Edge Petroleum — Investor Presentation (February 2008)
20 slides from Edge Petroleum's investor presentation, Feb 20, 2008
Slide 1: Corporate Presentation February 2008
Corporate Presentation February 2008
Slide 2: Disclaimer
Disclaimer This presentation contains forward-looking statements, including those relating to our future financial and operational results, reserves or transactions, that are subject to various risks and uncertainties that could cause the Company’s future plans, objectives and performance to differ
Slide 3: Introduction – Company Highlights
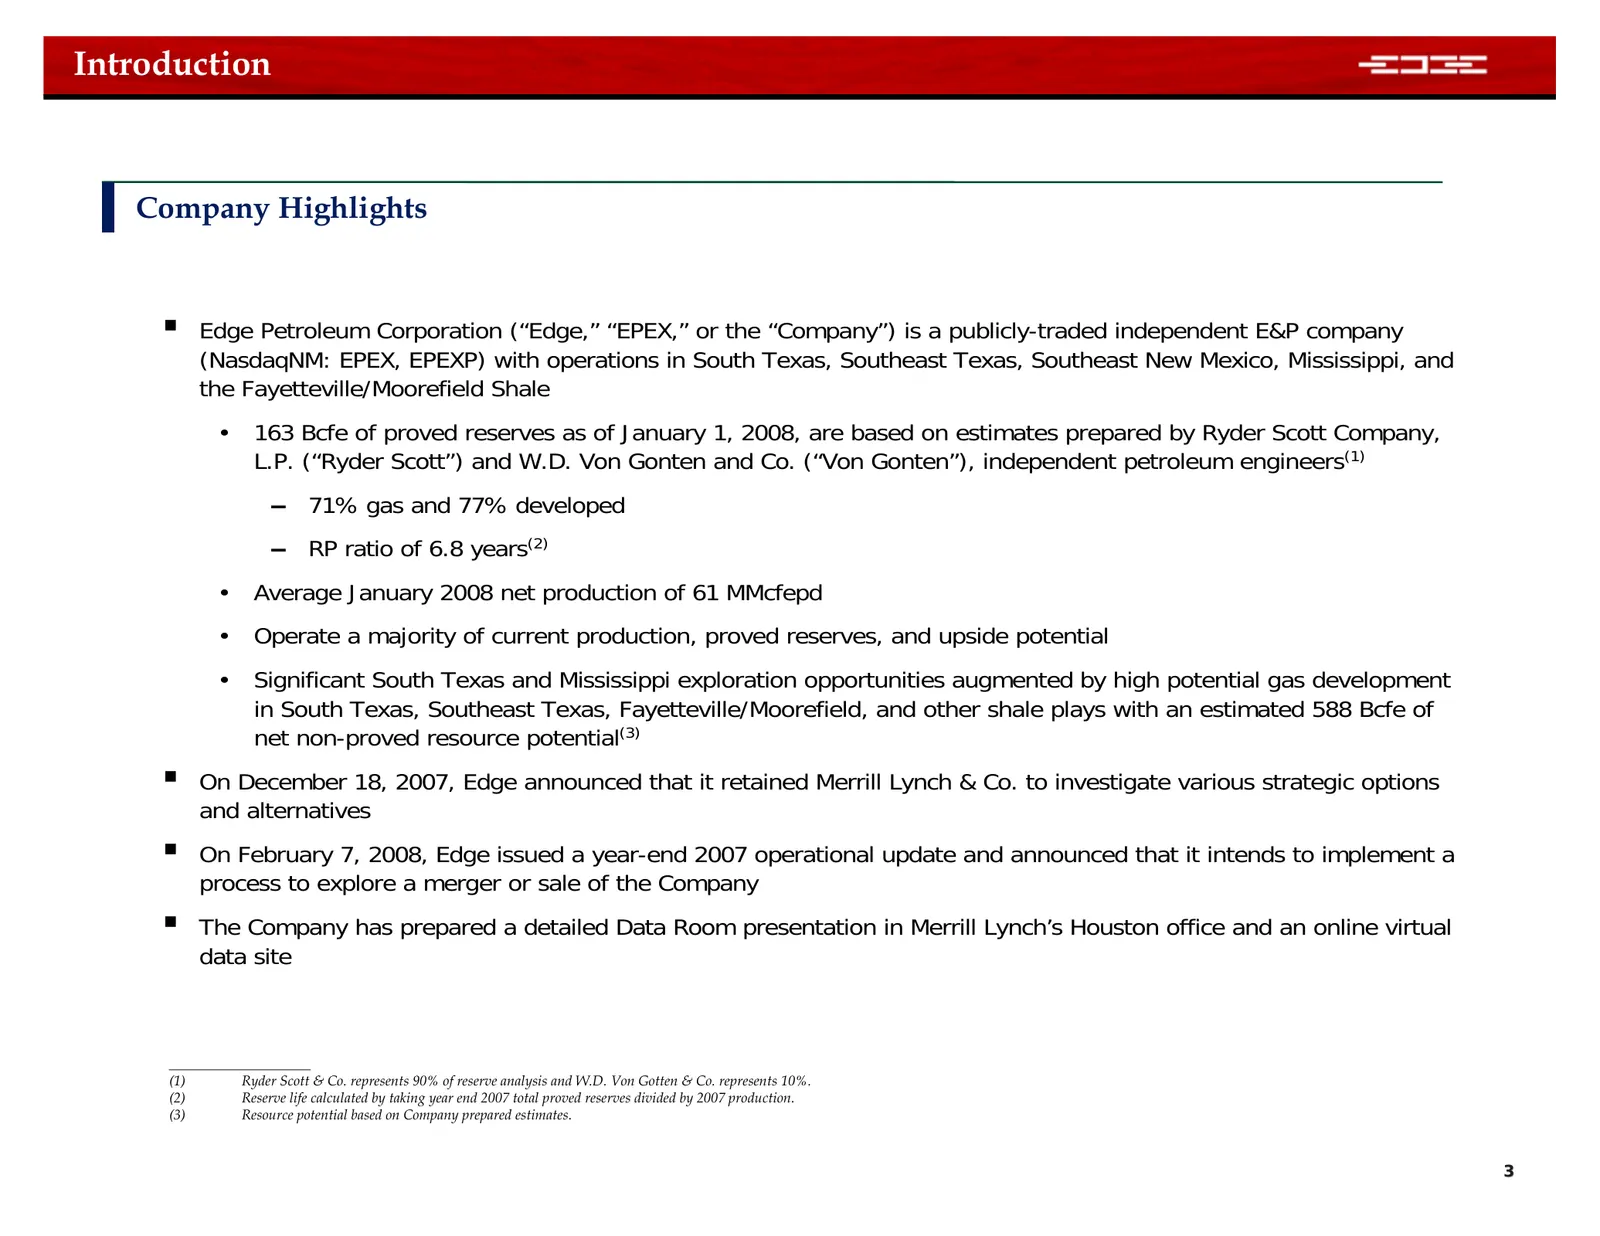
Introduction Company Highlights Edge Petroleum Corporation (“Edge,” “EPEX,” or the “Company”) is a publicly-traded independent E&P company (NasdaqNM: EPEX, EPEXP) with operations in South Texas, Southeast Texas, Southeast New Mexico, Mississippi, and the Fayetteville/Moorefield Shale • 163 Bcfe of
Slide 4: Areas of Operation – Asset Overview
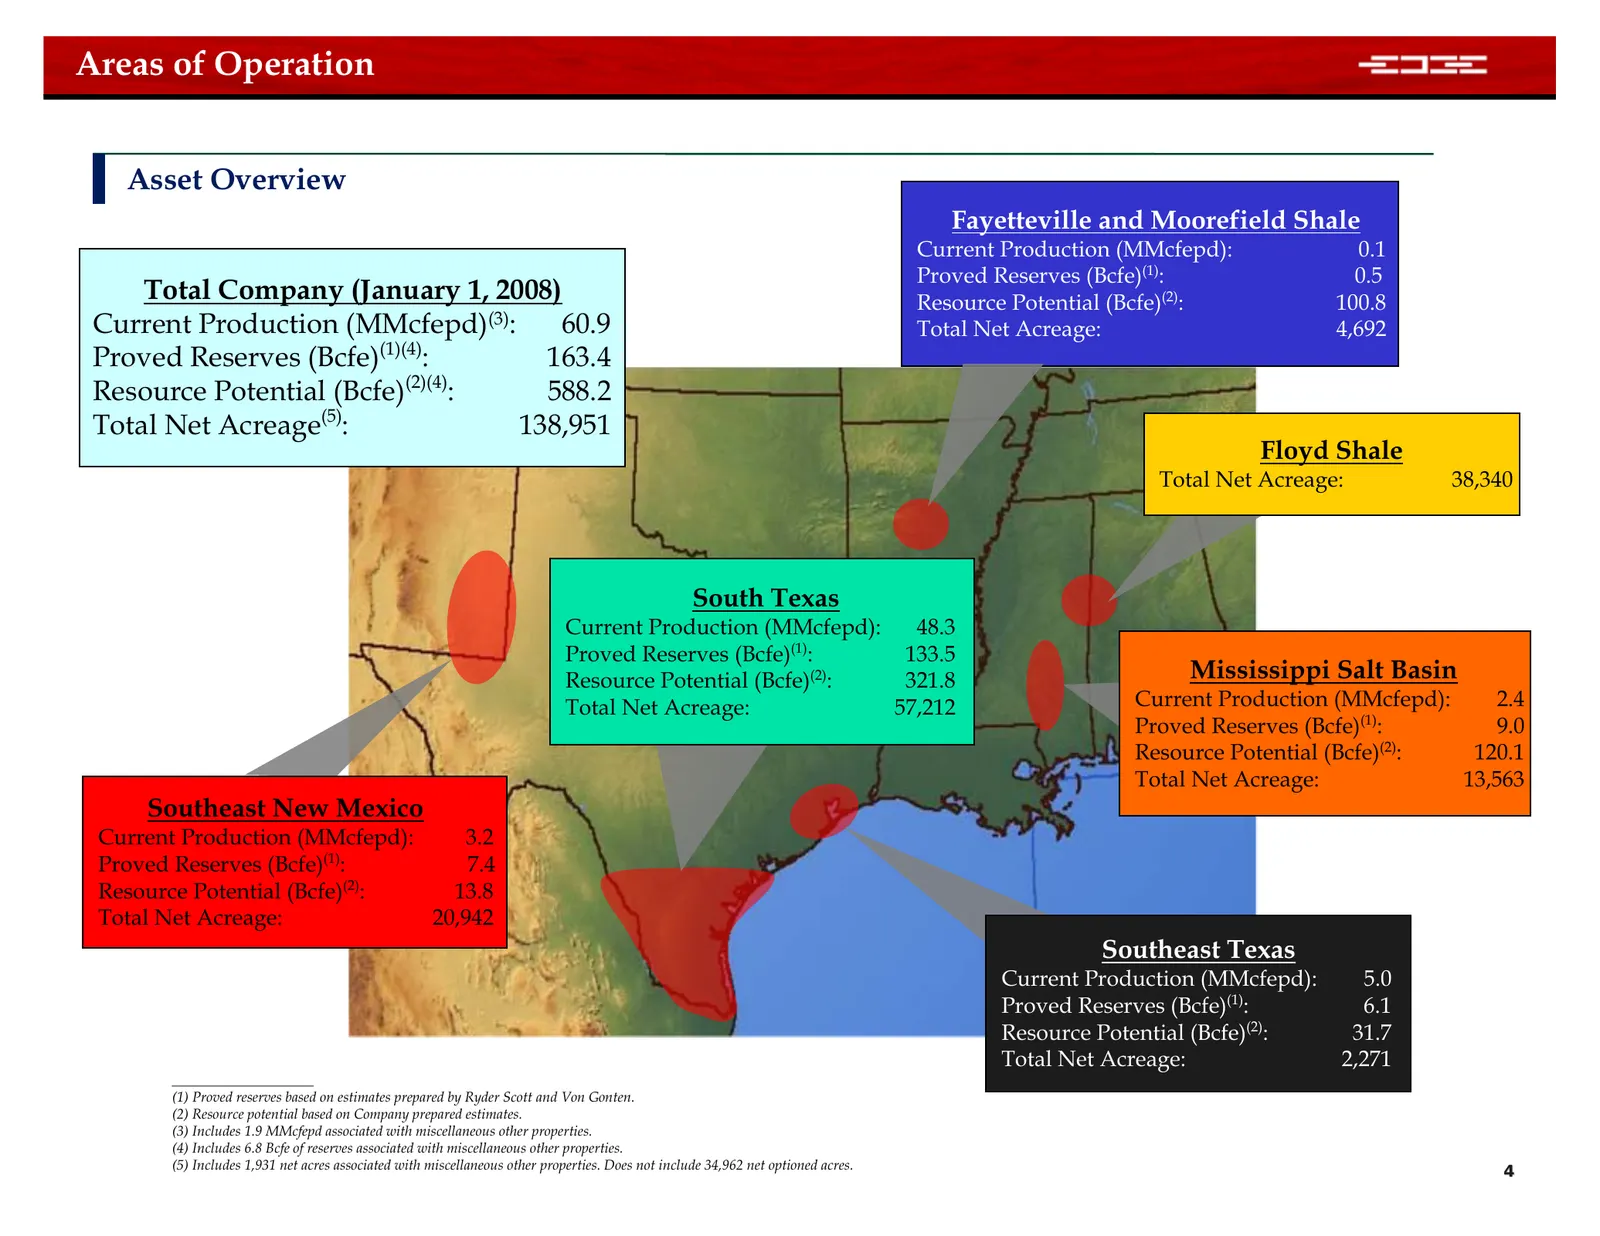
Areas of Operation Asset Overview Fayetteville and Moorefield Shale Current Production (MMcfepd): 0.1 Proved Reserves (Bcfe)(1): 0.5 Total Company (January 1, 2008) Resource Potential (Bcfe)(2): 100.8 Current Production (MMcfepd)(3): 60.9 Total Net Acreage: 4,692 (1)(4) Proved Reserves (Bcfe) : 163.
Slide 5: Areas of Operation – Total Company
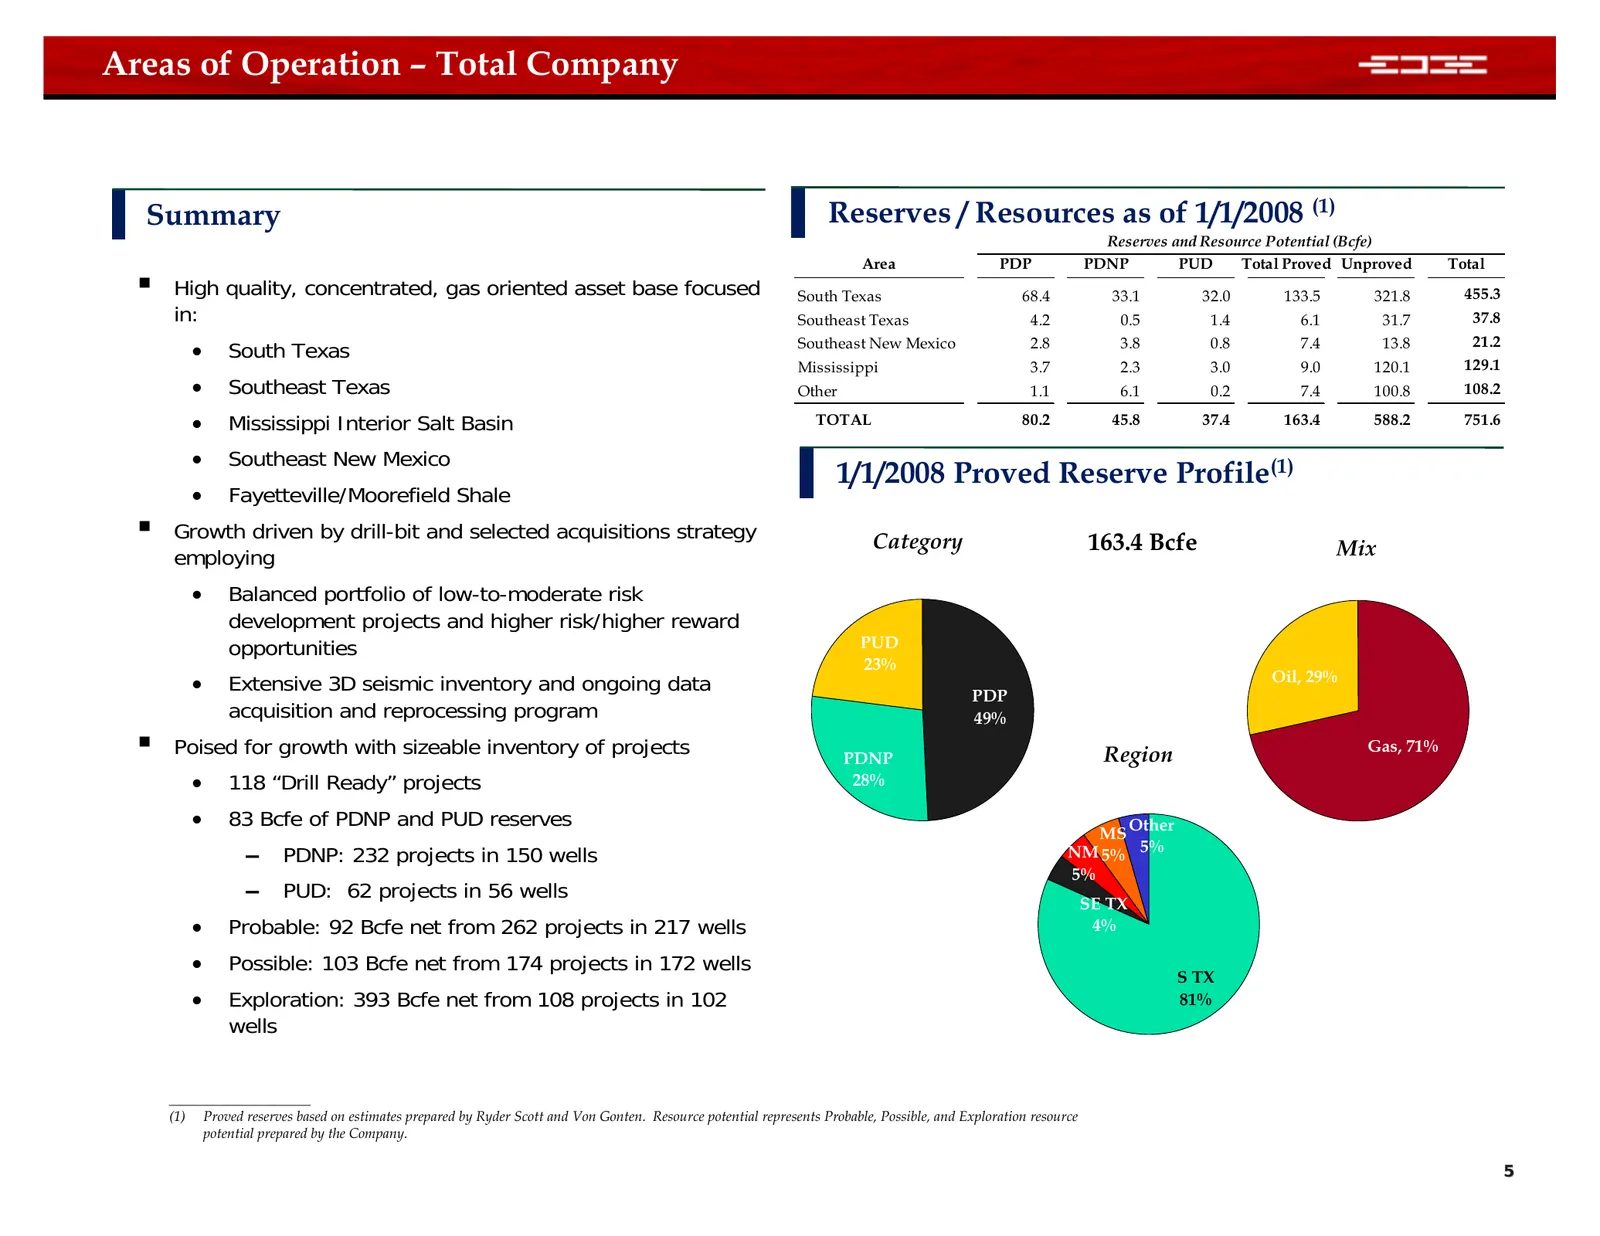
Areas of Operation – Total Company Summary Reserves / Resources as of 1/1/2008 (1) Reserves and Resource Potential (Bcfe) Area PDP PDNP PUD Total Proved Unproved Total High quality, concentrated, gas oriented asset base focused South Texas 68.4 33.1 32.0 133.5 321.8 455.3 in: Southeast Texas 4.2 0
Slide 6: Areas of Operation – South Texas
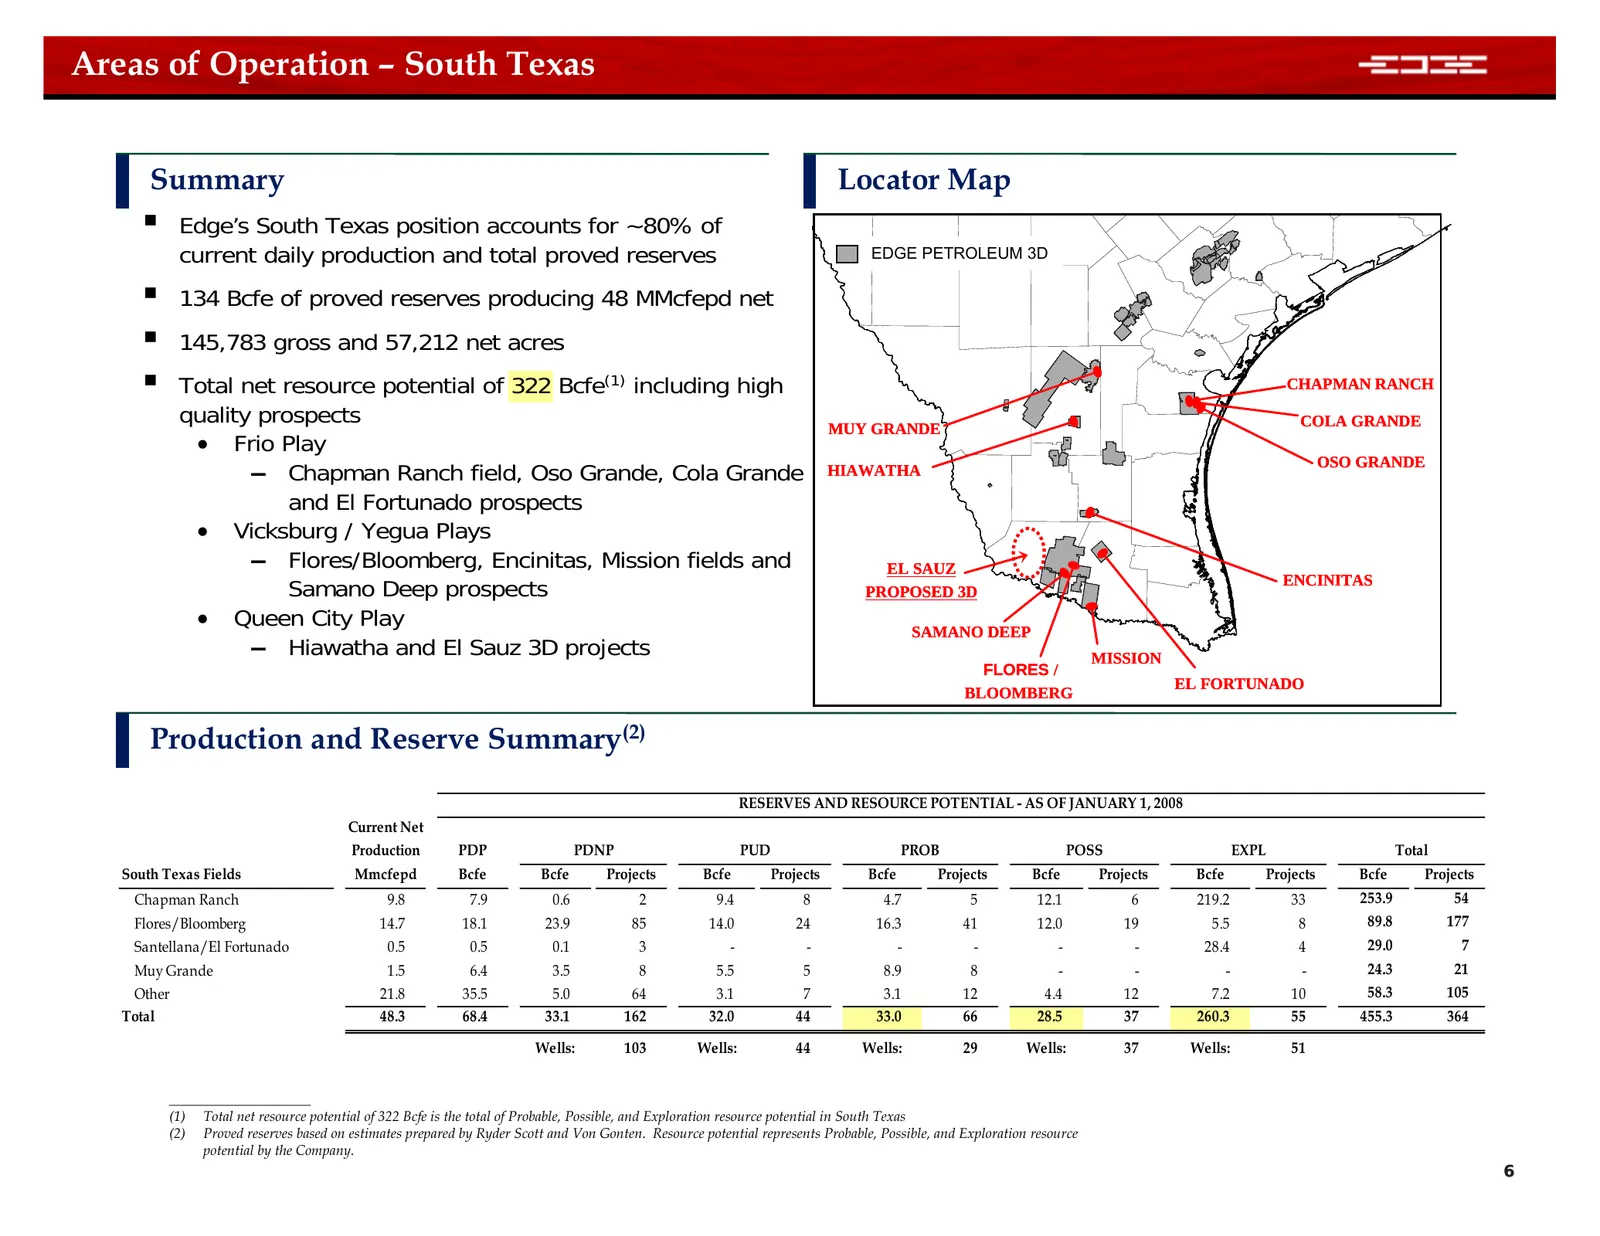
Areas of Operation – South Texas Summary Locator Map Edge’s South Texas position accounts for ~80% of current daily production and total proved reserves EDGE PETROLEUM 3D 134 Bcfe of proved reserves producing 48 MMcfepd net 145,783 gross and 57,212 net acres Total net resource potential of 3
Slide 7: South Texas Flores / Bloomberg
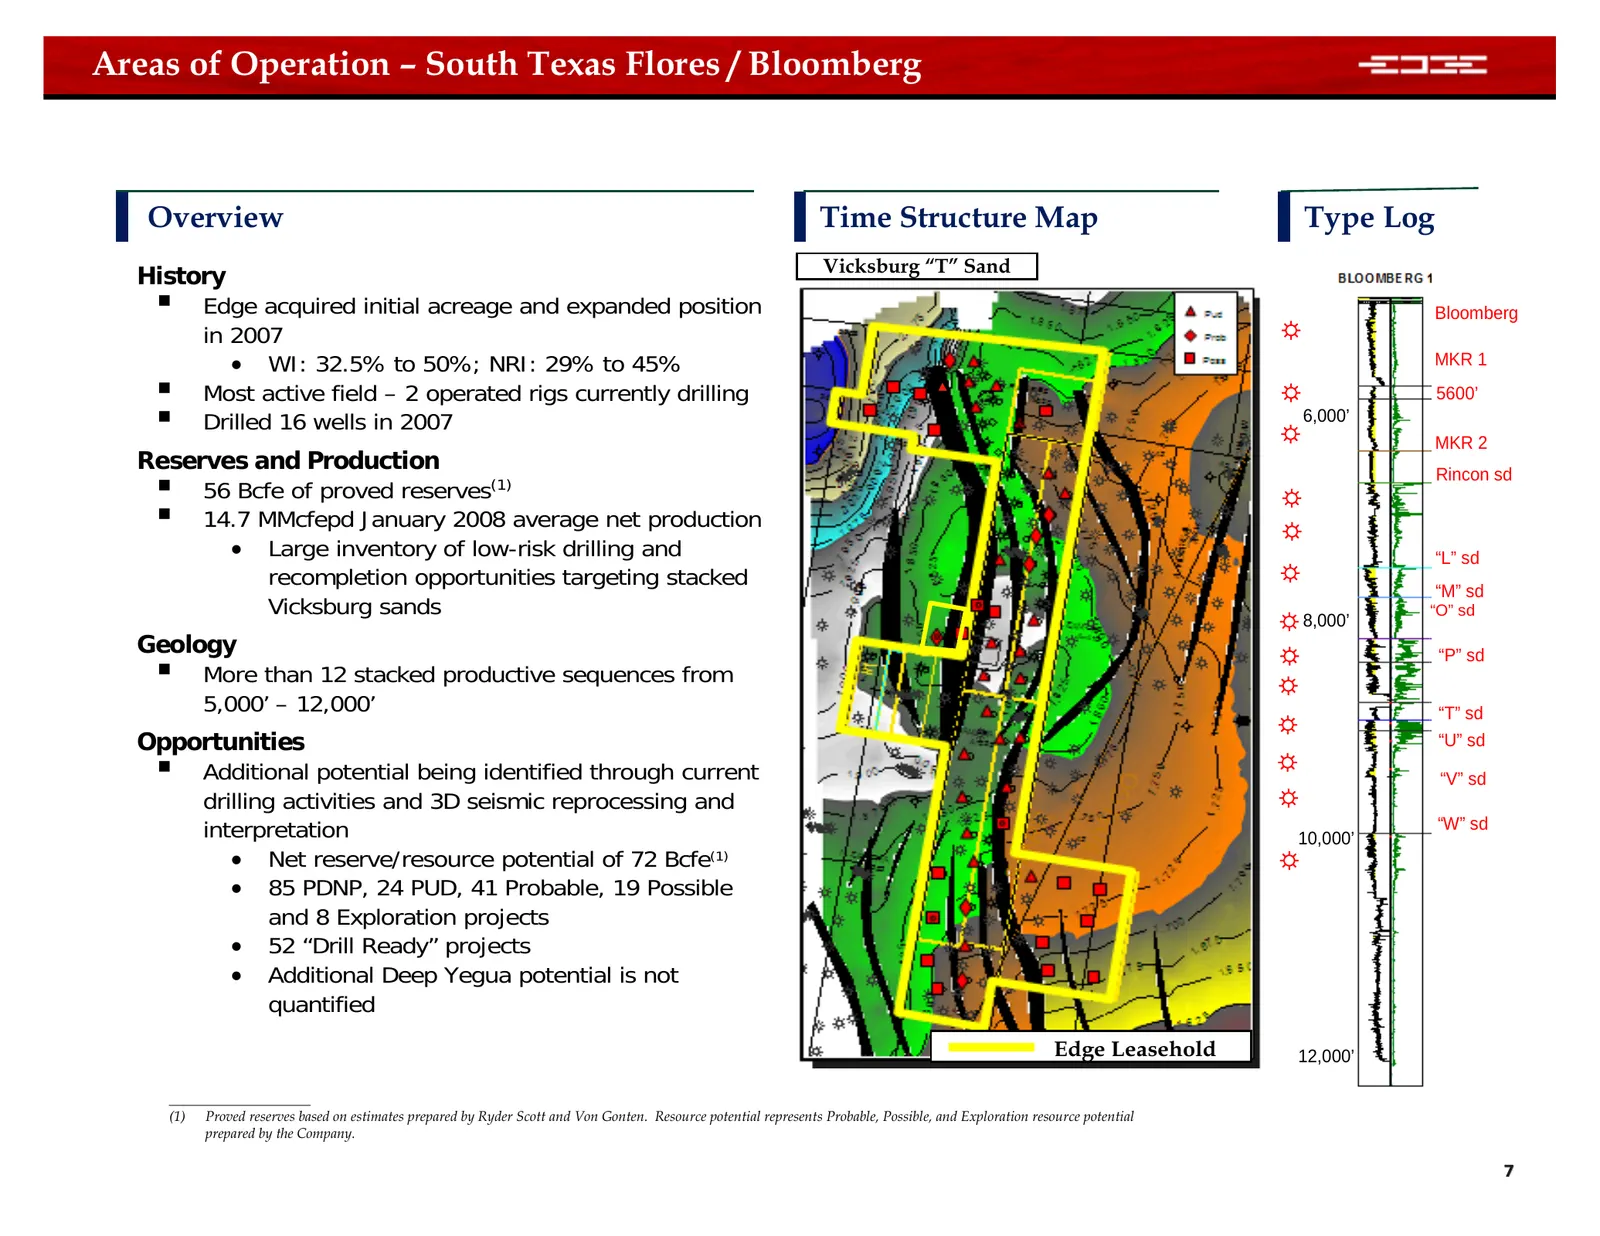
Areas of Operation – South Texas Flores / Bloomberg Overview Time Structure Map Type Log Vicksburg “T” Sand History Edge acquired initial acreage and expanded position Bloomberg in 2007 ☼ • WI: 32.5% to 50%; NRI: 29% to 45% MKR 1 Most active field – 2 operated rigs currently drilling ☼ 5600’ D
Slide 8: South Texas Encinitas
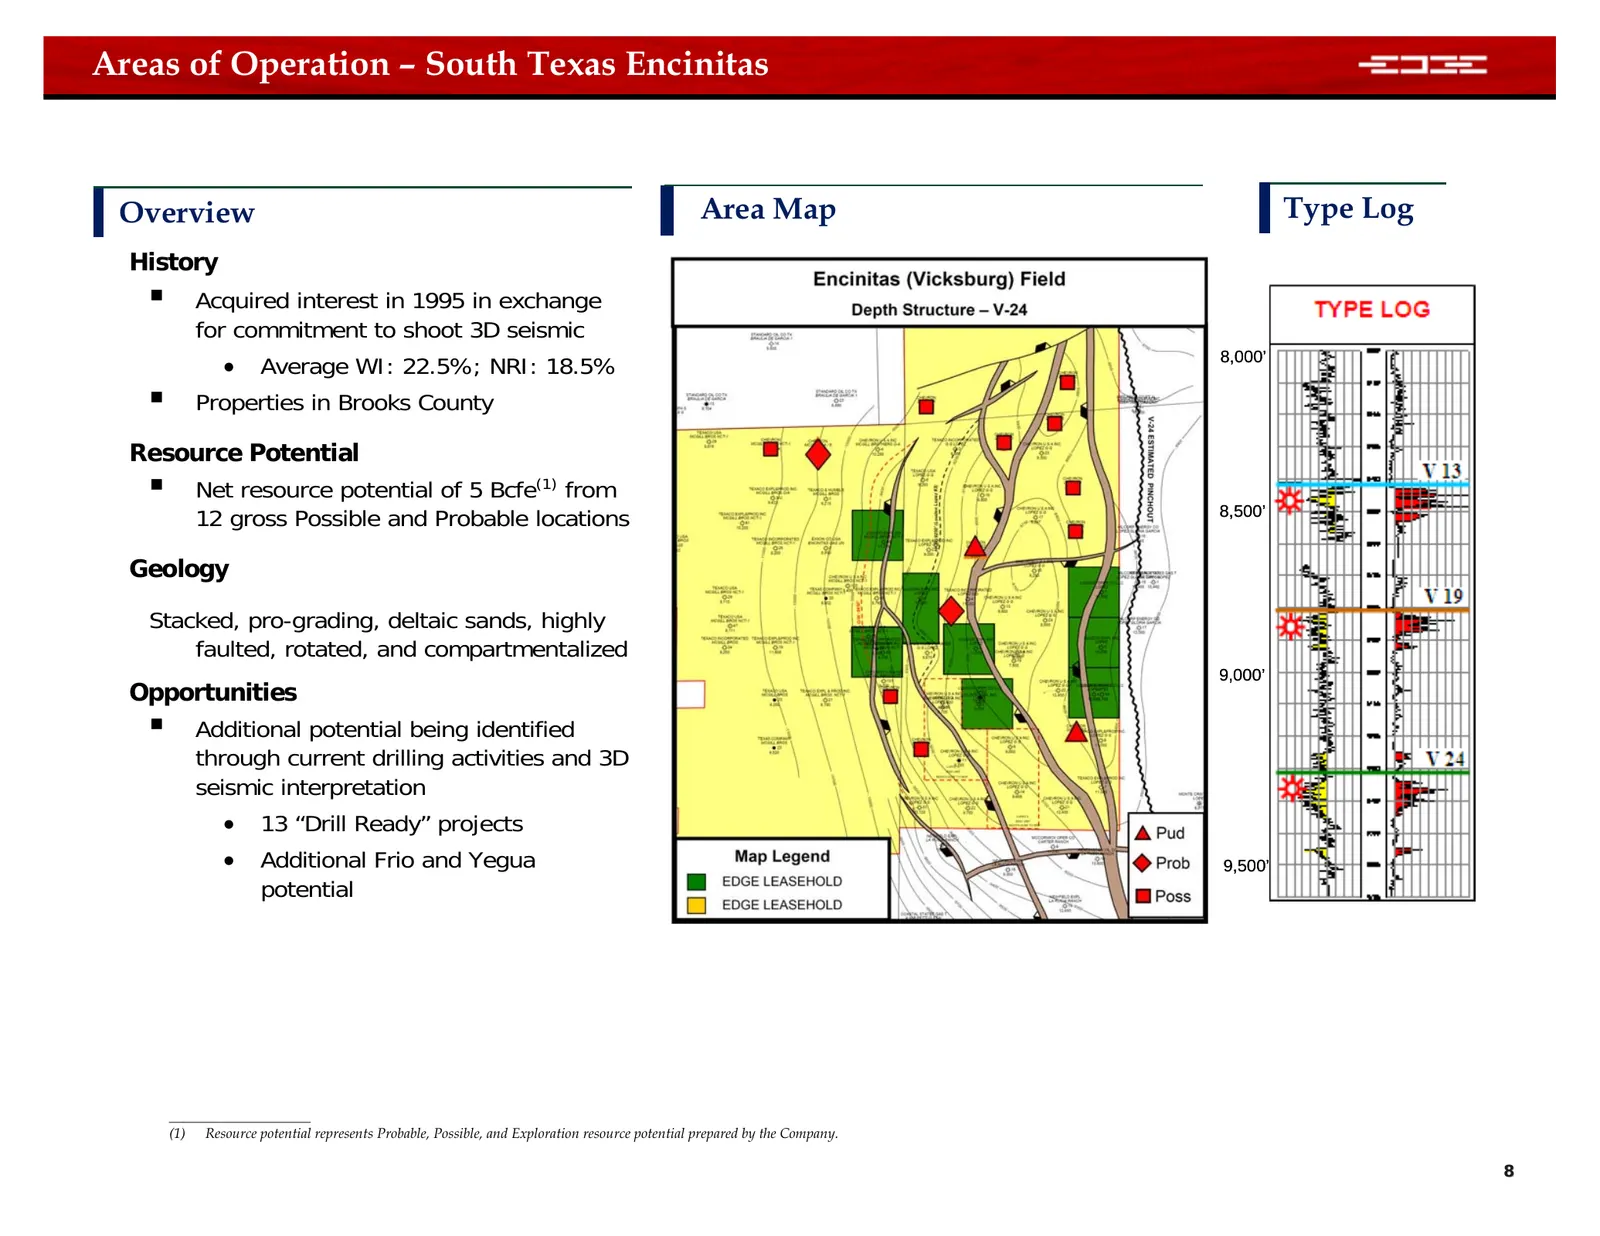
Areas of Operation – South Texas Encinitas Overview Area Map Type Log History Acquired interest in 1995 in exchange for commitment to shoot 3D seismic • Average WI: 22.5%; NRI: 18.5% 8,000’ Properties in Brooks County Resource Potential Net resource potential of 5 Bcfe(1) from 12 gross Possibl
Slide 9: South Texas Chapman Ranch
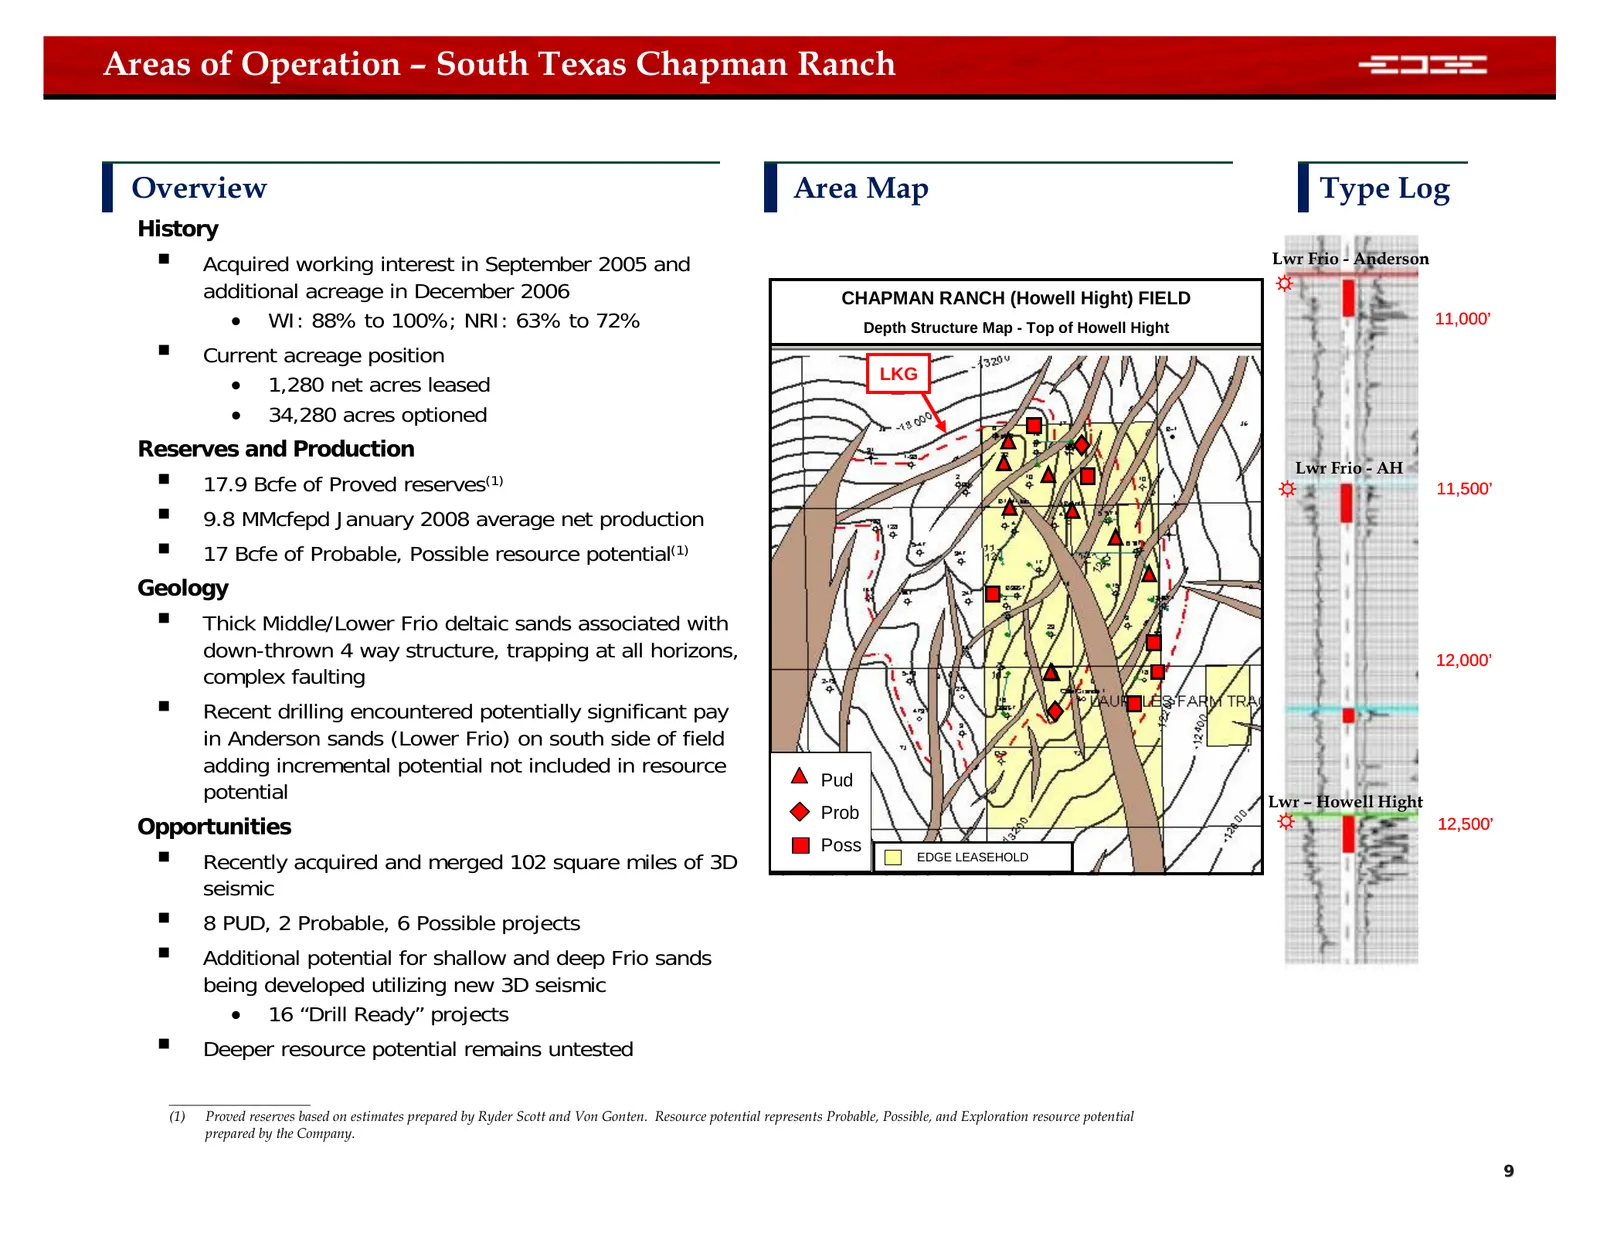
Areas of Operation – South Texas Chapman Ranch Overview Area Map Type Log History Acquired working interest in September 2005 and Lwr Frio - Anderson additional acreage in December 2006 CHAPMAN RANCH (Howell Hight) FIELD ☼ • WI: 88% to 100%; NRI: 63% to 72% Depth Structure Map - Top of Howell High
Slide 10: South Texas Deep Frio Opportunities
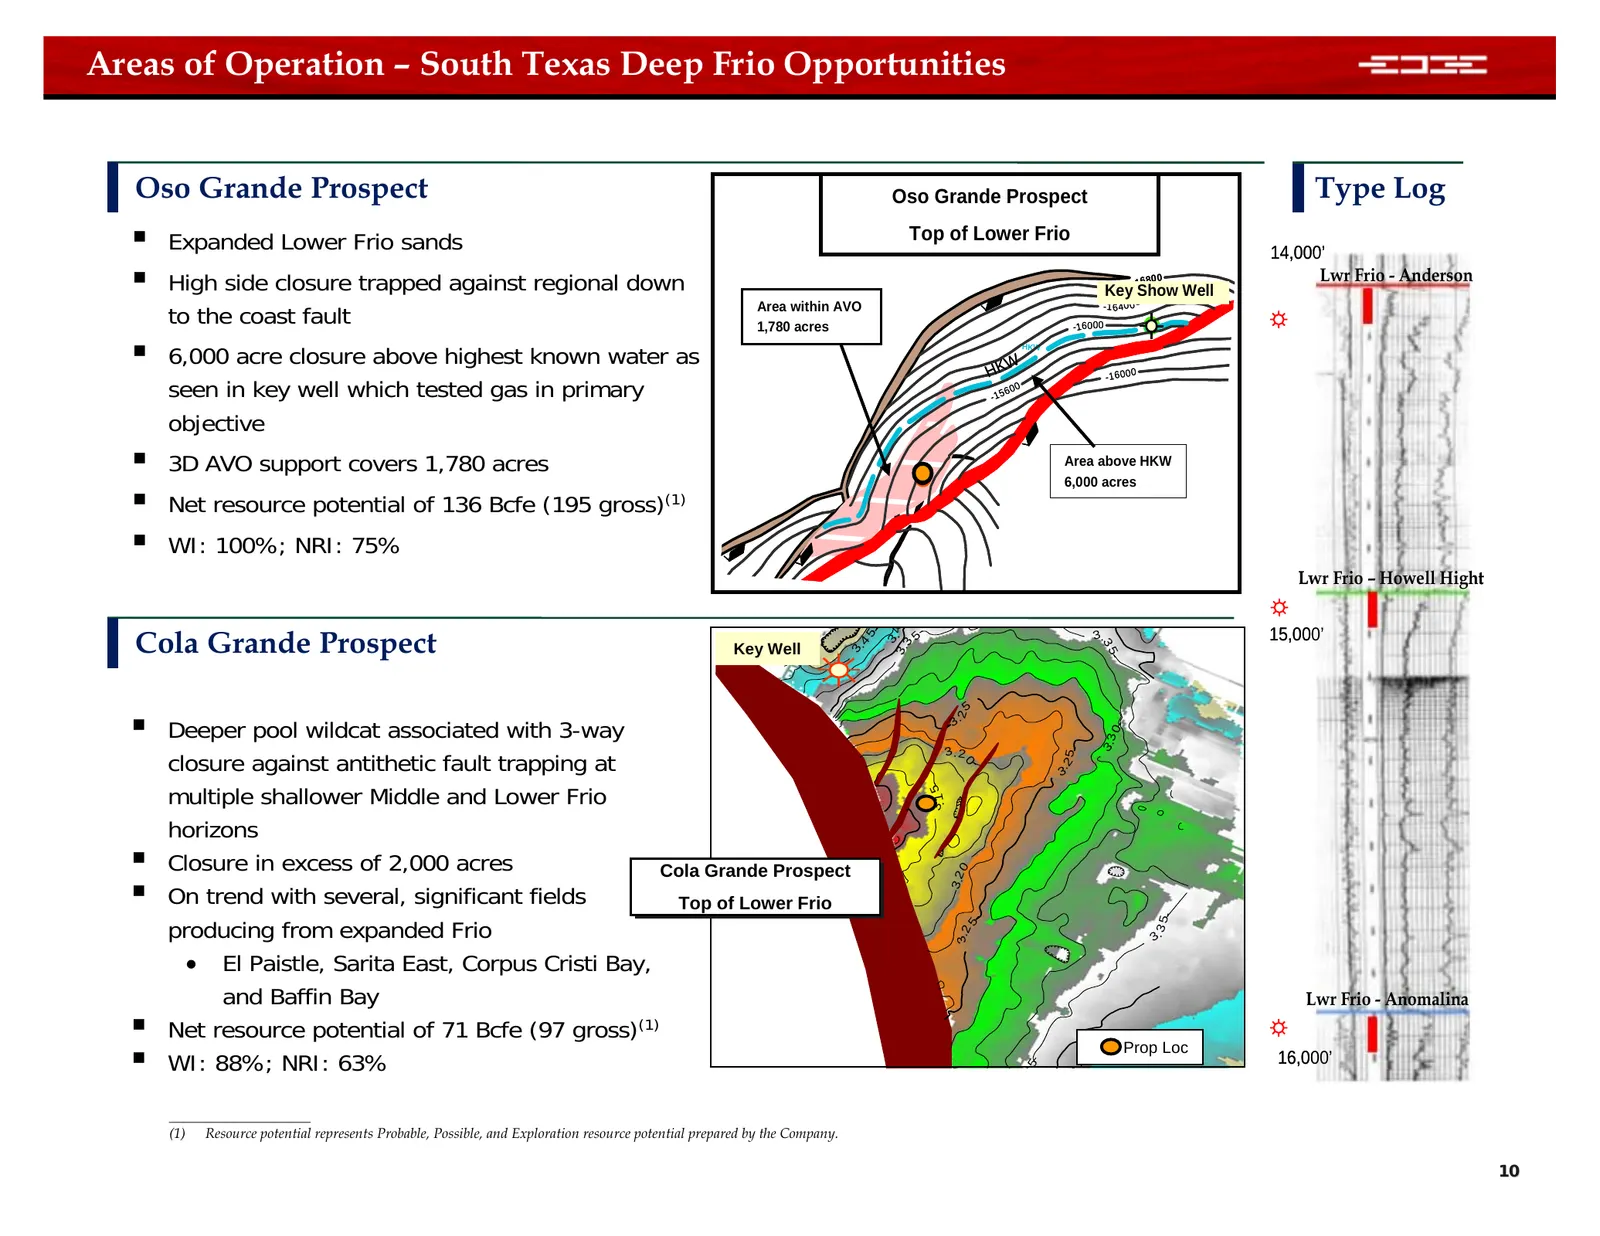
Areas of Operation – South Texas Deep Frio Opportunities Oso Grande Prospect Oso Grande Prospect Type Log Expanded Lower Frio sands Top of Lower Frio 14,000’ High side closure trapped against regional down - 16 8 Key Show Well 00 Lwr Frio - Anderson to the coast fault ☼ Area within AVO - 1 6 40
Slide 11: South Texas Exploration Opportunities
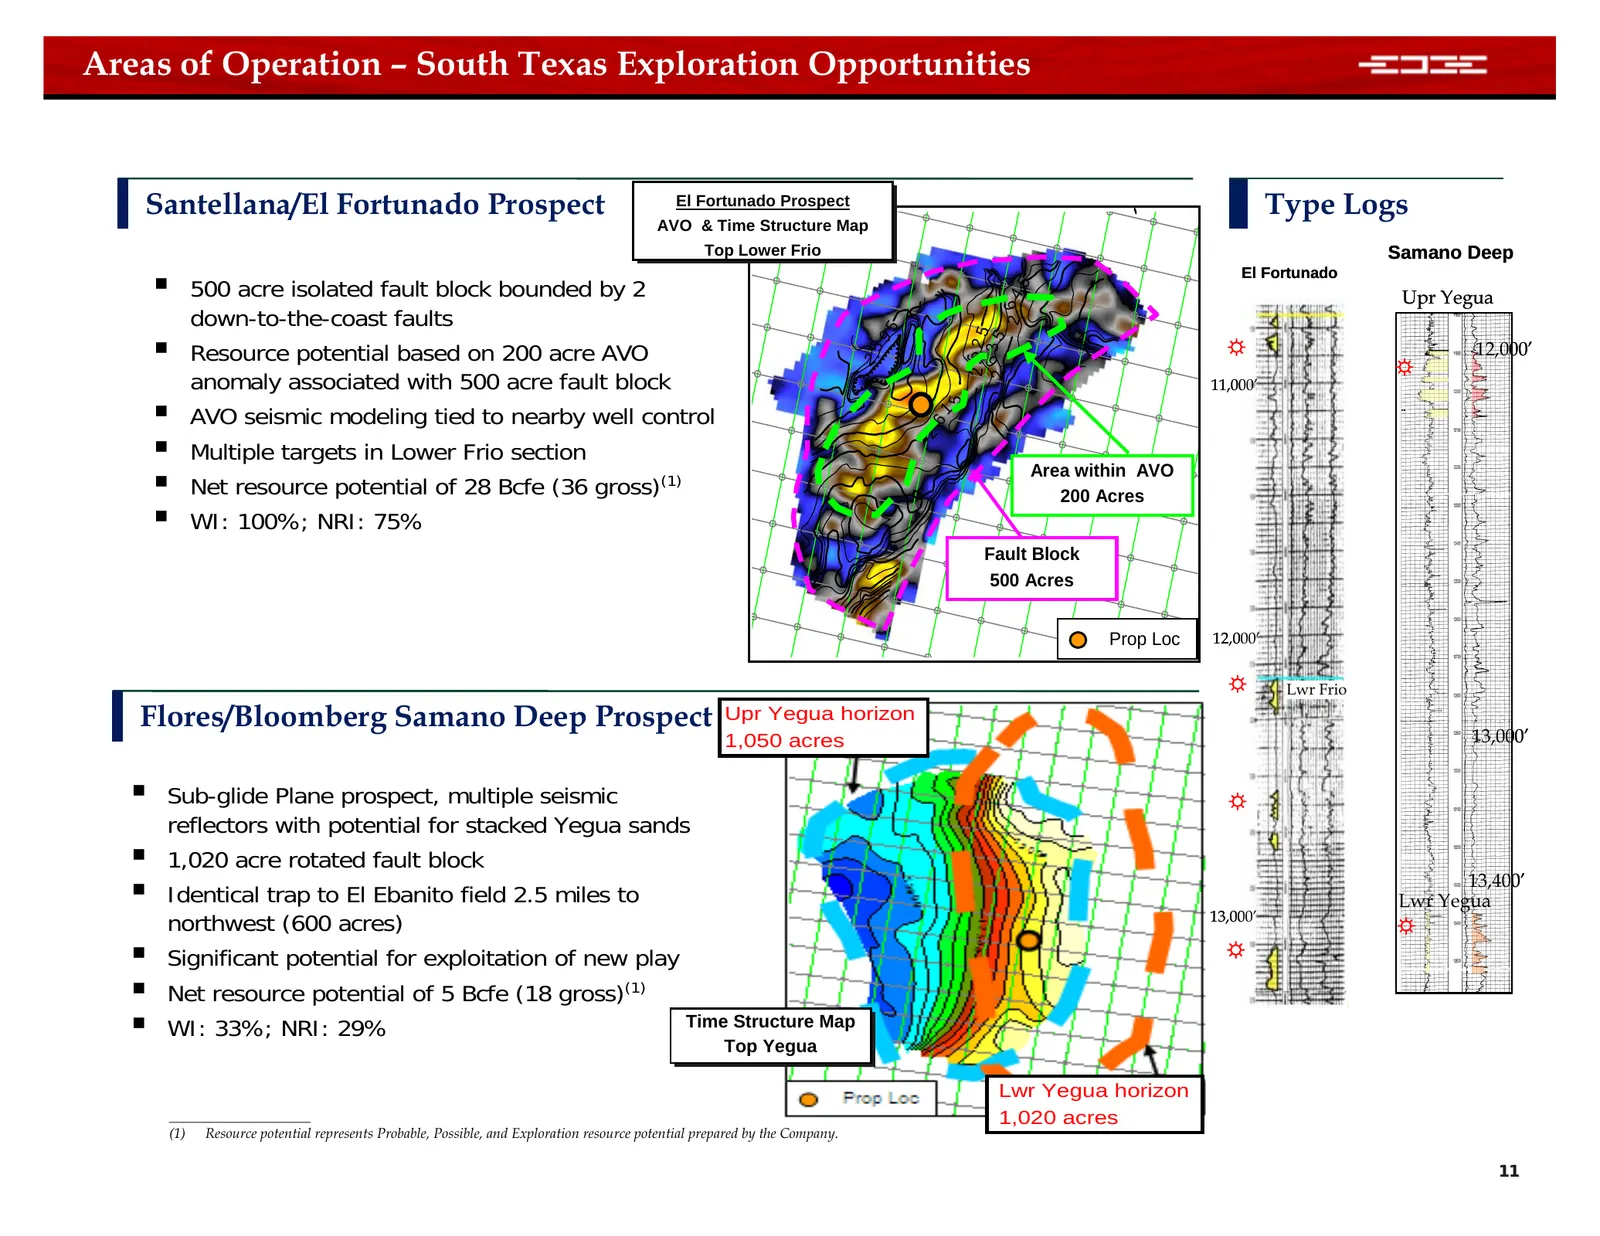
Areas of Operation – South Texas Exploration Opportunities Santellana/El Fortunado Prospect El El Fortunado Fortunado Prospect Prospect Type Logs AVO AVO &&Time Time Structure Structure Map Map Top Top Lower LowerFrio Frio Samano Deep 500 acre isolated fault block bounded by 2 El Fortunado 2 . 64
Slide 12: Areas of Operation – Southeast Texas
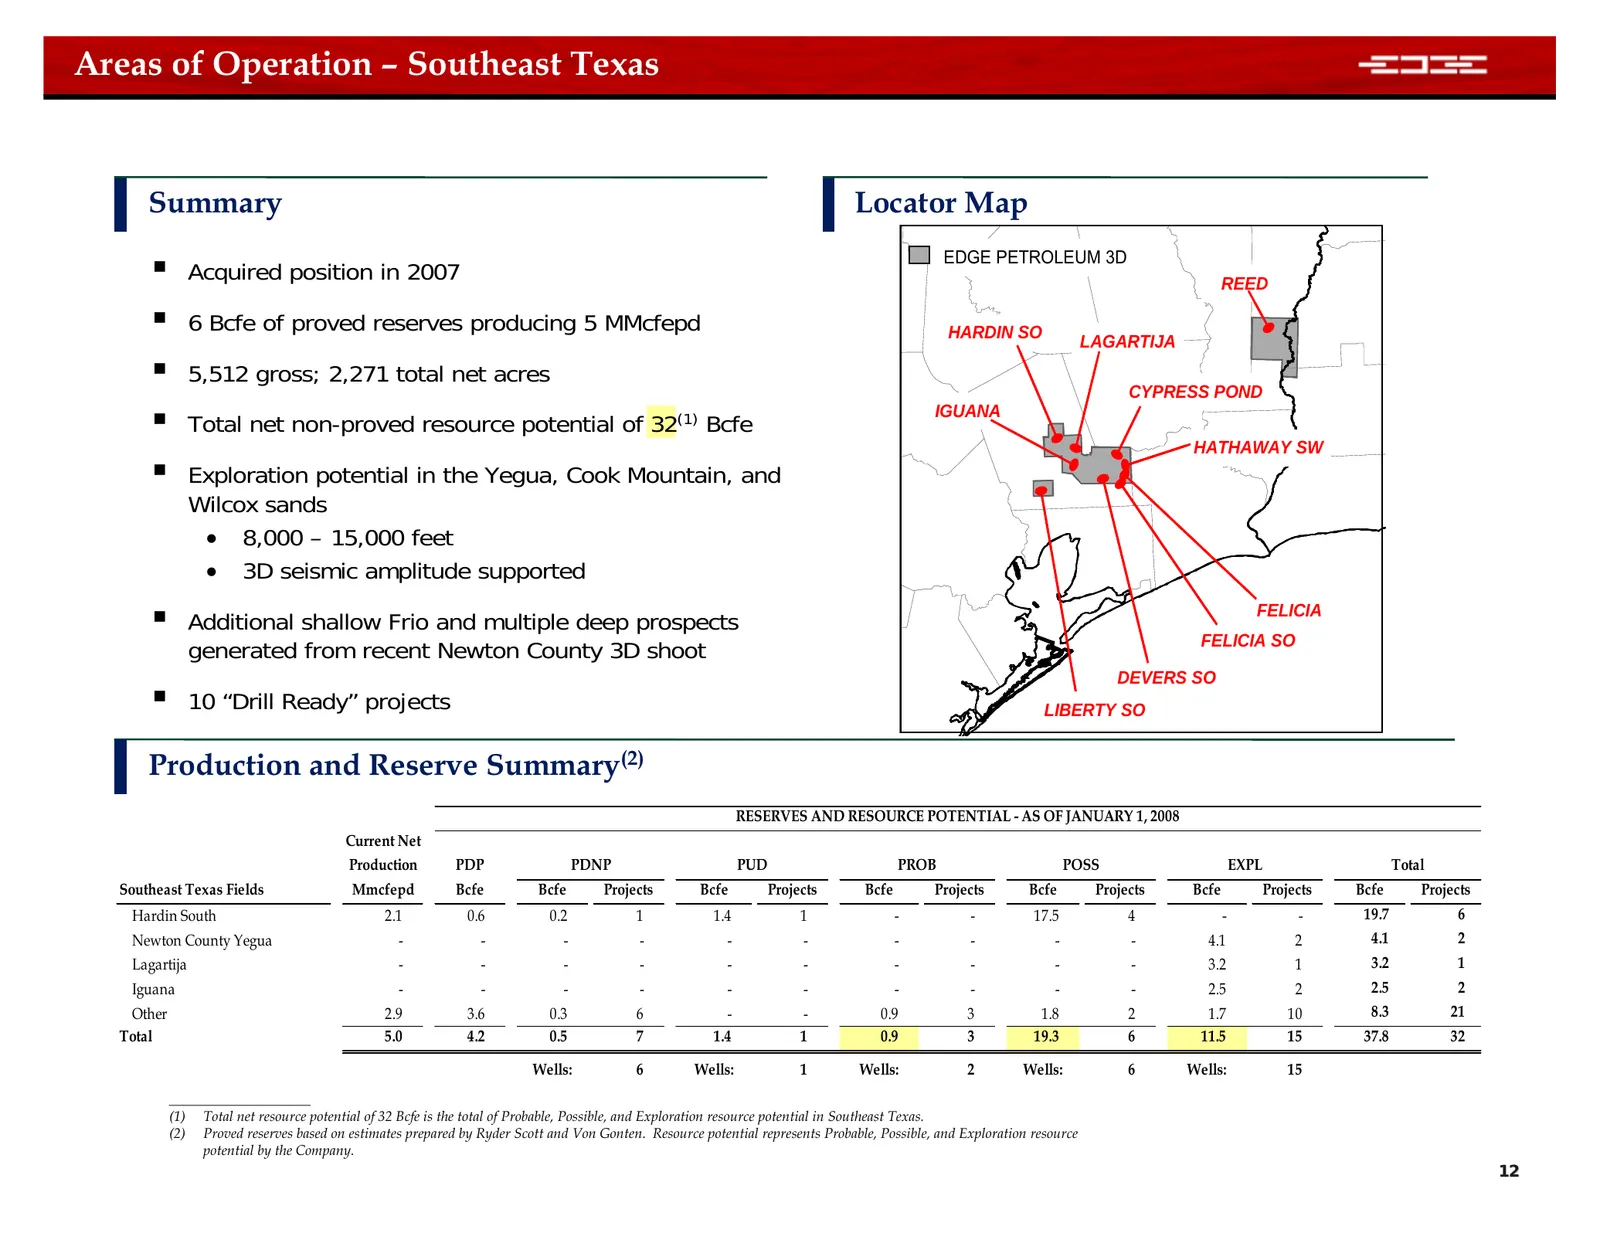
Areas of Operation – Southeast Texas Summary Locator Map EDGE PETROLEUM 3D Acquired position in 2007 REED 6 Bcfe of proved reserves producing 5 MMcfepd HARDIN SO LAGARTIJA 5,512 gross; 2,271 total net acres CYPRESS POND Total net non-proved resource potential of 32(1) Bcfe IGUANA HATHAWAY SW
Slide 13: Southeast Texas Exploration Opportunities
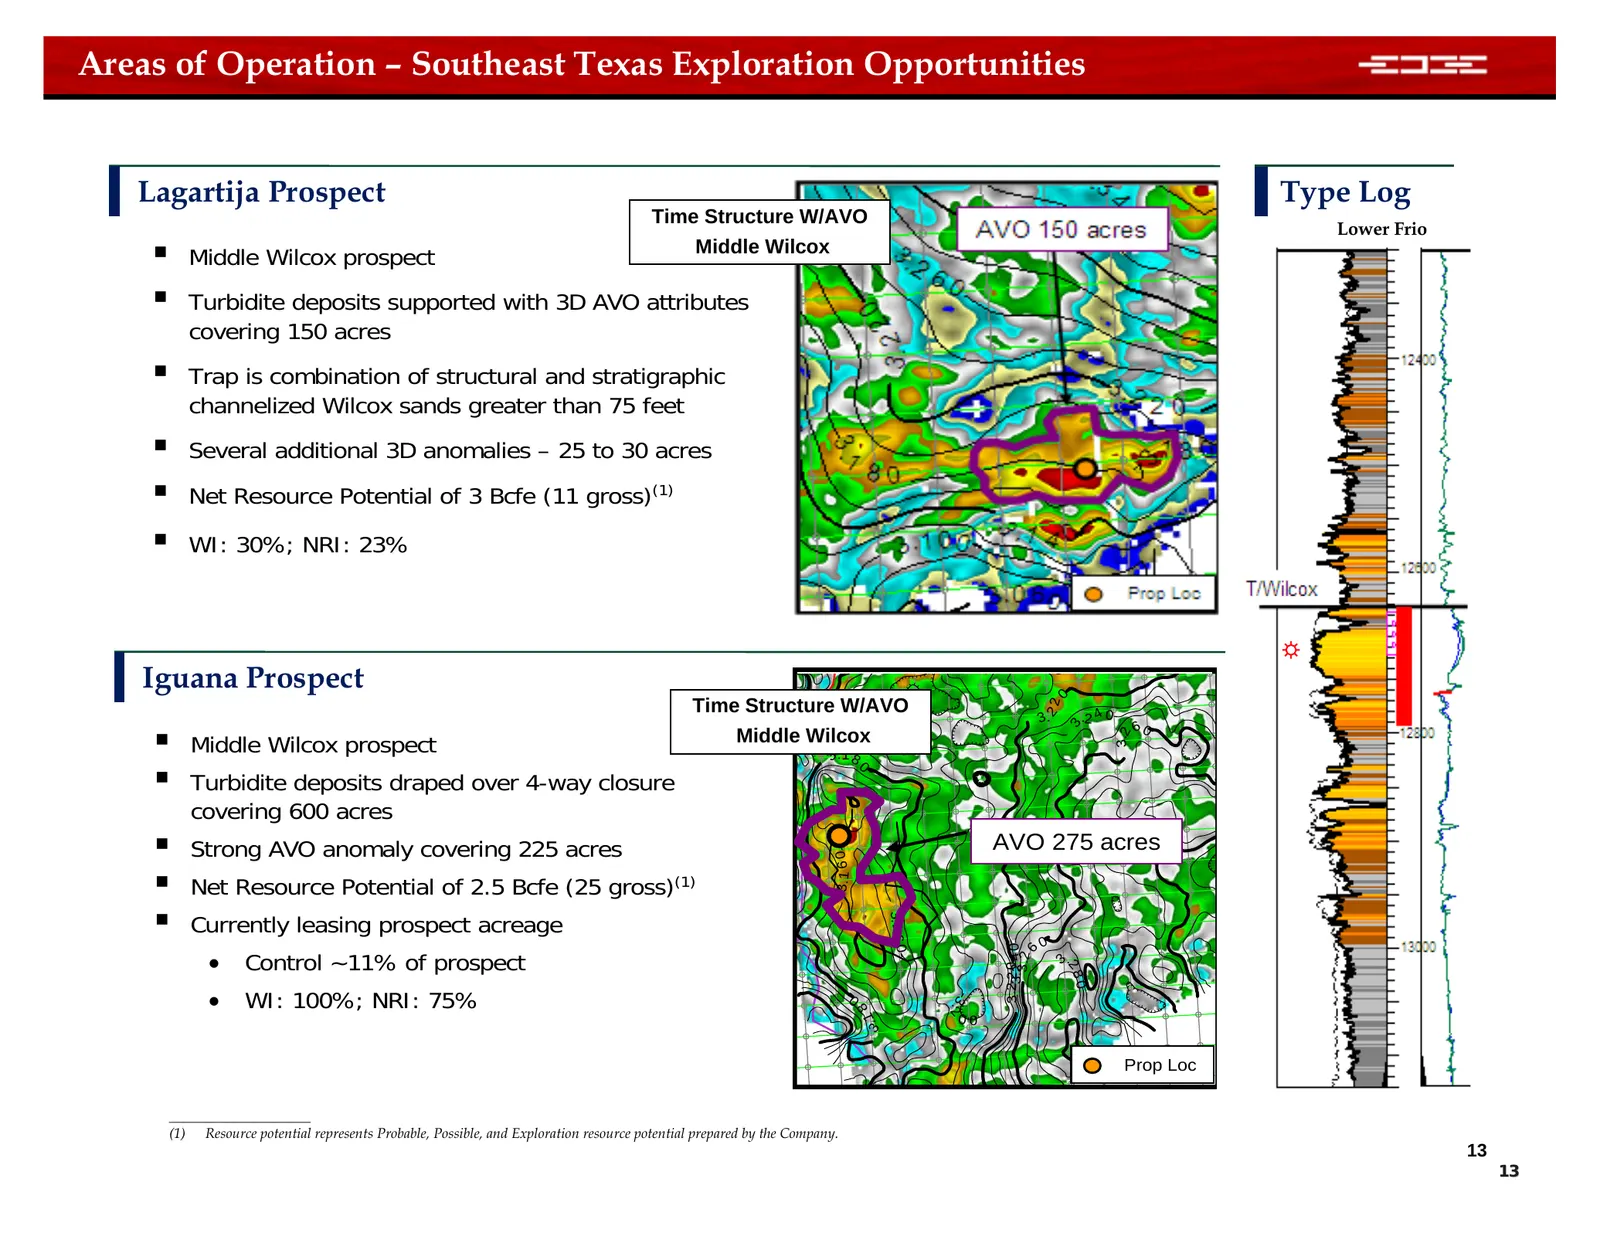
Areas of Operation – Southeast Texas Exploration Opportunities Lagartija Prospect Type Log Time Structure W/AVO Lower Frio Middle Wilcox prospect Middle Wilcox Turbidite deposits supported with 3D AVO attributes covering 150 acres Trap is combination of structural and stratigraphic channelized
Slide 14: Areas of Operation – Mississippi Interior Salt Basin
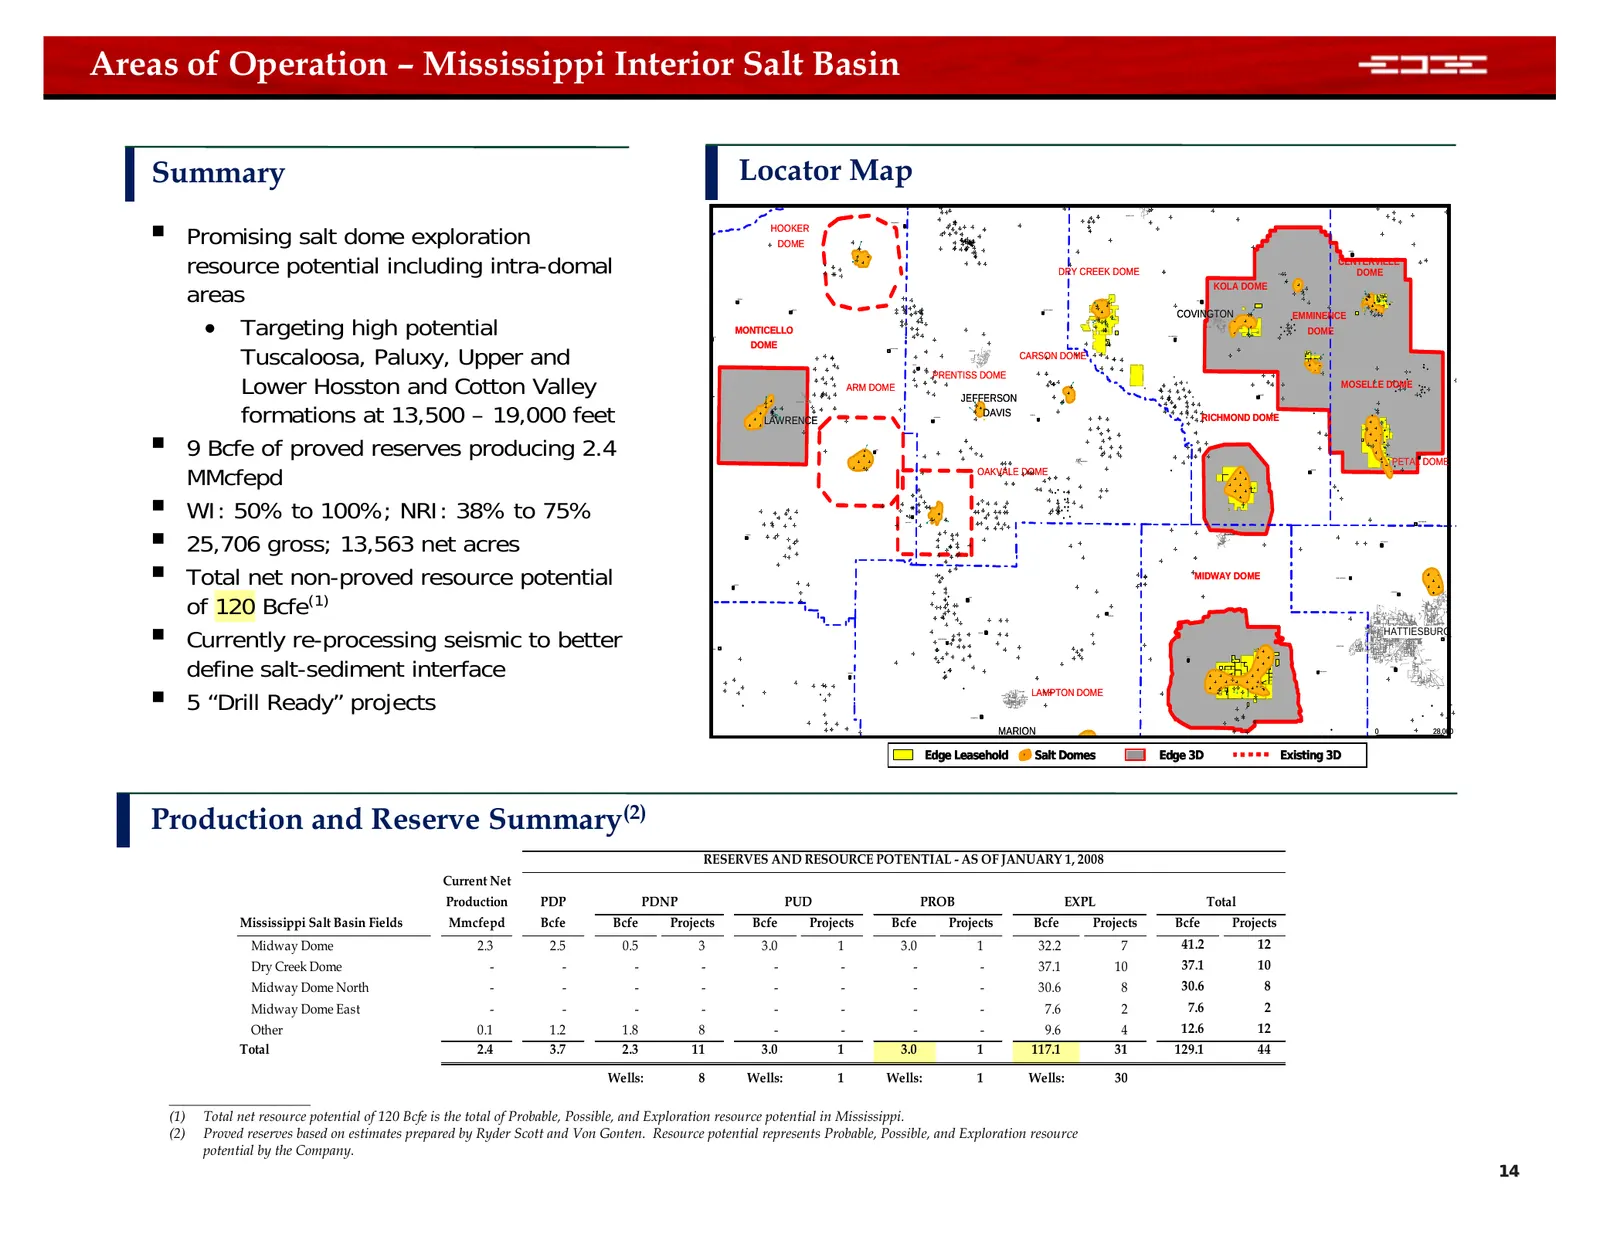
Areas of Operation – Mississippi Interior Salt Basin Summary Locator Map Promising salt dome exploration MOUNT OLIVE NEW HEBRON HOOKER DOME resource potential including intra-domal HEBRON CENTERVILLE DRY CREEK DOME DOME areas KOLA DOME SONTAG ORA WANILLA MOUNT CARMEL COVINGTON • Targeting high pot
Slide 15: Mississippi Interior Salt Basin Exploration Opportunities
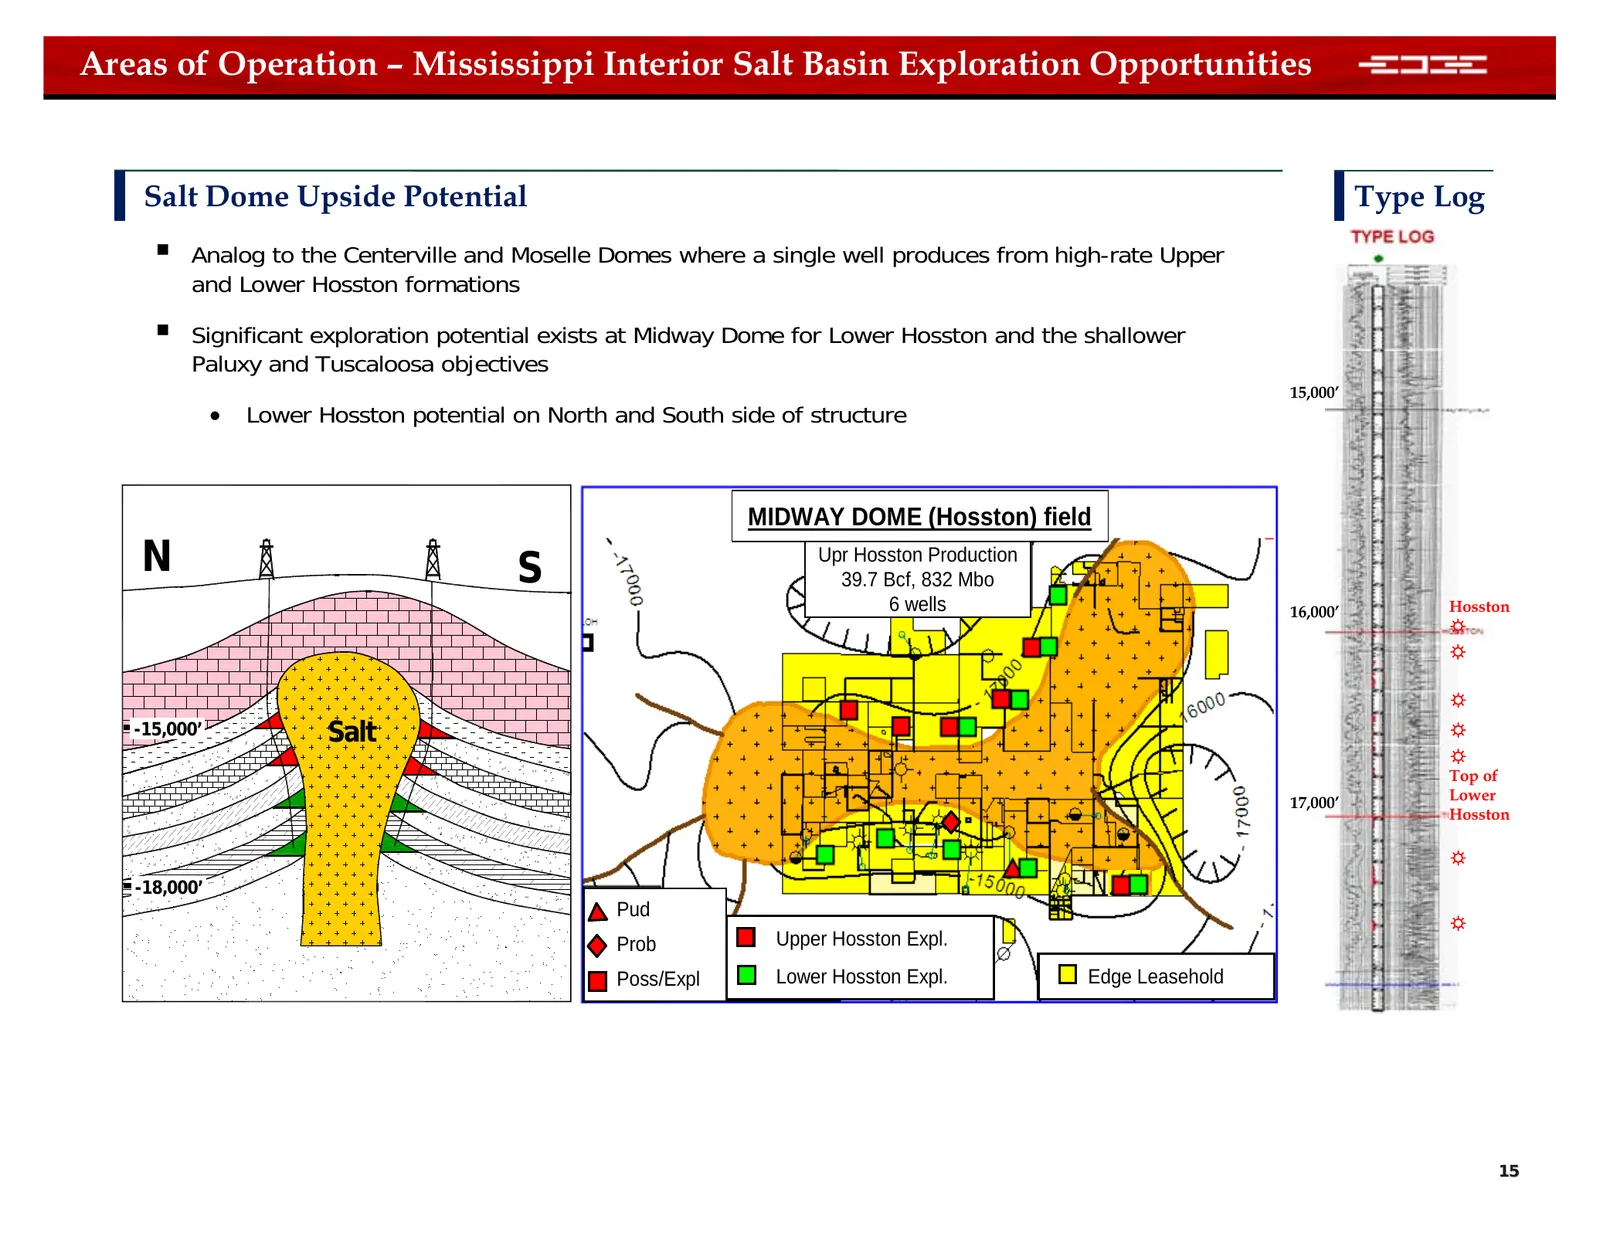
Areas of Operation – Mississippi Interior Salt Basin Exploration Opportunities Salt Dome Upside Potential Type Log Analog to the Centerville and Moselle Domes where a single well produces from high-rate Upper and Lower Hosston formations Significant exploration potential exists at Midway Dome fo
Slide 16: Areas of Operation – Southeast New Mexico
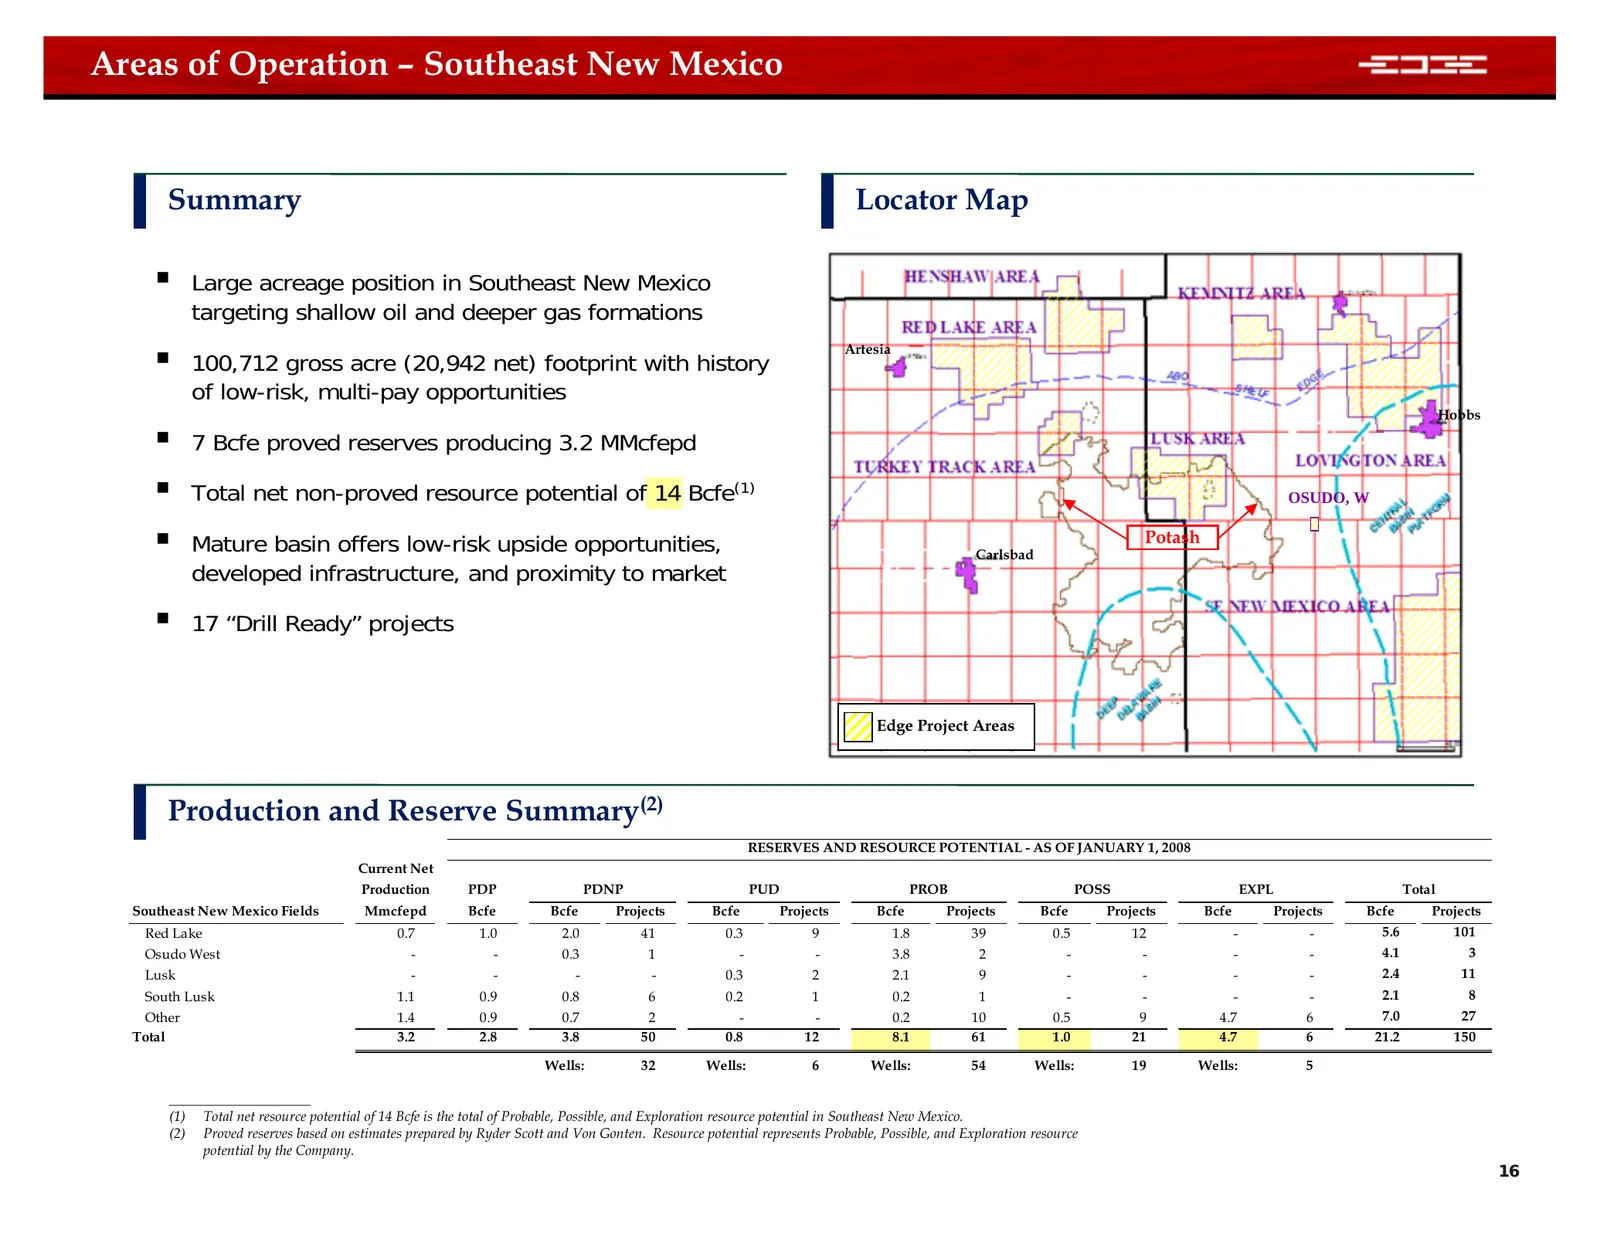
Areas of Operation – Southeast New Mexico Summary Locator Map Large acreage position in Southeast New Mexico targeting shallow oil and deeper gas formations 100,712 gross acre (20,942 net) footprint with history Artesia of low-risk, multi-pay opportunities Hobbs 7 Bcfe proved reserves producin
Slide 17: Fayetteville & Moorefield Shale
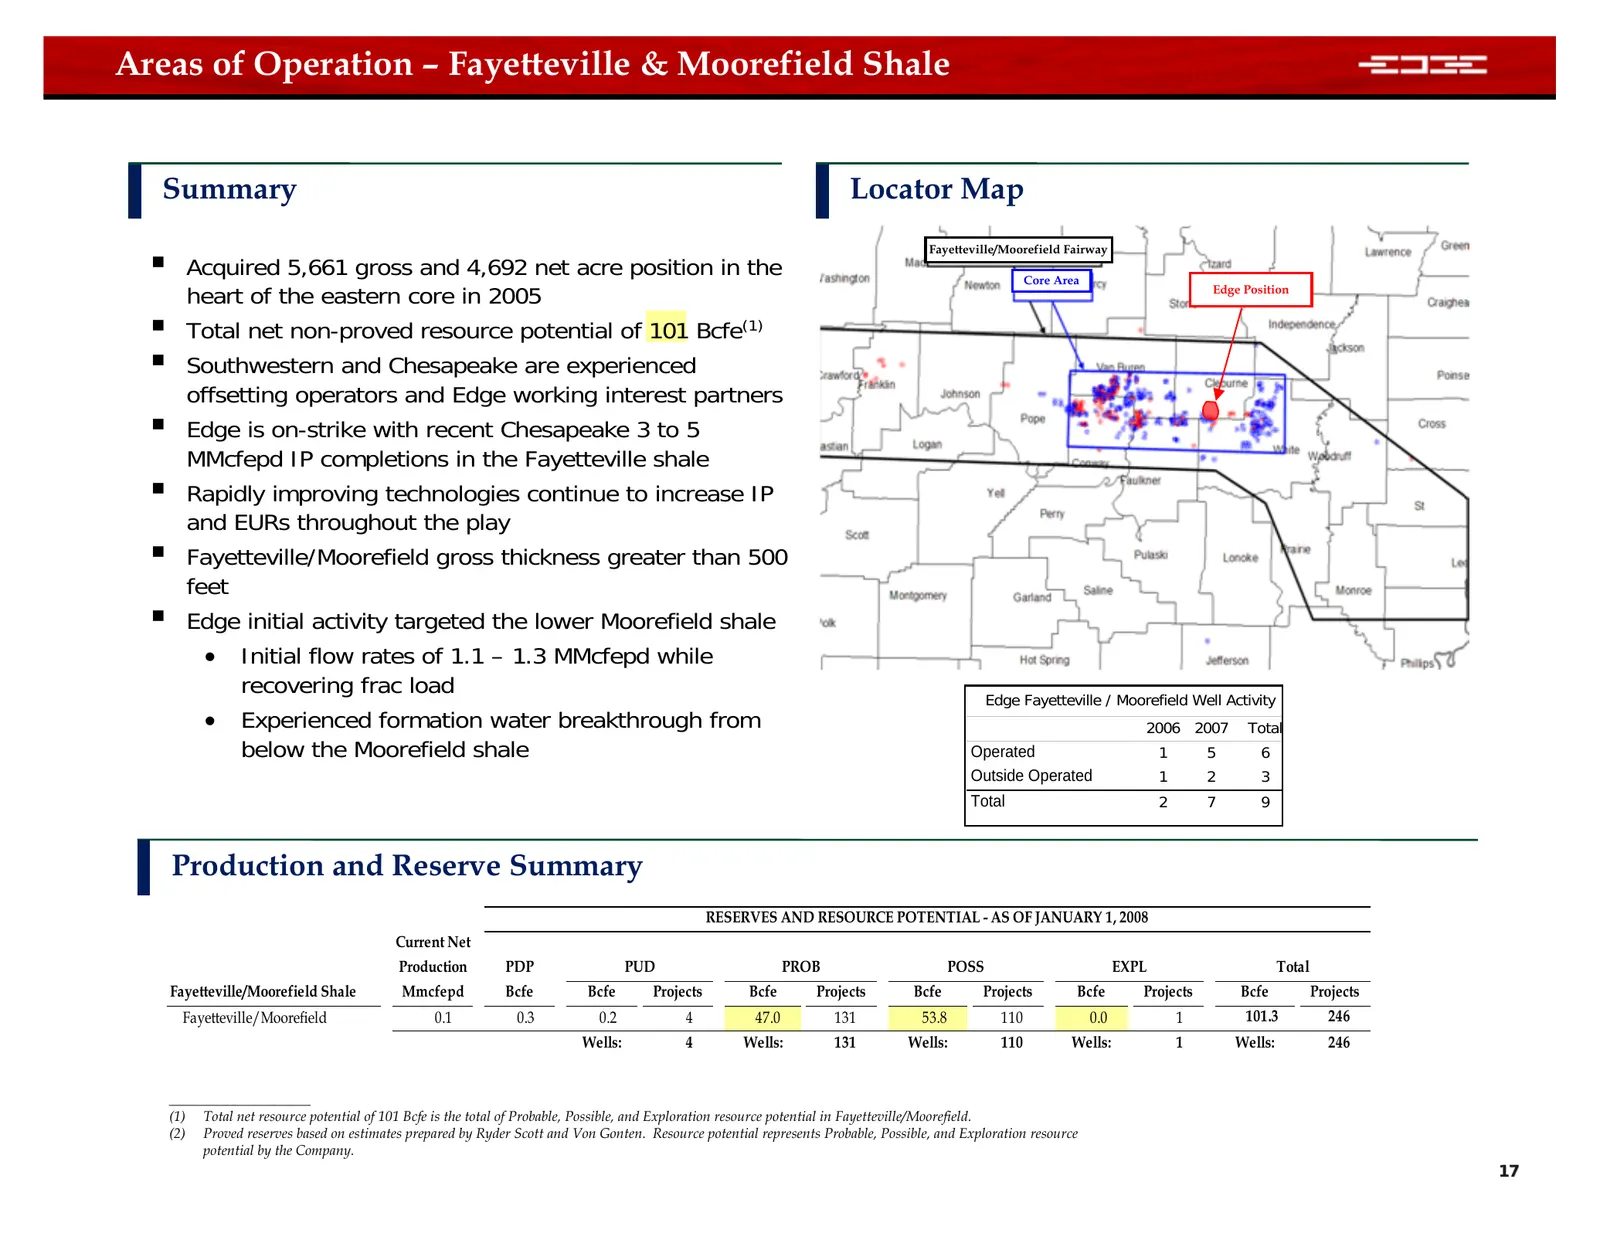
Areas of Operation – Fayetteville & Moorefield Shale Summary Locator Map Acquired 5,661 gross and 4,692 net acre position in the Fayetteville/Moorefield Fairway Core Area heart of the eastern core in 2005 Edge Position Total net non-proved resource potential of 101 Bcfe(1) Southwestern and Che
Slide 18: Fayetteville & Moorefield Shale Upside Opportunity
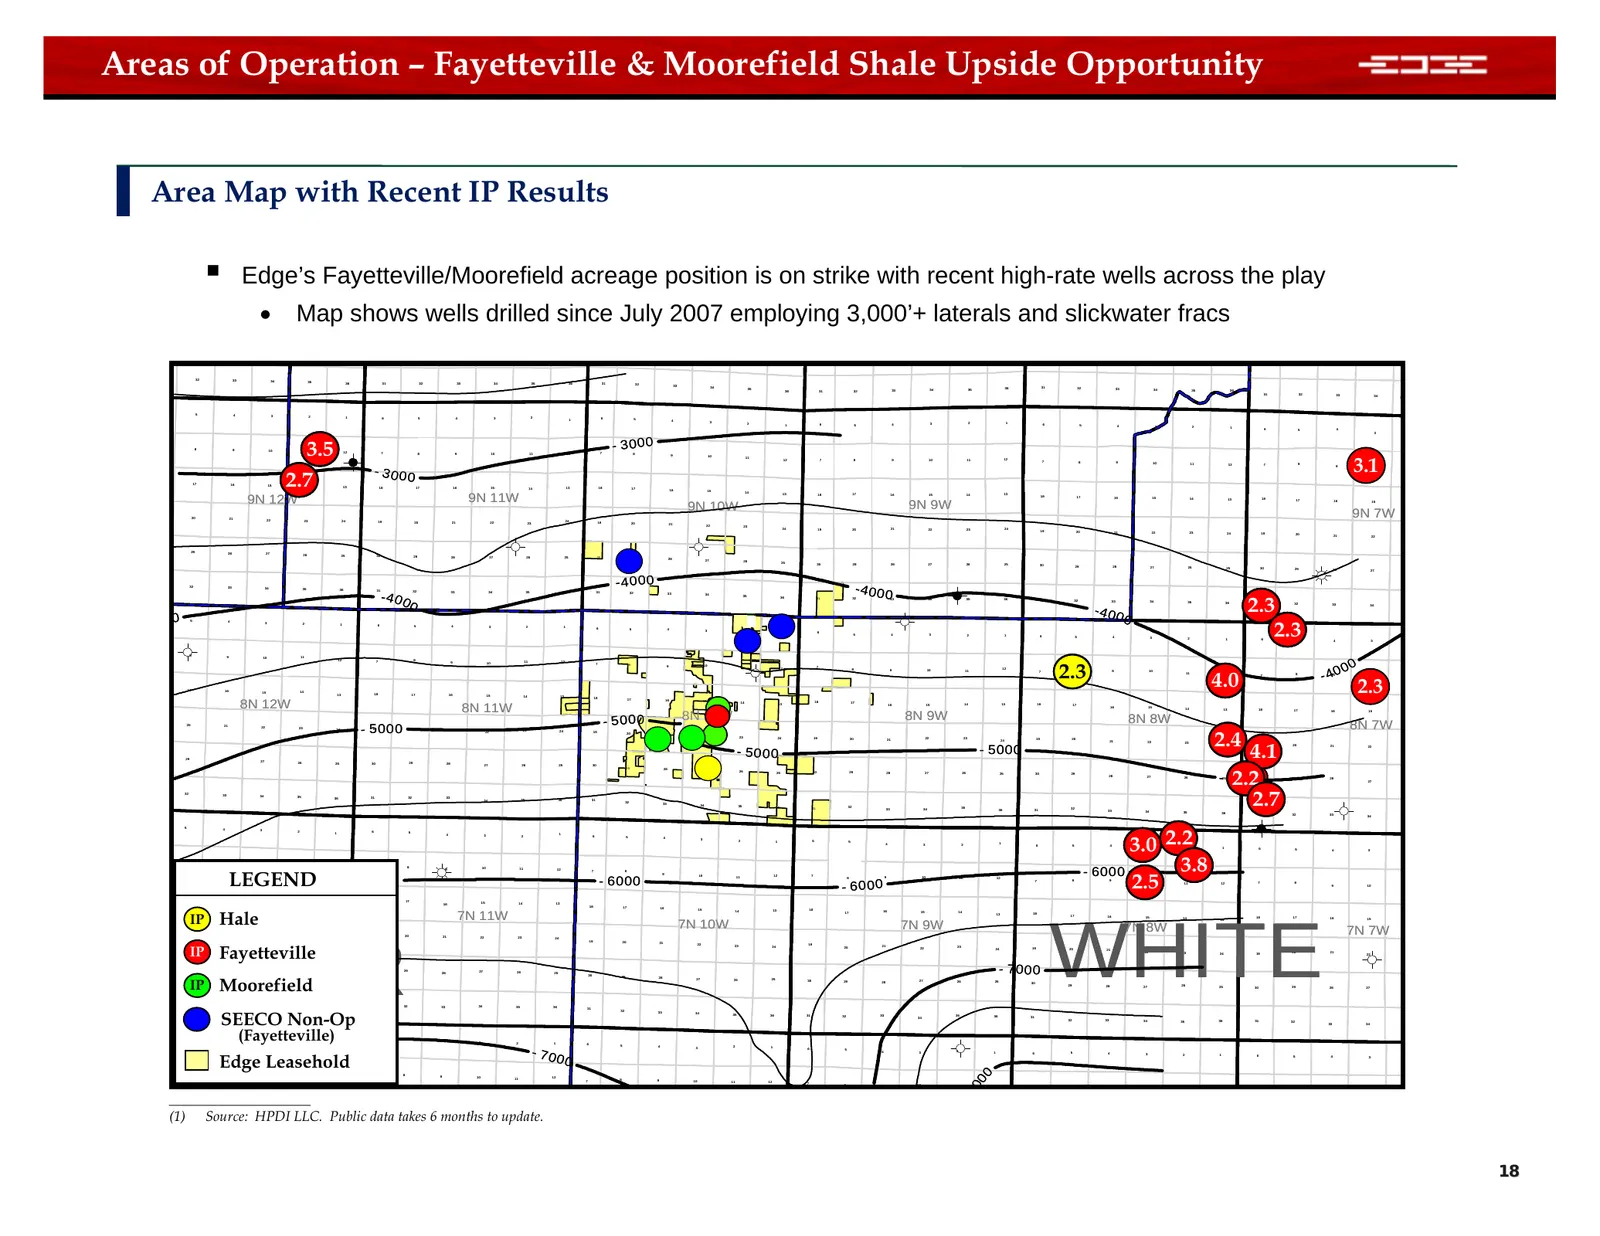
Areas of Operation – Fayetteville & Moorefield Shale Upside Opportunity Area Map with Recent IP Results Edge’s Fayetteville/Moorefield acreage position is on strike with recent high-rate wells across the play • Map shows wells drilled since July 2007 employing 3,000’+ laterals and slickwater fracs
Slide 19: Definitions
Definitions Proved Reserves – estimated quantities of oil and natural gas, which geological and engineering data demonstrate with reasonable certainty to be recoverable in future years from known reservoirs under existing economic and operating conditions • PDP – Proved developed reserves are prov
Slide 20: Corporate Presentation February 2008
Corporate Presentation February 2008
Source: SEC EDGAR · 8-K filed Feb 20, 2008