Ucb S.A. · EURONEXT:UCB
Ucb — FY2017 Earnings Presentation
53 slides from Ucb's earnings presentation, Feb 22, 2018
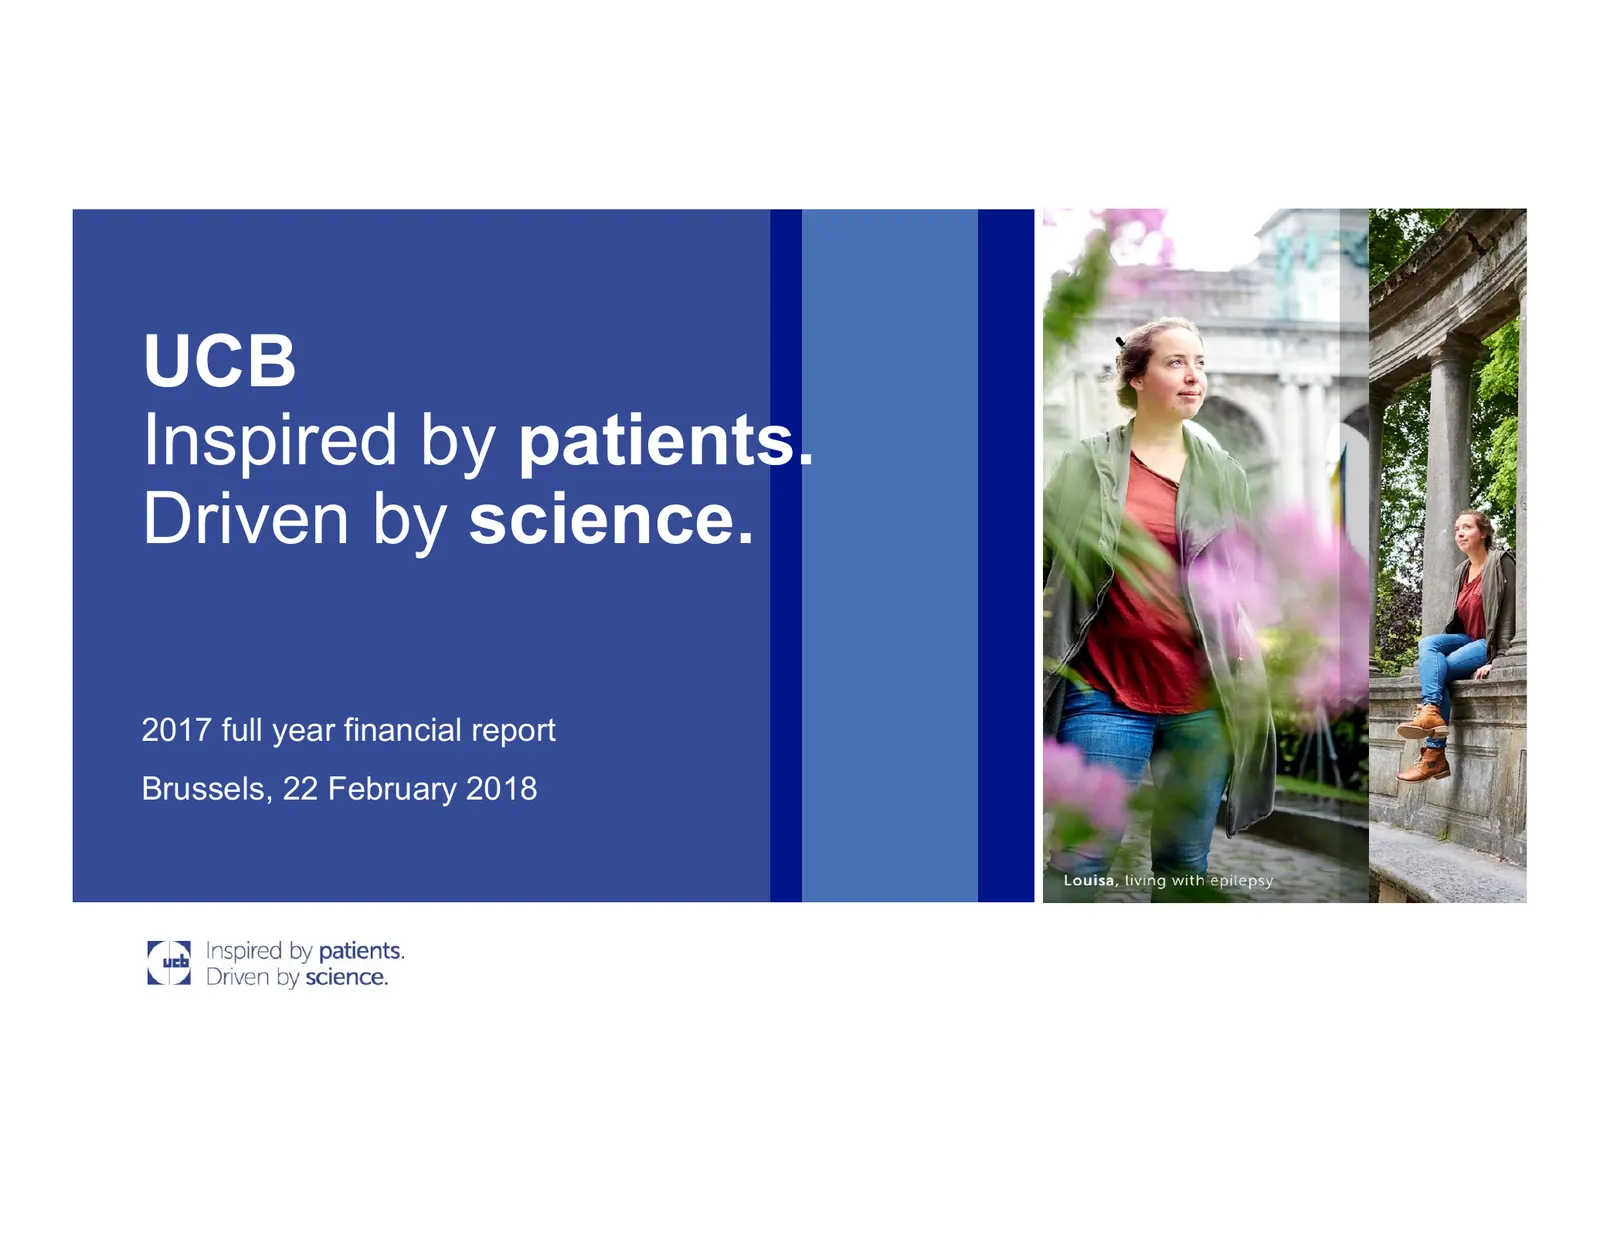
Slide 1: 2017 full year financial report
UCB Inspired by patients. Driven by science. 2017 full year financial report Brussels, 22 February 2018
Slide 2: Disclaimer and safe harbor
2017 FY results 2 Disclaimer and safe harbor Forward-looking statements This presentation contains forward-looking statements, including, without limitation, statements containing the words “believes”, “anticipates”, “expects”, “intends”, “plans”, “seeks”, “estimates”, “may”, “will”, and “continue”
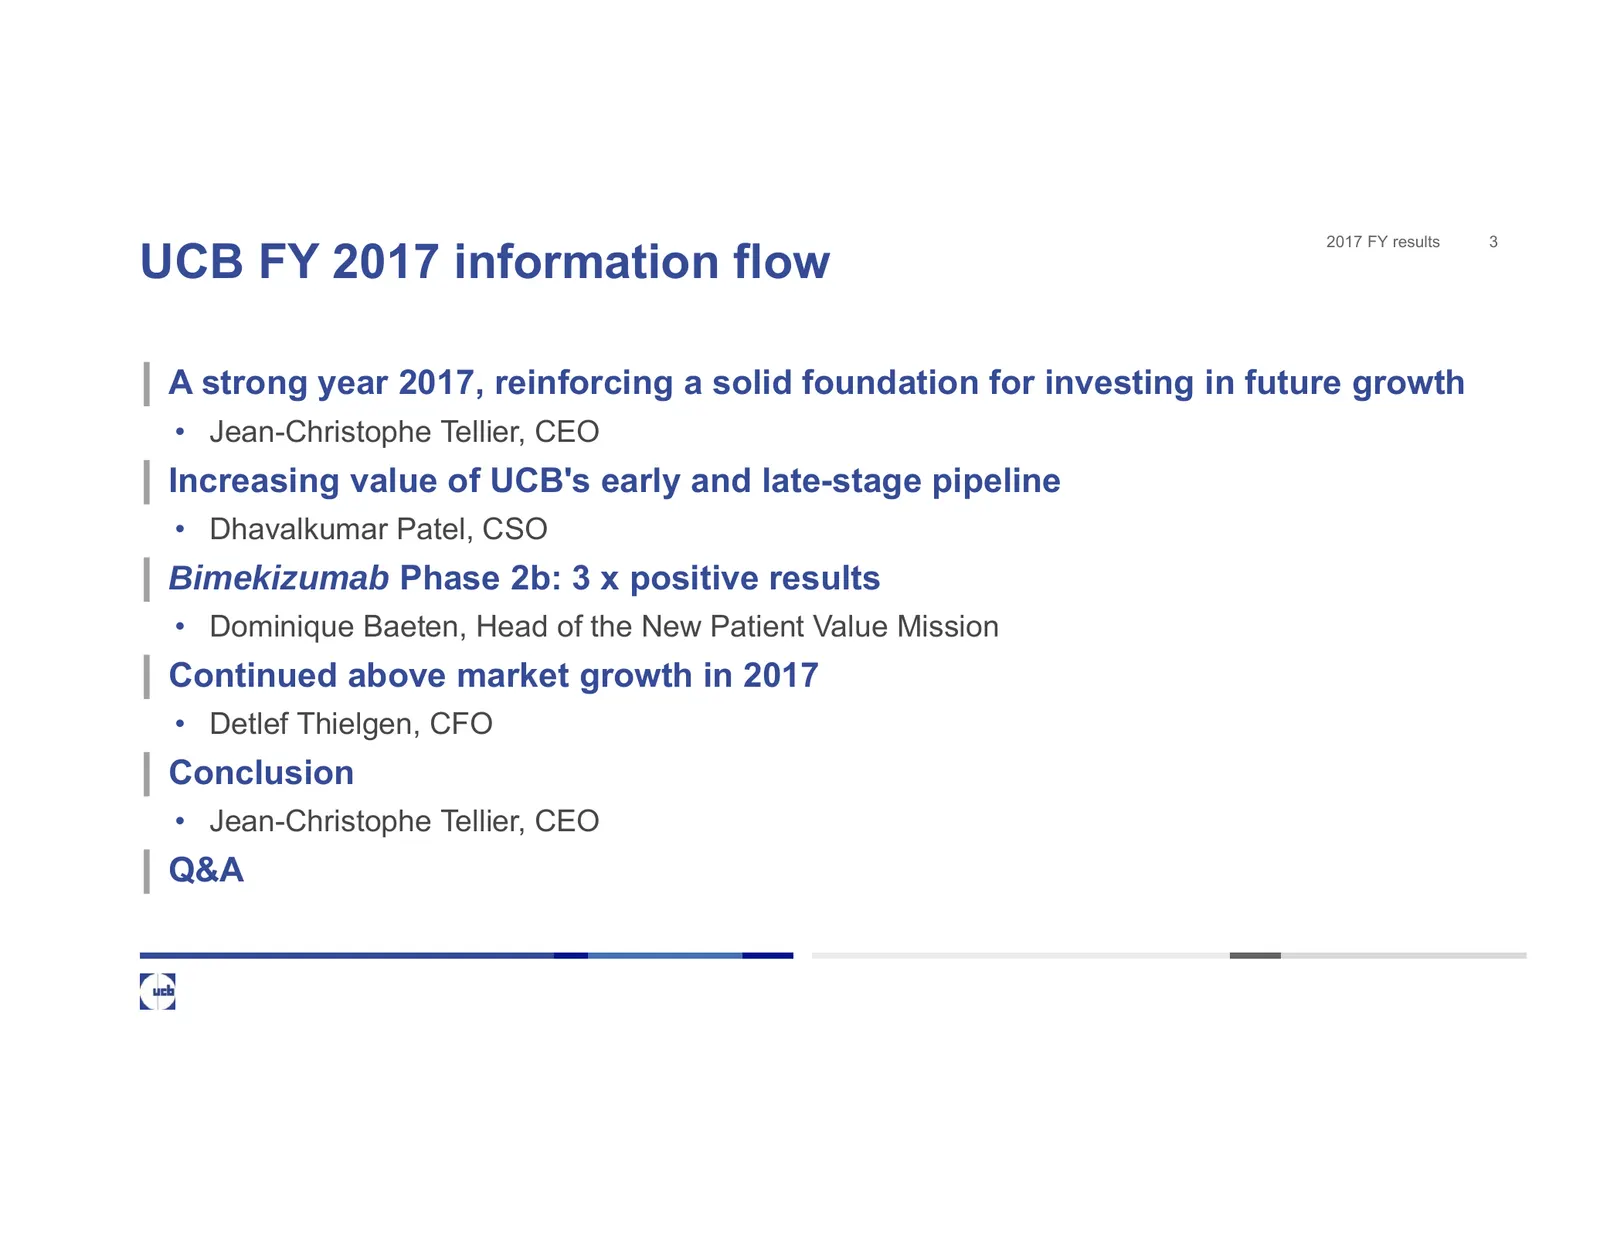
Slide 3: UCB FY 2017 information flow
2017 FY results 3 UCB FY 2017 information flow ןA strong year 2017, reinforcing a solid foundation for investing in future growth • Jean-Christophe Tellier, CEO ןIncreasing value of UCB's early and late-stage pipeline • Dhavalkumar Patel, CSO ןBimekizumab Phase 2b: 3 x positive results • Do
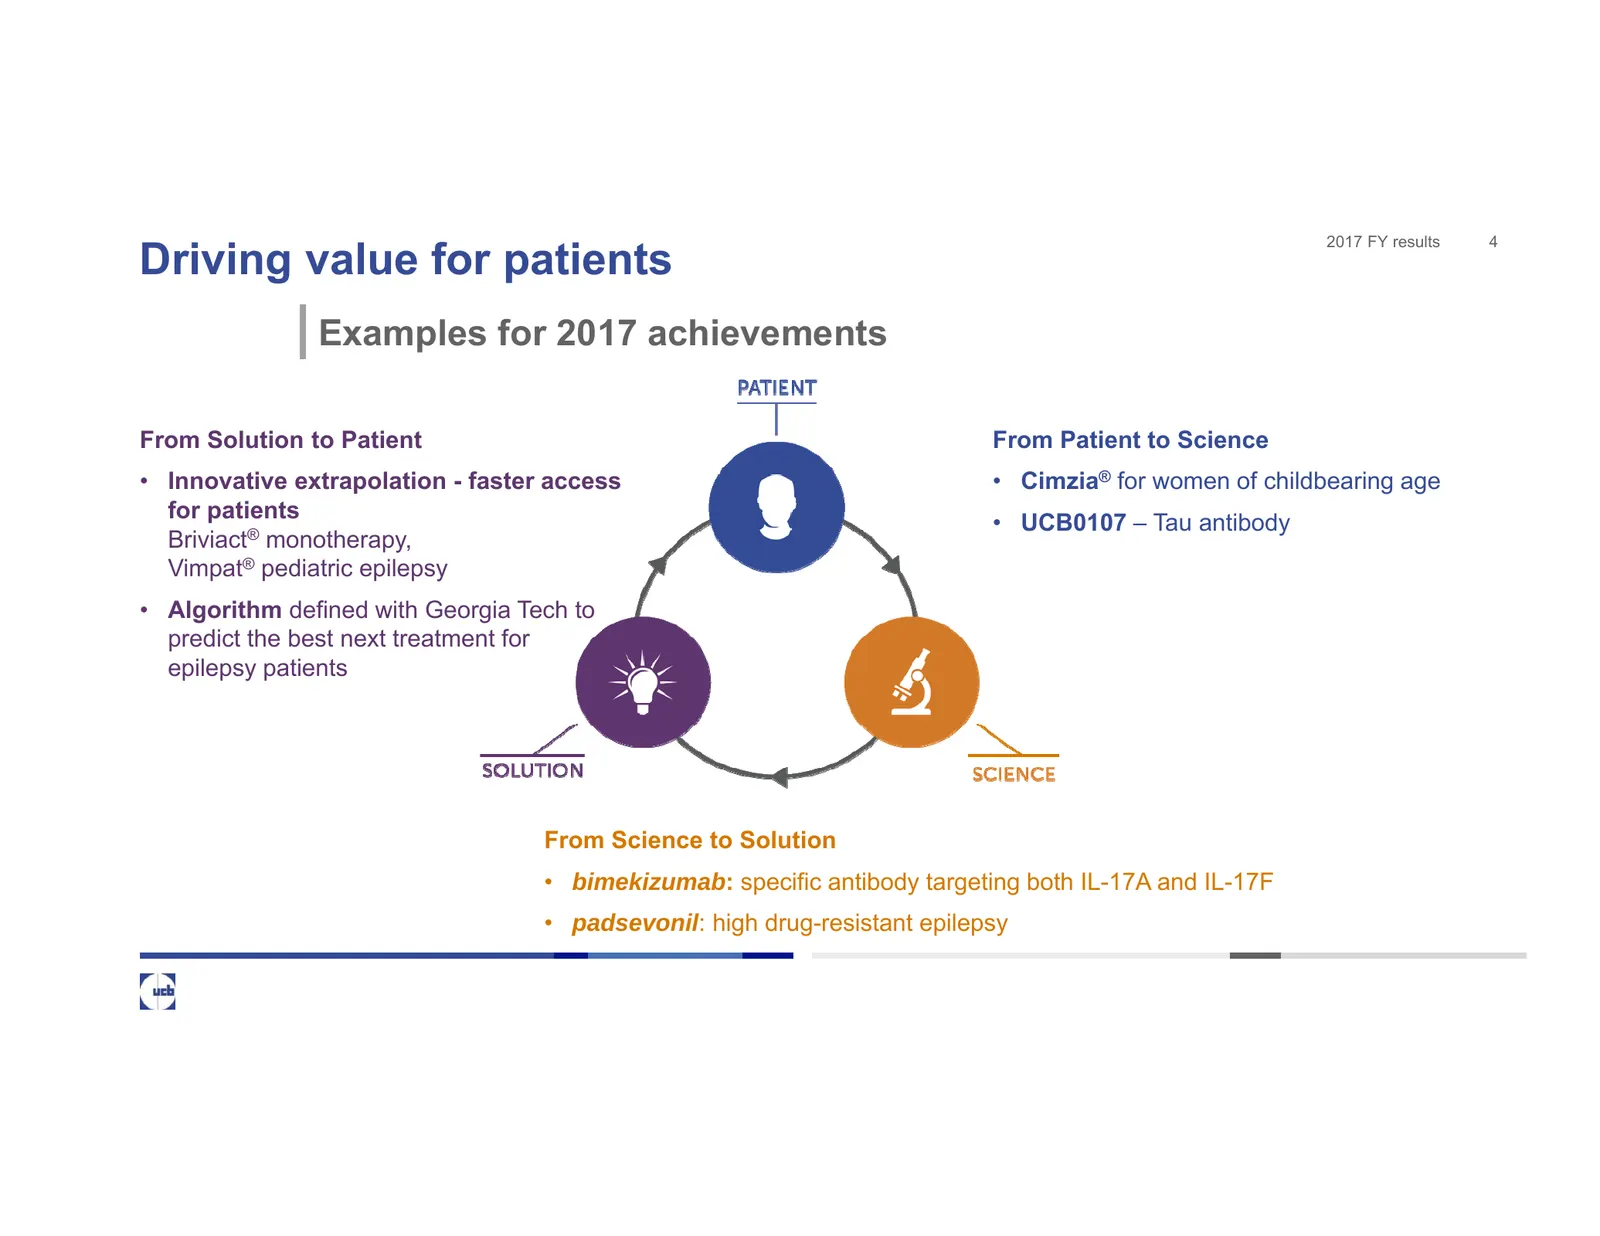
Slide 4: Driving value for patients
2017 FY results 4 Driving value for patients Examples for 2017 achievements From Solution to Patient From Patient to Science • Innovative extrapolation - faster access • Cimzia® for women of childbearing age for patients • UCB0107 – Tau antibody Briviact® monotherapy, Vimpat® pediatric epilepsy • Al
Slide 5: UCB is progressing on our strategic growth path
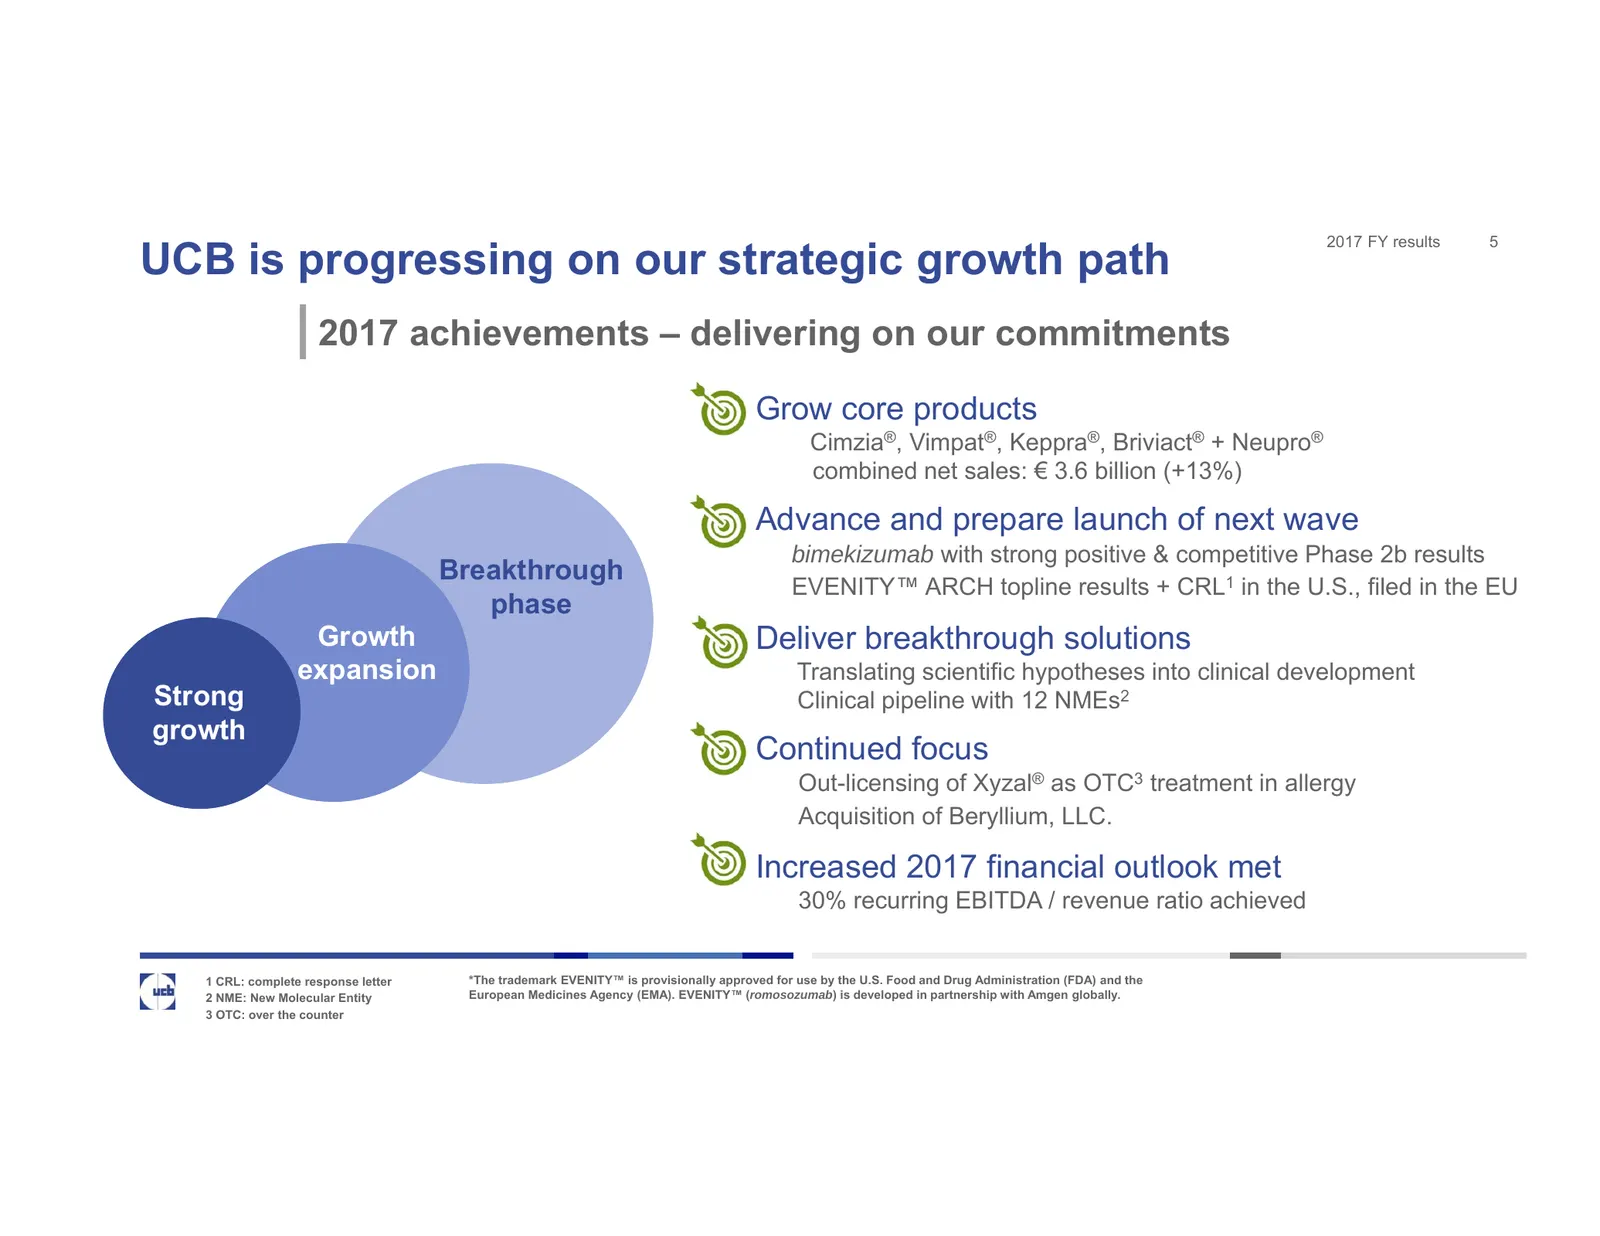
2017 FY results 5 UCB is progressing on our strategic growth path 2017 achievements – delivering on our commitments Grow core products Cimzia®, Vimpat®, Keppra®, Briviact® + Neupro® combined net sales: € 3.6 billion (+13%) Advance and prepare launch of next wave bimekizumab with strong positive & co
Slide 6: Increasing value of UCB's early and late-stage pipeline
6 Increasing value of UCB's early and late-stage pipeline Dhavalkumar Patel, MD, PhD CSO
Slide 7: Increasing value of UCB's early and late-stage pipeline
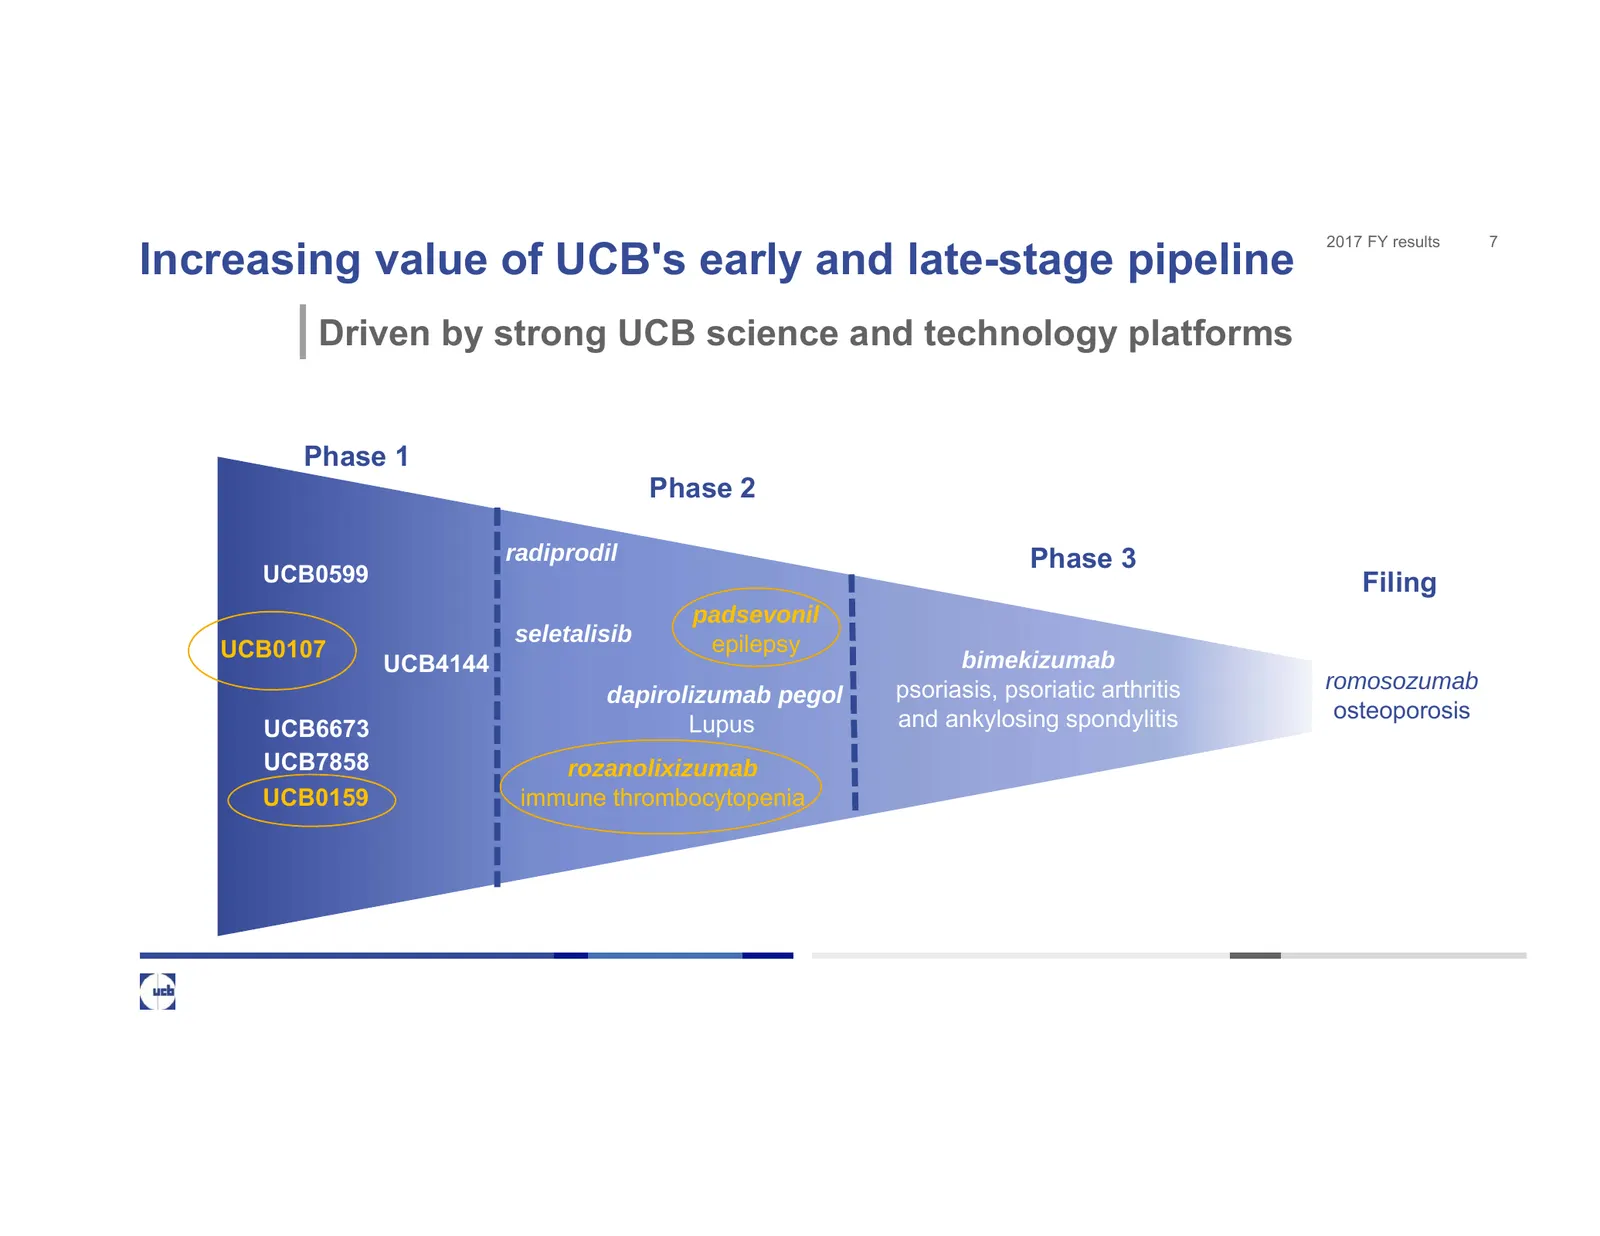
2017 FY results 7 Increasing value of UCB's early and late-stage pipeline Driven by strong UCB science and technology platforms Phase 1 Phase 2 radiprodil Phase 3 UCB0599 Filing padsevonil seletalisib epilepsy UCB0107 UCB4144 bimekizumab psoriasis, psoriatic arthritis romosozumab dapirolizumab pegol
Slide 8: We keep strengthening our leadership in epilepsy with padsevonil
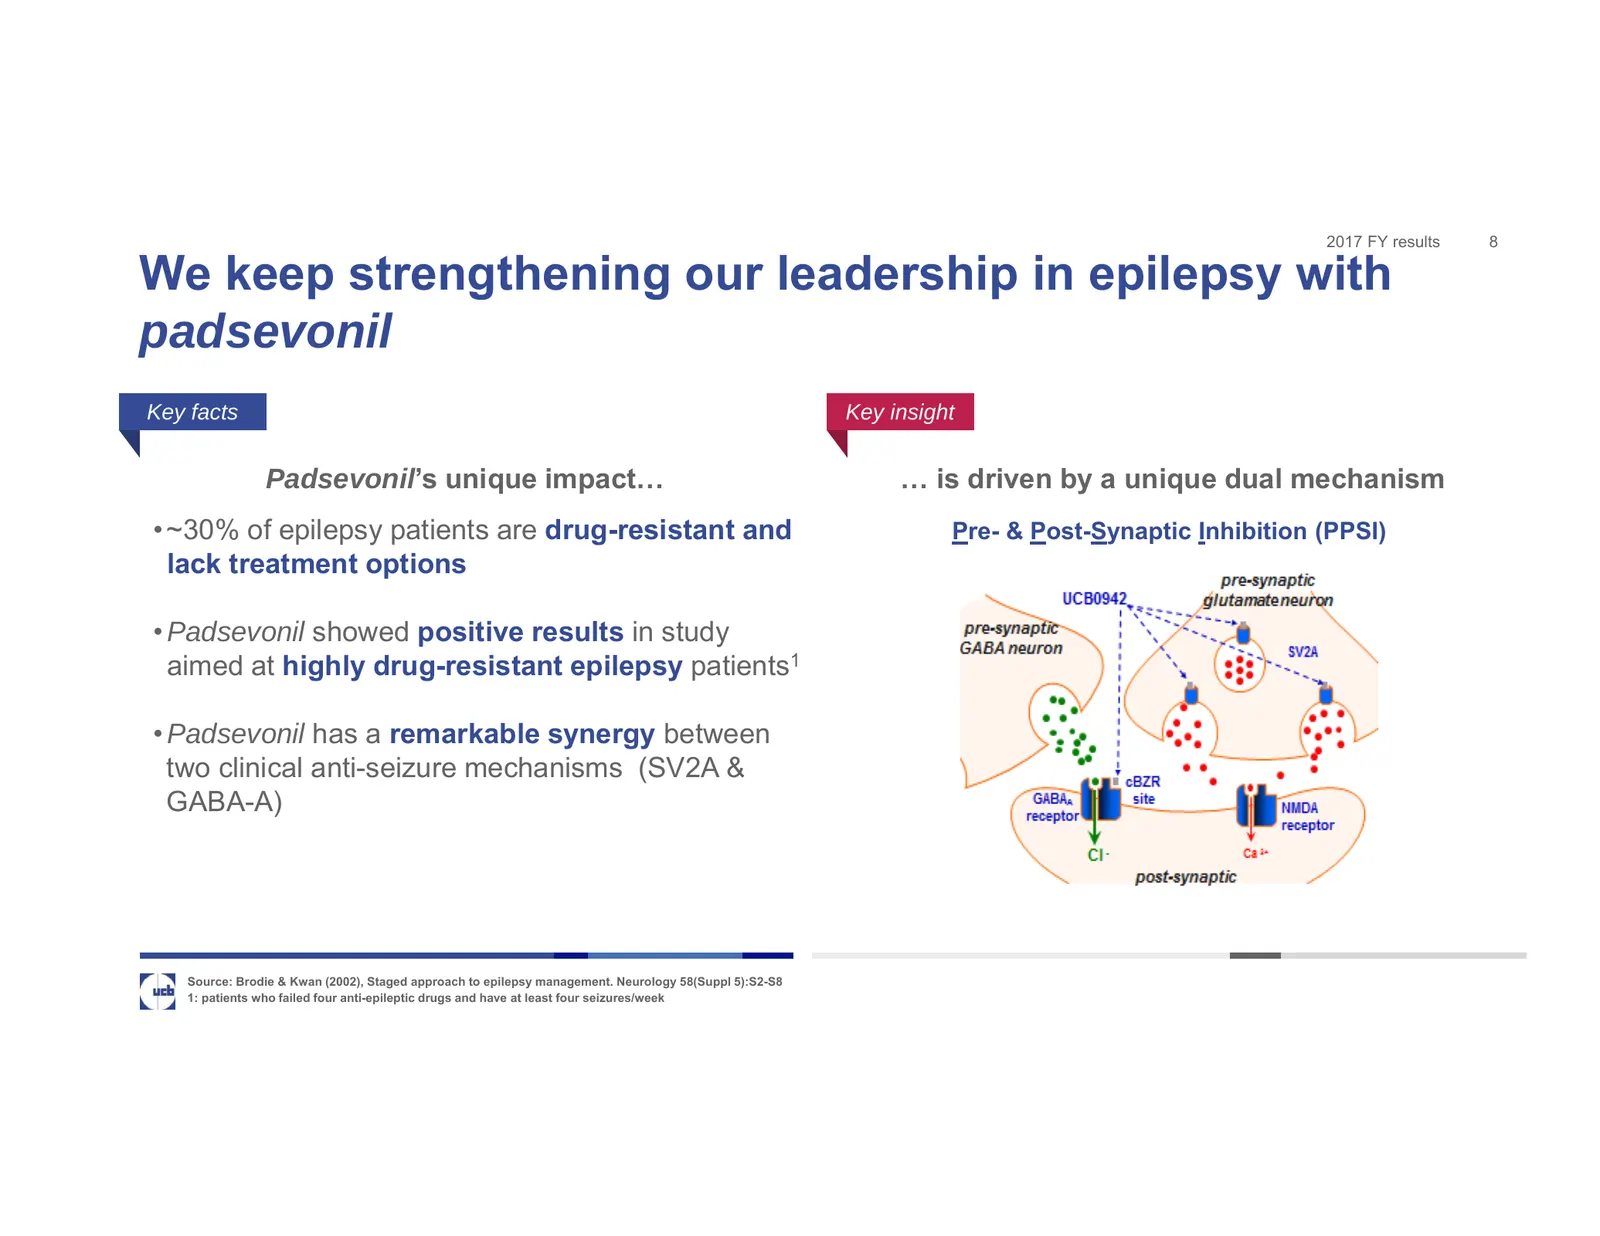
2017 FY results 8 We keep strengthening our leadership in epilepsy with padsevonil Key facts Key insight Padsevonil’s unique impact… … is driven by a unique dual mechanism • ~30% of epilepsy patients are drug-resistant and Pre- & Post-Synaptic Inhibition (PPSI) lack treatment options • Padsevonil sh
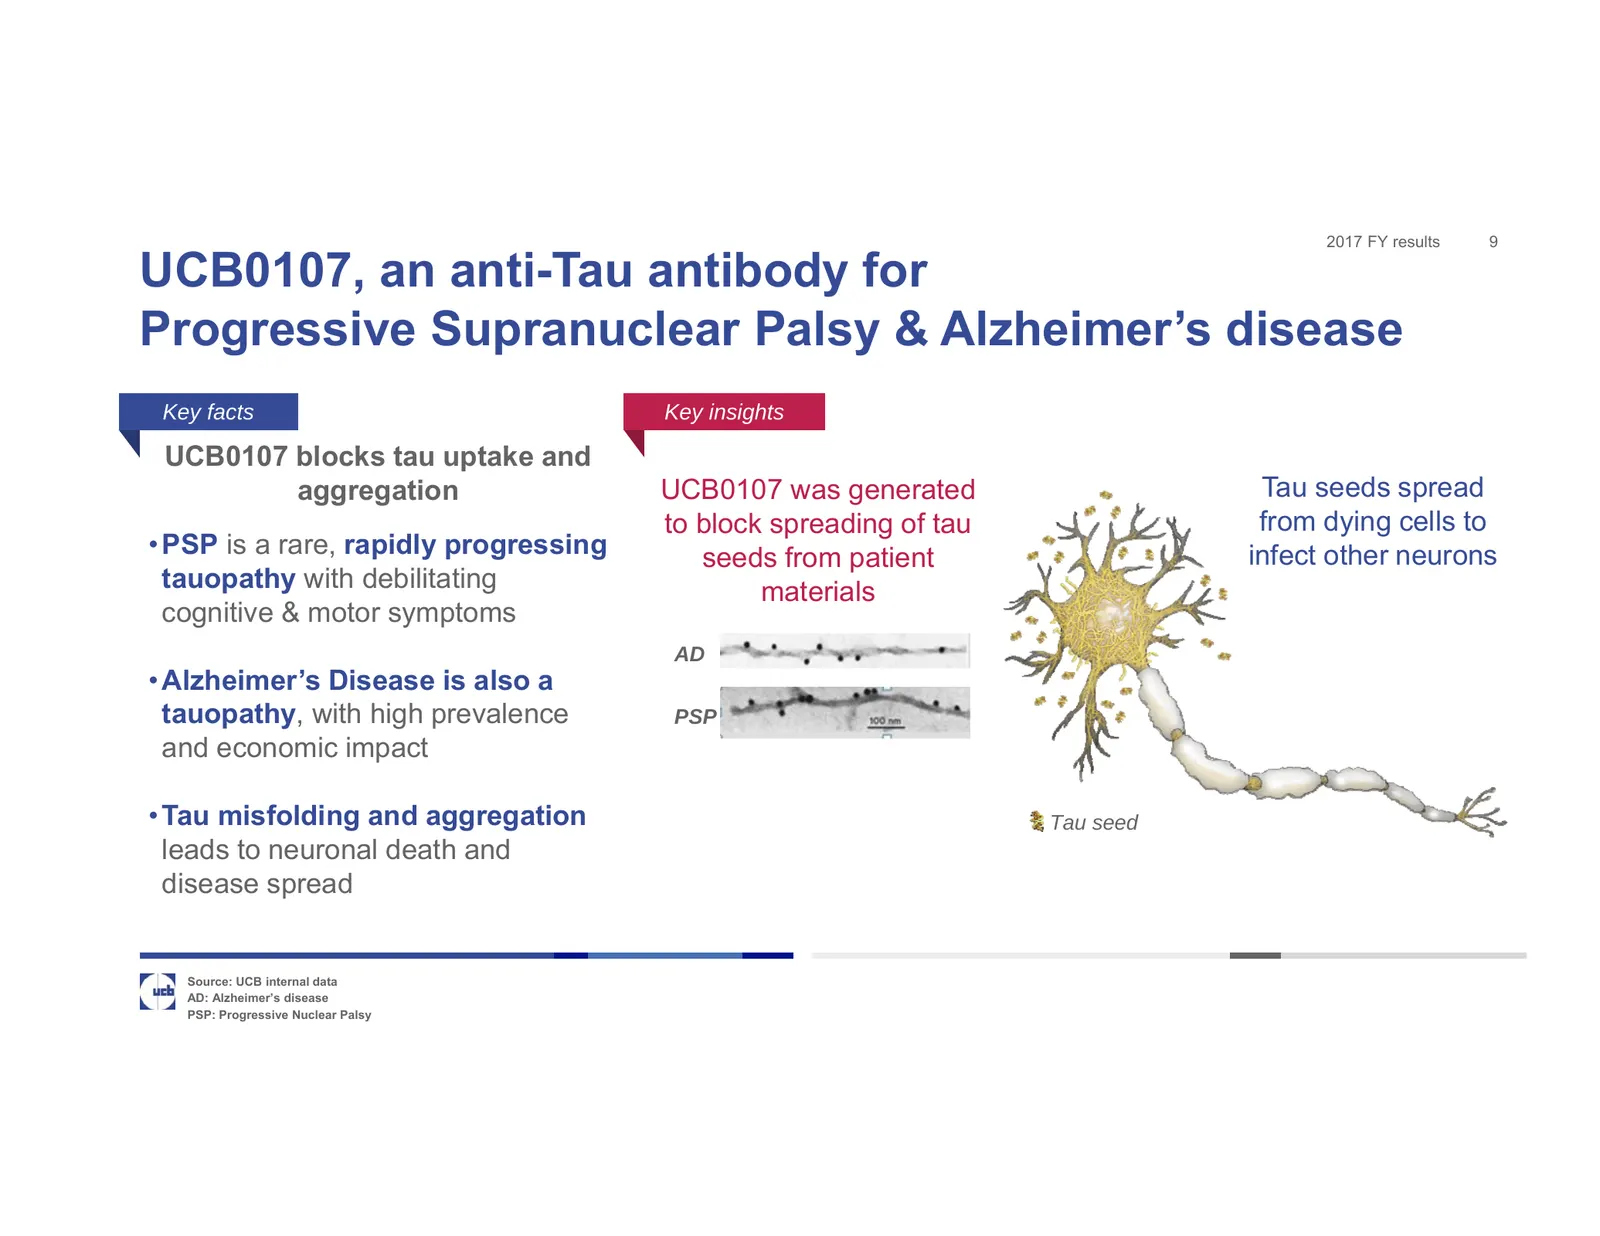
Slide 9: UCB0107, an anti-Tau antibody for PSP & Alzheimer's disease
2017 FY results 9 UCB0107, an anti-Tau antibody for Progressive Supranuclear Palsy & Alzheimer’s disease Key facts Key insights UCB0107 blocks tau uptake and aggregation UCB0107 was generated Tau seeds spread to block spreading of tau from dying cells to • PSP is a rare, rapidly progressing seeds fr
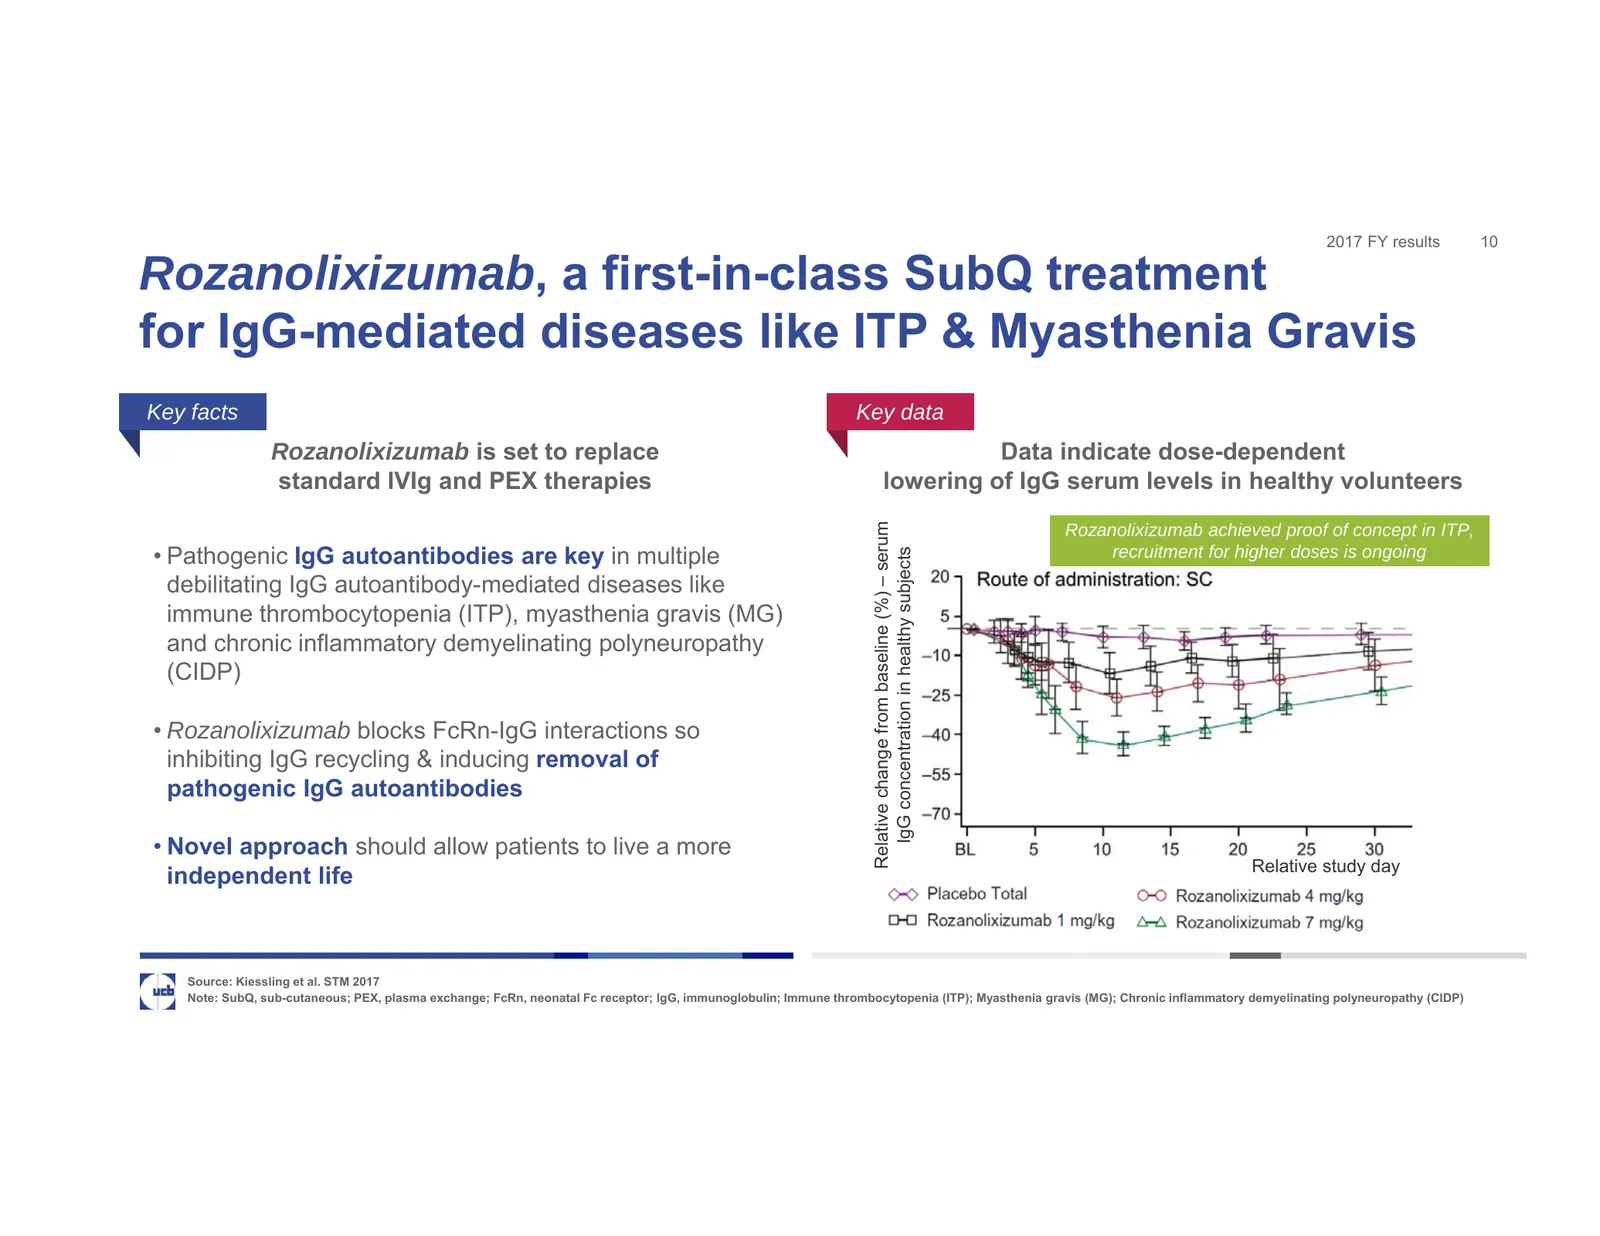
Slide 10: Rozanolixizumab, a first-in-class SubQ treatment for IgG-mediated diseases
2017 FY results 10 Rozanolixizumab, a first-in-class SubQ treatment for IgG-mediated diseases like ITP & Myasthenia Gravis Key facts Key data Rozanolixizumab is set to replace Data indicate dose-dependent standard IVIg and PEX therapies lowering of IgG serum levels in healthy volunteers Relative cha
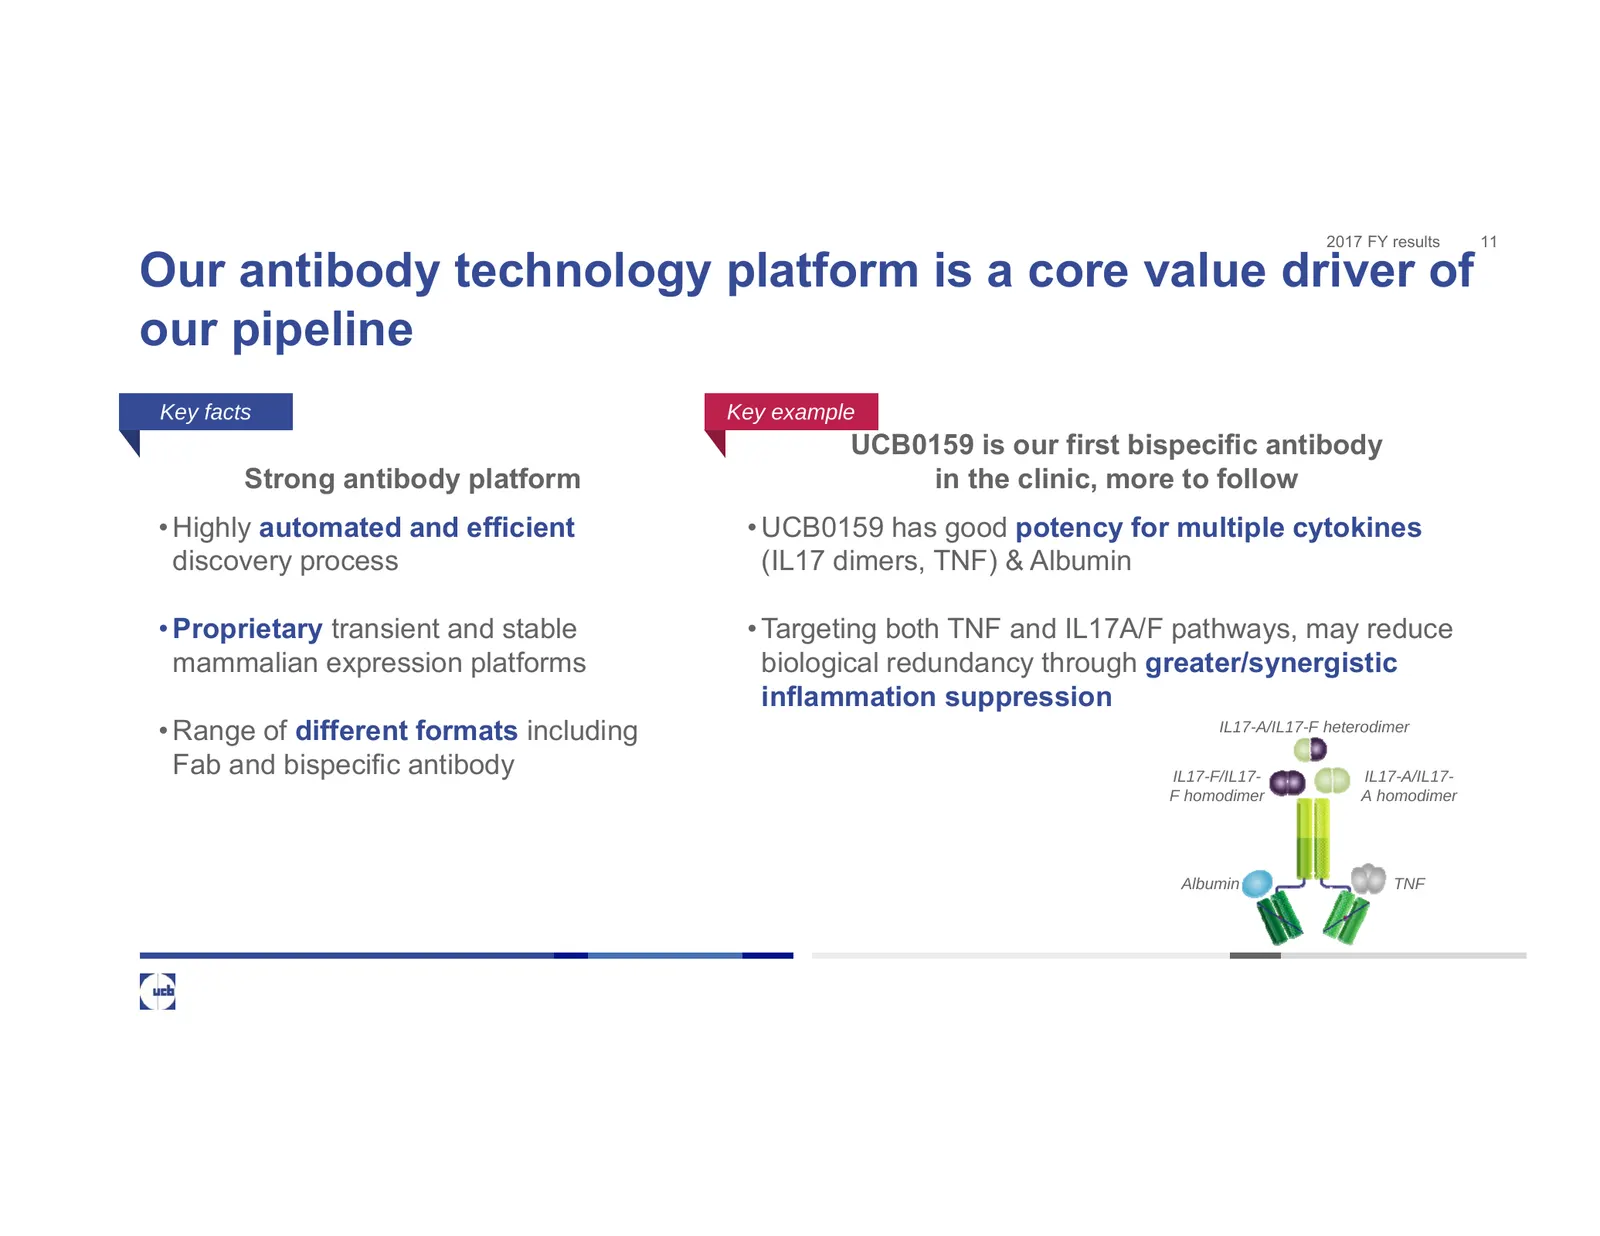
Slide 11: Our antibody technology platform is a core value driver
2017 FY results 11 Our antibody technology platform is a core value driver of our pipeline Key facts Key example UCB0159 is our first bispecific antibody Strong antibody platform in the clinic, more to follow • Highly automated and efficient • UCB0159 has good potency for multiple cytokines discover
Slide 12: Bimekizumab Phase 2b: 3 x positive results
12 Bimekizumab Phase 2b: 3 x positive results Dominique Baeten, MD, PhD Professor of Rheumatology Head of the New Patient Value Mission
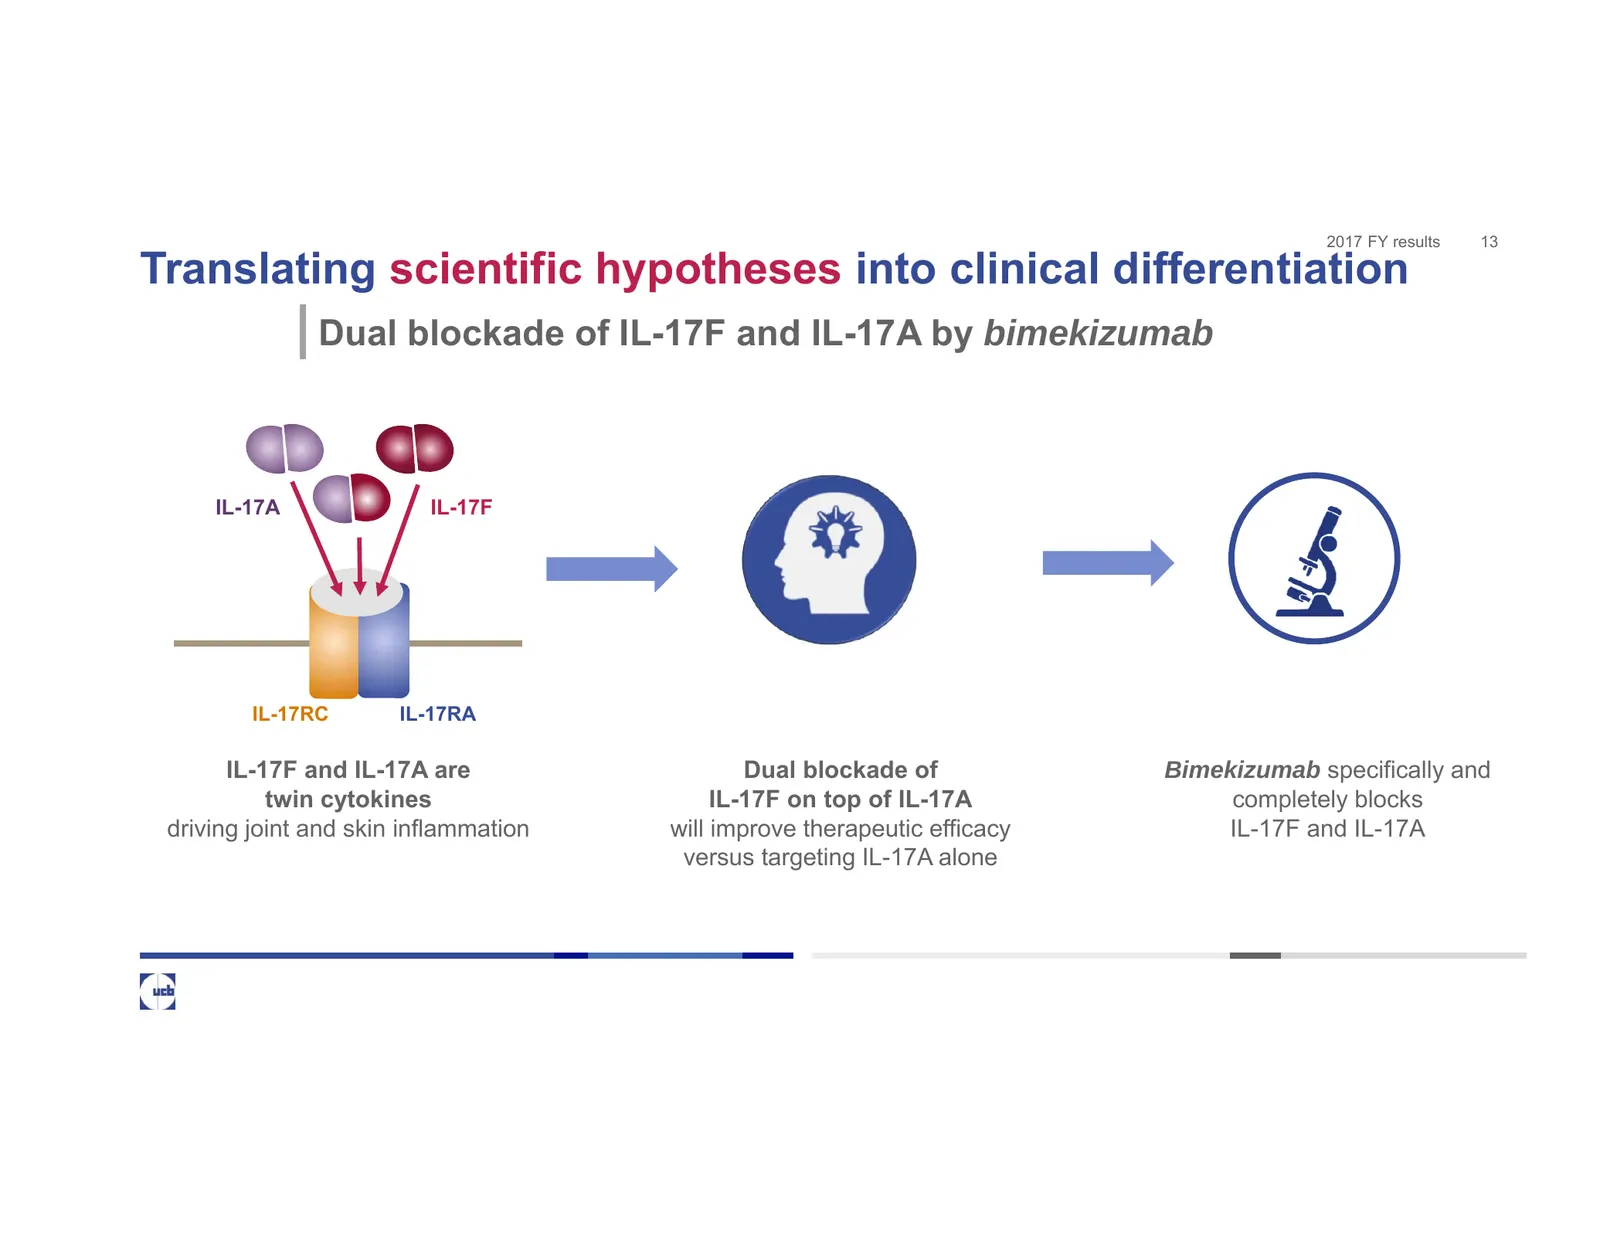
Slide 13: Translating scientific hypotheses into clinical differentiation
2017 FY results 13 Translating scientific hypotheses into clinical differentiation Dual blockade of IL-17F and IL-17A by bimekizumab IL-17A IL-17F IL-17RC IL-17RA IL-17F and IL-17A are Dual blockade of Bimekizumab specifically and twin cytokines IL-17F on top of IL-17A completely blocks driving join
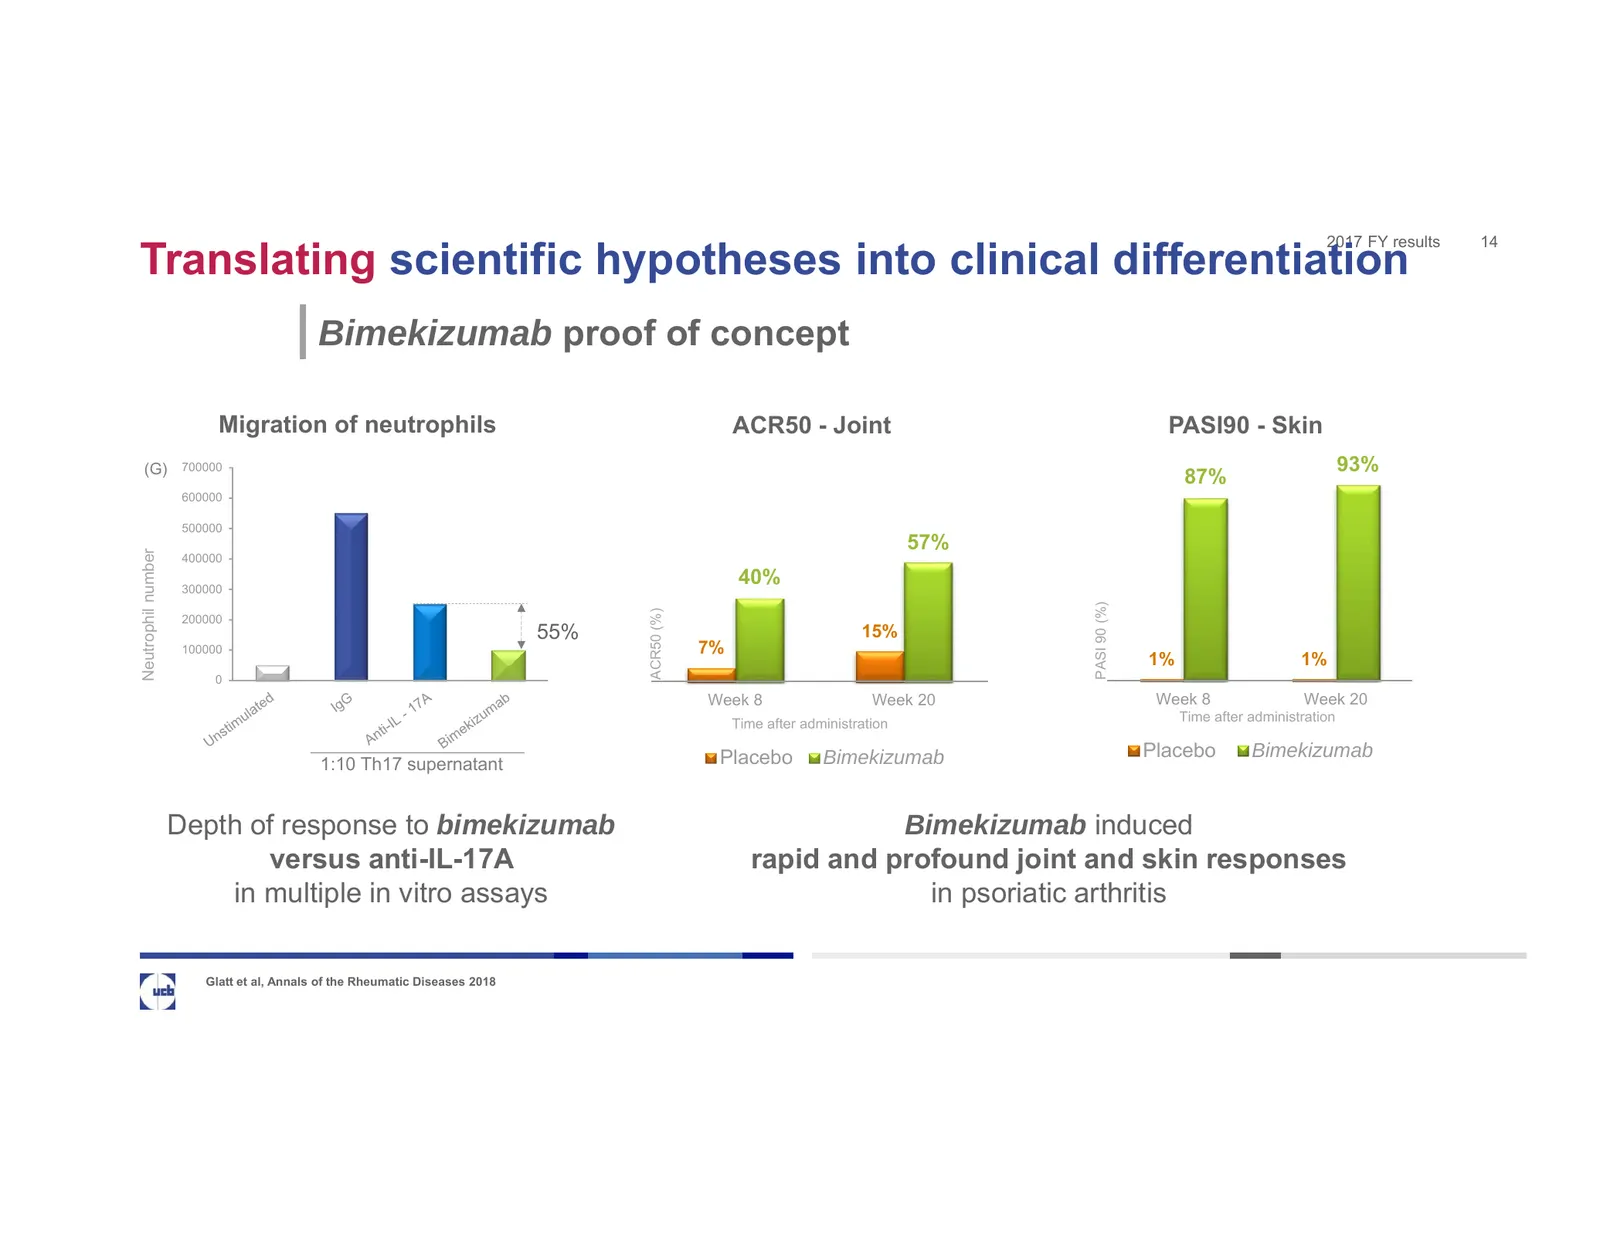
Slide 14: Bimekizumab proof of concept
2017 FY results 14 Translating scientific hypotheses into clinical differentiation Bimekizumab proof of concept Migration of neutrophils ACR50 - Joint PASI90 - Skin (G) 700000 93% 87% 600000 500000 57% Neutrophil number 400000 300000 40% PASI 90 (%) ACR50 (%) 200000 55% 15% 100000 7% 1% 1% 0 Week 8
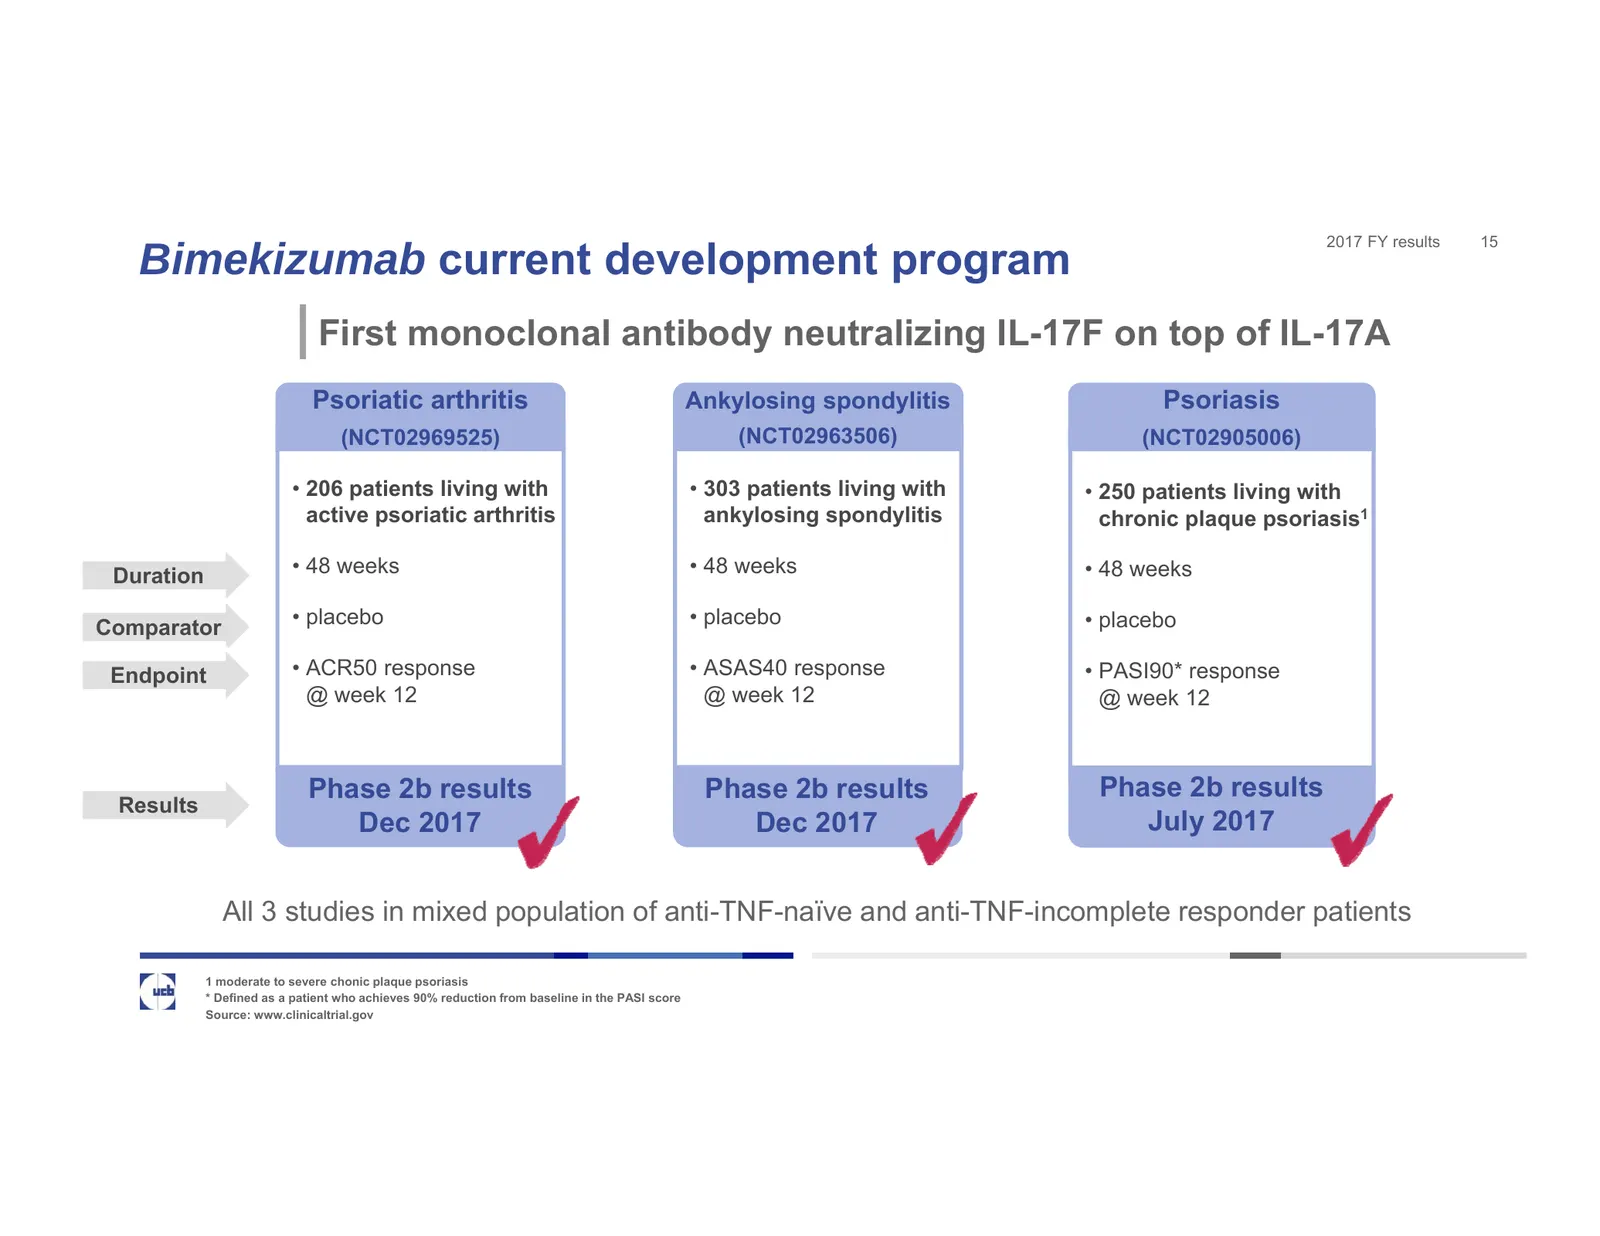
Slide 15: Bimekizumab current development program
2017 FY results 15 Bimekizumab current development program First monoclonal antibody neutralizing IL-17F on top of IL-17A Psoriatic arthritis Ankylosing spondylitis Psoriasis (NCT02969525) (NCT02963506) (NCT02905006) • 206 patients living with • 303 patients living with • 250 patients living with ac
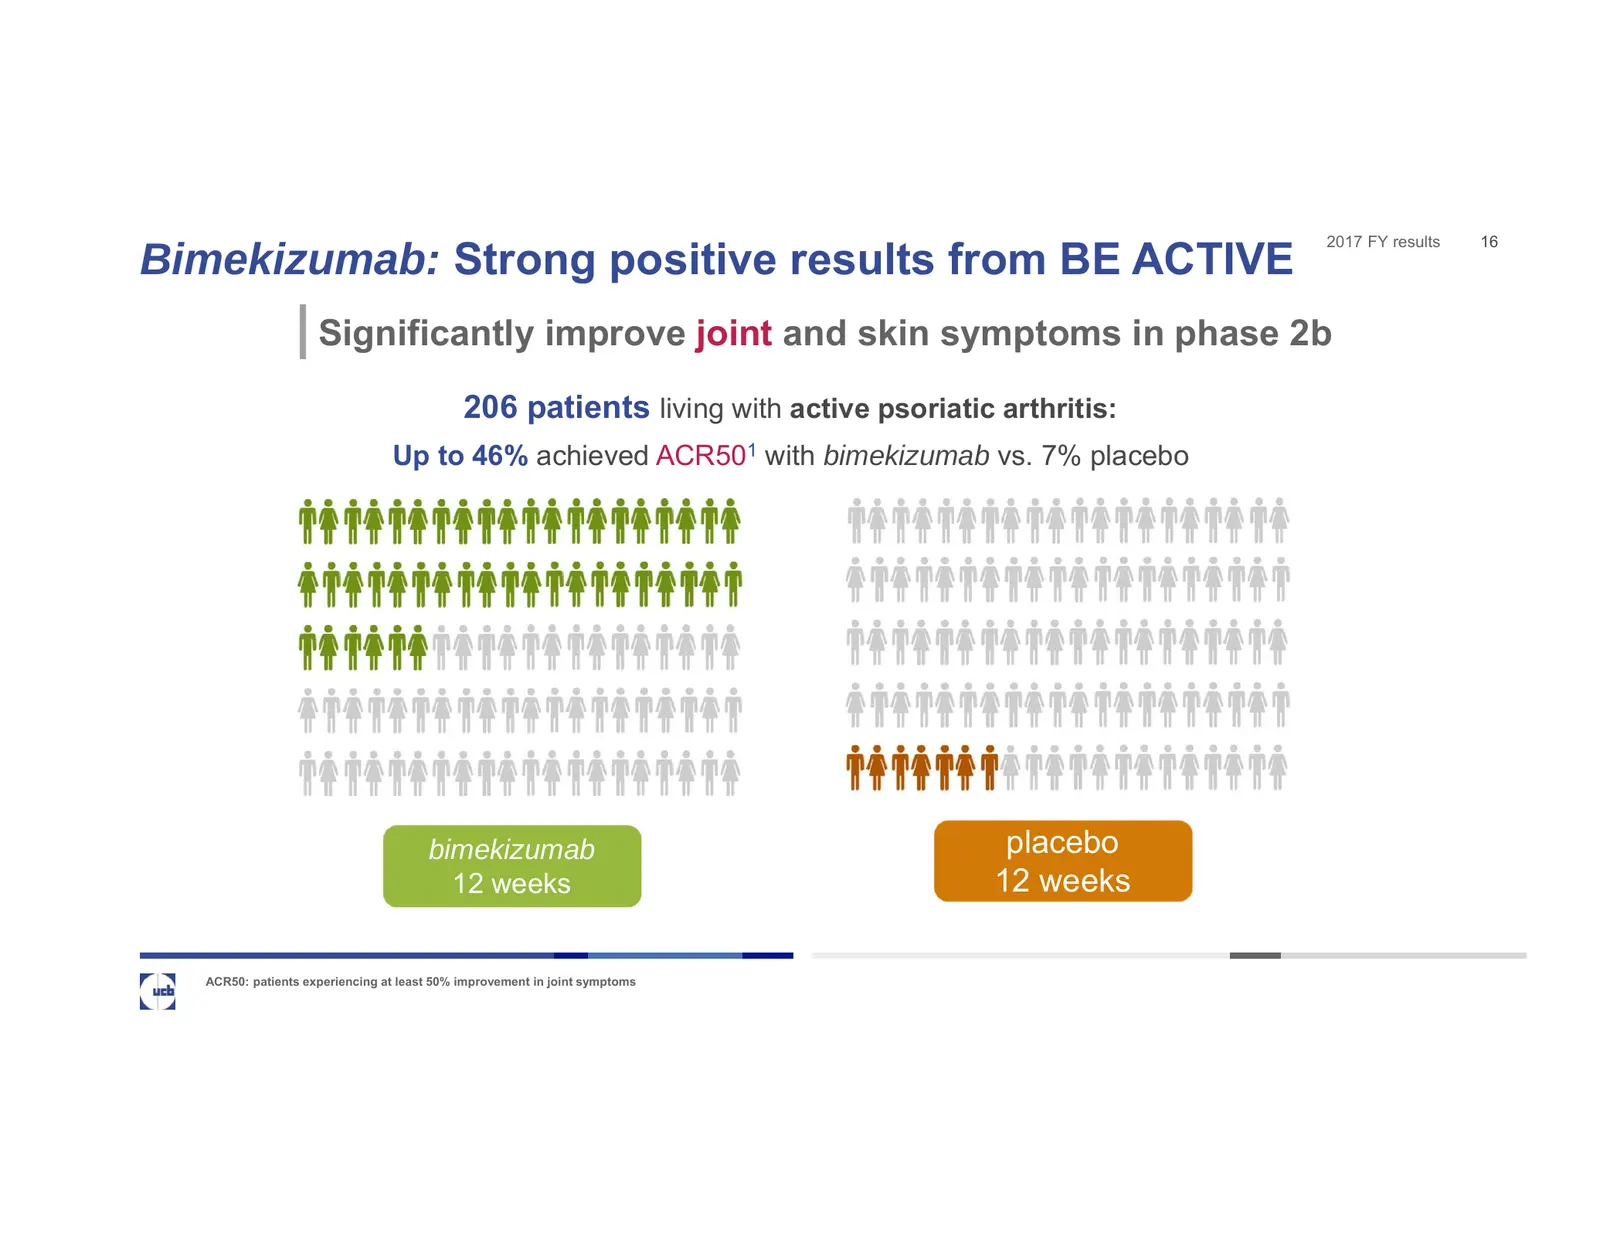
Slide 16: Bimekizumab: Strong positive results from BE ACTIVE
2017 FY results 16 Bimekizumab: Strong positive results from BE ACTIVE Significantly improve joint and skin symptoms in phase 2b 206 patients living with active psoriatic arthritis: Up to 46% achieved ACR501 with bimekizumab vs. 7% placebo bimekizumab placebo 12 weeks 12 weeks ACR50: patients experi
Slide 17: Bimekizumab: Strong positive results from BE ACTIVE
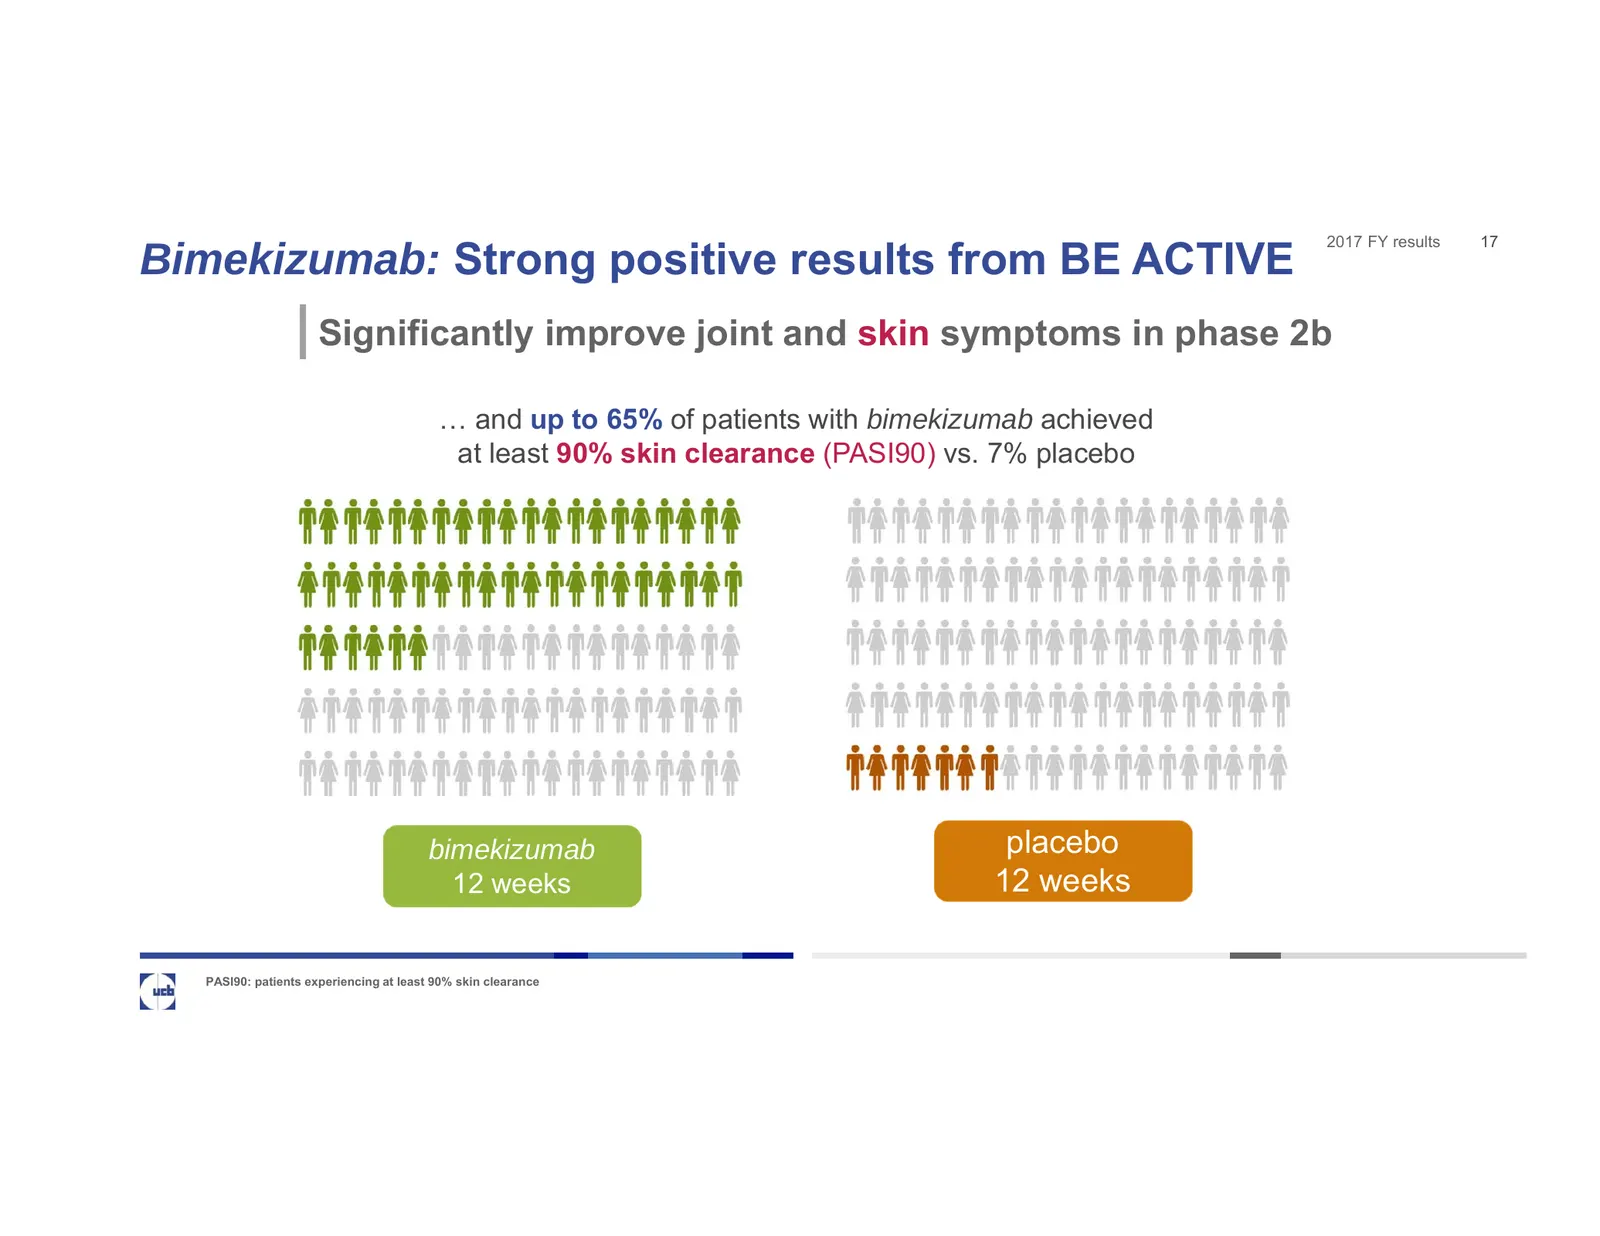
2017 FY results 17 Bimekizumab: Strong positive results from BE ACTIVE Significantly improve joint and skin symptoms in phase 2b … and up to 65% of patients with bimekizumab achieved at least 90% skin clearance (PASI90) vs. 7% placebo bimekizumab placebo 12 weeks 12 weeks PASI90: patients experienci
Slide 18: Bimekizumab: Strong positive results from BE AGILE
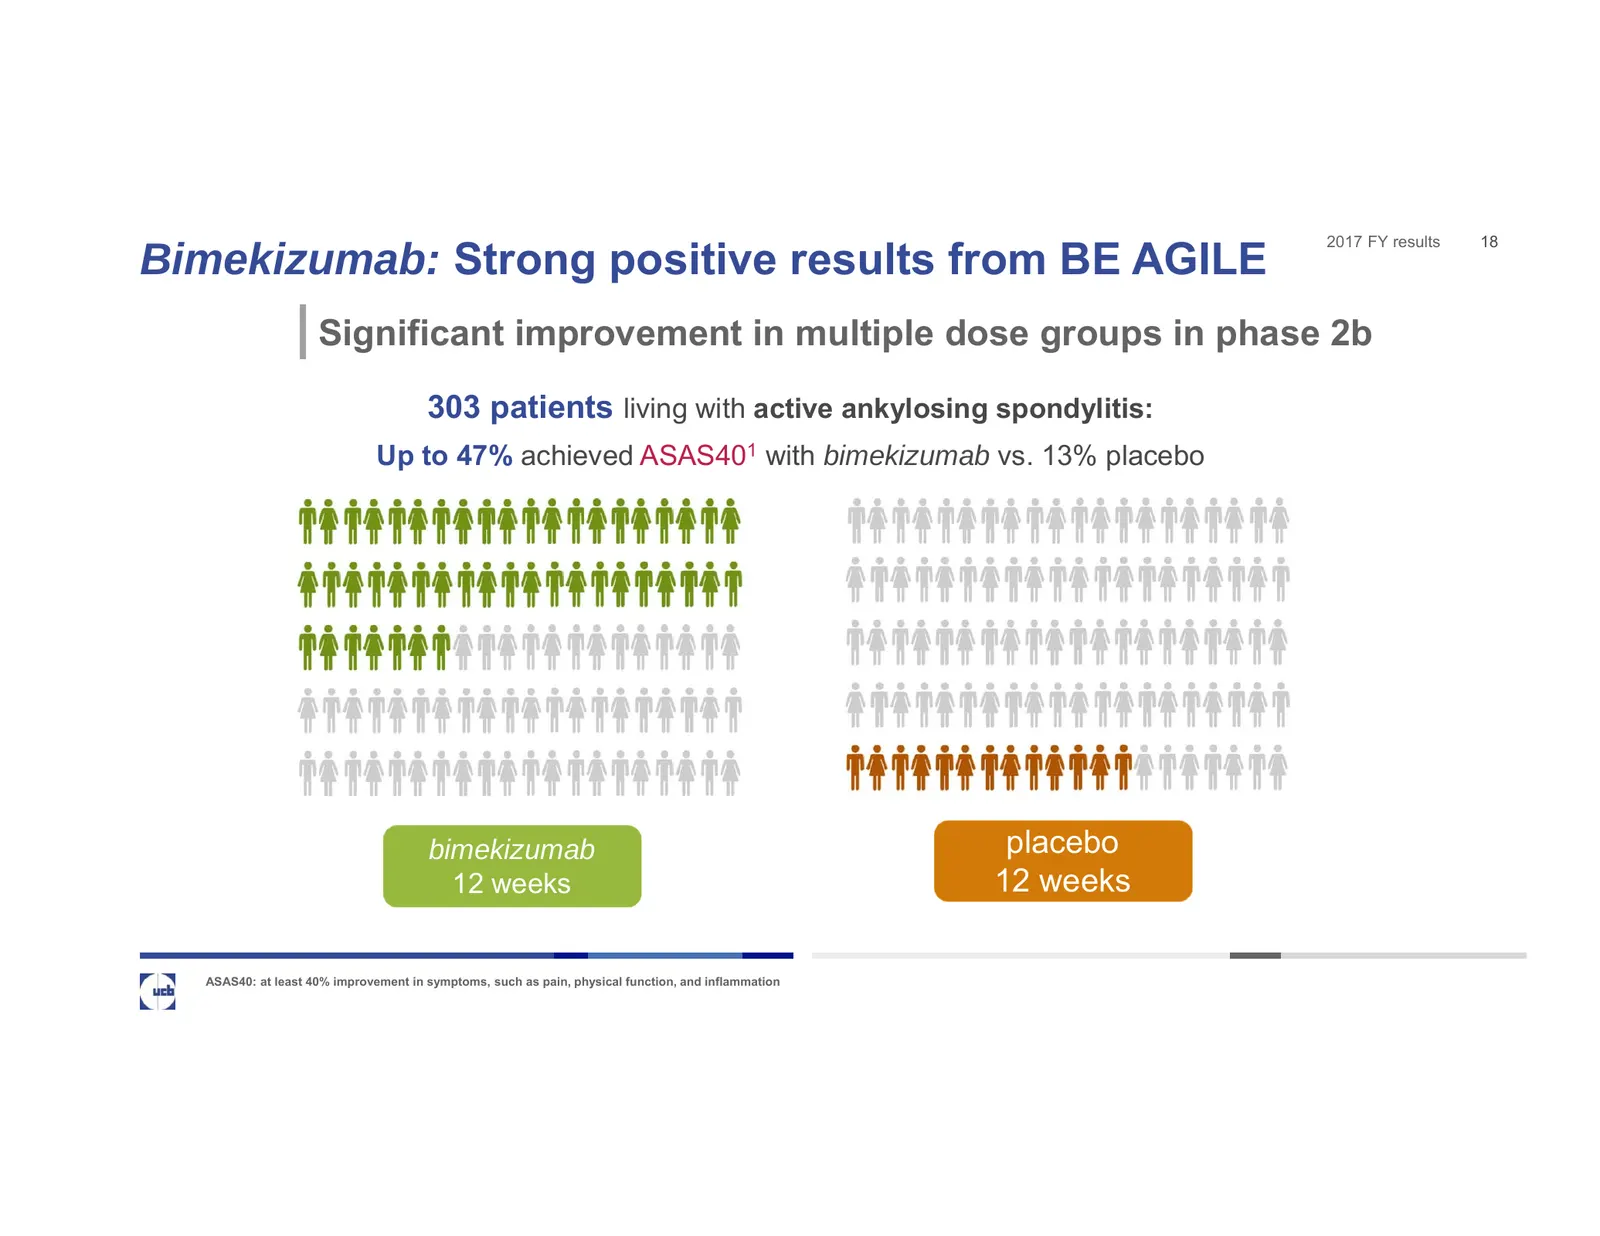
2017 FY results 18 Bimekizumab: Strong positive results from BE AGILE Significant improvement in multiple dose groups in phase 2b 303 patients living with active ankylosing spondylitis: Up to 47% achieved ASAS401 with bimekizumab vs. 13% placebo bimekizumab placebo 12 weeks 12 weeks ASAS40: at least
Slide 19: Bimekizumab: Strong positive results from BE ABLE
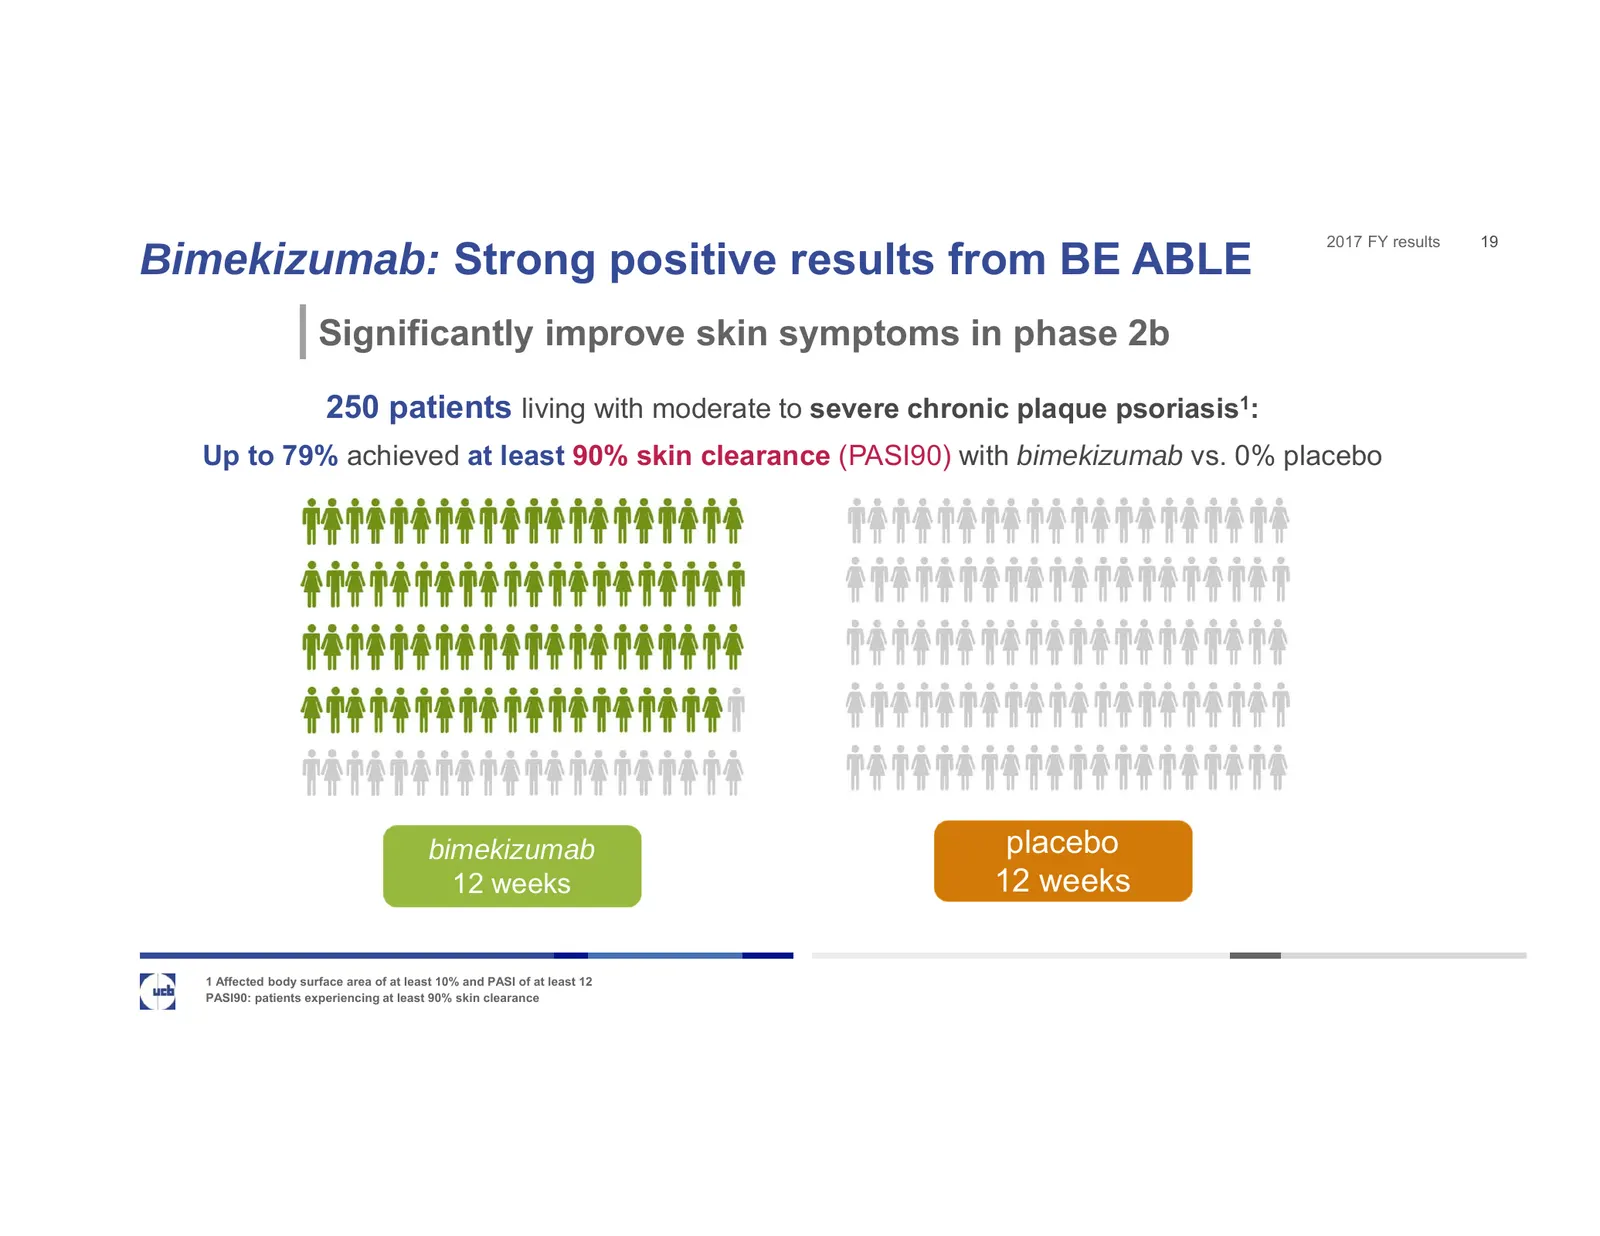
2017 FY results 19 Bimekizumab: Strong positive results from BE ABLE Significantly improve skin symptoms in phase 2b 250 patients living with moderate to severe chronic plaque psoriasis1: Up to 79% achieved at least 90% skin clearance (PASI90) with bimekizumab vs. 0% placebo bimekizumab placebo 12 w
Slide 20: Bimekizumab: Strong positive results from BE ABLE
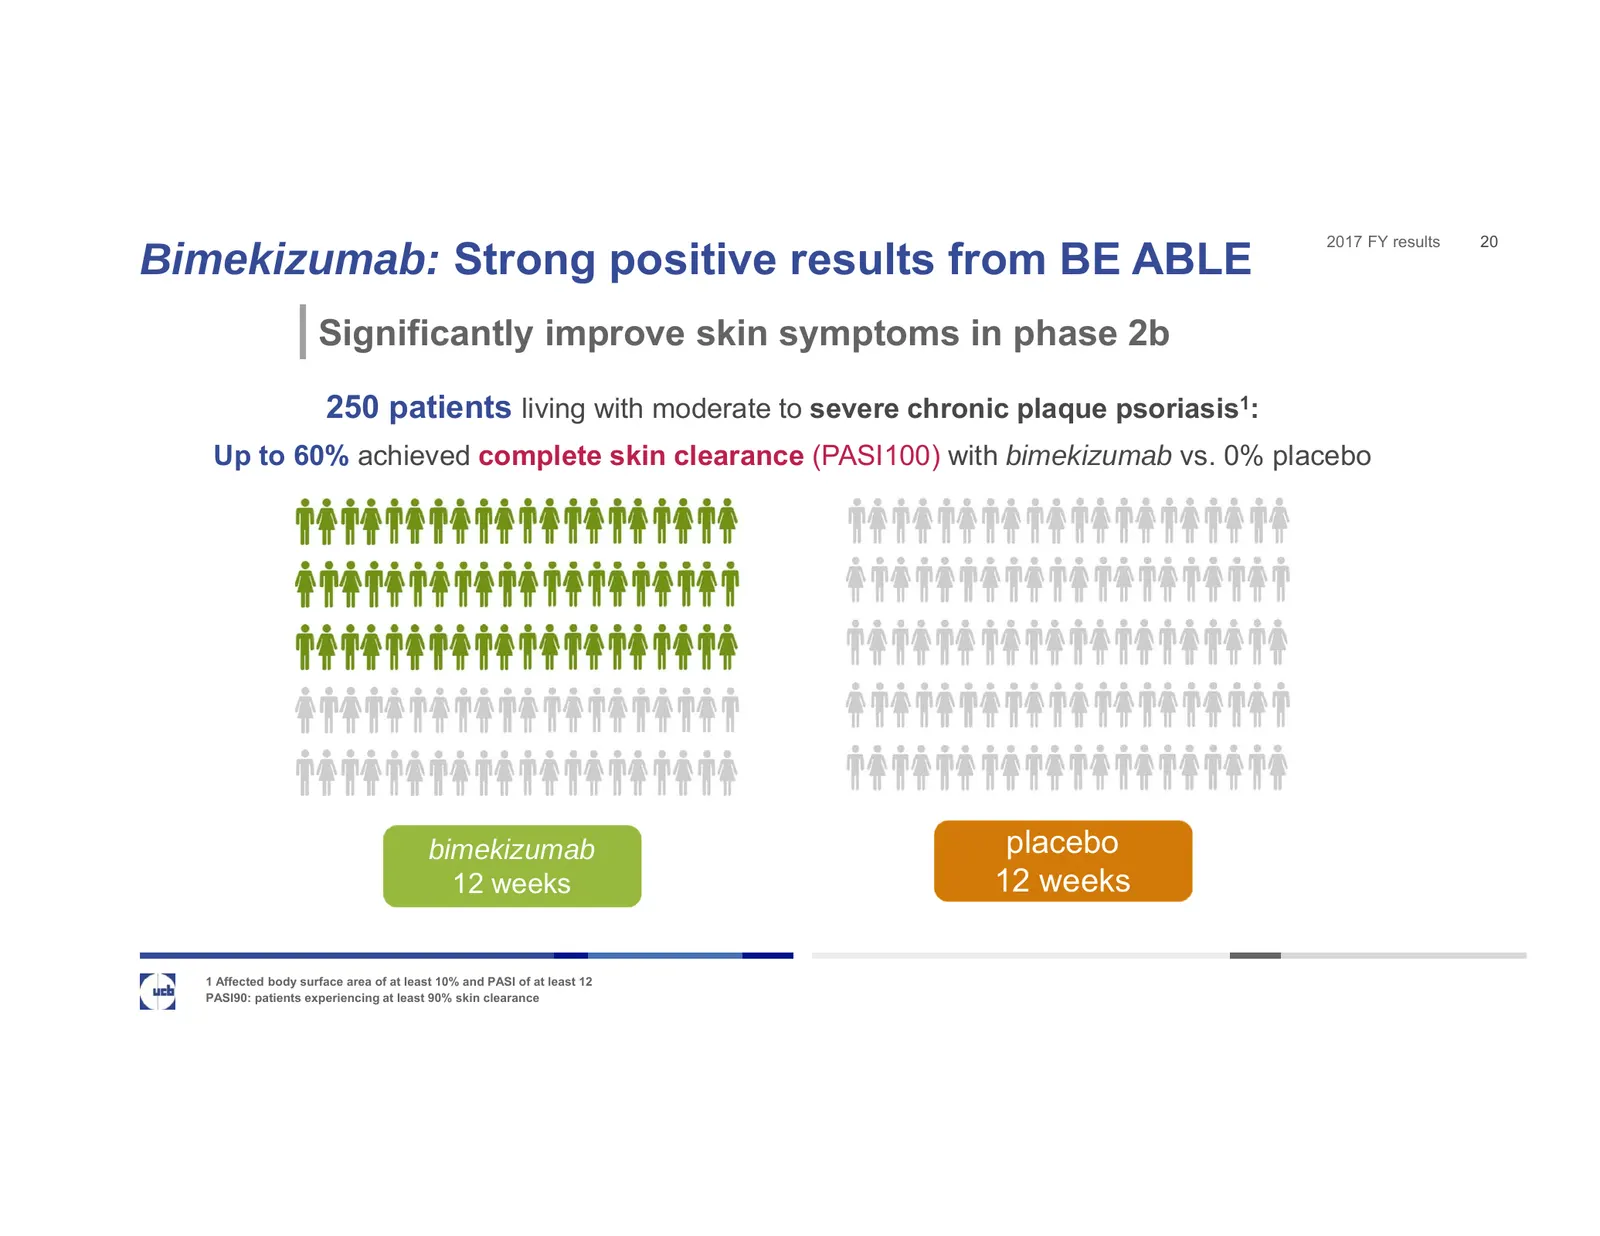
2017 FY results 20 Bimekizumab: Strong positive results from BE ABLE Significantly improve skin symptoms in phase 2b 250 patients living with moderate to severe chronic plaque psoriasis1: Up to 60% achieved complete skin clearance (PASI100) with bimekizumab vs. 0% placebo bimekizumab placebo 12 week
Slide 21: Next: Phase 3 programs for clinical differentiation
2017 FY results 21 Next: Phase 3 programs for clinical differentiation Robust Phase 2b studies in 3 related indications • All 3 studies met primary and secondary endpoints • Rapid and profound clinical efficacy on relevant endpoints • Both for joints and for skin • Consistent across the three 12-wee
Slide 22: Continued above market growth in 2017
22 Continued above market growth in 2017 Detlef Thielgen, CFO
Slide 23: UCB FY 2017 financial highlights
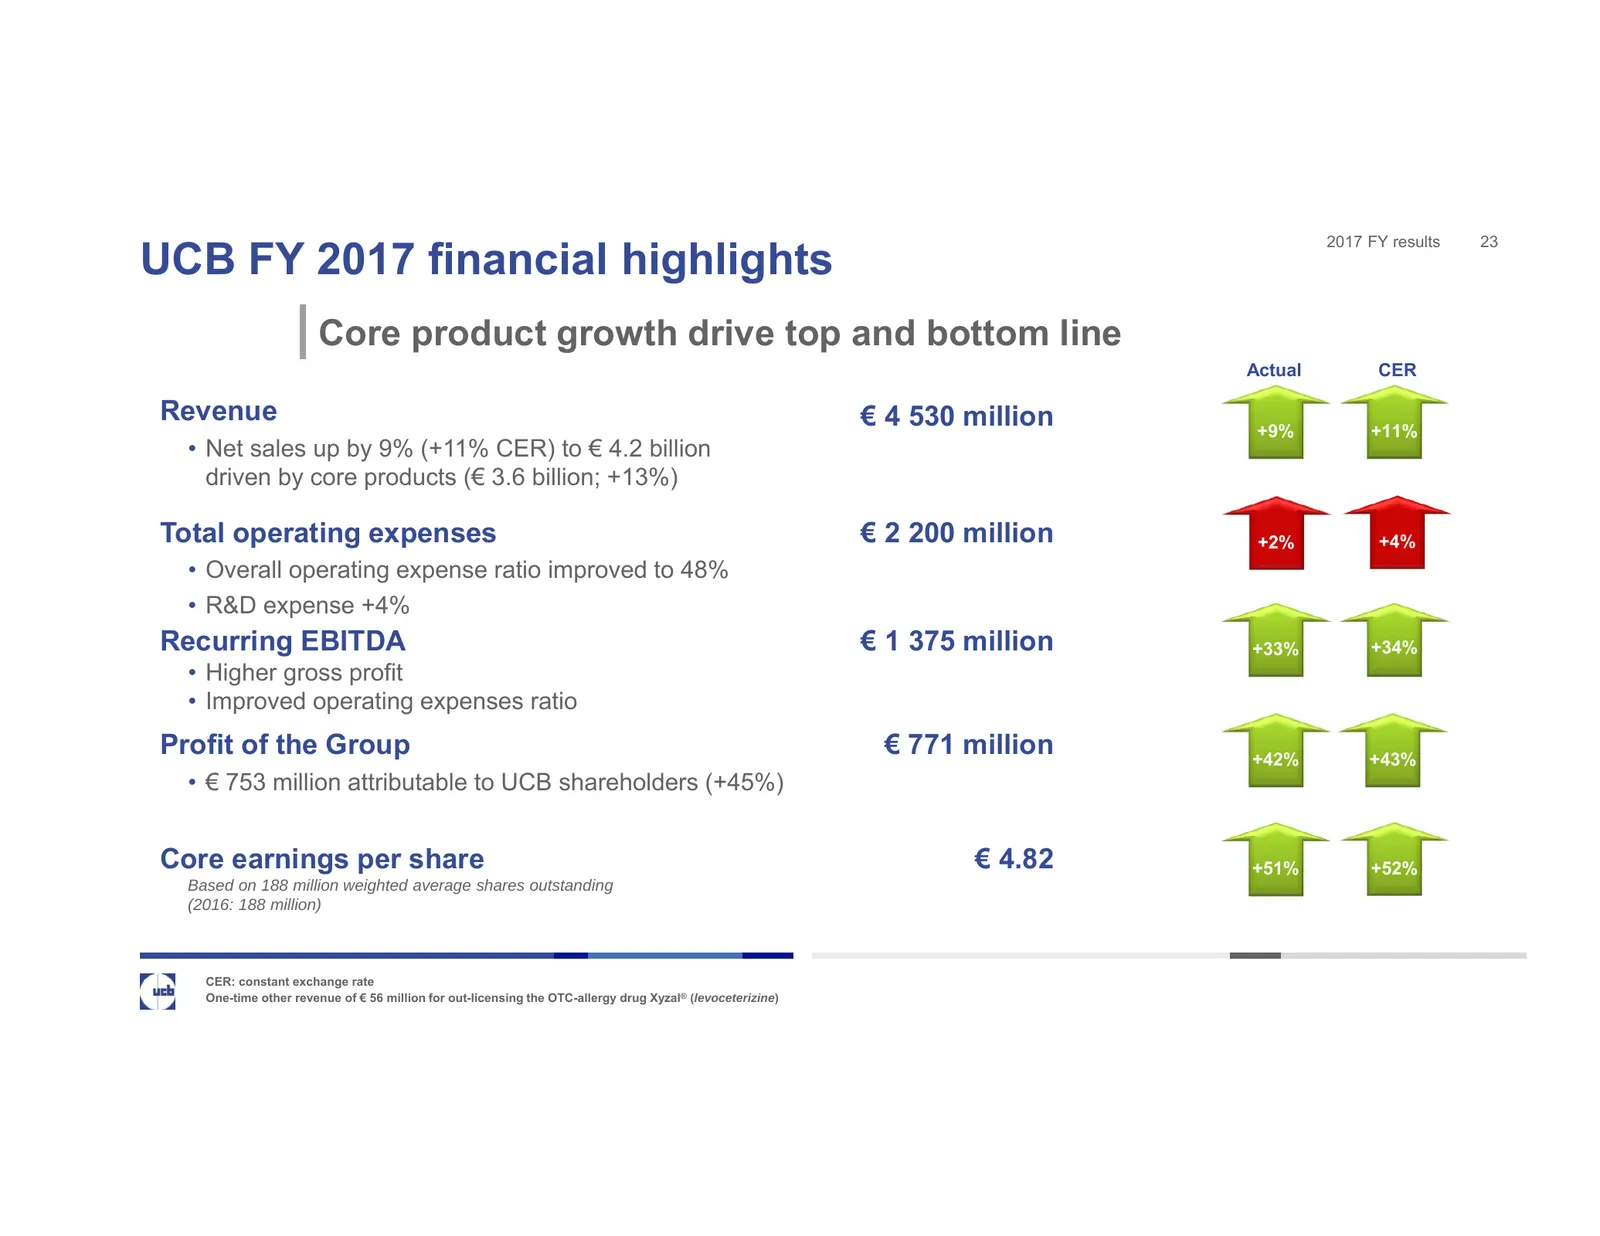
2017 FY results 23 UCB FY 2017 financial highlights Core product growth drive top and bottom line Actual CER Revenue € 4 530 million +9% +11% • Net sales up by 9% (+11% CER) to € 4.2 billion driven by core products (€ 3.6 billion; +13%) Total operating expenses € 2 200 million +2% +4% • Overall oper
Slide 24: Strong net sales growth from core products
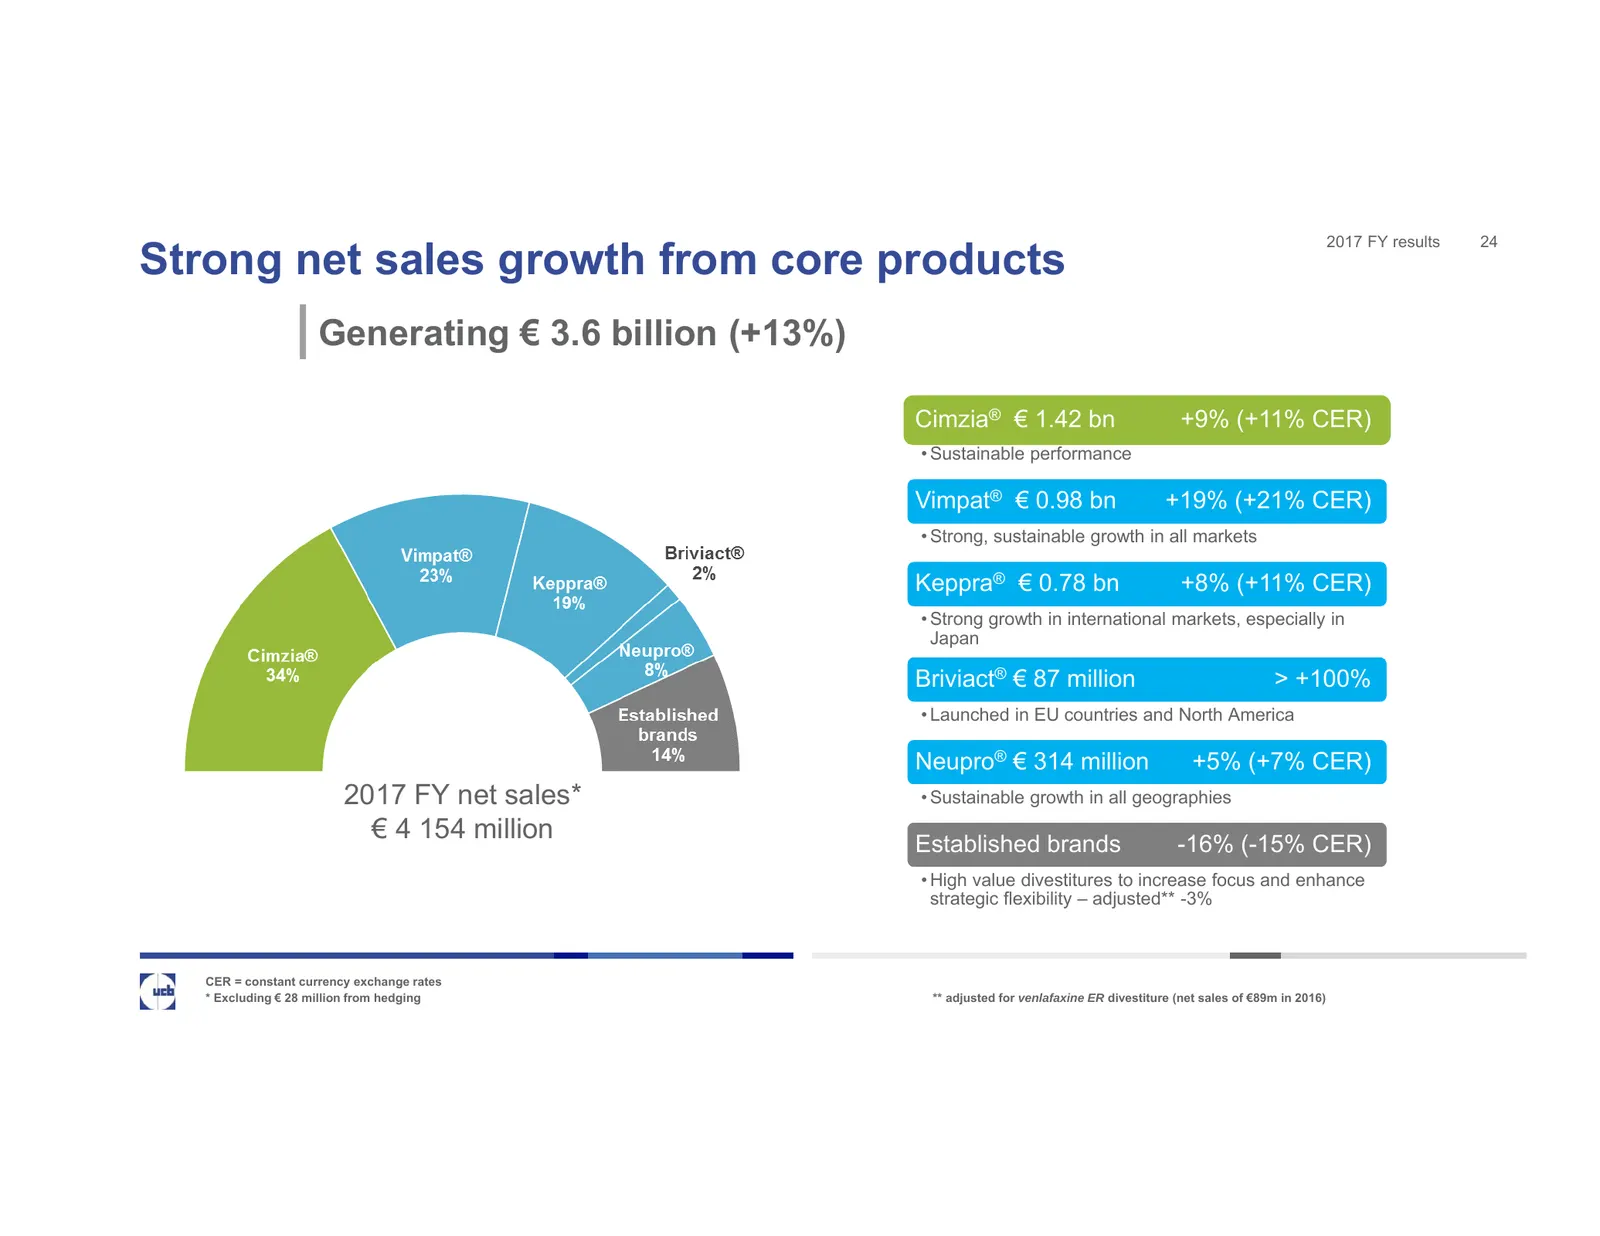
2017 FY results 24 Strong net sales growth from core products Generating € 3.6 billion (+13%) Cimzia® € 1.42 bn +9% (+11% CER) • Sustainable performance Vimpat® € 0.98 bn +19% (+21% CER) • Strong, sustainable growth in all markets Keppra® € 0.78 bn +8% (+11% CER) • Strong growth in international mar
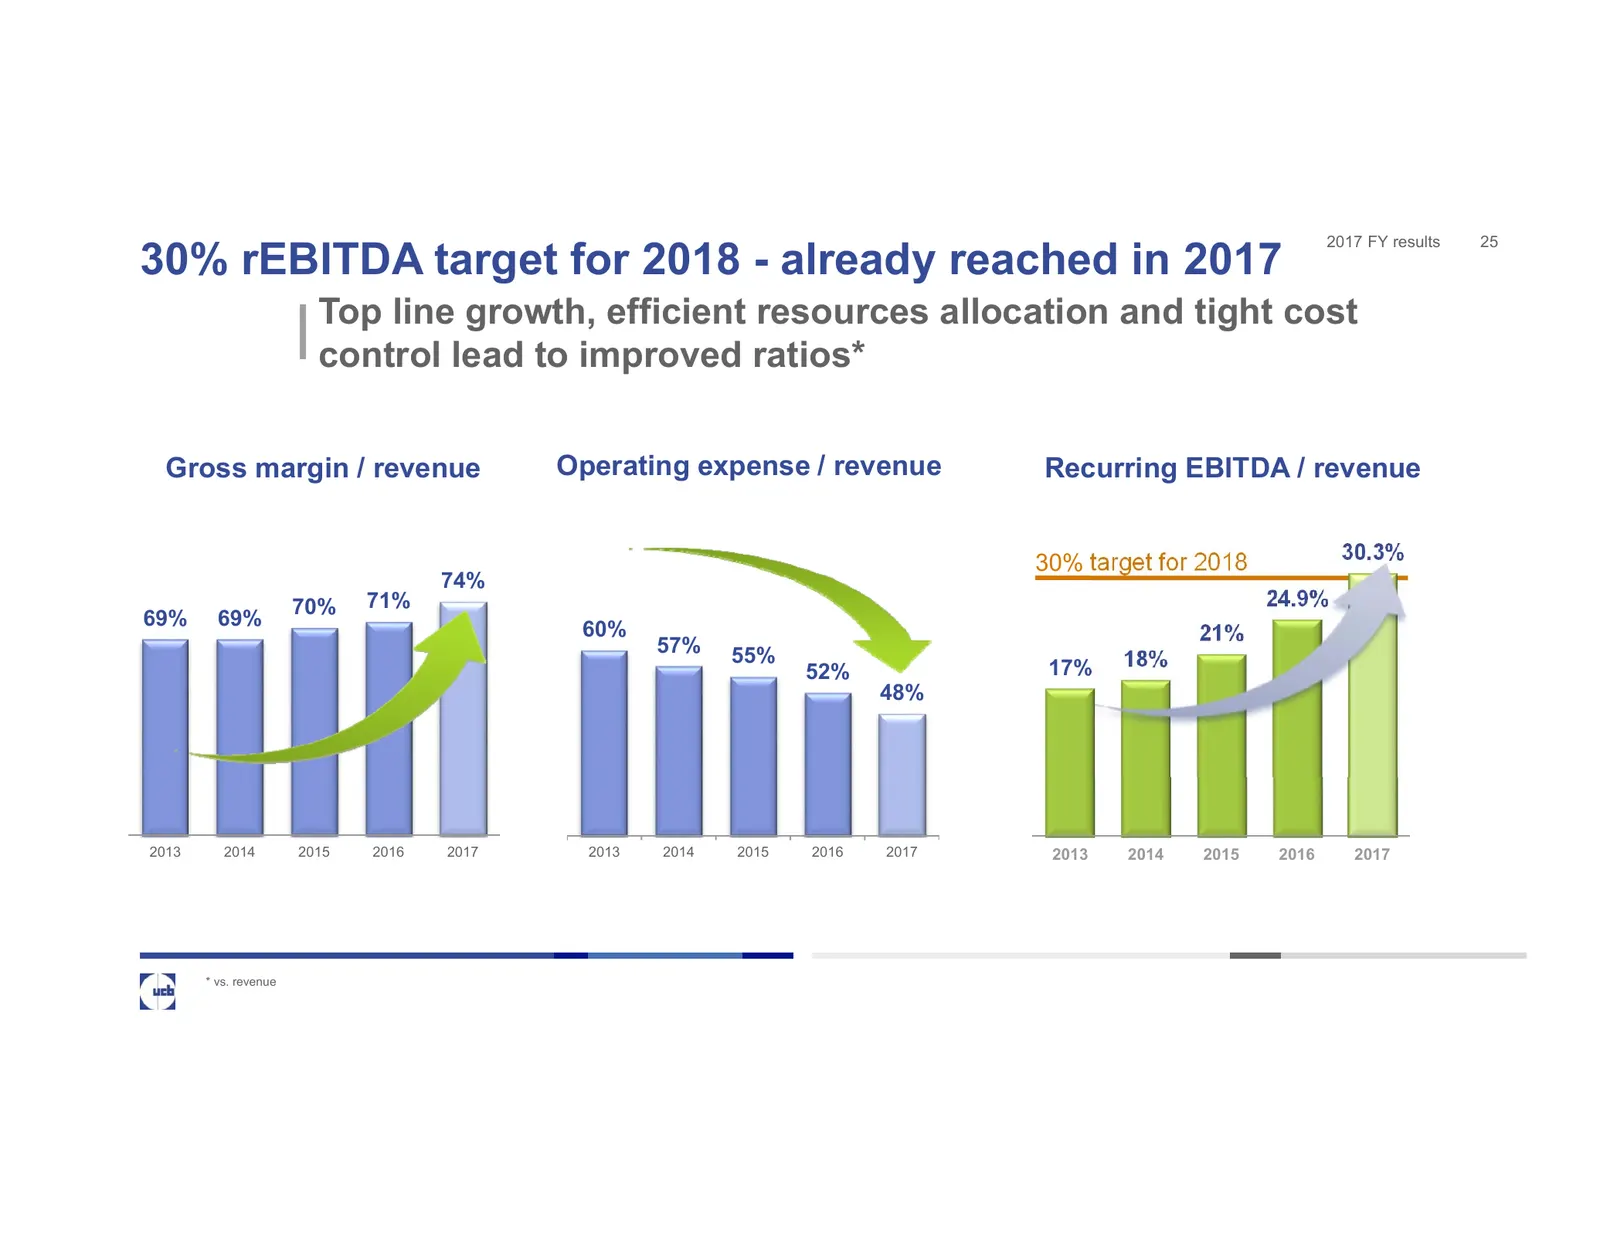
Slide 25: 30% rEBITDA target for 2018 - already reached in 2017
2017 FY results 25 30% rEBITDA target for 2018 - already reached in 2017 Top line growth, efficient resources allocation and tight cost control lead to improved ratios* Gross margin / revenue Operating expense / revenue Recurring EBITDA / revenue 30% target for 2018 30.3% 74% 70% 71% 24.9% 69% 69% 6
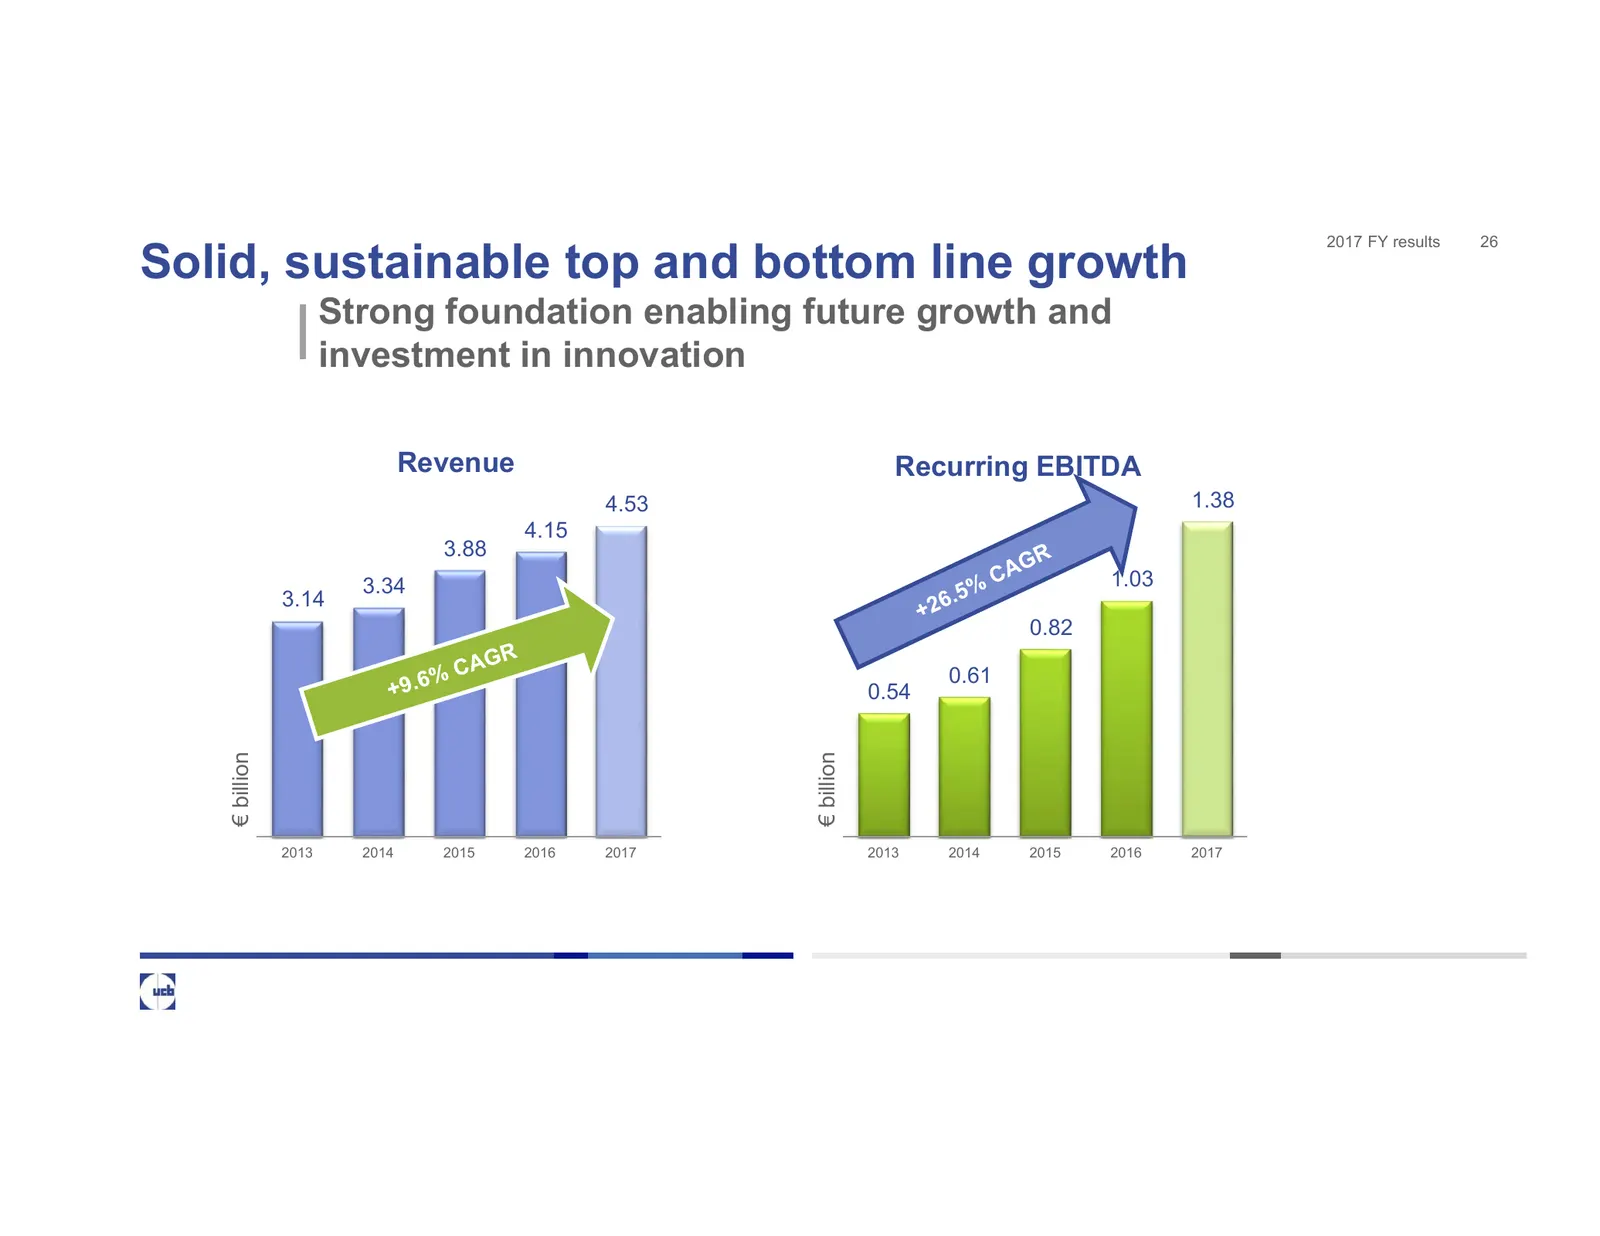
Slide 26: Solid, sustainable top and bottom line growth
2017 FY results 26 Solid, sustainable top and bottom line growth Strong foundation enabling future growth and investment in innovation Revenue Recurring EBITDA 4.53 1.38 4.15 3.88 3.34 1.03 3.14 0.82 0.61 0.54 € billion € billion 2013 2014 2015 2016 2017 2013 2014 2015 2016 2017
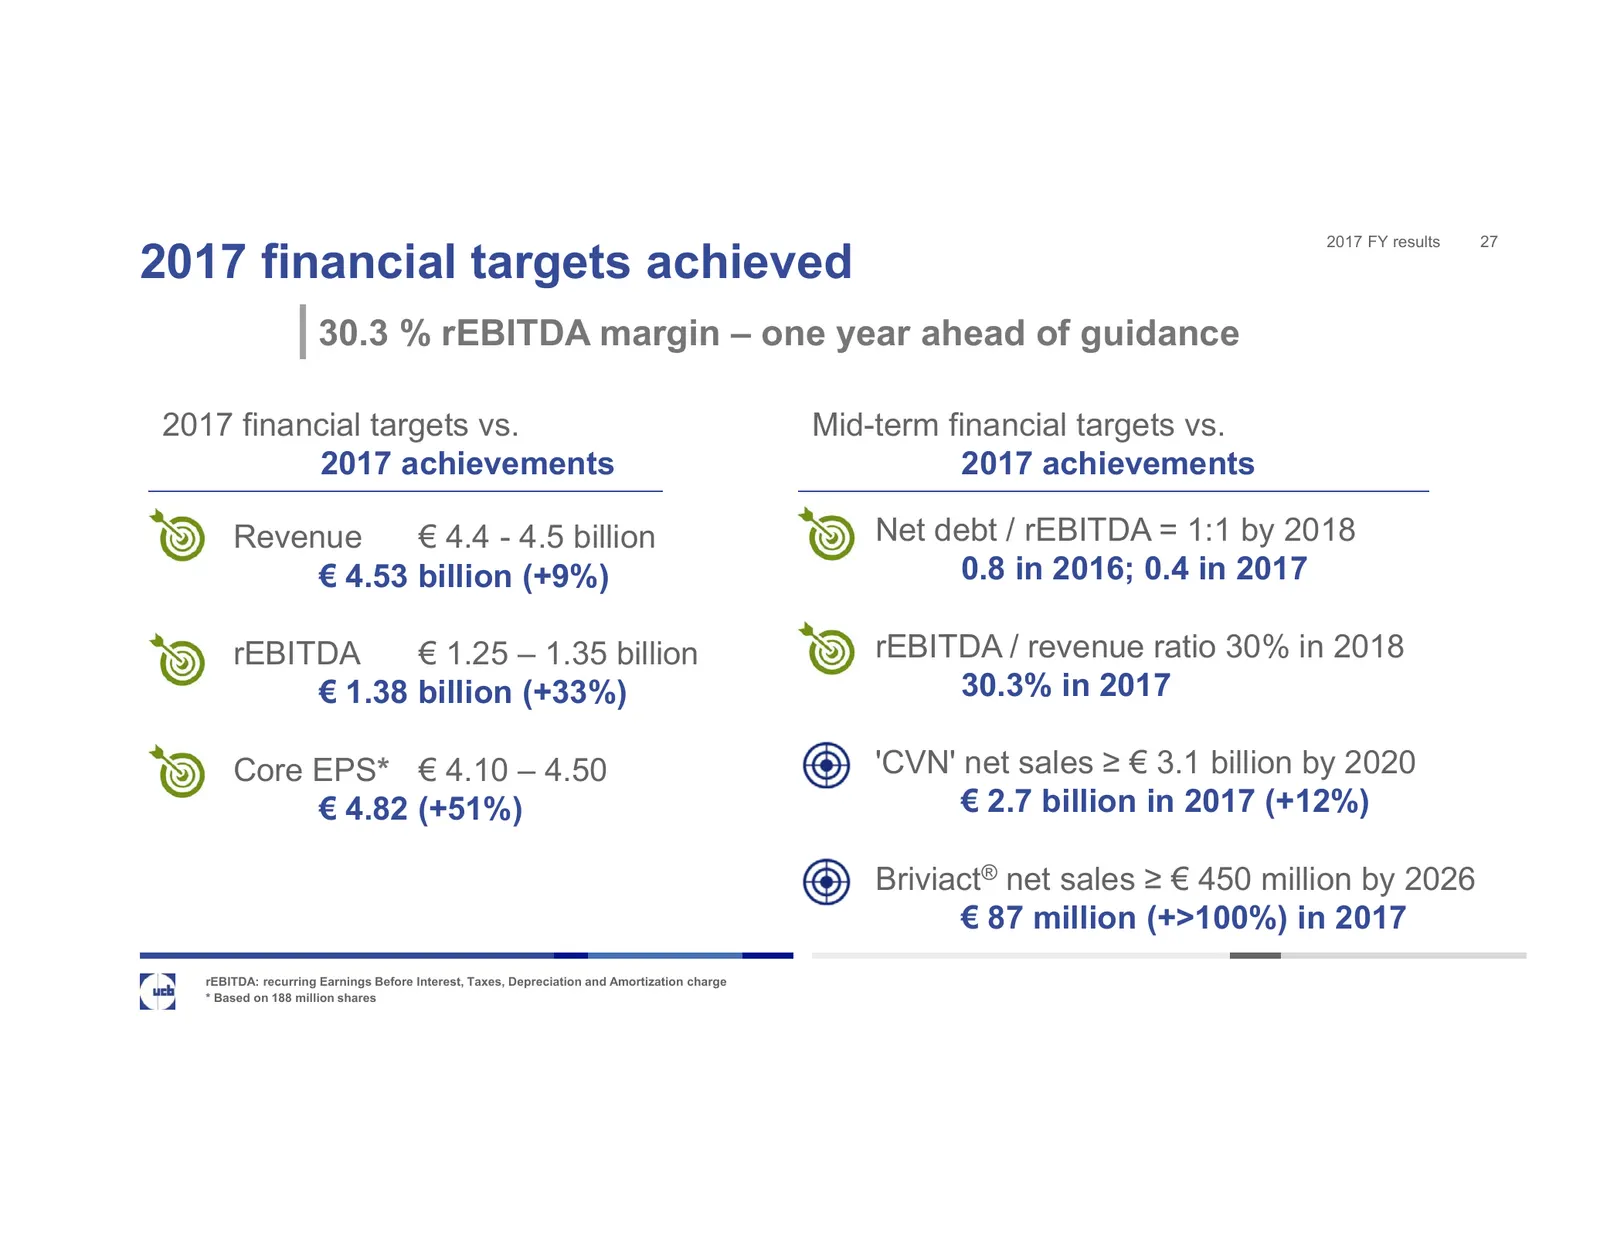
Slide 27: 2017 financial targets achieved
2017 FY results 27 2017 financial targets achieved 30.3 % rEBITDA margin – one year ahead of guidance 2017 financial targets vs. Mid-term financial targets vs. 2017 achievements 2017 achievements Revenue € 4.4 - 4.5 billion Net debt / rEBITDA = 1:1 by 2018 € 4.53 billion (+9%) 0.8 in 2016; 0.4 in 20
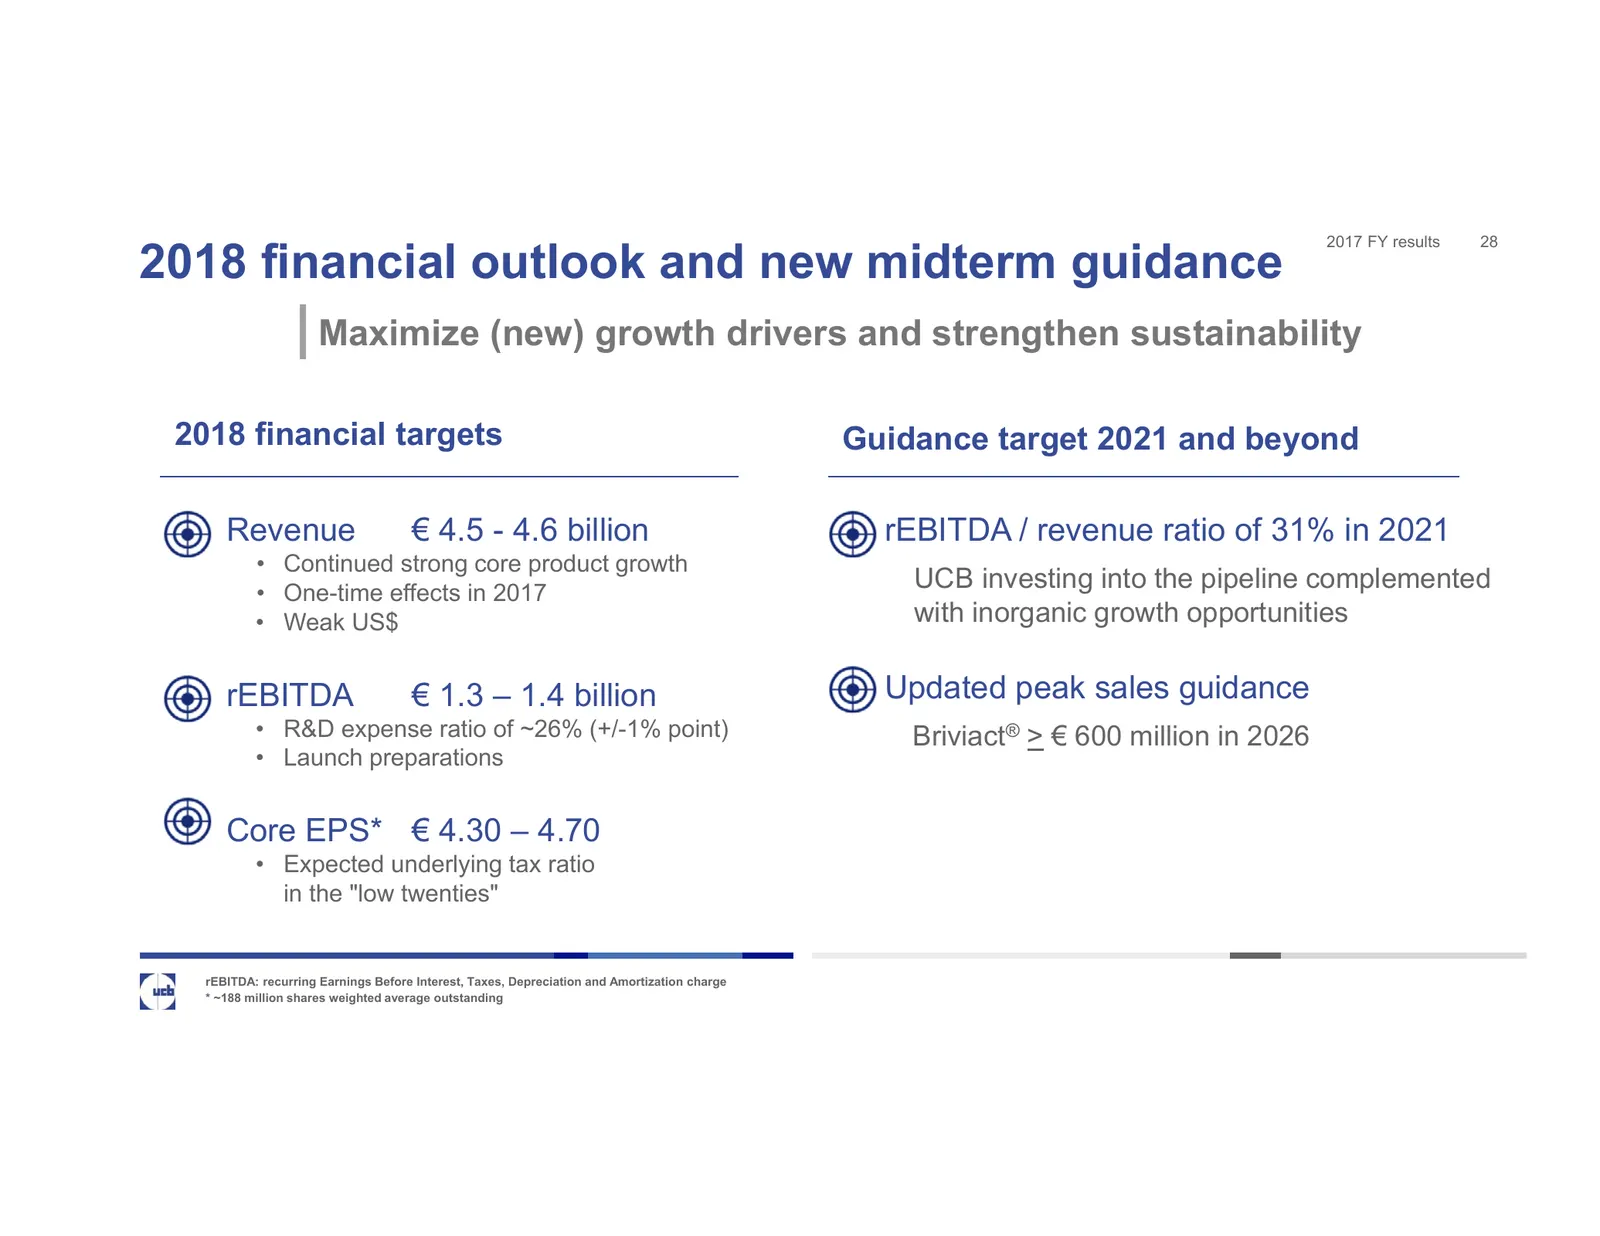
Slide 28: 2018 financial outlook and new midterm guidance
2017 FY results 28 2018 financial outlook and new midterm guidance Maximize (new) growth drivers and strengthen sustainability 2018 financial targets Guidance target 2021 and beyond Revenue € 4.5 - 4.6 billion rEBITDA / revenue ratio of 31% in 2021 • Continued strong core product growth • One-time e
Slide 29: UCB's Patient Value Strategy
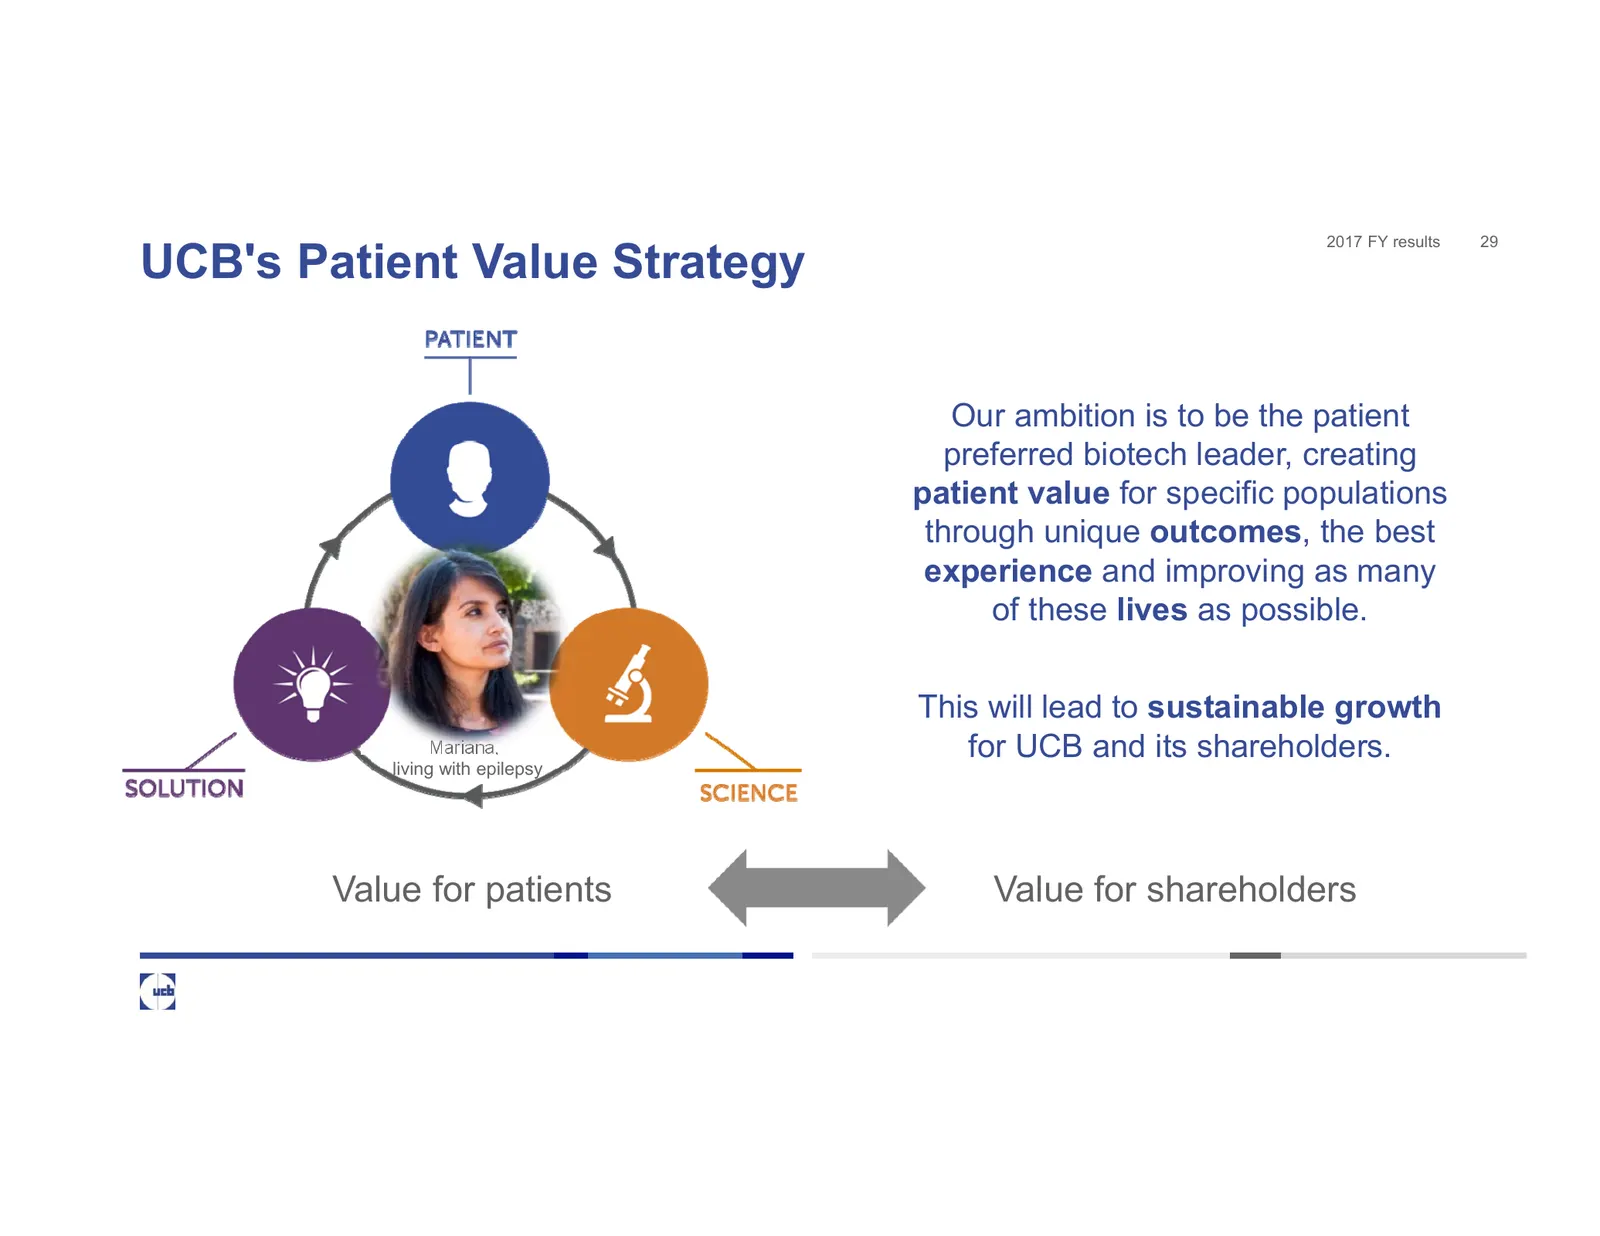
2017 FY results 29 UCB's Patient Value Strategy Our ambition is to be the patient preferred biotech leader, creating patient value for specific populations through unique outcomes, the best experience and improving as many of these lives as possible. This will lead to sustainable growth Mariana, for
Slide 30: Your Questions, please
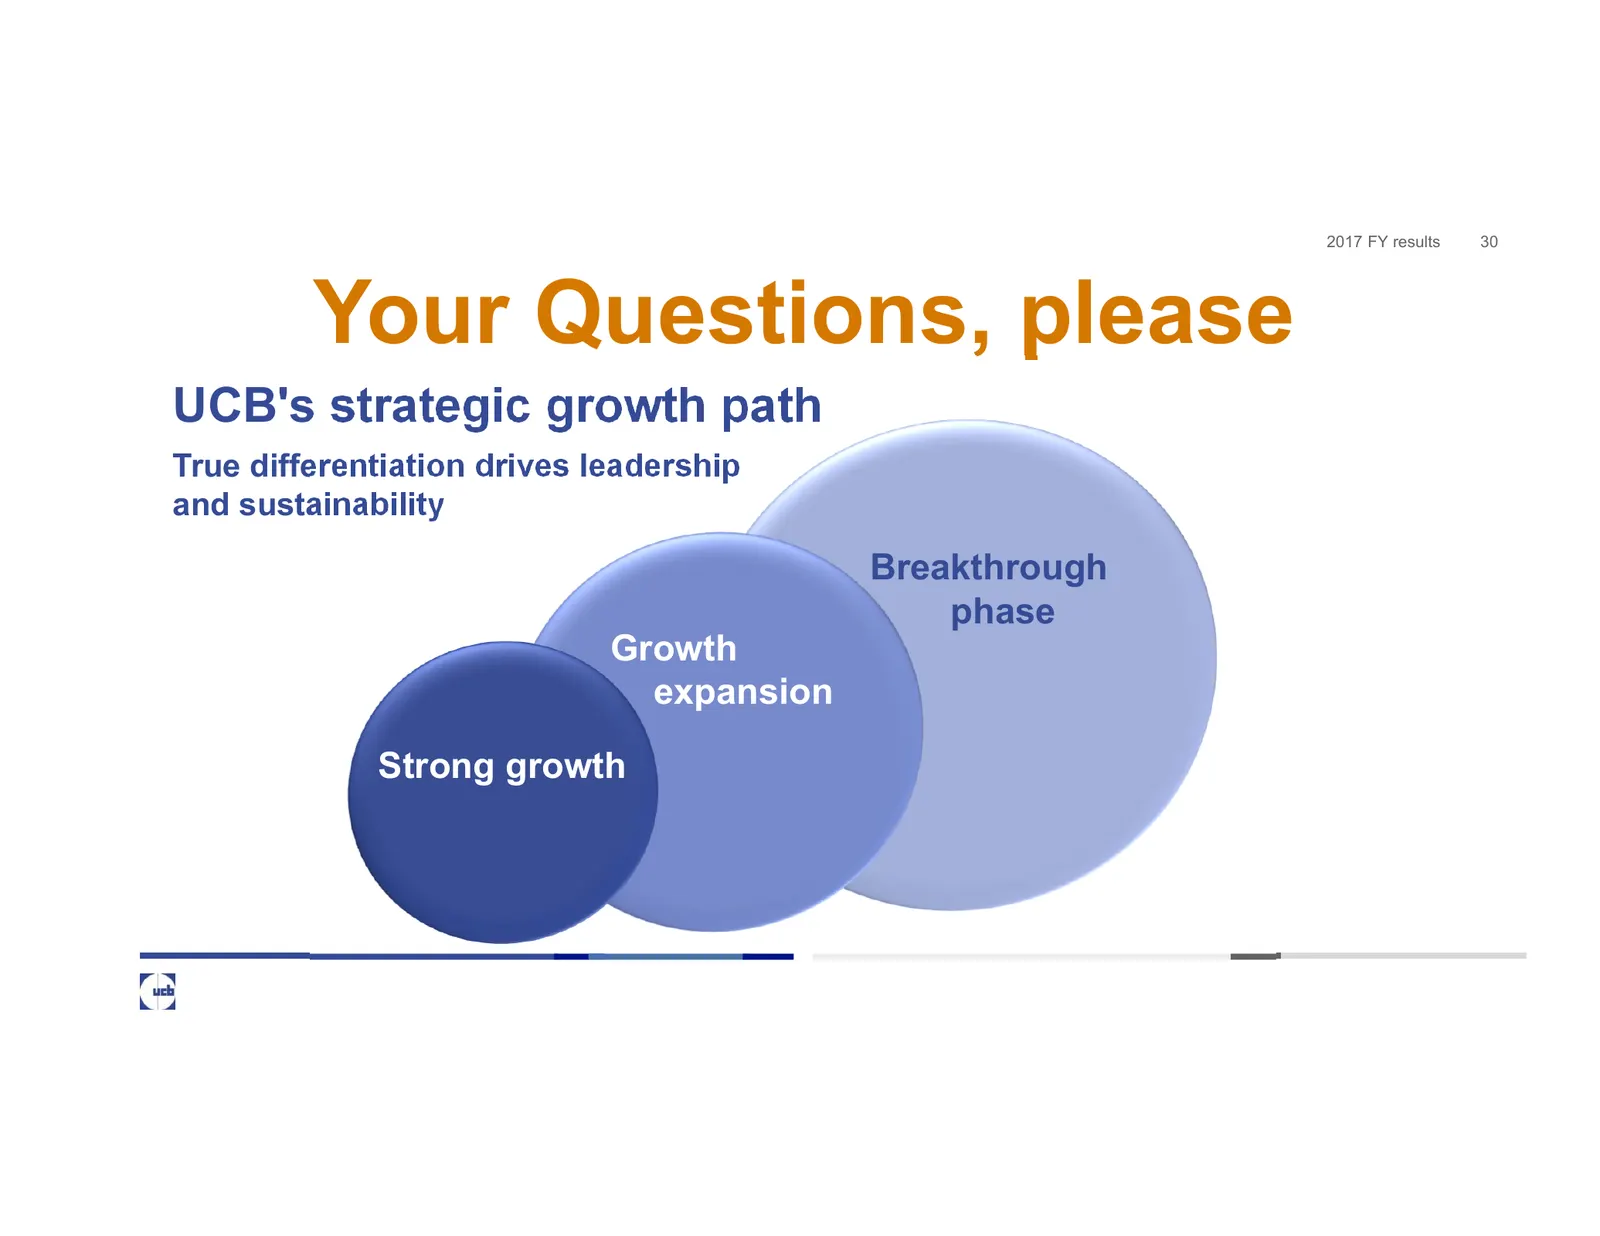
2017 FY results 30 Your Questions, please UCB's strategic growth path True differentiation drives leadership and sustainability Breakthrough phase Growth expansion Strong growth
Slide 31: Further facts and figures
Further facts and figures Fa Inspired by patients. kd Driven by science.
Slide 32: Recurring EBITDA
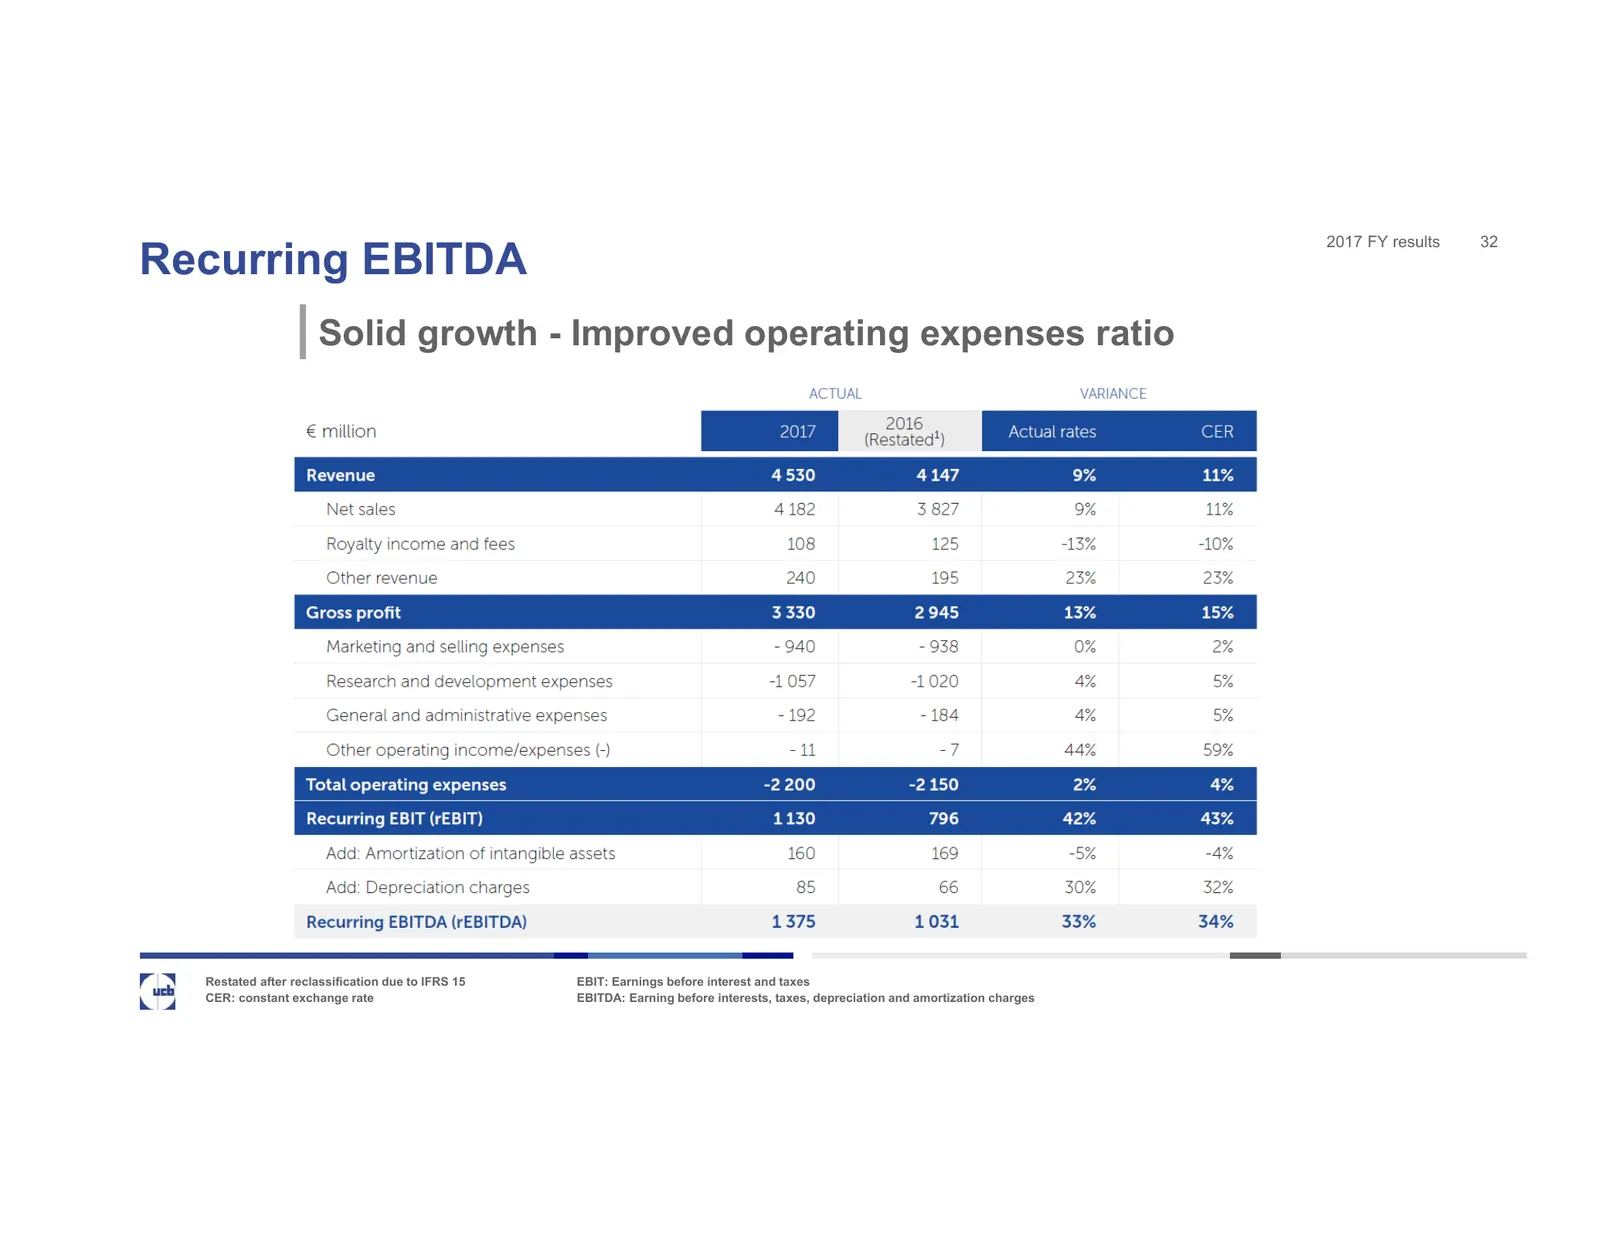
2017 FY results 32 Recurring EBITDA Solid growth - Improved operating expenses ratio Restated after reclassification due to IFRS 15 EBIT: Earnings before interest and taxes CER: constant exchange rate EBITDA: Earning before interests, taxes, depreciation and amortization charges
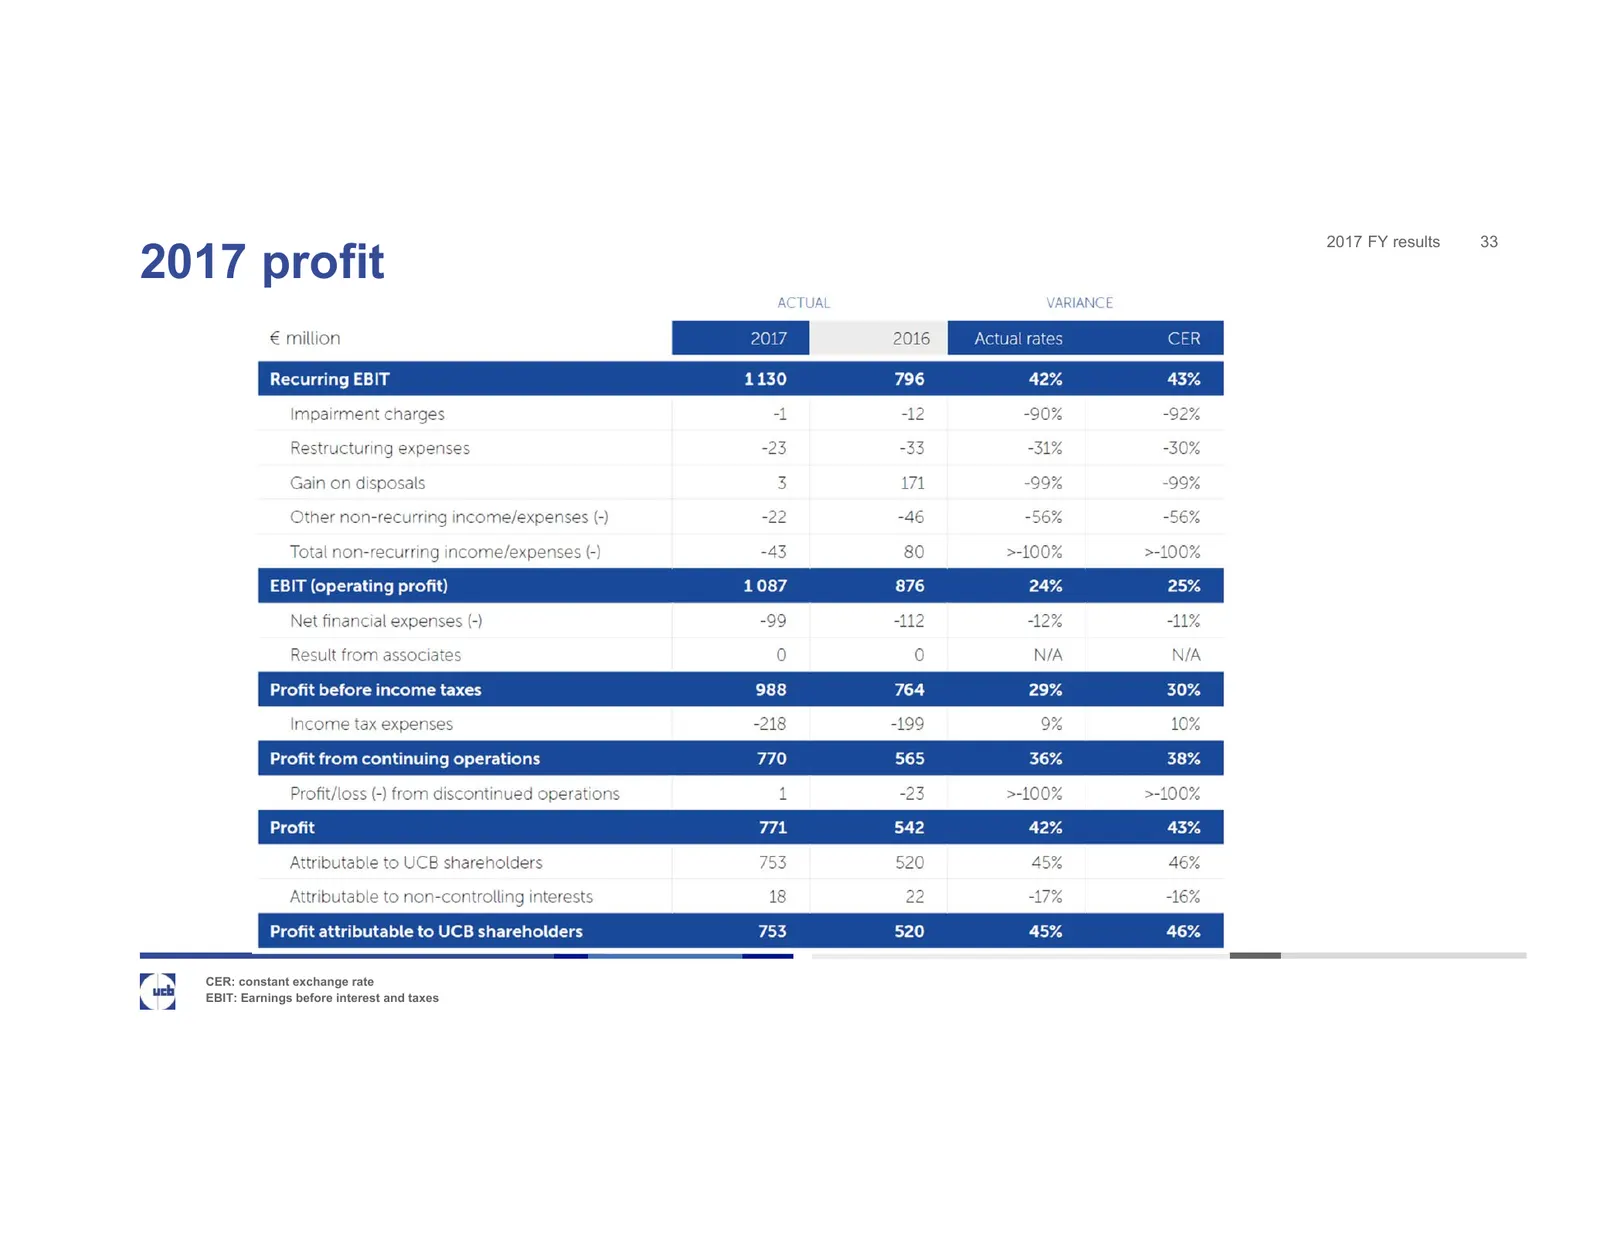
Slide 33: 2017 profit
2017 FY results 33 2017 profit CER: constant exchange rate EBIT: Earnings before interest and taxes
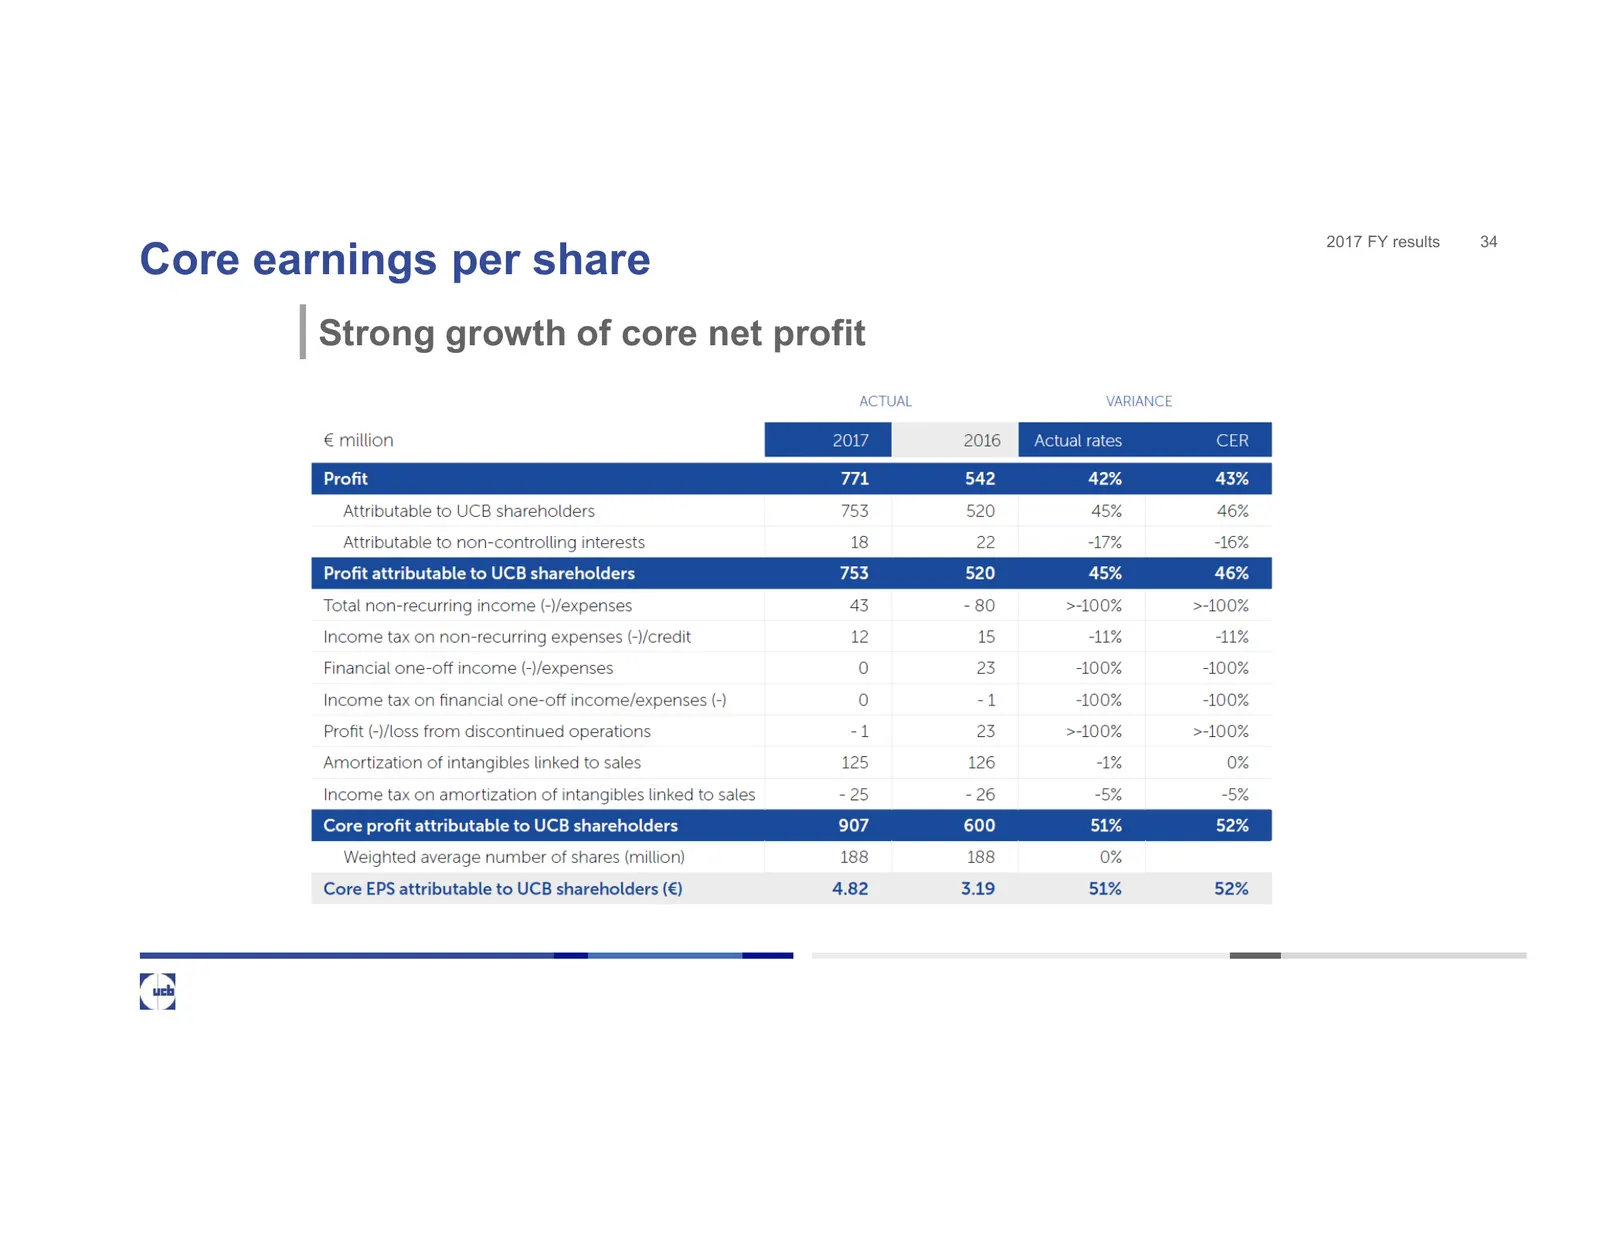
Slide 34: Core earnings per share
2017 FY results 34 Core earnings per share Strong growth of core net profit
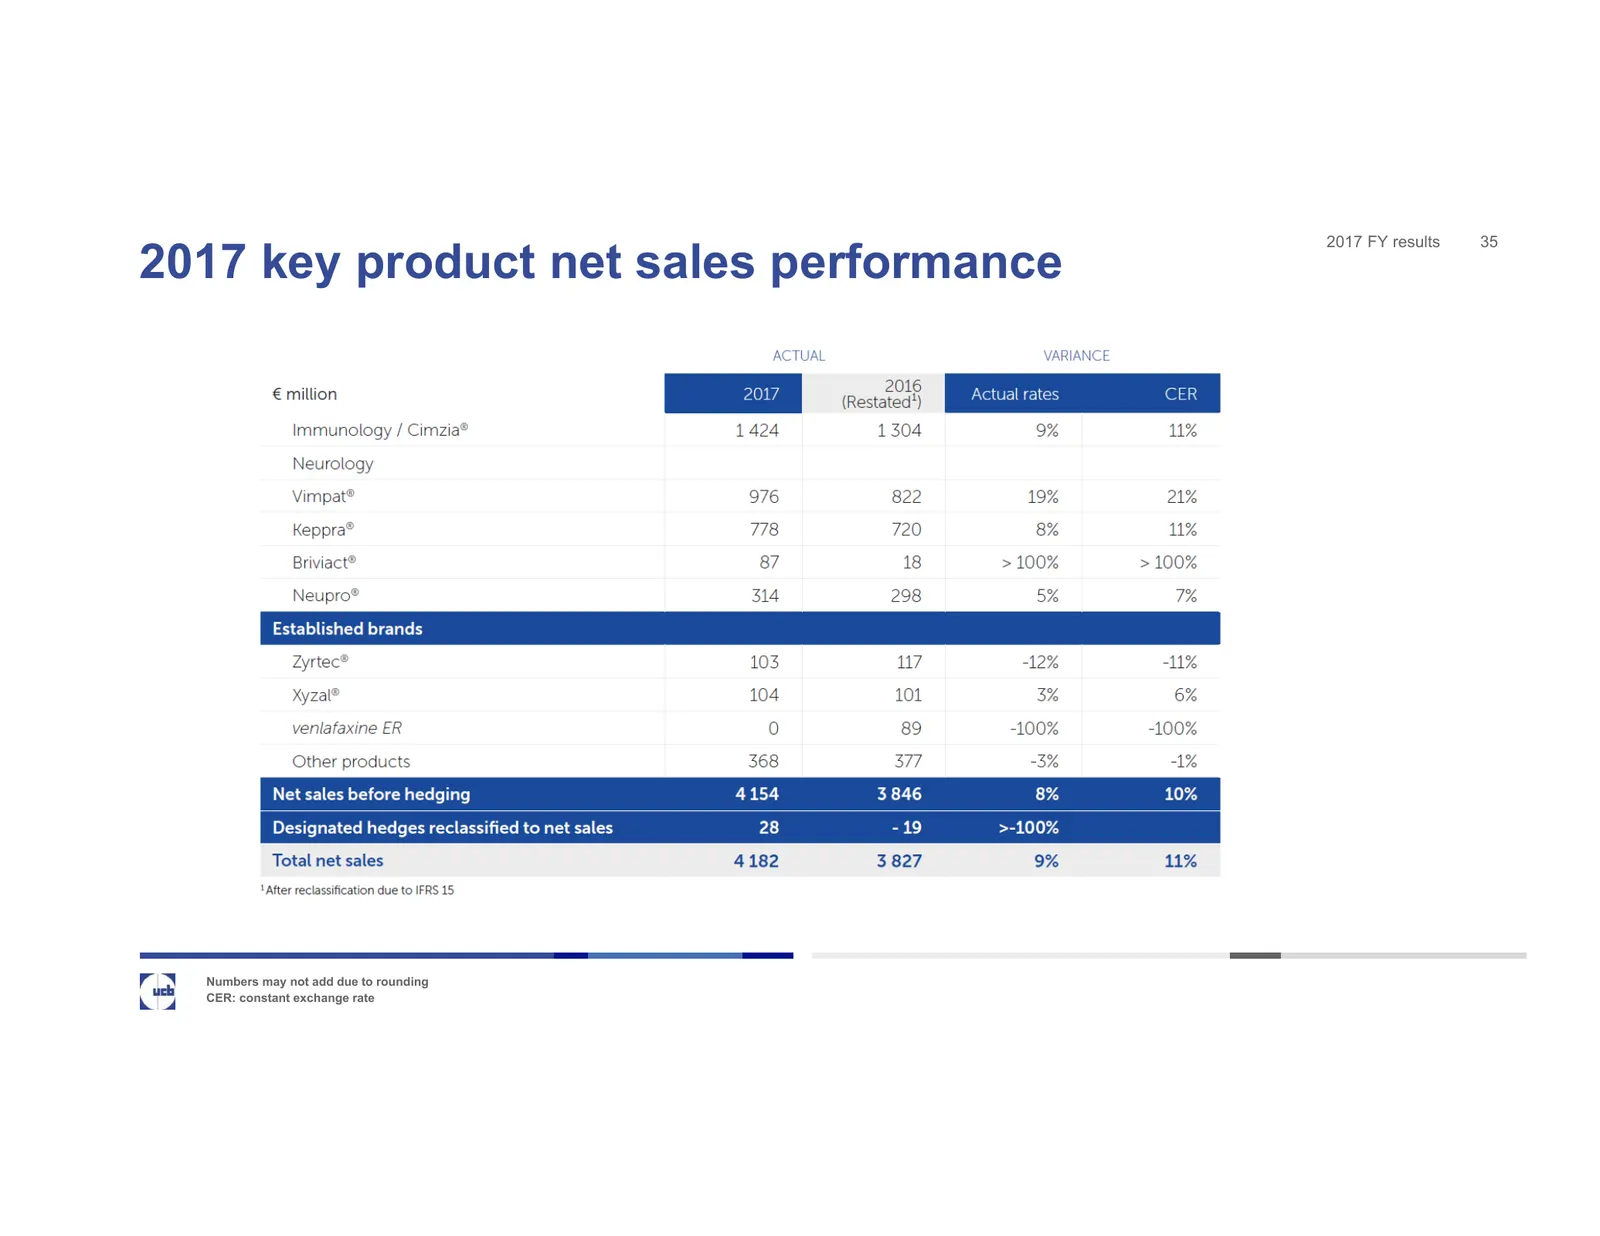
Slide 35: 2017 key product net sales performance
2017 FY results 35 2017 key product net sales performance Numbers may not add due to rounding CER: constant exchange rate
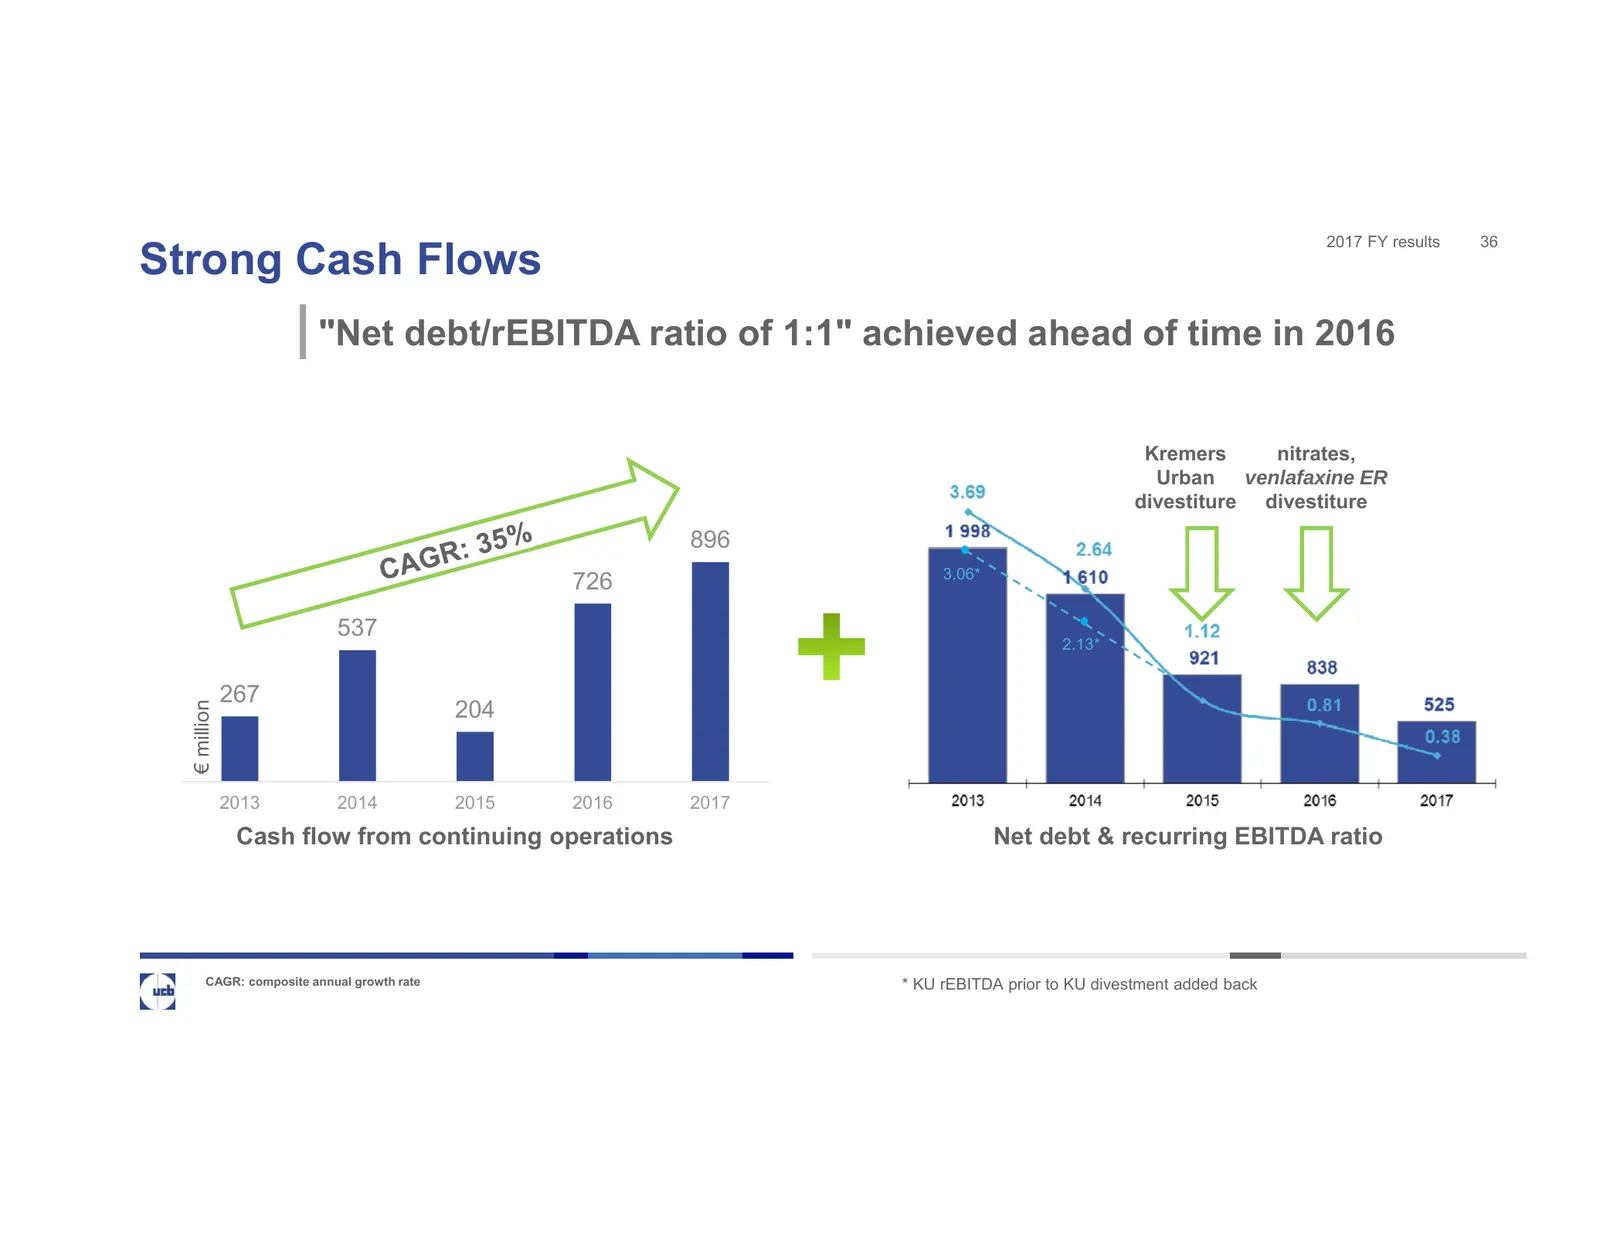
Slide 36: Strong Cash Flows
2017 FY results 36 Strong Cash Flows "Net debt/rEBITDA ratio of 1:1" achieved ahead of time in 2016 Kremers nitrates, Urban venlafaxine ER divestiture divestiture 896 3.06* 726 537 2.13* 267 204 € million 2013 2014 2015 2016 2017 Cash flow from continuing operations Net debt & recurring EBITDA ratio
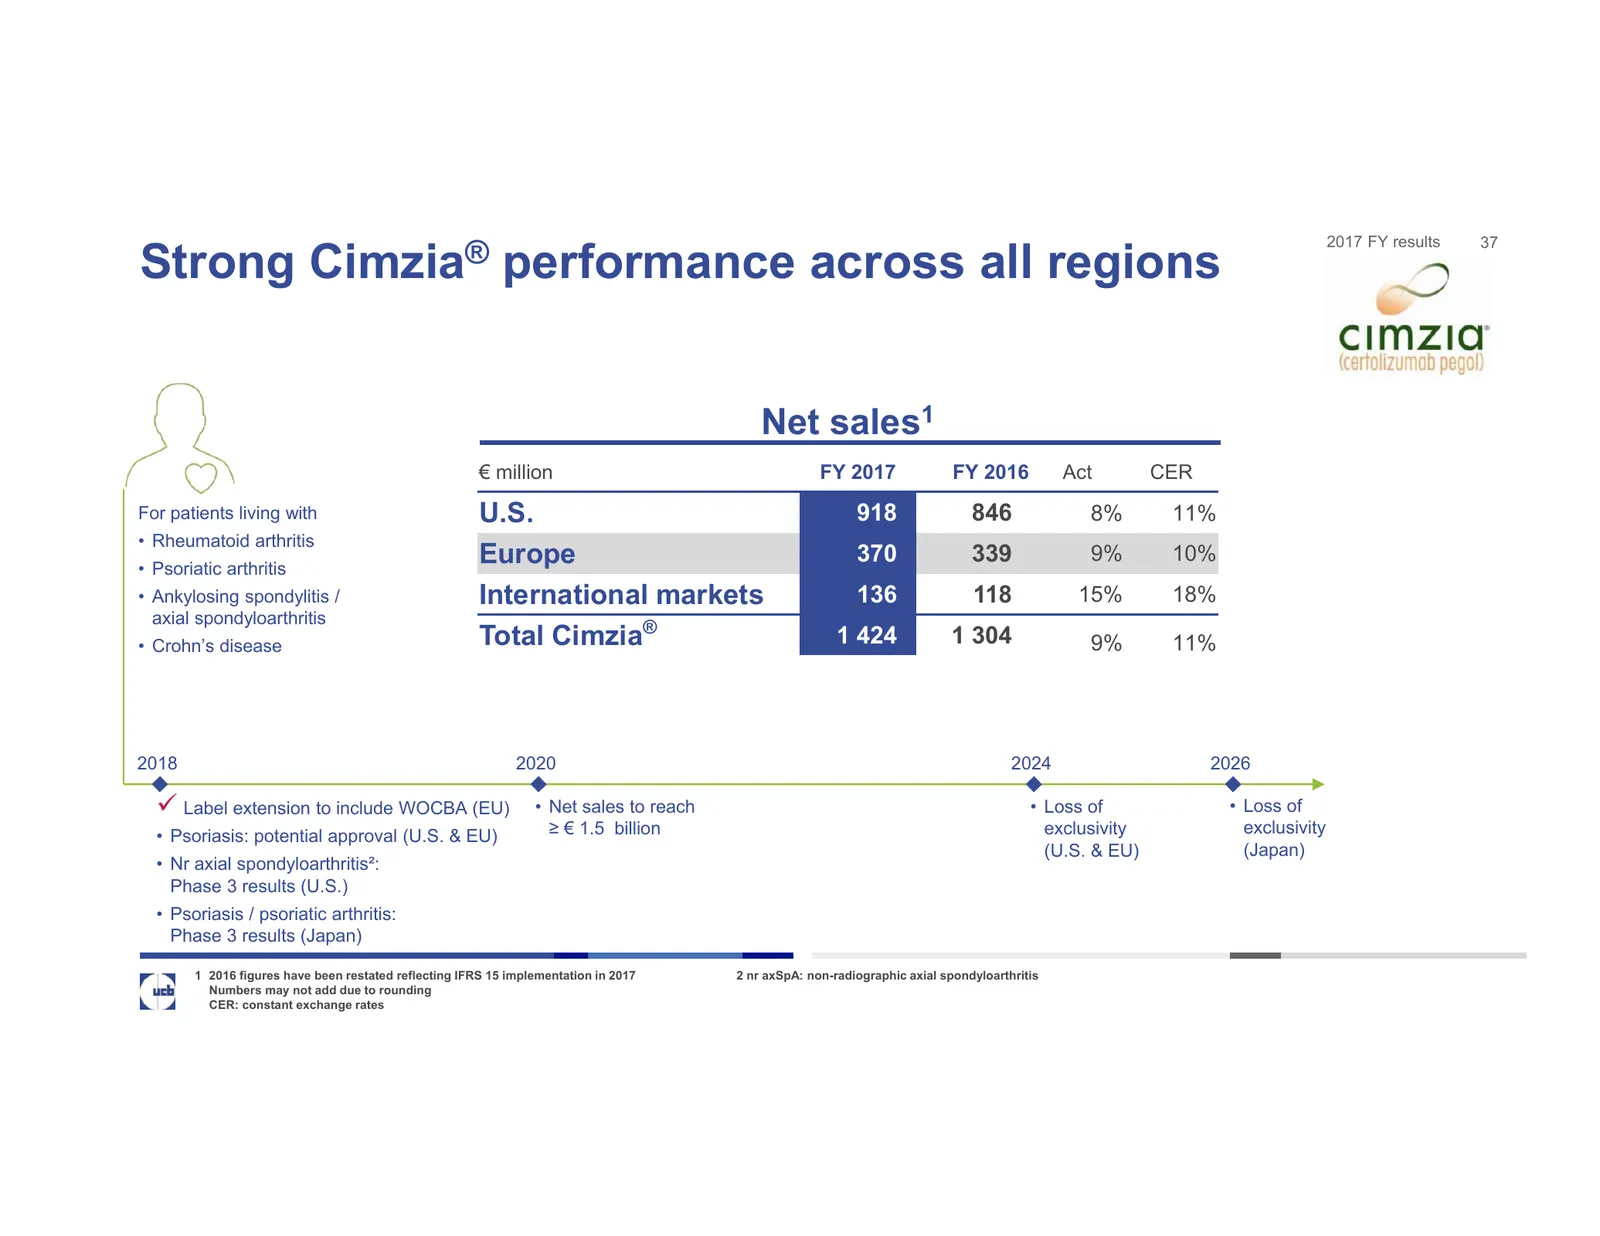
Slide 37: Strong Cimzia performance across all regions
2017 FY results 37 Strong Cimzia® performance across all regions Net sales1 € million FY 2017 FY 2016 Act CER For patients living with U.S. 918 846 8% 11% • Rheumatoid arthritis • Psoriatic arthritis Europe 370 339 9% 10% • Ankylosing spondylitis / International markets 136 118 15% 18% axial spondyl
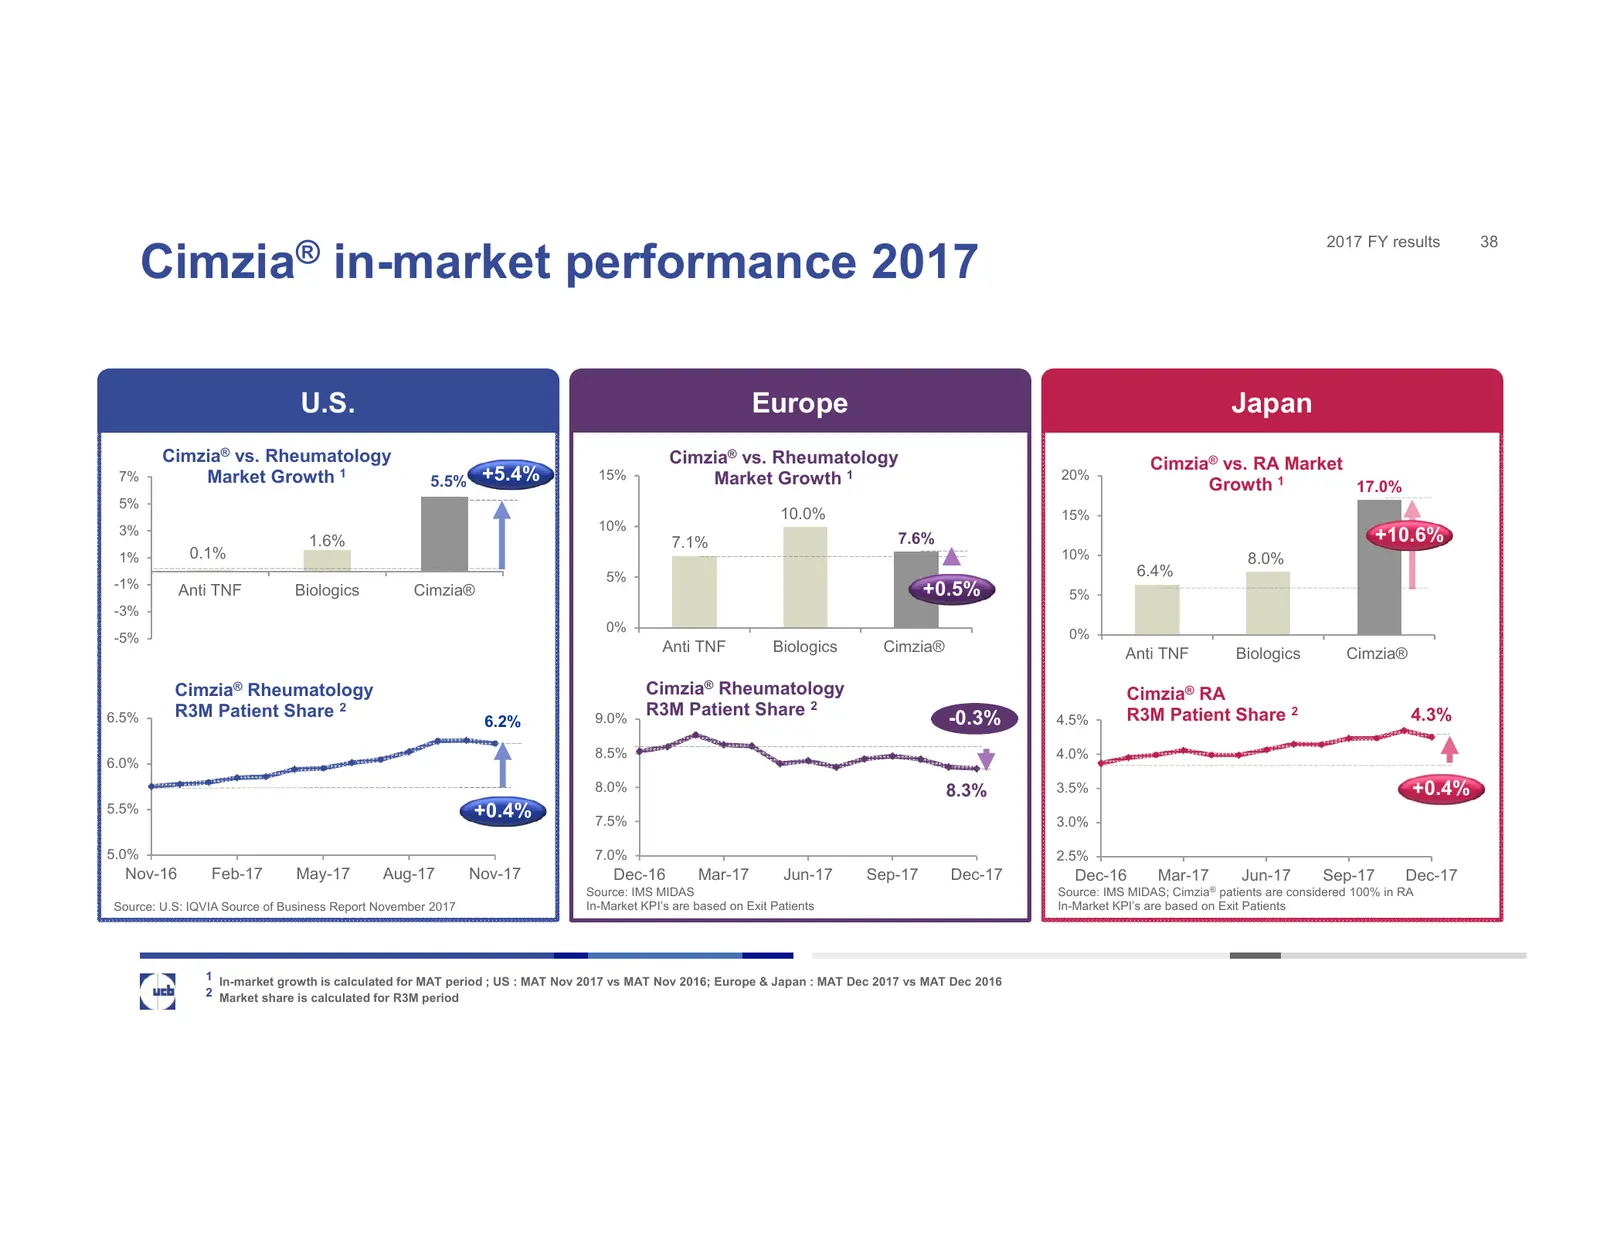
Slide 38: Cimzia in-market performance 2017
2017 FY results 38 Cimzia® in-market performance 2017 U.S. Europe Japan Cimzia® vs. Rheumatology Cimzia® vs. Rheumatology Cimzia® vs. RA Market 7% Market Growth 1 5.5% +5.4% 15% Market Growth 1 20% Growth 1 17.0% 5% 10.0% 15% 3% 10% 1.6% 7.1% 7.6% +10.6% 1% 0.1% 10% 8.0% 5% 6.4% -1% Anti TNF Biologi
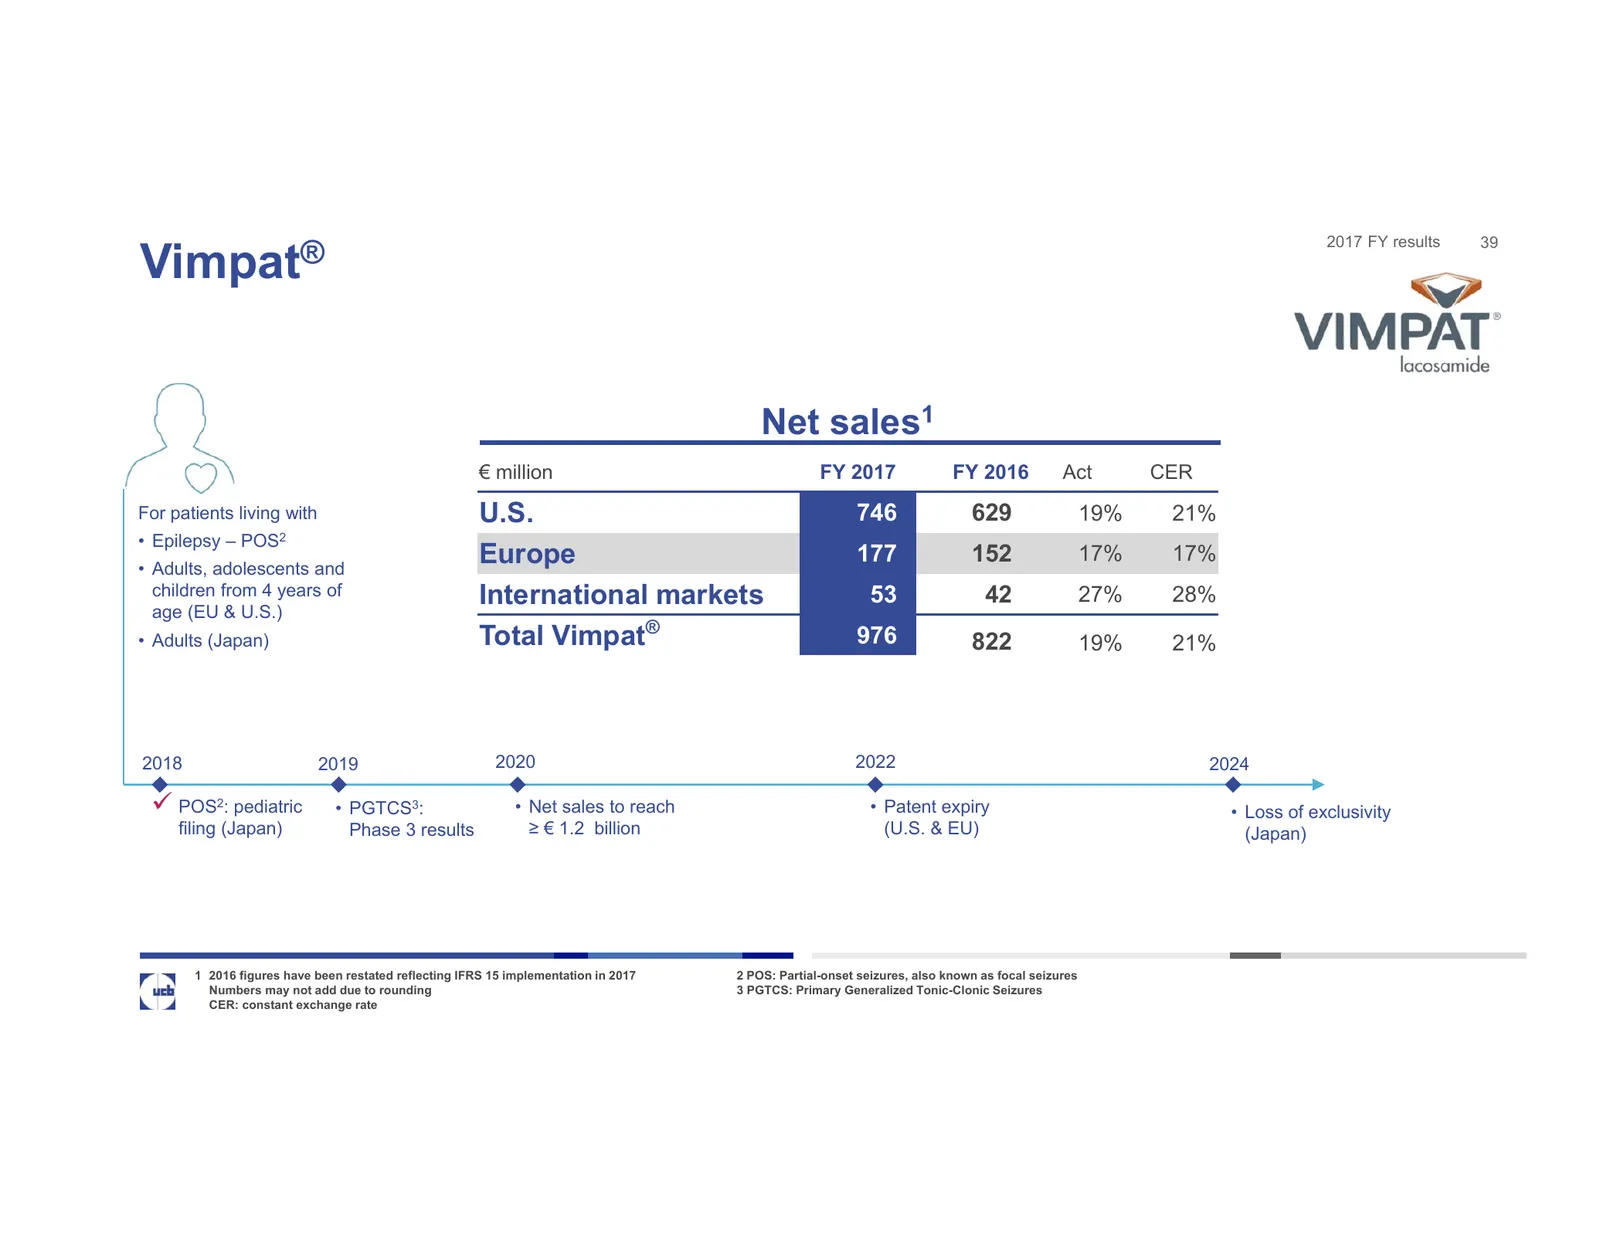
Slide 39: Vimpat
2017 FY results 39 Vimpat® Net sales1 € million FY 2017 FY 2016 Act CER For patients living with U.S. 746 629 19% 21% • Epilepsy – POS2 • Adults, adolescents and Europe 177 152 17% 17% children from 4 years of age (EU & U.S.) International markets 53 42 27% 28% • Adults (Japan) Total Vimpat® 976 822
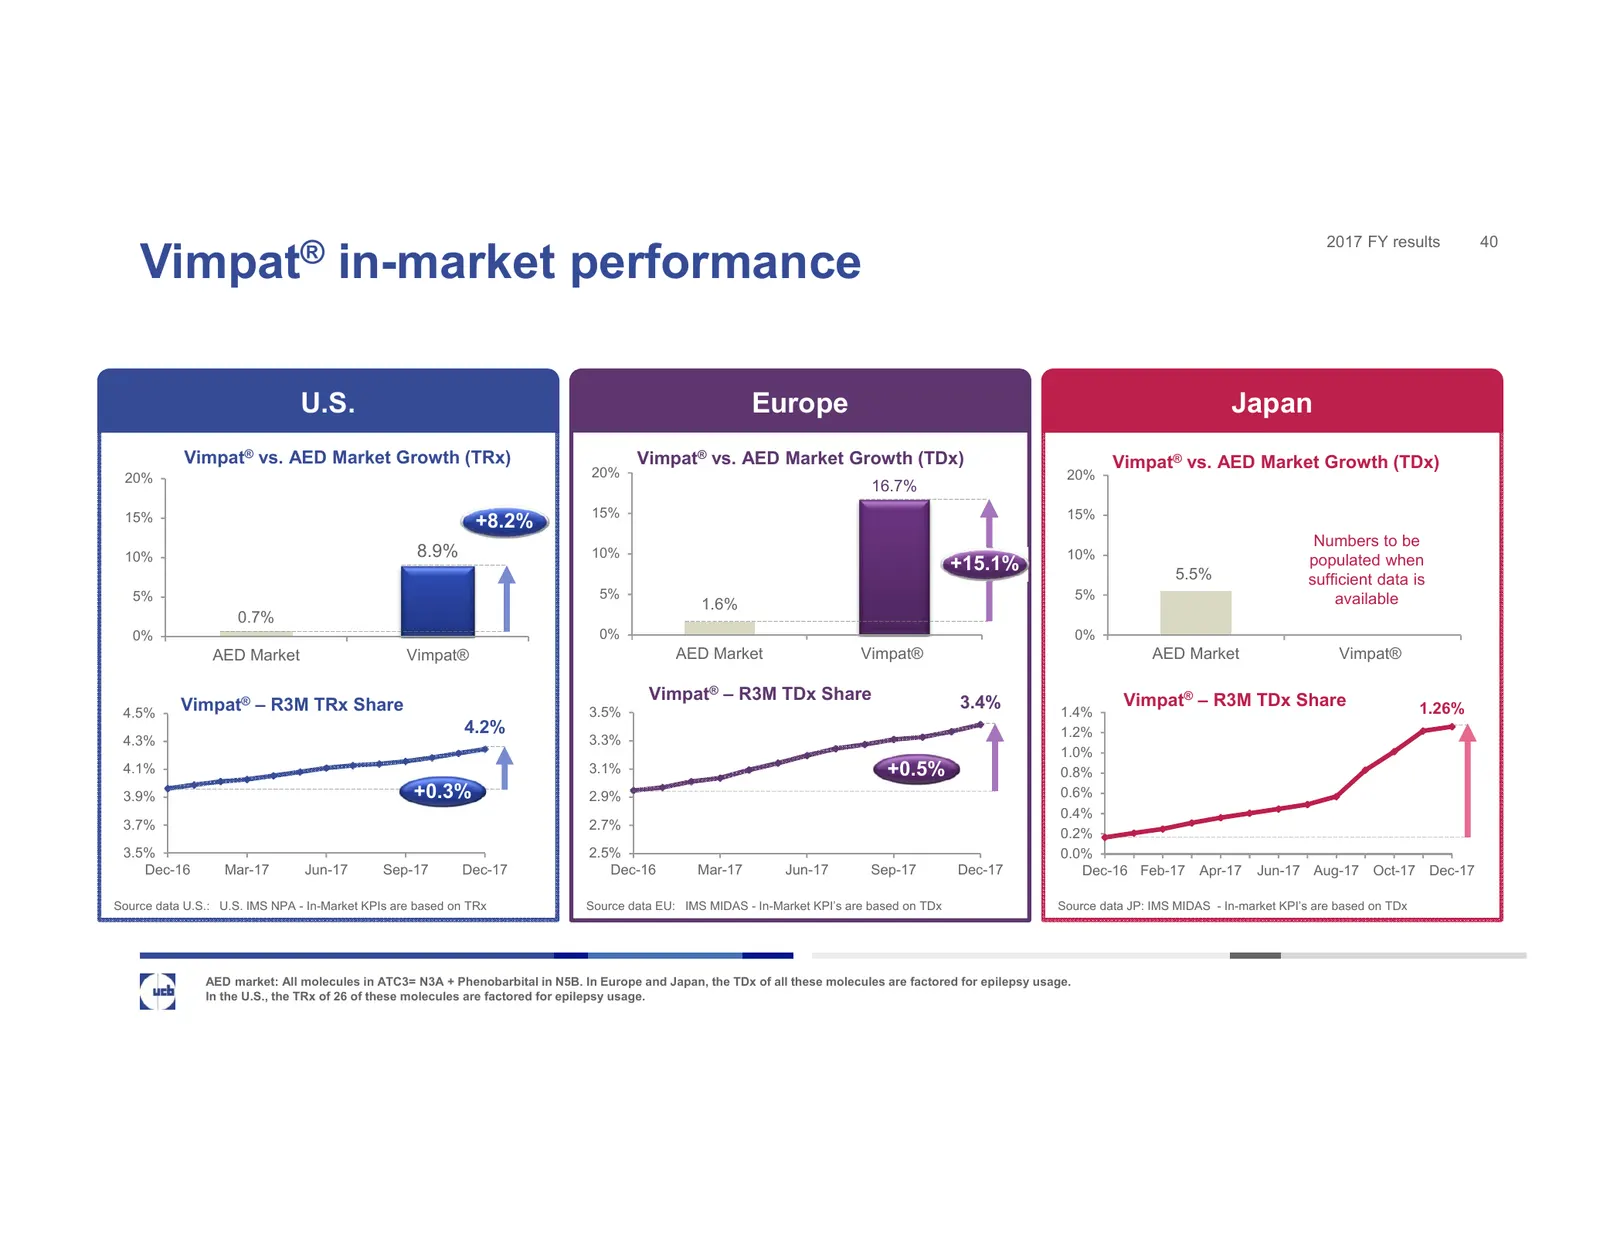
Slide 40: Vimpat in-market performance
2017 FY results 40 Vimpat® in-market performance U.S. Europe Japan Vimpat® vs. AED Market Growth (TRx) Vimpat® vs. AED Market Growth (TDx) Vimpat® vs. AED Market Growth (TDx) 20% 20% 20% 16.7% 15% 15% 15% +8.2% Numbers to be 10% 8.9% 10% 10% populated when +15.1% 5.5% sufficient data is 5% 5% 5% ava
Slide 41: Keppra
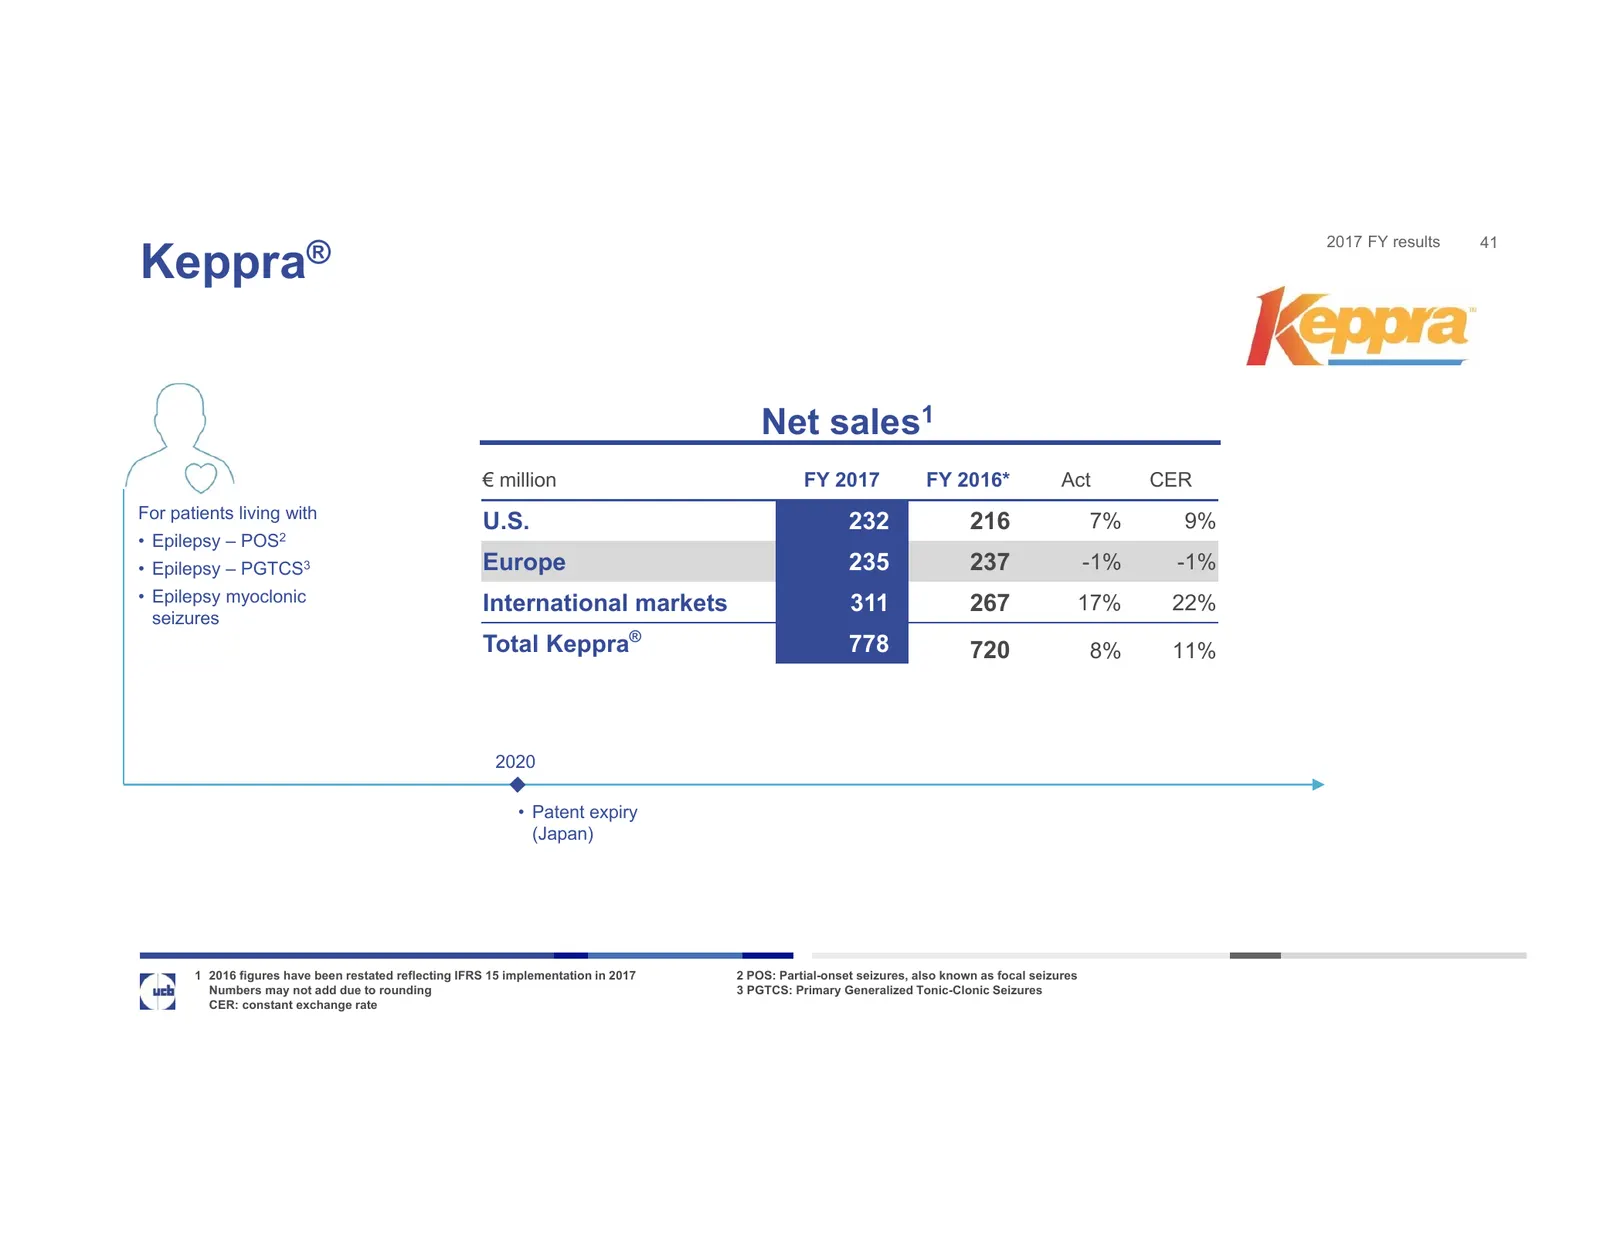
2017 FY results 41 Keppra® Net sales1 € million FY 2017 FY 2016* Act CER For patients living with U.S. 232 216 7% 9% • Epilepsy – POS2 • Epilepsy – PGTCS3 Europe 235 237 -1% -1% • Epilepsy myoclonic International markets 311 267 17% 22% seizures Total Keppra® 778 720 8% 11% 2020 • Patent expiry (Jap
Slide 42: Keppra in-market performance
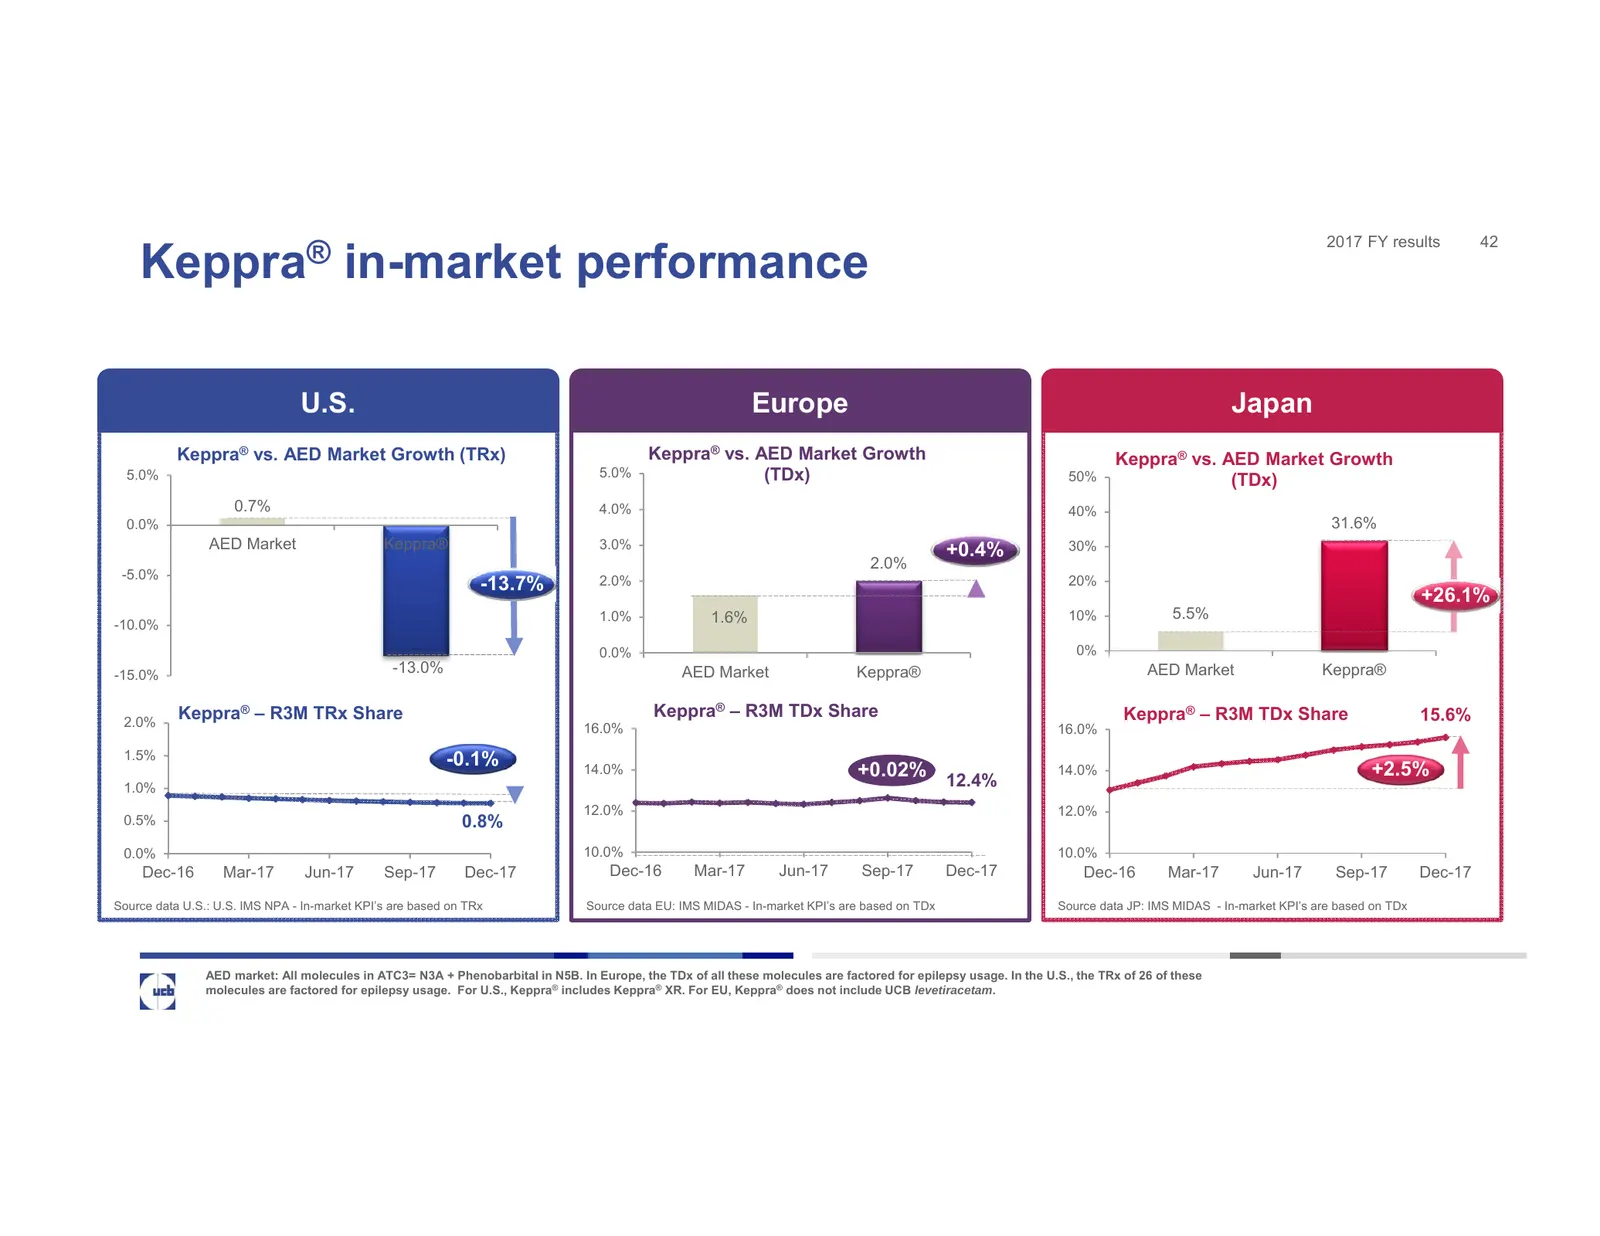
2017 FY results 42 Keppra® in-market performance U.S. Europe Japan Keppra® vs. AED Market Growth (TRx) Keppra® vs. AED Market Growth Keppra® vs. AED Market Growth 5.0% 5.0% (TDx) 50% (TDx) 0.7% 4.0% 40% 0.0% 31.6% AED Market Keppra® 3.0% +0.4% 30% 2.0% -5.0% -13.7% 2.0% 20% +26.1% 1.0% 1.6% 10% 5.5%
Slide 43: Briviact
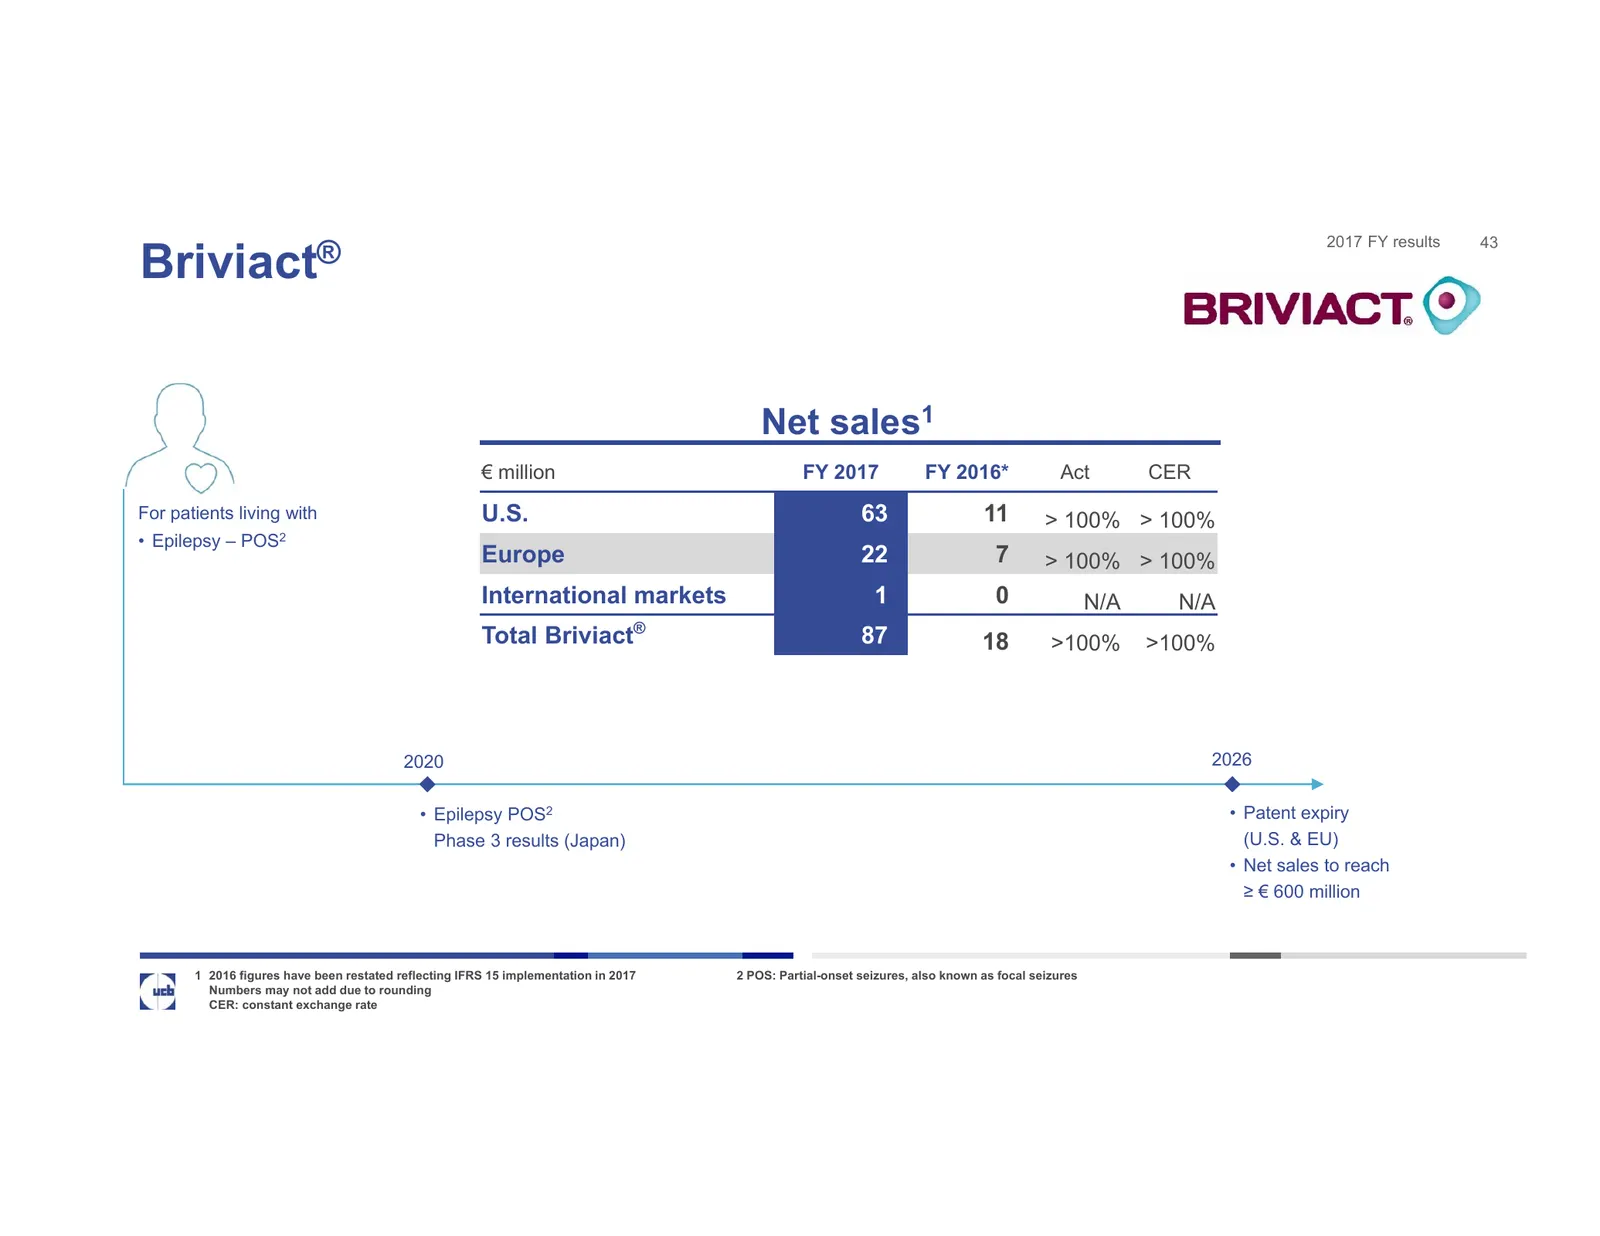
2017 FY results 43 Briviact® Net sales1 € million FY 2017 FY 2016* Act CER For patients living with U.S. 63 11 > 100% > 100% • Epilepsy – POS2 Europe 22 7 > 100% > 100% International markets 1 0 N/A N/A ® Total Briviact 87 18 >100% >100% 2020 2026 • Epilepsy POS2 • Patent expiry Phase 3 results (Jap
Slide 44: Briviact in-market performance
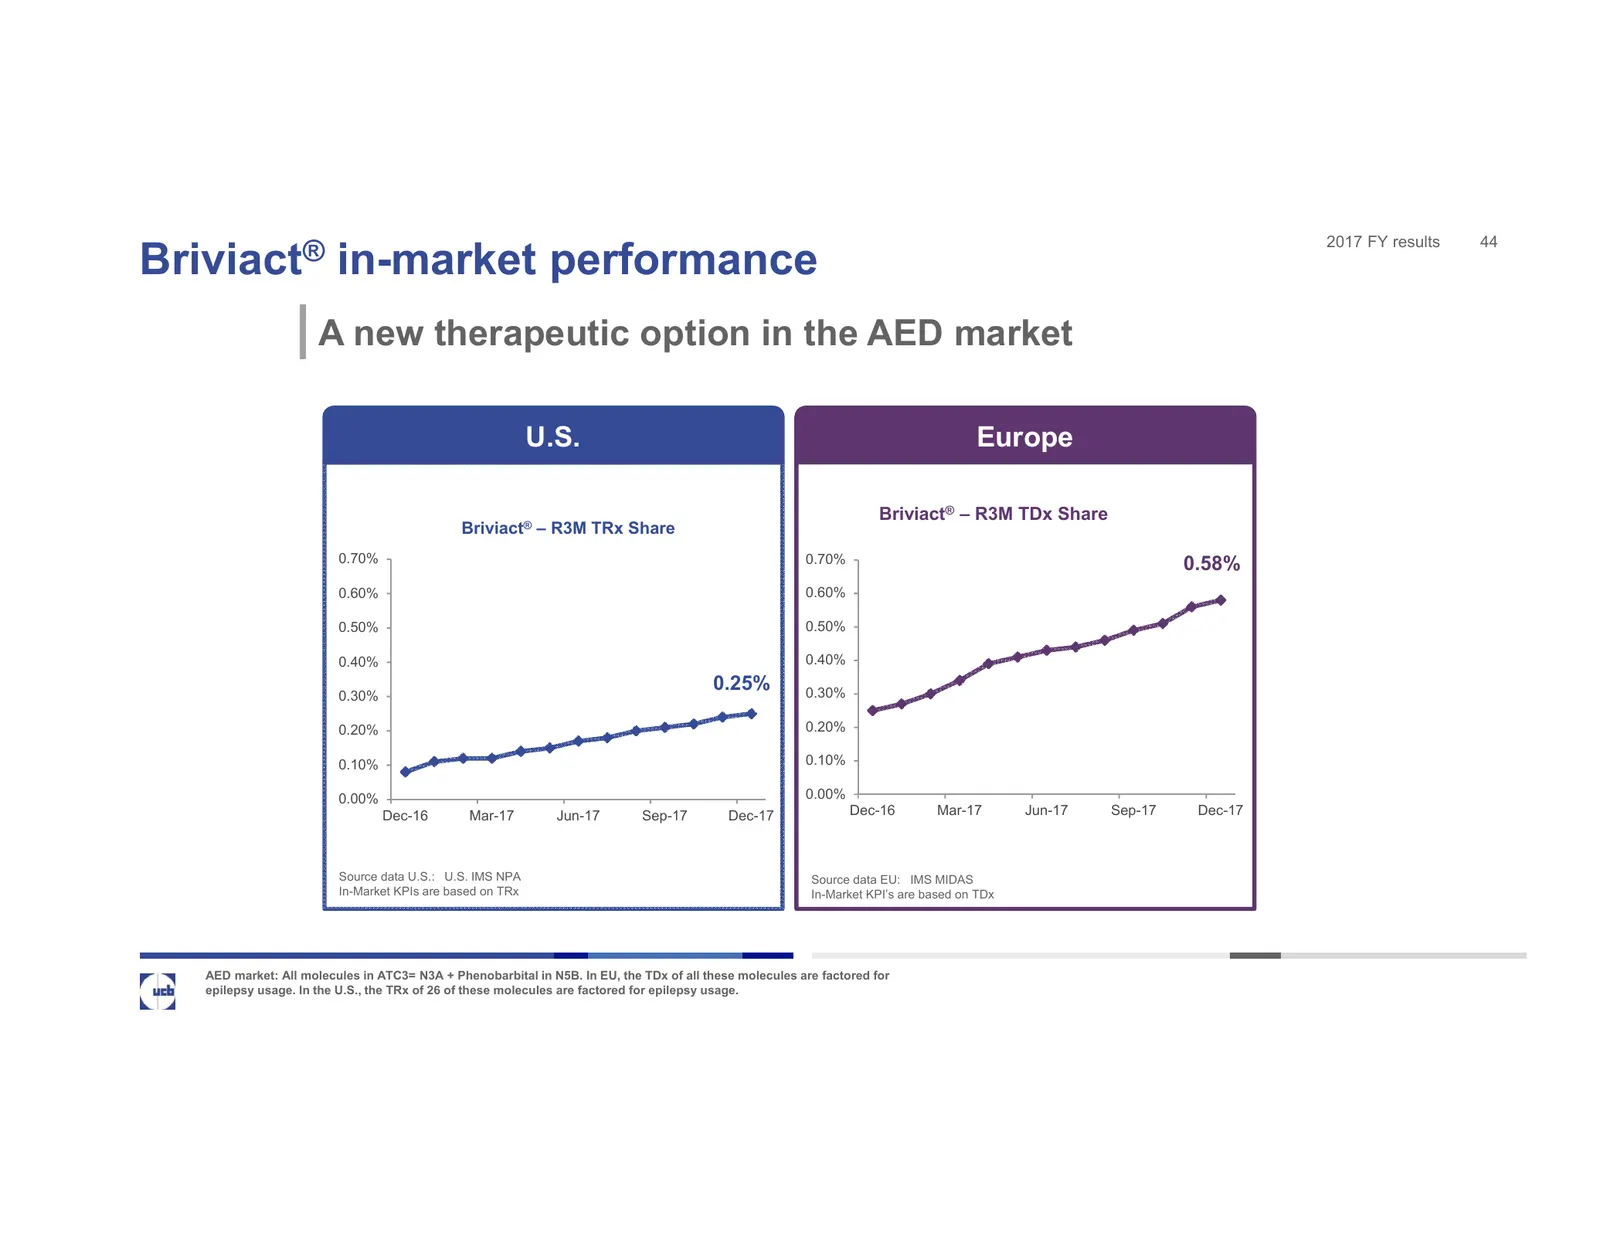
2017 FY results 44 Briviact® in-market performance A new therapeutic option in the AED market U.S. Europe Briviact® – R3M TDx Share Briviact® – R3M TRx Share 0.70% 0.70% 0.58% 0.60% 0.60% 0.50% 0.50% 0.40% 0.40% 0.25% 0.30% 0.30% 0.20% 0.20% 0.10% 0.10% 0.00% 0.00% Dec-16 Mar-17 Jun-17 Sep-17 Dec-17
Slide 45: Neupro
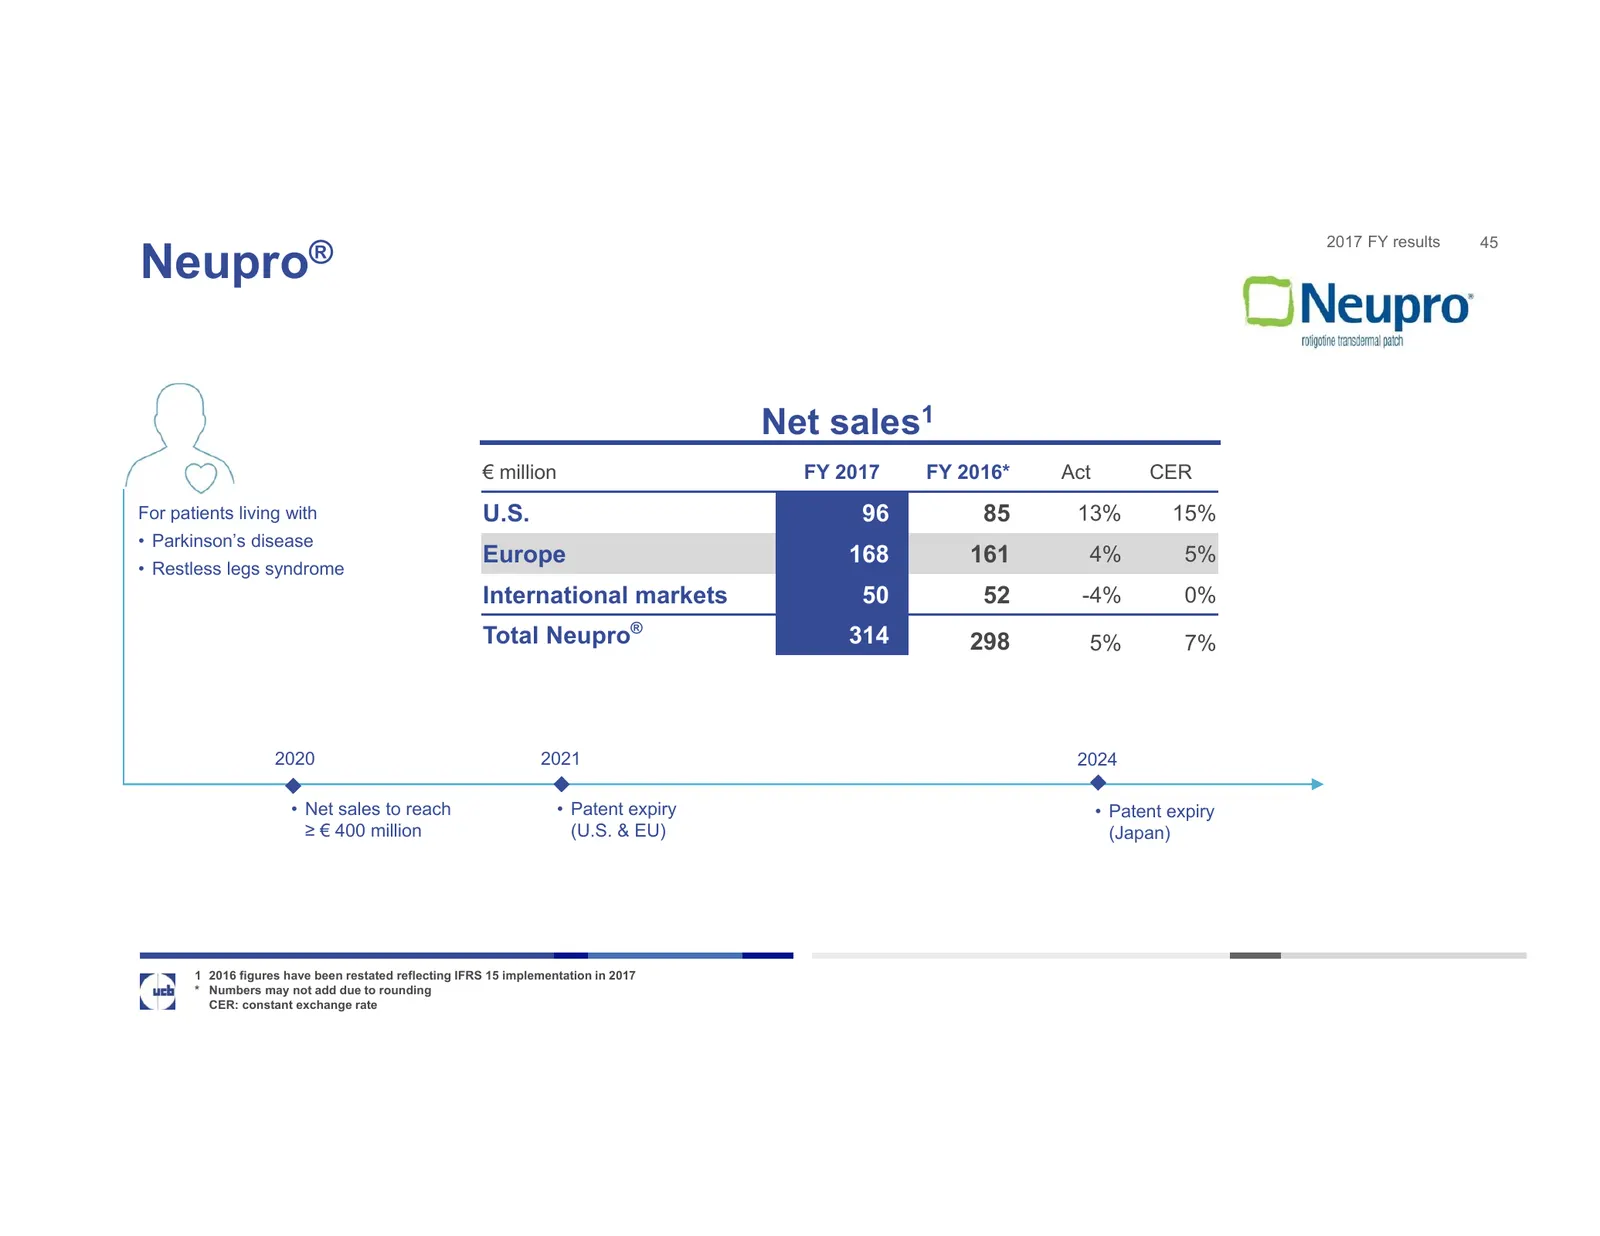
2017 FY results 45 Neupro® Net sales1 € million FY 2017 FY 2016* Act CER For patients living with U.S. 96 85 13% 15% • Parkinson’s disease Europe 168 161 4% 5% • Restless legs syndrome International markets 50 52 -4% 0% Total Neupro® 314 298 5% 7% 2020 2021 2024 • Net sales to reach • Patent expiry
Slide 46: Neupro in-market performance
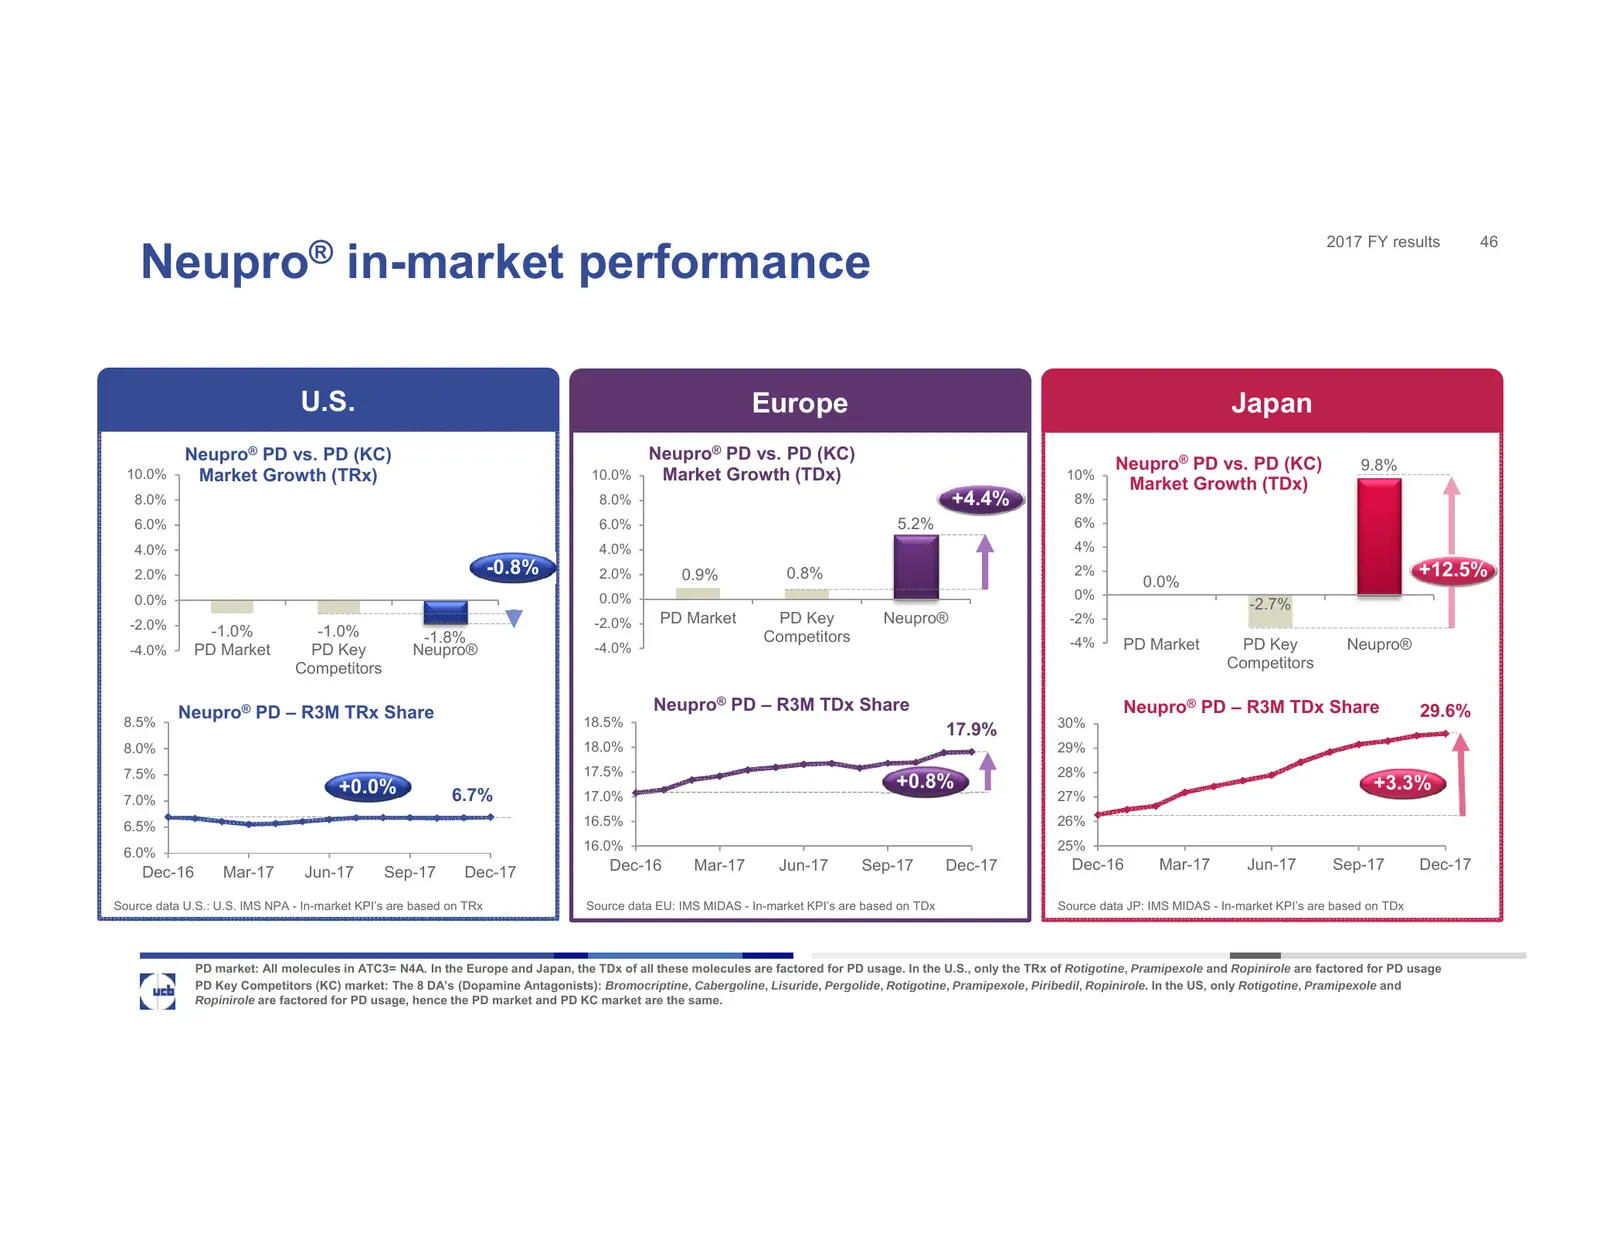
2017 FY results 46 Neupro® in-market performance U.S. Europe Japan Neupro® PD vs. PD (KC) Neupro® PD vs. PD (KC) Neupro® PD vs. PD (KC) 9.8% 10.0% Market Growth (TRx) 10.0% Market Growth (TDx) 10% Market Growth (TDx) 8.0% 8.0% +4.4% 8% 6.0% 6.0% 5.2% 6% 4.0% 4.0% 4% 2.0% -0.8% 2.0% 0.9% 0.8% 2% +12.
Slide 47: Translating scientific hypotheses into clinical development
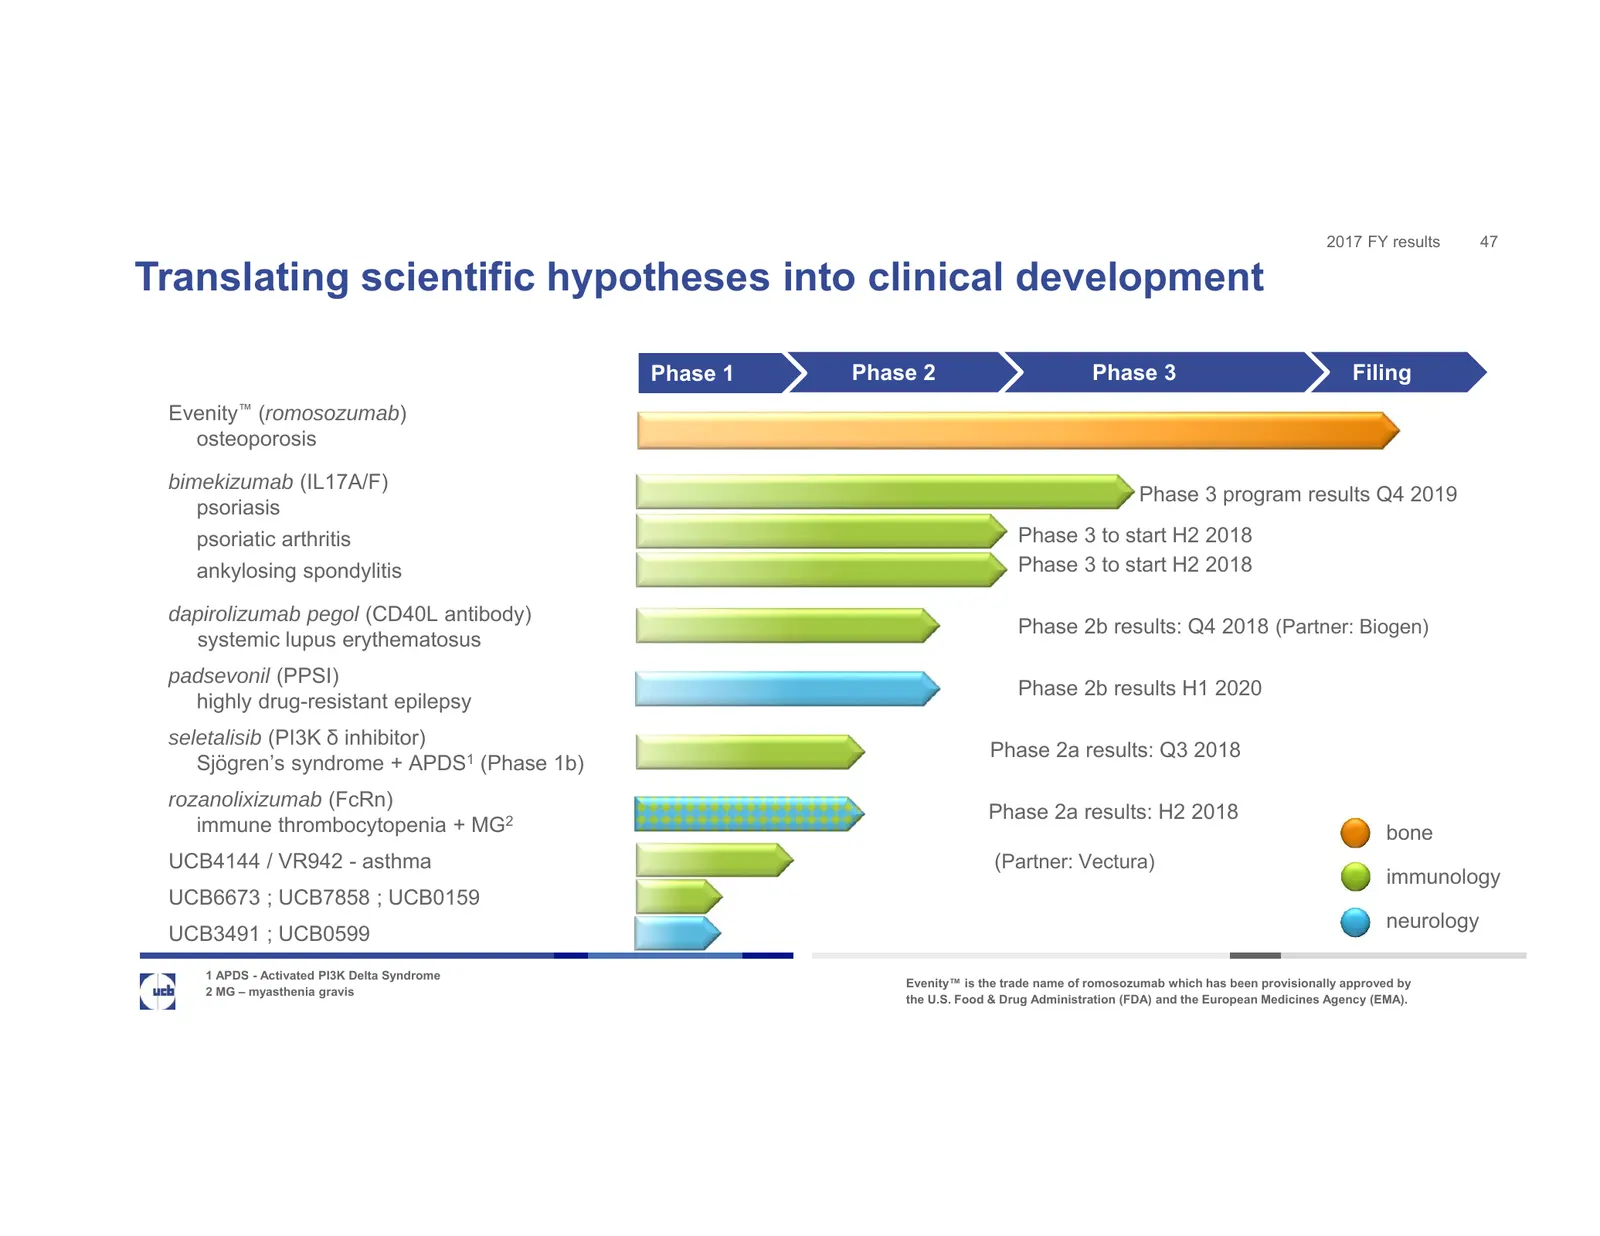
2017 FY results 47 Translating scientific hypotheses into clinical development Phase 1 Phase 2 Phase 3 Filing Evenity™ (romosozumab) osteoporosis bimekizumab (IL17A/F) Phase 3 program results Q4 2019 psoriasis psoriatic arthritis Phase 3 to start H2 2018 ankylosing spondylitis Phase 3 to start H2 20
Slide 48: Evenity (romosozumab)
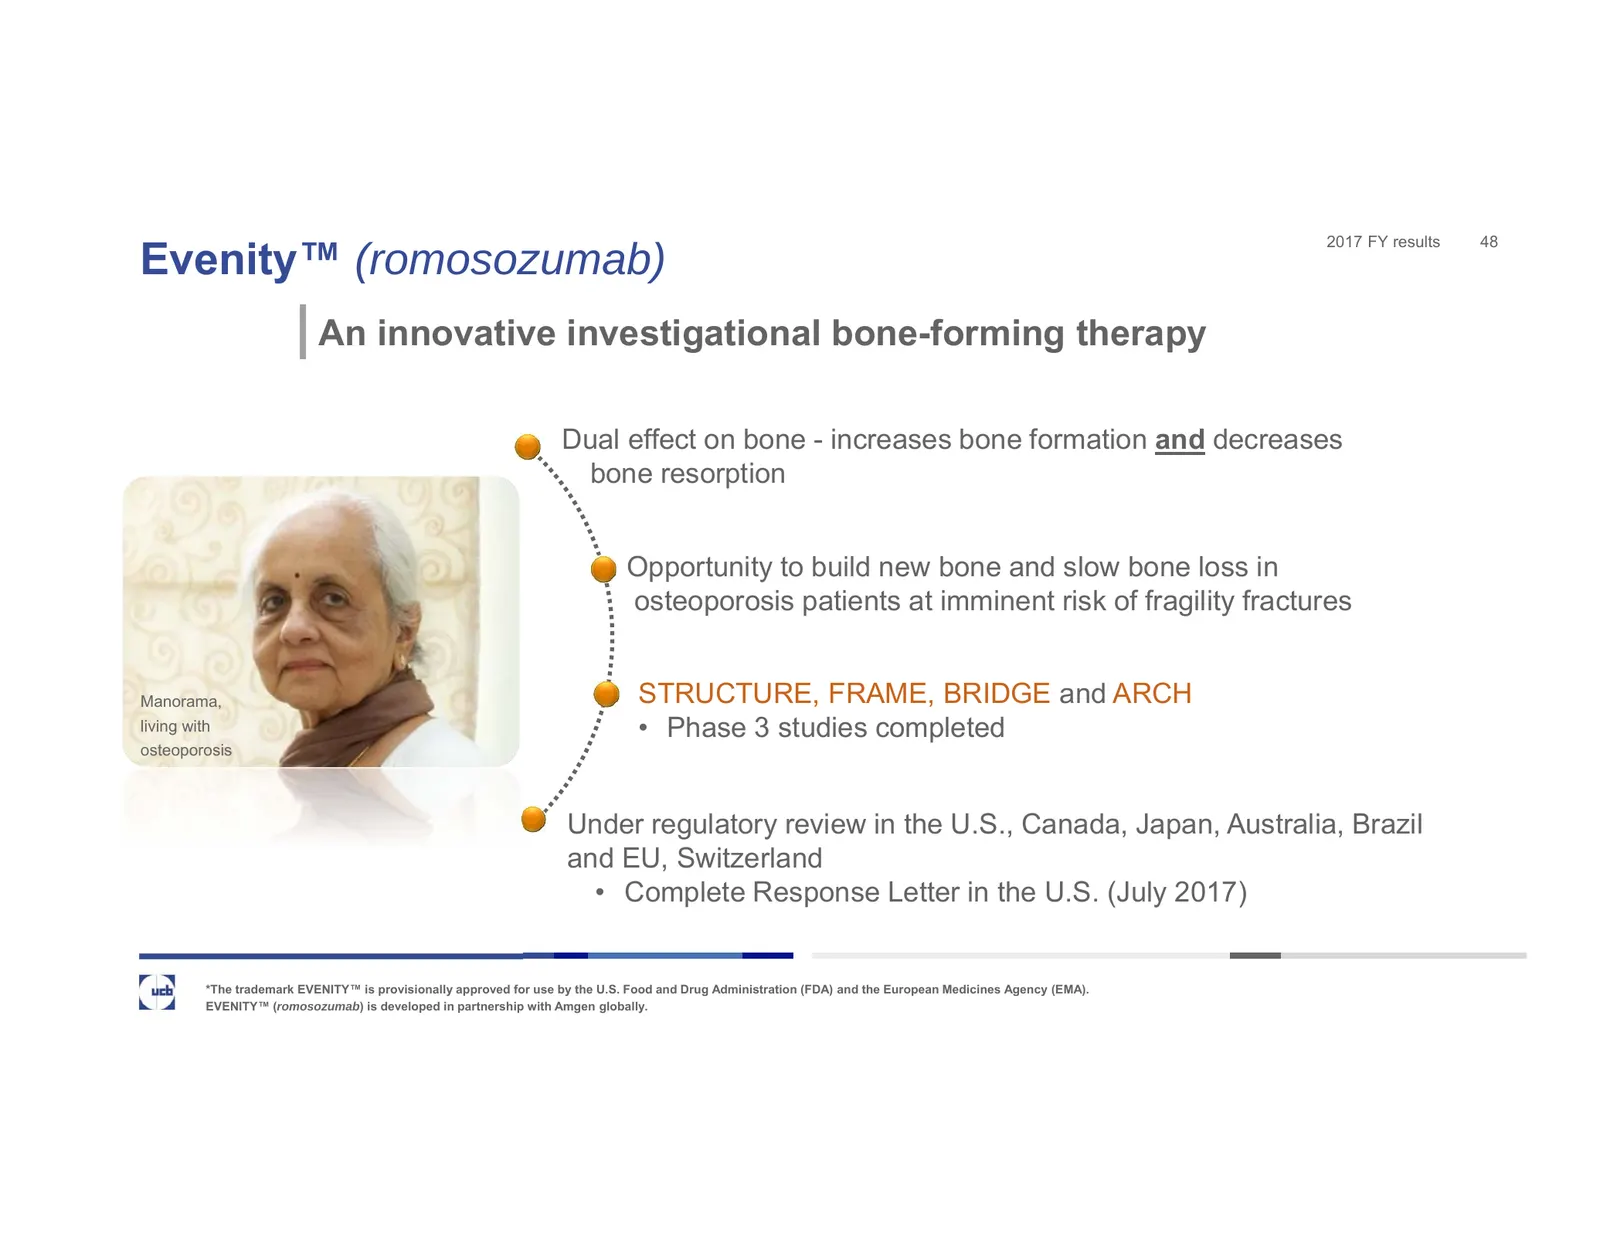
2017 FY results 48 Evenity™ (romosozumab) An innovative investigational bone-forming therapy Dual effect on bone - increases bone formation and decreases bone resorption Opportunity to build new bone and slow bone loss in osteoporosis patients at imminent risk of fragility fractures Manorama, STRUCT
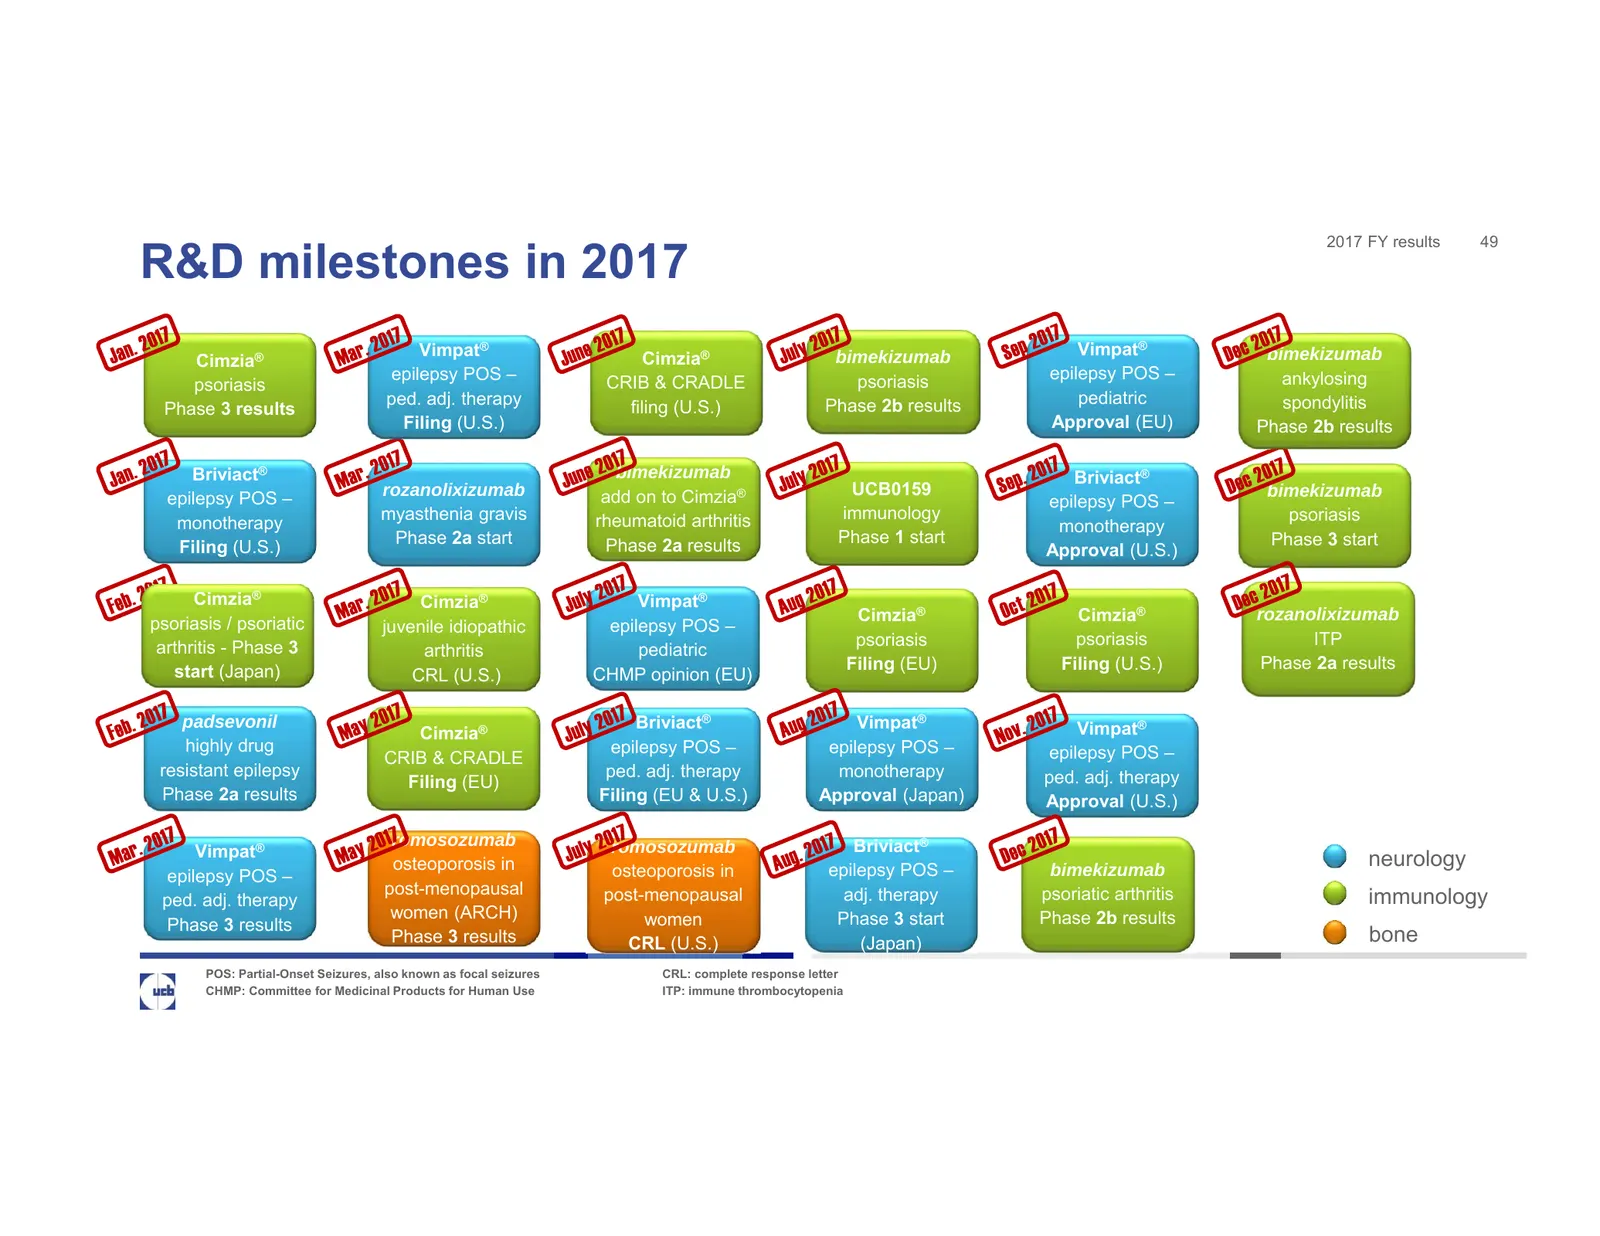
Slide 49: R&D milestones in 2017
2017 FY results 49 R&D milestones in 2017 Vimpat® Vimpat® bimekizumab Cimzia® Cimzia® bimekizumab epilepsy POS – psoriasis epilepsy POS – ankylosing psoriasis CRIB & CRADLE ped. adj. therapy Phase 2b results pediatric spondylitis Phase 3 results filing (U.S.) Filing (U.S.) Approval (EU) Phase 2b res
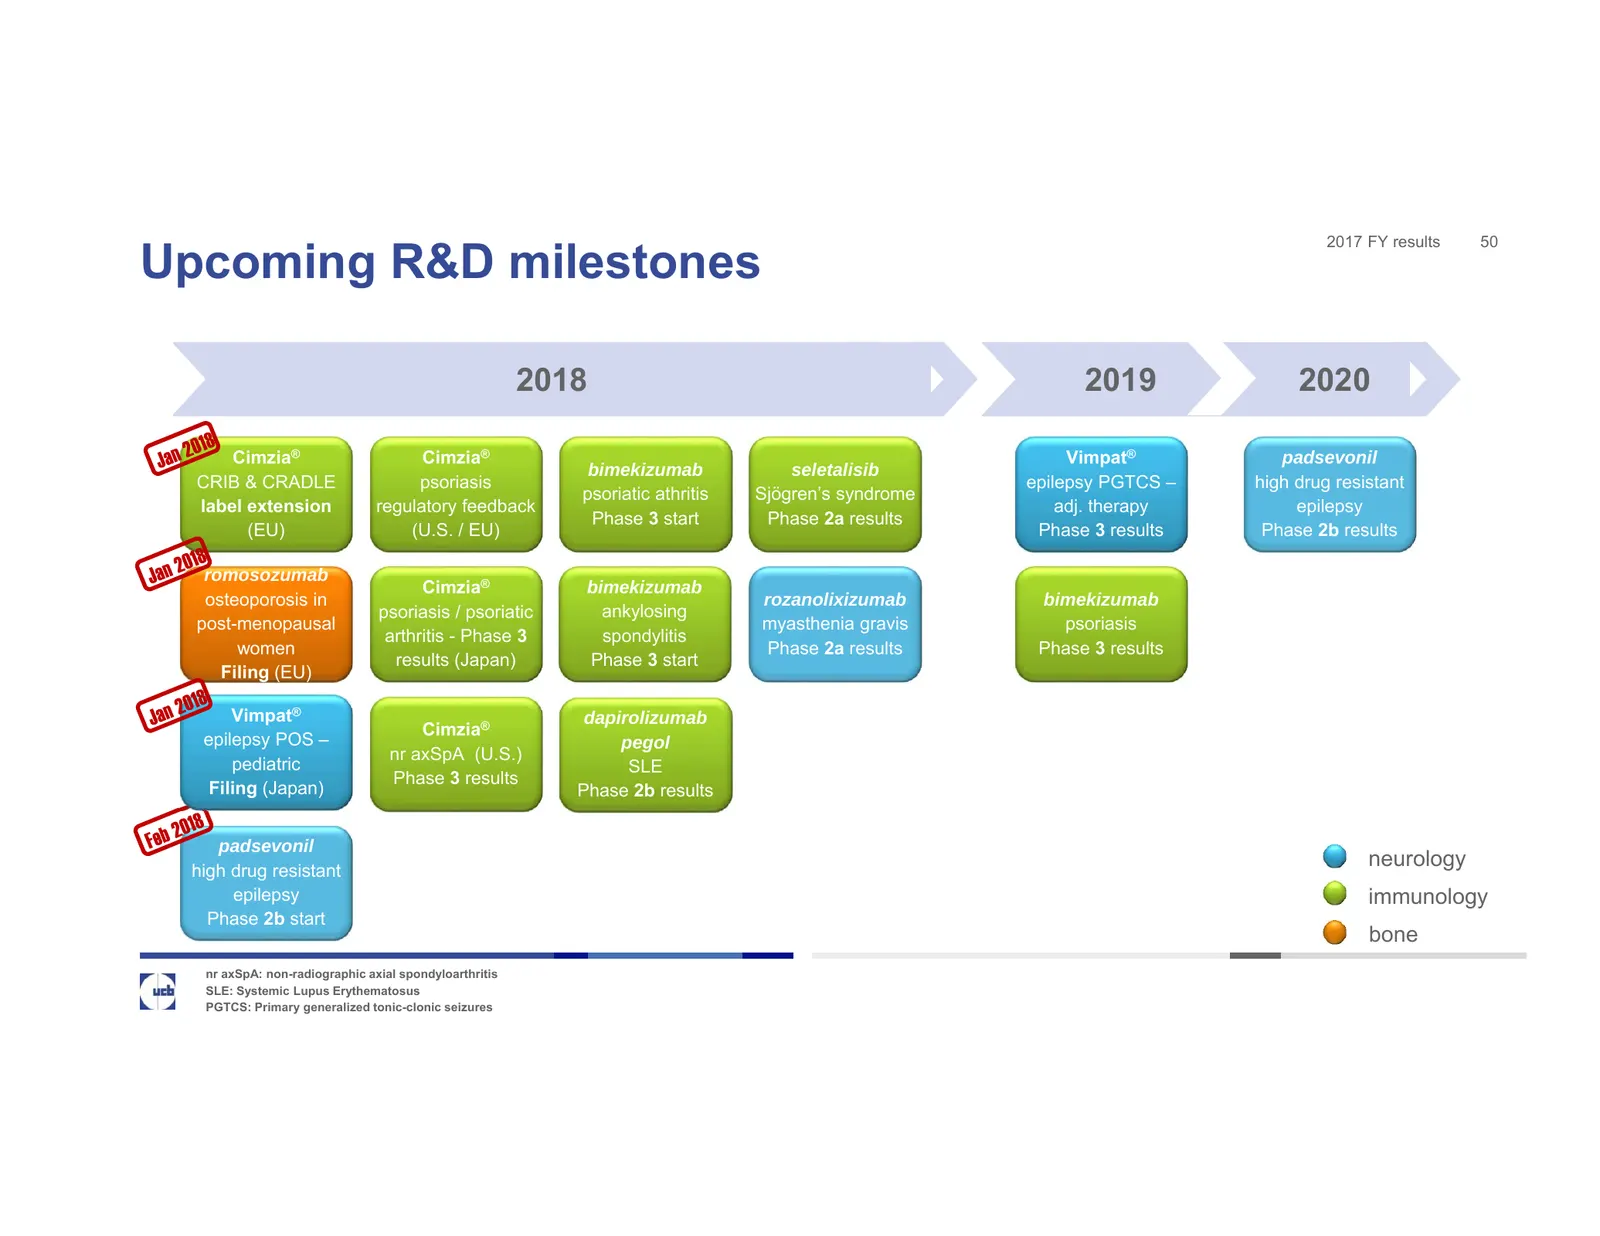
Slide 50: Upcoming R&D milestones
2017 FY results 50 Upcoming R&D milestones 2018 2019 2020 Cimzia® Cimzia® Vimpat® padsevonil bimekizumab seletalisib CRIB & CRADLE psoriasis epilepsy PGTCS – high drug resistant psoriatic athritis Sjögren’s syndrome label extension regulatory feedback adj. therapy epilepsy Phase 3 start Phase 2a res
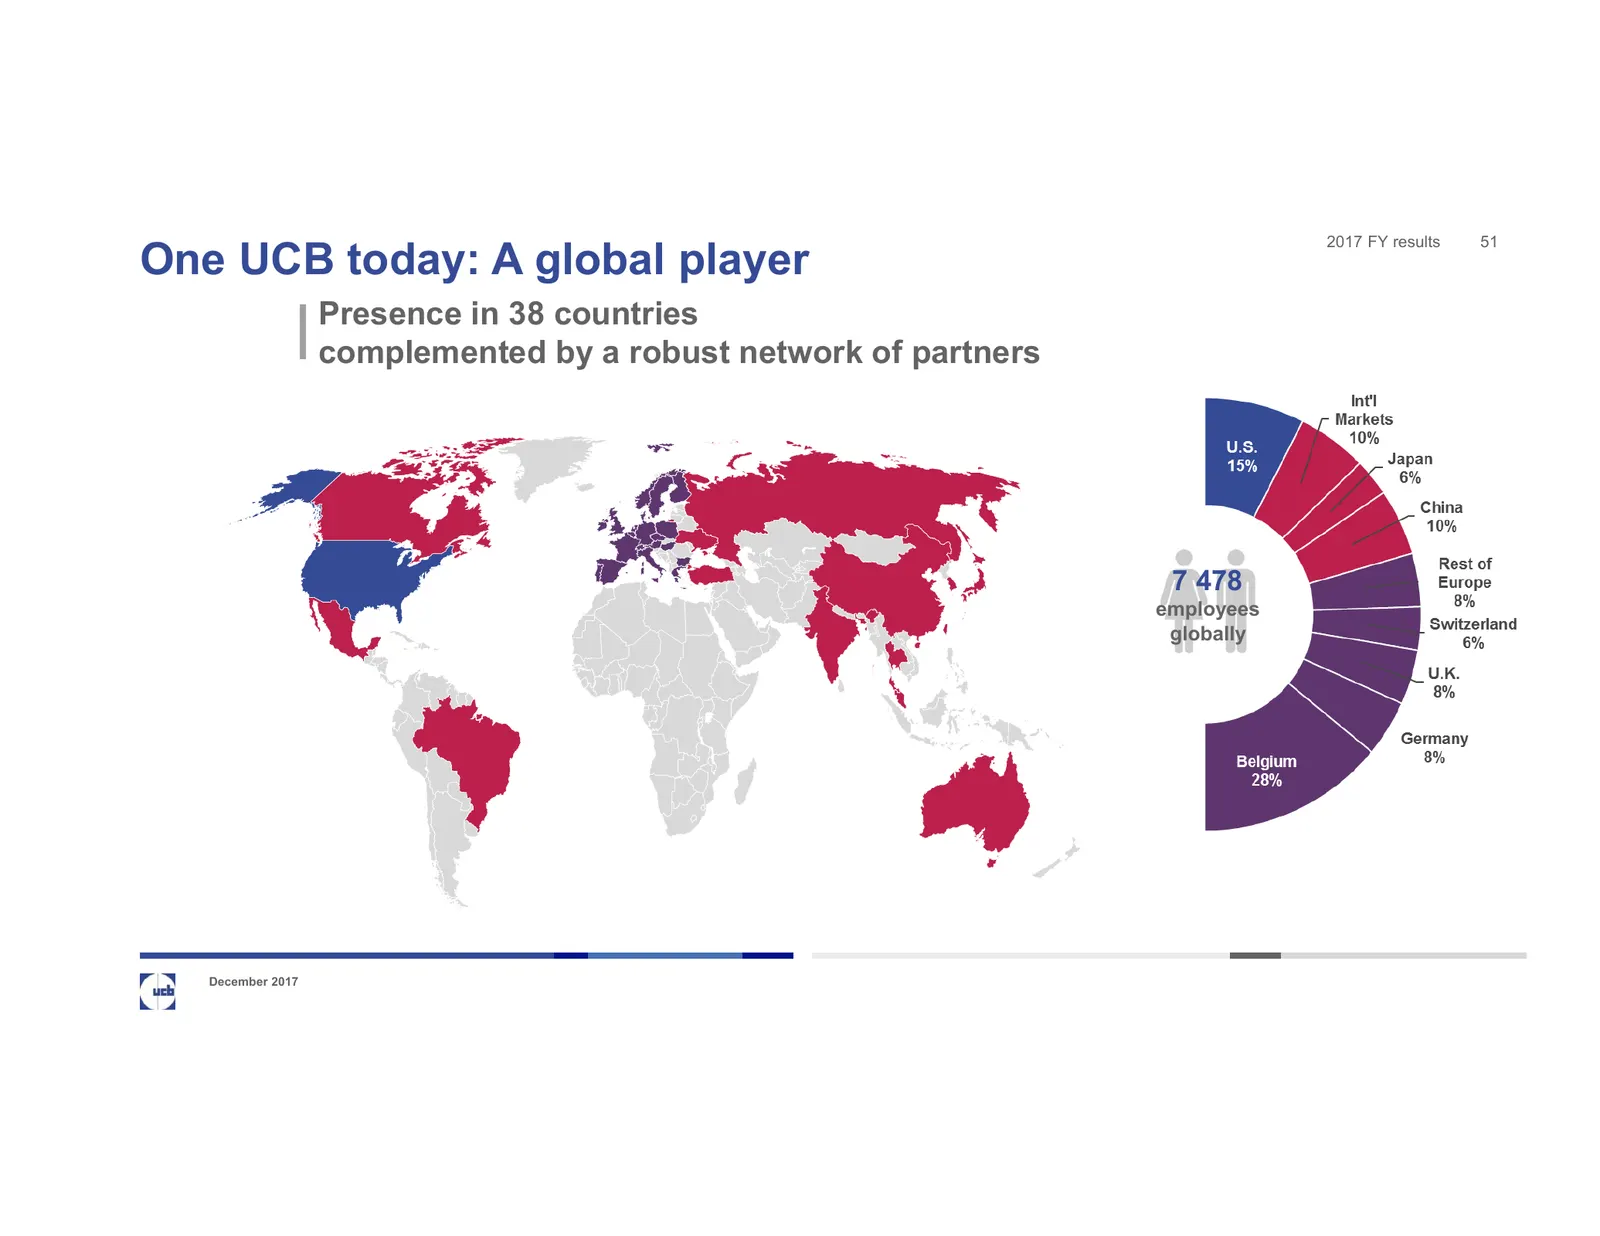
Slide 51: One UCB today: A global player
2017 FY results 51 One UCB today: A global player Presence in 38 countries complemented by a robust network of partners 7 478 employees globally December 2017
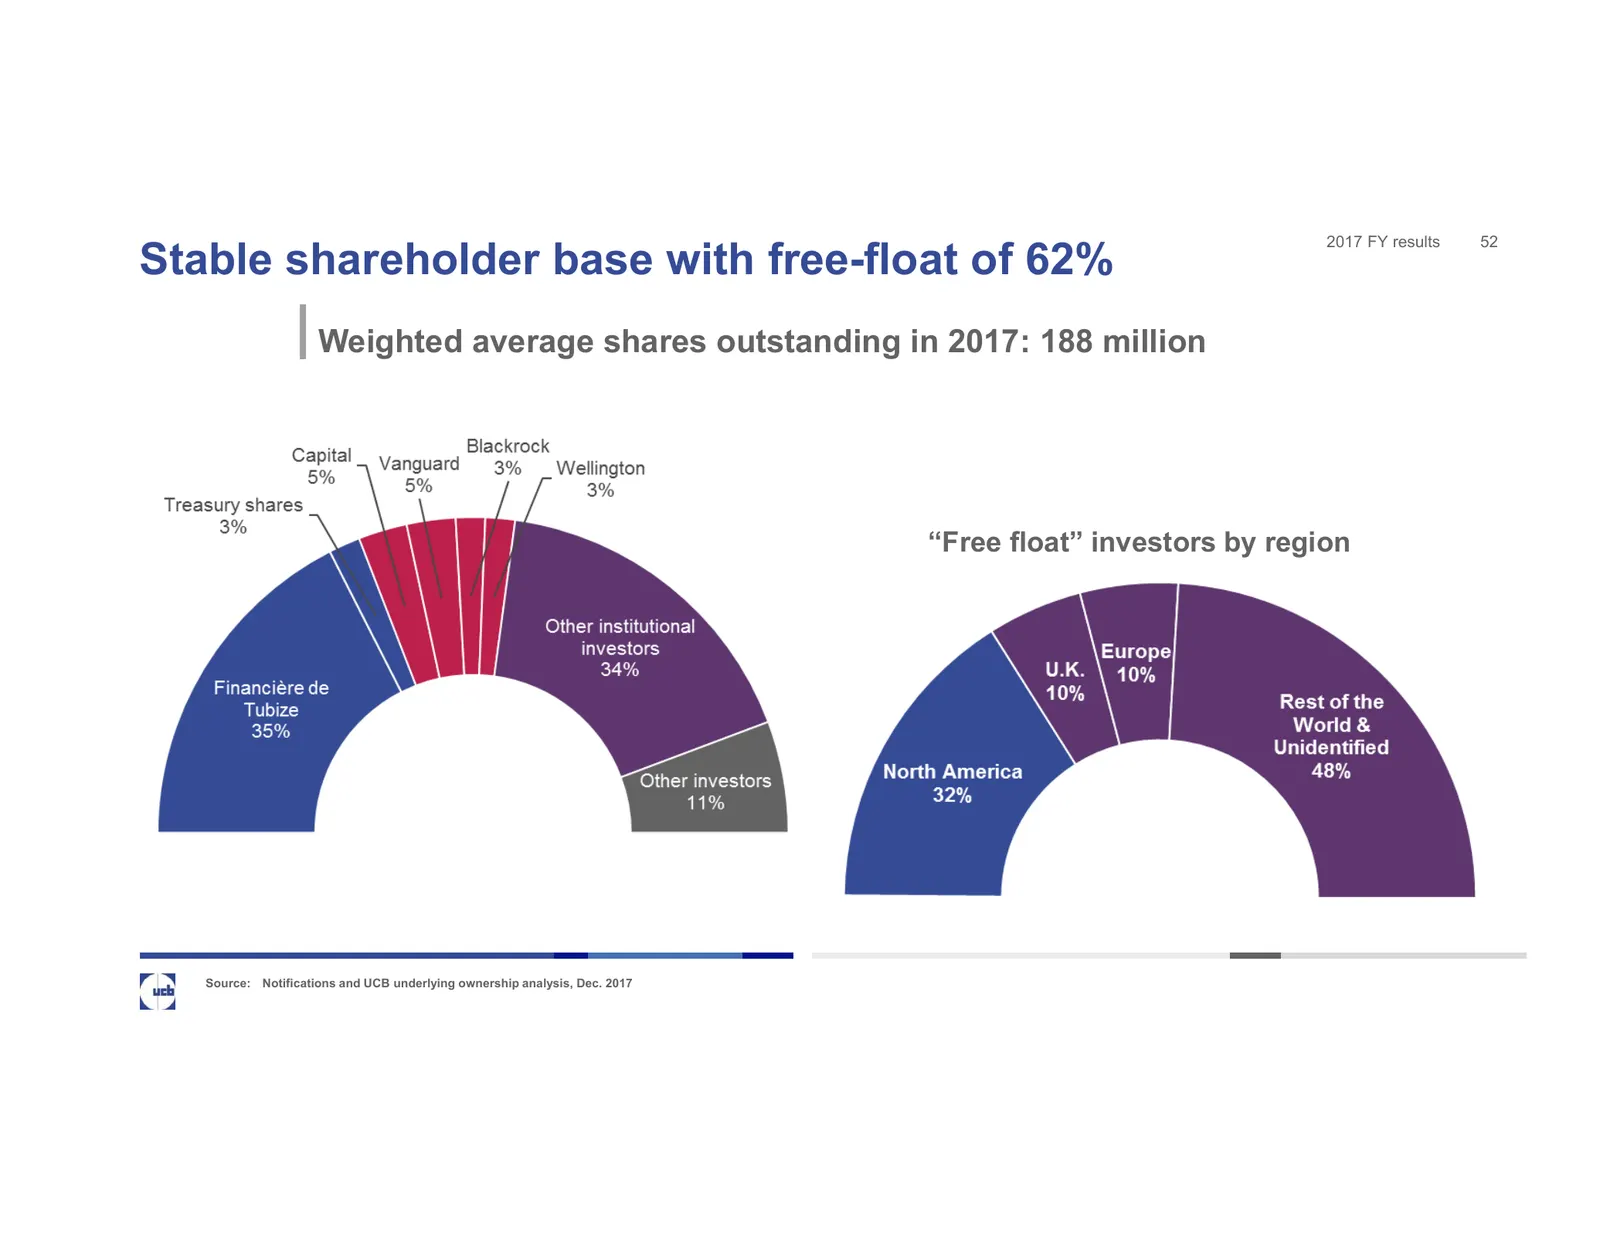
Slide 52: Stable shareholder base with free-float of 62%
2017 FY results 52 Stable shareholder base with free-float of 62% Weighted average shares outstanding in 2017: 188 million “Free float” investors by region Source: Notifications and UCB underlying ownership analysis, Dec. 2017
Slide 53: Your UCB Investor Relations team
2017 FY results 53 Your UCB Investor Relations team ןAntje Witte, Vice President Investor Relations • Phone: +32 2 559 9414 • E-mail: antje.witte@ucb.com ןIsabelle Ghellynck, Director Investor Relations • Phone: +32 2 559 9588 • E-mail: isabelle.ghellynck@ucb.com ןNathalie Deldime, Investor
Source: Internet Archive copy of ucb.com
More decks from Ucb S.A.
 H1 2026 Earnings Presentation22 slides · Jul 30, 2026
 FY2025 Earnings Presentation22 slides · Feb 26, 2026
 44th Annual J.P. Morgan Healthcare Conference 202616 slides · Jan 14, 2026
 H1 2025 Earnings Presentation21 slides · Jul 31, 2025
 FY2024 Earnings Presentation18 slides · Feb 27, 2025
 43rd Annual J.P. Morgan Healthcare Conference (January 2025)13 slides · Jan 15, 2025