Dunkin' Brands — Investor Day (February 2018)
183 slides from Dunkin' Brands's investor day presentation, Feb 8, 2018
Slide 1: 2018 Investor & Analyst Day
2018 Investor & Analyst Day February 8, 2018
Slide 2: Forward Looking Statements
Forward Looking Statements • Certain information contained in this presentation, particularly information regarding future economic performance, finances, and expectations and objectives of management constitutes forward-looking statements. Forward-looking statements can be identified by the fact th
Slide 3: dunia’ =
dunia’ = FENWAY |SPORTS|GROUP ‘lf A it yy DUS, SRACING —
Slide 4: Proud of Our Heritage
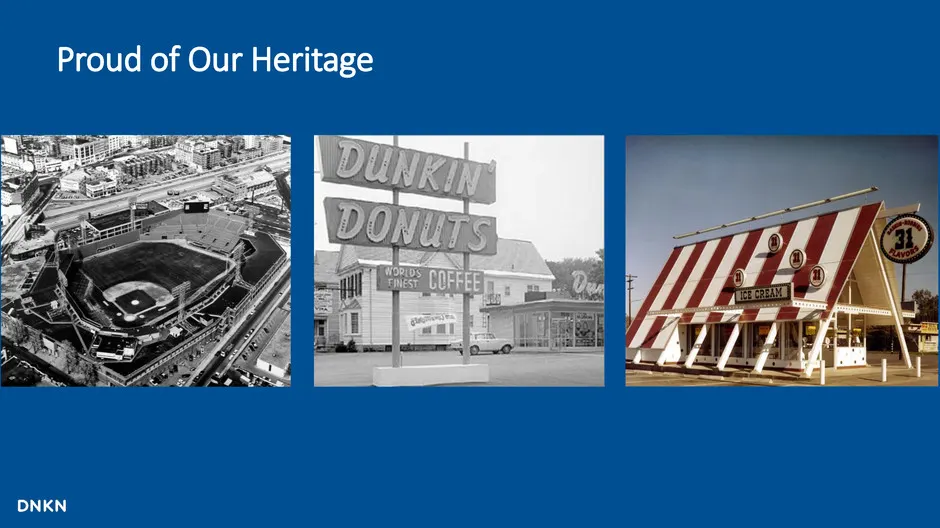
Proud of Our Heritage DNKN
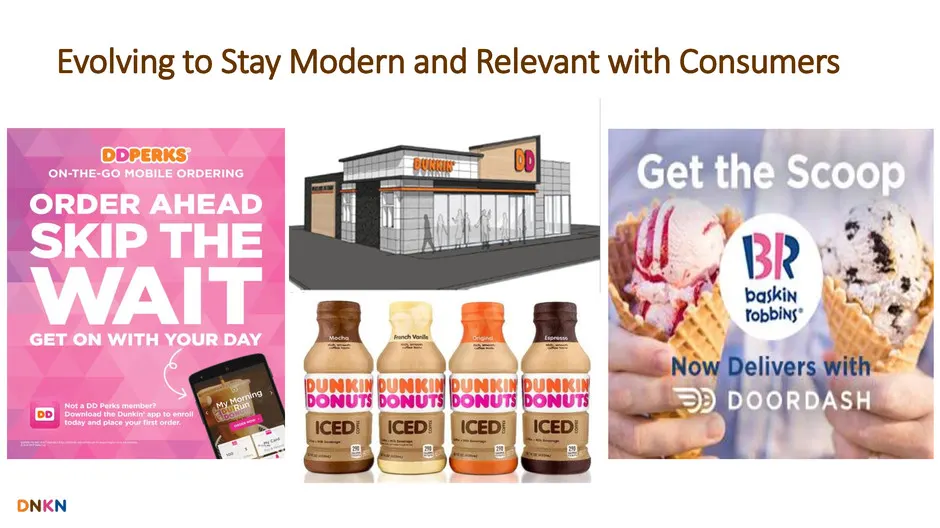
Slide 5: Evolving to Stay Modern and Relevant with Consumers
Evolving to Stay Modern and Relevant with Consumers
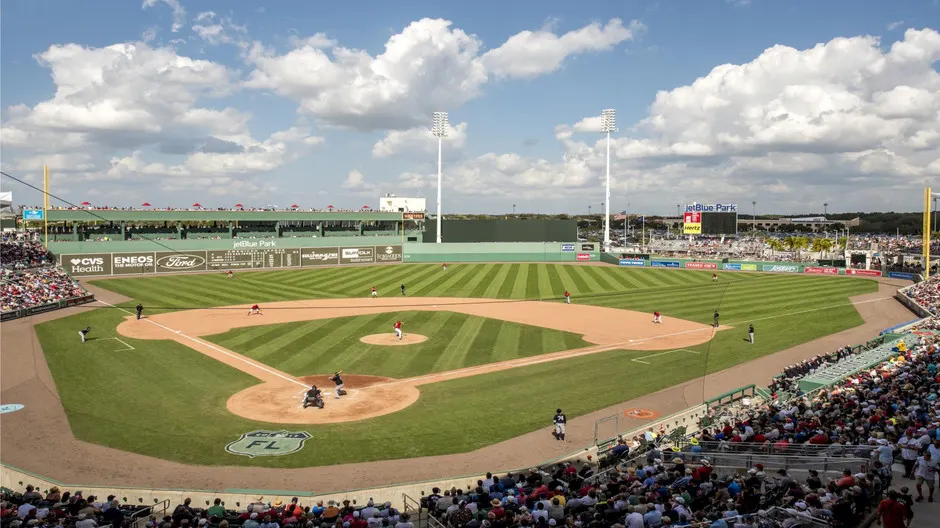
Slide 6: 6
6
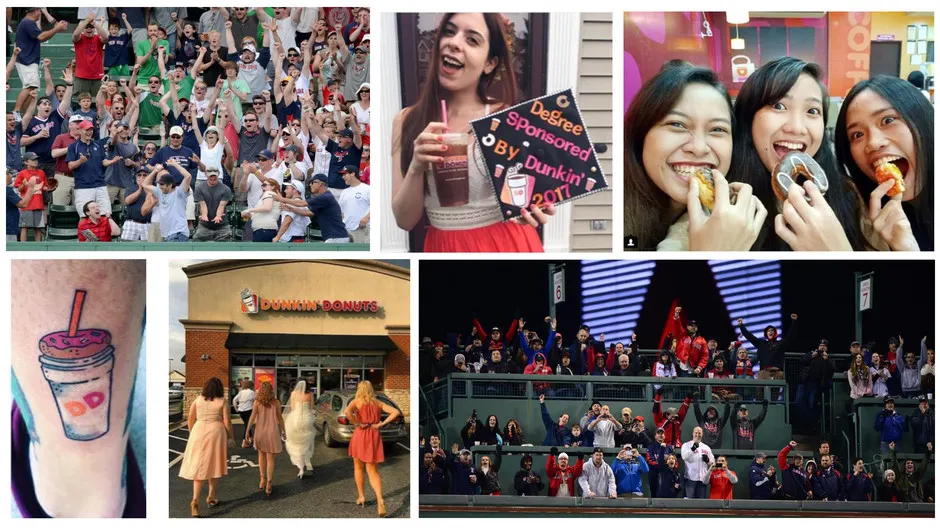
Slide 7: 7
7
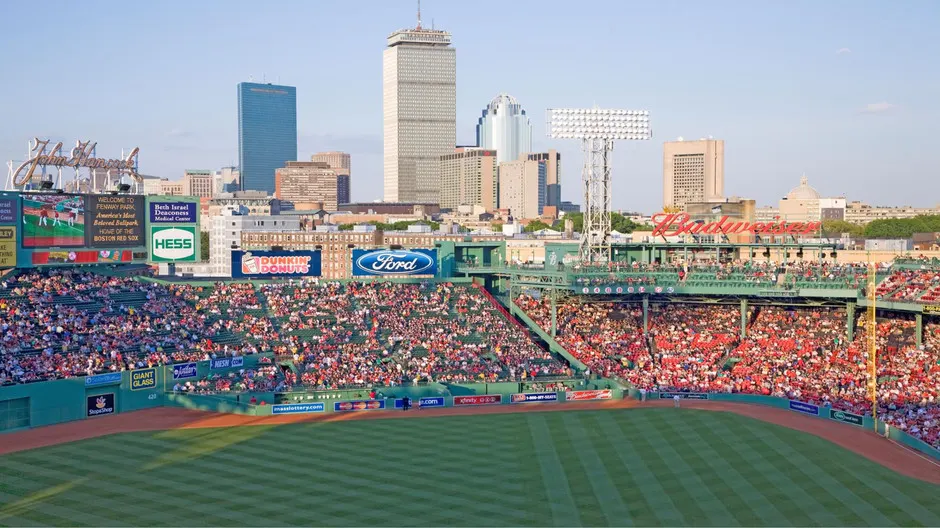
Slide 8
Slide 9: Asset Light, 100% Franchised Model Strong Free Cash Flow Shareholder Friendly Returned $2B to
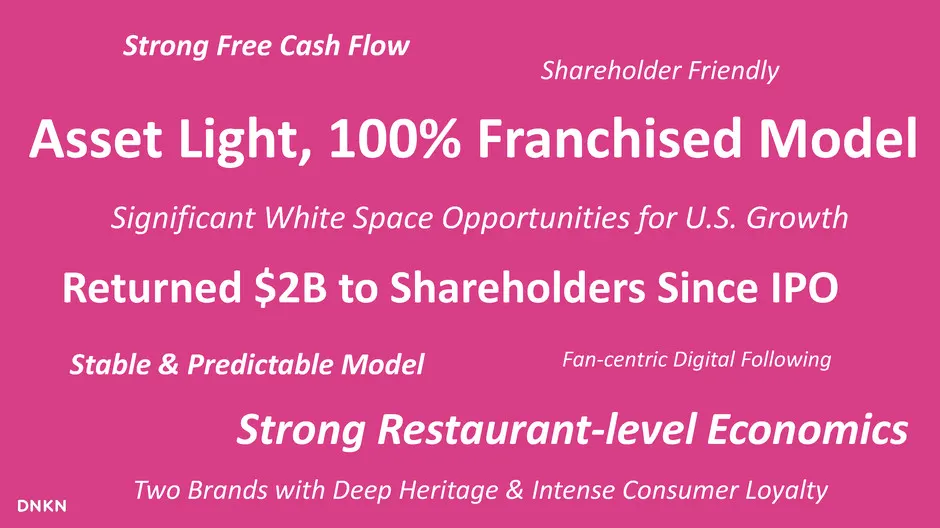
Asset Light, 100% Franchised Model Strong Free Cash Flow Shareholder Friendly Returned $2B to Shareholders Since IPO Two Brands with Deep Heritage & Intense Consumer Loyalty Significant White Space Opportunities for U.S. Growth Strong Restaurant-level Economics Stable & Predictable Model Fan-centric
Slide 10: Proud of Historical Global Development Growth; White Space Ahead
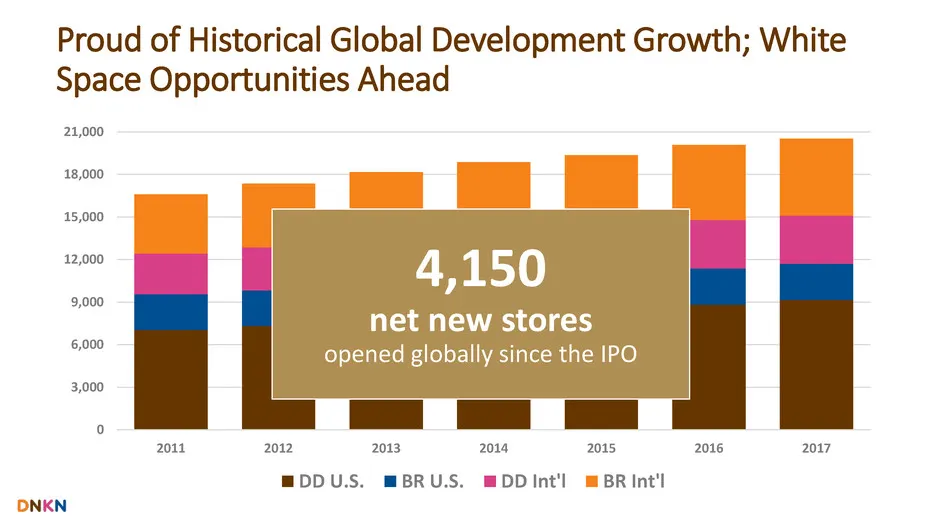
Proud of Historical Global Development Growth; White Space Opportunities Ahead 0 3,000 6,000 9,000 12,000 15,000 18,000 21,000 2011 2012 2013 2014 2015 2016 2017 DD U.S. BR U.S. DD Int'l BR Int'l 4,150 net new stores opened globally since the IPO
Slide 11: Driving Systemwide Sales Growth
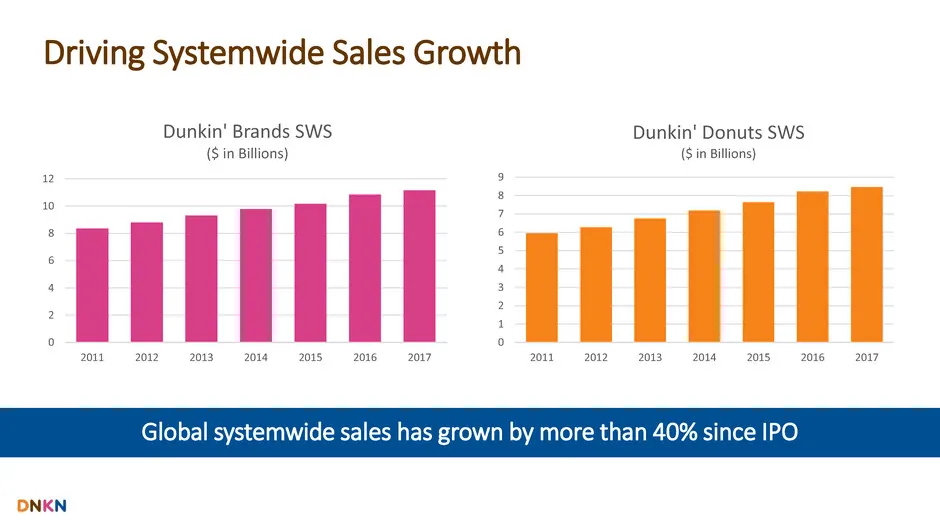
Driving Systemwide Sales Growth 0 2 4 6 8 10 12 2011 2012 2013 2014 2015 2016 2017 Dunkin' Brands SWS ($ in Billions) 0 1 2 3 4 5 6 7 8 9 2011 2012 2013 2014 2015 2016 2017 Dunkin' Donuts SWS ($ in Billions) Global systemwide sales has grown by more than 40% since IPO
Slide 12: Baskin-Robbins U.S.
Baskin-Robbins U.S.
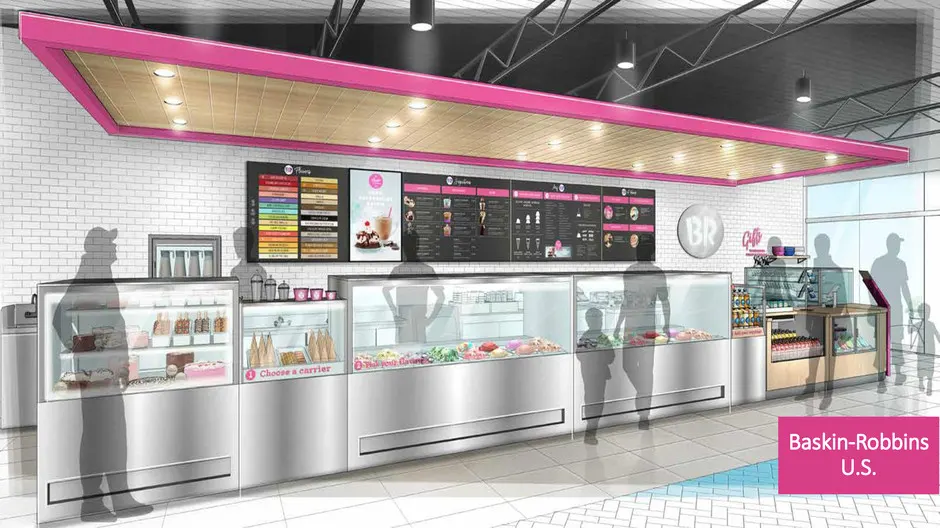
Slide 13: Baskin-Robbins U.S.
13 Baskin-Robbins U.S.

Slide 14: International
International DNKN
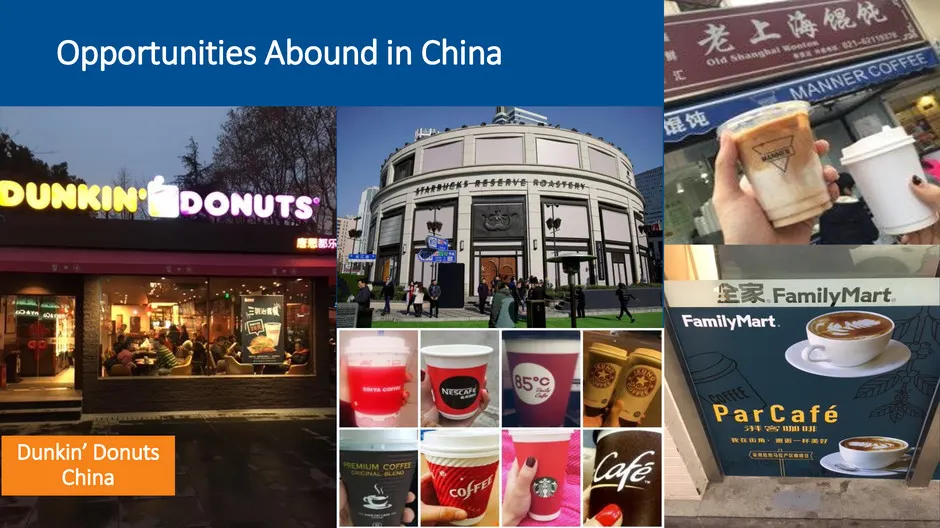
Slide 15: Dunkin' Donuts China
15 Dunkin’ Donuts China Opportunities Abound in China
Slide 16: Baskin-Robbins International
Baskin-Robbins International
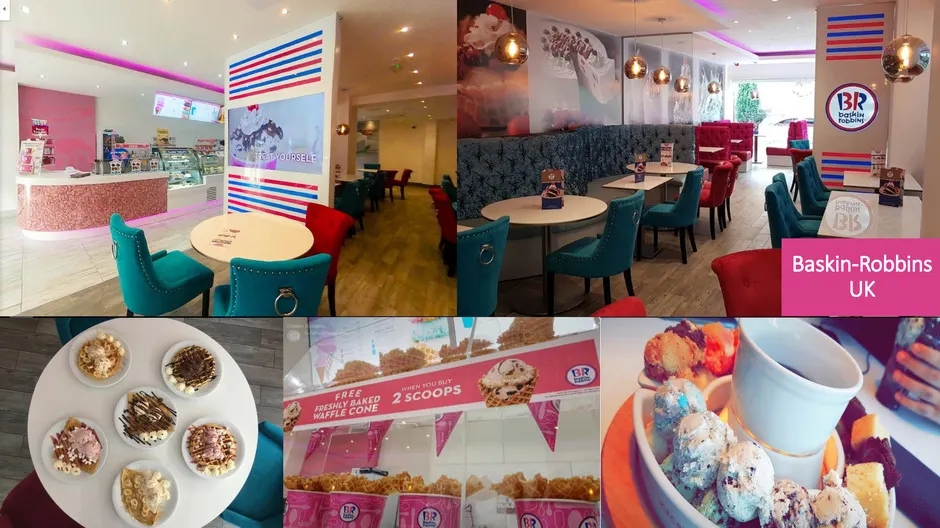
Slide 17: Baskin-Robbins UK
17 Baskin-Robbins UK
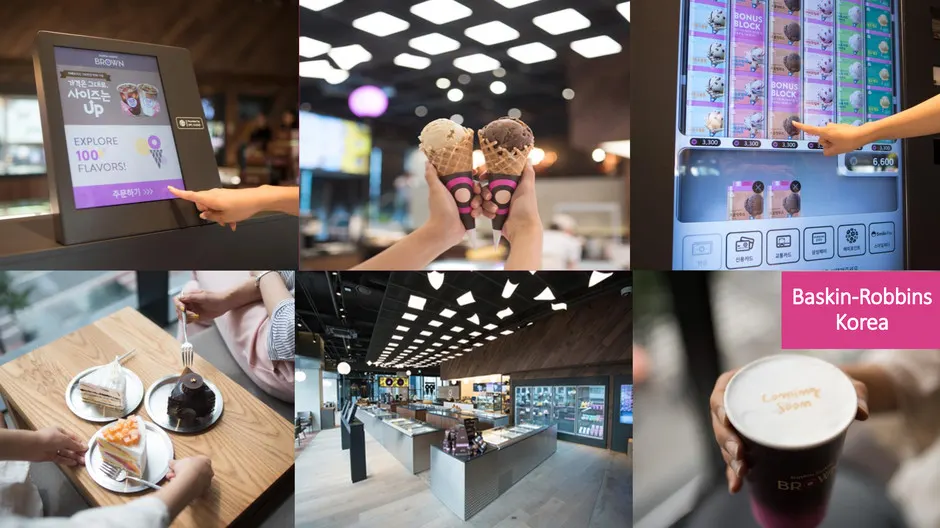
Slide 18: Baskin-Robbins Korea
Baskin-Robbins Korea
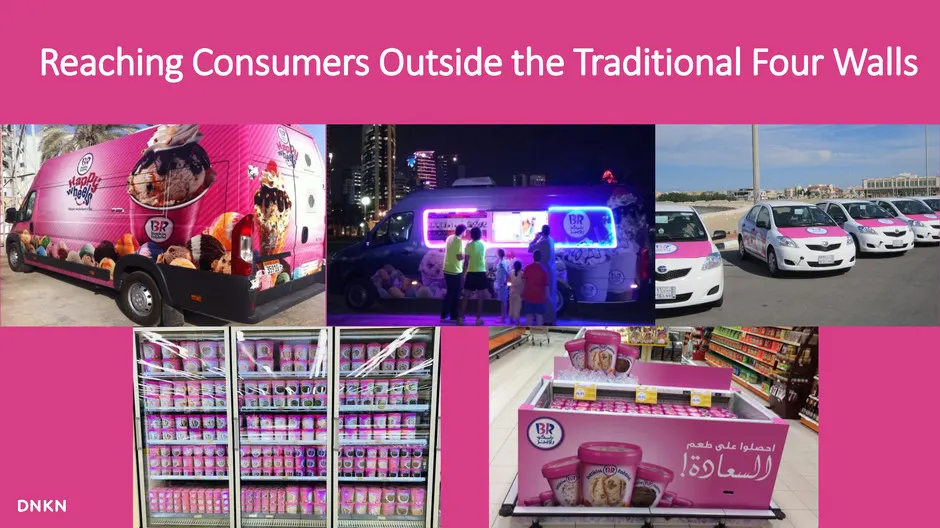
Slide 19: Reaching Consumers Outside the Traditional Four Walls
Reaching Consumers Outside the Traditional Four Walls

Slide 20: Dunkin' Donuts International
Dunkin’ Donuts International
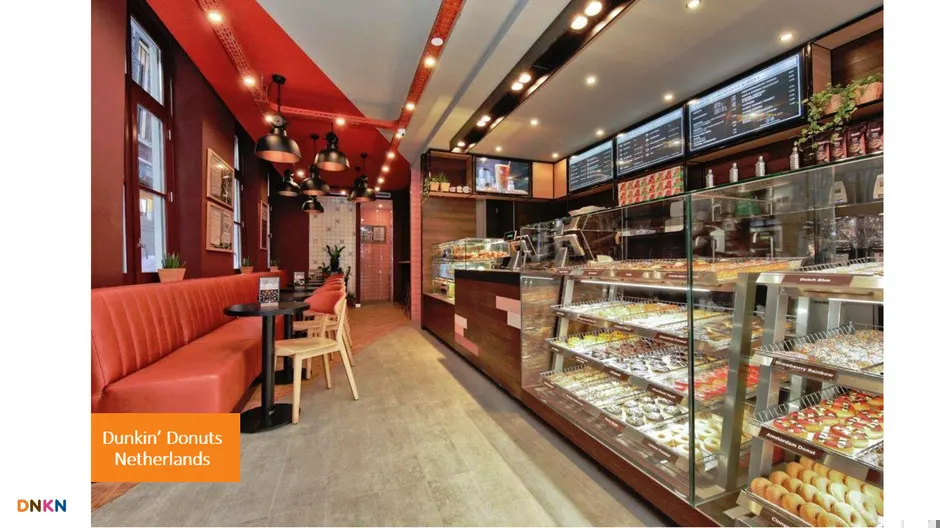
Slide 21: Dunkin' Donuts Netherlands
Dunkin’ Donuts Netherlands Fa
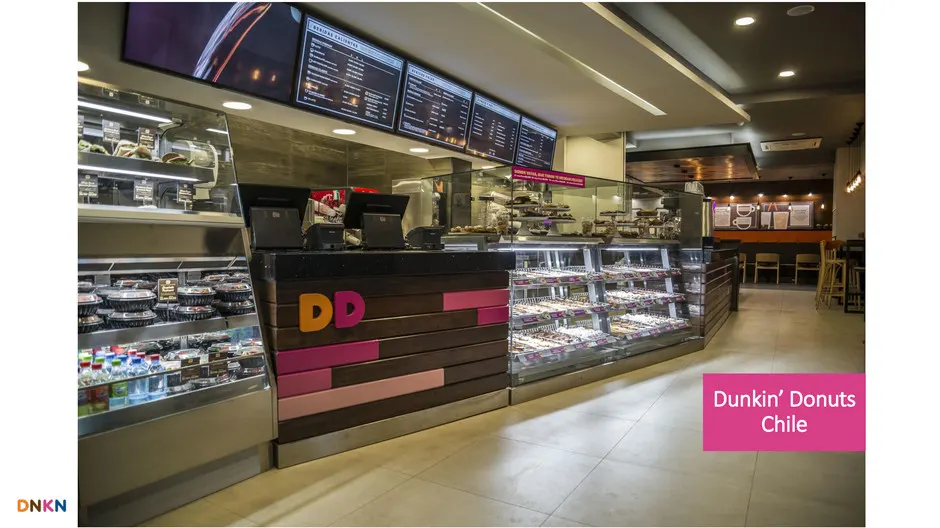
Slide 22: Dunkin' Donuts Chile
22 Dunkin’ Donuts Chile
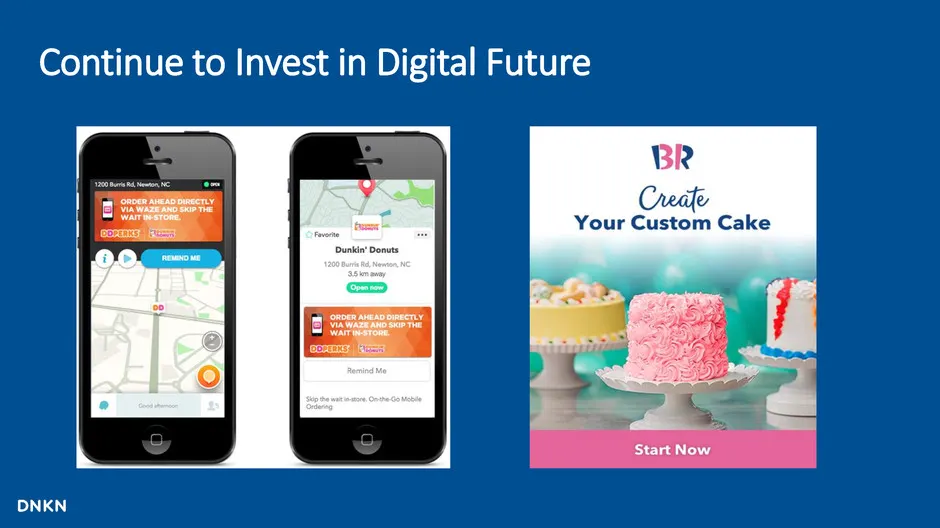
Slide 23: Continue to Invest in Digital Future
Continue to Invest in Digital Future
Slide 24: Looking Ahead
Looking Ahead Net Unit Development Blueprint for Growth CPG Digital
Slide 25: DD U.S. Blueprint for Growth
DD U.S. BLUEPRINT FOR GROWTH Dave Hoffmann, President of Dunkin’ Donuts U.S.
Slide 26: Year 1: Time to Make the Donuts
YEAR 1: TIME TO MAKE THE DONUTS Compelling business model • Strong unit economics • Record of delivering top shareholder value
Slide 27: Our Focus: Beverage-Led, On-the-Go
OUR FOCUS: BEVERAGE-LED, ON-THE-GO
Slide 28: Operationalizing Our Plan: Blueprint for Growth
OPERATIONALIZING OUR PLAN: BLUEPRINT FOR GROWTH
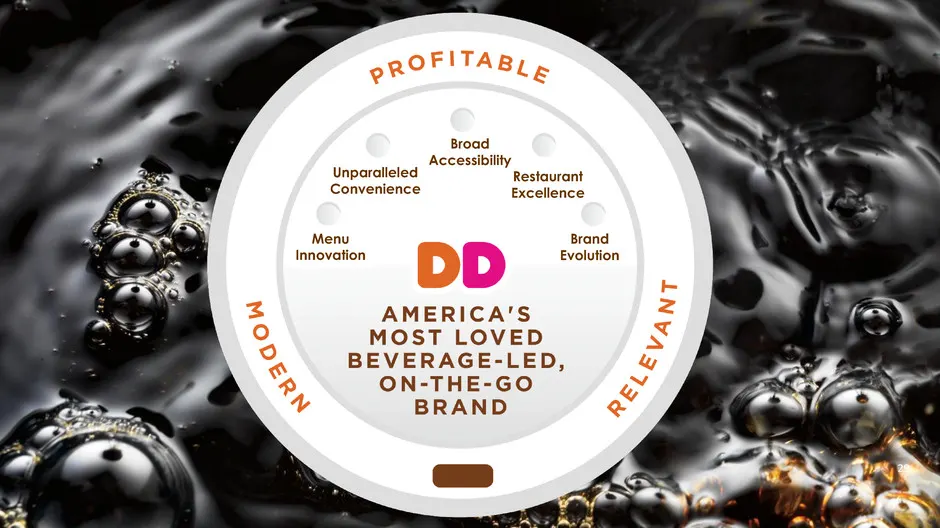
Slide 29: Brand Evolution Blueprint Pillars
29 Brand Evolution Menu Innovation Unparalleled Convenience Broad Accessibility AMER ICA ’ S M O S T L O V E D B E V E R A G E - L E D , O N - T H E - G O B R A N D Menu Innovation Restaurant Excellence Broad Accessibility Br nd luti Unparalleled Convenience
Slide 30: Dunkin' 2020
30 DUNKIN’ 2020
Slide 31: DD U.S. Same Store Sales
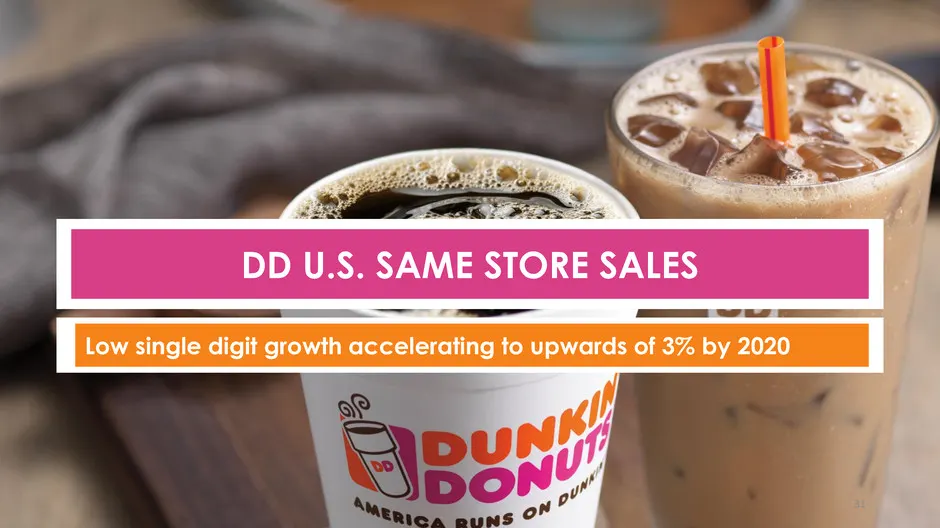
31 DD U.S. SAME STORE SALES Low single digit growth accelerating to upwards of 3% by 2020
Slide 32: Stabilize the Core and Innovation Priorities
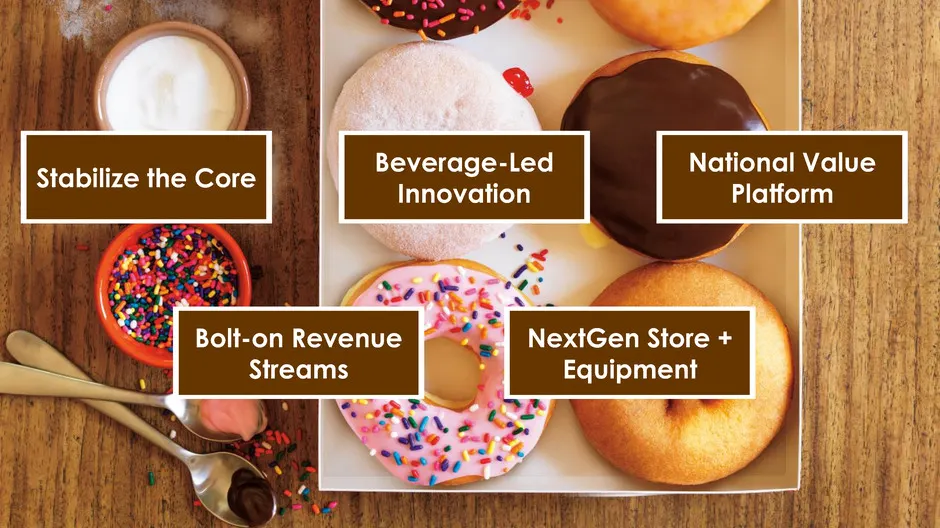
Stabilize the Core Beverage-Led Innovation National Value Platform Bolt-on Revenue Streams NextGen Store + Equipment
Slide 33: Consumer Packaged Goods
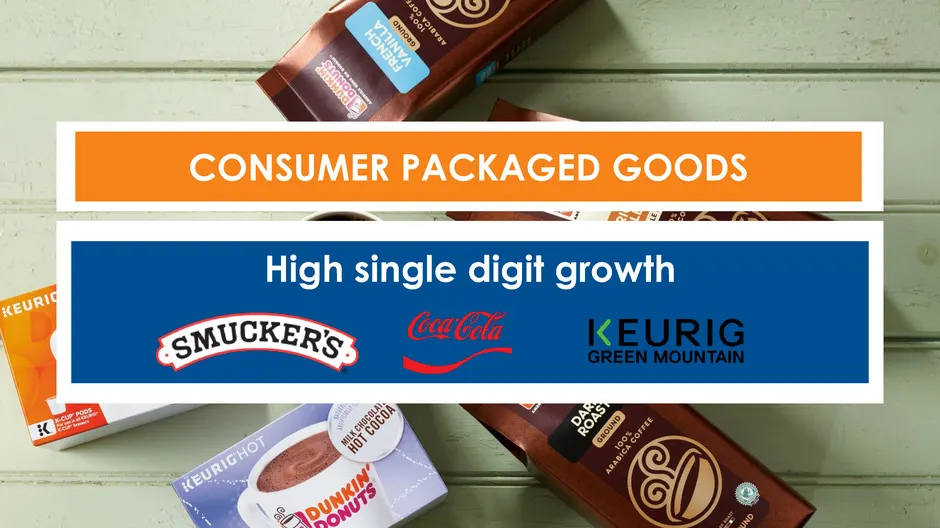
33 CONSUMER PACKAGED GOODS High single digit growth
Slide 34: DD U.S. Net Development
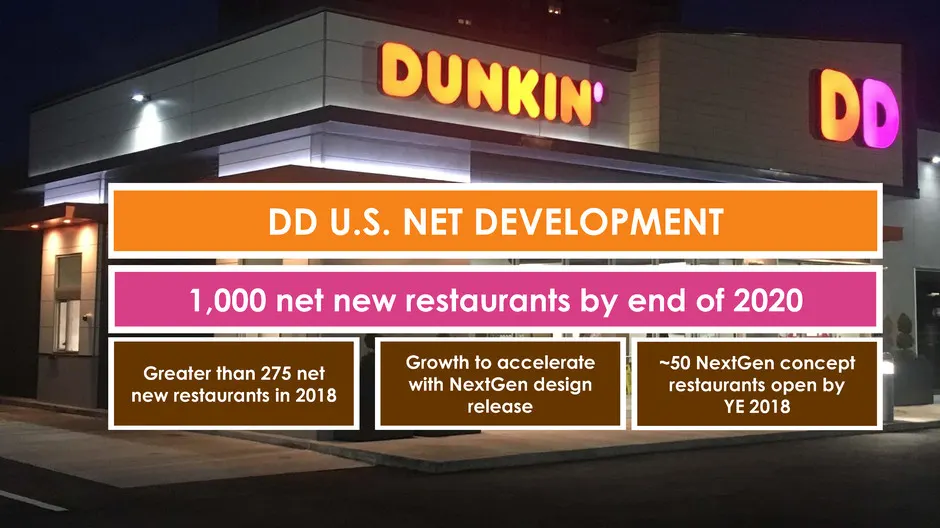
34 DD U.S. NET DEVELOPMENT 1,000 net new restaurants by end of 2020 Greater than 275 net new restaurants in 2018 Growth to accelerate with NextGen design release ~50 NextGen concept restaurants open by YE 2018
Slide 35: DD U.S. Restaurant Expansion
DD U.S. RESTAURANT EXPANSION
Slide 36: Dunkin' Development Map
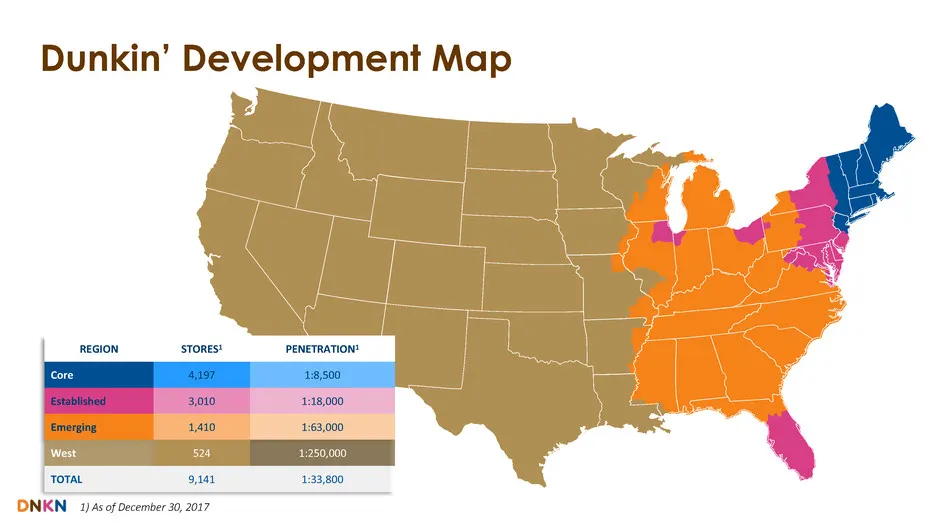
REGION STORES1 PENETRATION1 Core 4,197 1:8,500 Established 3,010 1:18,000 Emerging 1,410 1:63,000 West 524 1:250,000 TOTAL 9,141 1:33,800 Dunkin’ Development Map 1) As of December 30, 2017
Slide 37: Different Development Strategies for Different Markets
DIFFERENT DEVELOPMENT STRATEGIES FOR DIFFERENT MARKETS
Slide 38: Development Strategy: Northeast
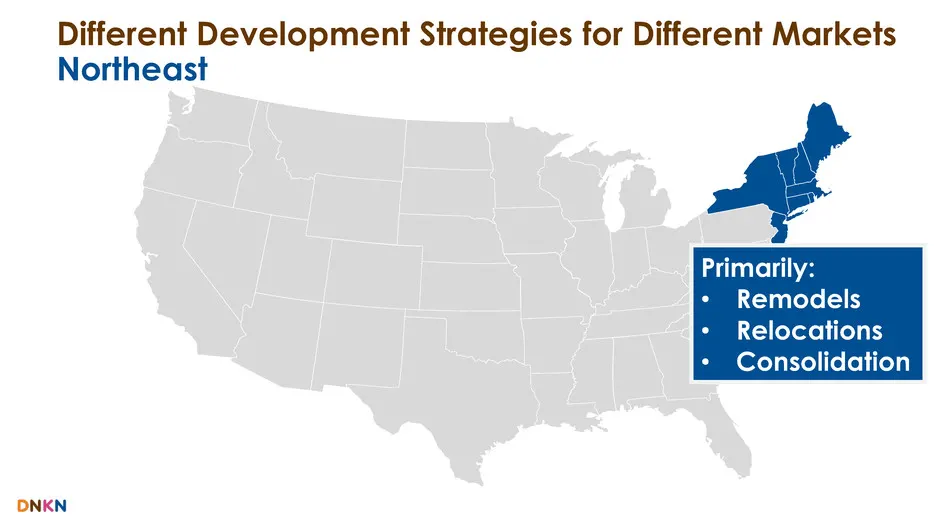
Different Development Strategies for Different Markets Northeast Primarily: • Remodels • Relocations • Consolidation
Slide 39: Development Strategy: East of the Mississippi
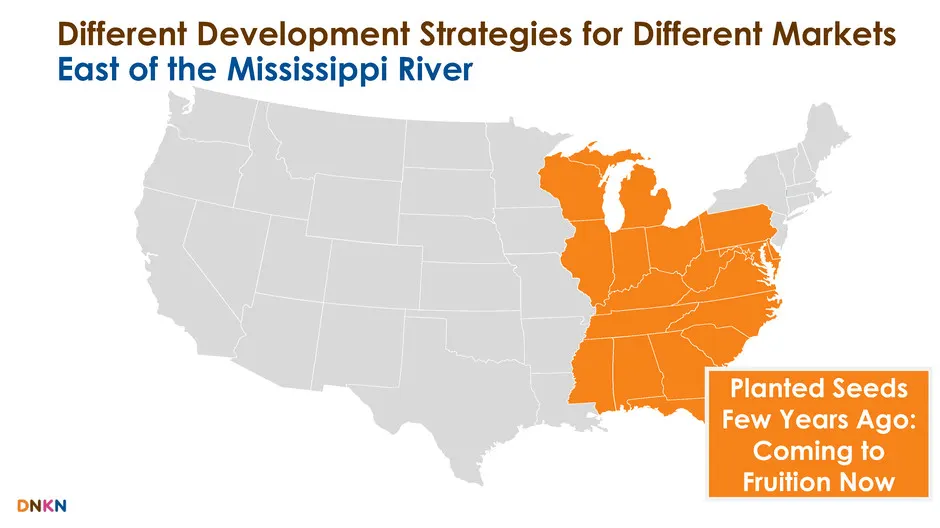
Different Development Strategies for Different Markets East of the Mississippi River Planted Seeds Few Years Ago: Coming to Fruition Now
Slide 40: Development Strategy: West of the Mississippi
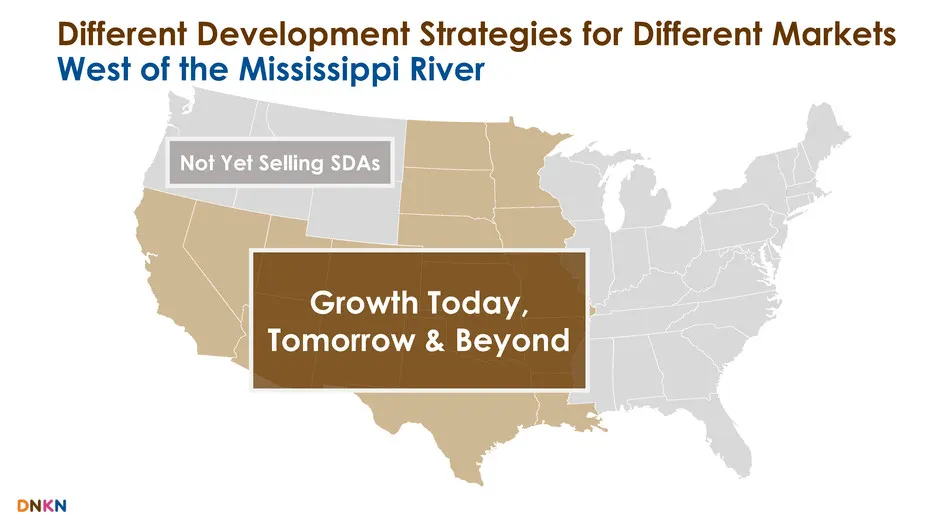
Different Development Strategies for Different Markets West of the Mississippi River Growth Today, Tomorrow & Beyond Not Yet Selling SDAs
Slide 41: West Development and Expected Cash-on-Cash Returns
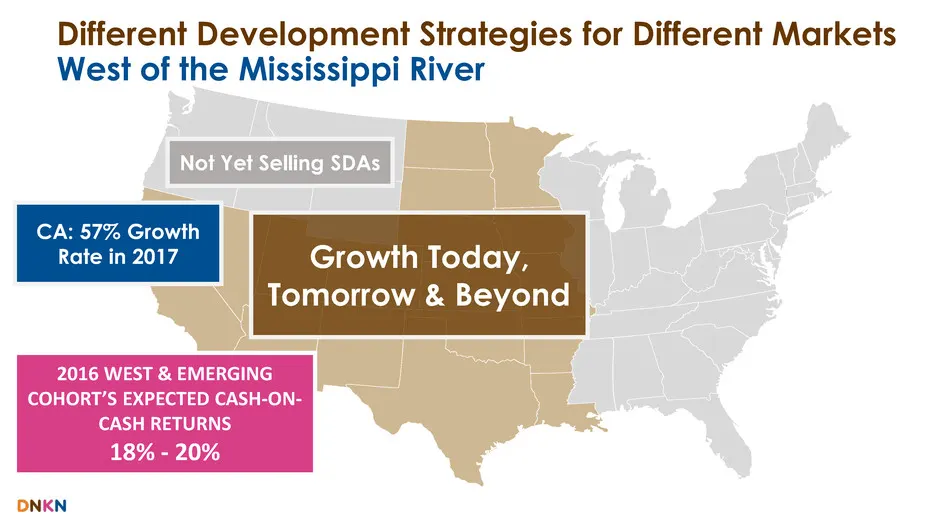
Different Development Strategies for Different Markets West of the Mississippi River CA: 57% Growth Rate in 2017 Not Yet Selling SDAs Growth Today, Tomorrow & Beyond 2016 WEST & EMERGING COHORT’S EXPECTED CASH-ON- CASH RETURNS 18% - 20%
Slide 42: Dunkin' of the Future
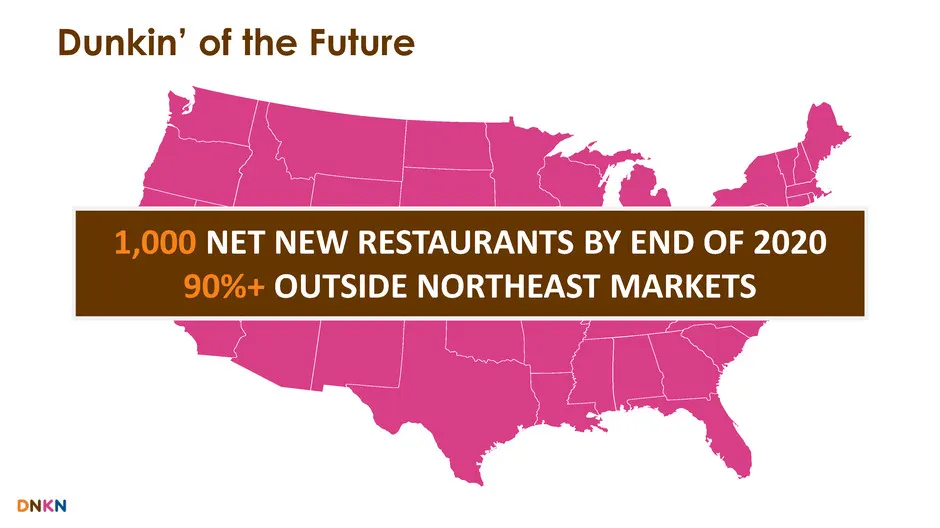
Dunkin’ of the Future 1,000 NET NEW RESTAURANTS BY END OF 2020 90%+ OUTSIDE NORTHEAST MARKETS
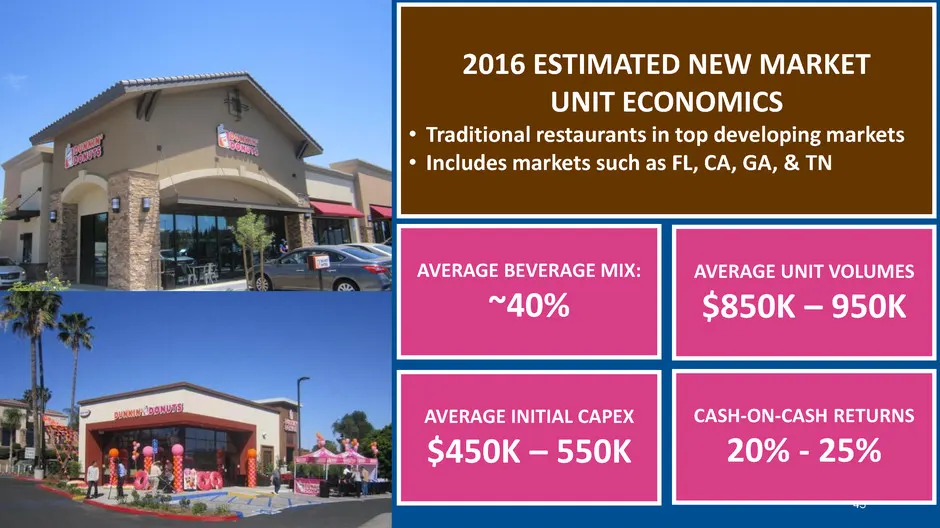
Slide 43: 2016 Estimated New Market Unit Economics
43 2016 ESTIMATED NEW MARKET UNIT ECONOMICS • Traditional restaurants in top developing markets • Includes markets such as FL, CA, GA, & TN AVERAGE BEVERAGE MIX: ~40% AVERAGE INITIAL CAPEX $450K – 550K AVERAGE UNIT VOLUMES $850K – 950K CASH-ON-CASH RETURNS 20% - 25%
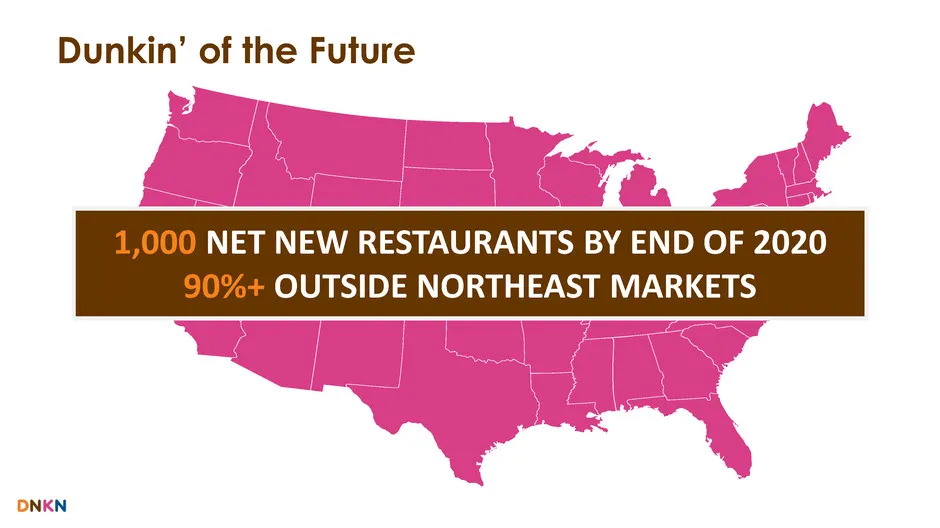
Slide 44: Dunkin' of the Future
Dunkin’ of the Future 1,000 NET NEW RESTAURANTS BY END OF 2020 90%+ OUTSIDE NORTHEAST MARKETS
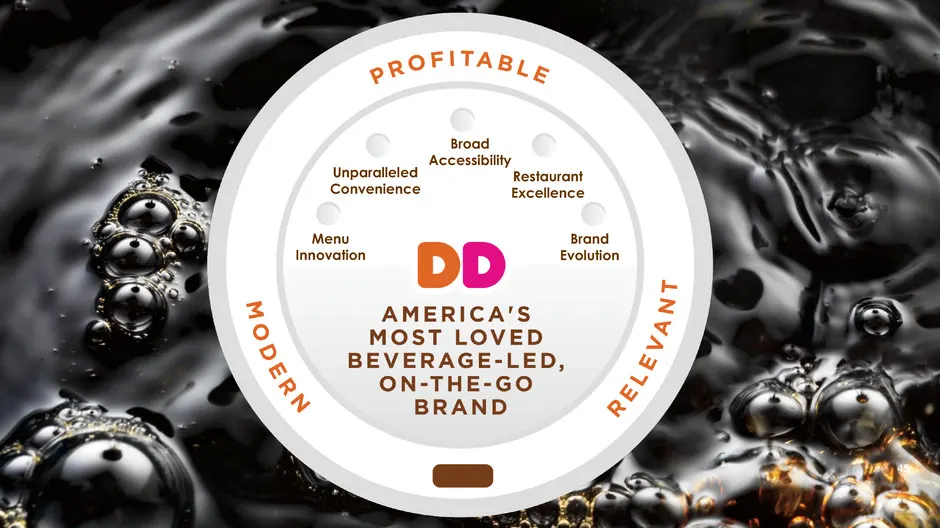
Slide 45: Brand Evolution Blueprint Pillars
45 Brand Evolution Menu Innovation Unparalleled Convenience Broad Accessibility AMER ICA ’ S M O S T L O V E D B E V E R A G E - L E D , O N - T H E - G O B R A N D Menu Innovation Restaurant Excellence Broad Accessibility Br nd luti Unparalleled Convenience
Slide 46: DD U.S. Operations: Restaurant Excellence
DD U.S. Operations: Restaurant Excellence Scott Murphy, COO
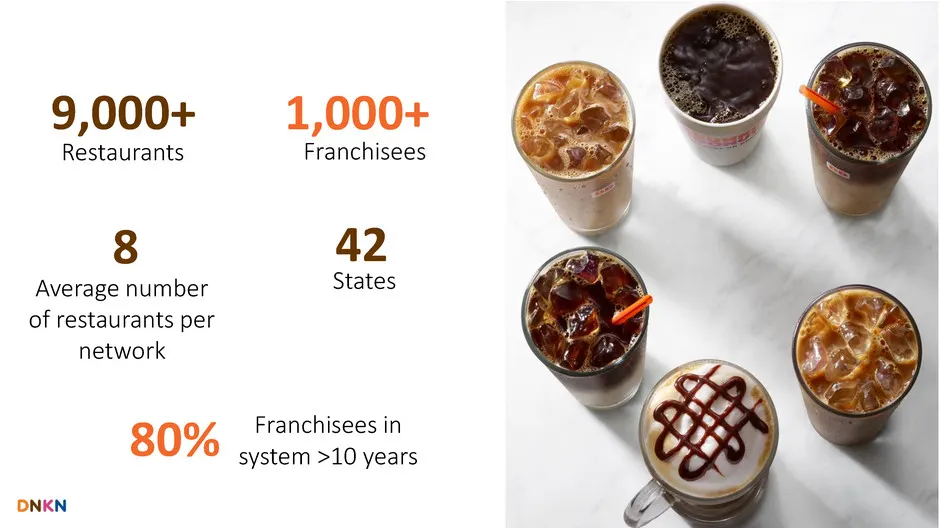
Slide 47: 9,000+ 1,000+ Restaurants Franchisees States 80% Average number of restaurants per network Franchisees in
9,000+ 1,000+ Restaurants Franchisees States 428 80% Average number of restaurants per network Franchisees in system >10 years
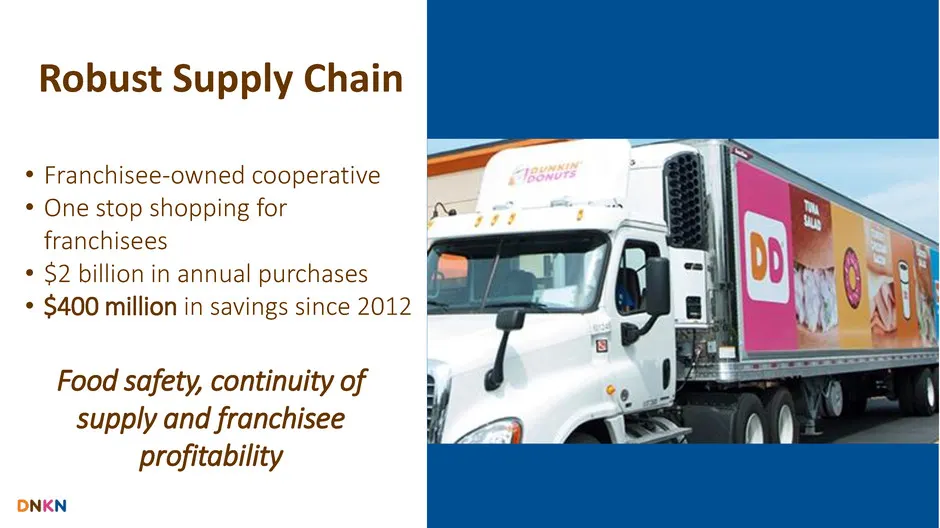
Slide 48: Robust Supply Chain
Robust Supply Chain • Franchisee-owned cooperative • One stop shopping for franchisees • $2 billion in annual purchases • $400 million in savings since 2012 Food safety, continuity of supply and franchisee profitability
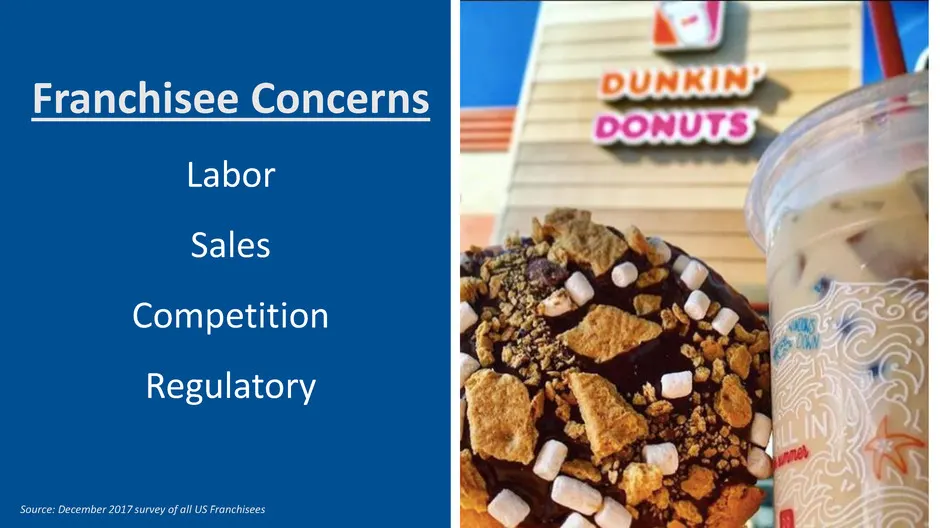
Slide 49: Franchisee Concerns
49 Franchisee Concerns Labor Sales Competition Regulatory Source: December 2017 survey of all US Franchisees
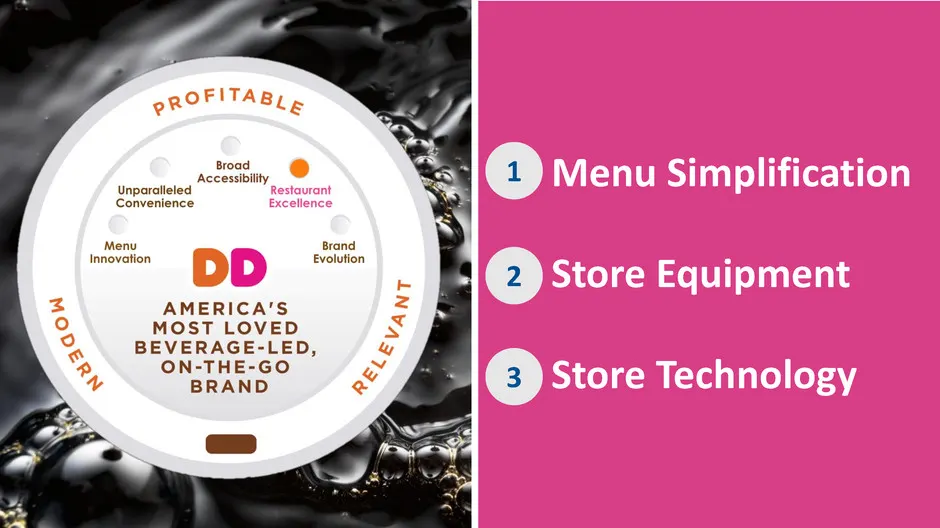
Slide 50: Menu Simplification, Store Equipment, Store Technology
Menu Simplification Store Equipment Store Technology 1 2 3
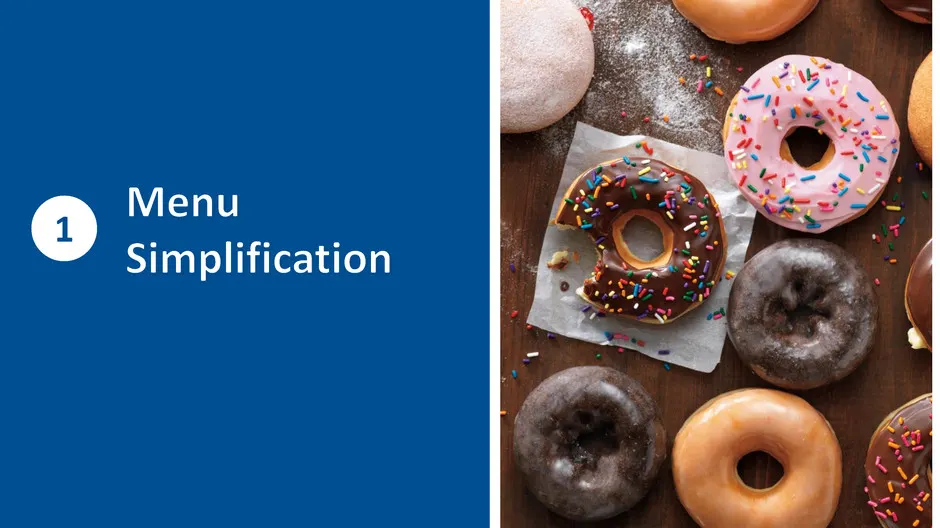
Slide 51: Menu Simplification
ion Menu Simplificat
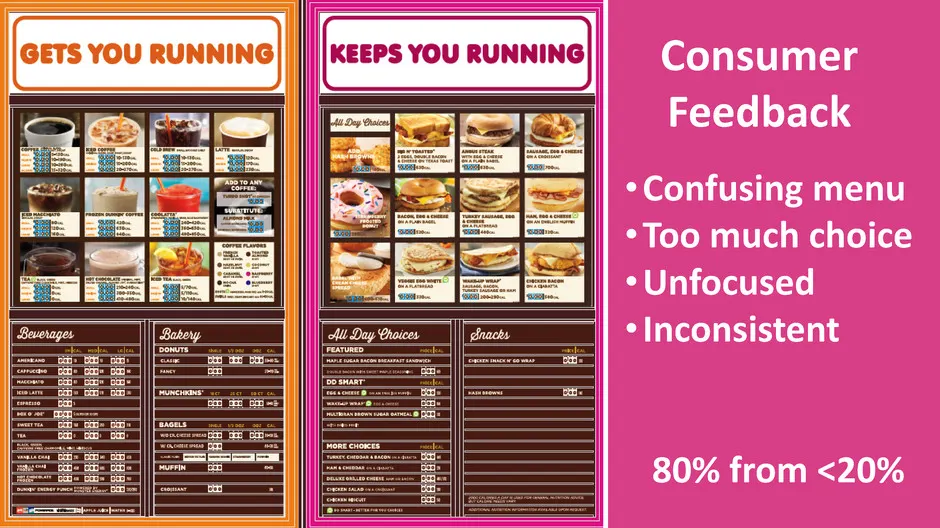
Slide 52: Consumer Feedback
•Confusing menu •Too much choice •Unfocused •Inconsistent 80% from <20% Consumer Feedback
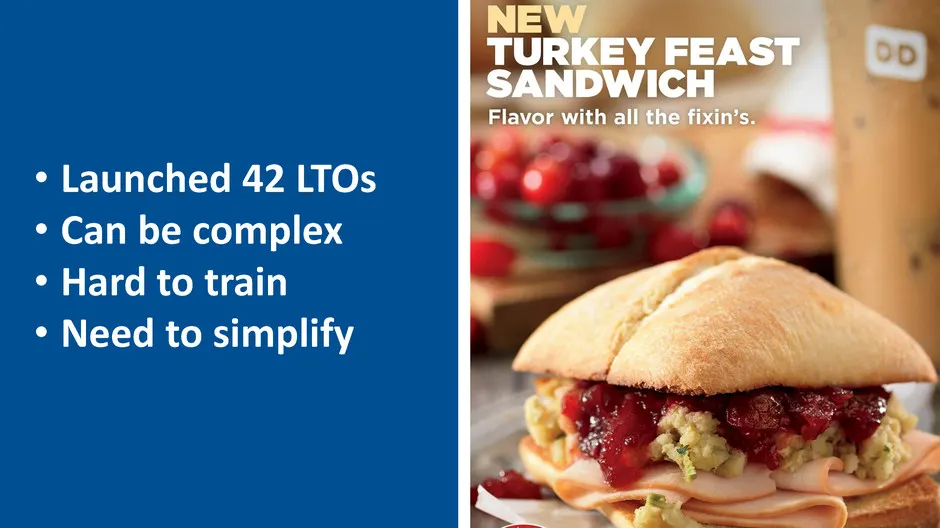
Slide 53: • Launched LTOs • Can be complex • Hard to train • Need to
53 • Launched 42 LTOs • Can be complex • Hard to train • Need to simplify
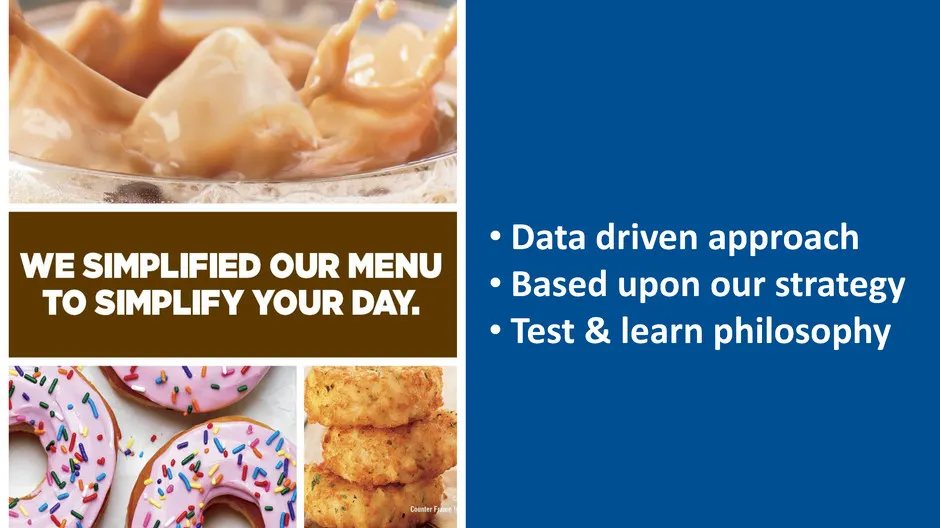
Slide 54: • Data driven approach • Based upon our strategy • Test & learn philosophy
• Data driven approach • Based upon our strategy • Test & learn philosophy
Slide 55: Menu Simplification
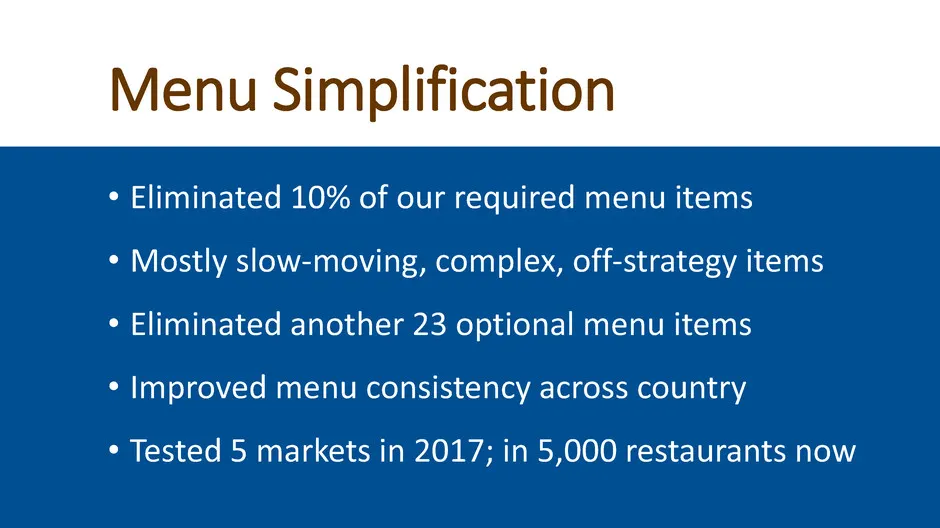
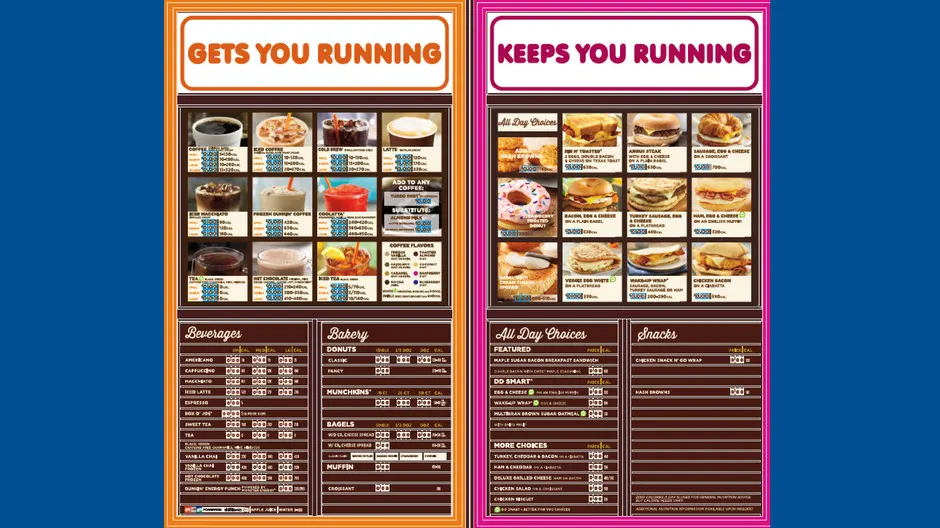
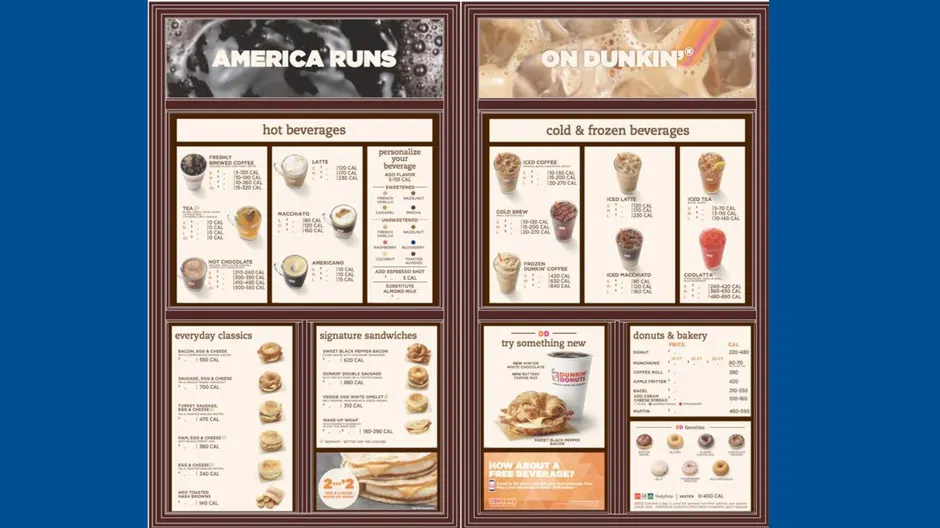
Menu Simplification • Eliminated 10% of our required menu items • Mostly slow-moving, complex, off-strategy items • Eliminated another 23 optional menu items • Improved menu consistency across country • Tested 5 markets in 2017; in 5,000 restaurants now
Slide 56: We trained crews to suggest replacements
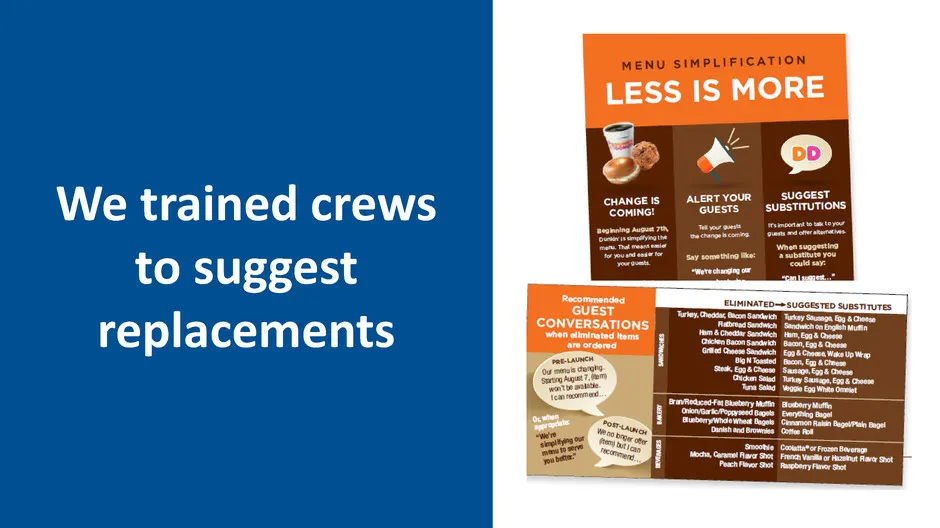
We trained crews to suggest replacements
Slide 57
Slide 58
Slide 59: Expected Impact of Menu Simplification
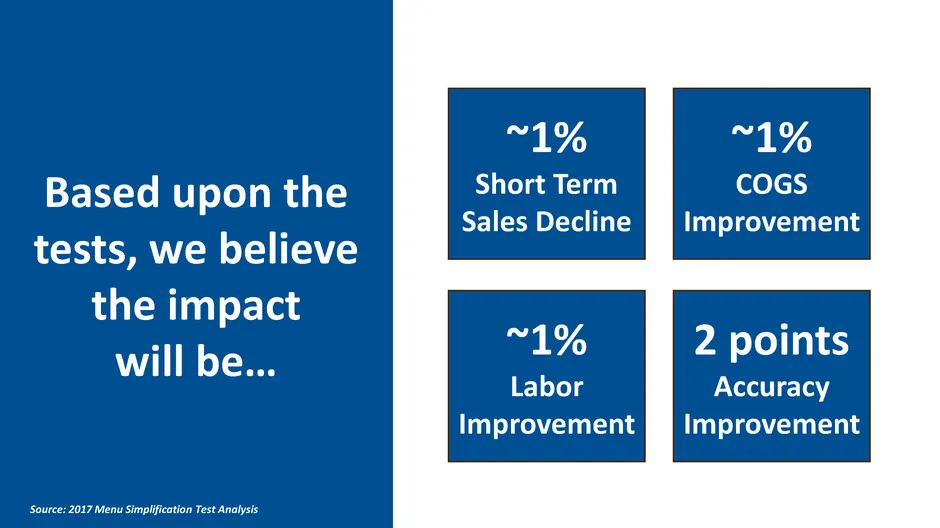
Based upon the tests, we believe the impact will be… ~1% Short Term Sales Decline ~1% COGS Improvement ~1% Labor Improvement 2 points Accuracy Improvement Source: 2017 Menu Simplification Test Analysis
Slide 60: The crew is happy
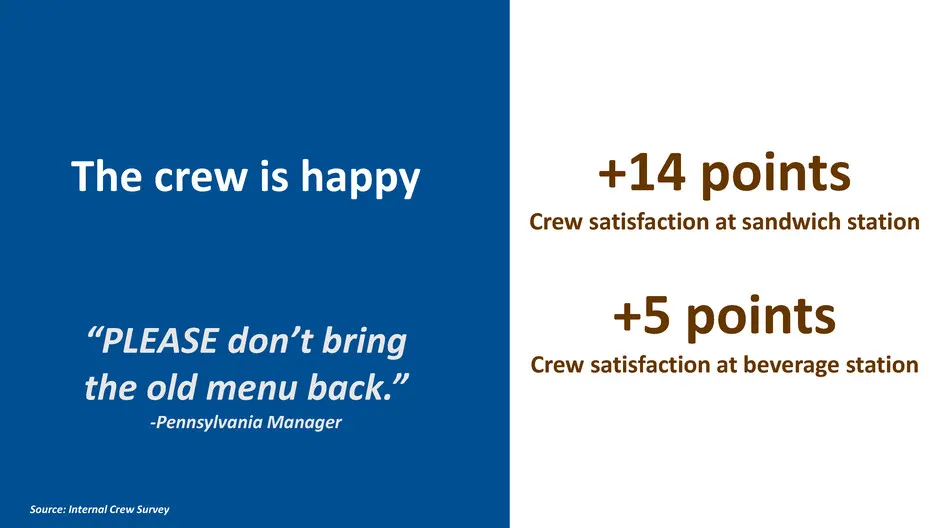
The crew is happy “PLEASE don’t bring the old menu back.” -Pennsylvania Manager +14 points Crew satisfaction at sandwich station +5 points Crew satisfaction at beverage station Source: Internal Crew Survey
Slide 61: minutes per day of labor savings hours per week redeployed on guest experience And
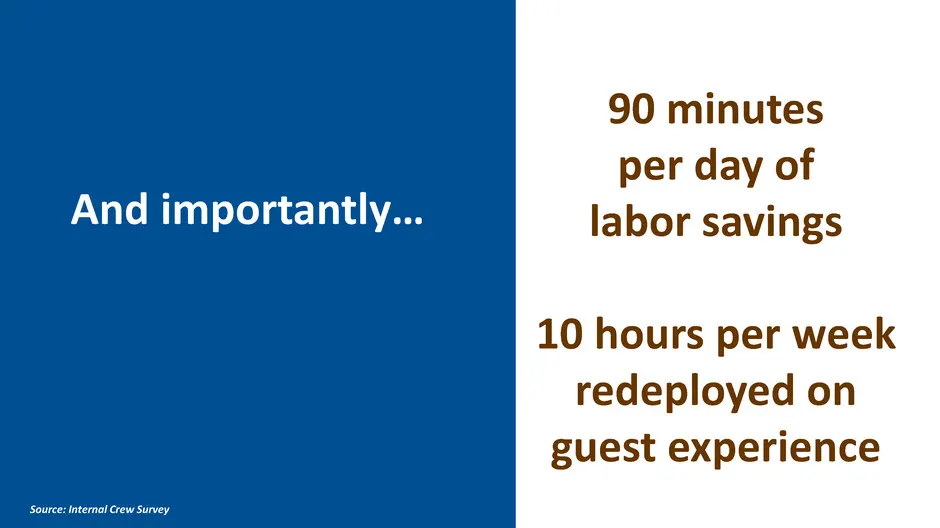
90 minutes per day of labor savings 10 hours per week redeployed on guest experience And importantly… Source: Internal Crew Survey
Slide 62: Menu Simplification
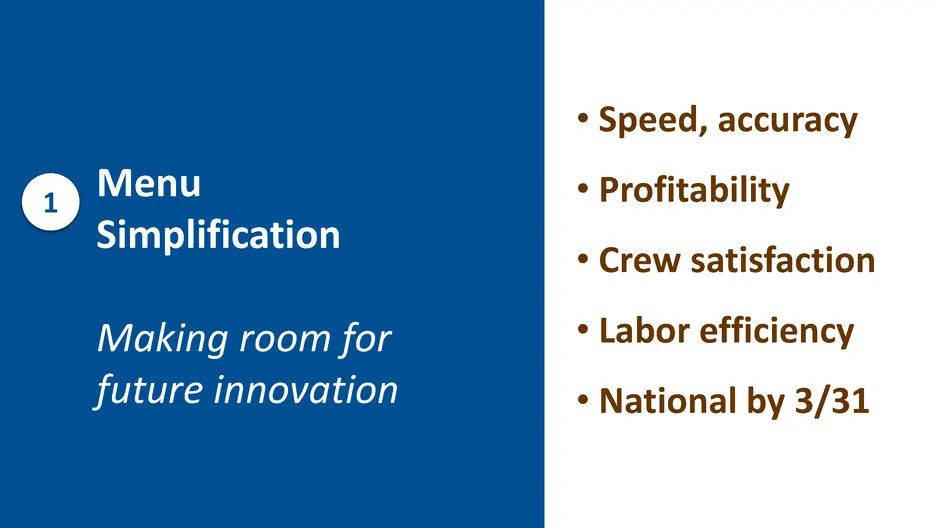
• Speed, accuracy • Profitability • Crew satisfaction • Labor efficiency • National by 3/31 Menu Simplification Making room for future innovation 1
Slide 63: Store Equipment
Store Equipment2
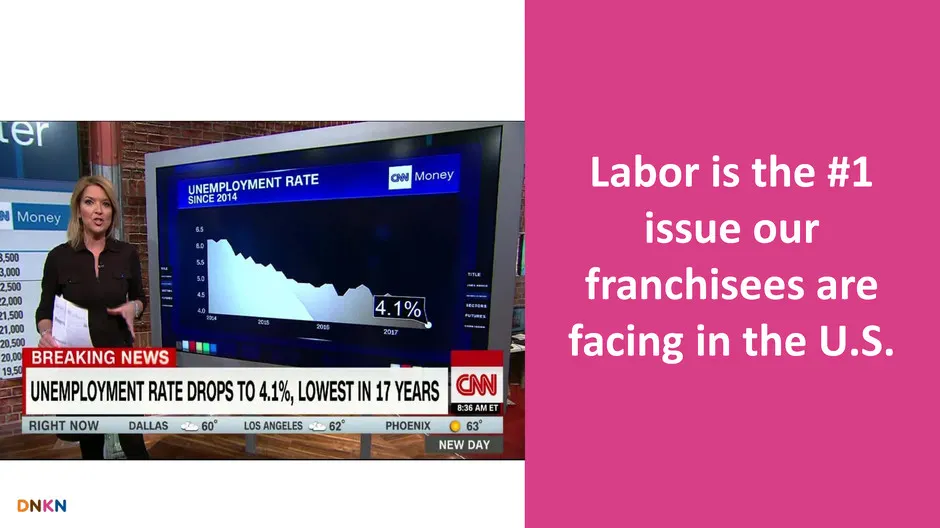
Slide 64: Labor is the #1 issue franchisees face
Labor is the #1 issue our franchisees are facing in the U.S.
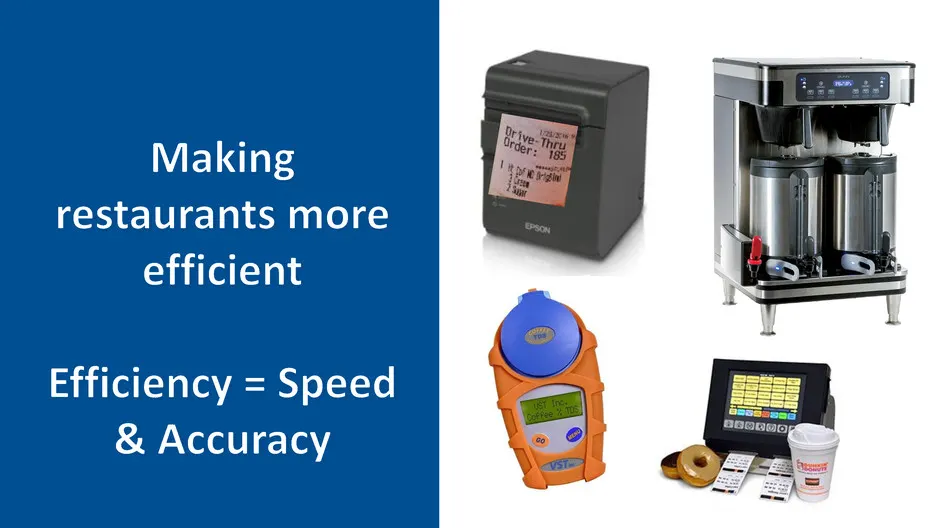
Slide 65: Making restaurants more efficient
Making restaurants more efficient Efficiency = Speed & Accuracy
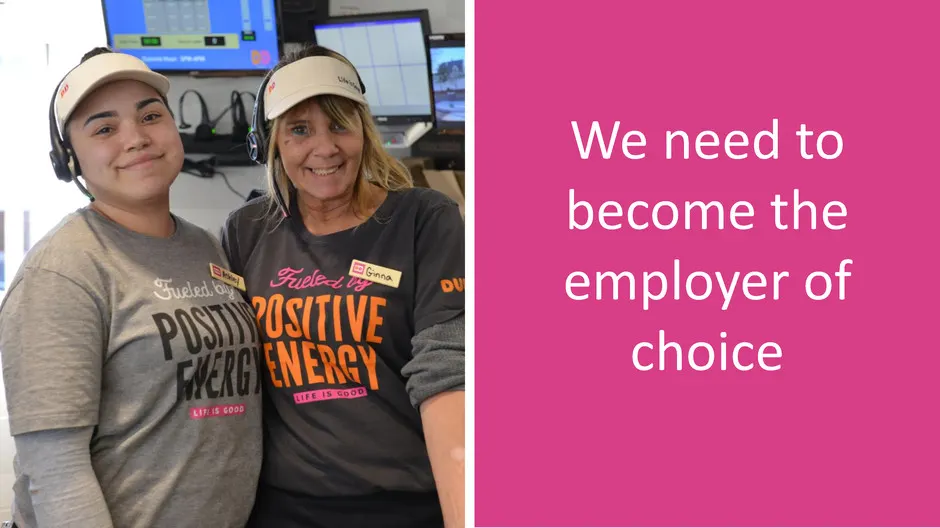
Slide 66: We need to become the employer of choice
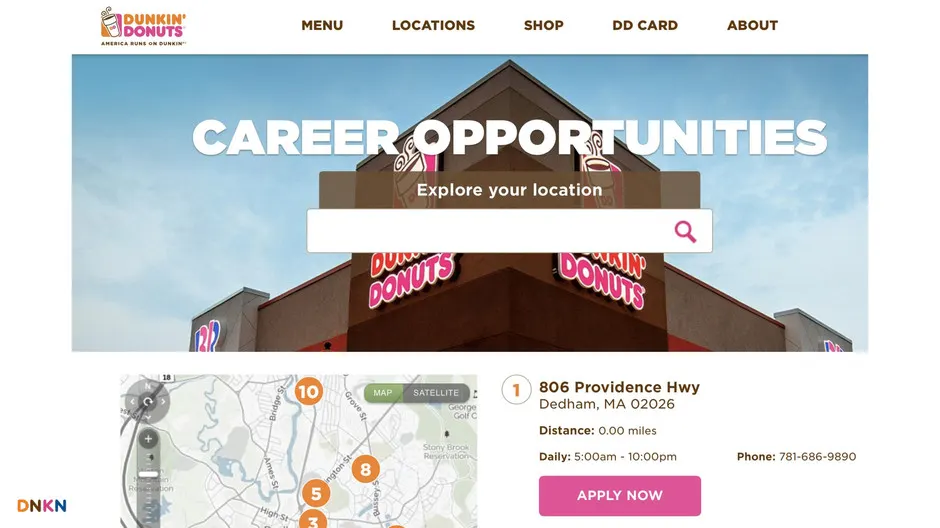
We need to become the employer of choice
Slide 67: MENU LOCATIONS SHOP DD CARD ABOUT
MENU LOCATIONS SHOP DD CARD ABOUT — 5 © Cm: (1) 806 Providence Hwy § 5 Dedham, MA 02026 [ . Distance: 0.00 miles fe) Daily: 5:00am - 10:00pm Phone: 781-686-9890 DNKN o
Slide 68: People First Culture
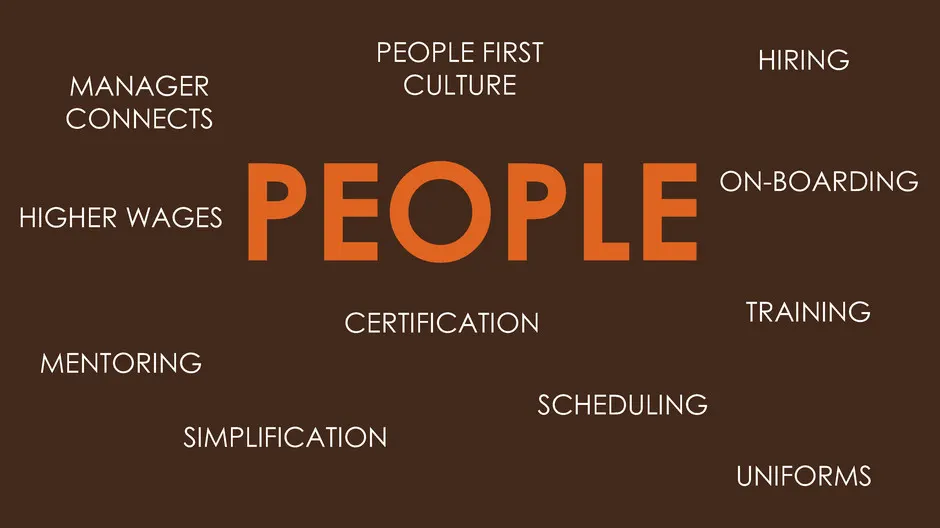
CERTIFICATION PEOPLE PEOPLE FIRST CULTURE MENTORING HIRING ON-BOARDING UNIFORMS HIGHER WAGES SIMPLIFICATION SCHEDULING MANAGER CONNECTS TRAINING
Slide 69: Store Technology
Store Technology 3

Slide 70: We are world class at speed; we need to be accurate
We are world class at speed We need to be accurate as well
Slide 71: New store technology solution
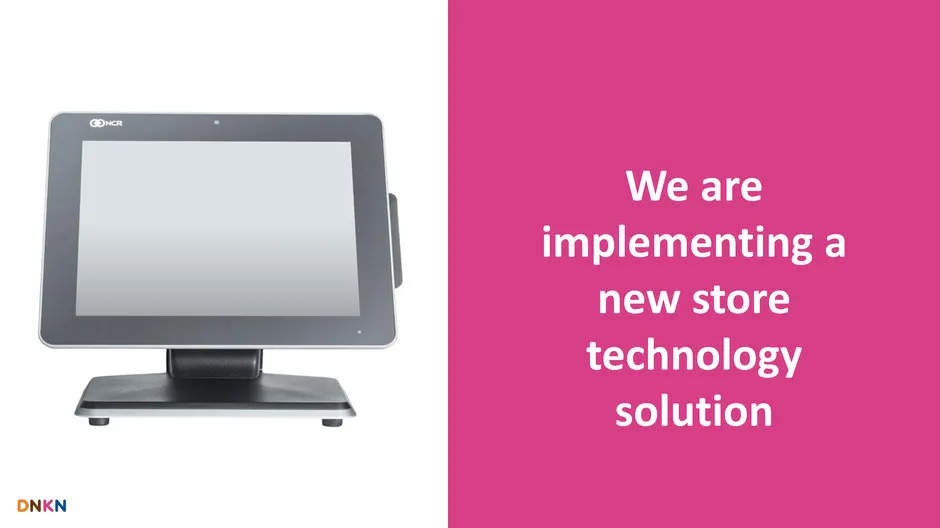
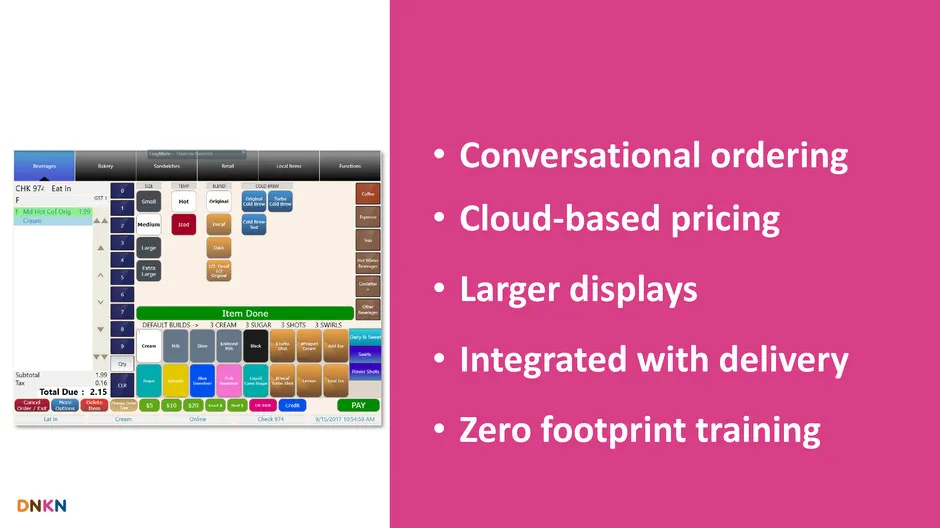
We are implementing a new store technology solution
Slide 72: • Conversational ordering • Cloud-based pricing • Larger displays • Integrated with delivery •
• Conversational ordering • Cloud-based pricing • Larger displays • Integrated with delivery • Zero footprint training
Slide 73: Improved Tools
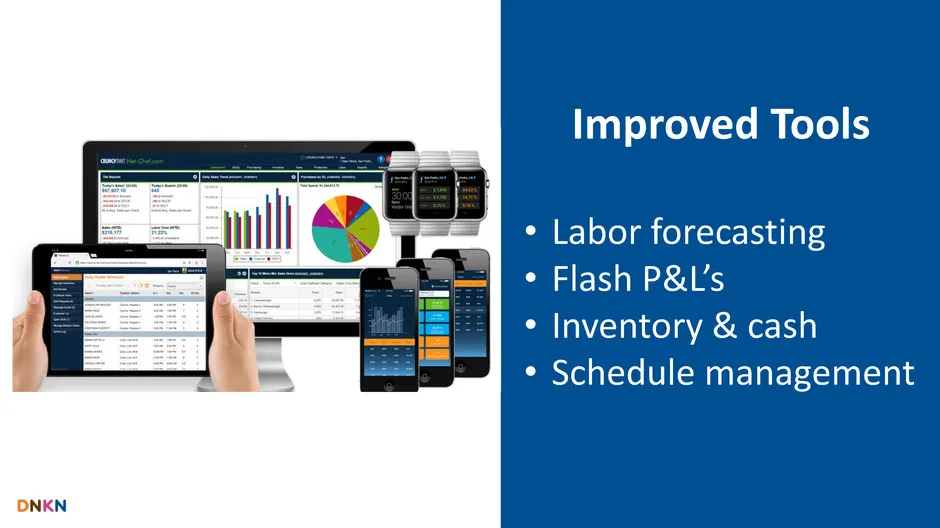
Improved Tools • Labor forecasting • Flash P&L’s • Inventory & cash • Schedule management
Slide 74: Restaurant Excellence Initiatives
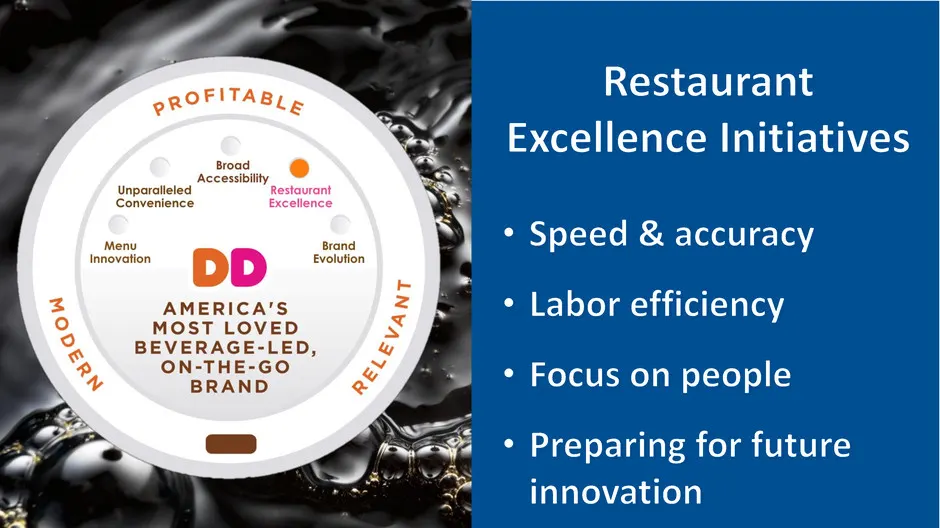
Restaurant Tl Excellence Initiatives pROFITAB, Broad Accessibility Unparalleled R Convenience 5 * Speed & accuracy Brand inven DD fvoltion 3 AMERICA'S * Labor efficiency ° MOST LOVED &. BEVERAGE-LED, 2 % ONSRAND “ ° Focus on people Wr : ap #4 ° Preparing for future “innovation
Slide 75: Franchise Profitability, Guest Experience
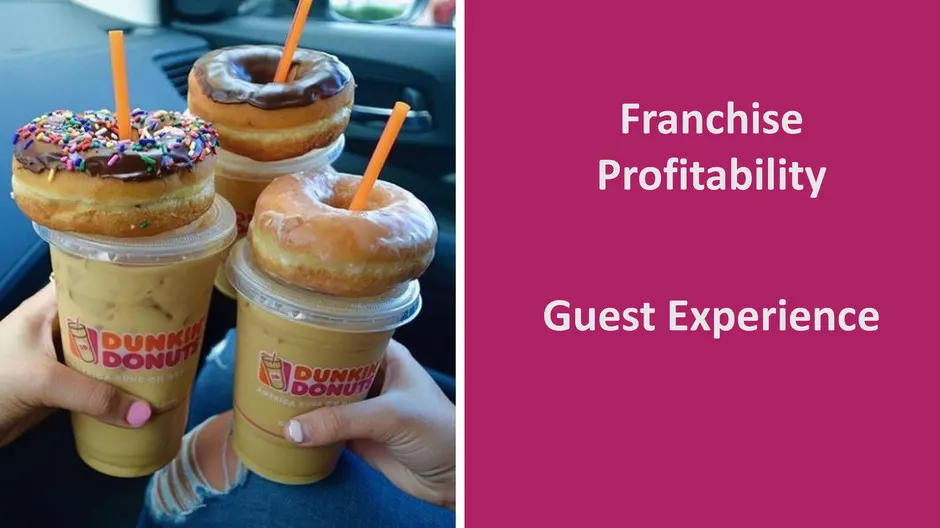
Franchise Profitability Guest Experience
Slide 76: Marketing Vision for Growth
Marketing Vision for Growth Tony Weisman, CMO 76
Slide 77
Slide 78: Fallon Tonight
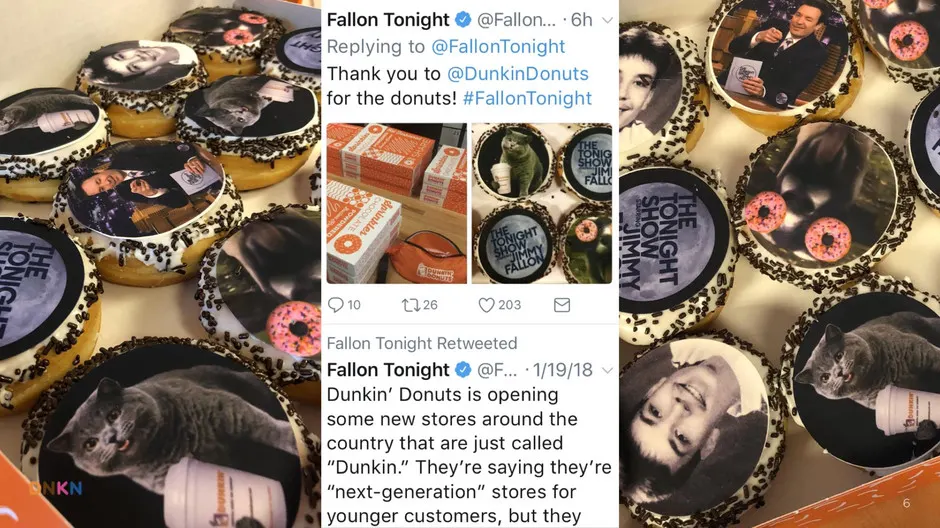
Fallon Tonight & Replying to a Thank you to for the donuts! Fallon Tonight 1/19 Dunkin’ Donuts is opening some new stores around the country that are just called “Dunkin.” They‘re saying they're “next-generation” stores for younger custom but they
Slide 79
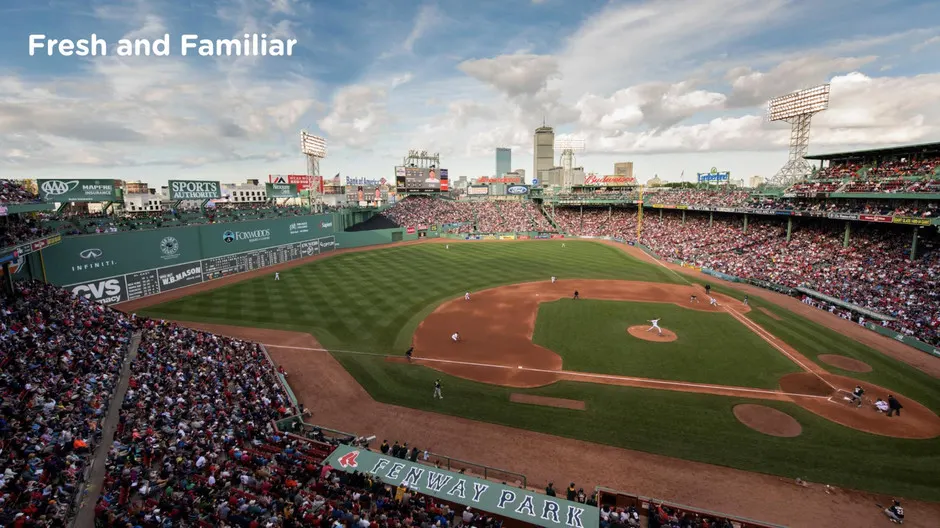
Slide 80
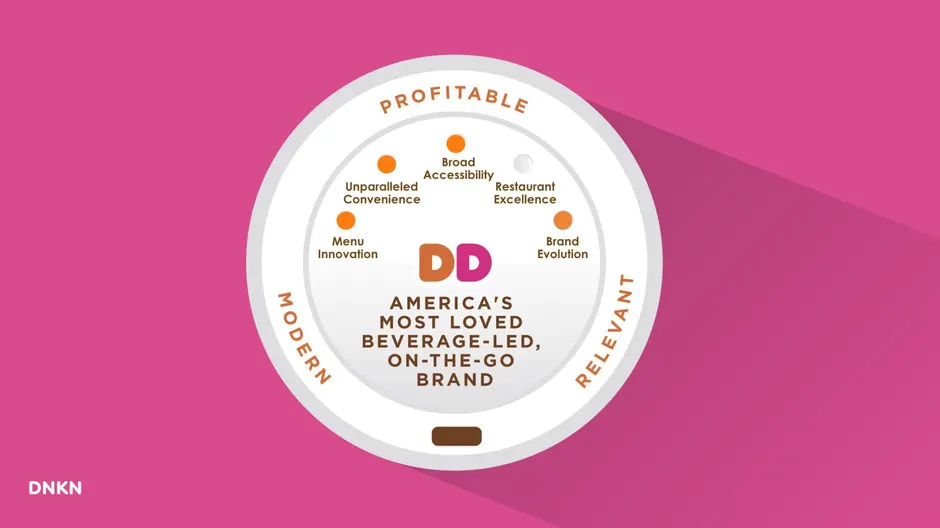
Slide 81: DNKN
DNKN pROFITABy Broad Accessibility Unparalleled Restaurant Convenience Excellence ‘Menu Brand DD Evolution AMERICA'S
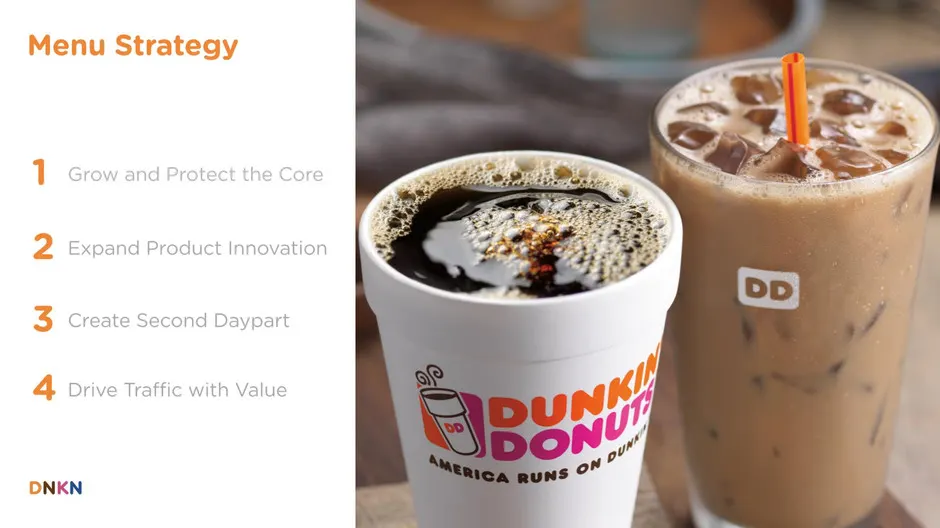
Slide 82: Expand Product Innovation
Expand Product Innovation Create Second Daypart Drive Traffic with Value
Slide 83: 83
83
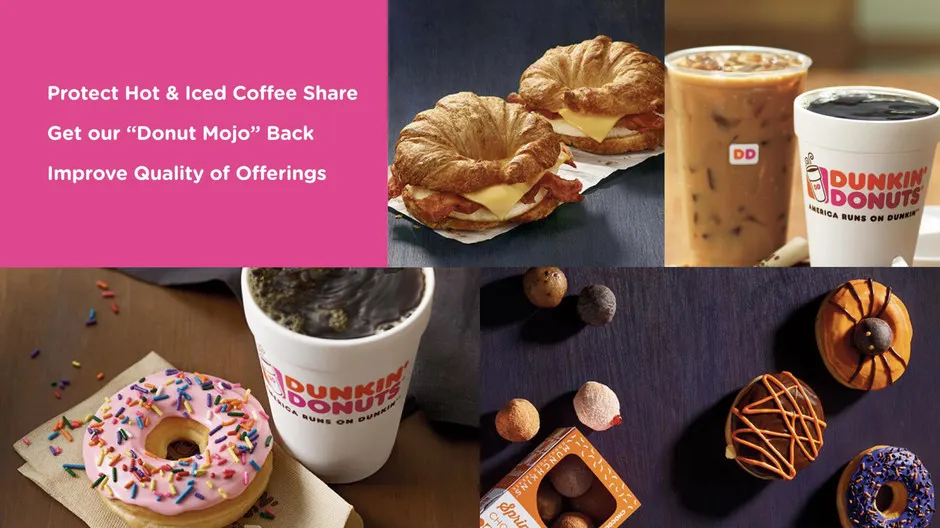
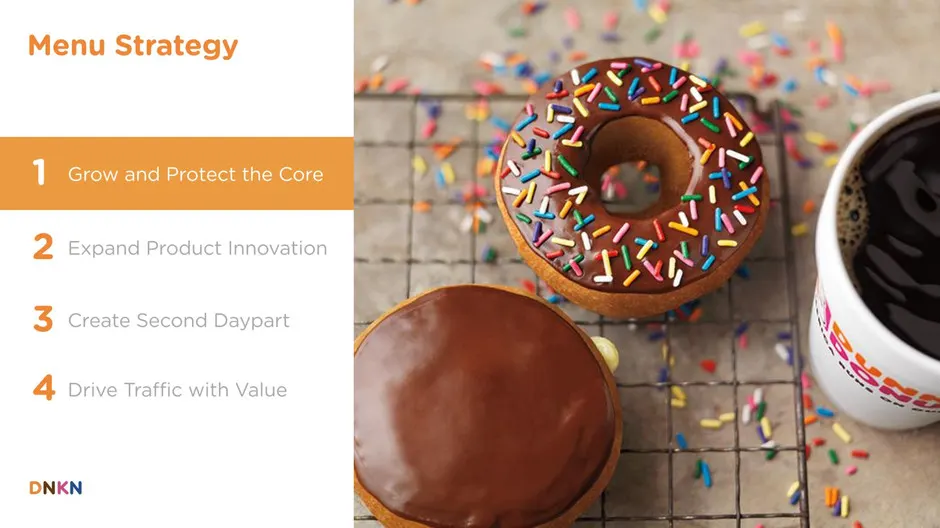
Slide 84: Protect Hot & Iced Coffee Share
Protect Hot & Iced Coffee Share Get our “Donut Mojo” Back Improve Quality of Offerings
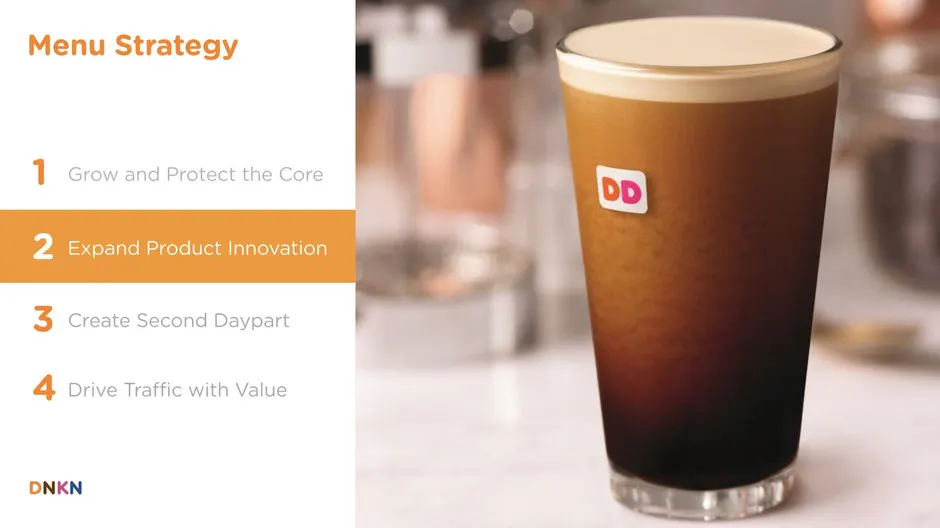
Slide 85: 85
85
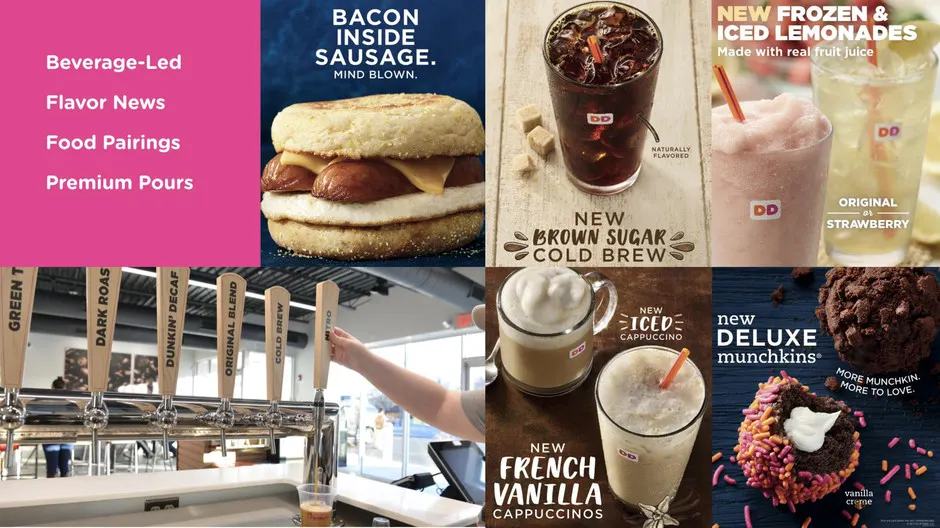
Slide 86: LD BREWS
LD BREWS NEW = BKOWN SUGAK 2 co a AE = new ' a eheehs DELUXE \¢" é munchkins:
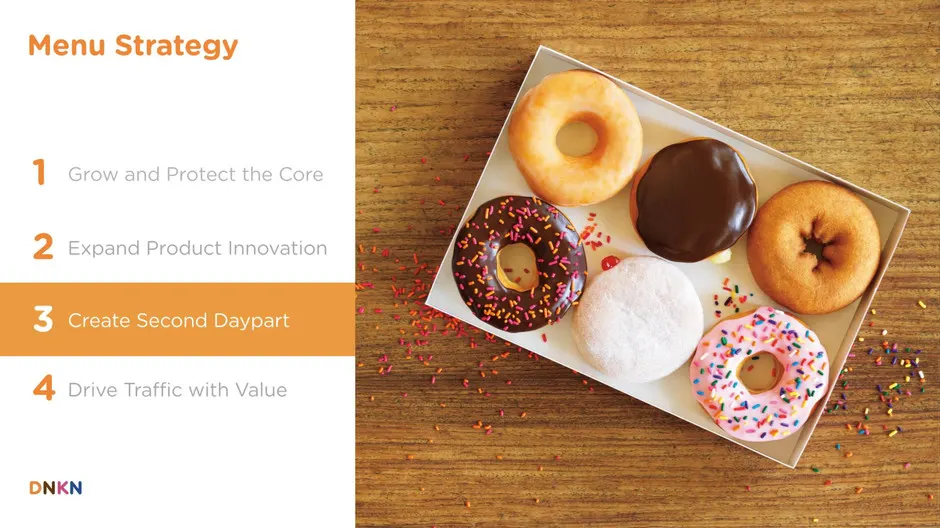
Slide 87: Menu Strategy: Create Second Daypart
Menu Strategy 3 Create Second Daypart 4
Slide 88: Winning the P.M.
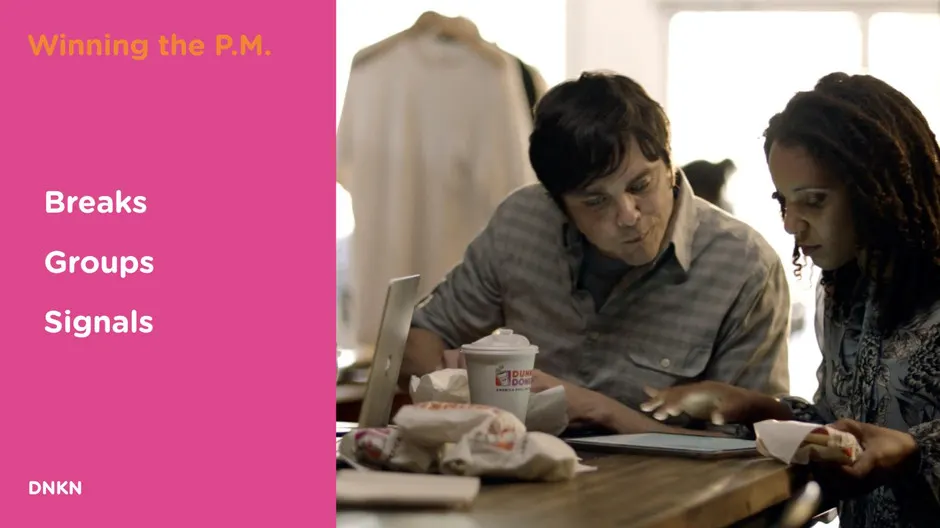
Winning the P.M. Breaks Groups Signals DNKN
Slide 89
Slide 90: Capture Snacking Occasion: Grab n' Go
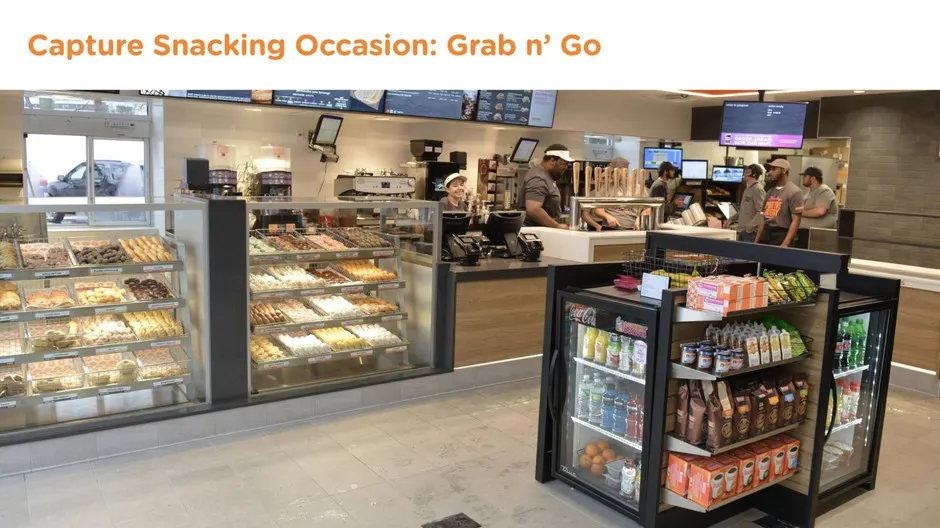
Capture Snacking Occasion: Grab n’ Go
Slide 91: Dunkin’ Donuts th Like Page
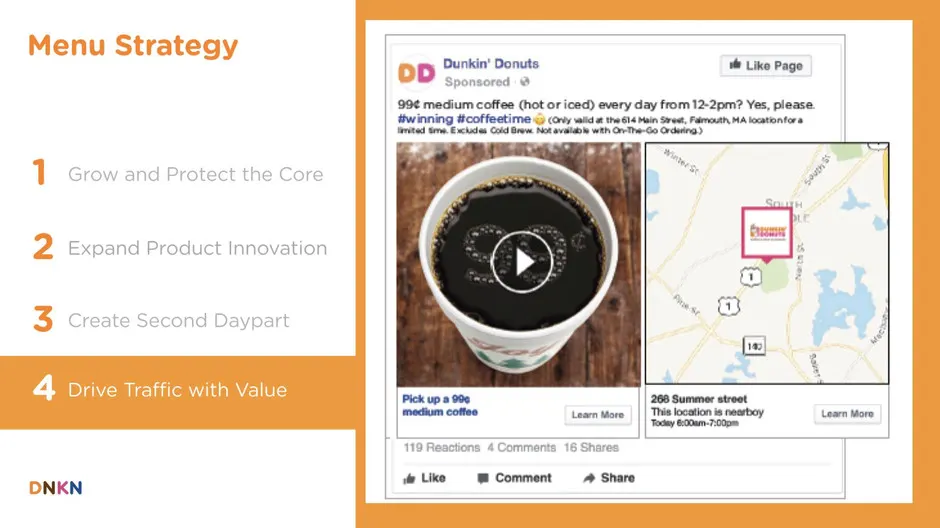
N Dunkin’ Donuts th Like Page Yes, please ateot Lear tore | || Thi location i nearby Learn More “ay ban 7.000 119 React mmer hare ve Like = Comment Share
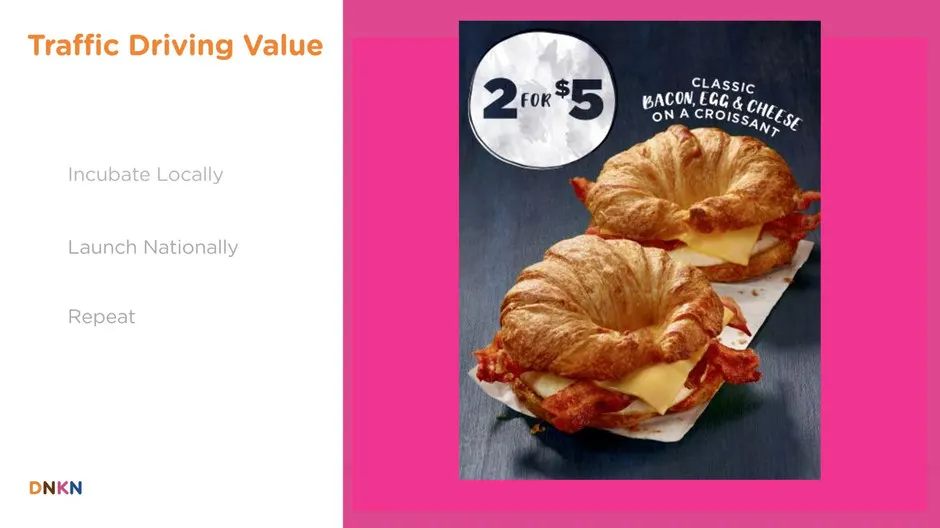
Slide 92: IN
IN
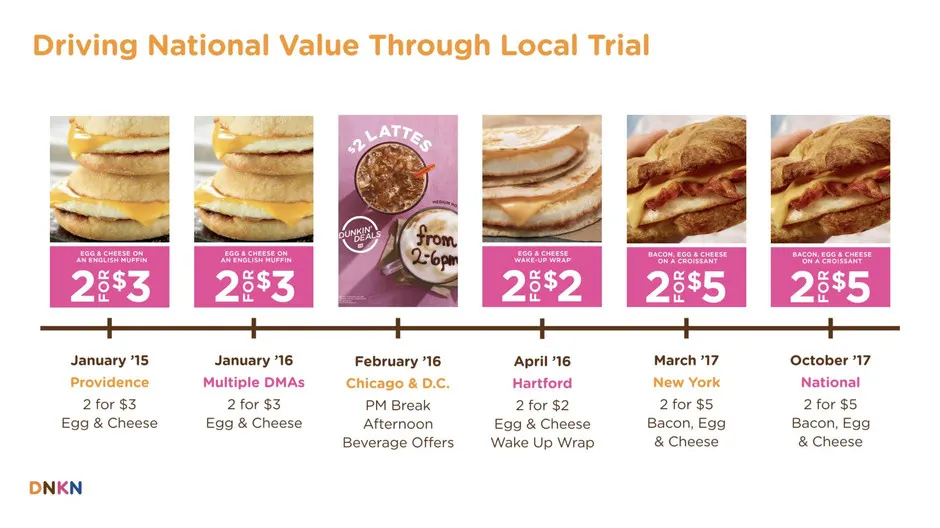
Slide 93: Driving national value through local trial
93 Jan ’15, Providence: 2 for $3 Egg & Cheese Jan ’16, Multiple DMAs: 2 for $3 Egg & Cheese Feb ’16, Chicago & DC: PM Break Afternoon Beverage Offers April ’16, Hartford: 2 for $2 Egg & Cheese Wake Up Wrap Mar ’17, NY: 2 for $5 Bacon, Egg & Cheese Oct’17, NATIONAL: 2 for $5 Bacon, Egg & Cheese Drivi
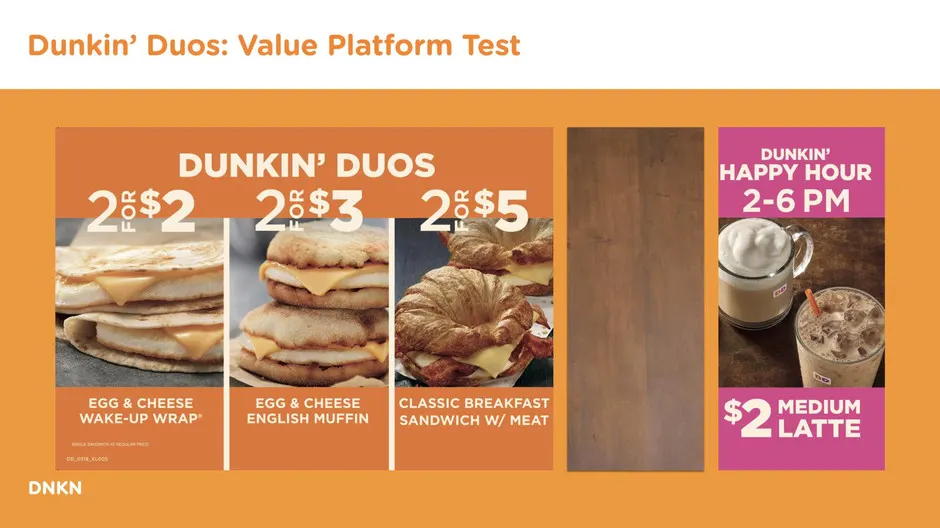
Slide 94: Dunkin' Duos: Value Platform Test
Dunkin’ Duos: Value Platform Test EGG & CHEESE EGG & CHEESE |] CLASSIC BREAKFAST $ MEDIUM WAKE-UP WRAP* ENGLISH MUFFIN] SANDWICH W/ MEAT LATTE DNKN
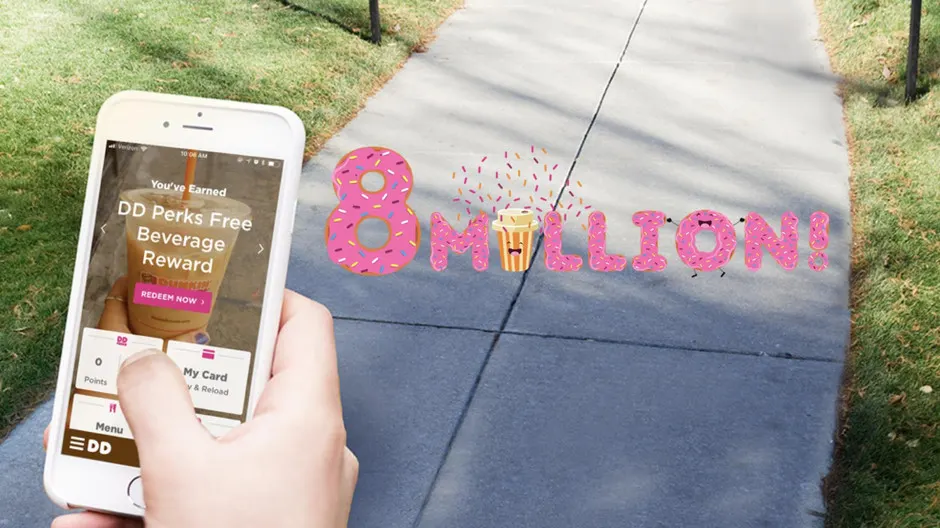
Slide 95
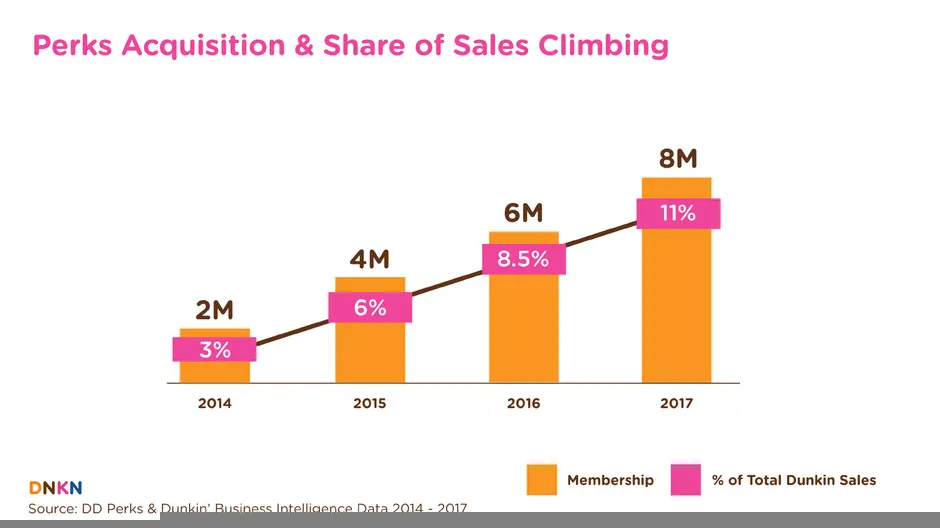
Slide 96: Perks Acquisition & Share of Sales Climbing
Perks Acquisition & Share of Sales Climbing 2014 2015 2016 2017 | Membership | % of Total Dunkin Sales DNKN Source: DD Perks &
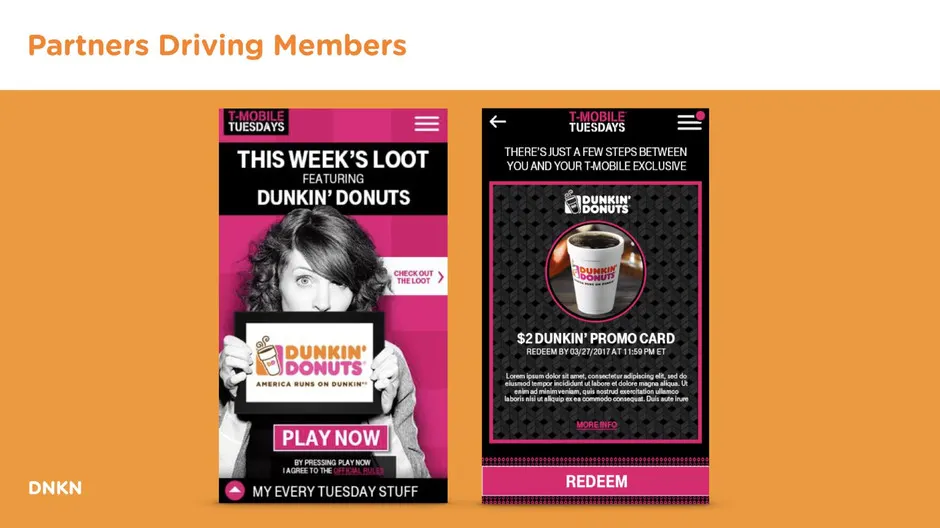
Slide 97: Partners Driving Members
Partners Driving Members REDEEM

Slide 98
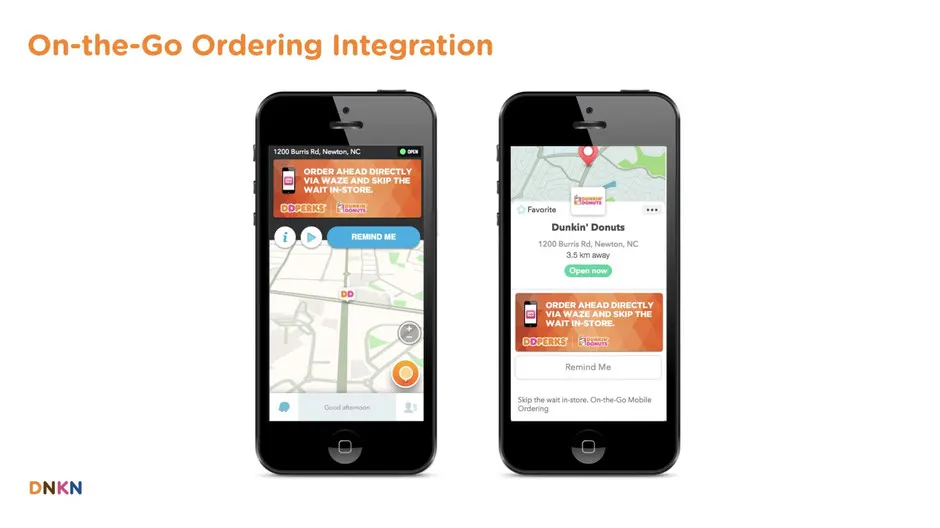
Slide 99: On-the-Go Ordering Integration
On-the-Go Ordering Integration noes aver © oteaeaecene ave DNKN
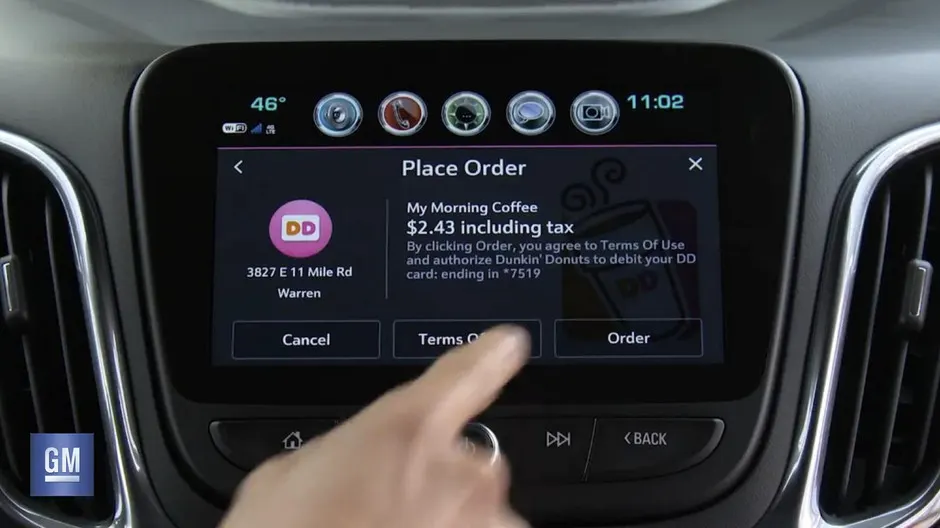
Slide 100: @O f(s) © iS) @~
@O f(s) © iS) @~ ic Place Order x My Morning Coffee $2.43 including tax By clicking Or 1e to Terms Of Use sed authorize ‘Sunt Donuts to debit your DD 3827 E11 Mile Rd ard: ending Warren
Slide 101: Three Dunkin' Treats, Picked Just for You
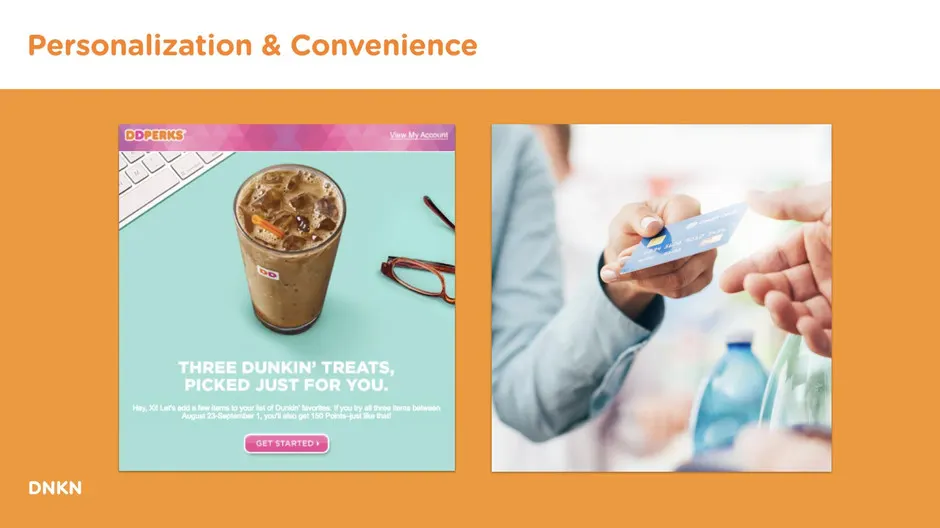
THREE DUNKIN’ TREATS, PICKED JUST FOR YOU. tae "gan 3 parte yu ena pt 0 Par a Pad
Slide 102: Simplicity via App Refresh
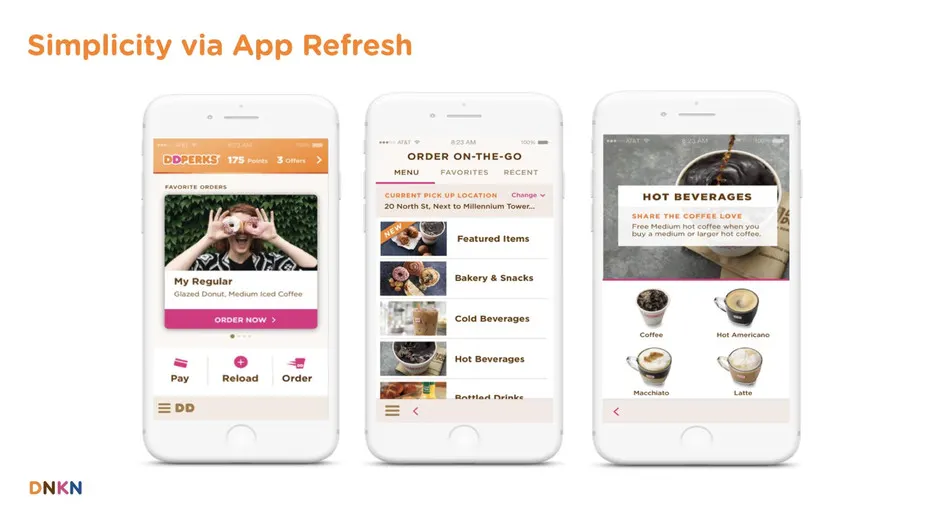
Simplicity via App Refresh HOT BEVERAGES DNKN
Slide 103: On-the-Go Ordering: 80% Retrial Rate
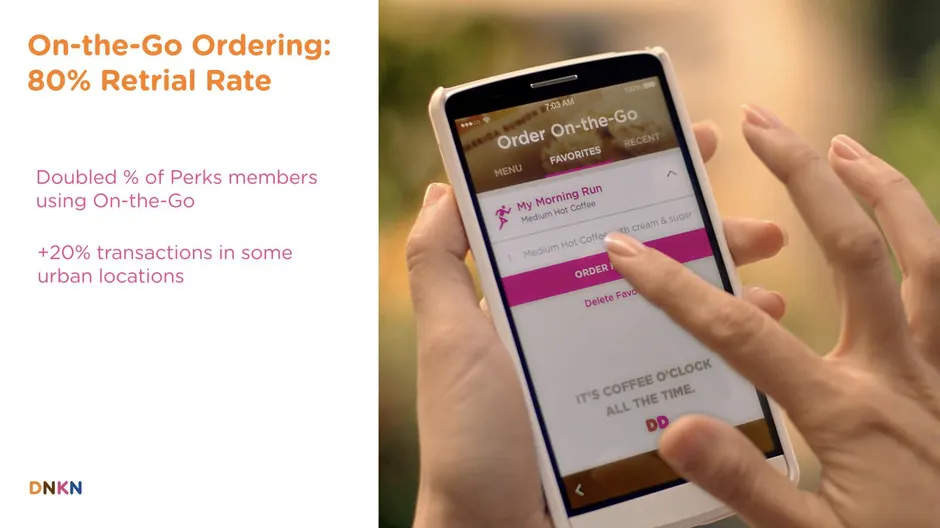
On-the-Go Ordering: 80% Retrial Rate
Slide 104
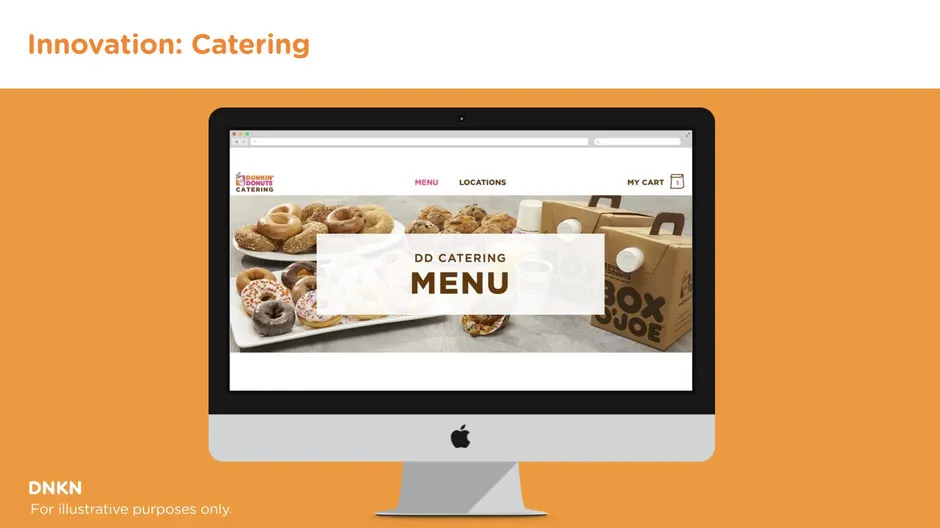
Slide 105
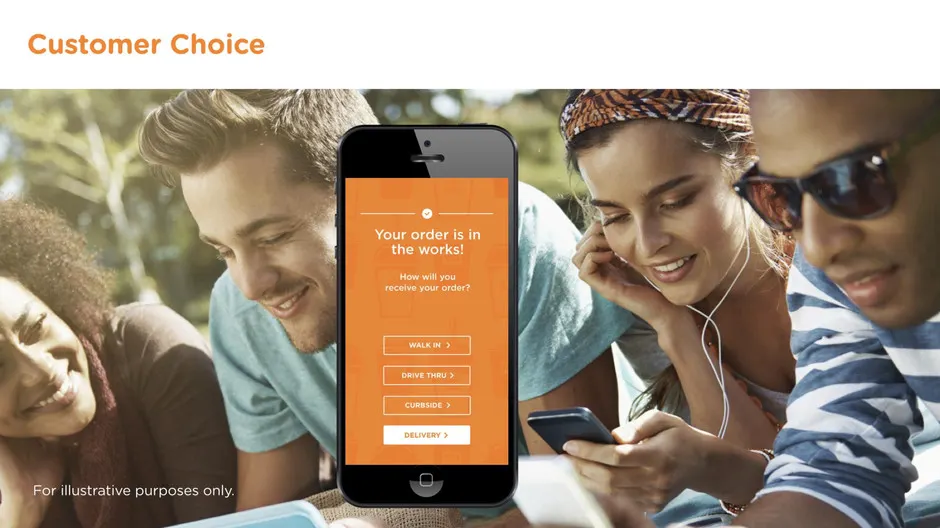
Slide 106: Customer Choice
Customer Choice
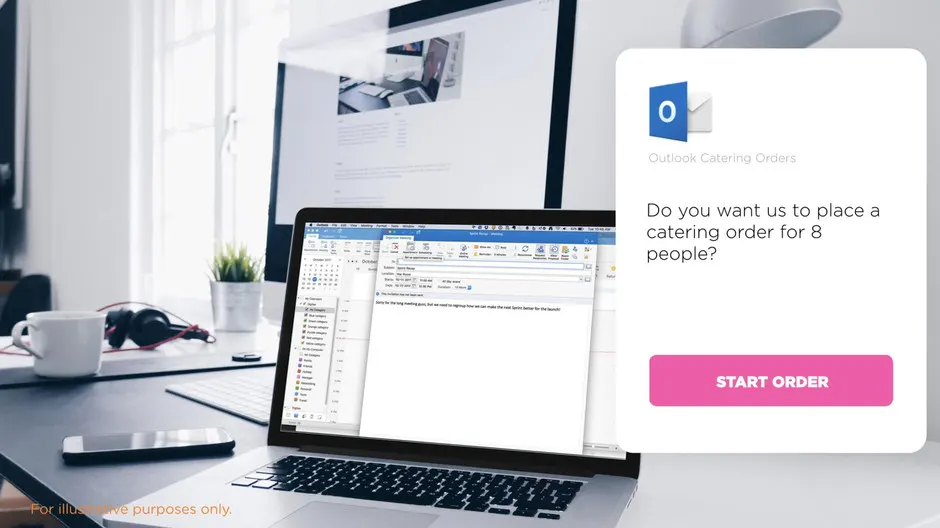
Slide 107: Do you want us to place a
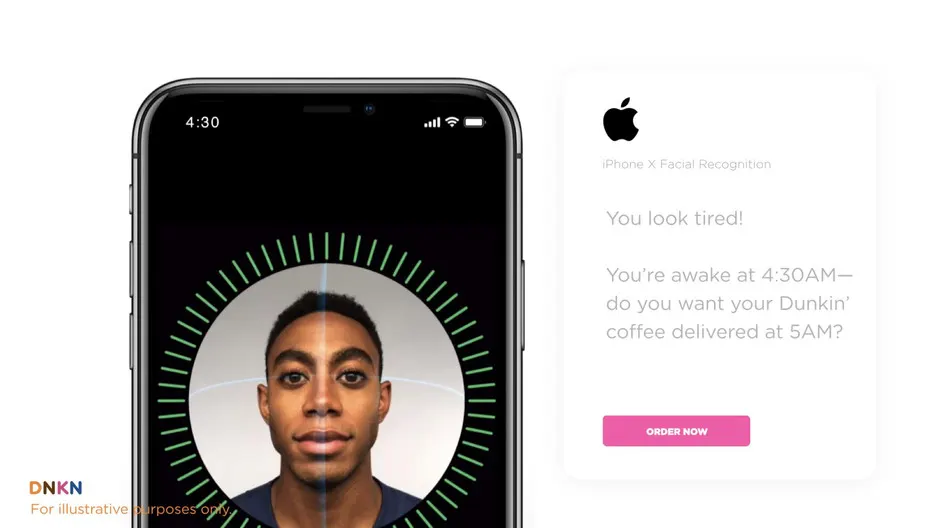
Do you want us to place a catering order for 8 people? START ORDER Ve purposes only.
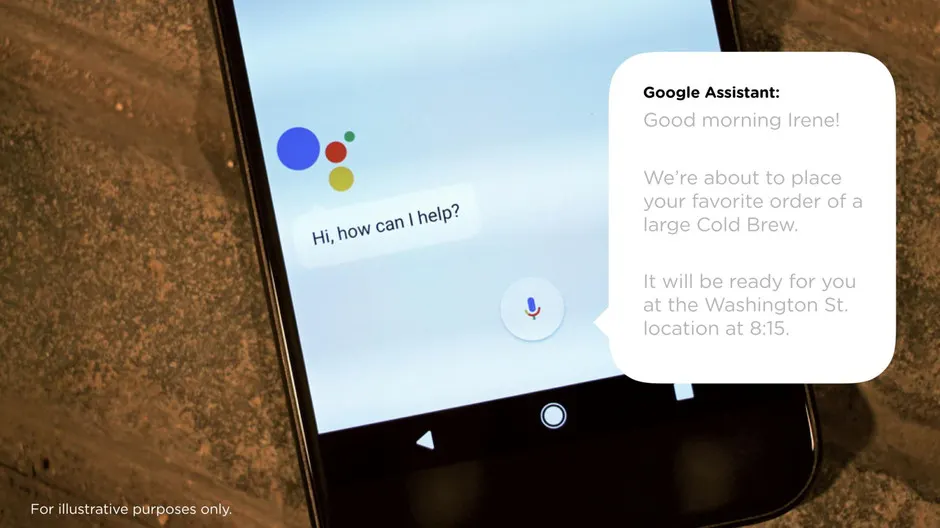
Slide 108: Google Assistant
Google Assistant: For illustrative purposes only.
Slide 109

Slide 110
Slide 111
Slide 112: New Business Driving CPG Sales
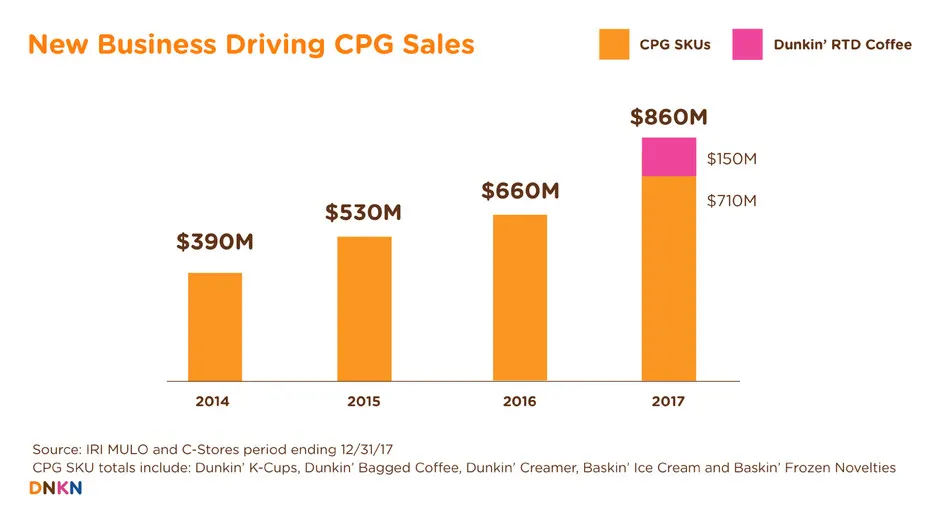
New Business Driving CPG Sales $660M $530M $390M |_| CPG SKUs i | Dunkin’ RTD Coffee $860M $150M $710M 2014 2015 2016 Source: IRI MULO and C-Stores period ending 12/31 2017 V7 CPG SKU totals include: Dunkin’ K-Cups, Dunkin’ Bagged Coffee, Dunkin’ Creamer, Baskin’ Ice Cream and Baskin’ Frozen Novelti
Slide 113: N
N
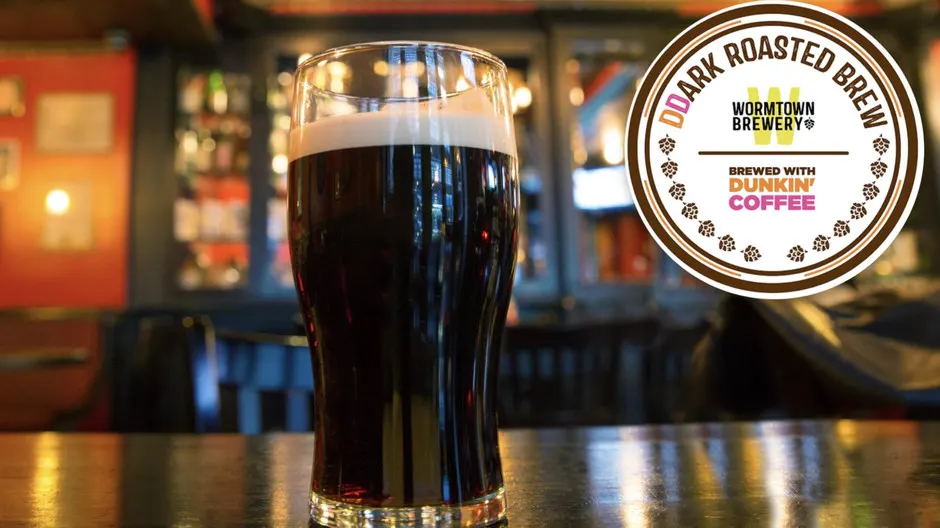
Slide 114: OAST
OAST Same? unin
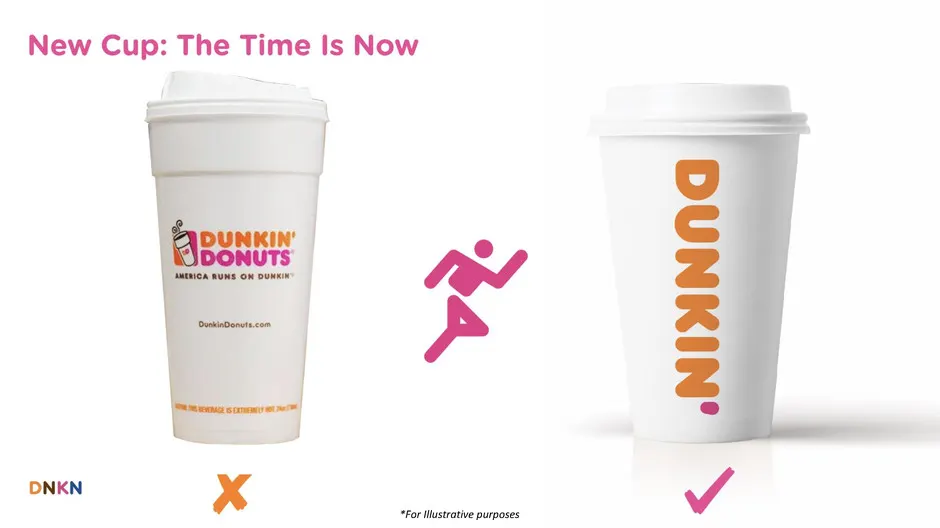
Slide 115: New Cup: The Time Is Now
New Cup: The Time Is Now tL. = DNKN x *For ilustrative purposes
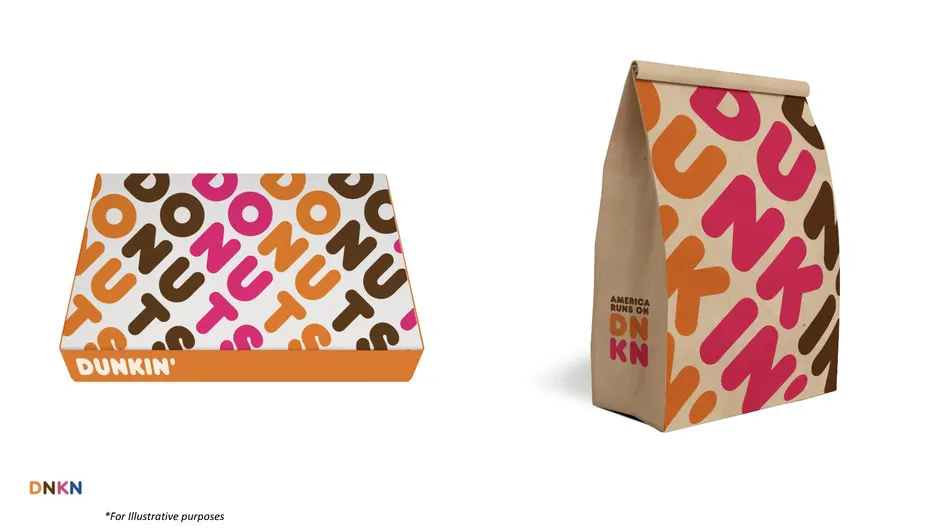
Slide 116: *For Illustrative purposes
*For Illustrative purposes
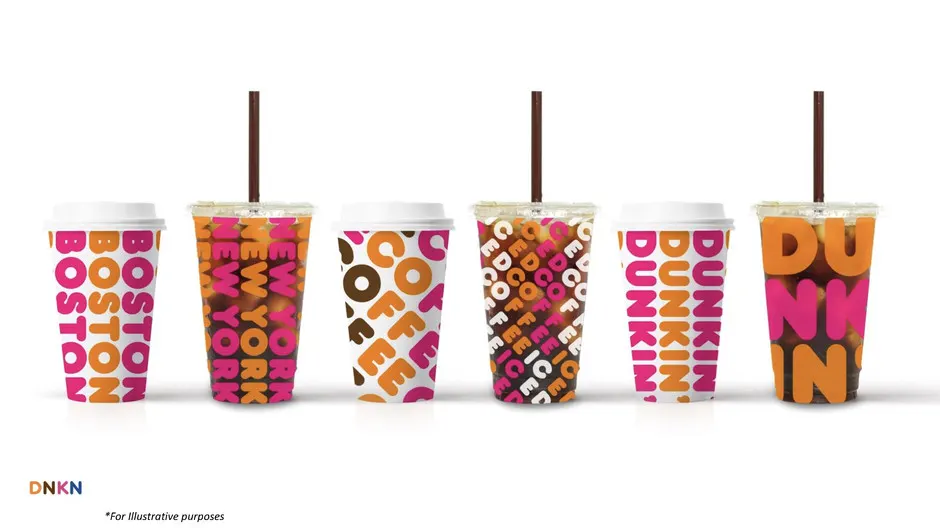
Slide 117: *For Illustrative purposes
*For Illustrative purposes

Slide 118
Slide 119
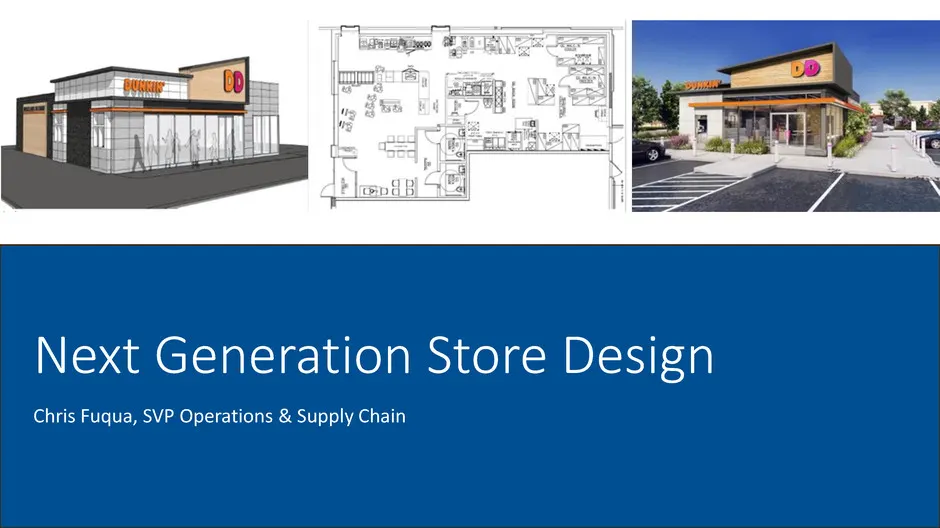
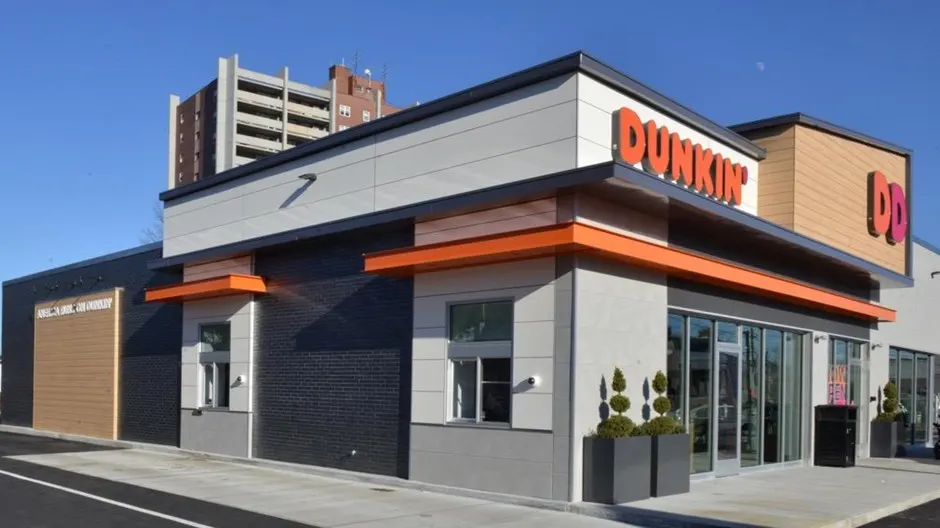
Slide 120: Next Generation Store Design
Next Generation Store Design Chris Fuqua, SVP Operations & Supply Chain
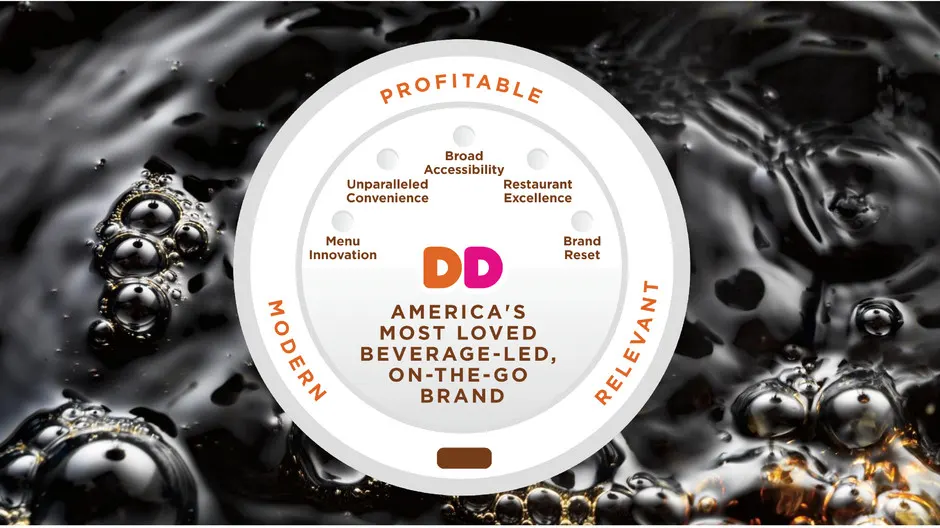
Slide 121: pROFITABy ~
pROFITABy ~ Broad Accessibility Unparalleled Restaurant Convenience Excellence Menu Innovation DD AMERICA'S MOST LOVED BEVERAGE-LED,

Slide 122: The future is now!
The future is now!
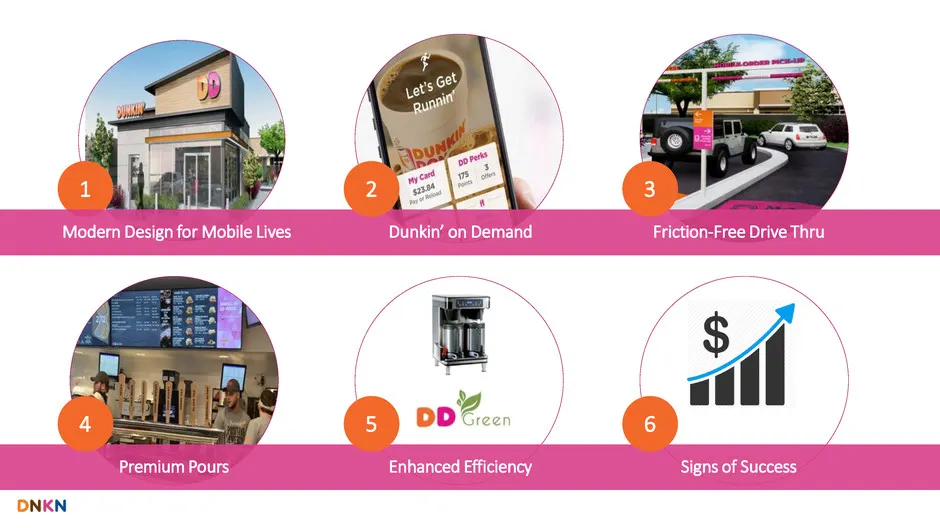
Slide 123: NextGen Store Design Elements
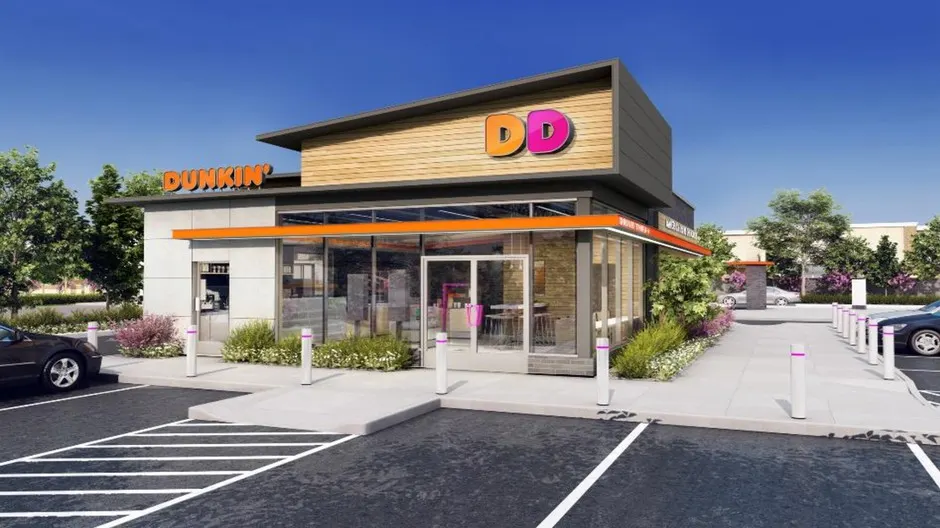
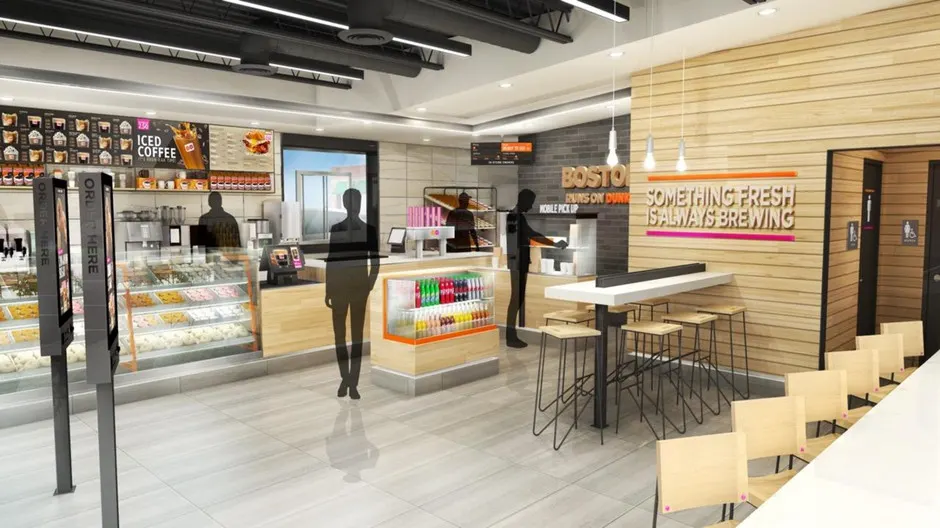
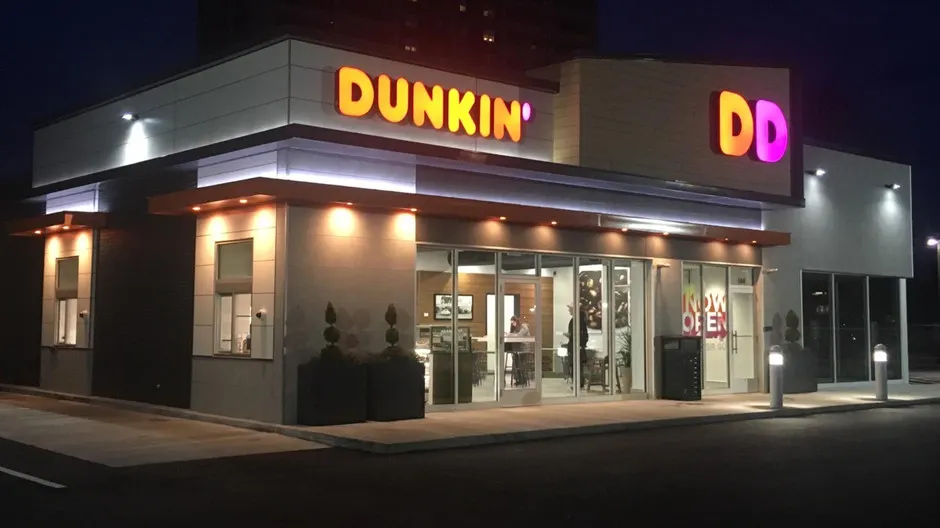
1 Modern Design for Mobile Lives 2 Dunkin’ on Demand 3 Friction-Free Drive Thru 4 Premium Pours 5 Enhanced Efficiency 6 Signs of Success
Slide 124: Modern Design for Mobile Lives
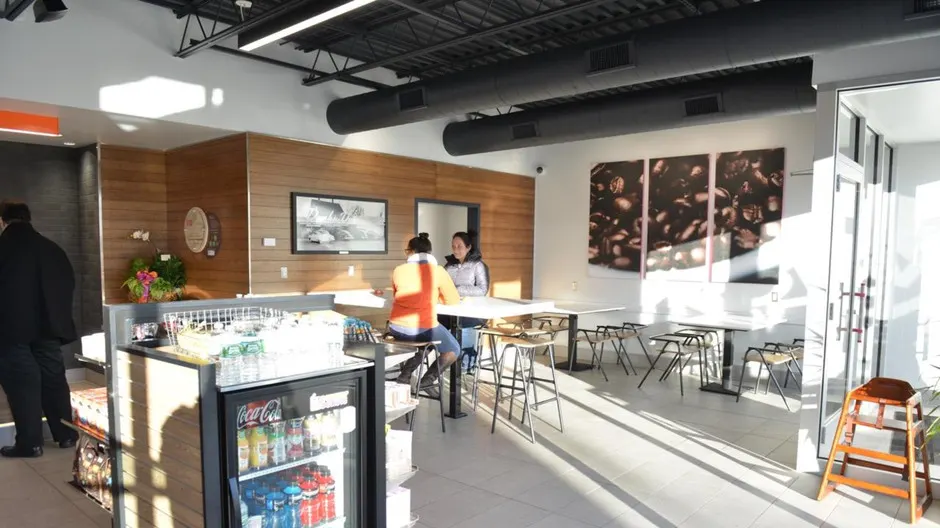
1 Modern Design for Mobile Lives
Slide 125: Consumer-led design
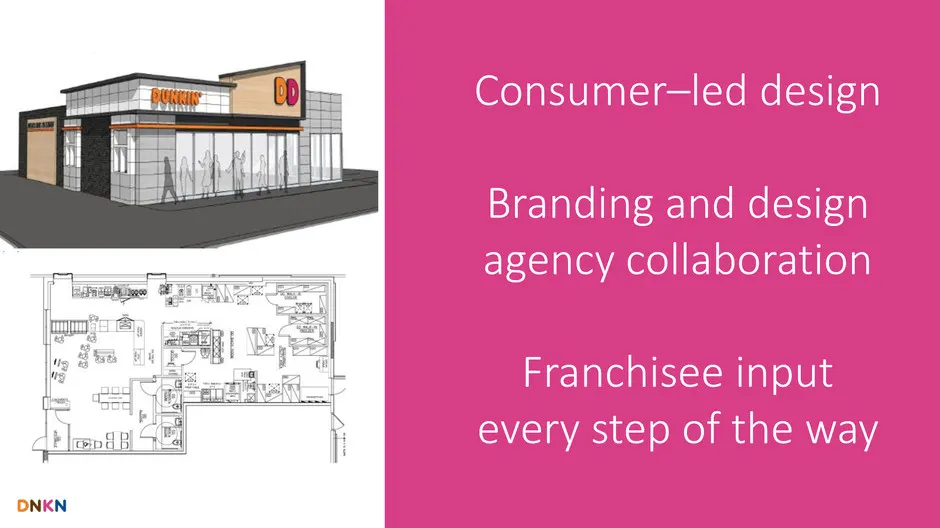
Consumer–led design Branding and design agency collaboration Franchisee input every step of the way
Slide 126
Slide 127
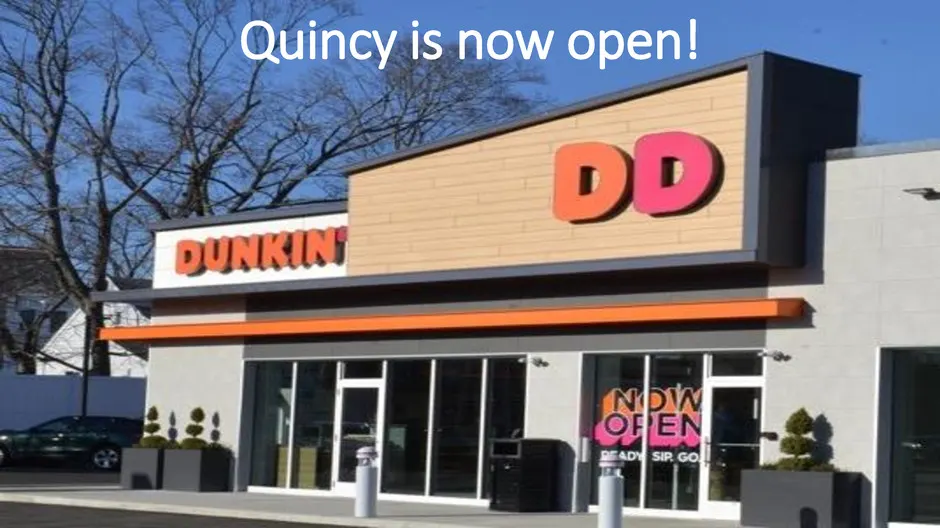
Slide 128: Quincy is now open!
Quincy is now open!
Slide 129
Slide 130: 130
130
Slide 131
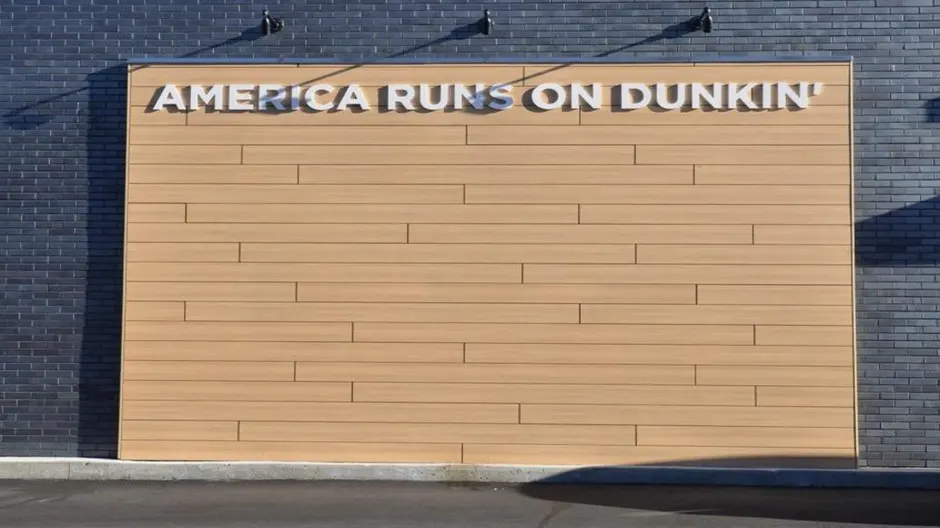
Slide 132: MEr'OA RUN SON DUNKING
x = =o MEr'OA RUN SON DUNKING a
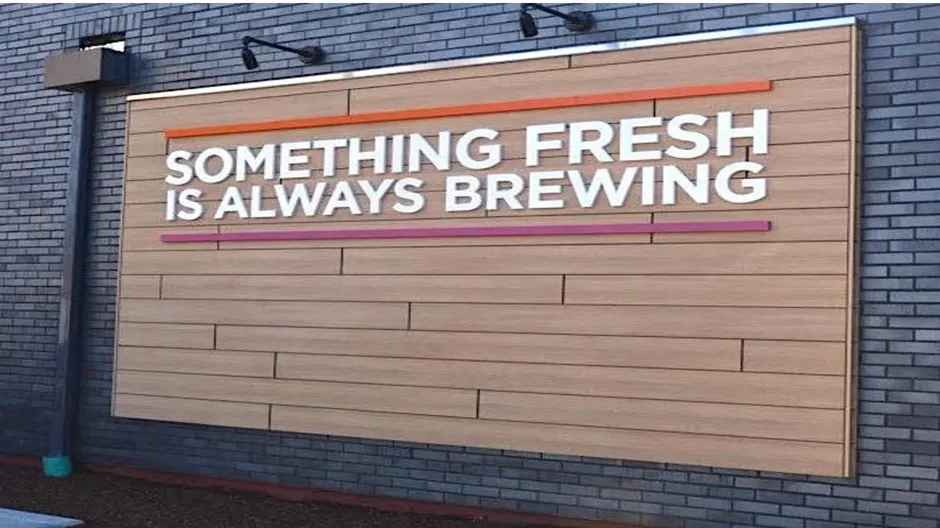
Slide 133
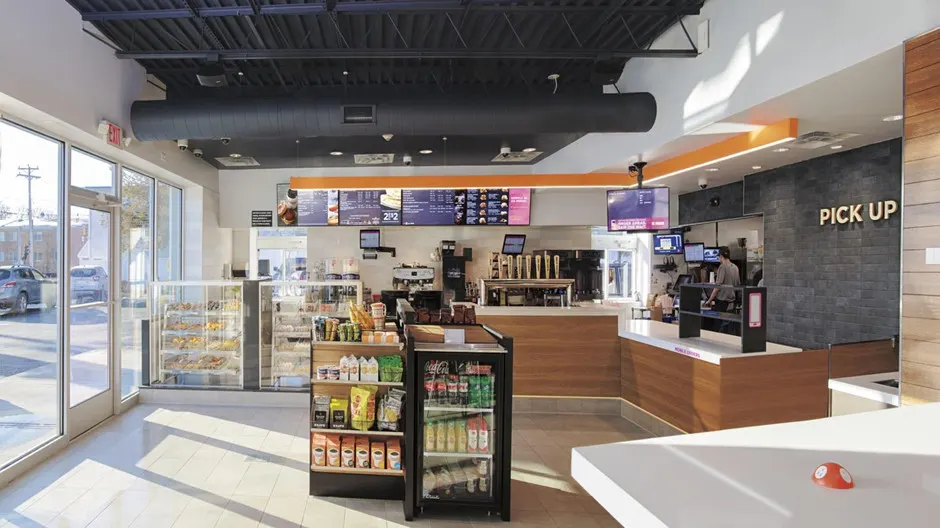
Slide 134: 134
134
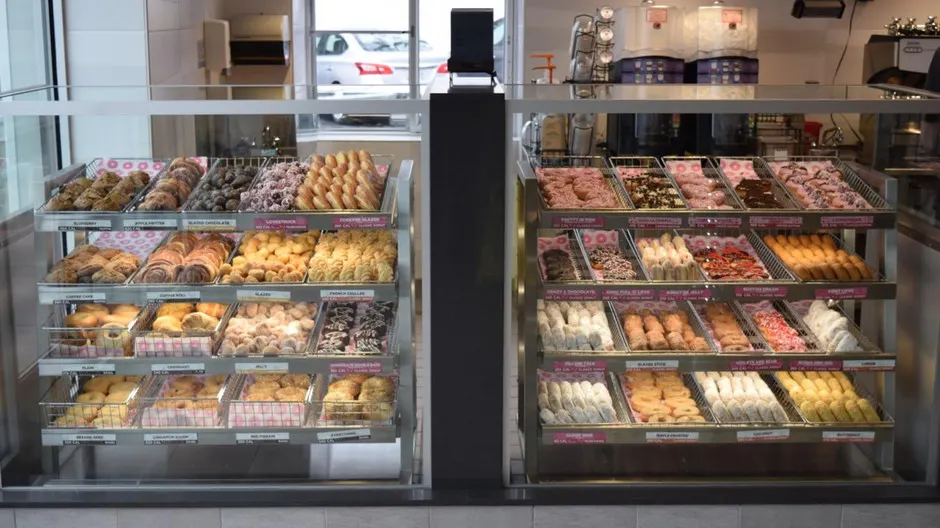
Slide 135: 135
135
Slide 136
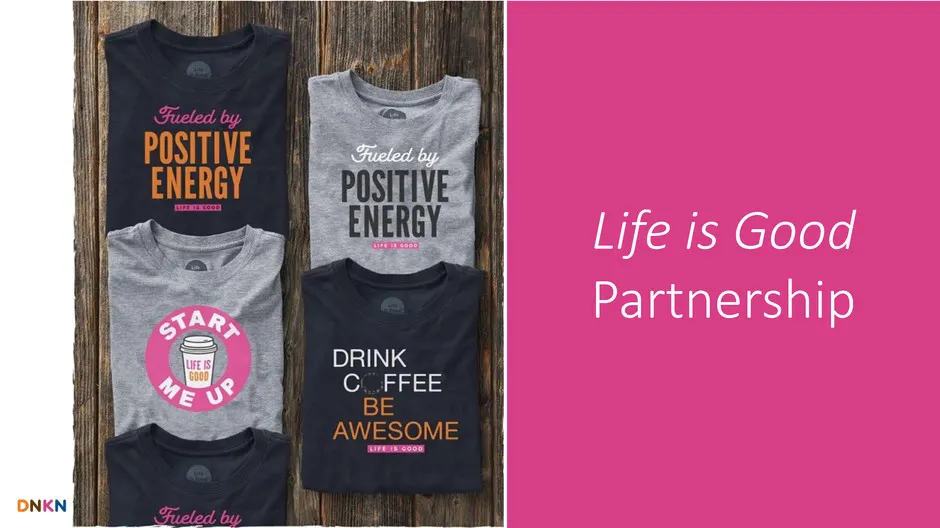
Slide 137: Life is Good Partnership
Life is Good Partnership
Slide 138: Dunkin' on Demand
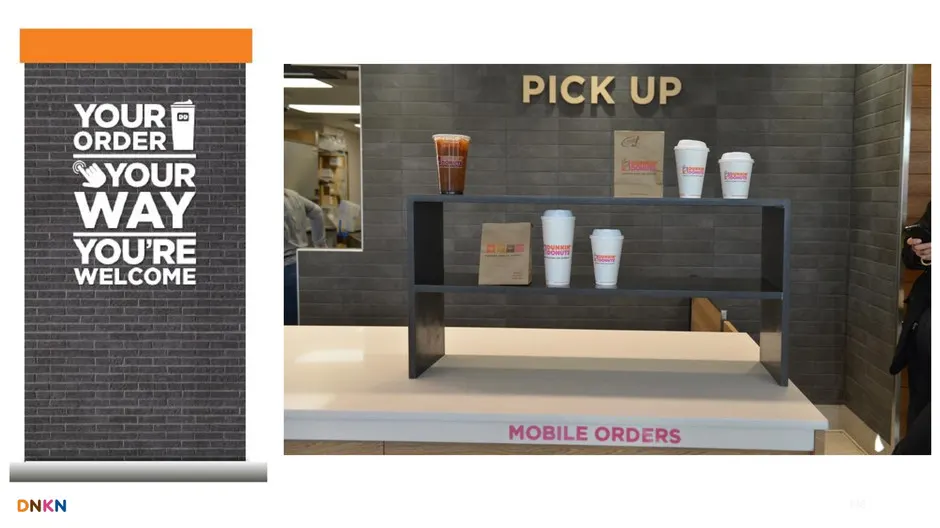
dynkin’ WD Dunkin’ on Demand —————
Slide 139: SRDE ll
SRDE ll SSYOUR WELCOME
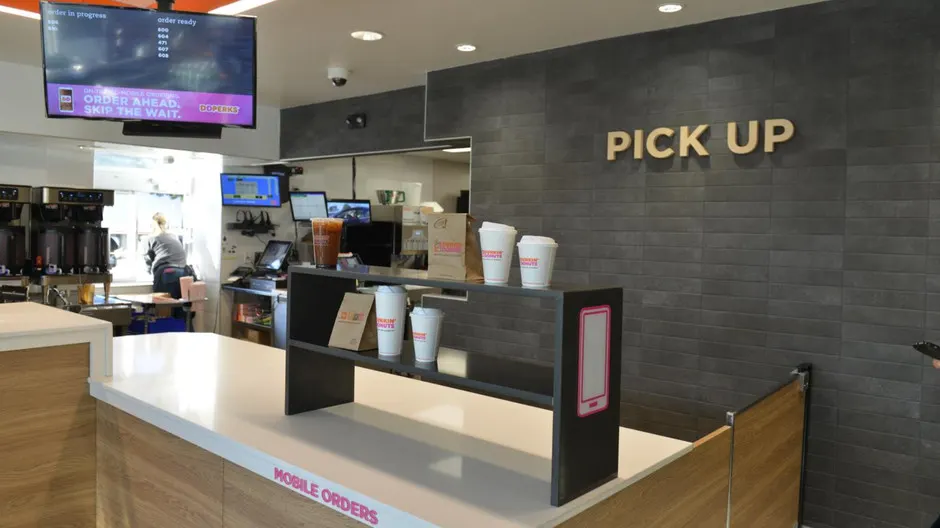
Slide 140: 140
140
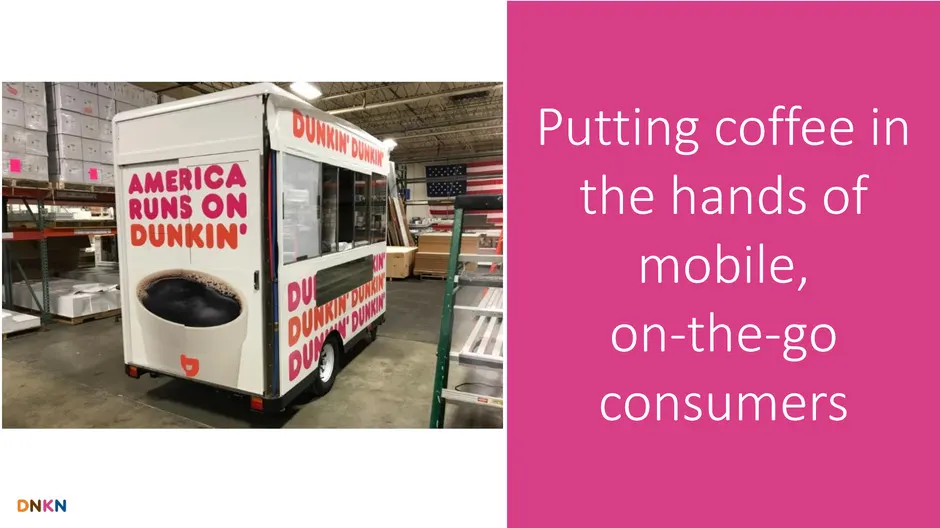
Slide 141: Putting coffee in the hands of mobile, on-the-go consumers
Putting coffee in the hands of mobile, on-the-go consumers
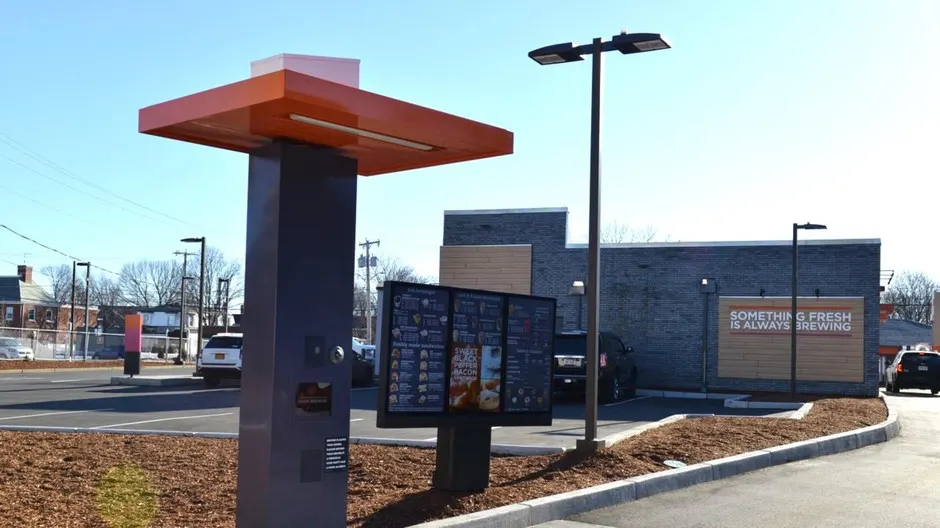
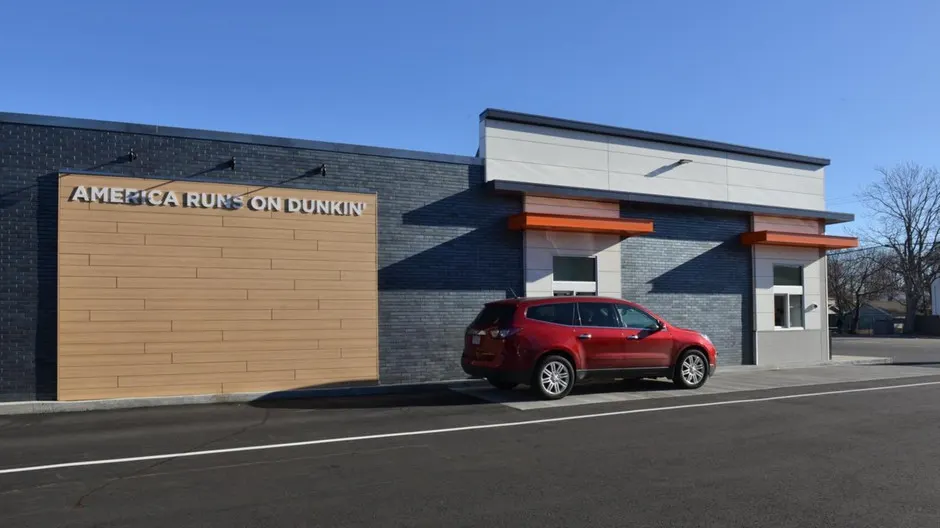
Slide 142: Friction-Free Drive-Thru
3 Friction-Free Drive-Thru
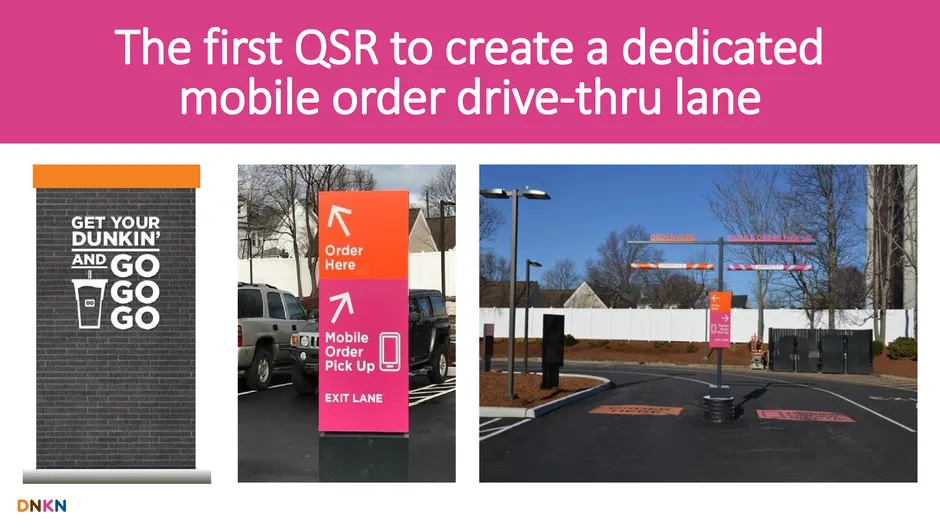
Slide 143: First QSR with dedicated mobile order drive-thru lane
The first QSR to create a dedicated mobile order drive-thru lane
Slide 144
Slide 145

Slide 146: Premium Pours
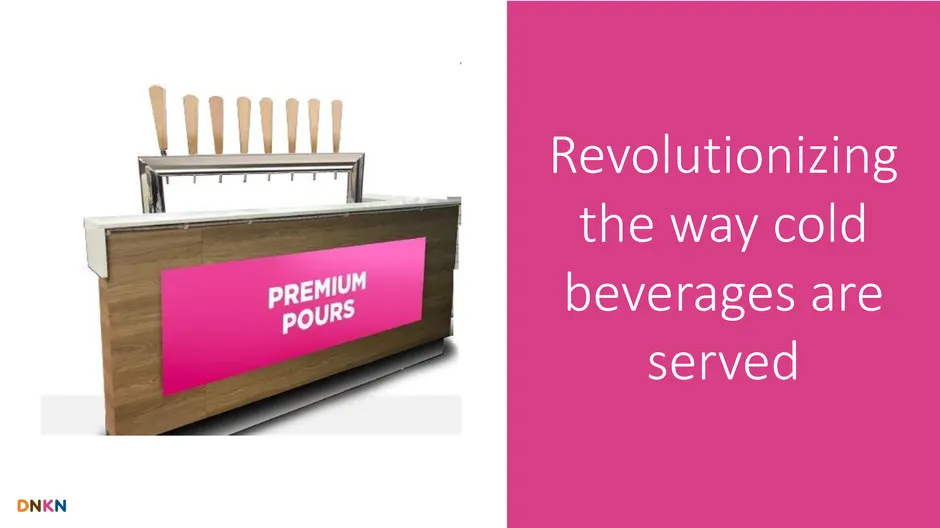
4 Premium Pours
Slide 147: No baristas here
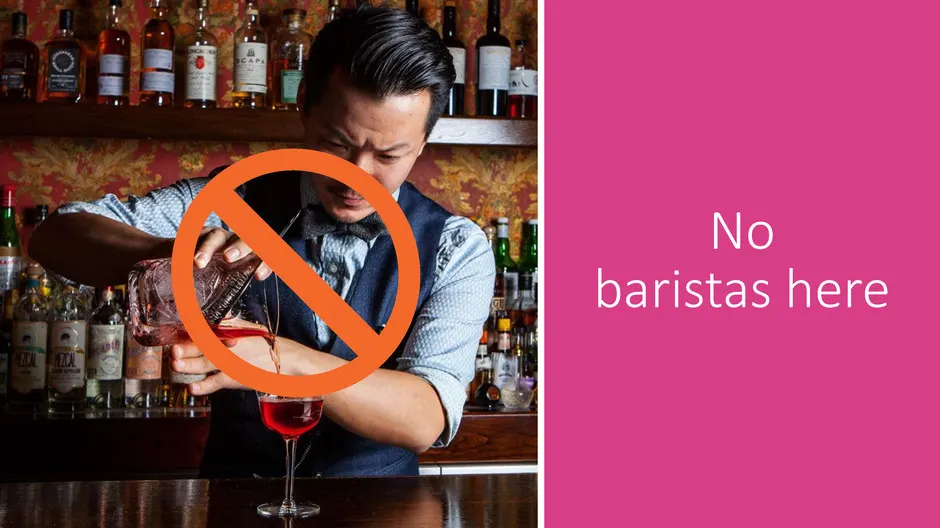
No baristas here
Slide 148: Revolutionizing the way cold beverages are served
Revolutionizing the way cold beverages are served
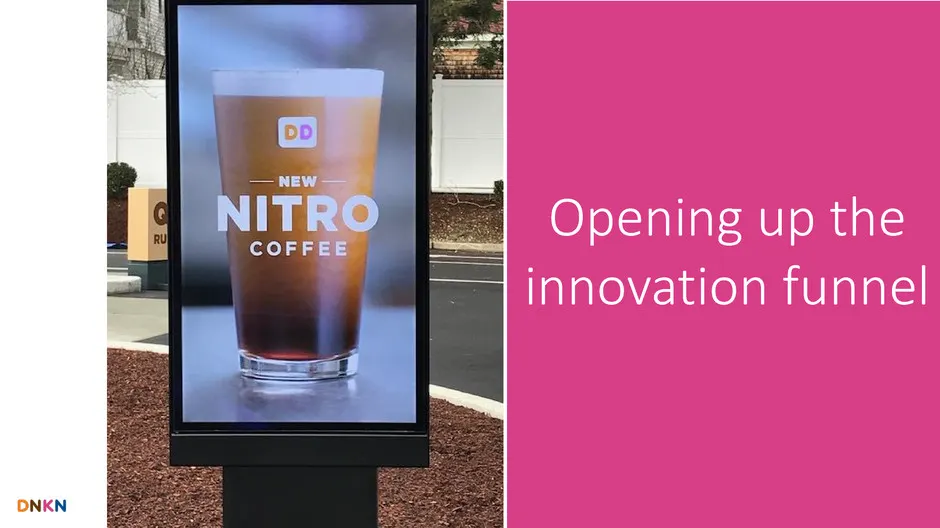
Slide 149: Opening up the innovation funnel
Opening up the innovation funnel
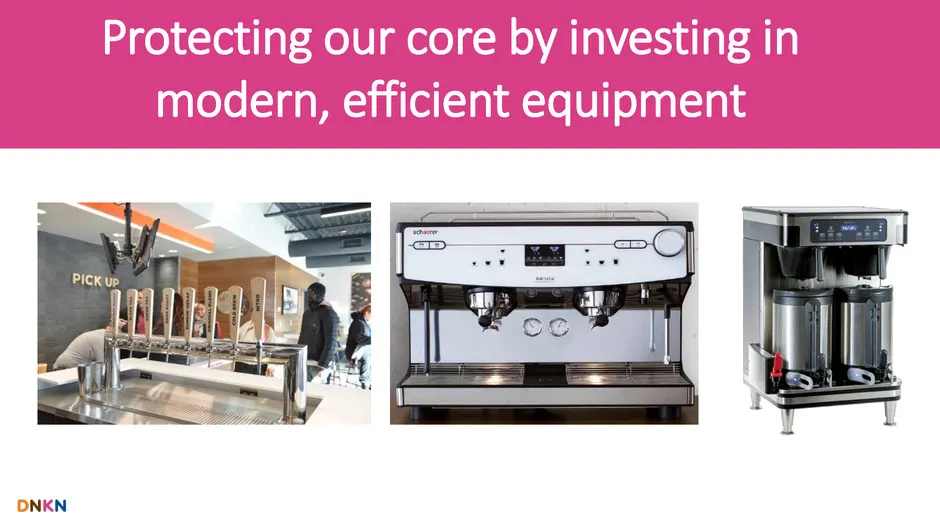
Slide 150: Protecting our core with modern, efficient equipment
Protecting our core by investing in modern, efficient equipment
Slide 151: Enhanced Efficiency
5 Enhanced Efficiency
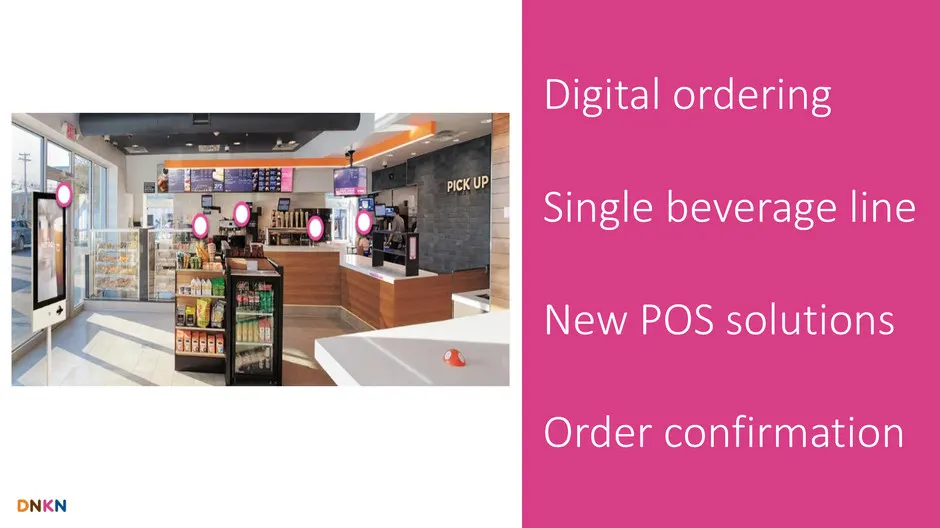
Slide 152: Digital ordering Single beverage line New POS solutions Order confirmation
Digital ordering Single beverage line New POS solutions Order confirmation
Slide 153: 186th DD Green Restaurant
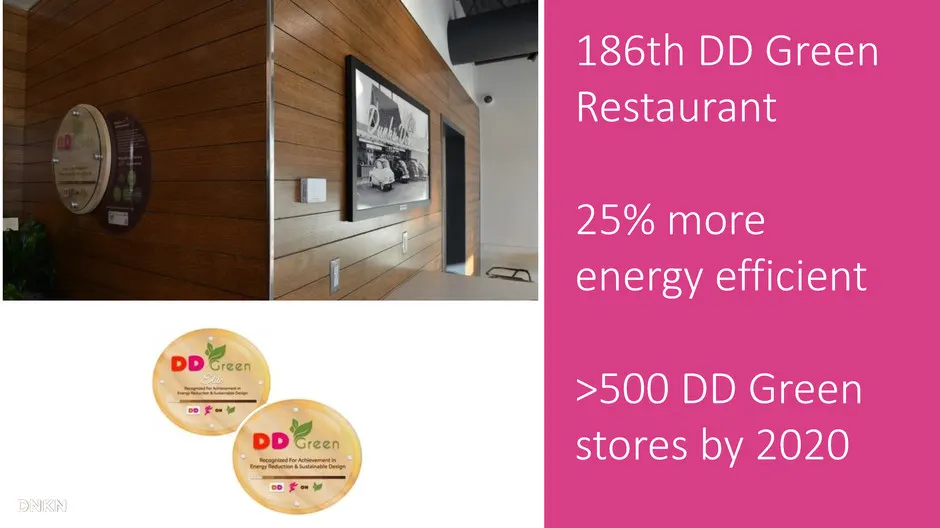
186th DD Green Restaurant 25% more energy efficient >500 DD Green stores by 2020

Slide 154: Signs of Success
6 Signs of Success
Slide 155: Goals of New Design
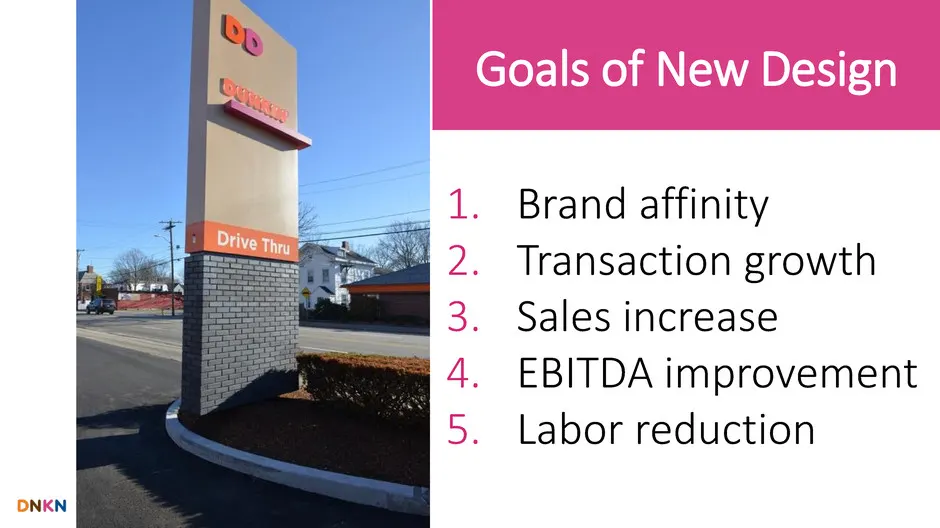
1. Brand affinity 2. Transaction growth 3. Sales increase 4. EBITDA improvement 5. Labor reduction Goals of New Design
Slide 156: What's Next?
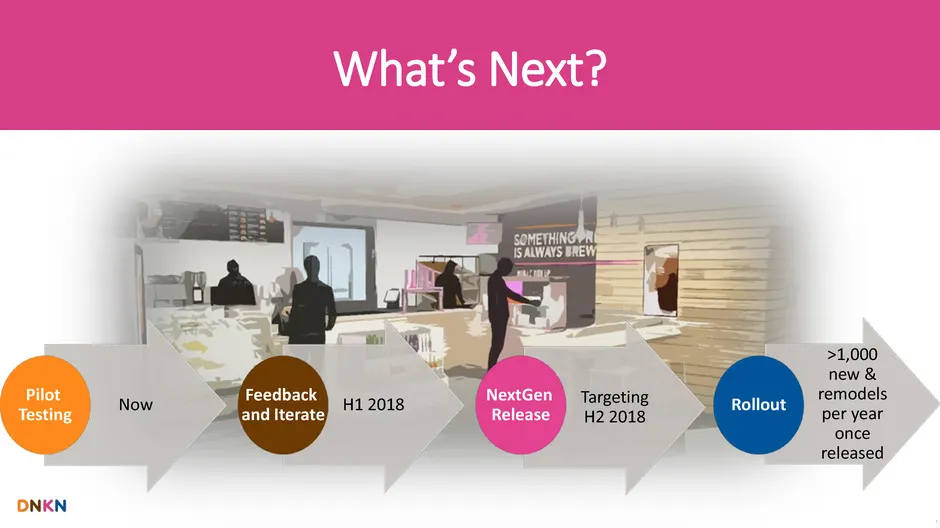
What’s Next? Now Pilot Testing H1 2018 Feedback and Iterate Targeting H2 2018 NextGen Release >1,000 new & remodels per year once released Rollout
Slide 157: Q&A
Q&A Dave Hoffmann, President of Dunkin’ Donuts U.S. Scott Murphy, COO Tony Weisman, CMO Chris Fuqua, SVP Operations & Supply Chain
Slide 158: Bringing it All Together: Financials & Long-Term Guidance
Bringing it All Together: Financials & Long-Term Guidance Kate Jaspon, CFO
Slide 159: Big changes in the financial world impacting 2018 results
Big changes in the financial world that will impact 2018 results…
Slide 160: Revenue Recognition Refresher
Revenue Recognition Refresher Presented on a new standard basis beginning Q1 2018
Slide 161: What is not impacted?
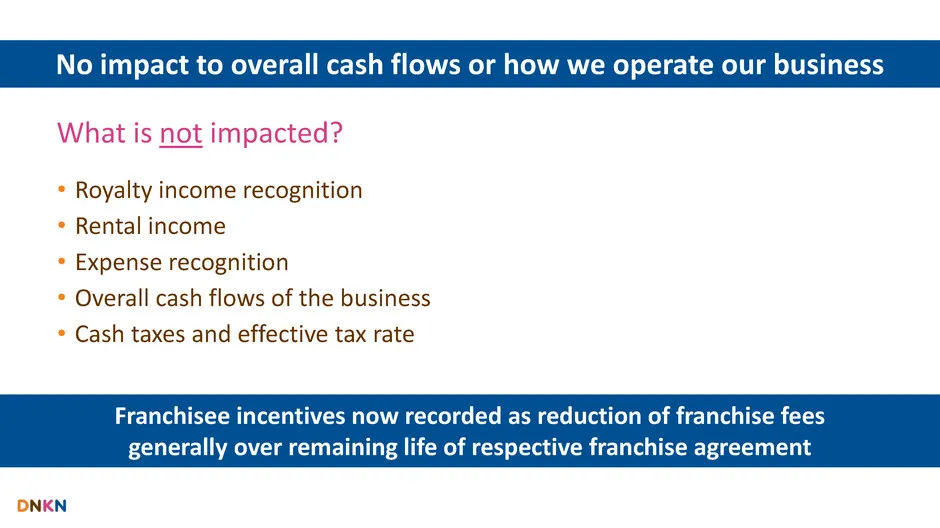
What is not impacted? • Royalty income recognition • Rental income • Expense recognition • Overall cash flows of the business • Cash taxes and effective tax rate Franchisee incentives now recorded as reduction of franchise fees generally over remaining life of respective franchise agreement No impac
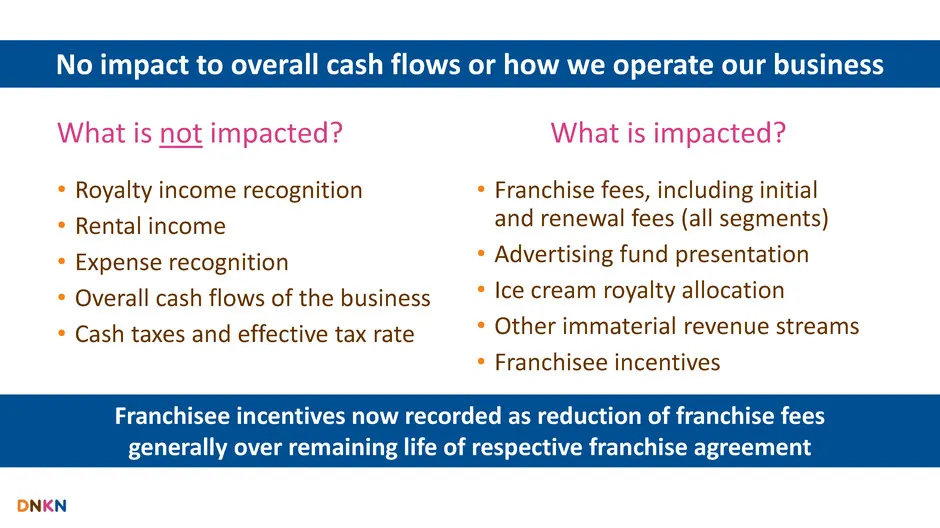
Slide 162: What is and is not impacted
What is not impacted? What is impacted? • Royalty income recognition • Rental income • Expense recognition • Overall cash flows of the business • Cash taxes and effective tax rate • Franchise fees, including initial and renewal fees (all segments) • Advertising fund presentation • Ice cream royalty
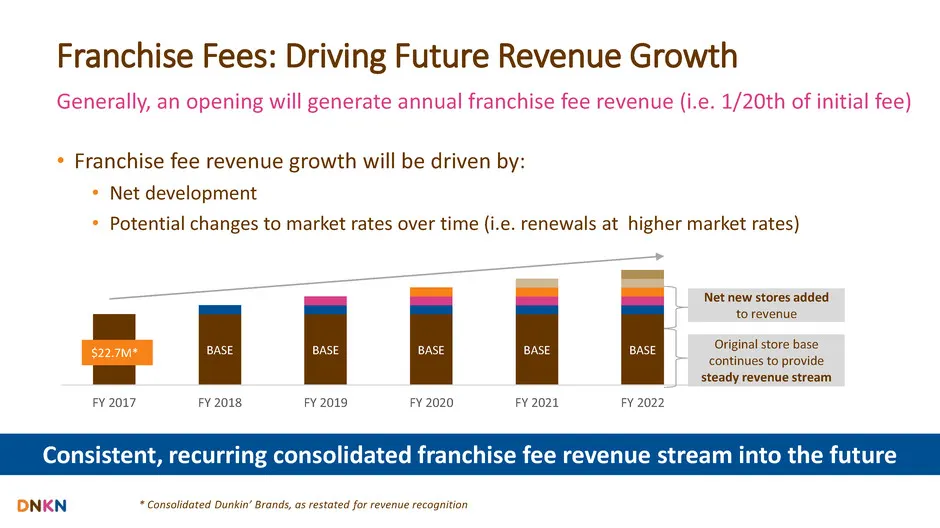
Slide 163: Franchise Fees: Driving Future Revenue Growth
Franchise Fees: Driving Future Revenue Growth • Franchise fee revenue growth will be driven by: • Net development • Potential changes to market rates over time (i.e. renewals at higher market rates) Generally, an opening will generate annual franchise fee revenue (i.e. 1/20th of initial fee) BASE BA
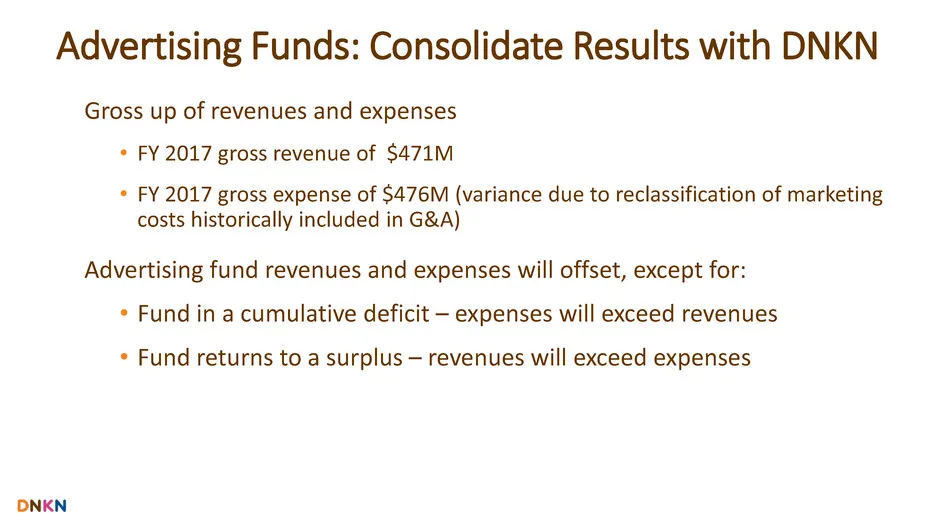
Slide 164: Advertising Funds: Consolidate Results with DNKN
Advertising Funds: Consolidate Results with DNKN Gross up of revenues and expenses • FY 2017 gross revenue of $471M • FY 2017 gross expense of $476M (variance due to reclassification of marketing costs historically included in G&A) Advertising fund revenues and expenses will offset, except for: • Fu
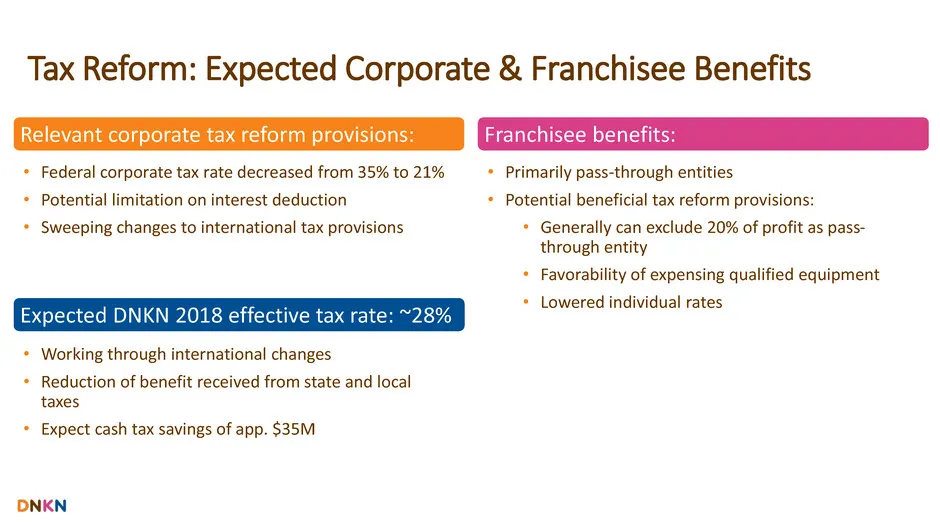
Slide 165: Tax Reform: Expected Corporate & Franchisee Benefits
Tax Reform: Expected Corporate & Franchisee Benefits • Federal corporate tax rate decreased from 35% to 21% • Potential limitation on interest deduction • Sweeping changes to international tax provisions • Working through international changes • Reduction of benefit received from state and local tax
Slide 166: The world has changed dramatically since our last Investor Day
The world has changed dramatically since our last Investor & Analyst Day…
Slide 167: Who would have predicted this?
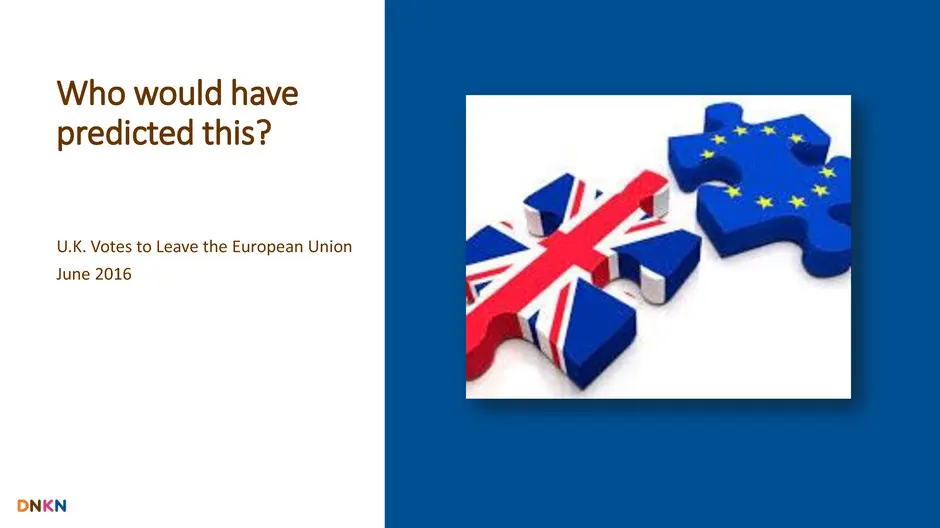
Who would have predicted this? U.K. Votes to Leave the European Union June 2016
Slide 168: Who would have predicted this?
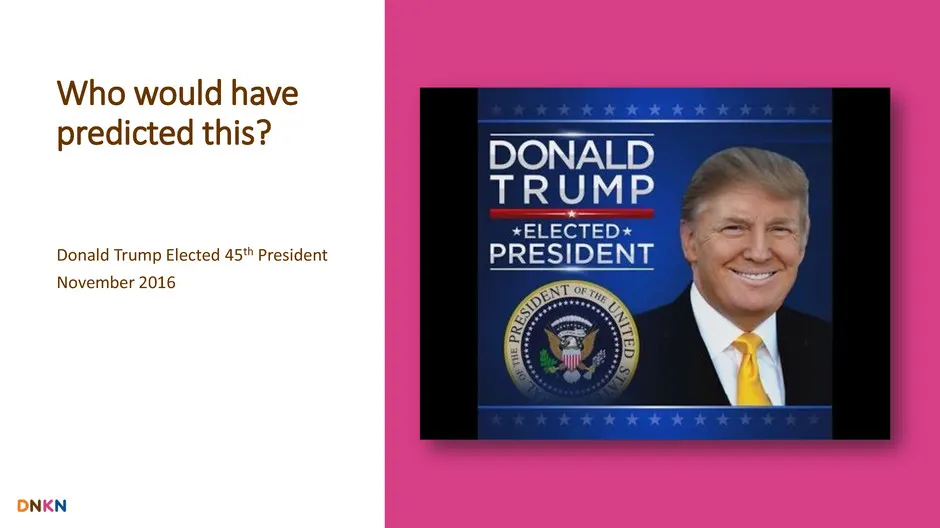
Donald Trump Elected 45th President November 2016 Who would have predicted this?
Slide 169: Who would have predicted this?
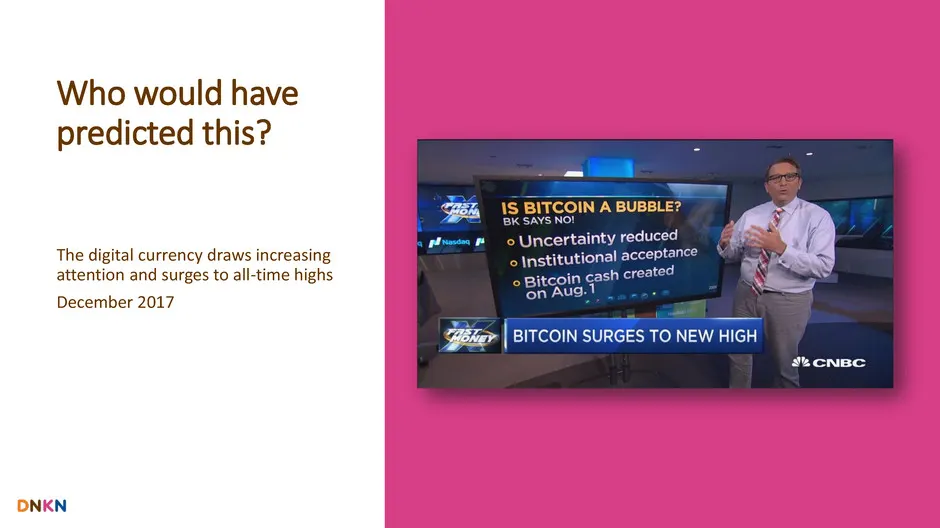
The digital currency draws increasing attention and surges to all-time highs December 2017 Who would have predicted this?

Slide 170: With all this change, we need to change too
…with all this change, we need to change too.
Slide 171: Redefining long-term guidance as a three-year horizon
So we are redefining “long-term” guidance as a three-year time horizon.
Slide 172: Our Financial Targets
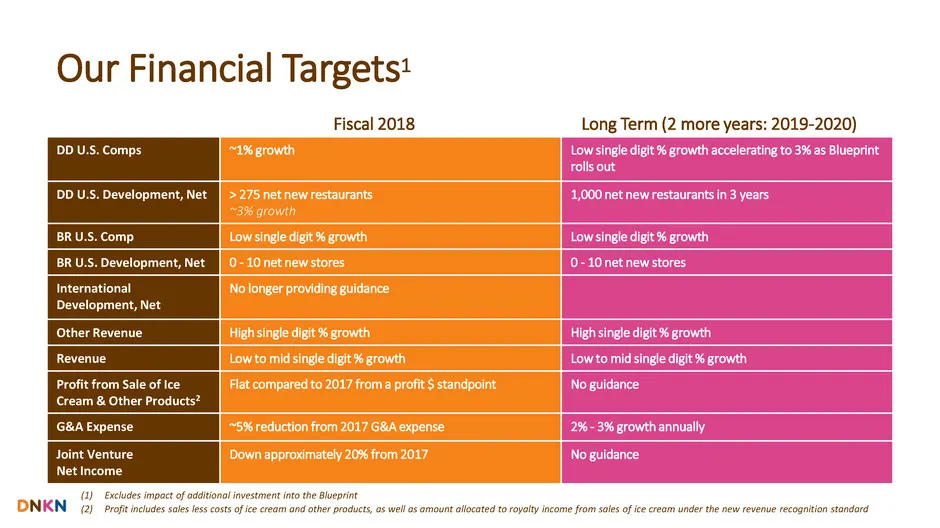
Our Financial Targets1 Fiscal 2018 Long Term (2 more years: 2019-2020) DD U.S. Comps ~1% growth Low single digit % growth accelerating to 3% as Blueprint rolls out DD U.S. Development, Net > 275 net new restaurants ~3% growth 1,000 net new restaurants in 3 years BR U.S. Comp Low single digit % growt
Slide 173: Our Financial Targets (cont'd)
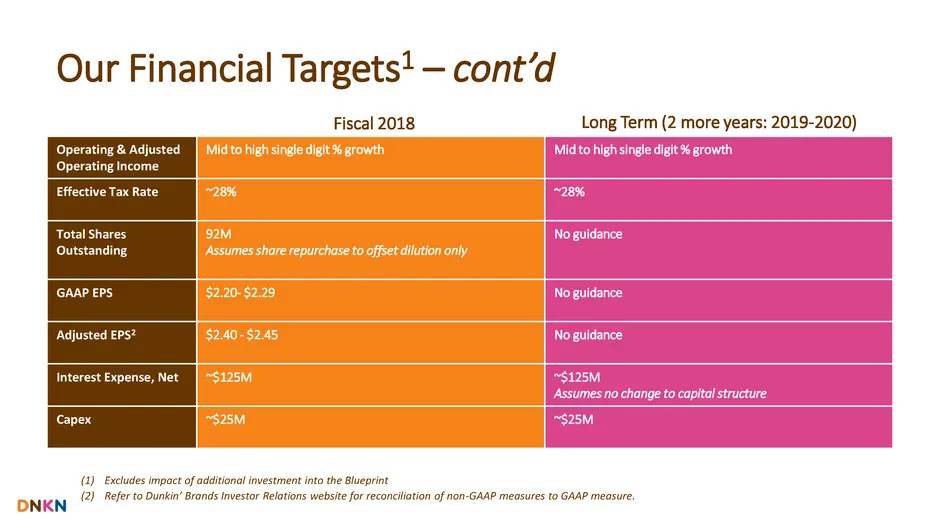
Our Financial Targets1 – cont’d Fiscal 2018 Long Term (2 more years: 2019-2020) Operating & Adjusted Operating Income Mid to high single digit % growth Mid to high single digit % growth Effective Tax Rate ~28% ~28% Total Shares Outstanding 92M Assumes share repurchase to offset dilution only No guid

Slide 174: Investment into Blueprint for DD U.S. Growth
Investment into Blueprint for DD U.S. Growth
Slide 175: Accelerating the Blueprint for DD U.S. Growth
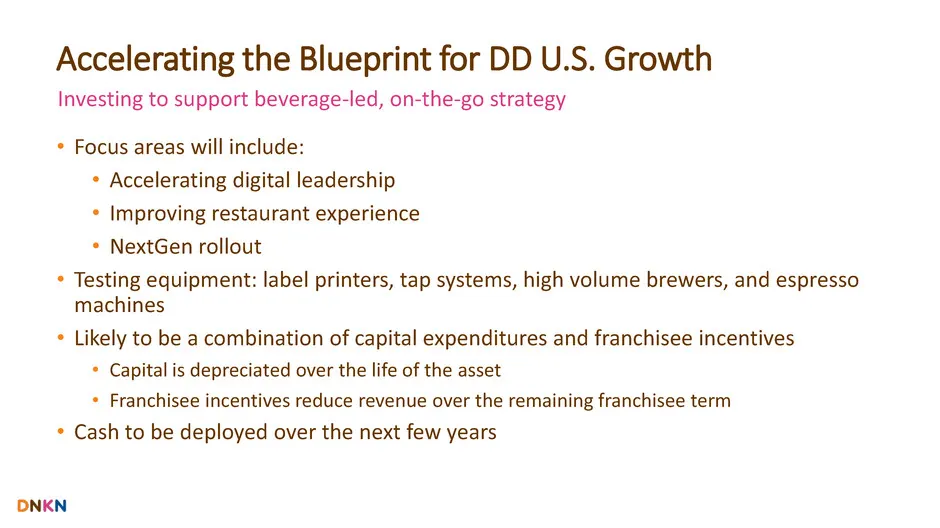
Accelerating the Blueprint for DD U.S. Growth • Focus areas will include: • Accelerating digital leadership • Improving restaurant experience • NextGen rollout • Testing equipment: label printers, tap systems, high volume brewers, and espresso machines • Likely to be a combination of capital expendi

Slide 176: Asset-Light Model Strength
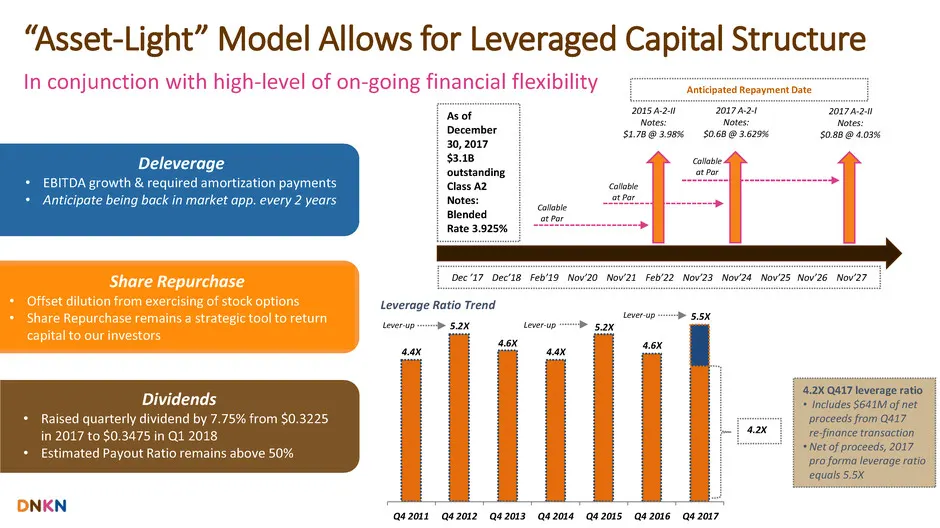
Asset-Light Model Strength Facilitates shareholder-friendly capital structure
Slide 177: Debt maturities, deleveraging and dividends
Dec ’17 Dec’18 Feb’19 Nov’20 Nov’21 Feb’22 Nov’23 Nov’24 Nov’25 Nov’26 Nov’27 Callable at Par Callable at Par Callable at Par As of December 30, 2017 $3.1B outstanding Class A2 Notes: Blended Rate 3.925% 2015 A-2-II Notes: $1.7B @ 3.98% 2017 A-2-I Notes: $0.6B @ 3.629% 2017 A-2-II Notes: $0.8B @ 4.0
Slide 178: $2 billion returned to shareholders since IPO
$2 billion returned to shareholders since July 2011 IPO…
Slide 179: The Perks of Investing in Dunkin' Brands
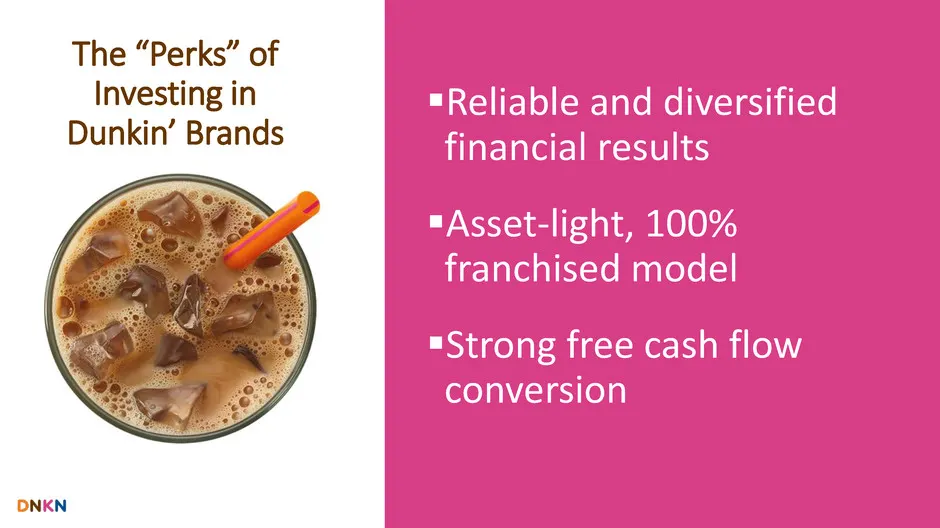
The “Perks” of Investing in Dunkin’ Brands Reliable and diversified financial results Asset-light, 100% franchised model Strong free cash flow conversion
Slide 180: Q&A
Q&A Nigel Travis, Chairman & CEO Dave Hoffmann, President of Dunkin’ Donuts U.S. Kate Jaspon, CFO
Slide 181: Top Takeaways
Top 10 Takeaways Nigel Travis, Chairman & CEO
Slide 182: Top Takeaways
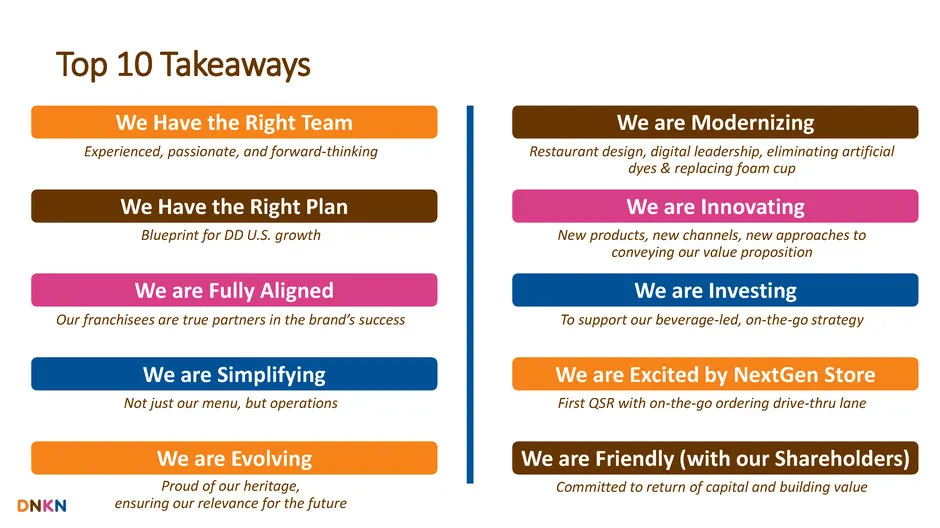
Top 10 Takeaways We Have the Right Team We Have the Right Plan We are Fully Aligned We are Simplifying We are Evolving We are Modernizing We are Innovating We are Investing We are Excited by NextGen Store We are Friendly (with our Shareholders) Experienced, passionate, and forward-thinking Blueprint
Slide 183: 2018 Investor & Analyst Day
2018 Investor & Analyst Day February 8, 2018
Source: SEC EDGAR · 8-K filed Feb 8, 2018
More decks from Dunkin' Brands Group Inc
 Q4 2019 Earnings Presentation33 slides · Feb 6, 2020
 Q1 2019 Earnings Presentation33 slides · May 2, 2019
 Q4 2018 Earnings Presentation32 slides · Feb 7, 2019
 Investor Presentation (November 2017)16 slides · Nov 16, 2017
 Q2 2017 Earnings Presentation26 slides · Jul 27, 2017
 Investor Presentation (October 2016)27 slides · Oct 20, 2016