First Sensor AG · XETR:SIS
First Sensor — Investor Presentation (August 2015)
24 slides from First Sensor's investor presentation, August 2015

Slide 1: We Engineer the Future – Investor Presentation
WE ENGINEER THE FUTURE INVESTOR PRESENTATION AUGUST, 2015
Slide 2: First Sensor Company Profile
FIRST SENSOR COMPANY PROFILE First Sensor AG is one of the world's leading suppliers in the field of sensor systems. Our company develops and manufactures standardized and customized sensor solutions for applications in the Industrial, Medical and Mobility growth markets.
Slide 3: Company Profile: leading provider of sensor solutions
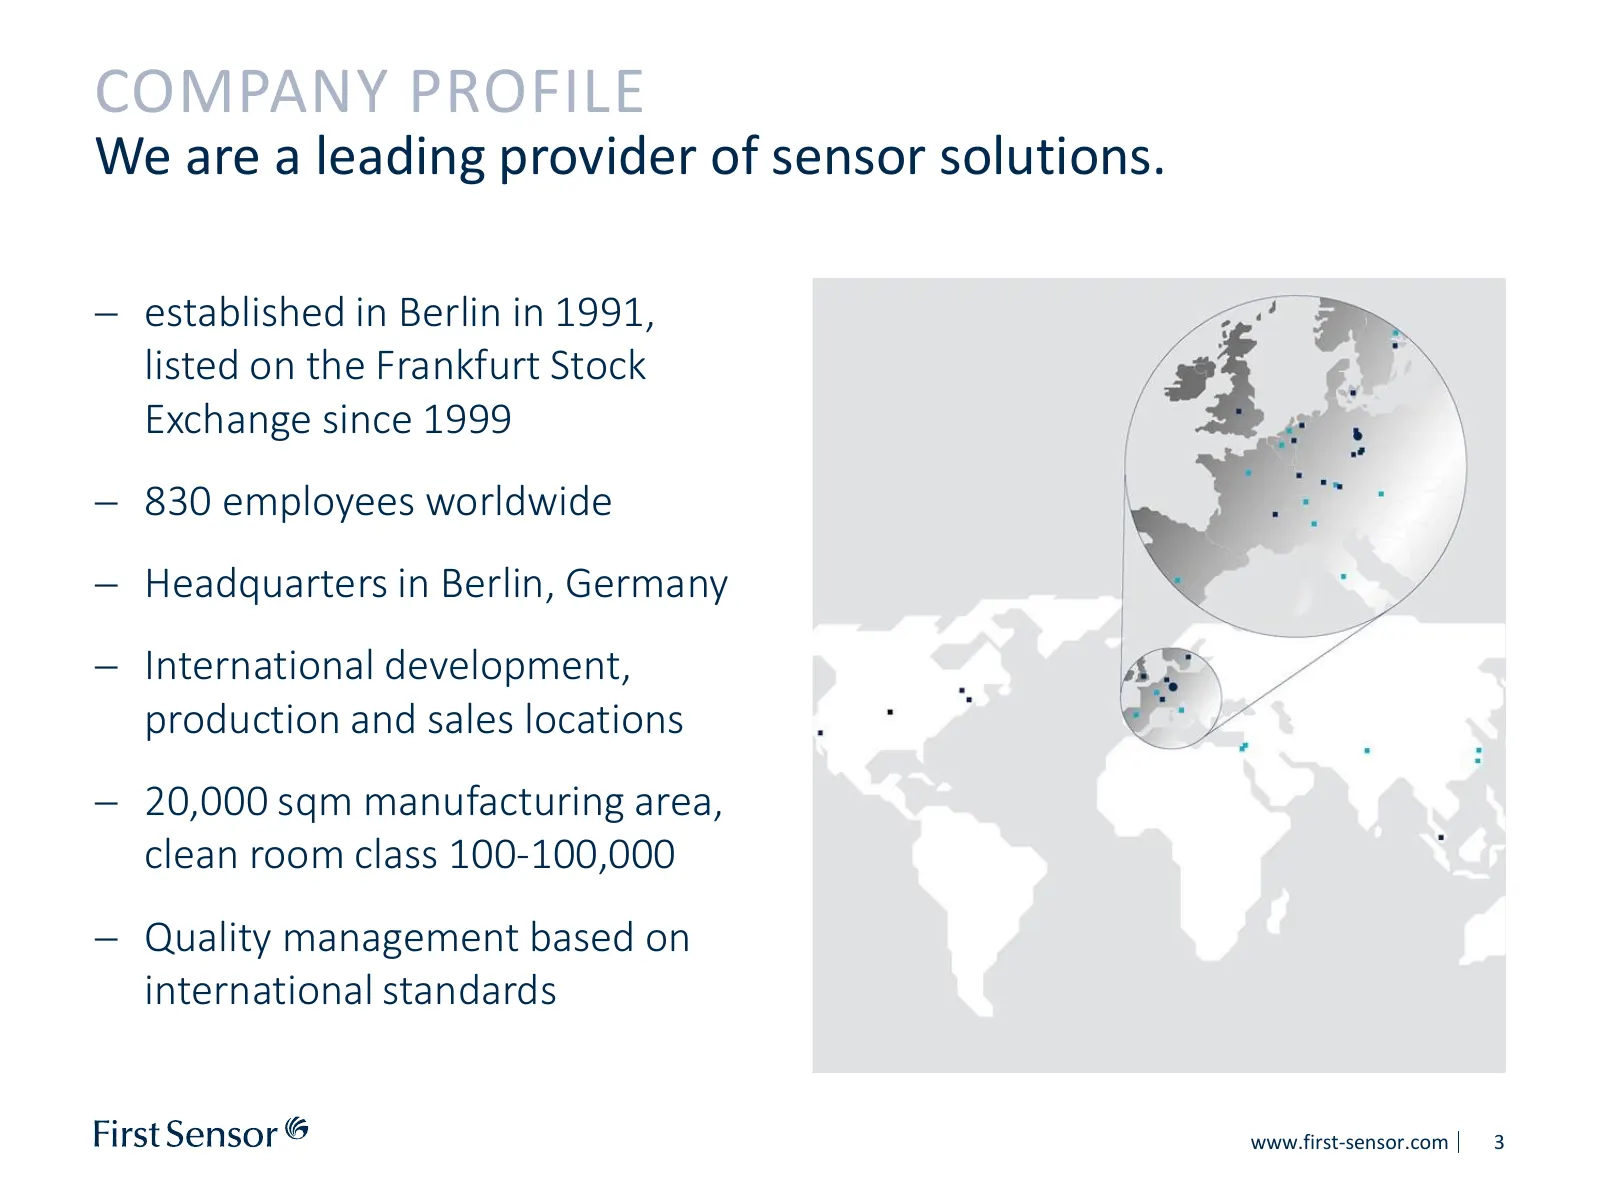
COMPANY PROFILE We are a leading provider of sensor solutions. − established in Berlin in 1991, listed on the Frankfurt Stock Exchange since 1999 − 830 employees worldwide − Headquarters in Berlin, Germany − International development, production and sales locations − 20,000 sqm manufacturing area, c
Slide 4: Company Profile: entire value chain for sensor technologies
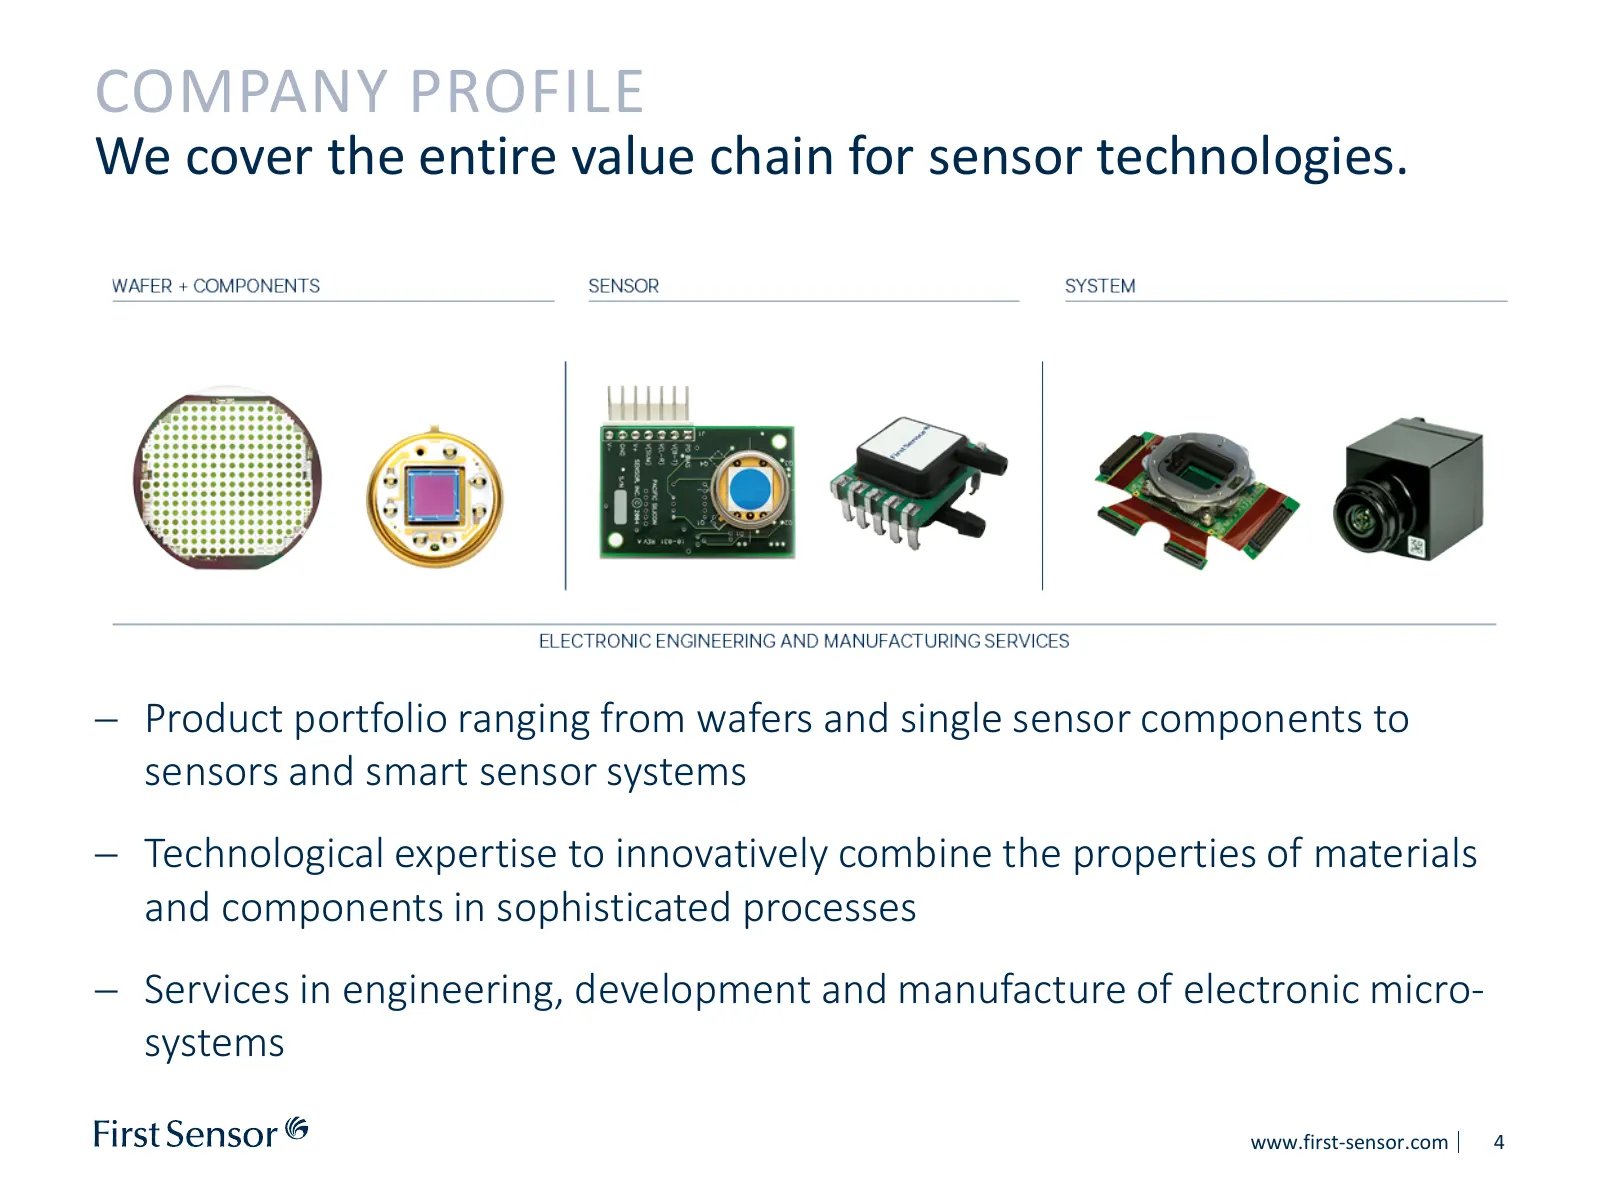
COMPANY PROFILE We cover the entire value chain for sensor technologies. − Product portfolio ranging from wafers and single sensor components to sensors and smart sensor systems − Technological expertise to innovatively combine the properties of materials and components in sophisticated processes −
Slide 5: Focus on Industrial, Medical and Mobility markets
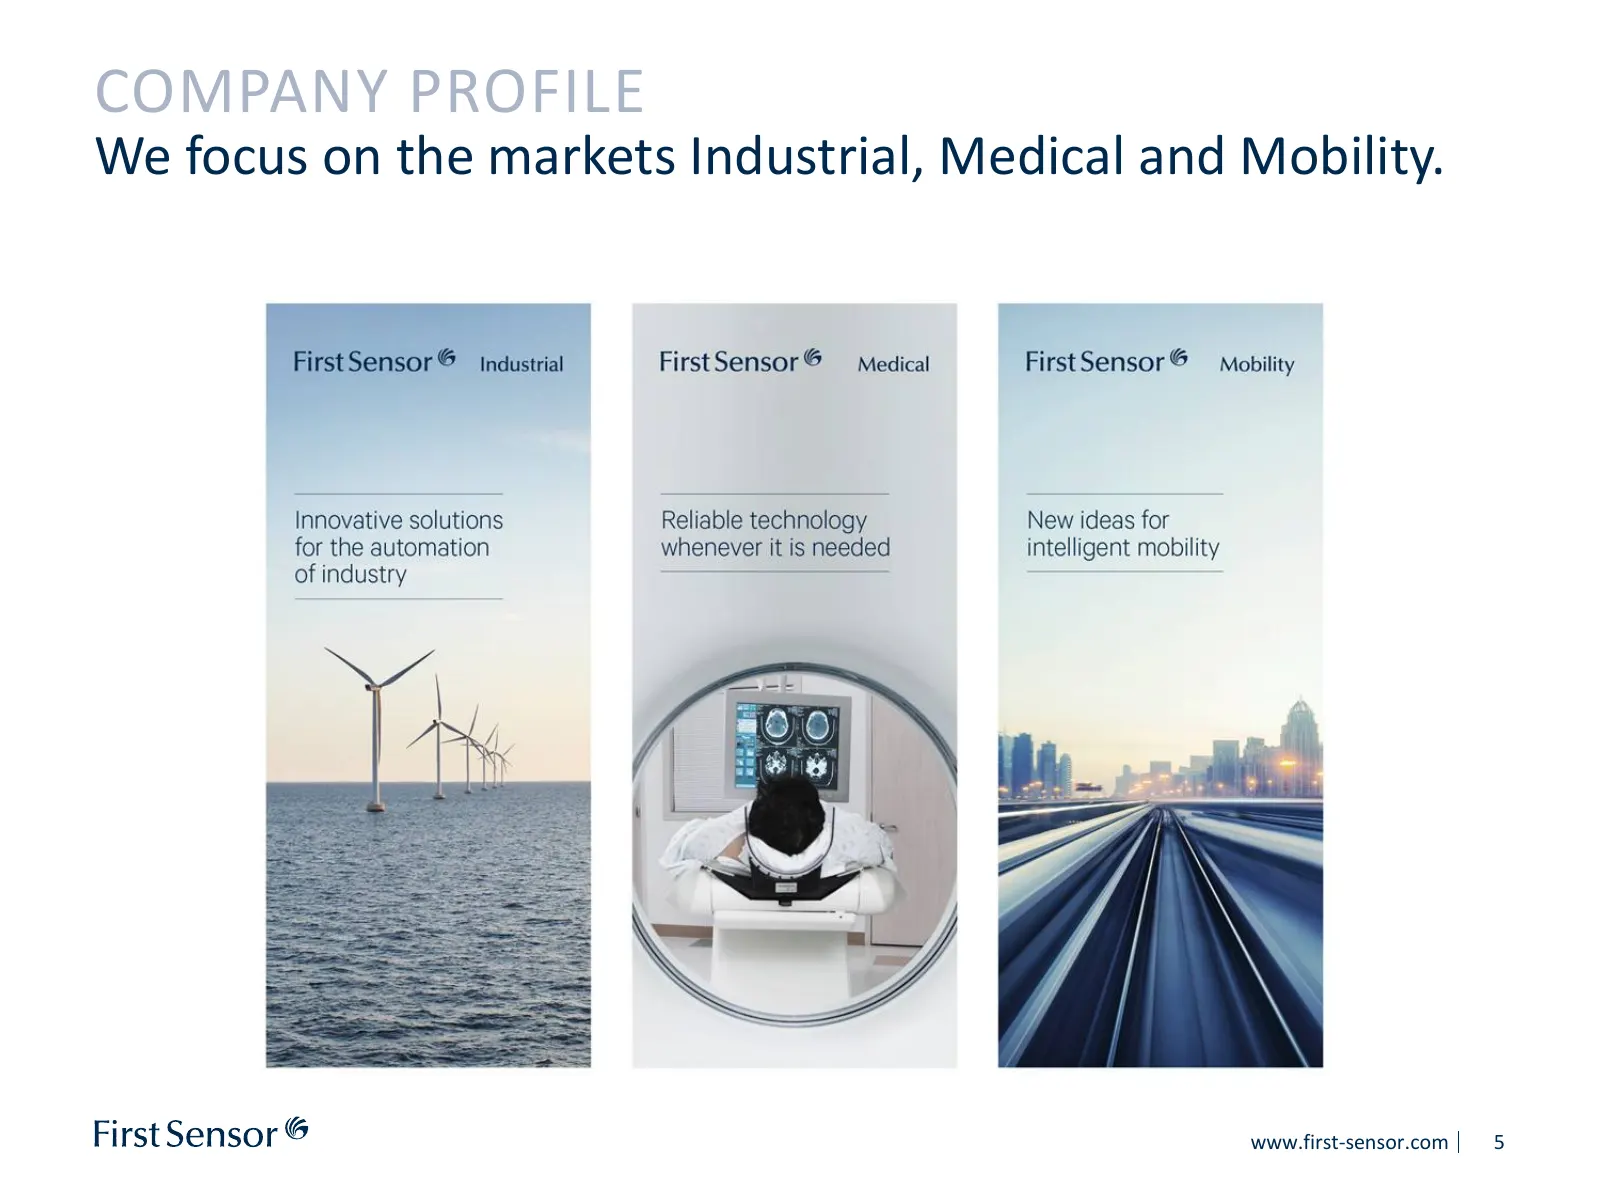
COMPANY PROFILE We focus on the markets Industrial, Medical and Mobility. www.first-sensor.com 5
Slide 6: Business Unit Industrial at a glance
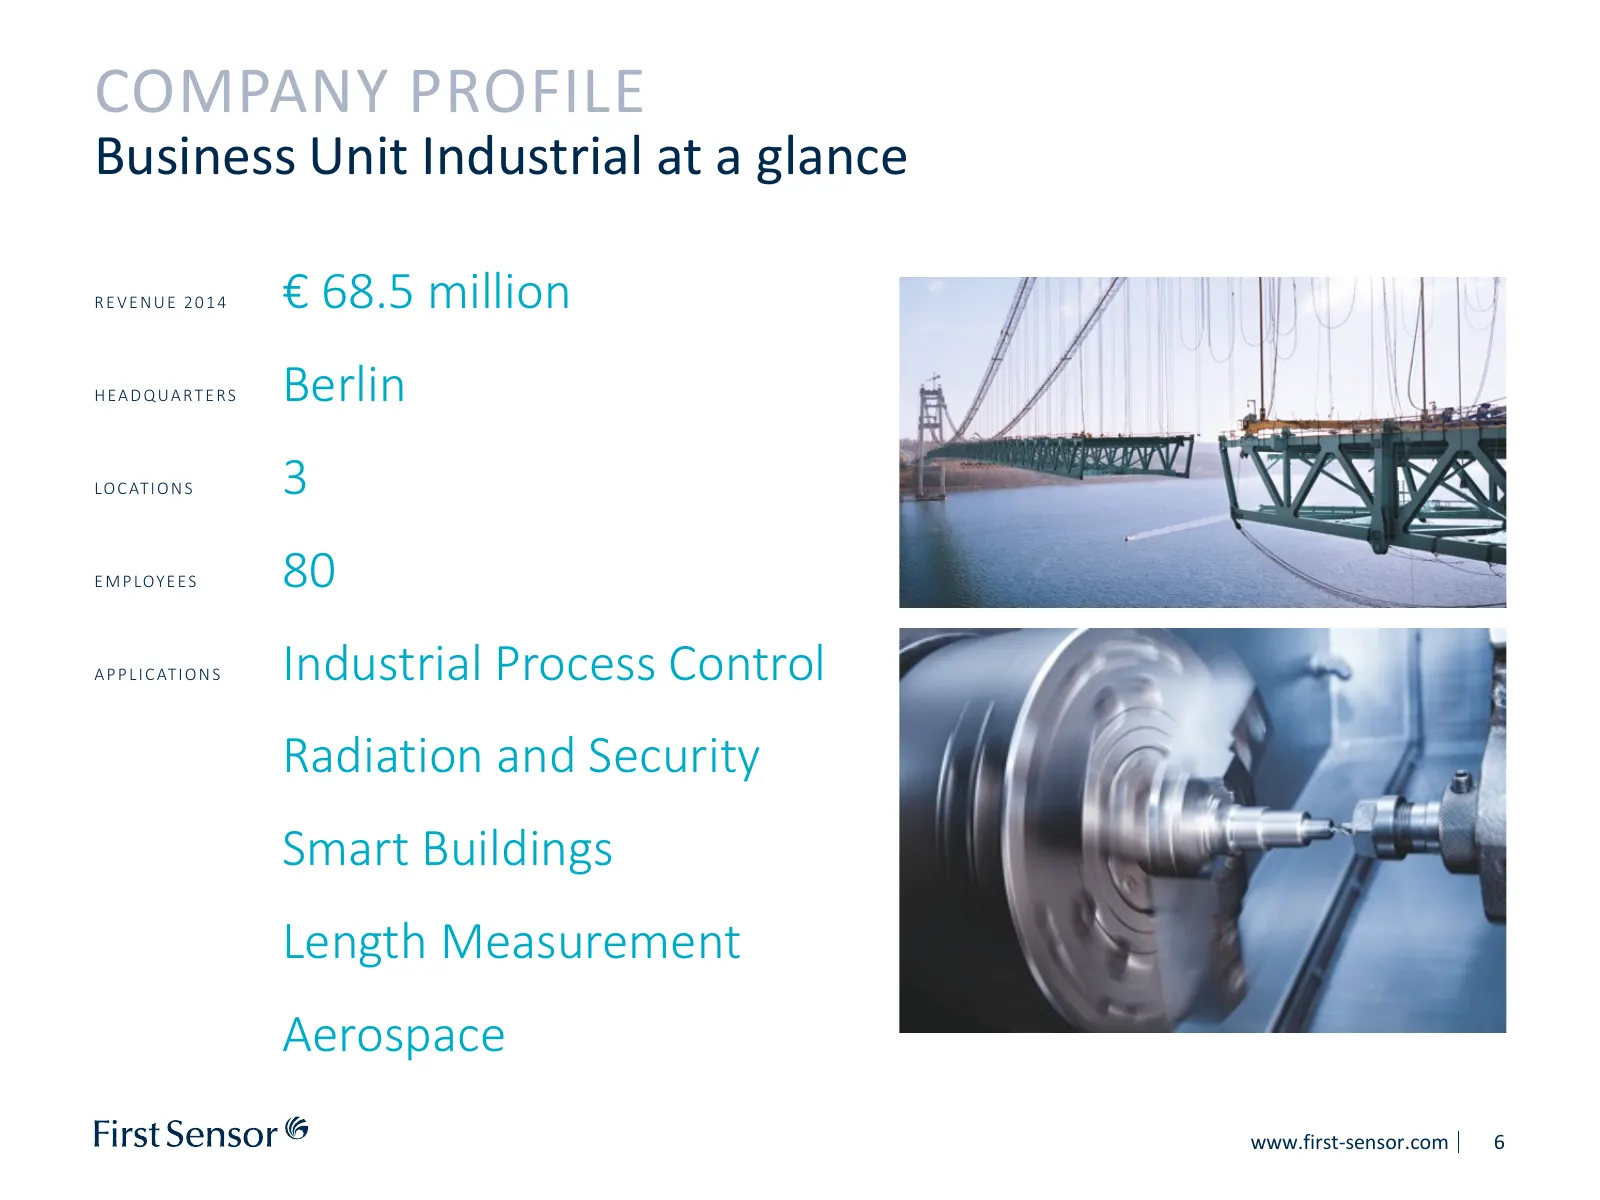
COMPANY PROFILE Business Unit Industrial at a glance REVENUE 2014 € 68.5 million HEADQUARTERS Berlin LO C AT I O N S 3 E M P LOY E E S 80 A P P L I C AT I O N S Industrial Process Control Radiation and Security Smart Buildings Length Measurement Aerospace www.first-sensor.com 6
Slide 7: Business Unit Medical at a glance
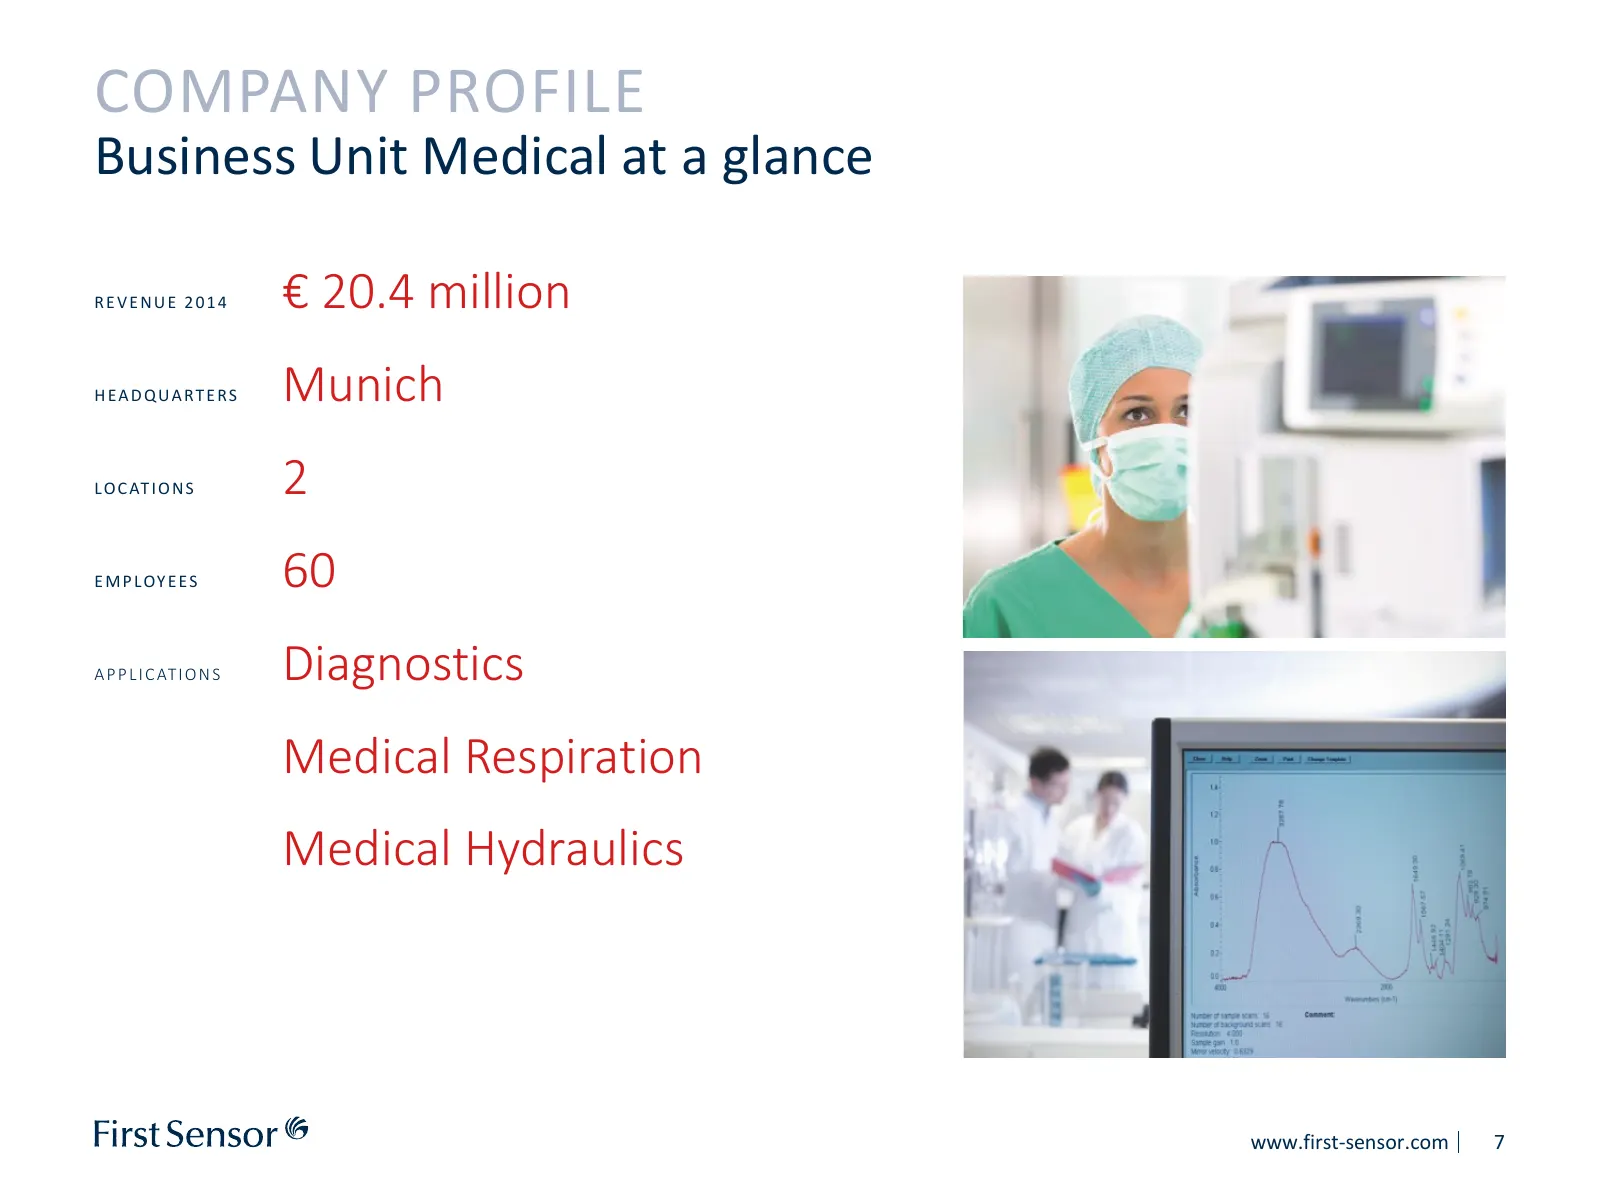
COMPANY PROFILE Business Unit Medical at a glance REVENUE 2014 € 20.4 million H E A D Q U A RT E RS Munich L O C AT I O N S 2 E M P L OY E E S 60 A P P L I C AT I O N S Diagnostics Medical Respiration Medical Hydraulics www.first-sensor.com 7
Slide 8: Business Unit Mobility at a glance
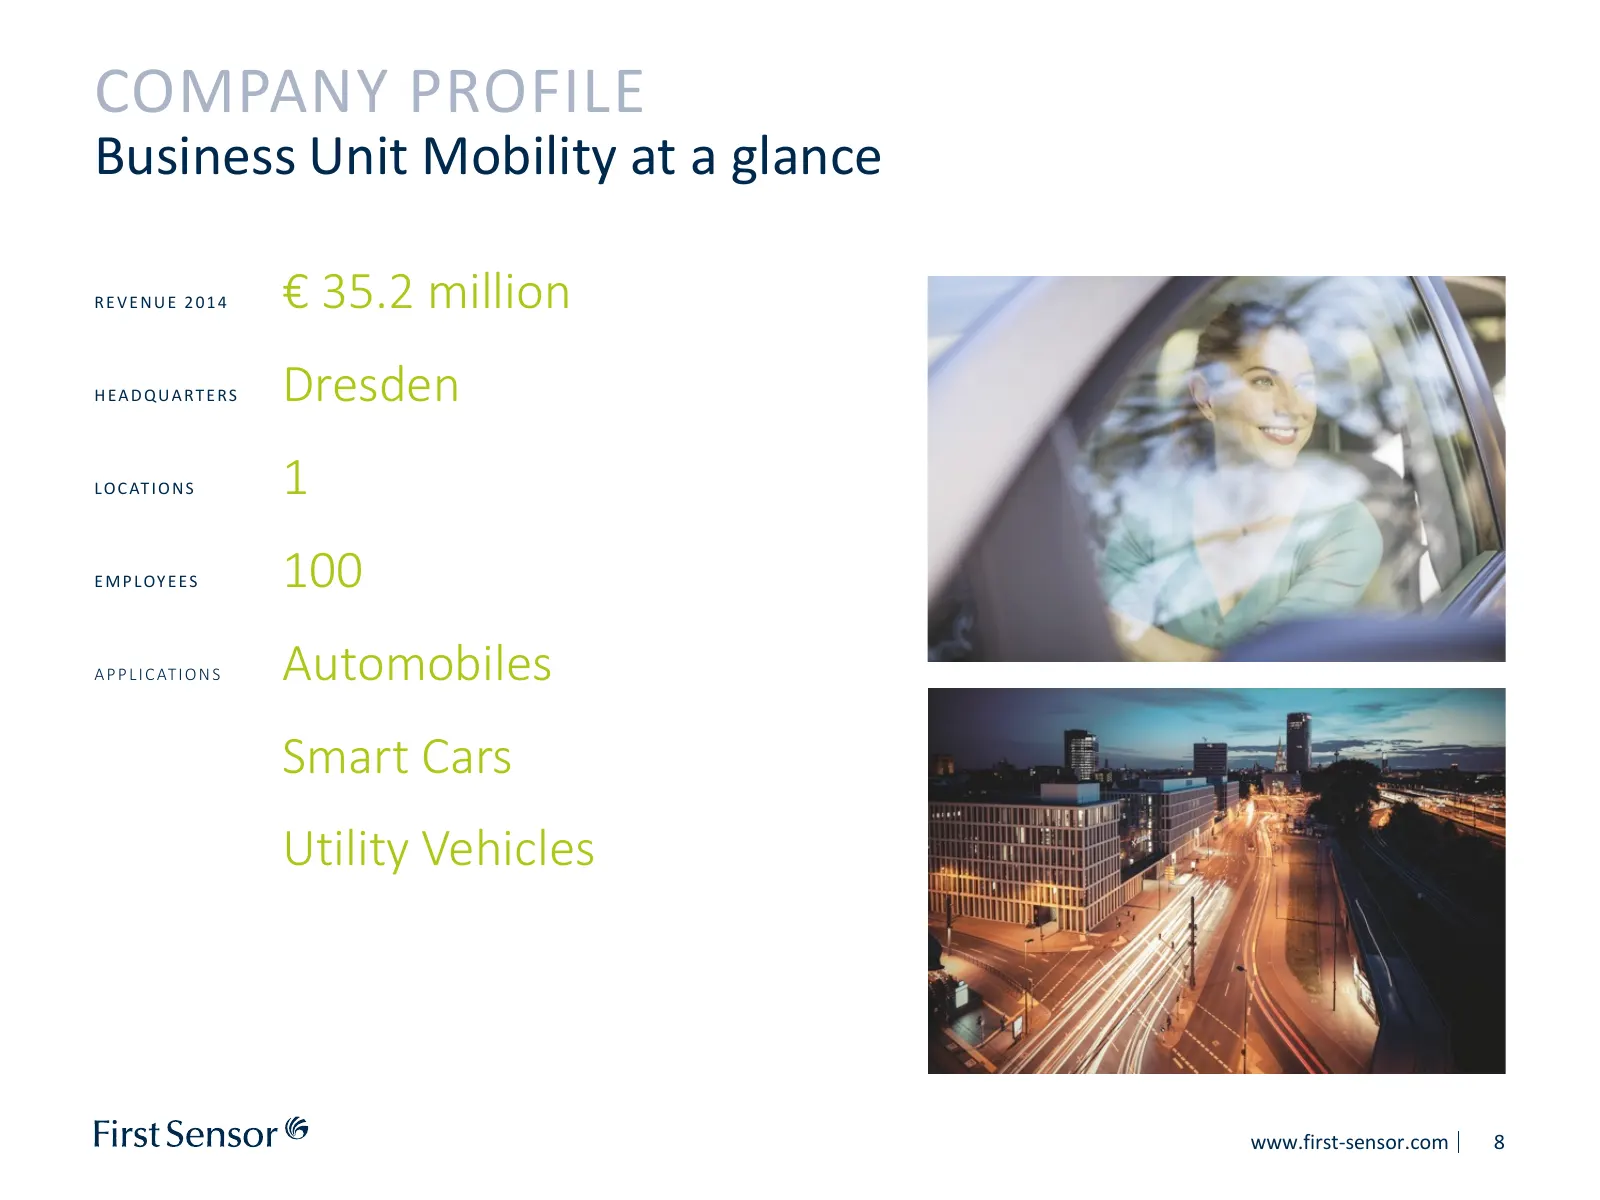
COMPANY PROFILE Business Unit Mobility at a glance REVENUE 2014 € 35.2 million H E A D Q U A RT E RS Dresden L O C AT I O N S 1 E M P L OY E E S 100 A P P L I C AT I O N S Automobiles Smart Cars Utility Vehicles www.first-sensor.com 8
Slide 9: We are clearly on a path of growth
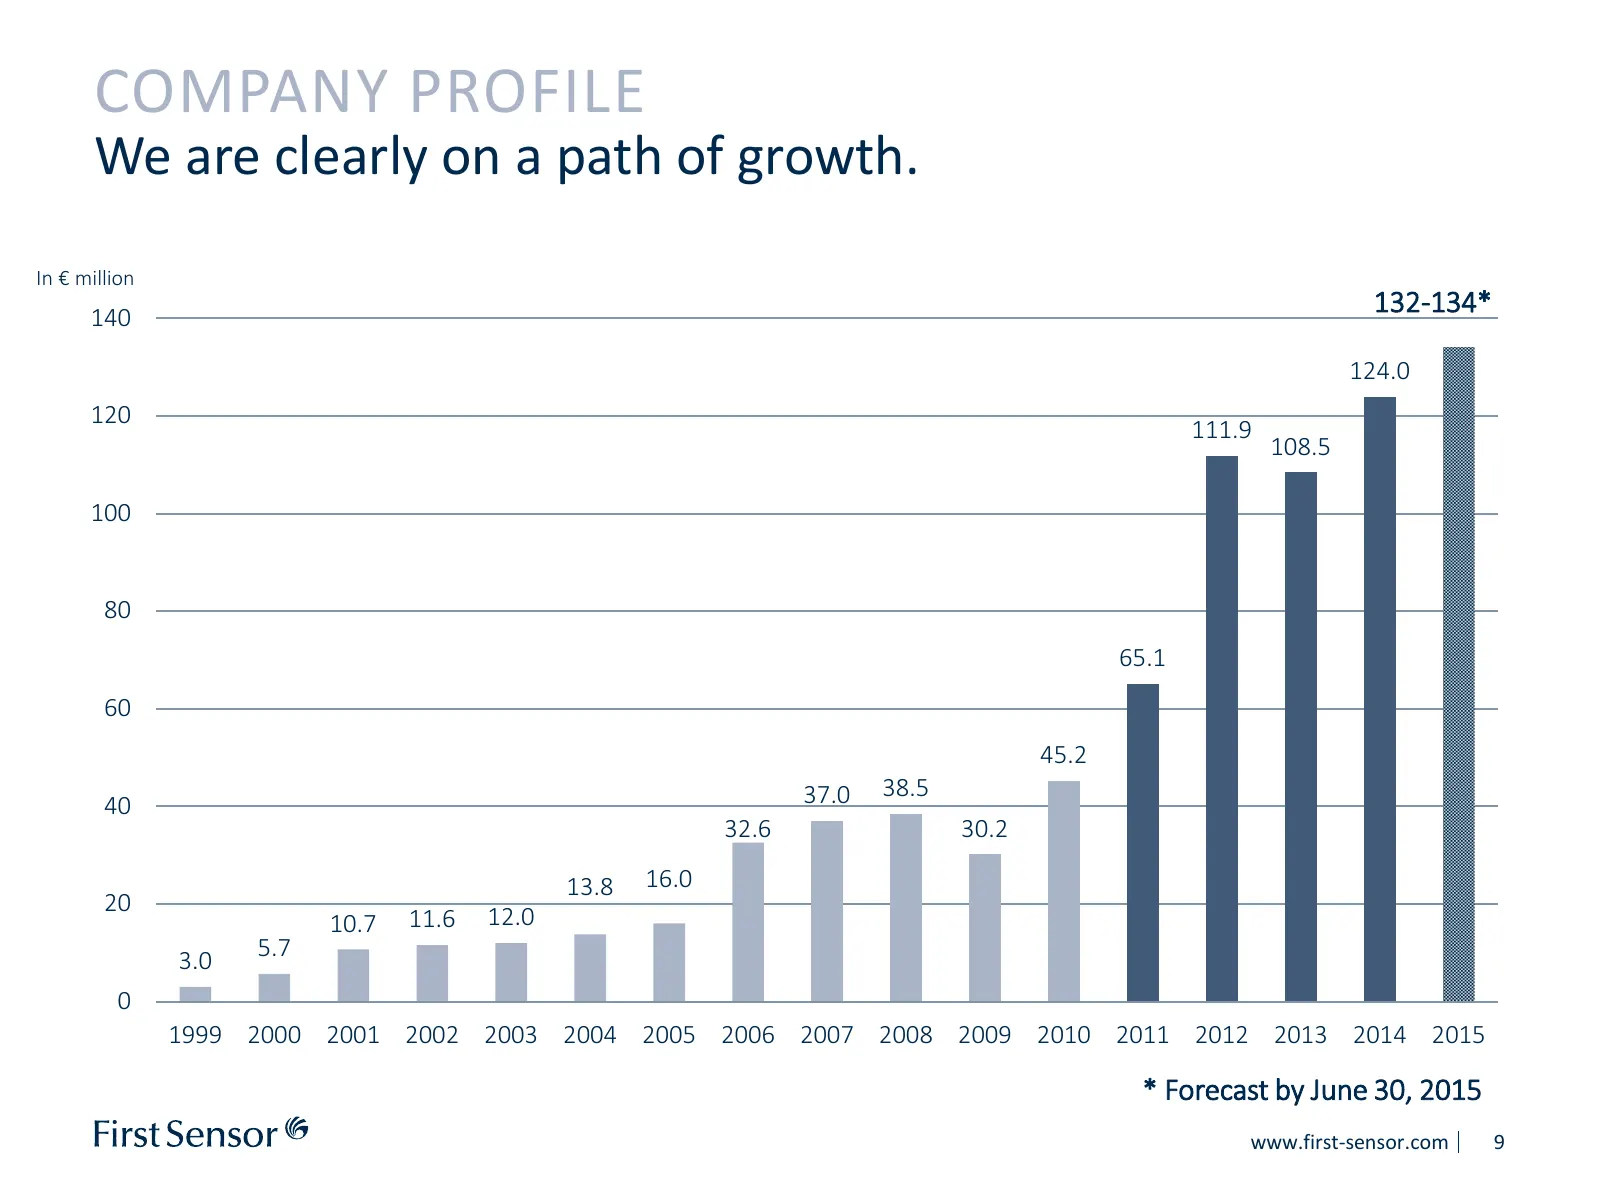
COMPANY PROFILE We are clearly on a path of growth. In € million 140 132-134* 124.0 120 111.9 108.5 100 80 65.1 60 45.2 37.0 38.5 40 32.6 30.2 13.8 16.0 20 10.7 11.6 12.0 3.0 5.7 0 1999 2000 2001 2002 2003 2004 2005 2006 2007 2008 2009 2010 2011 2012 2013 2014 2015 * Forecast by June 30, 2015 www.fi
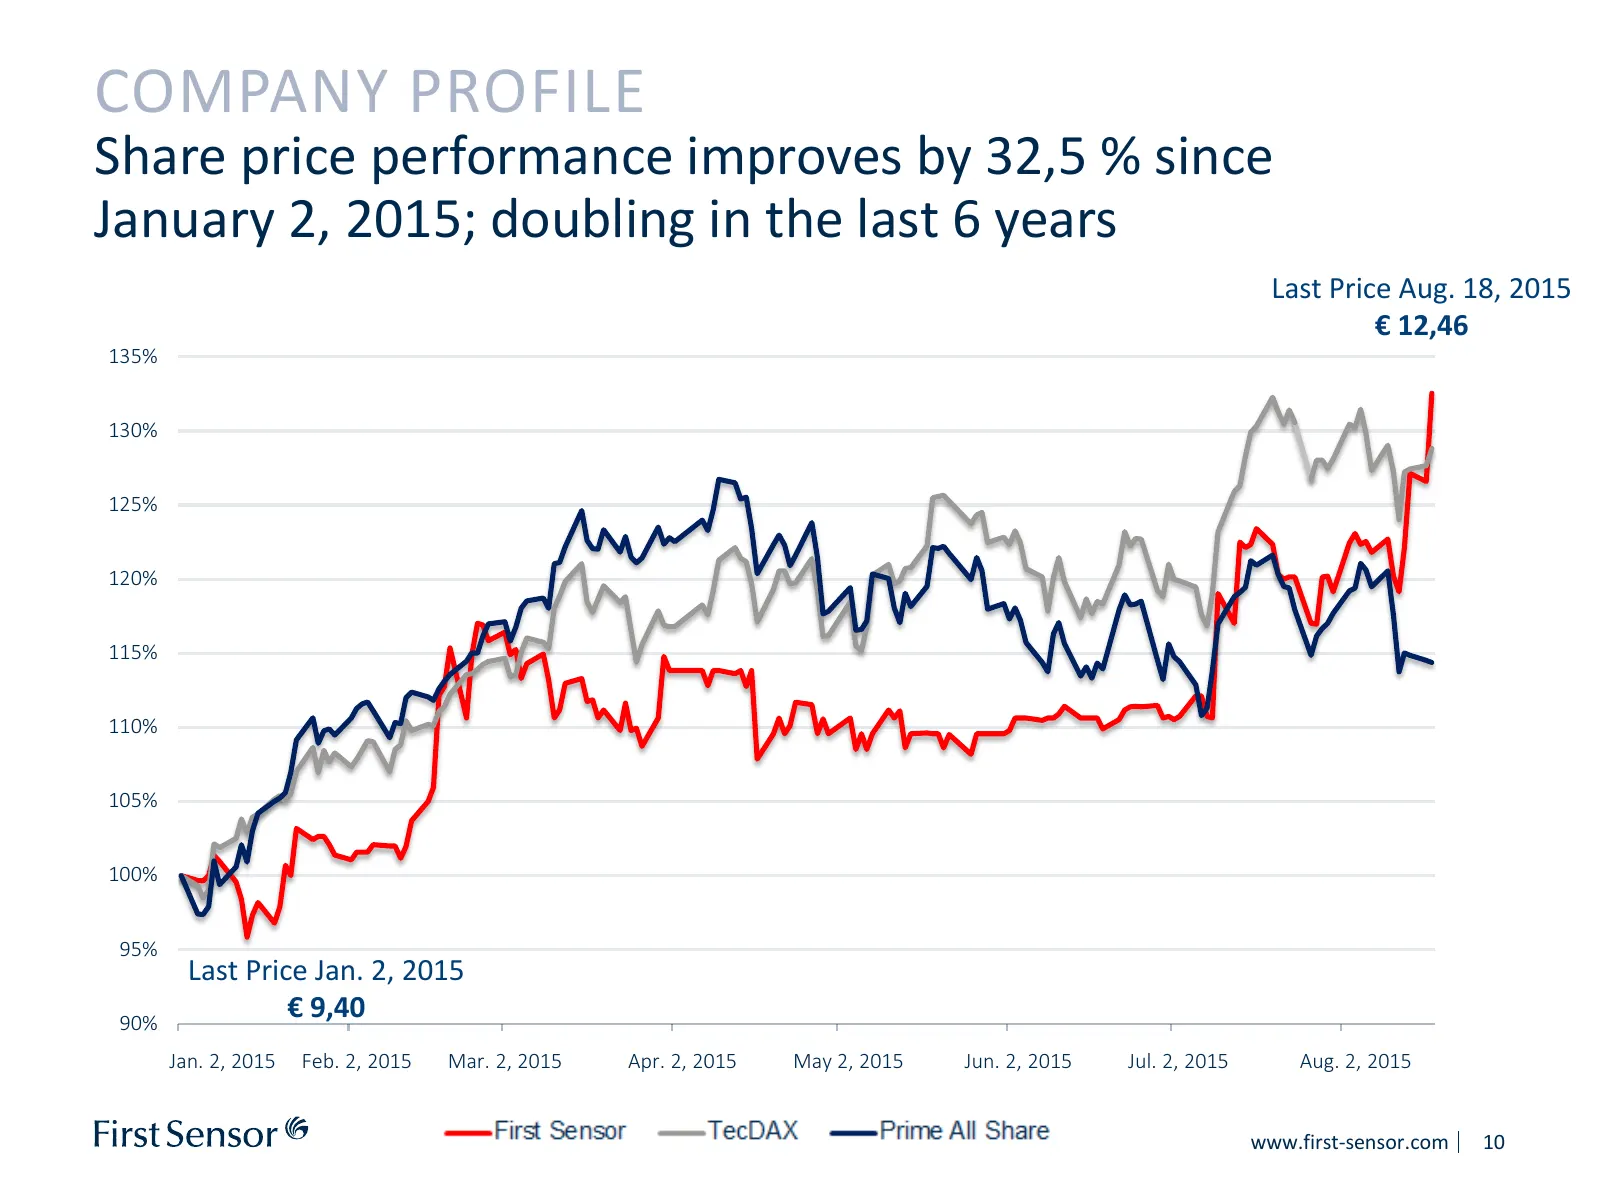
Slide 10: Share price performance improves by 32.5% since January 2015
COMPANY PROFILE Share price performance improves by 32,5 % since January 2, 2015; doubling in the last 6 years Last Price Aug. 18, 2015 € 12,46 135% 130% 125% 120% 115% 110% 105% 100% 95% Last Price Jan. 2, 2015 90% € 9,40 Jan. 2, 2015 Feb. 2, 2015 Mar. 2, 2015 Apr. 2, 2015 May 2, 2015 Jun. 2, 2015
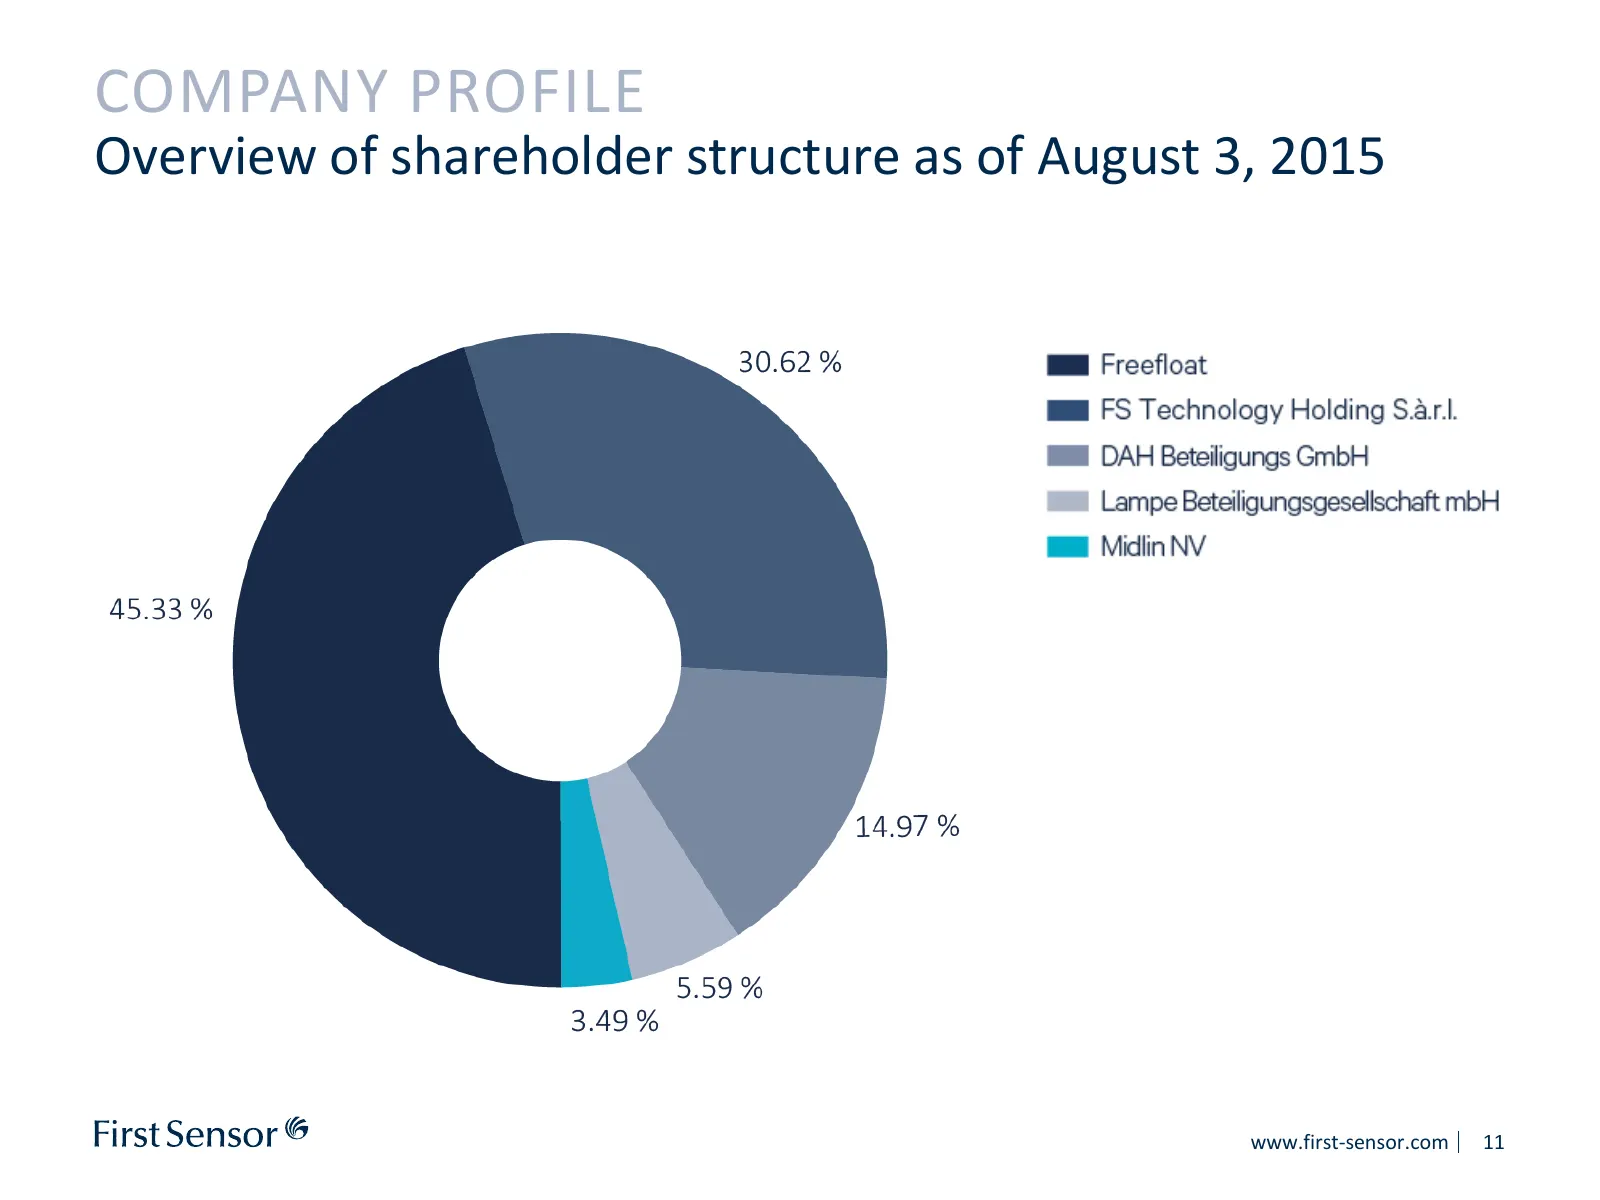
Slide 11: Overview of shareholder structure as of August 3, 2015
COMPANY PROFILE Overview of shareholder structure as of August 3, 2015 www.first-sensor.com 11
Slide 12: Key Figures
KEY FIGURES We have successfully implemented a new strategic position and organizational structure in 2014. Our medium-term goal is to lead the market in the areas of automotive, industrial and medical applications.
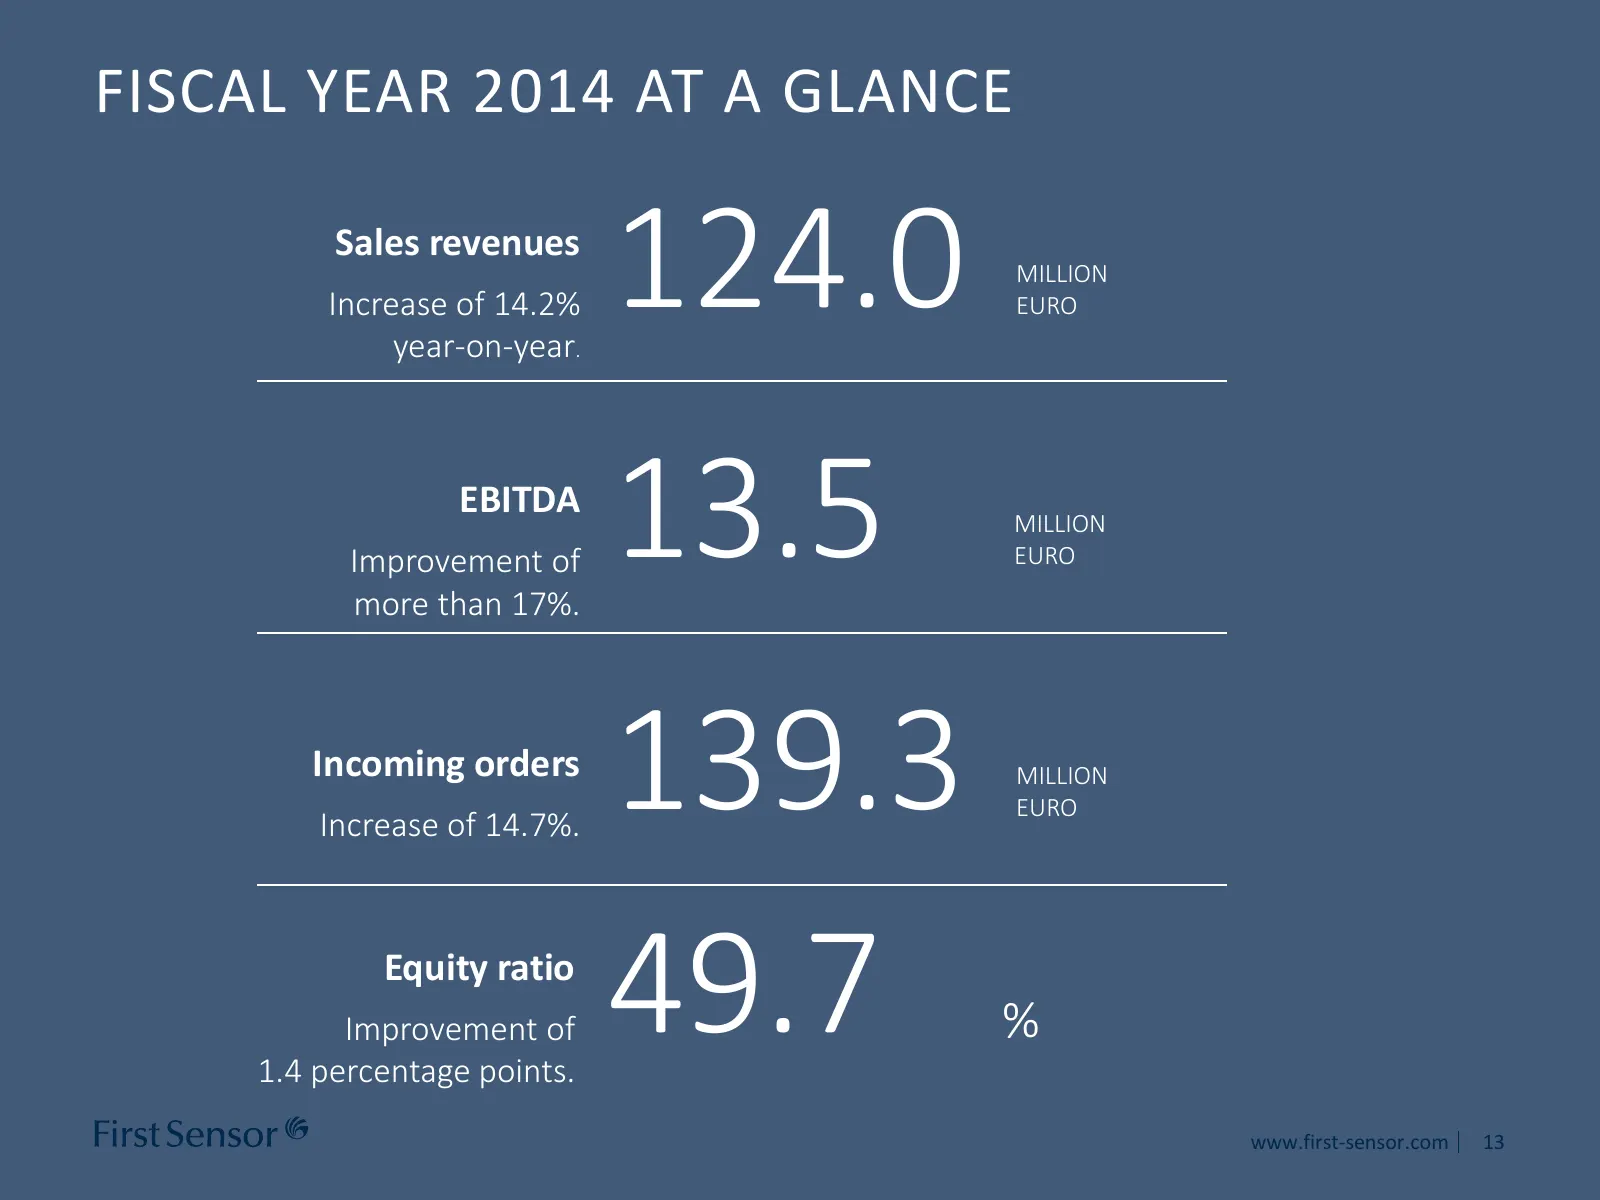
Slide 13: Fiscal Year 2014 at a Glance
FISCAL YEAR 2014 AT A GLANCE Sales revenues Increase of 14.2% year-on-year. 124.0 MILLION EURO EBITDA Improvement of more than 17%. 13.5 MILLION EURO Incoming orders Increase of 14.7%. 139.3 MILLION EURO Equity ratio Improvement of 1.4 percentage points. 49.7 % www.first-sensor.com 13
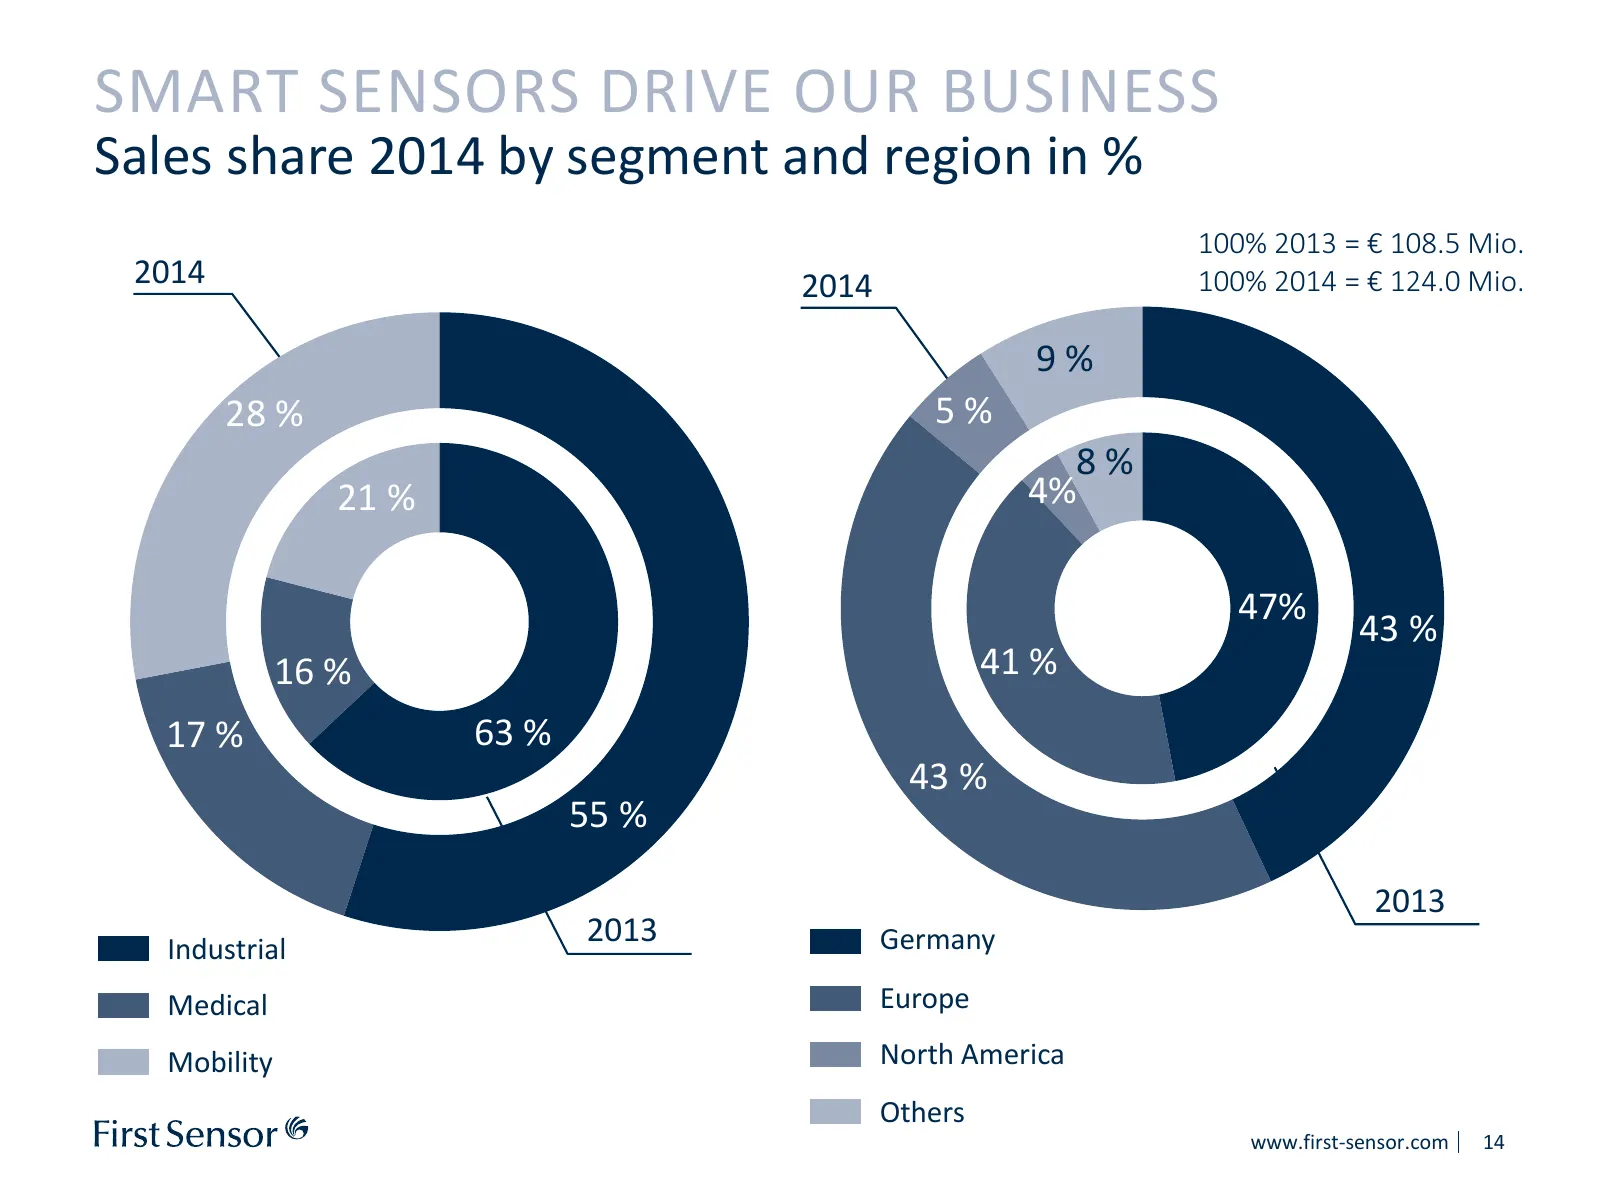
Slide 14: Smart Sensors Drive Our Business
SMART SENSORS DRIVE OUR BUSINESS Sales share 2014 by segment and region in % 100% 2013 = € 108.5 Mio. 2014 2014 100% 2014 = € 124.0 Mio. 9% 28 % 5% 8% 21 % 4% 47% 43 % 16 % 41 % 17 % 63 % 43 % 55 % 2013 Industrial 2013 Germany Medical Europe Mobility North America Others www.first-sensor.com 14
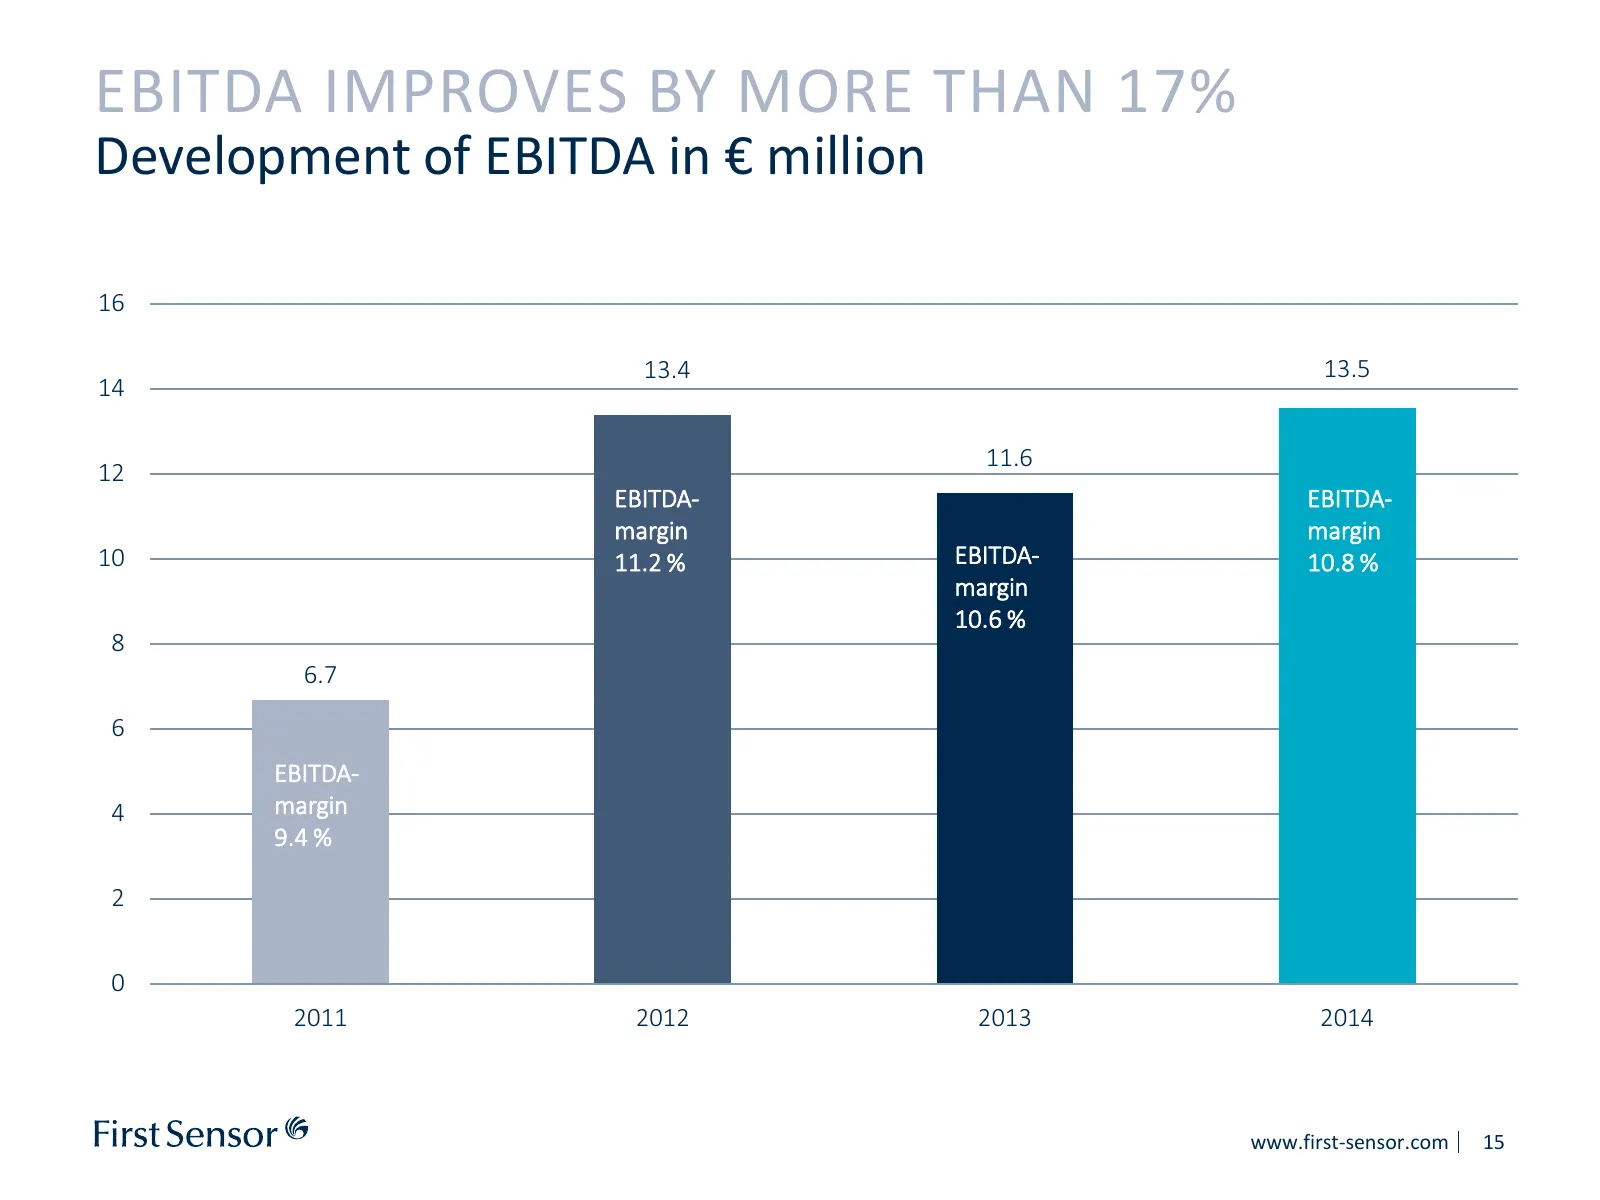
Slide 15: EBITDA Improves by More Than 17%
EBITDA IMPROVES BY MORE THAN 17% Development of EBITDA in € million 16 13.4 13.5 14 11.6 12 EBITDA- EBITDA- margin margin 10 11.2 % EBITDA- 10.8 % margin 10.6 % 8 6.7 6 EBITDA- 4 margin 9.4 % 2 0 2011 2012 2013 2014 www.first-sensor.com 15
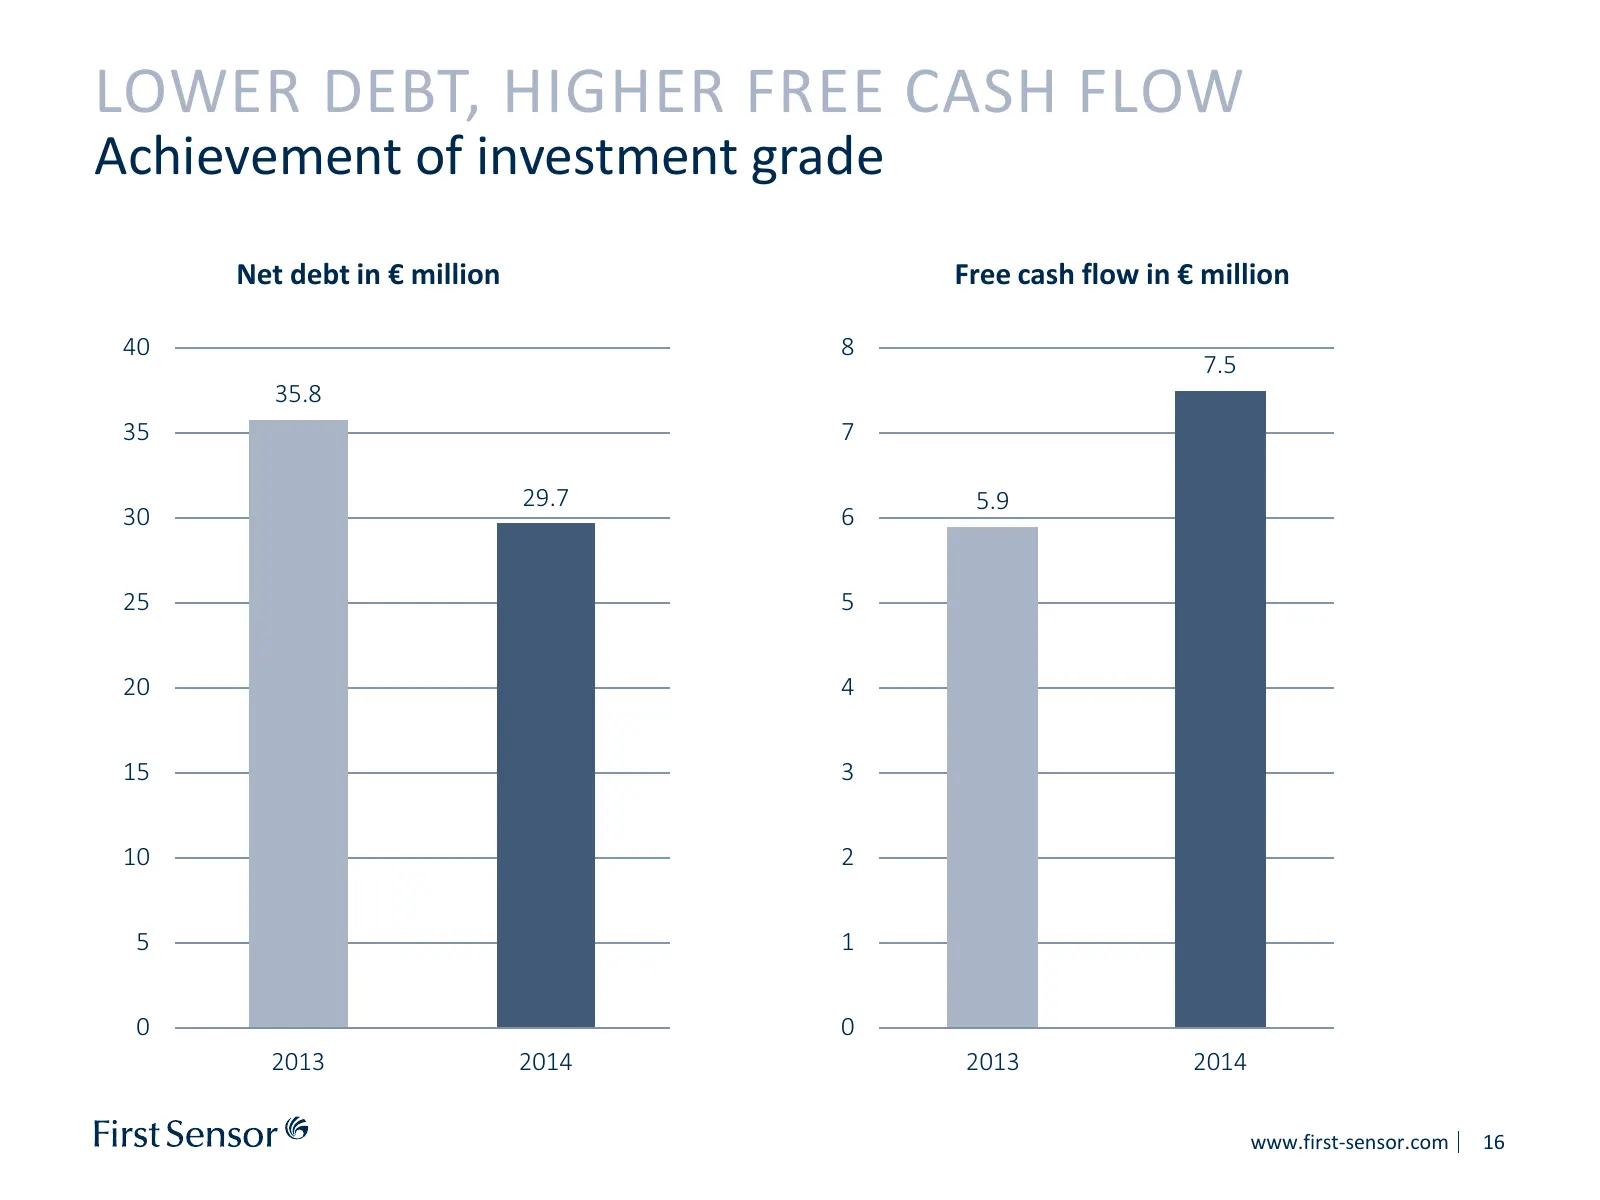
Slide 16: Lower Debt, Higher Free Cash Flow
LOWER DEBT, HIGHER FREE CASH FLOW Achievement of investment grade Net debt in € million Free cash flow in € million 40 8 7.5 35.8 35 7 29.7 5.9 30 6 25 5 20 4 15 3 10 2 5 1 0 0 2013 2014 2013 2014 www.first-sensor.com 16
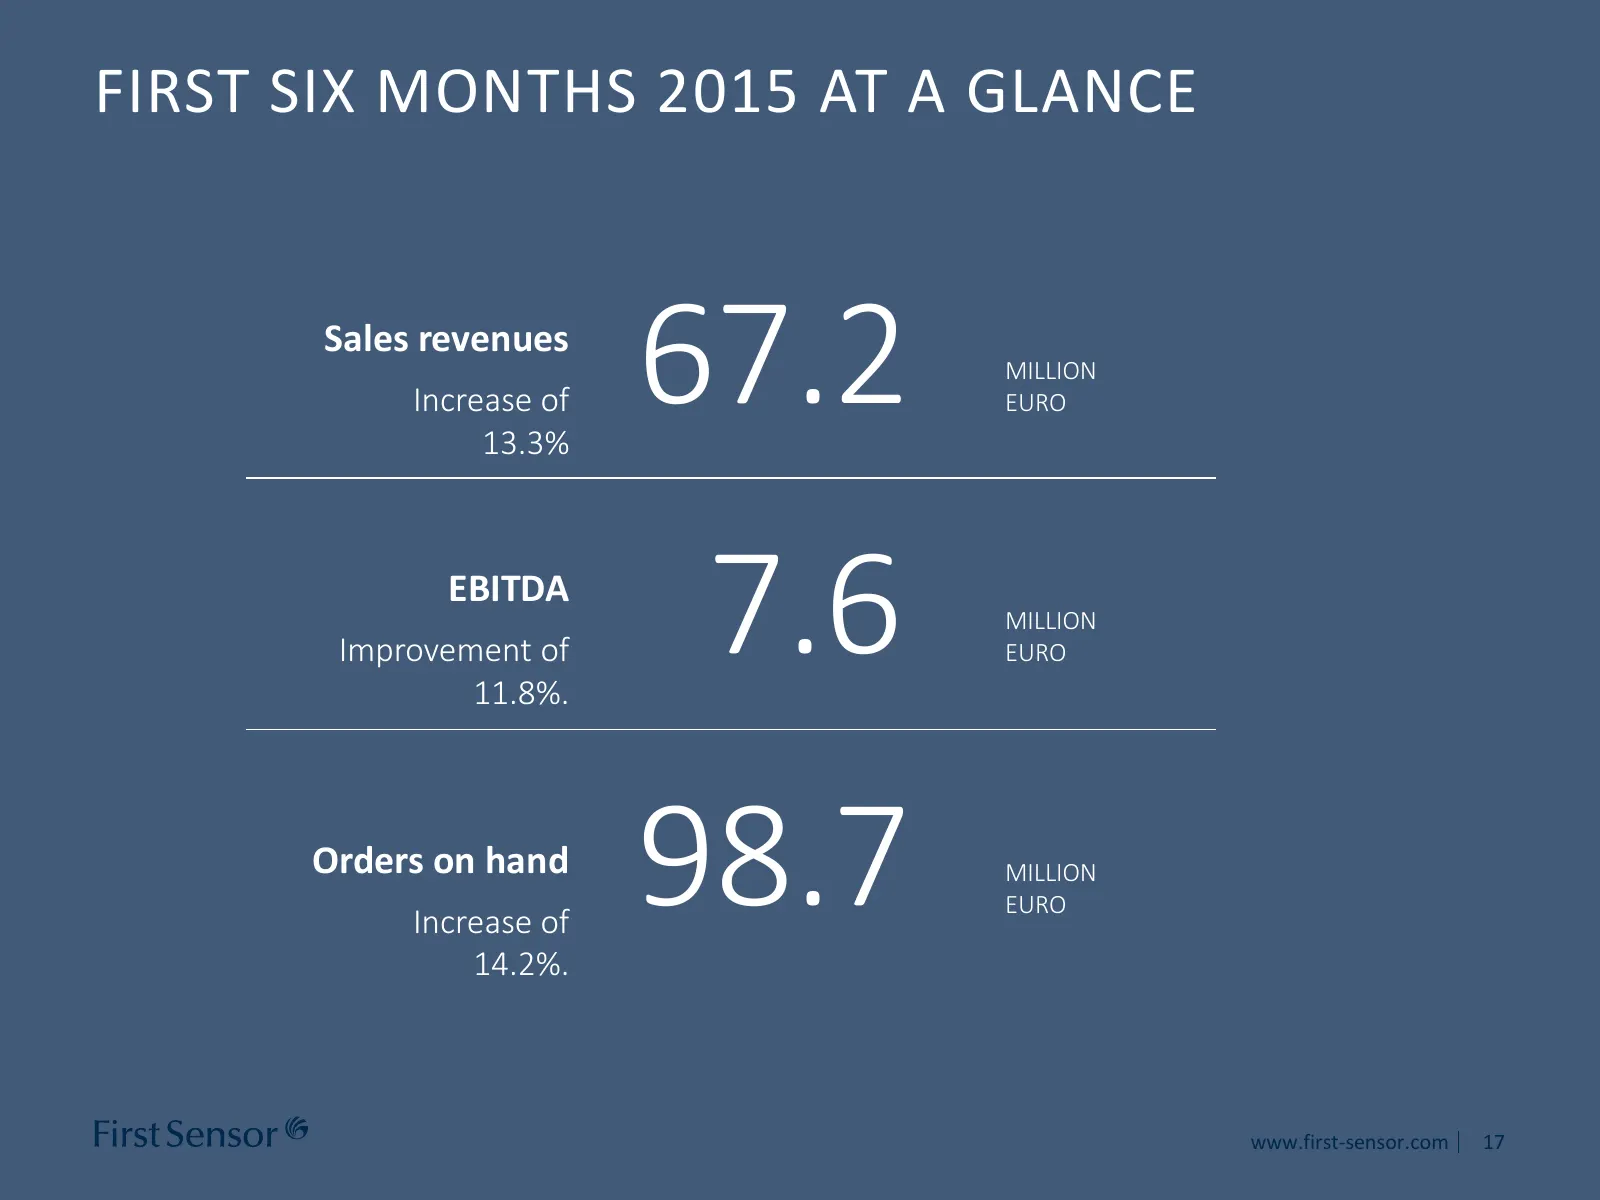
Slide 17: First Six Months 2015 at a Glance
FIRST SIX MONTHS 2015 AT A GLANCE Sales revenues Increase of 13.3% 67.2 MILLION EURO EBITDA Improvement of 11.8%. 7.6 MILLION EURO Orders on hand Increase of 14.2%. 98.7 MILLION EURO www.first-sensor.com 17
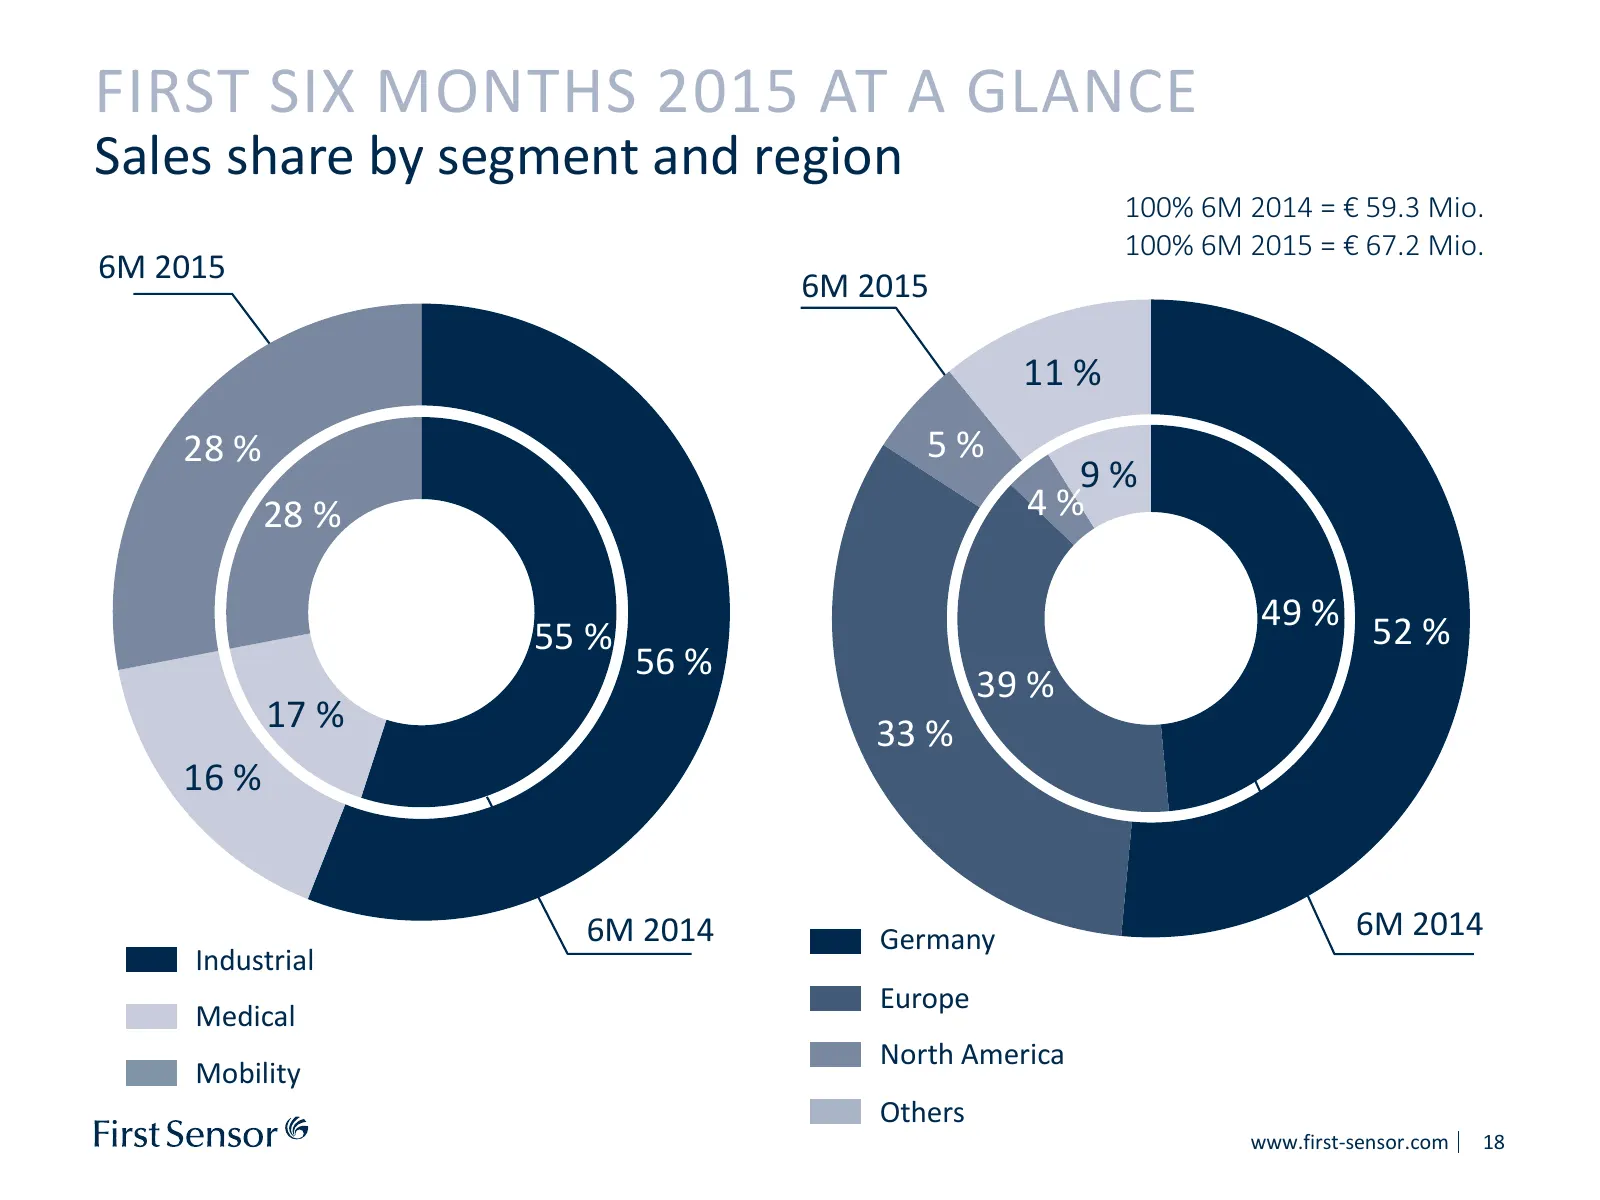
Slide 18: First Six Months 2015 at a Glance – sales by segment and region
FIRST SIX MONTHS 2015 AT A GLANCE Sales share by segment and region 100% 6M 2014 = € 59.3 Mio. 100% 6M 2015 = € 67.2 Mio. 6M 2015 6M 2015 11 % 28% 5% 28 % 5% 4% 9% 28 %28 % 4% 49% 49 % 52% 55 % 52 % 17% 56 % 39% 39 % 17 % 55% 33 % 16% 16 % 33% 56% 6M 2014 Germany 6M 2014 Industrial Europe Medical No
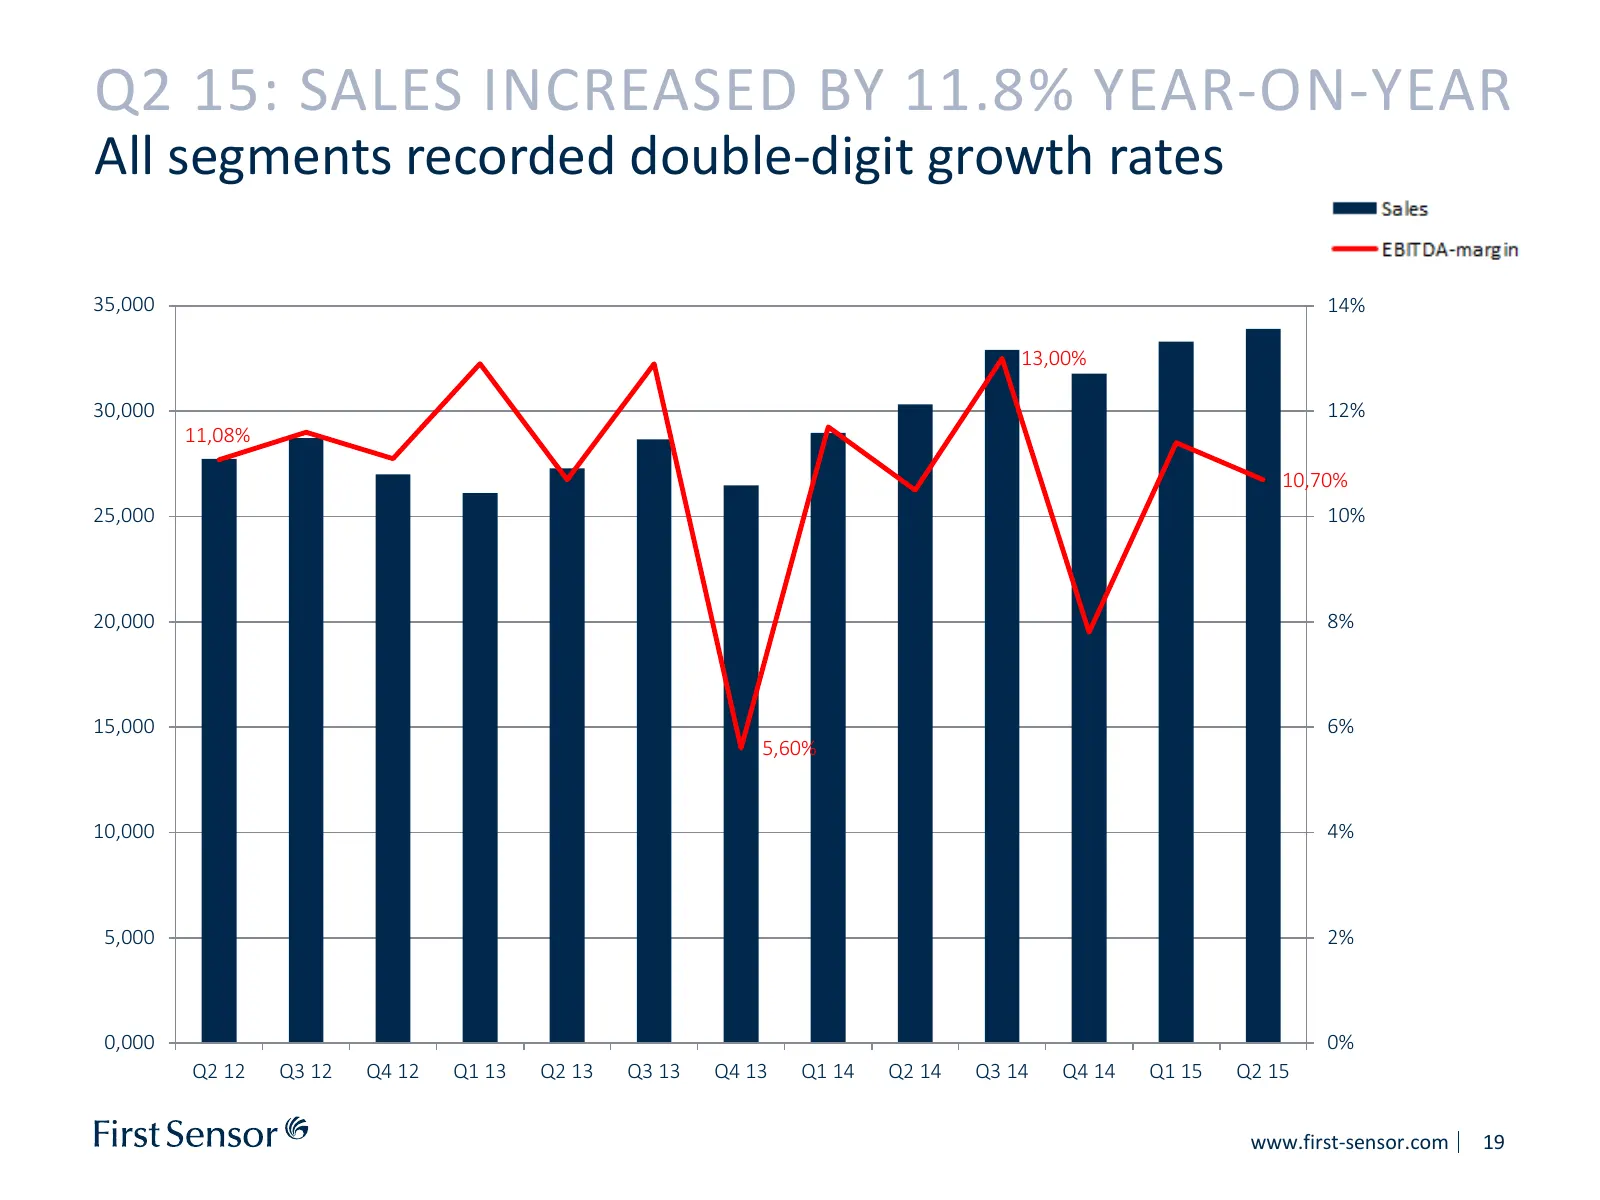
Slide 19: Q2 15: Sales Increased by 11.8% Year-on-Year
Q2 15: SALES INCREASED BY 11.8% YEAR-ON-YEAR All segments recorded double-digit growth rates 35,000 14% 13,00% 30,000 12% 11,08% 10,70% 25,000 10% 20,000 8% 15,000 6% 5,60% 10,000 4% 5,000 2% 0,000 0% Q2 12 Q3 12 Q4 12 Q1 13 Q2 13 Q3 13 Q4 13 Q1 14 Q2 14 Q3 14 Q4 14 Q1 15 Q2 15 www.first-sensor.com
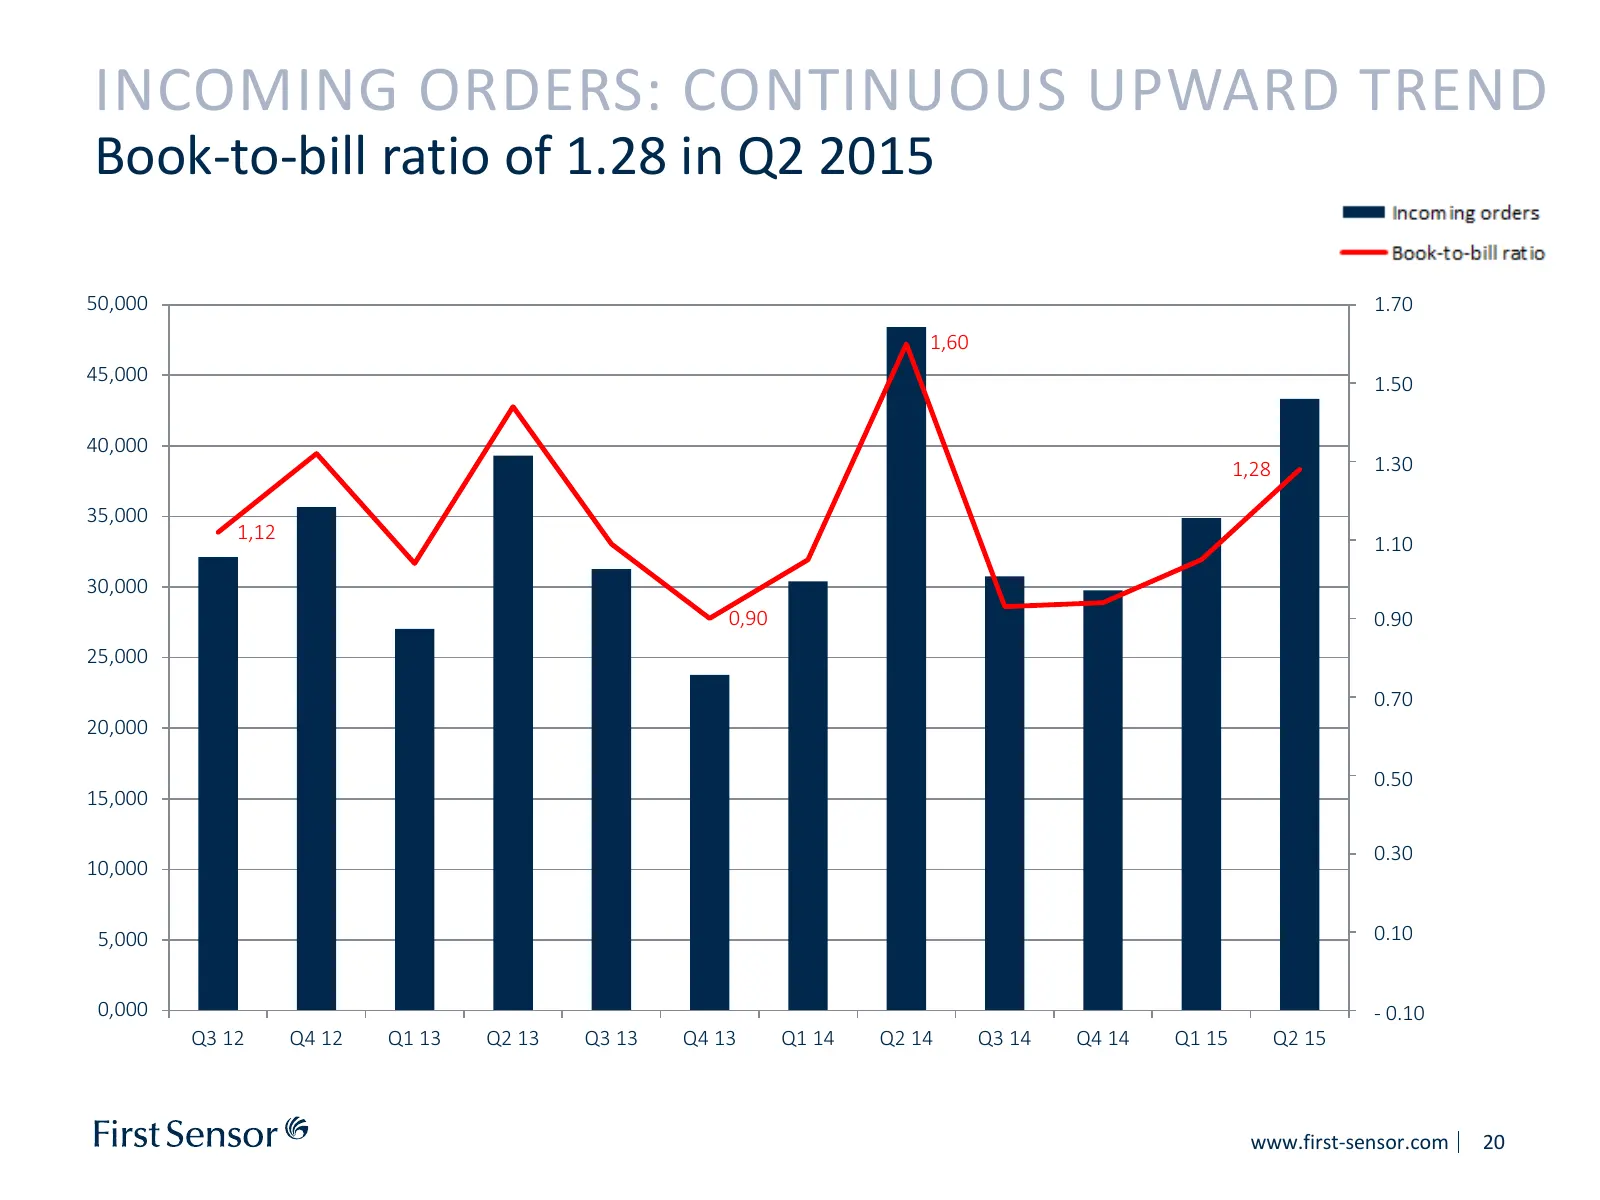
Slide 20: Incoming Orders: Continuous Upward Trend
INCOMING ORDERS: CONTINUOUS UPWARD TREND Book-to-bill ratio of 1.28 in Q2 2015 50,000 1.70 1,60 45,000 1.50 40,000 1,28 1.30 35,000 1,12 1.10 30,000 0,90 0.90 25,000 0.70 20,000 0.50 15,000 0.30 10,000 5,000 0.10 0,000 - 0.10 Q3 12 Q4 12 Q1 13 Q2 13 Q3 13 Q4 13 Q1 14 Q2 14 Q3 14 Q4 14 Q1 15 Q2 15 ww
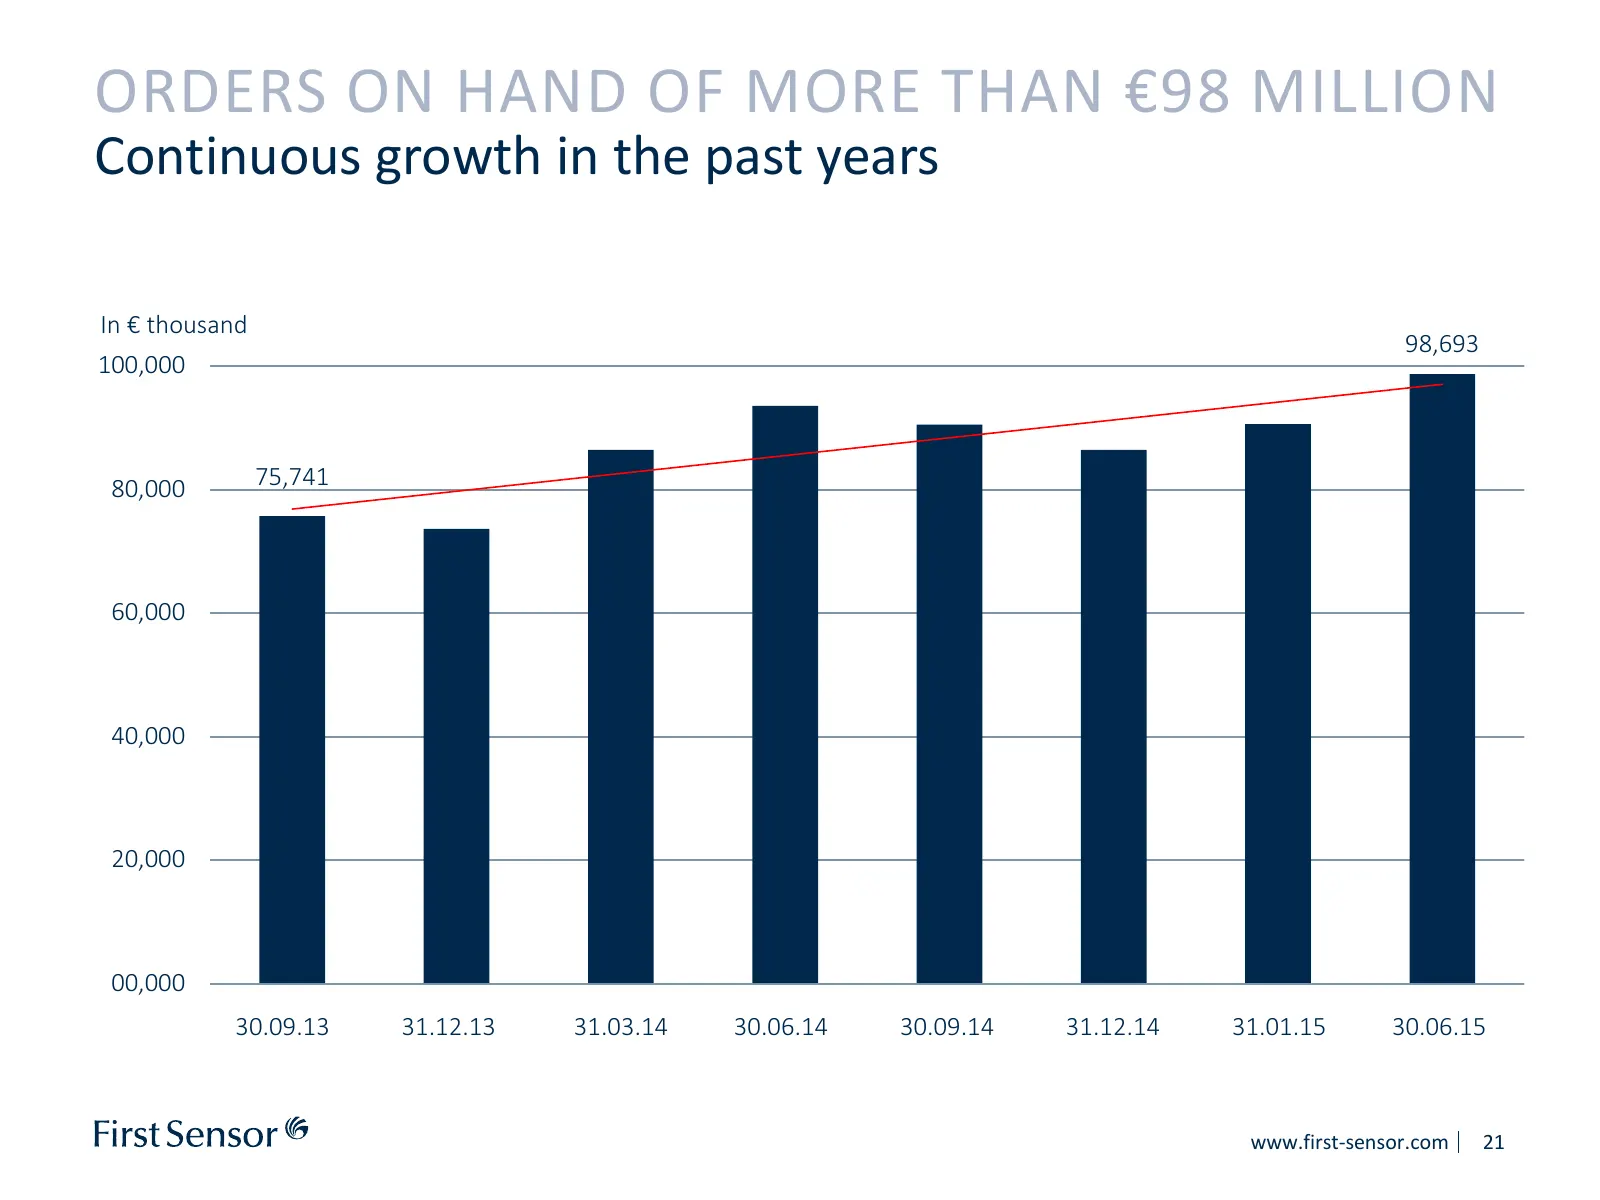
Slide 21: Orders on Hand of More Than €98 Million
ORDERS ON HAND OF MORE THAN €98 MILLION Continuous growth in the past years In € thousand 98,693 100,000 80,000 75,741 60,000 40,000 20,000 00,000 30.09.13 31.12.13 31.03.14 30.06.14 30.09.14 31.12.14 31.01.15 30.06.15 www.first-sensor.com 21
Slide 22: Guidance
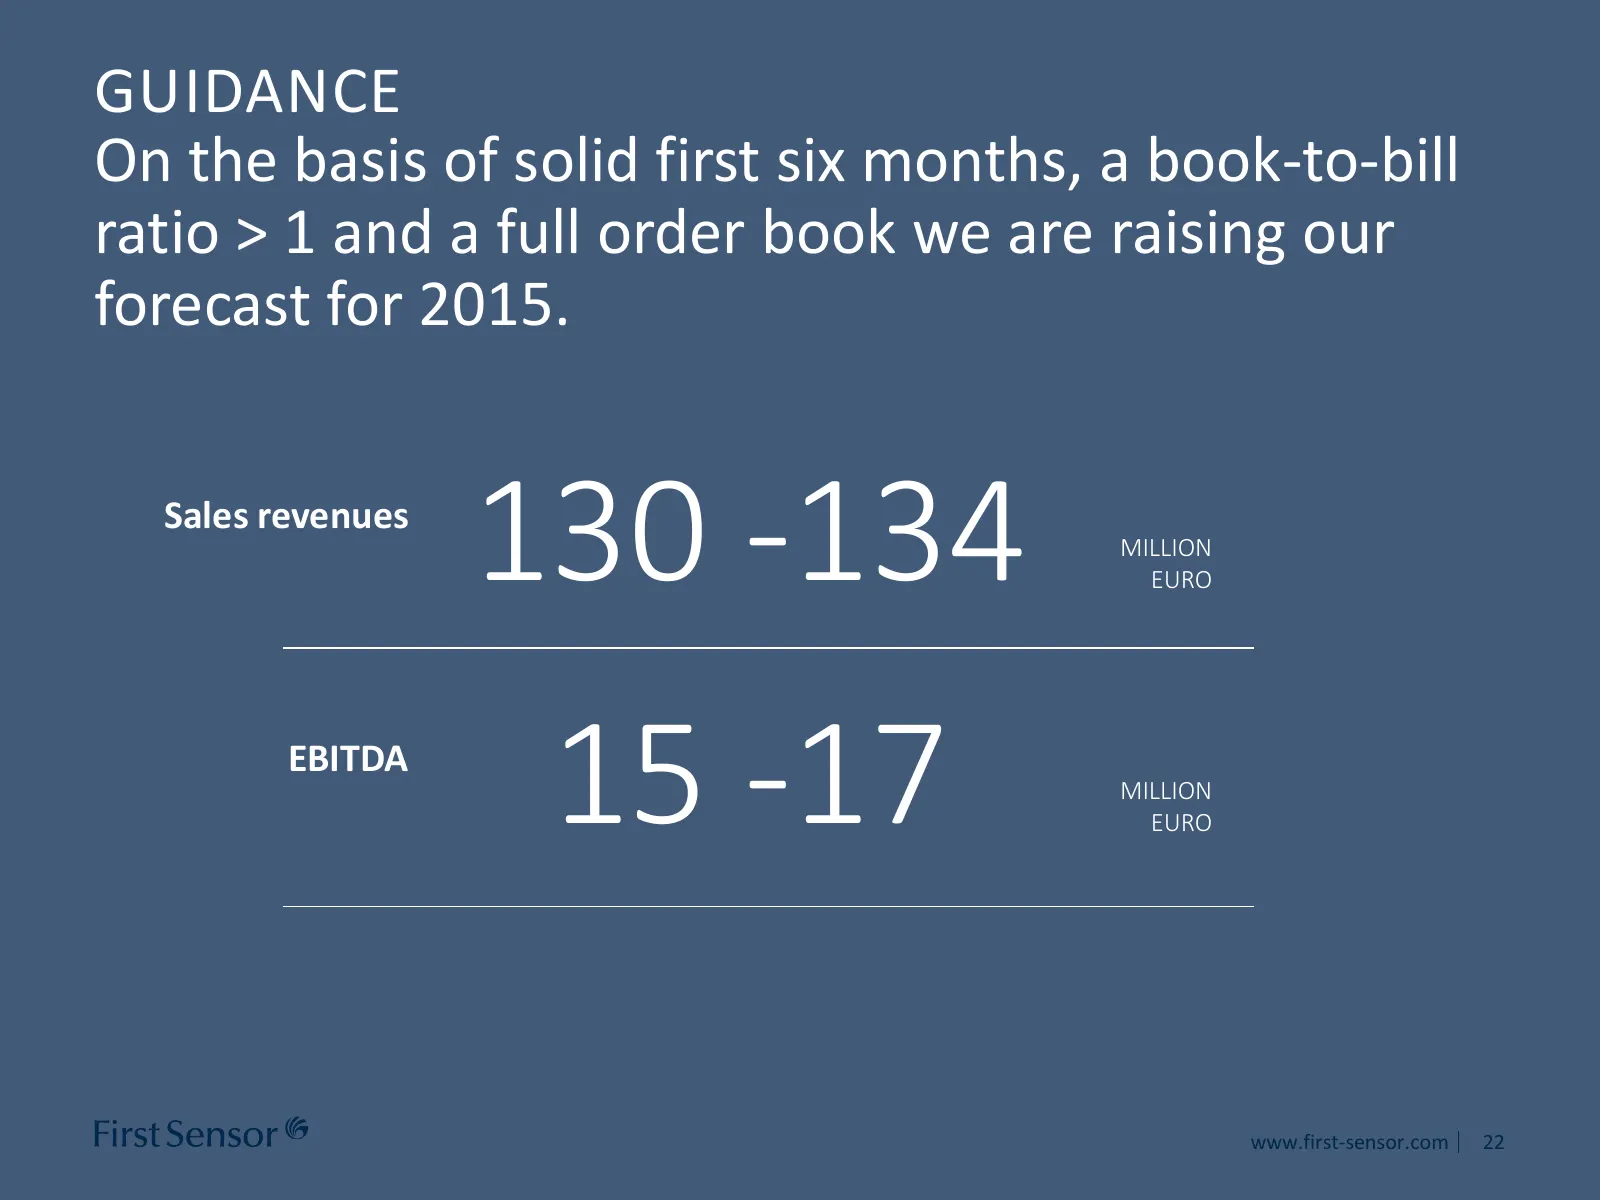
GUIDANCE On the basis of solid first six months, a book-to-bill ratio > 1 and a full order book we are raising our forecast for 2015. Sales revenues 130 -134 MILLION EURO EBITDA 15 -17 MILLION EURO www.first-sensor.com 22
Slide 23: Disclaimer
Disclaimer This presentation contains forward-looking statements. This presentation does not represent any solicitation to purchase shares of First Sensor AG. Rather it is intended exclusively for information purposes with regard to possible future developments at the company. All future-oriented in
Slide 24: Thank You
THANK YOU We engineer the future: Investor Presentation Dr. Martin U. Schefter / Dr. Mathias Gollwitzer August, 2015
Source: Internet Archive copy of first-sensor.com
More decks from First Sensor AG
 Shareholder Meeting (2020)31 slides · 2020
 Investor Presentation (December 2019)46 slides · December 2019
 Investor Presentation (May 2019)55 slides · May 2019
 German Equity Forum 201871 slides · Nov 26, 2018
 Berenberg Pan-European Discovery Conference 201854 slides · Jun 21, 2018
 Non-Deal Roadshow (June 2018)58 slides · Jun 1, 2018