Victoria PLC · LSE:VCP
Victoria — FY2012 Earnings Presentation
31 slides from Victoria's earnings presentation, Jun 26, 2012
Slide 1: Preliminary results for the year ended 31 March 2012
Preliminary results For the year ended 31 March 2012 26 June 2012
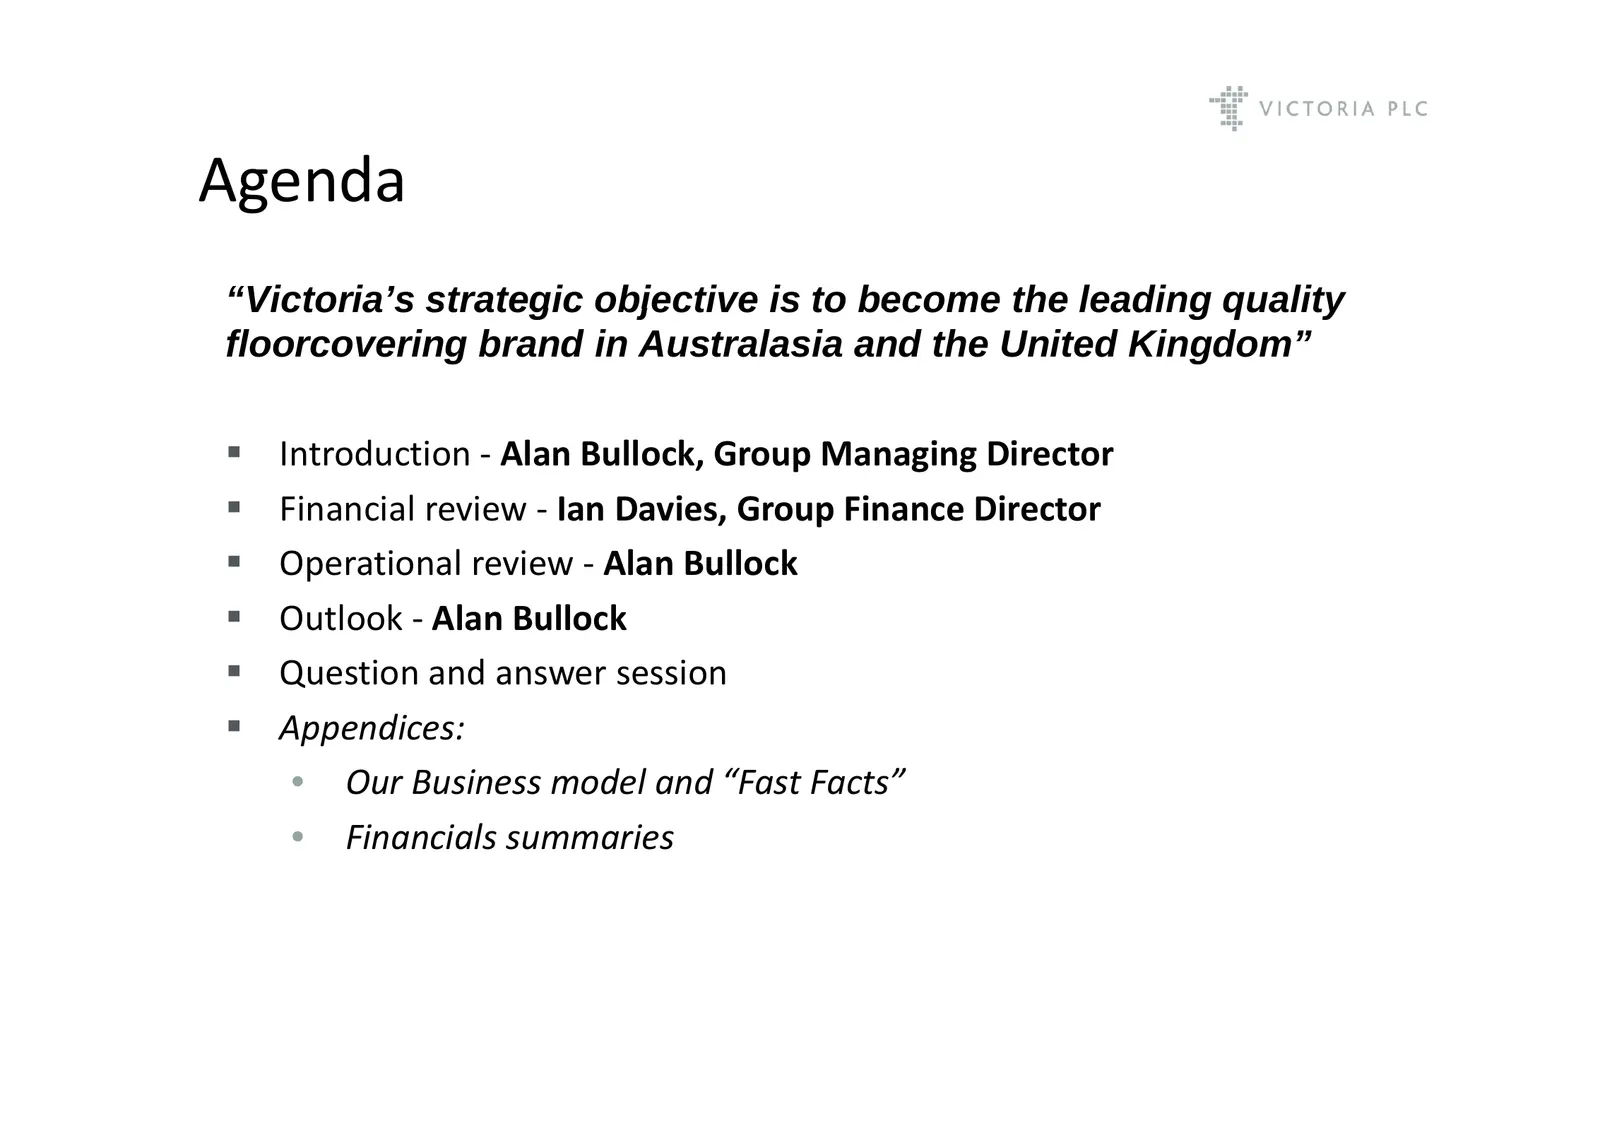
Slide 2: Agenda
Agenda “Victoria’s Victoria s strategic objective is to become the leading quality floorcovering brand in Australasia and the United Kingdom” Introduction ‐ Alan Bullock, Group Managing Director Financial review ‐ Ian Davies, Group Finance Director Operational review ‐ Alan Bullock Outlook ‐
Slide 3: Financial Review
Financial Review Ian Davies Group Finance Director
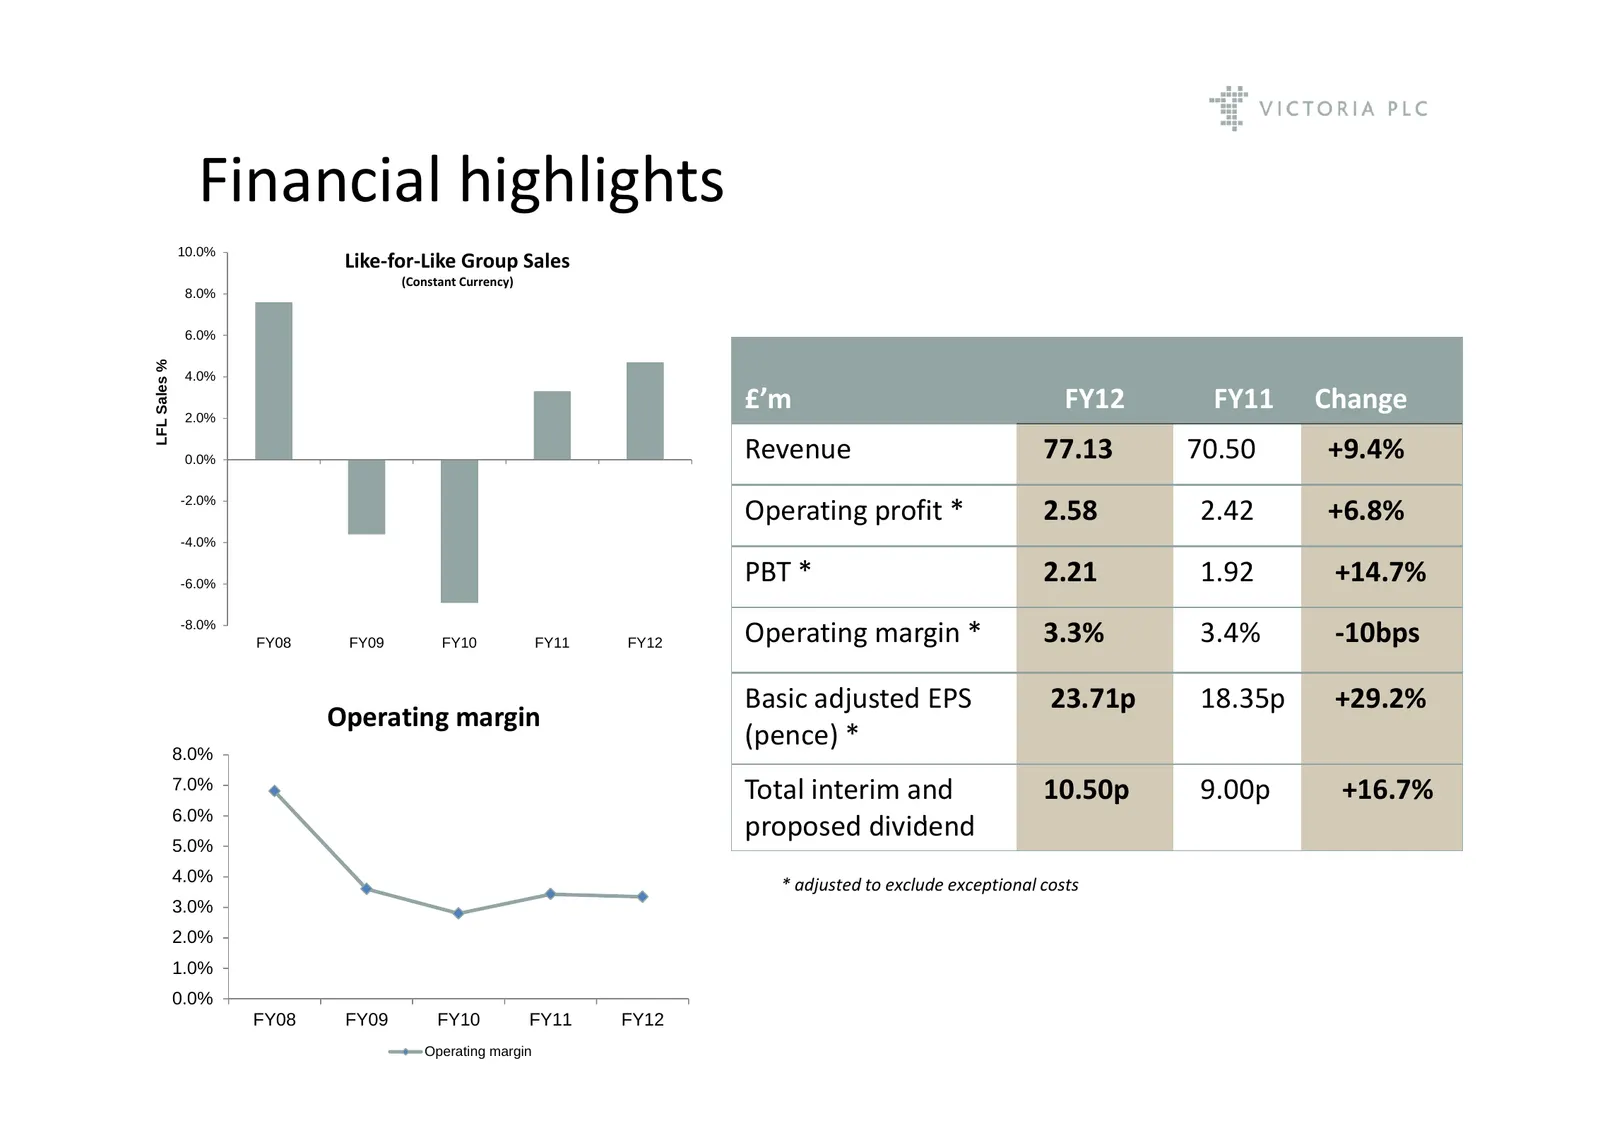
Slide 4: Financial highlights
Financial highlights 10.0% Like‐for‐Like Group Sales (Constant Currency) 8.0% 6.0% LFL Sales % 4.0% 2.0% £’m FY12 FY11 Change 0.0% Revenue 77.13 70.50 +9.4% -2.0% Operating profit * 2.58 2.42 +6.8% -4.0% -6.0% PBT * 2 21 2.21 1 92 1.92 +14.7% 14 7% -8.0% FY08 FY09 FY10 FY11 FY12 Operating margin * 3
Slide 5: Segmental performance
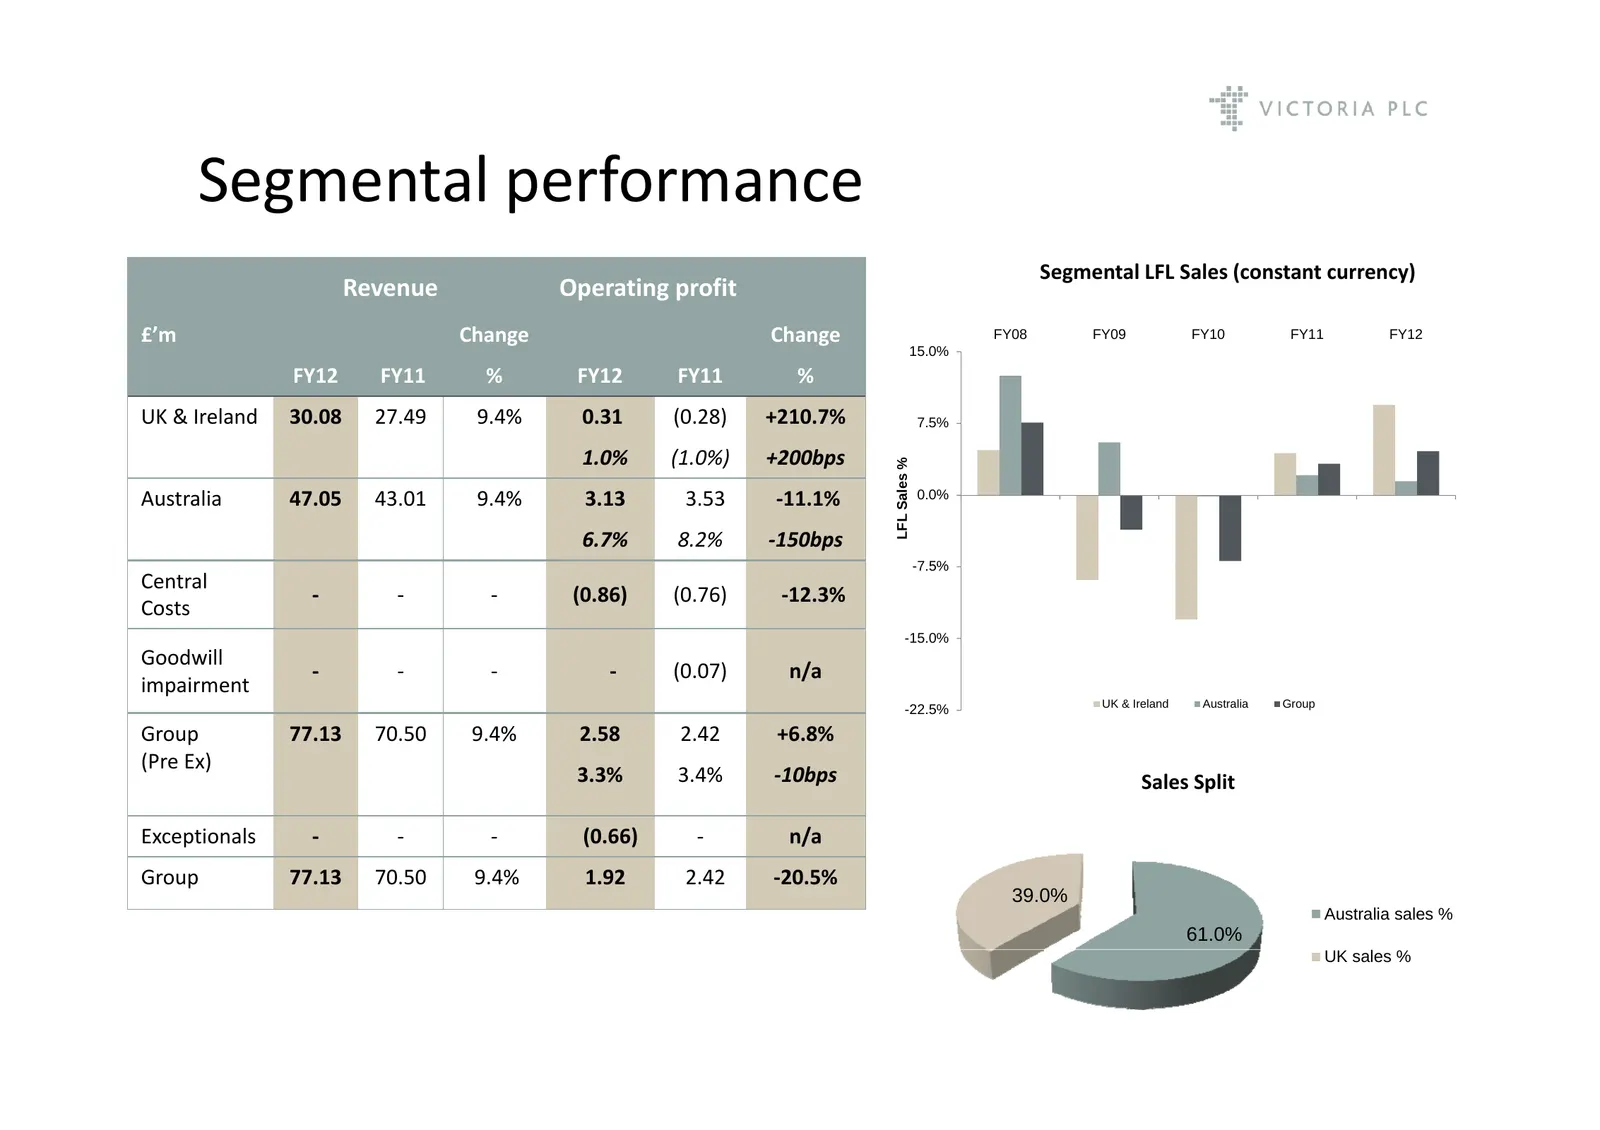
Segmental performance Segmental LFL Sales (constant currency) Revenue Operating profit £’m Change Change FY08 FY09 FY10 FY11 FY12 15.0% FY12 FY11 % FY12 FY11 % UK & Ireland 30.08 27.49 9.4% 0.31 (0.28) +210.7% 7.5% 1.0% (1.0%) +200bps LFL Sales % Australia 47.05 43.01 9.4% 3.13 3.53 ‐11.1% 0.0% 6.7%
Slide 6: Operating profit bridge
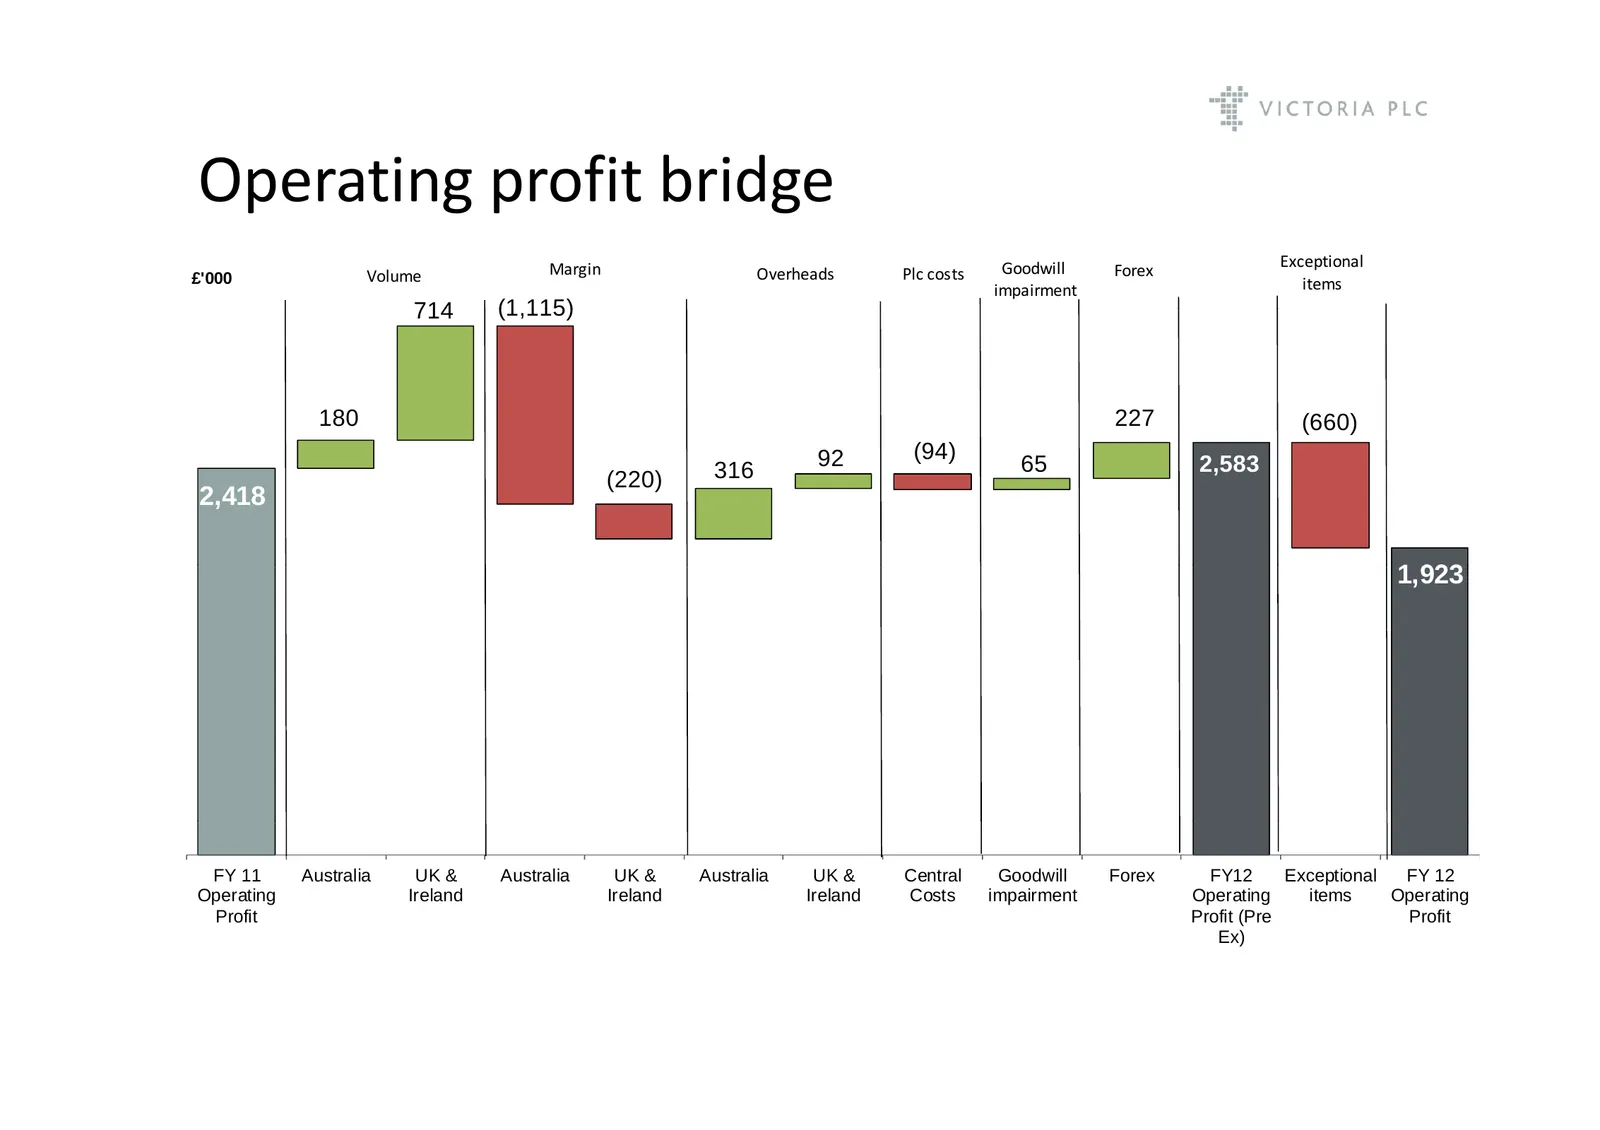
Operating profit bridge Margin Goodwill Forex Exceptional £'000 Volume Overheads Plc costs impairment items 714 (1 115) (1,115) 180 227 (660) 92 (94) 316 65 2,583 (220) 2,418 1 923 1,923 776 FY 11 Australia UK & Australia UK & Australia UK & Central Goodwill Forex FY12 Exceptional FY 12 Operating Ir
Slide 7: Cash flow and net debt
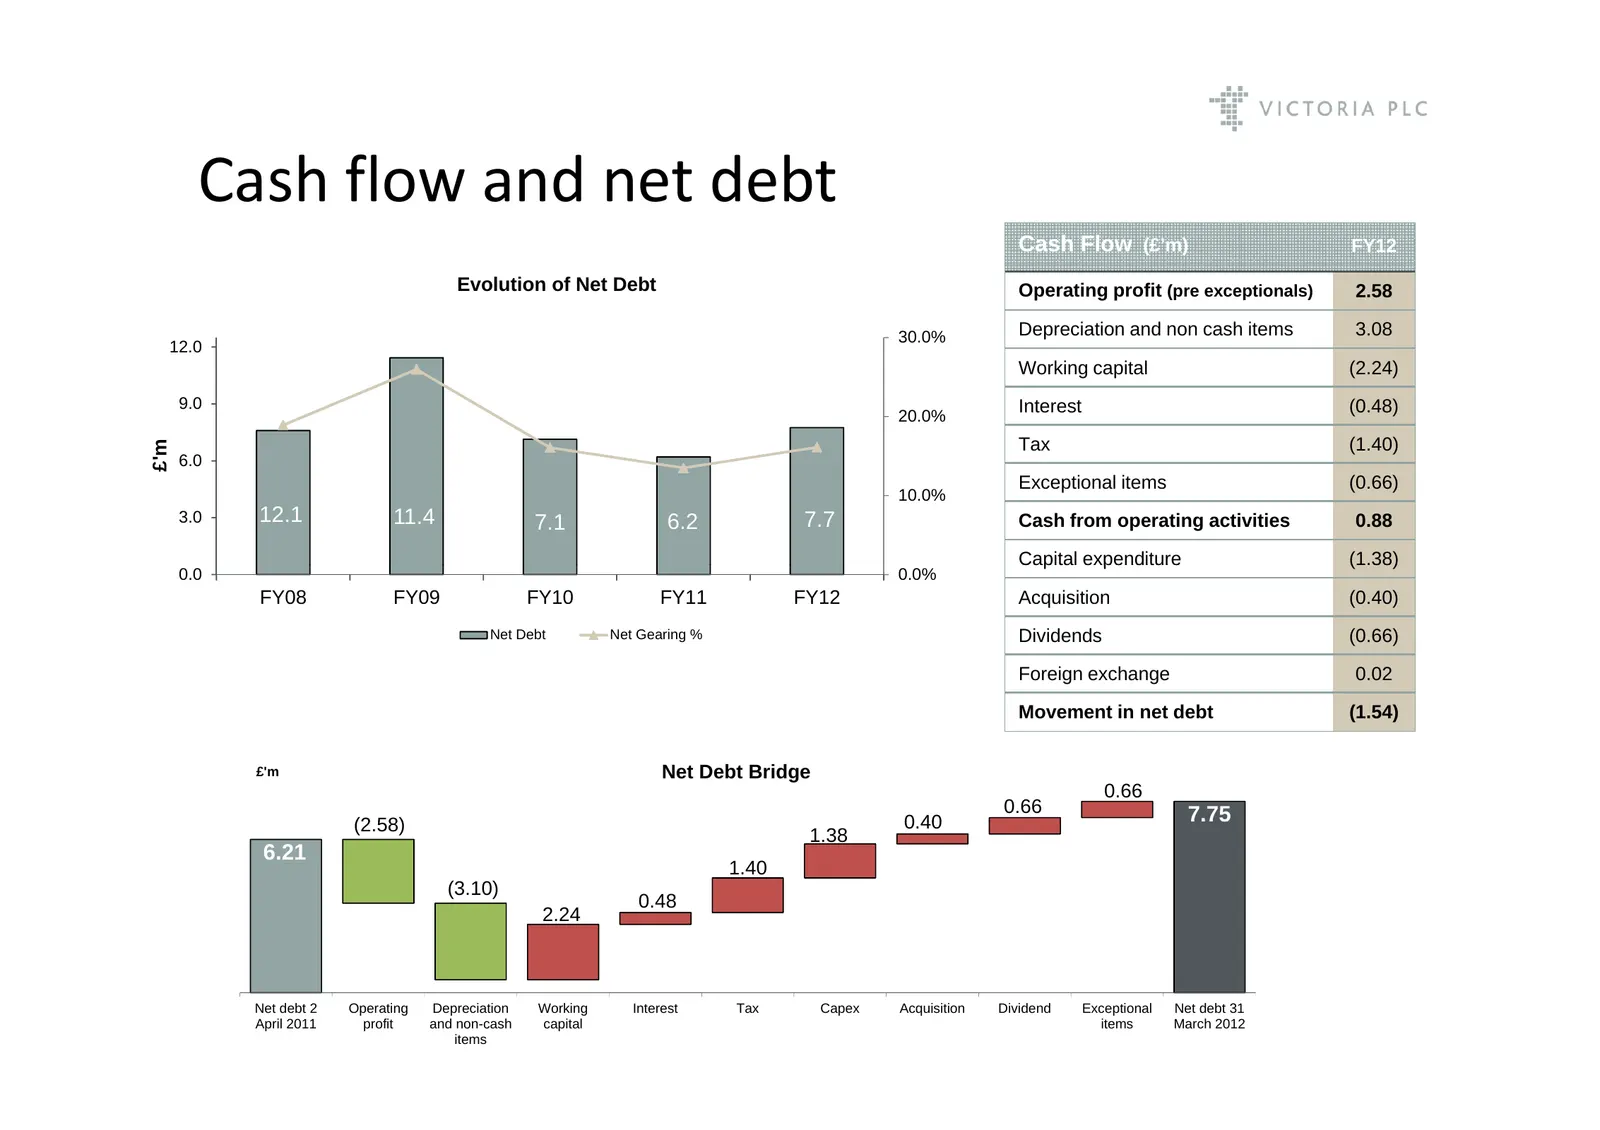
Cash flow and net debt Cash Flow (£’m) FY12 Evolution of Net Debt Operating profit (pre exceptionals) 2.58 30.0% Depreciation and non cash items 3.08 12.0 Working capital (2.24) 9.0 Interest (0.48) 20.0% Tax (1.40) £'m 6.0 Exceptional items (0.66) 10.0% 3.0 12.1 11.4 7.1 6.2 7.7 Cash from operating
Slide 8: Net Working Capital
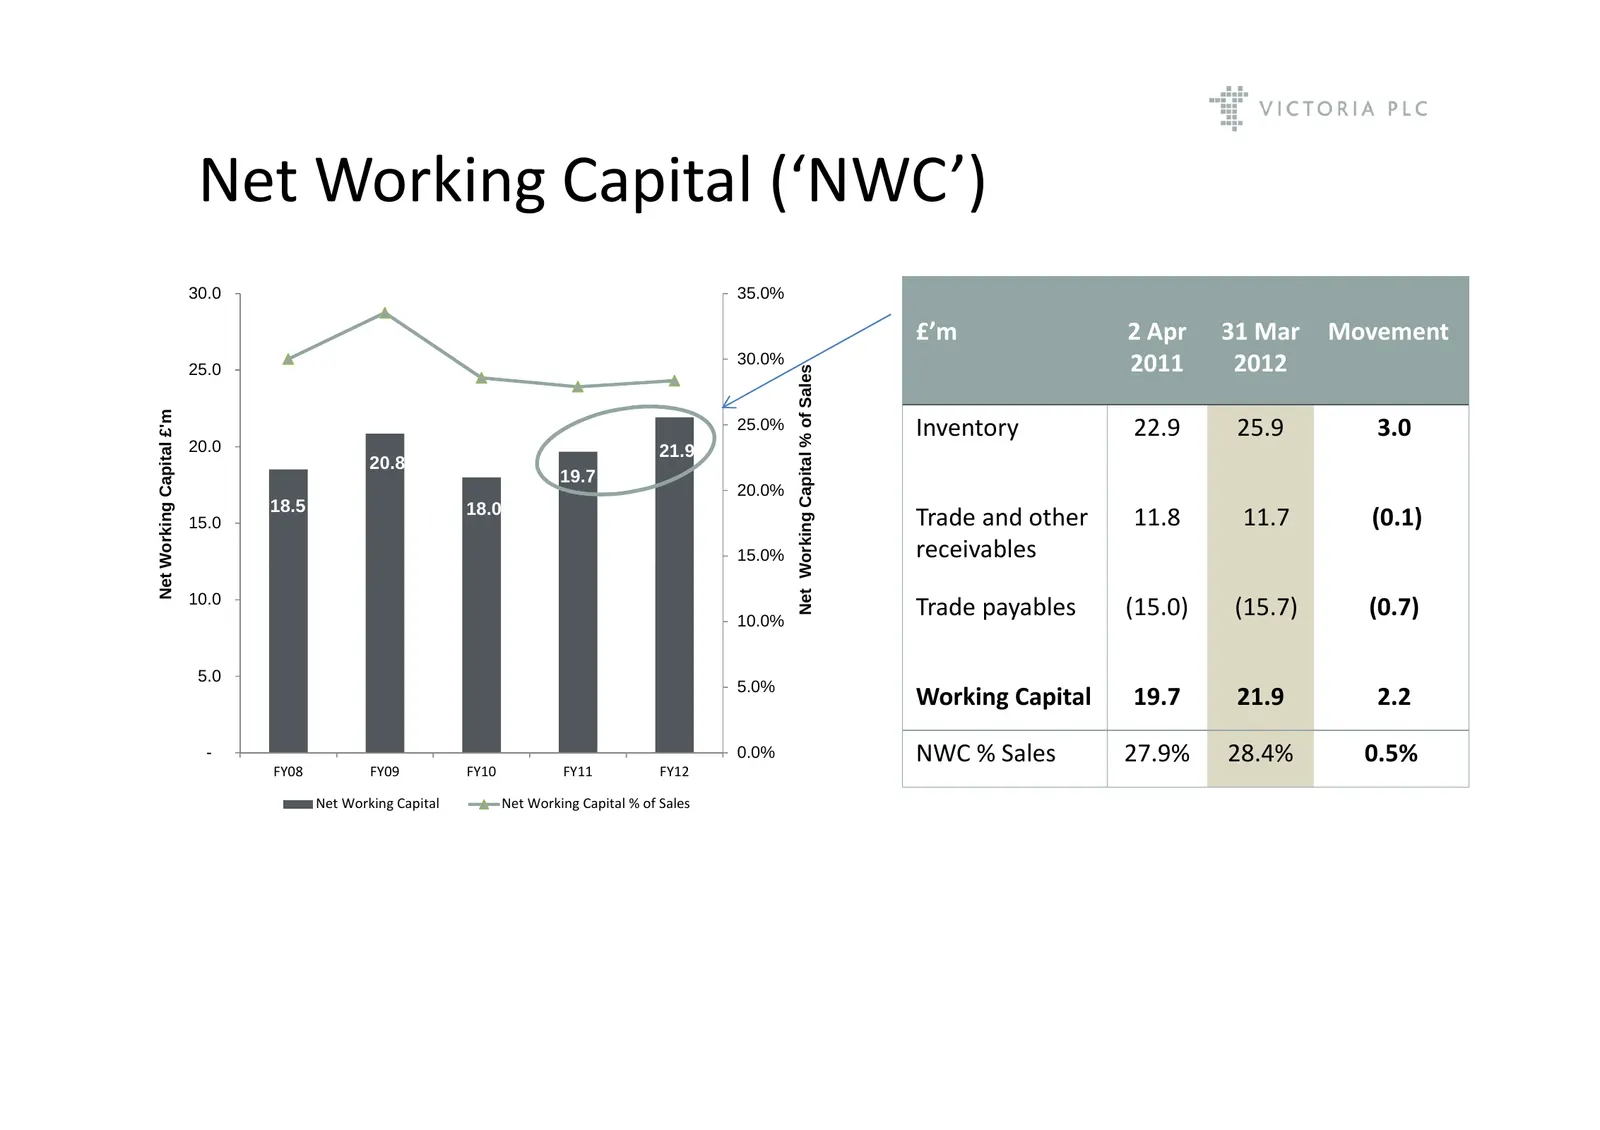
Net Working Capital (‘NWC’) ( NWC ) 30.0 35.0% £’m 2 Apr 31 Mar Movement 25.0 30.0% 2011 2012 Working Capital % of Sales £'m 25.0% Inventoryy 22.9 25.9 3.0 Working Capital £ 20.0 21.9 20.8 19.7 20.0% 18.5 18.0 15.0 Trade and other 11.8 11.7 (0.1) 15.0% receivables Net W Net W 10.0 10.0% Trade payabl
Slide 9: Capital expenditure
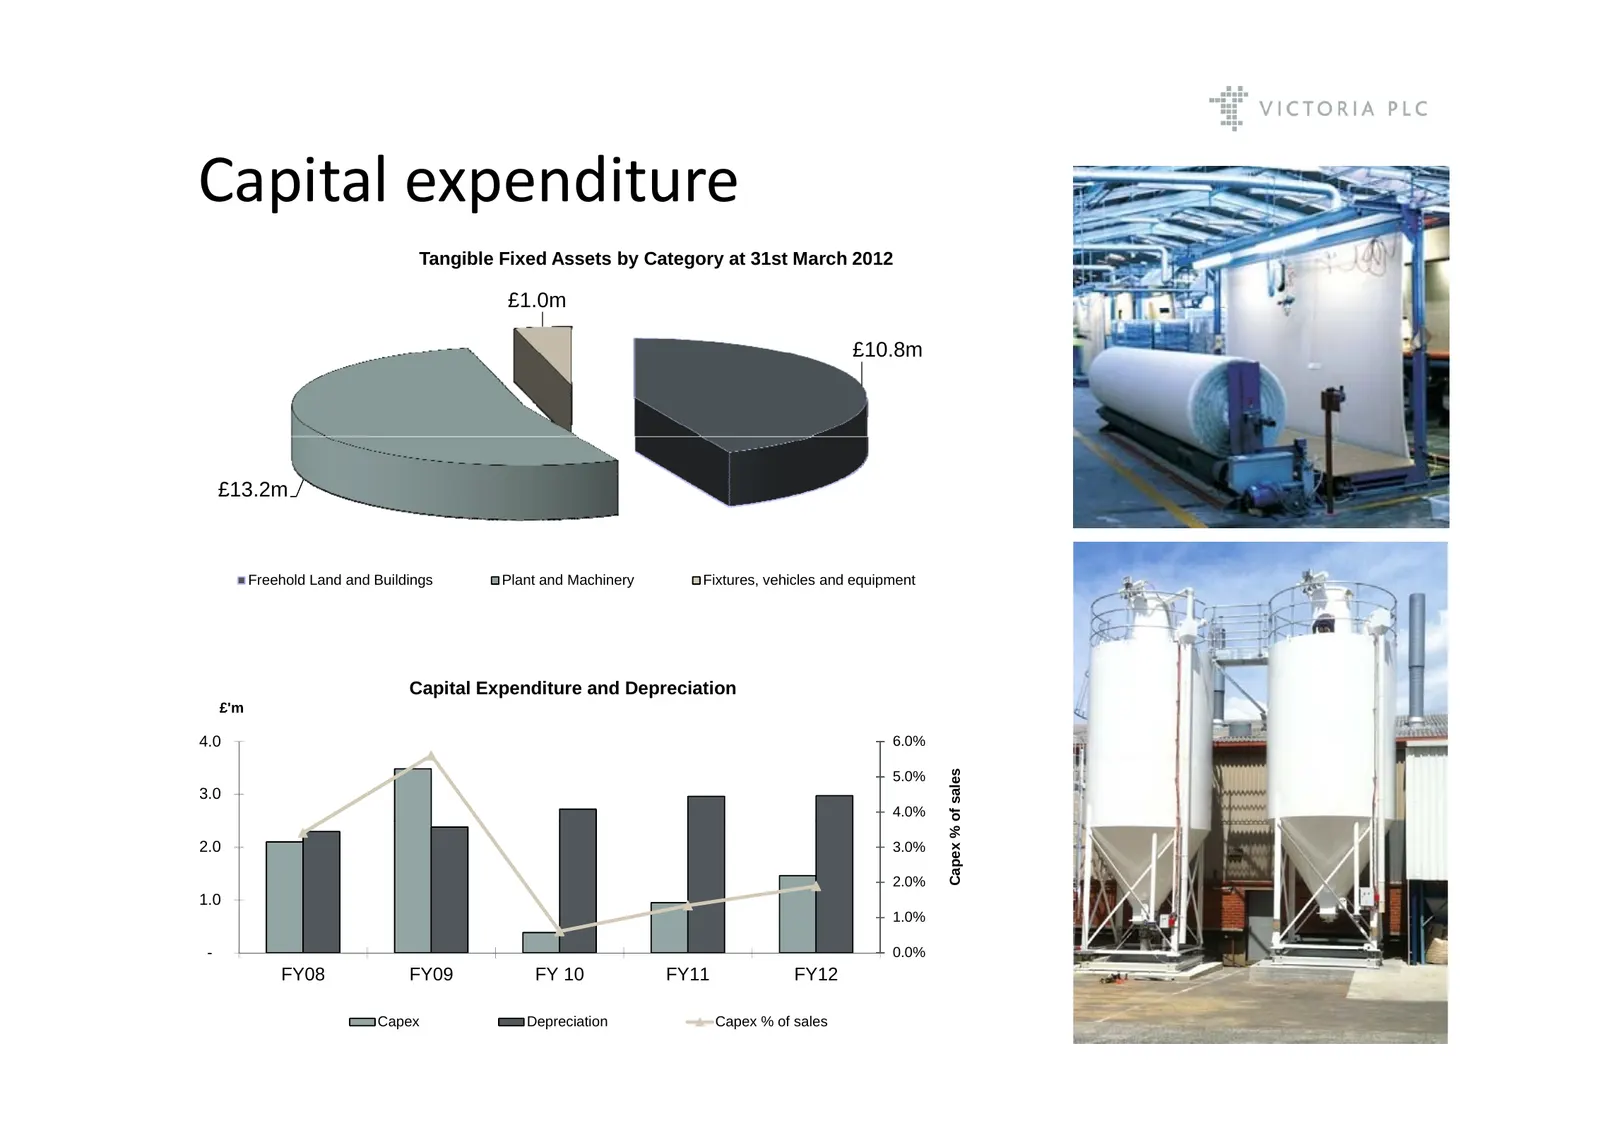
Capital expenditure Tangible Fixed Assets by Category at 31st March 2012 £1.0m £10.8m £13.2m Freehold Land and Buildings Plant and Machinery Fixtures, vehicles and equipment Capital Expenditure and Depreciation £'m 4.0 6.0% of sales 5.0% 3.0 4.0% Capex % o 2.0 3.0% 2.0% 1.0 1.0% - 0 0% 0.0% FY08 FY0
Slide 10: Financial summary
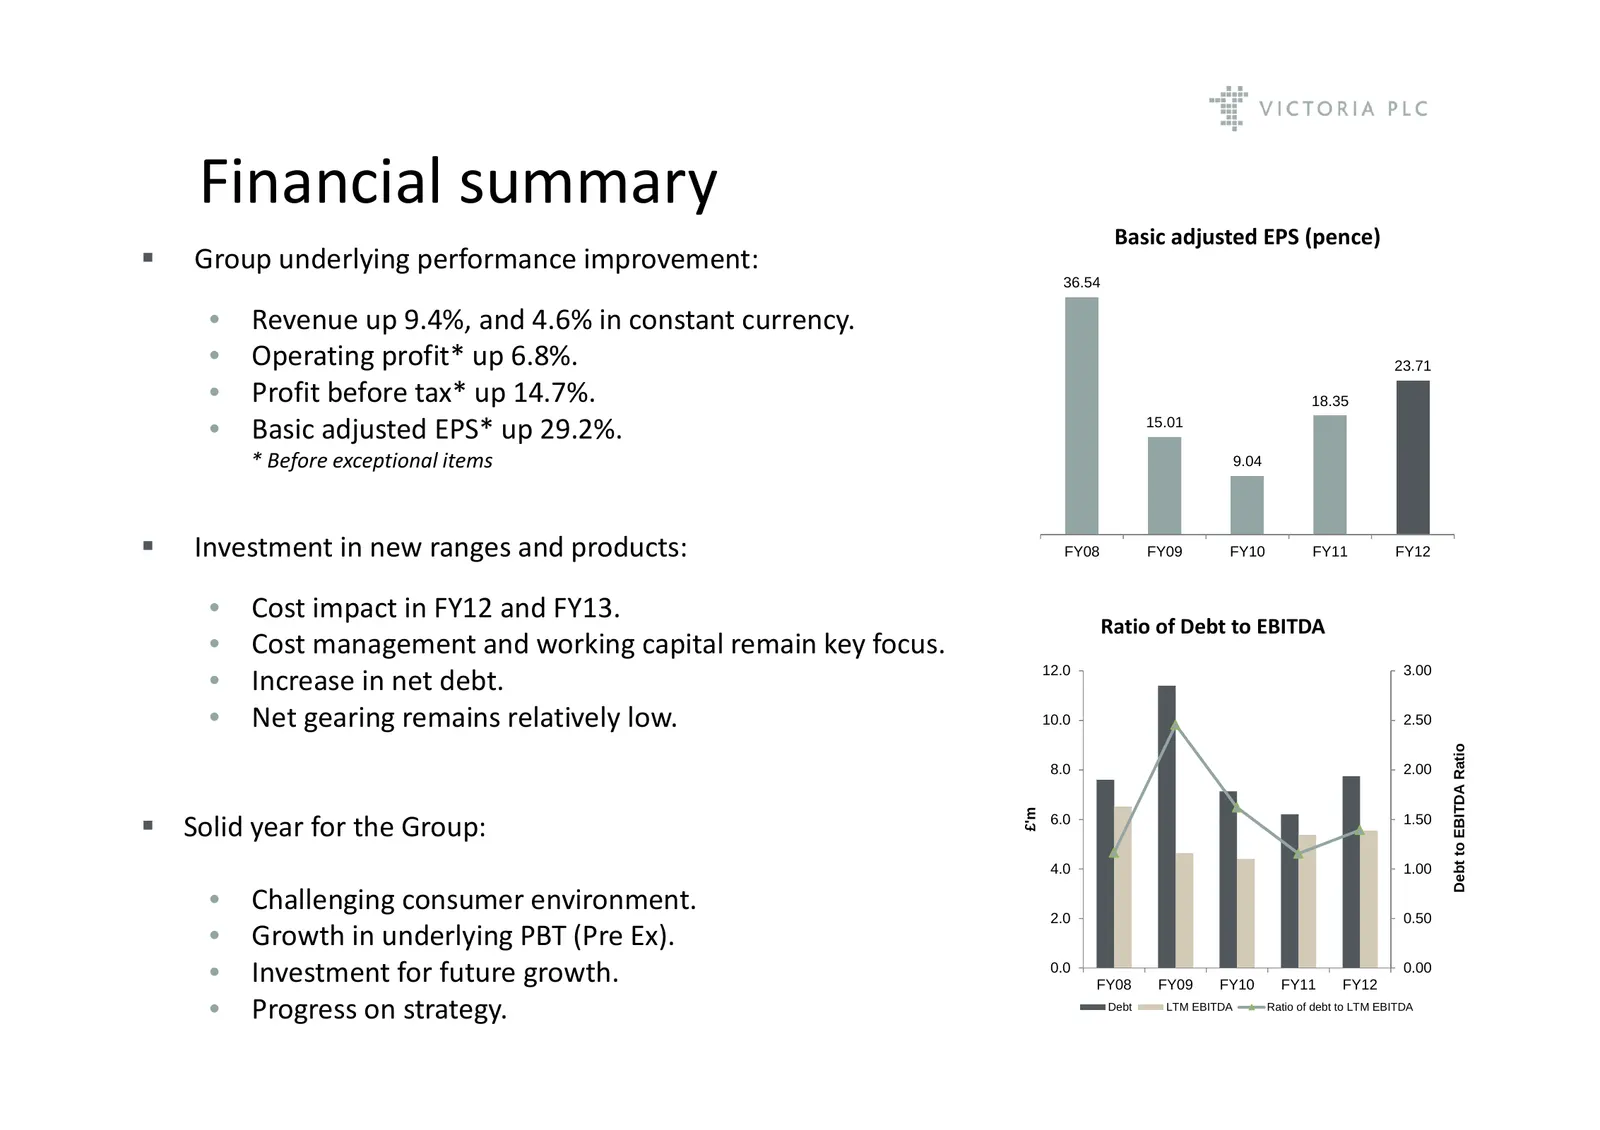
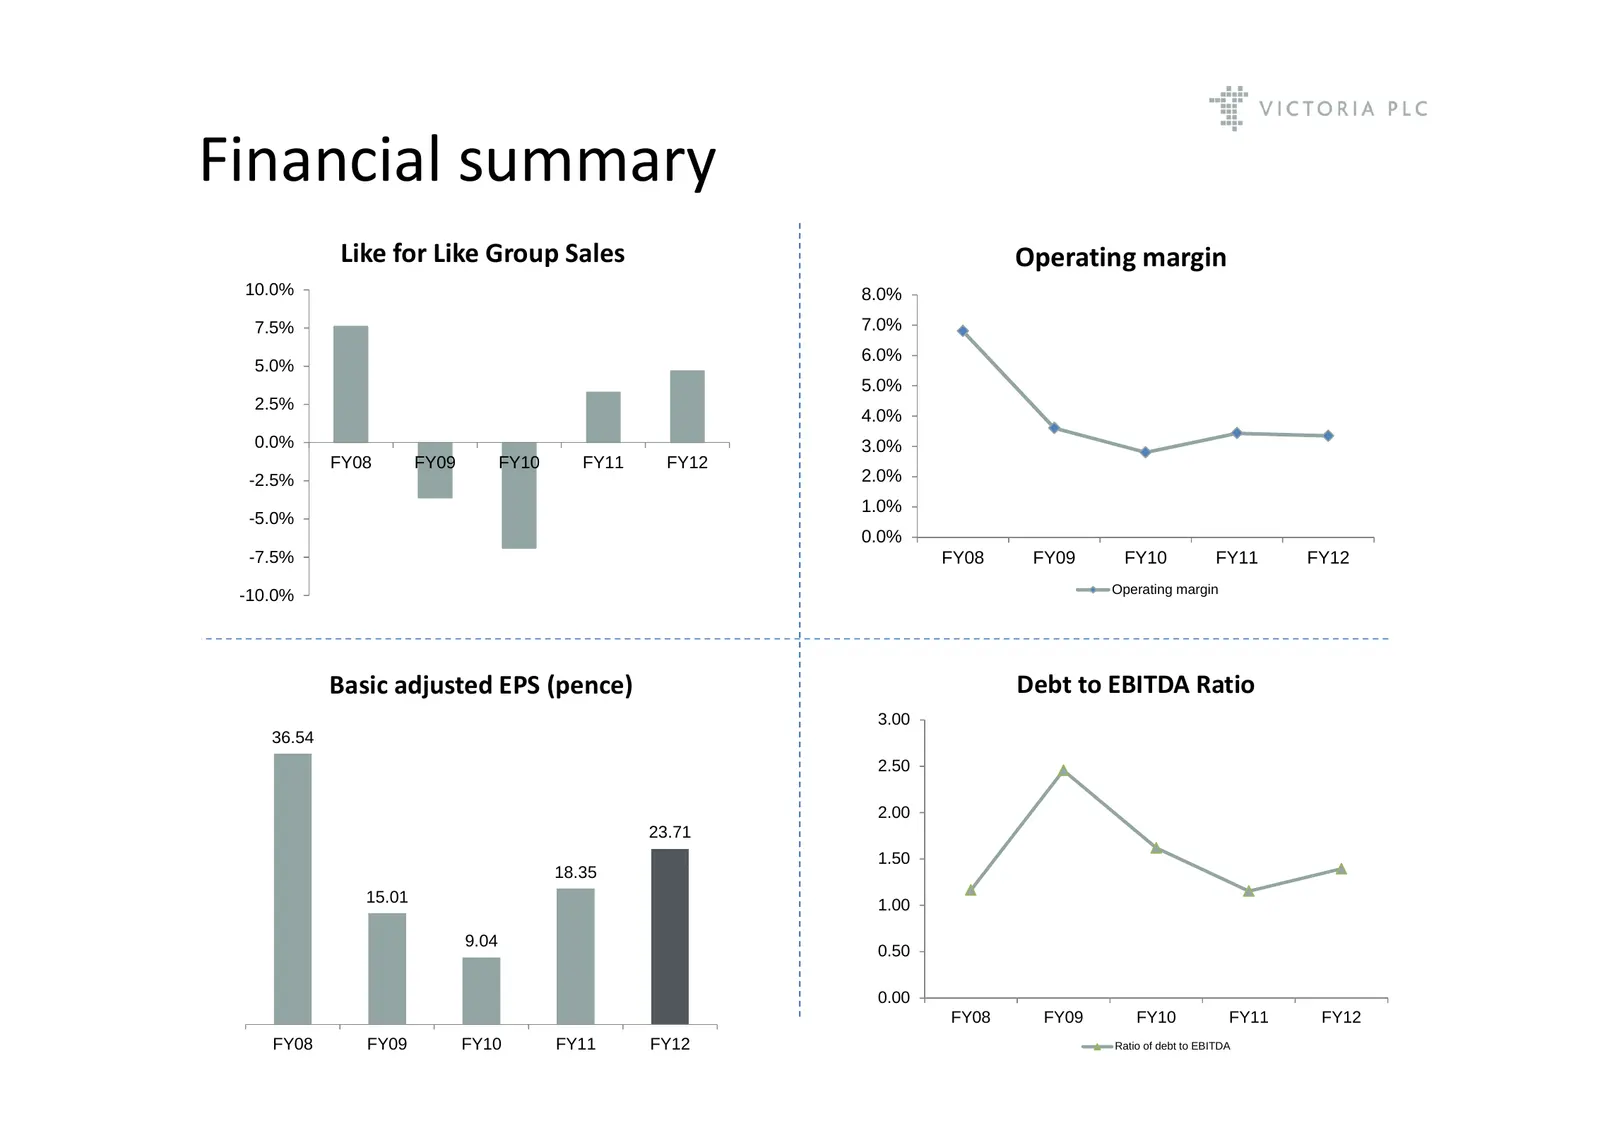
Financial summary Basic adjusted EPS (pence) Group underlying performance improvement: 36.54 • Revenue up 9.4%, and d 4.6% in constant currency. • Operating profit* up 6.8%. 23.71 • Profit before tax* up 14.7%. 18.35 • Basic adjusted EPS EPS* up 29.2%. 15.01 * Before exceptional items 9.04 Inves
Slide 11: Operational Review
Operational Review Alan Bullock Group Managing Director
Slide 12: Divisional review - Australia
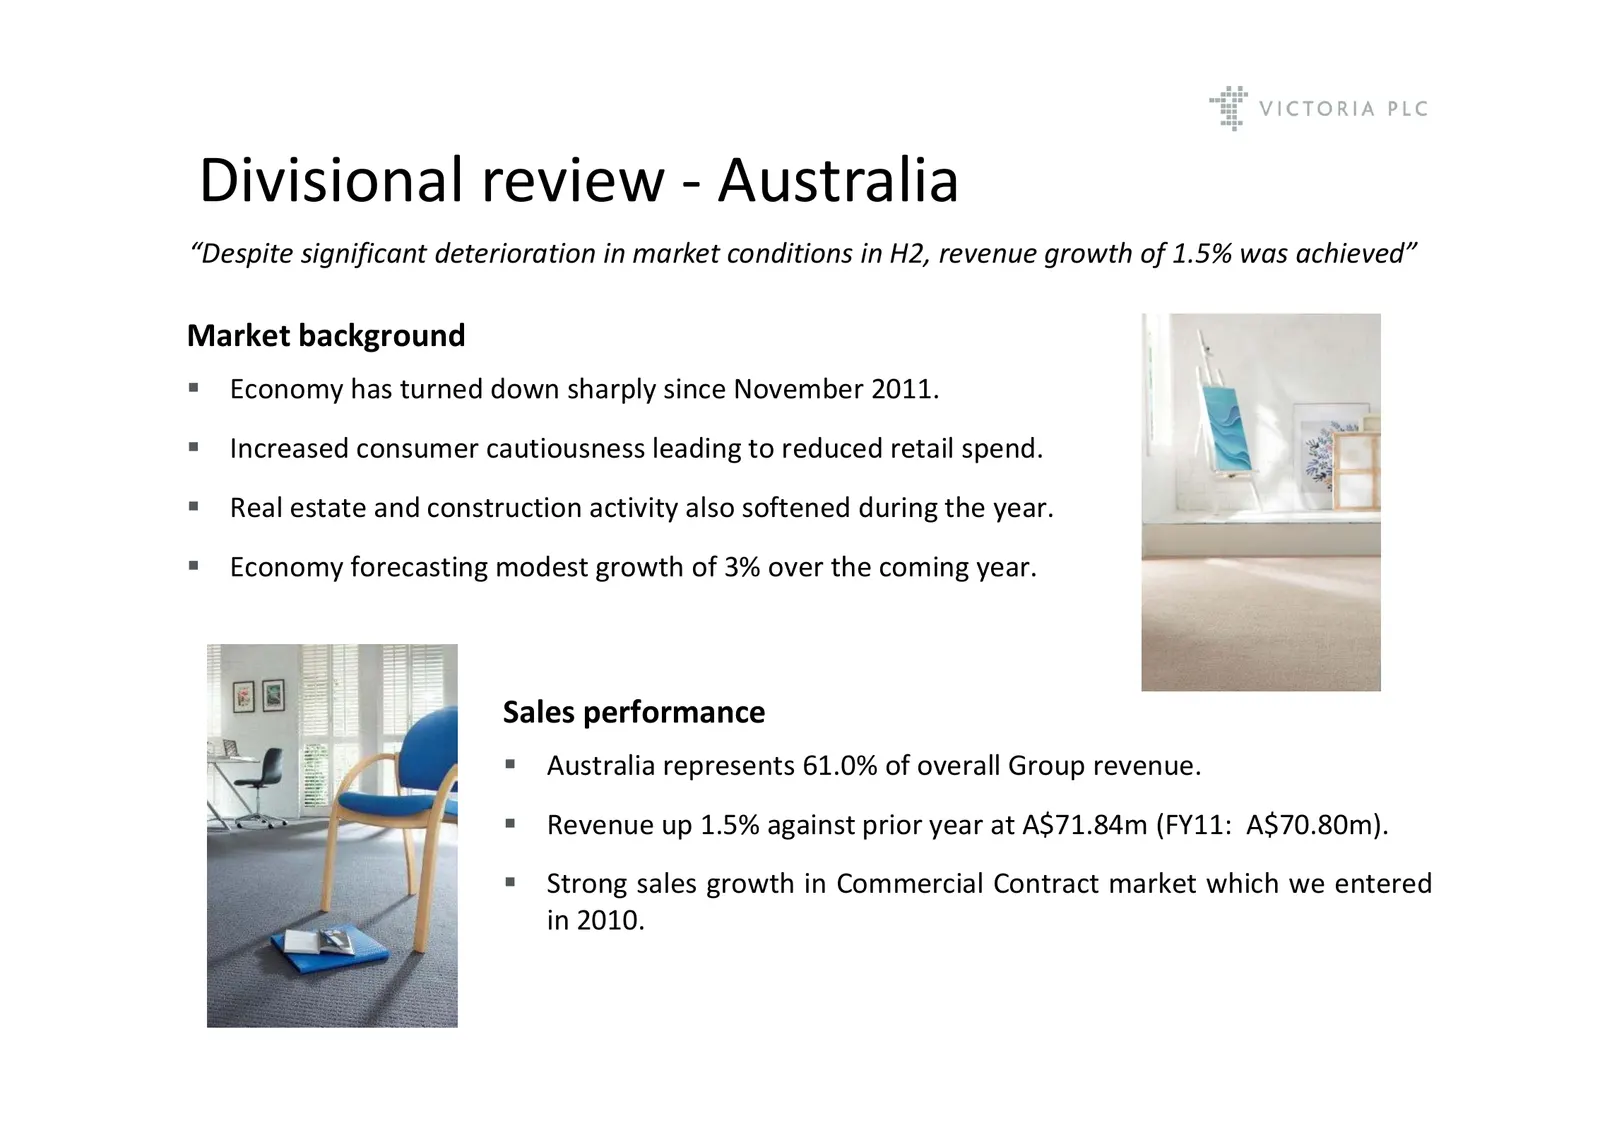
Divisional review ‐ Australia “Despite significant deterioration in market conditions in H2, revenue growth of 1.5% was achieved” Market background Economy has turned down sharply since November 2011. Increased consumer cautiousness leading to reduced retail spend. Real estate and construction
Slide 13: Divisional review - Australia
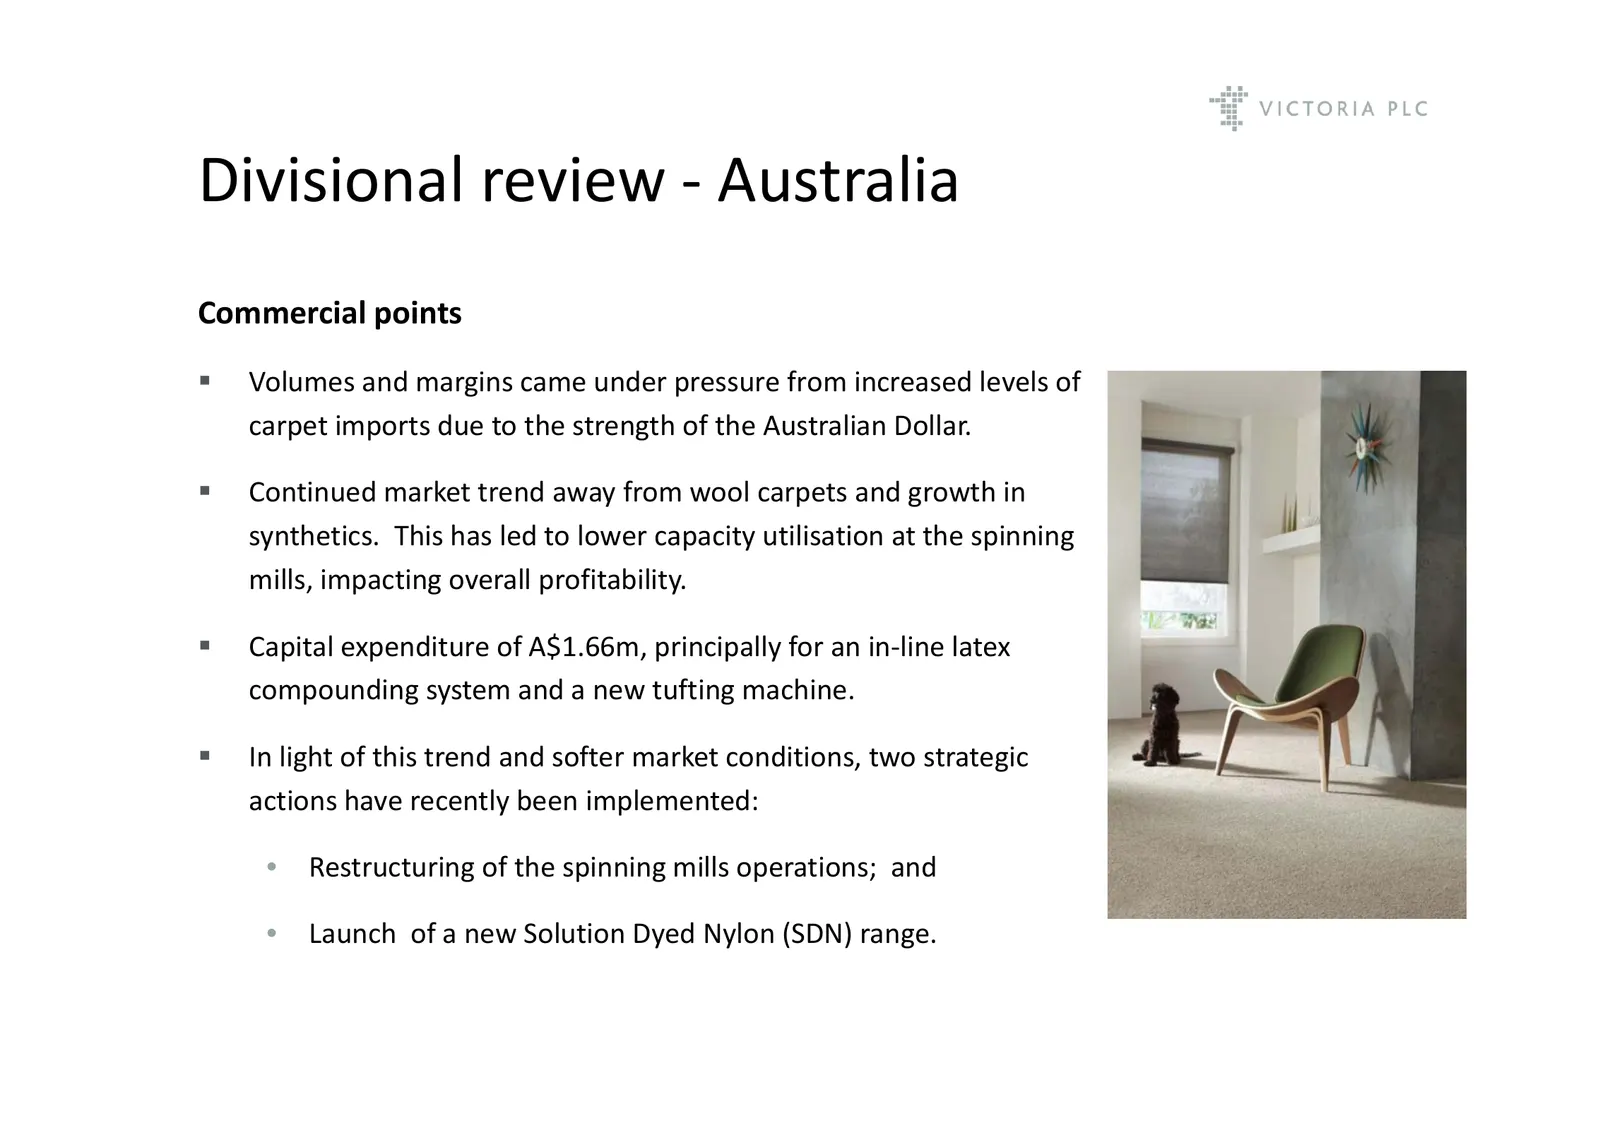
Divisional review ‐ Australia Commercial points Volumes and margins came under pressure from increased levels of carpet p imports p due to the strength g of the Australian Dollar. Continued market trend away from wool carpets and growth in synthetics. This has led to lower capacity utilisation a
Slide 14: Divisional review - Australia: EverSoft
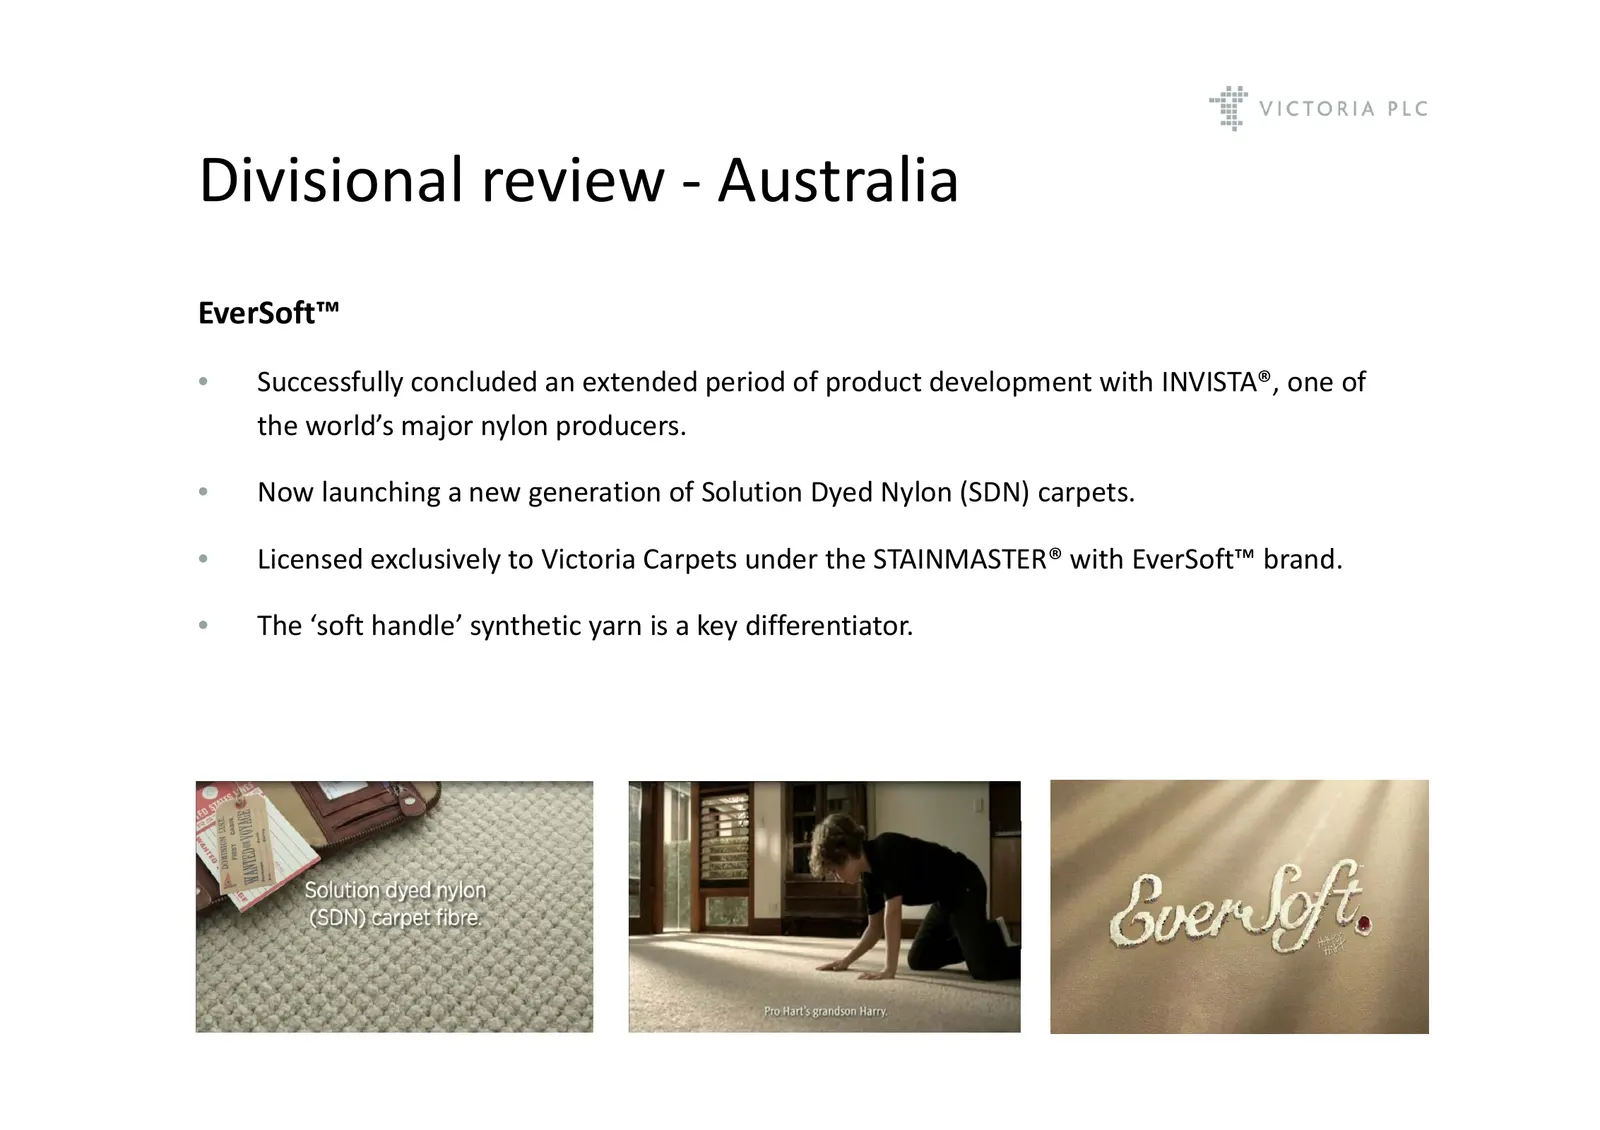
Divisional review ‐ Australia EverSoft™ • Successfully concluded an extended period of product development with INVISTA®, one of the world’s major j nylon y producers. p • Now launching a new generation of Solution Dyed Nylon (SDN) carpets. • Licensed exclusively to Victoria Carpets under the STAINM
Slide 15: Divisional review - UK (Including Ireland)
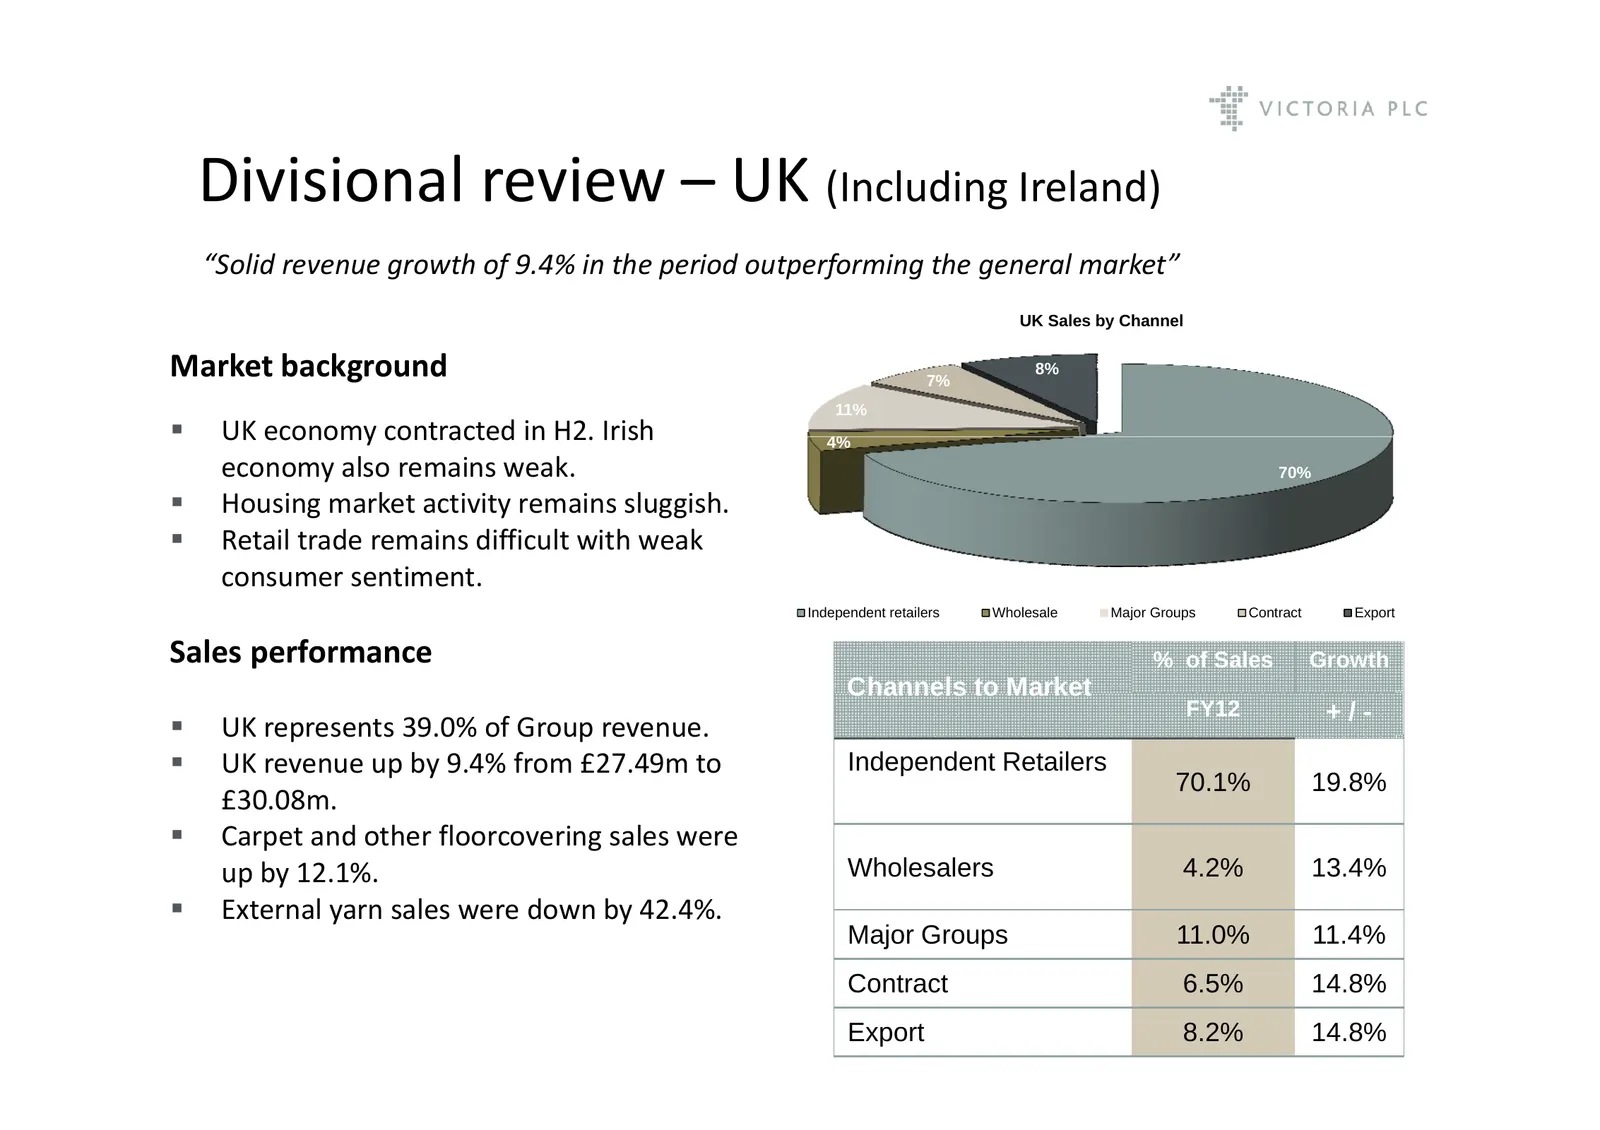
Divisional review – UK (Including (Incl ding Ireland) “Solid revenue growth of 9.4% in the period outperforming the general market” UK Sales by Channel Market background 7% 8% 11% UK economy contracted in H2.H2 Irish 4% economy also remains weak. 70% Housing market activity remains sluggish. R
Slide 16: Divisional review - UK
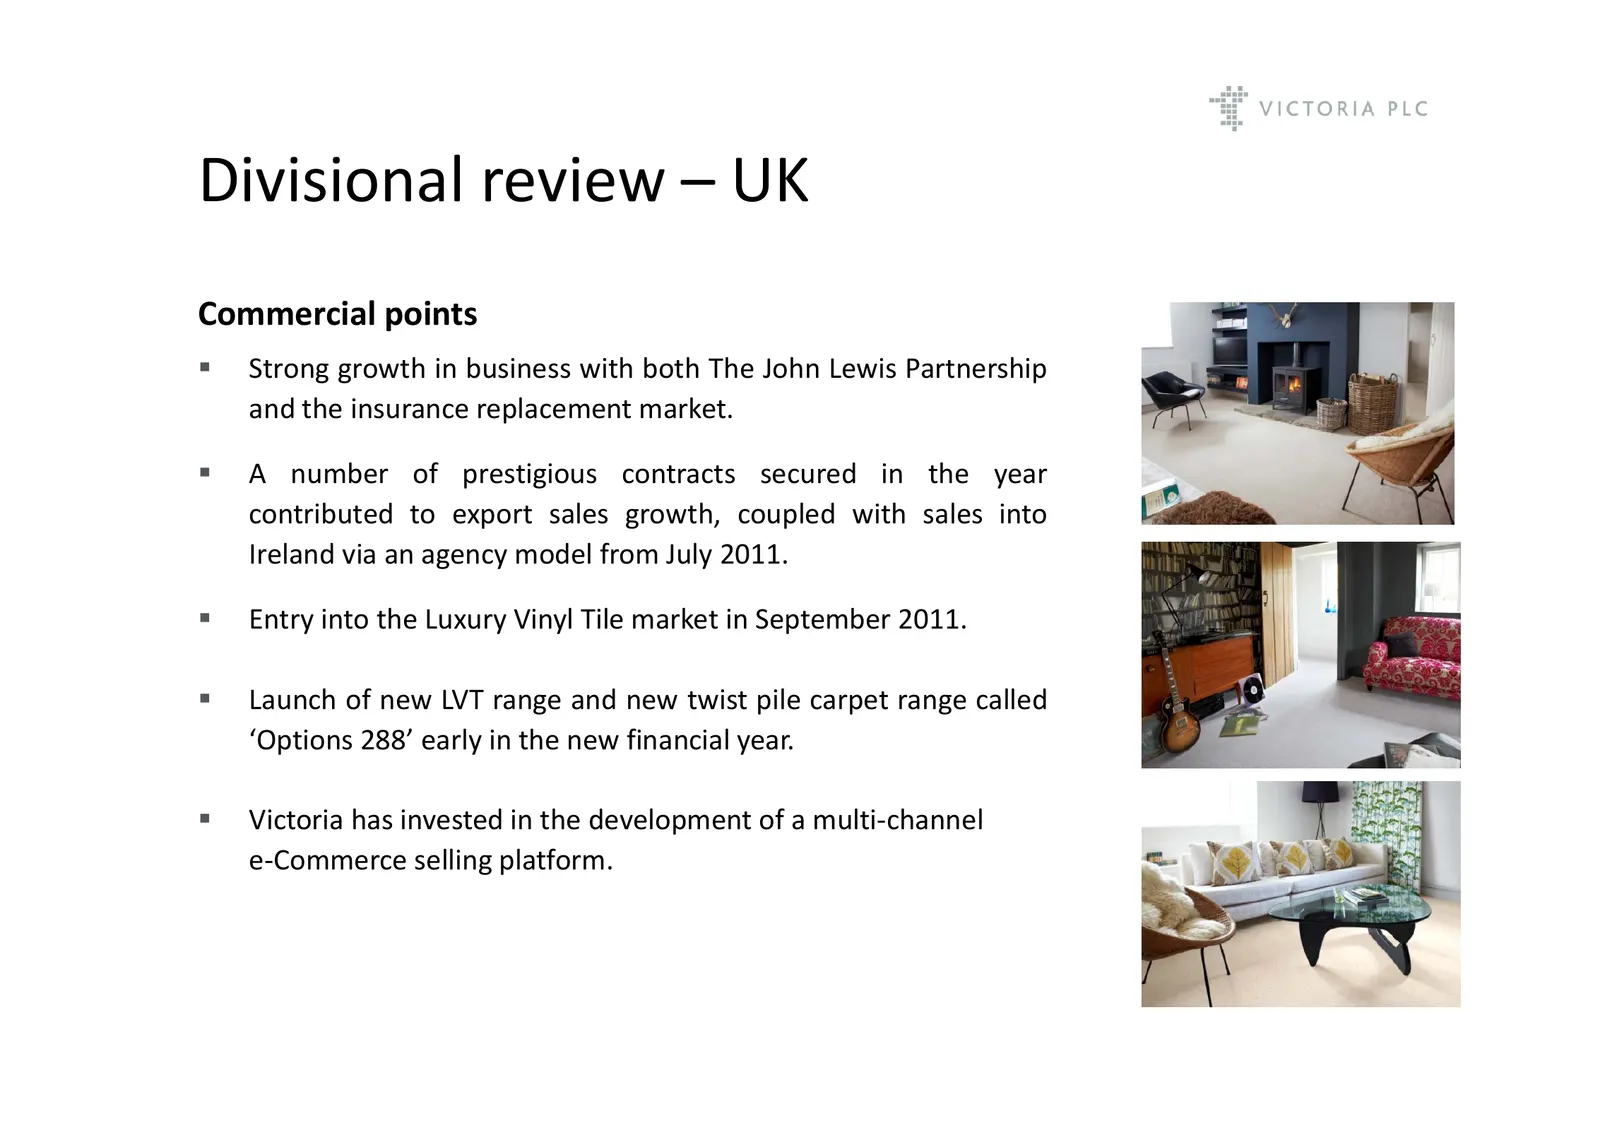
Divisional review – UK Commercial points Strong growth in business with both The John Lewis Partnership and the insurance replacement market. A number of prestigious contracts secured in the year contributed to export sales growth, coupled with sales into g y model from Julyy 2011. Ireland via a
Slide 17: Luxury Vinyl Tile (LVT)
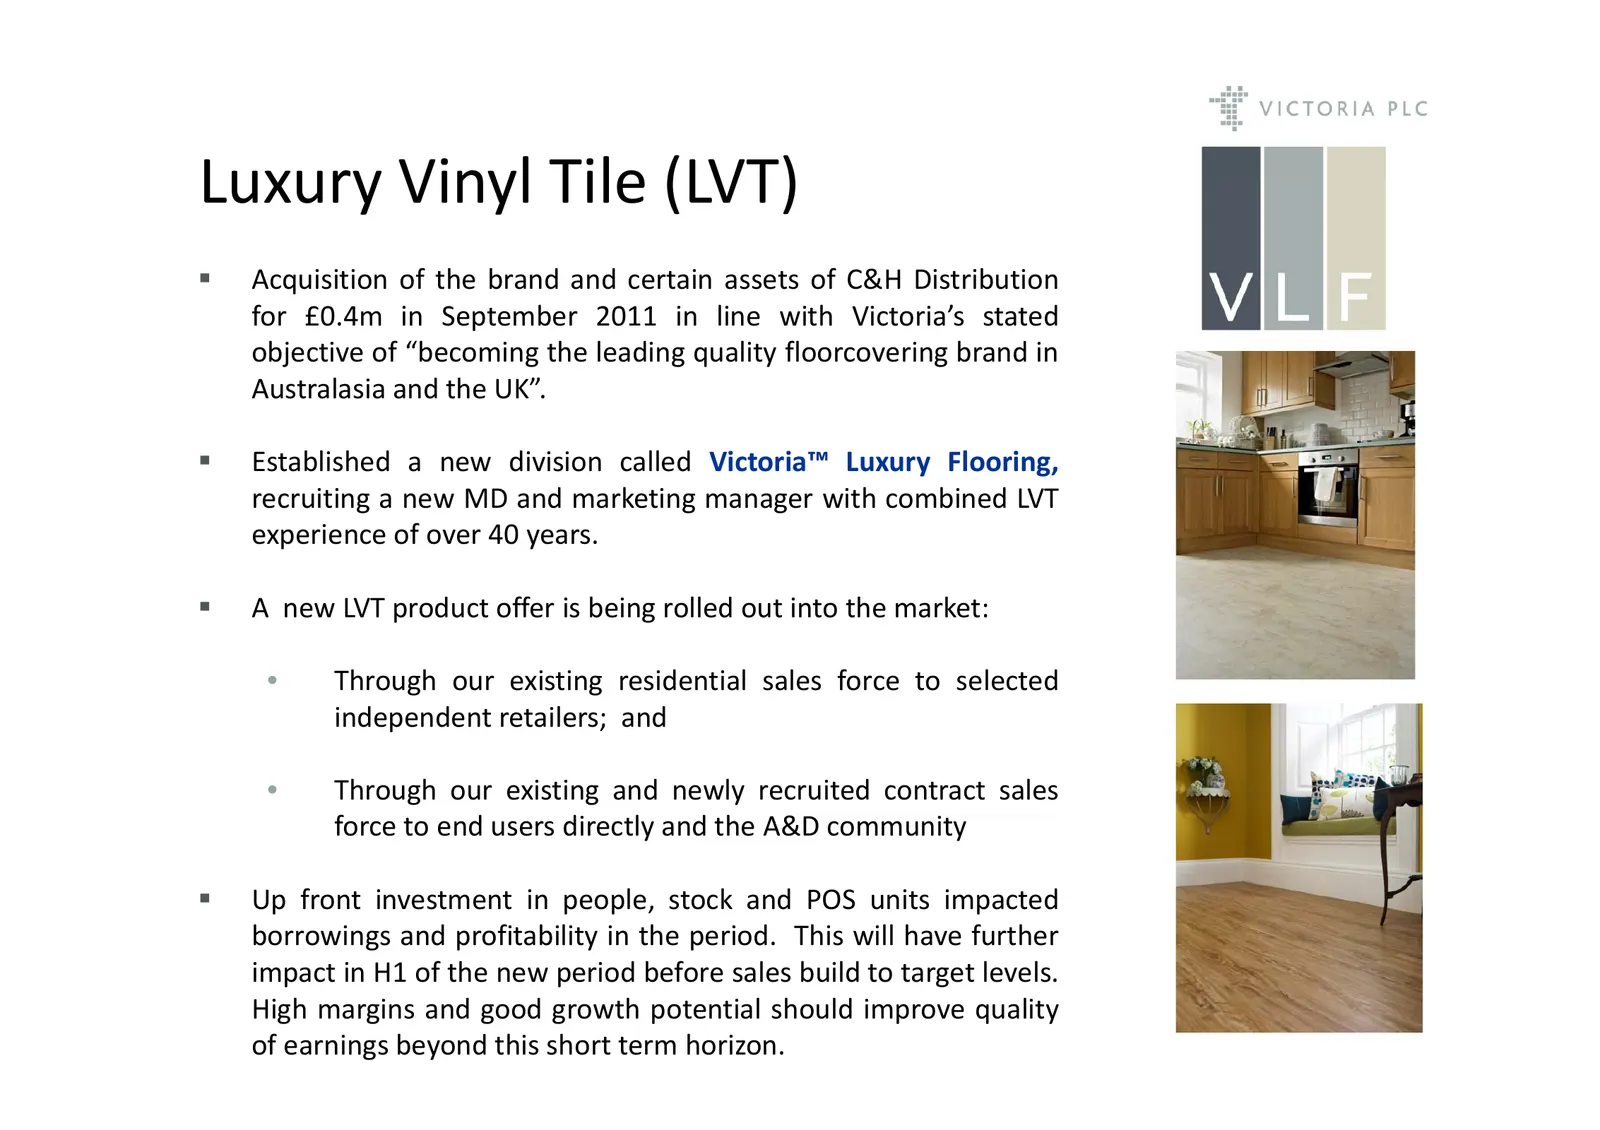
Luxury Vinyl Tile (LVT) Acquisition of the brand and certain assets of C&H Distribution f £0.4m for £0 4 in i September S t b 2011 in i line li with ith Victoria’s Vi t i ’ stated t t d objective of “becoming the leading quality floorcovering brand in Australasia and the UK”. Established a new d
Slide 18: Divisional review - Canada
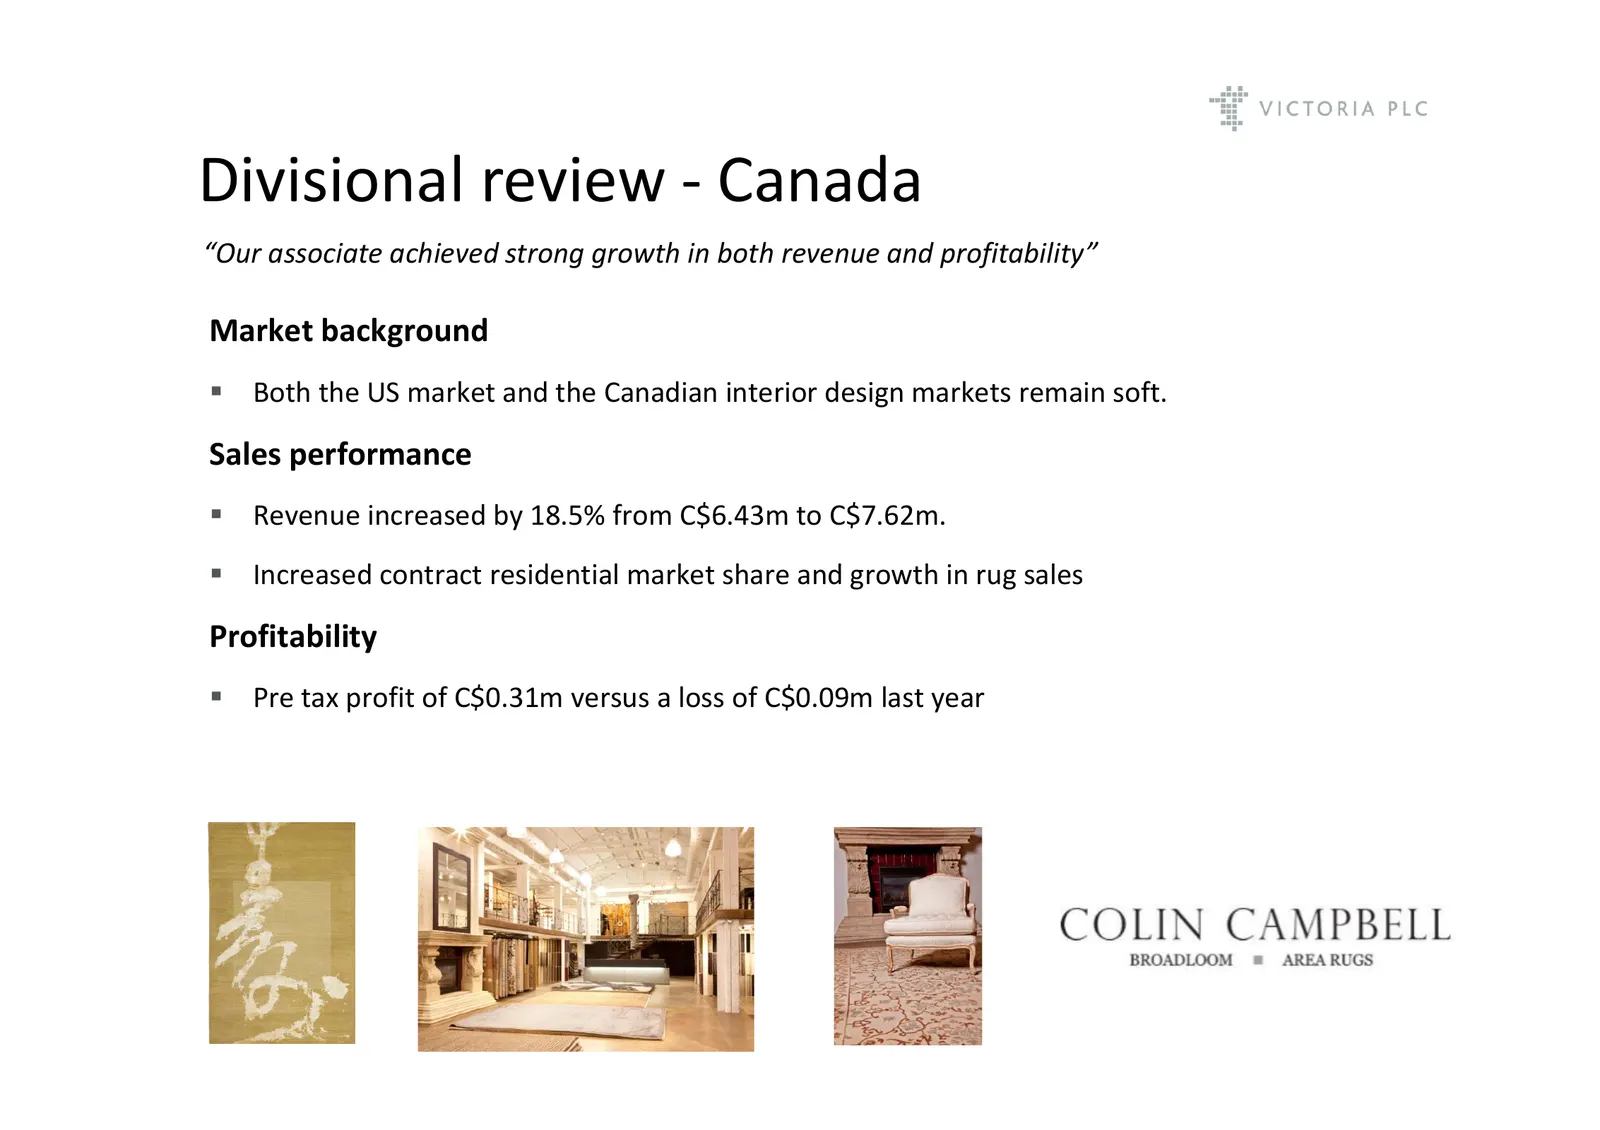
Divisional review ‐ Canada “Our associate achieved strong growth in both revenue and profitability” Market background Both the US market and the Canadian interior design markets remain soft. Sales performance Revenue increased by 18.5% from C$6.43m to C$7.62m. Increased d contract residential
Slide 19: Outlook
Outlook Alan Bullock Group Managing Director
Slide 20: Outlook
Outlook UK No significant improvement in underlying economic or market conditions are expected in the short term. The introduction of the LVT product offers significant future growth potential and enhanced quality of earnings Australia The outlook for the Australian economy is for modest overa
Slide 21: Disclaimer
Disclaimer This presentation, presentation which has been prepared by Victoria PLC ((“the the Company Company”)), includes statements that are, are or may be deemed to be, “forward‐looking statements”. These forward‐looking statements can be identified by the use of forward‐looking terminology, incl
Slide 22: Appendices
Appendices
Slide 23: Our Business Model
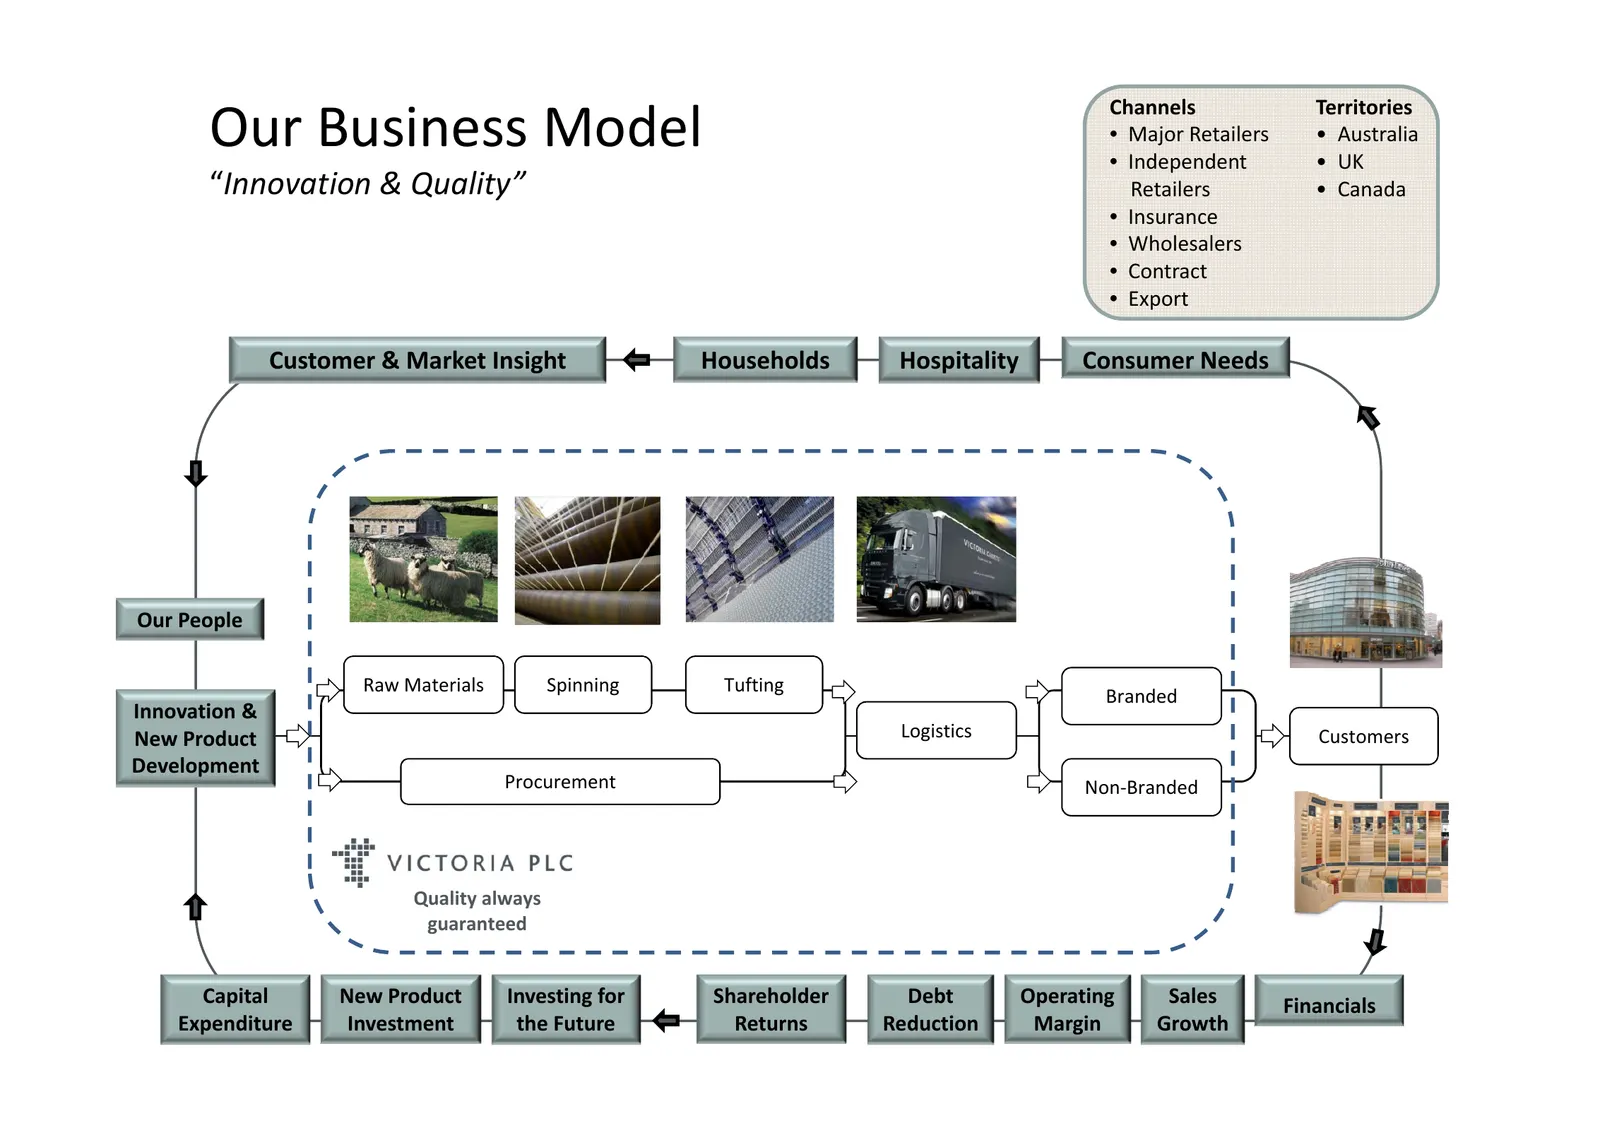
Channels Territories Our Business Model • Major Retailers • Independent • Australia • UK “Innovation Innovation & Quality Quality” Retailers • Canada • Insurance • Wholesalers • Contract • Export p Customer & Market Insight Households Hospitality Consumer Needs Our People Raw Materials Spinning p g
Slide 24: Fast facts
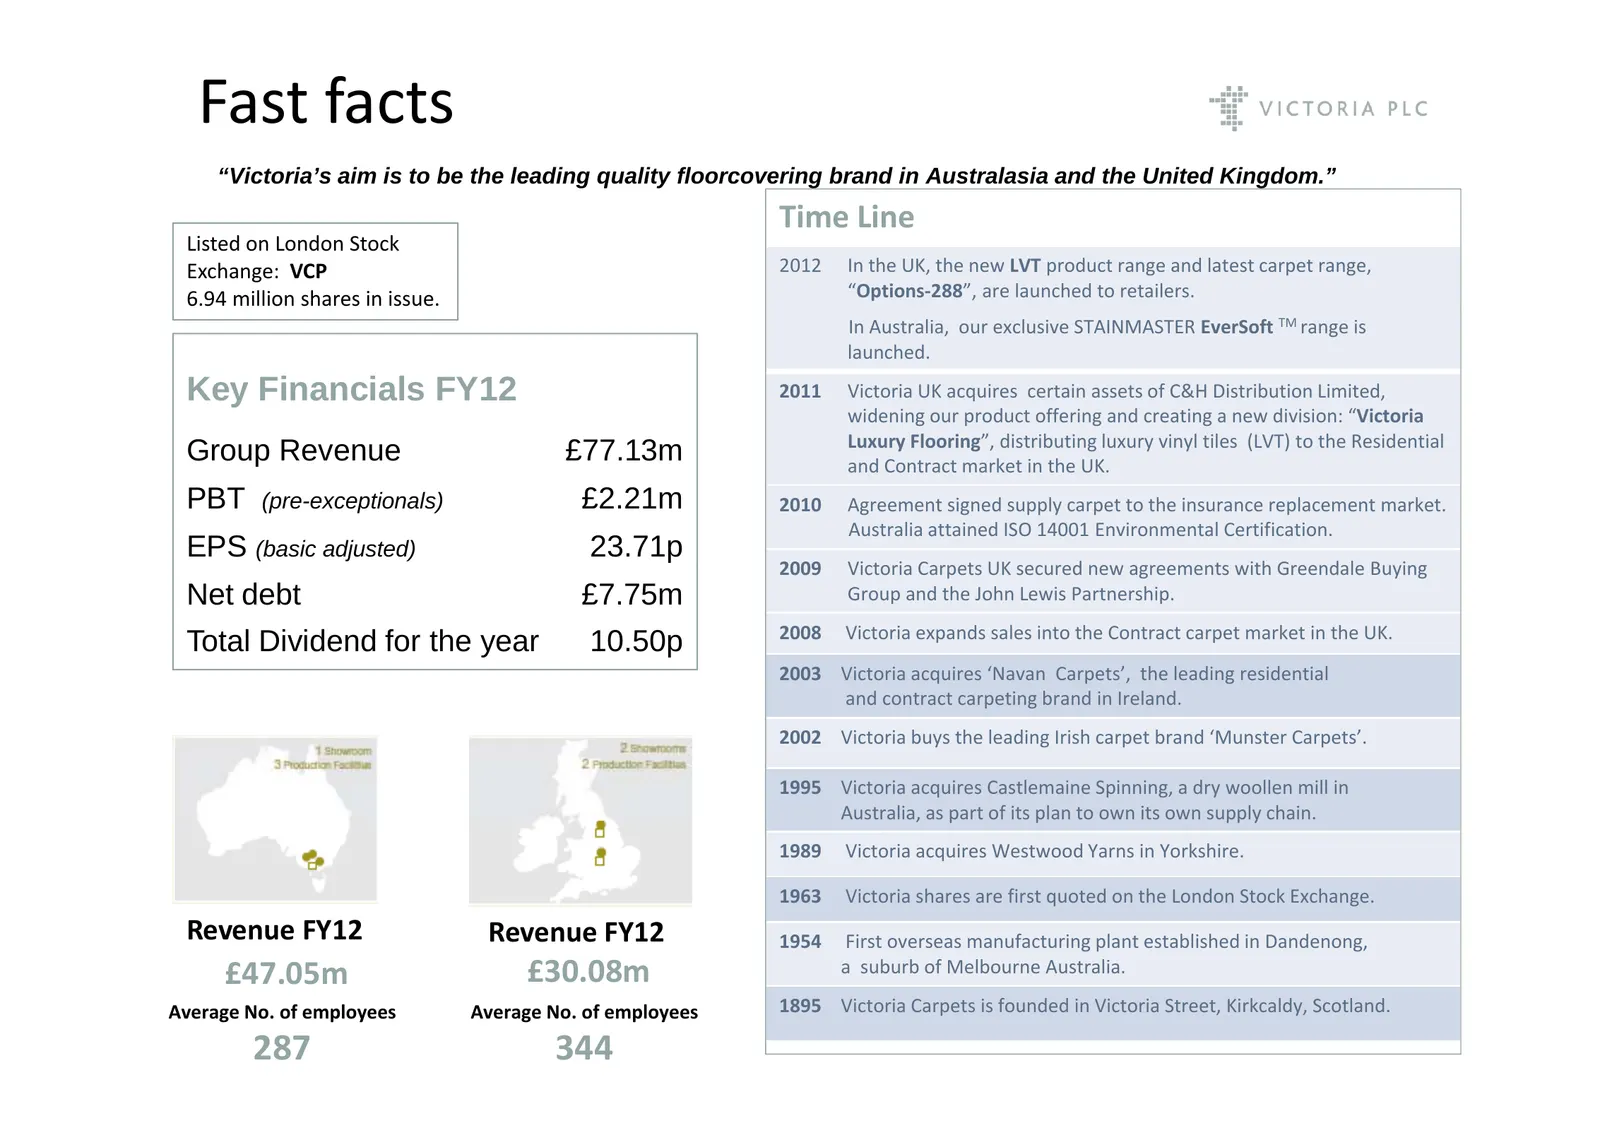
Fast facts “Victoria’s Victoria s aim is to be the leading quality floorcovering brand in Australasia and the United Kingdom. Kingdom ” Time Line Listed on London Stock Exchange: VCP 2012 In the UK, the new LVT product range and latest carpet range, 6.94 million shares in issue. “Options‐288”, are l
Slide 25: Fast facts (Continued)
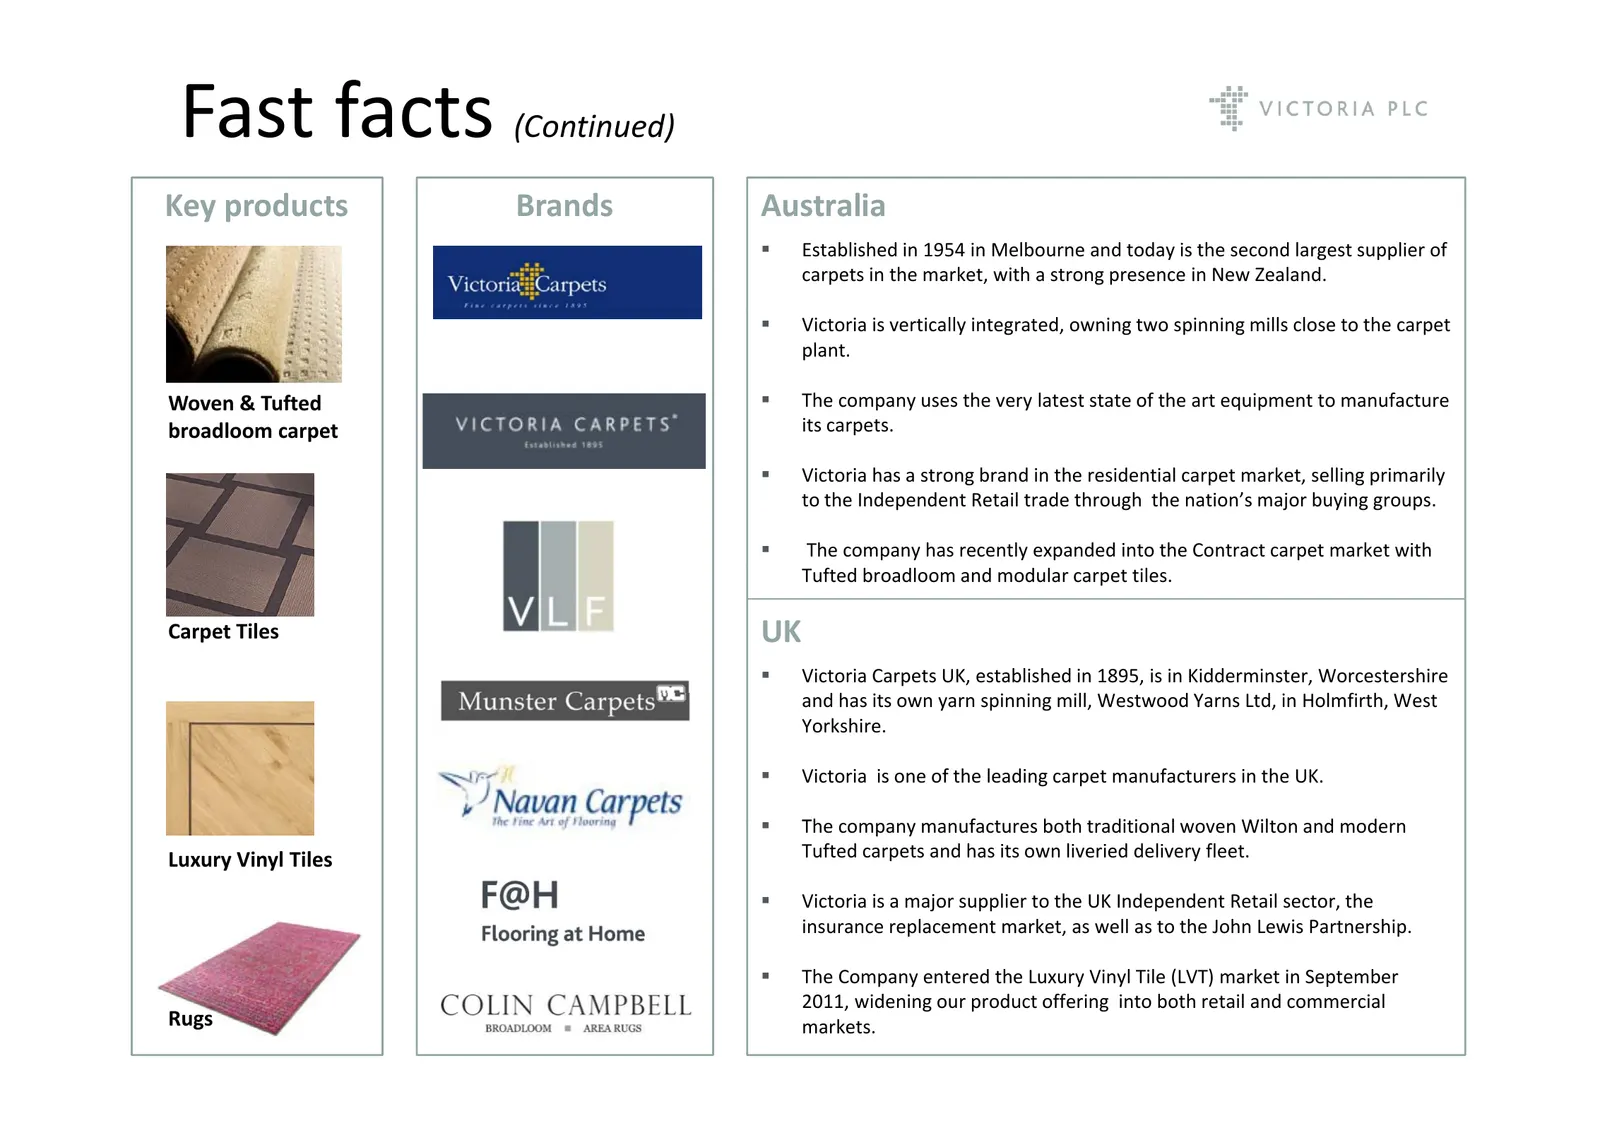
Fast facts (Continued) Key products Brands Australia Established in 1954 in Melbourne and today is the second largest supplier of carpets in the market, with a strong presence in New Zealand. Victoria is vertically integrated, owning two spinning mills close to the carpet plant. Woven & Tufted
Slide 26: Fast facts (continued): The Board
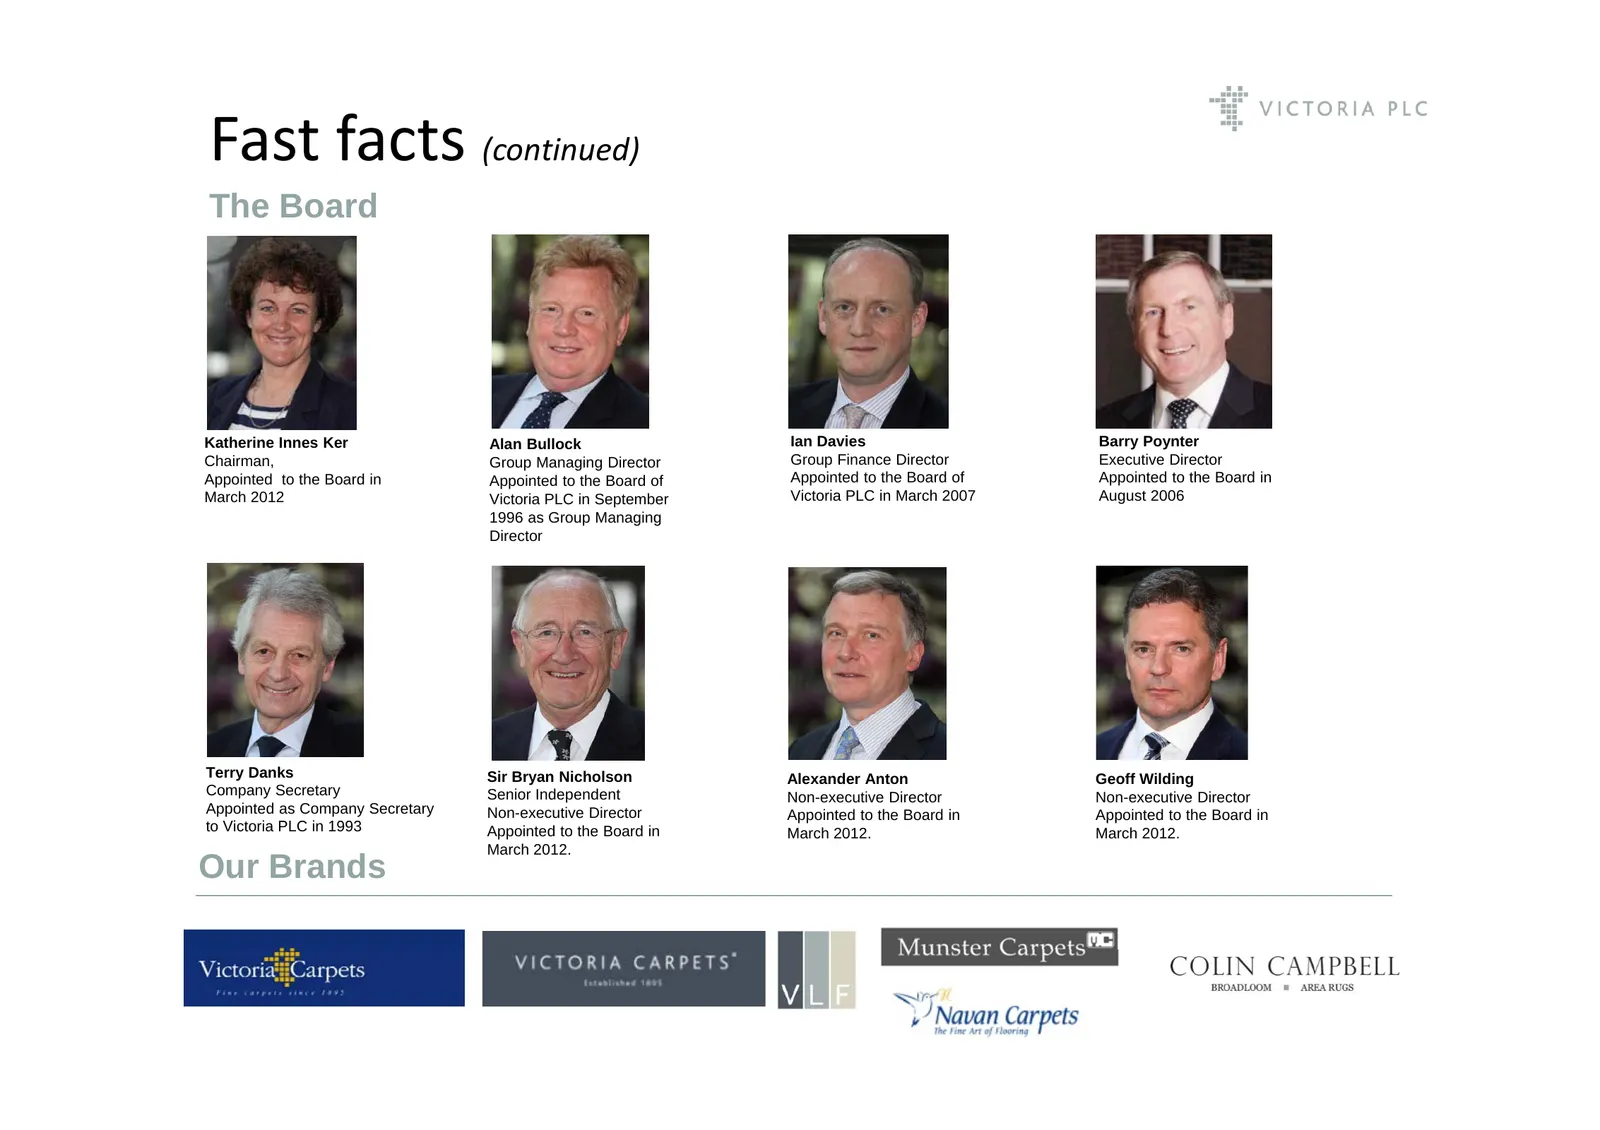
Fast facts (continued) The Board Katherine Innes Ker Alan Bullock IIan Davies D i B Barry P Poynter t Chairman, Group Managing Director Group Finance Director Executive Director Appointed to the Board in Appointed to the Board of Appointed to the Board of Appointed to the Board in March 2012 Victori
Slide 27: UK - wool prices
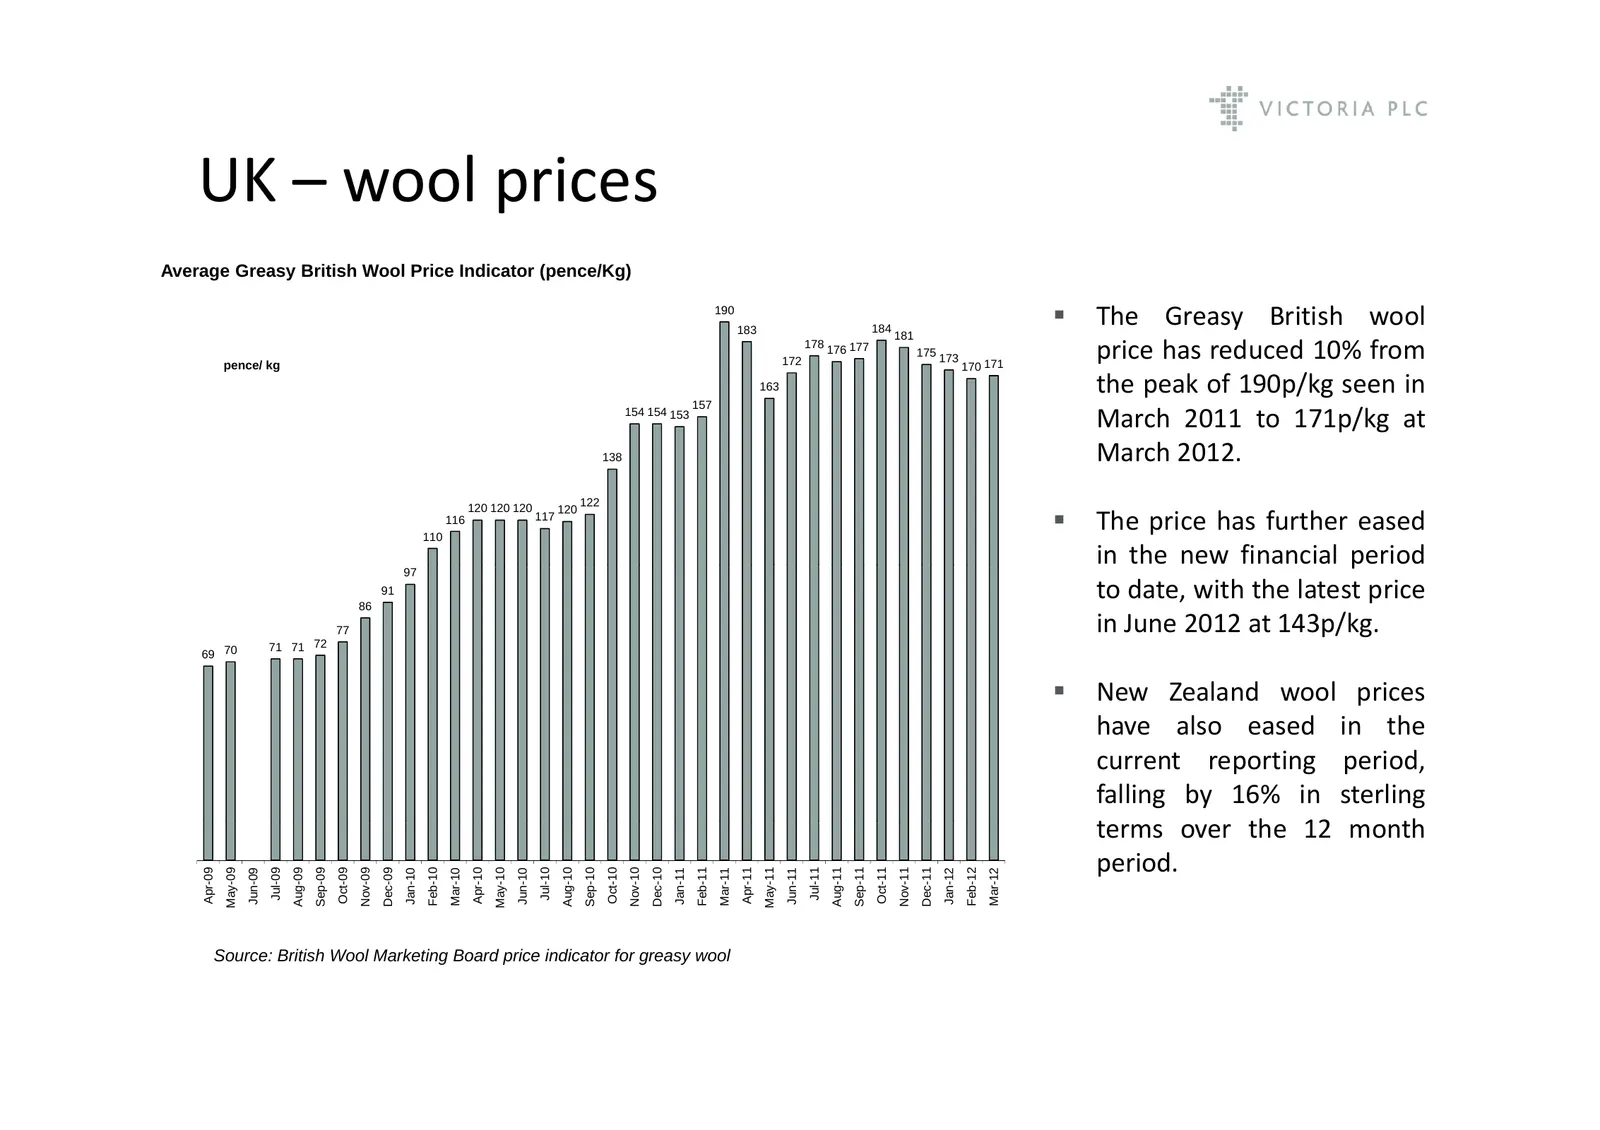
UK – wool prices Average Greasy British Wool Price Indicator (pence/Kg) 190 183 184 The Greasy Th G B iti h wooll British 181 pence/ kg 172 178 176 177 175 173 170 171 price has reduced 10% from 163 the peak of 190p/kg seen in 157 154 154 153 March 2011 to 171p/kg at 138 March 2012. 120 120 120 12
Slide 28: Financial summary
Financial summary Like for Like Group Sales Operating margin 10.0% 8.0% 7.5% 7.0% 6.0% 5.0% 5.0% 2.5% 4.0% 0 0% 0.0% 3.0% FY08 FY09 FY10 FY11 FY12 -2.5% 2.0% 1.0% -5.0% 0.0% -7.5% FY08 FY09 FY10 FY11 FY12 Operating margin -10.0% Basic adjusted EPS (pence) Debt to EBITDA Ratio 3.00 36.54 2.50 2.00 23
Slide 29: Group balance sheet and cash flow
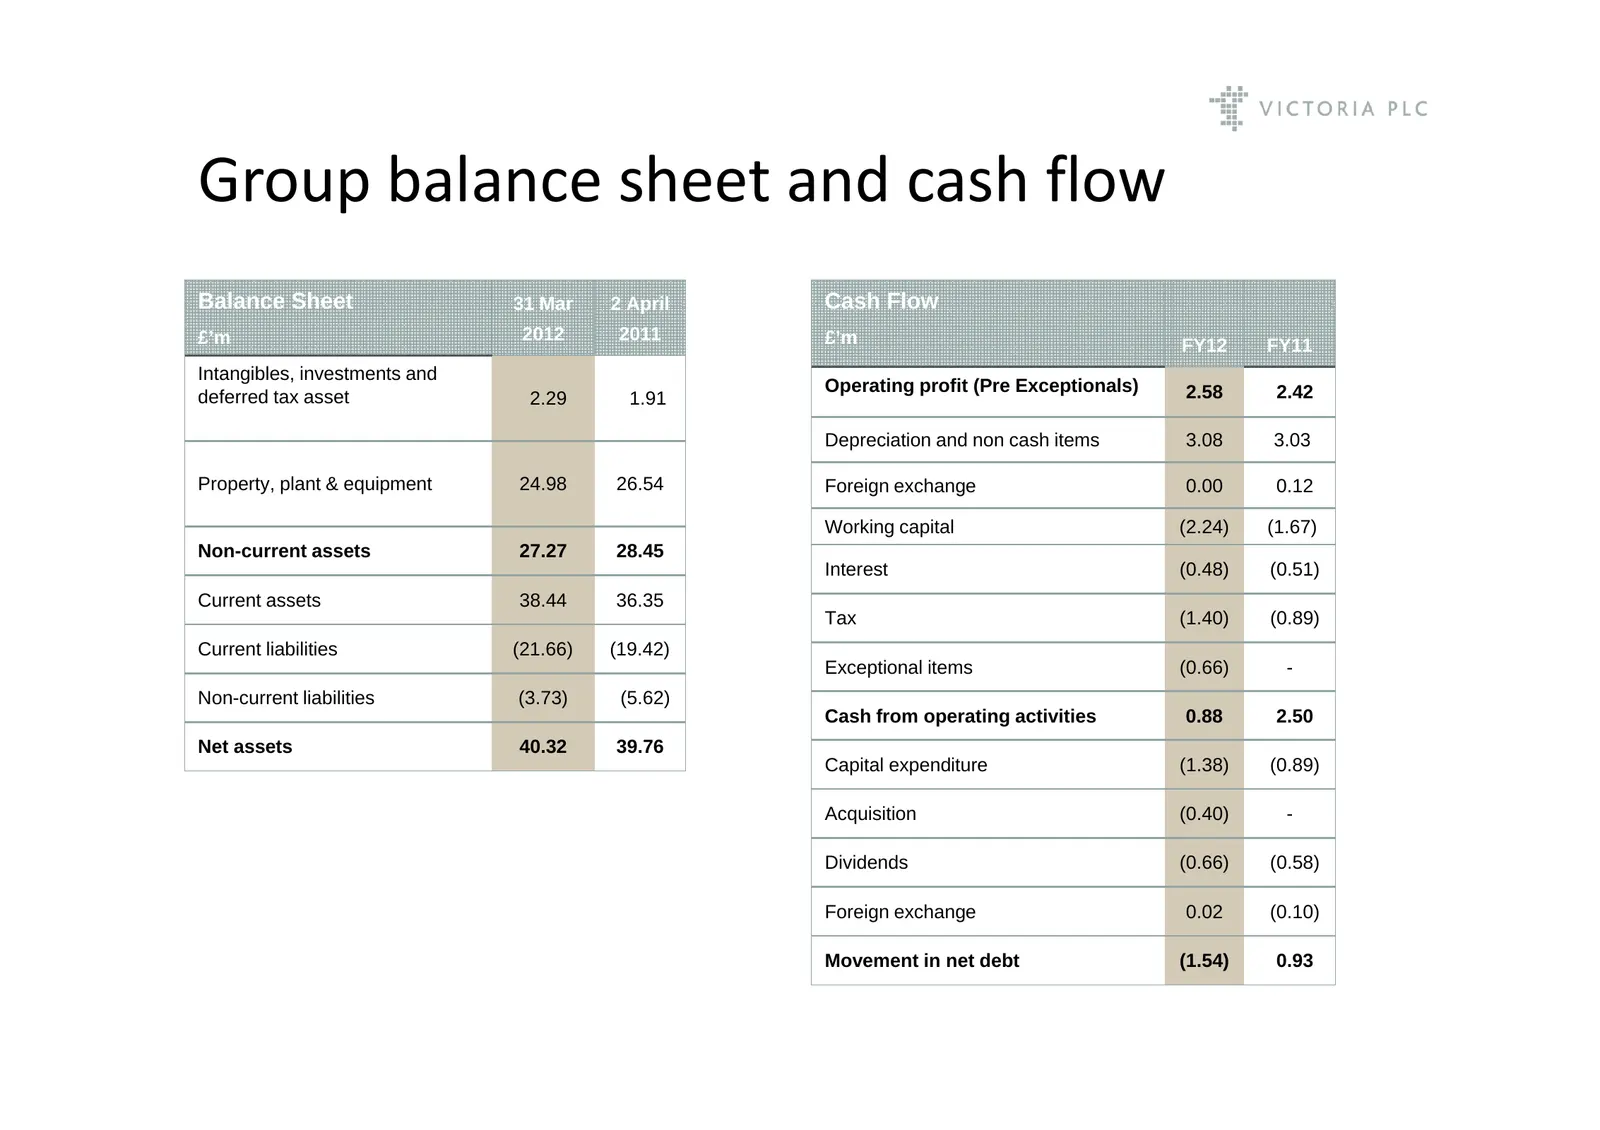
Group balance sheet and cash flow Balance Sheet 31 Mar 2 April Cash Flow £’m 2012 2011 £’m FY12 FY11 Intangibles, investments and Operating profit (Pre Exceptionals) 2.58 2.42 deferred tax asset 2.29 1.91 Depreciation and non cash items 3 08 3.08 3 03 3.03 Property, plant & equipment 24.98 26.54 For
Slide 30: Glossary & Currency Movements
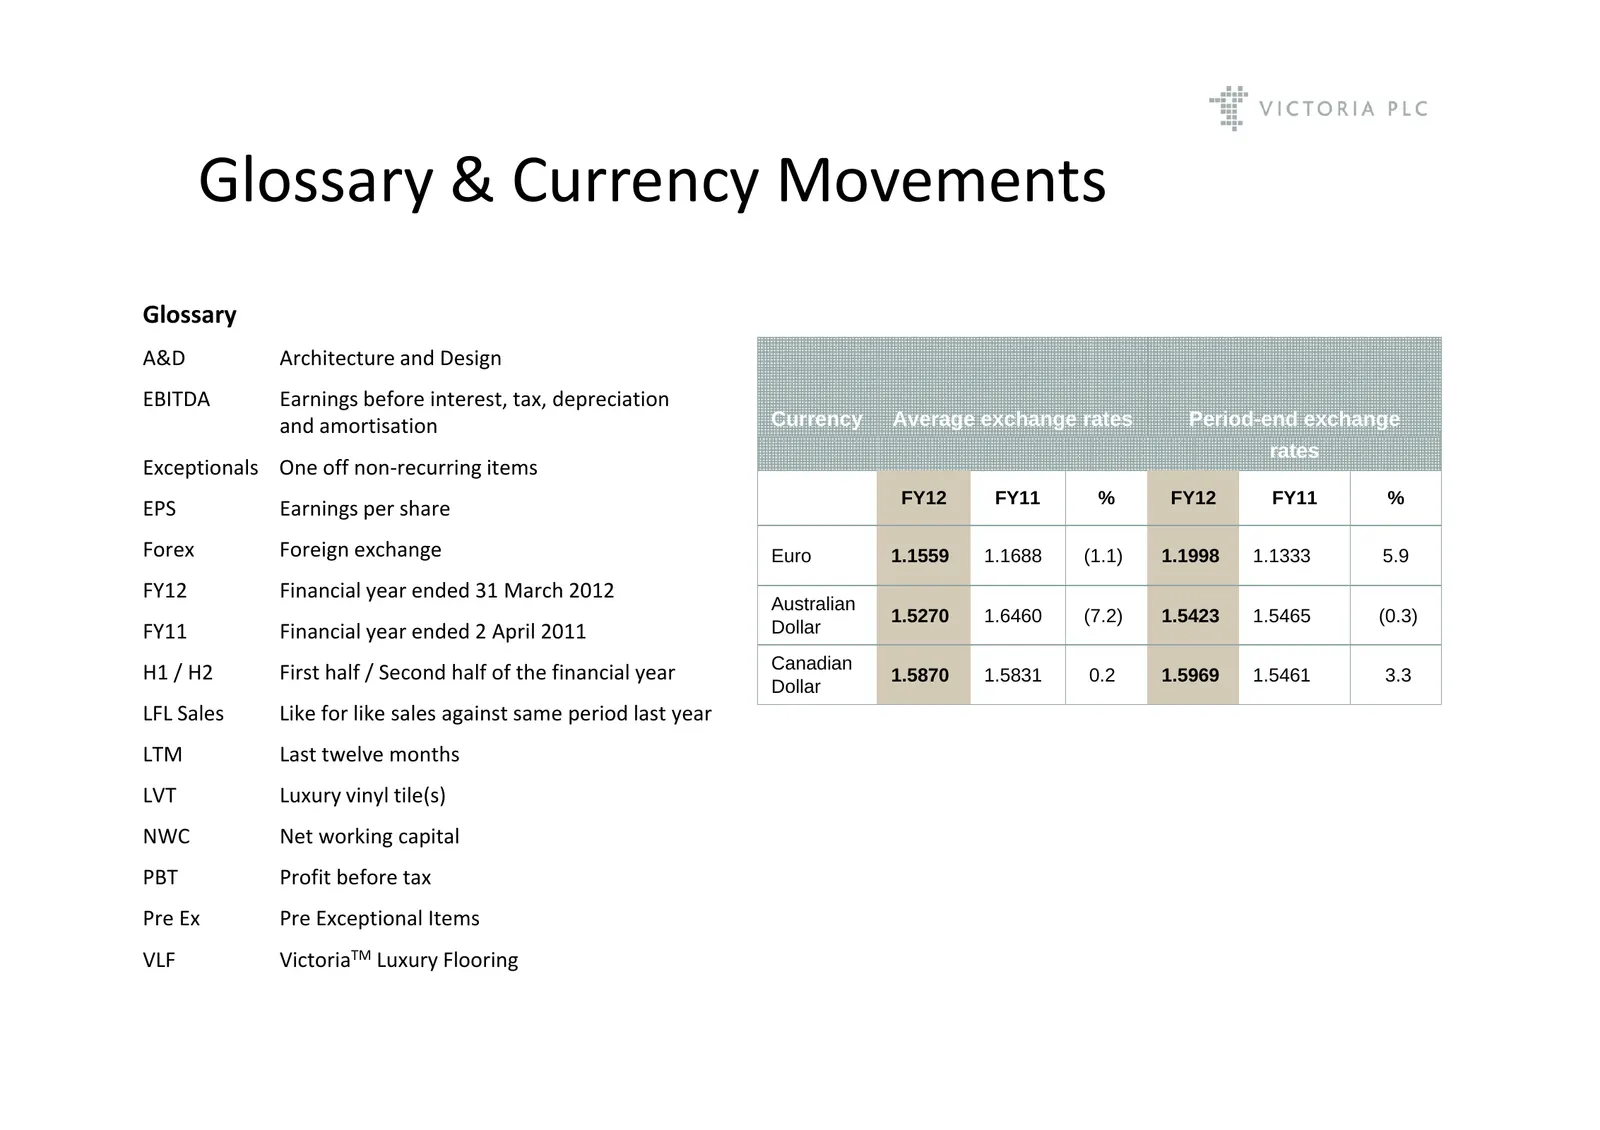
Glossary & Currency Movements Glossary Gl A&D Architecture and Design EBITDA Earnings before interest, tax, depreciation and amortisation Currency Average exchange rates Period-end exchange rates Exceptionals One off non‐recurring items FY12 FY11 % FY12 FY11 % EPS Earnings per share Forex Foreign ex
Slide 31: Worcester Road, Kidderminster, Worcestershire DY10 1JR England
Enquiries: Victoria PLC Seymour Pierce Alan Bullock, Group Managing Director Jonathan Wright, Head of Corporate Finance Mobile: +44 (0) 7785 325701 Tel: +44 (0) 20-7107 8050 Ian Davies, Group Finance Director Mobile: +44 (0) 7711 627449 Mobile: +44 (0) 7770 638791 Office: +44 (0) 1562 749300 www.vic
Source: Internet Archive copy of victoriaplc.com
More decks from Victoria PLC
 FY2026 Earnings Presentation31 slides · Jul 24, 2026
 H1 FY2026 Earnings Presentation35 slides · Dec 17, 2025
 FY2025 Earnings Presentation33 slides · Jul 24, 2025
 FY2024 Earnings Presentation25 slides · Jun 19, 2024
 H1 FY2023 Earnings Presentation27 slides · Nov 29, 2022
 FY2022 Earnings Presentation32 slides · Jul 19, 2022