Budimex SA · GPW:BDX
Budimex SA — Q1 2015 Earnings Presentation
15 slides from Budimex SA's earnings presentation, 2015
Slide 1: Investor presentation 1Q'15 financial results
Investor presentation 1Q’15 financial results www.budimex.com.pl
Slide 2: Budimex Group
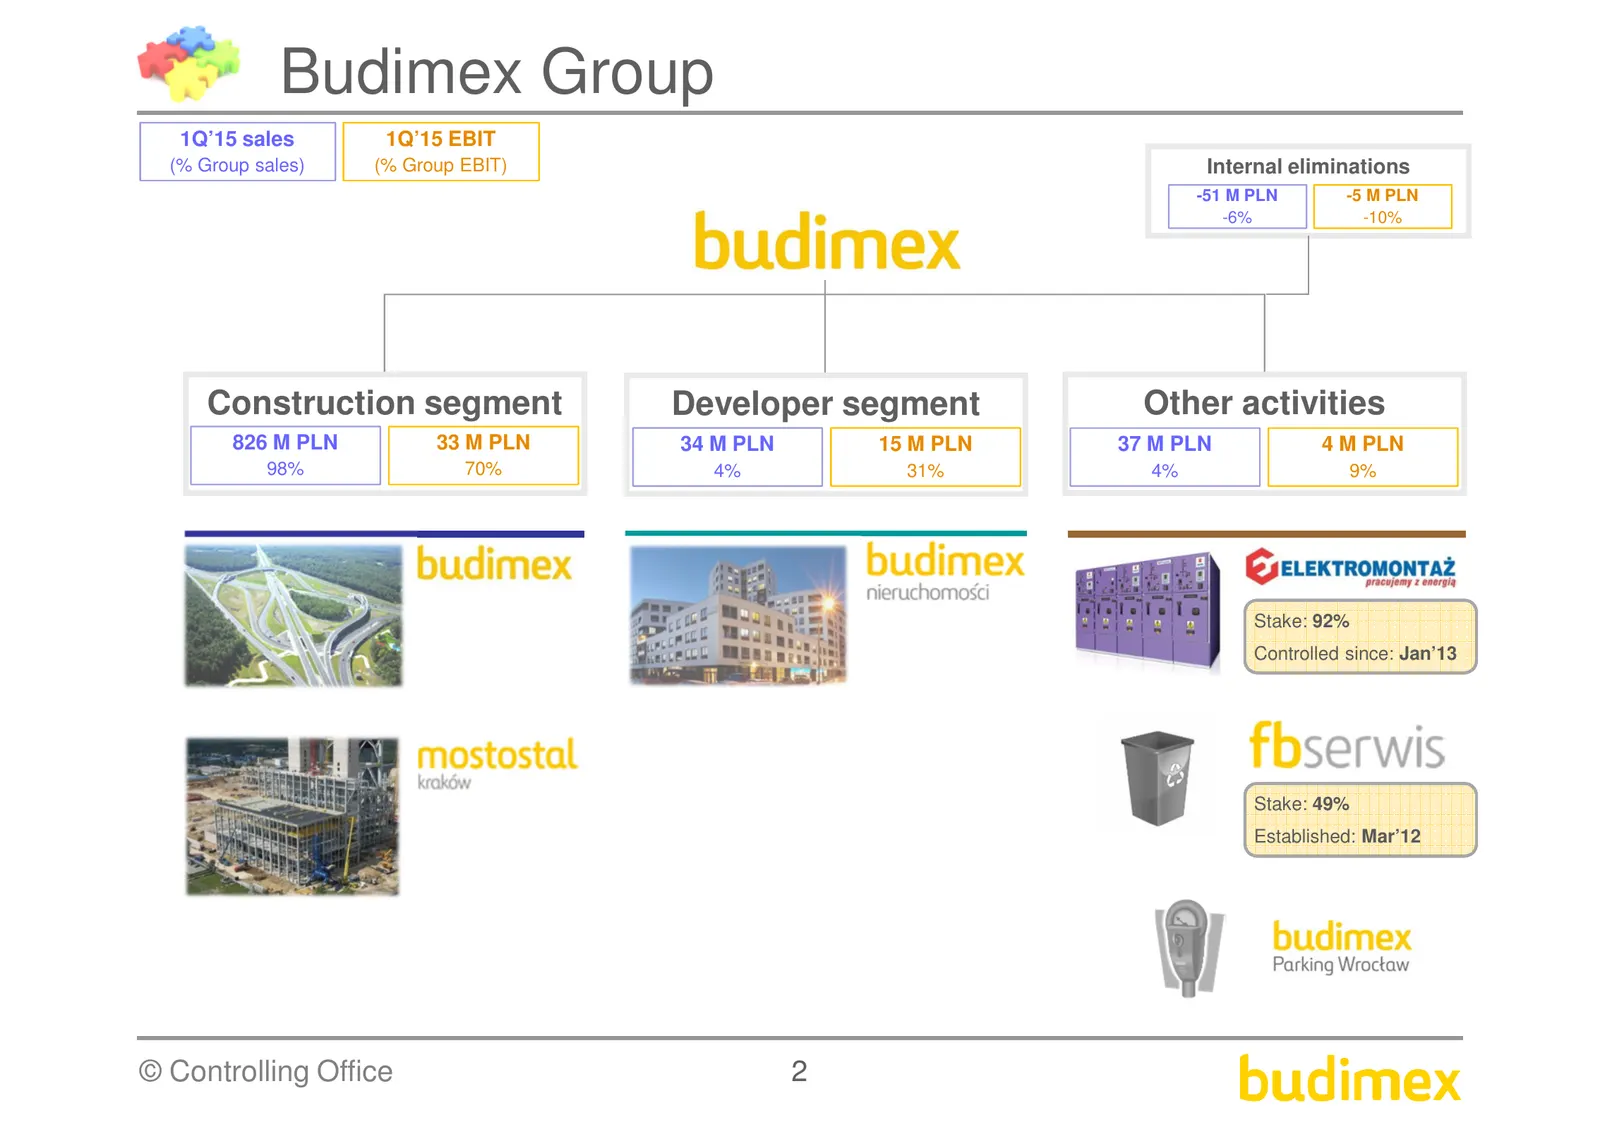
Budimex Group 1Q’15 sales 1Q’15 EBIT (% Group sales) (% Group EBIT) Internal eliminations -51 M PLN -5 M PLN -6% -10% Construction segment Developer segment Other activities 826 M PLN 33 M PLN 34 M PLN 15 M PLN 37 M PLN 4 M PLN 98% 70% 4% 31% 4% 9% Stake: 92% Controlled since: Jan’13 Stake: 49% Esta
Slide 3: 1Q'15 at a glance
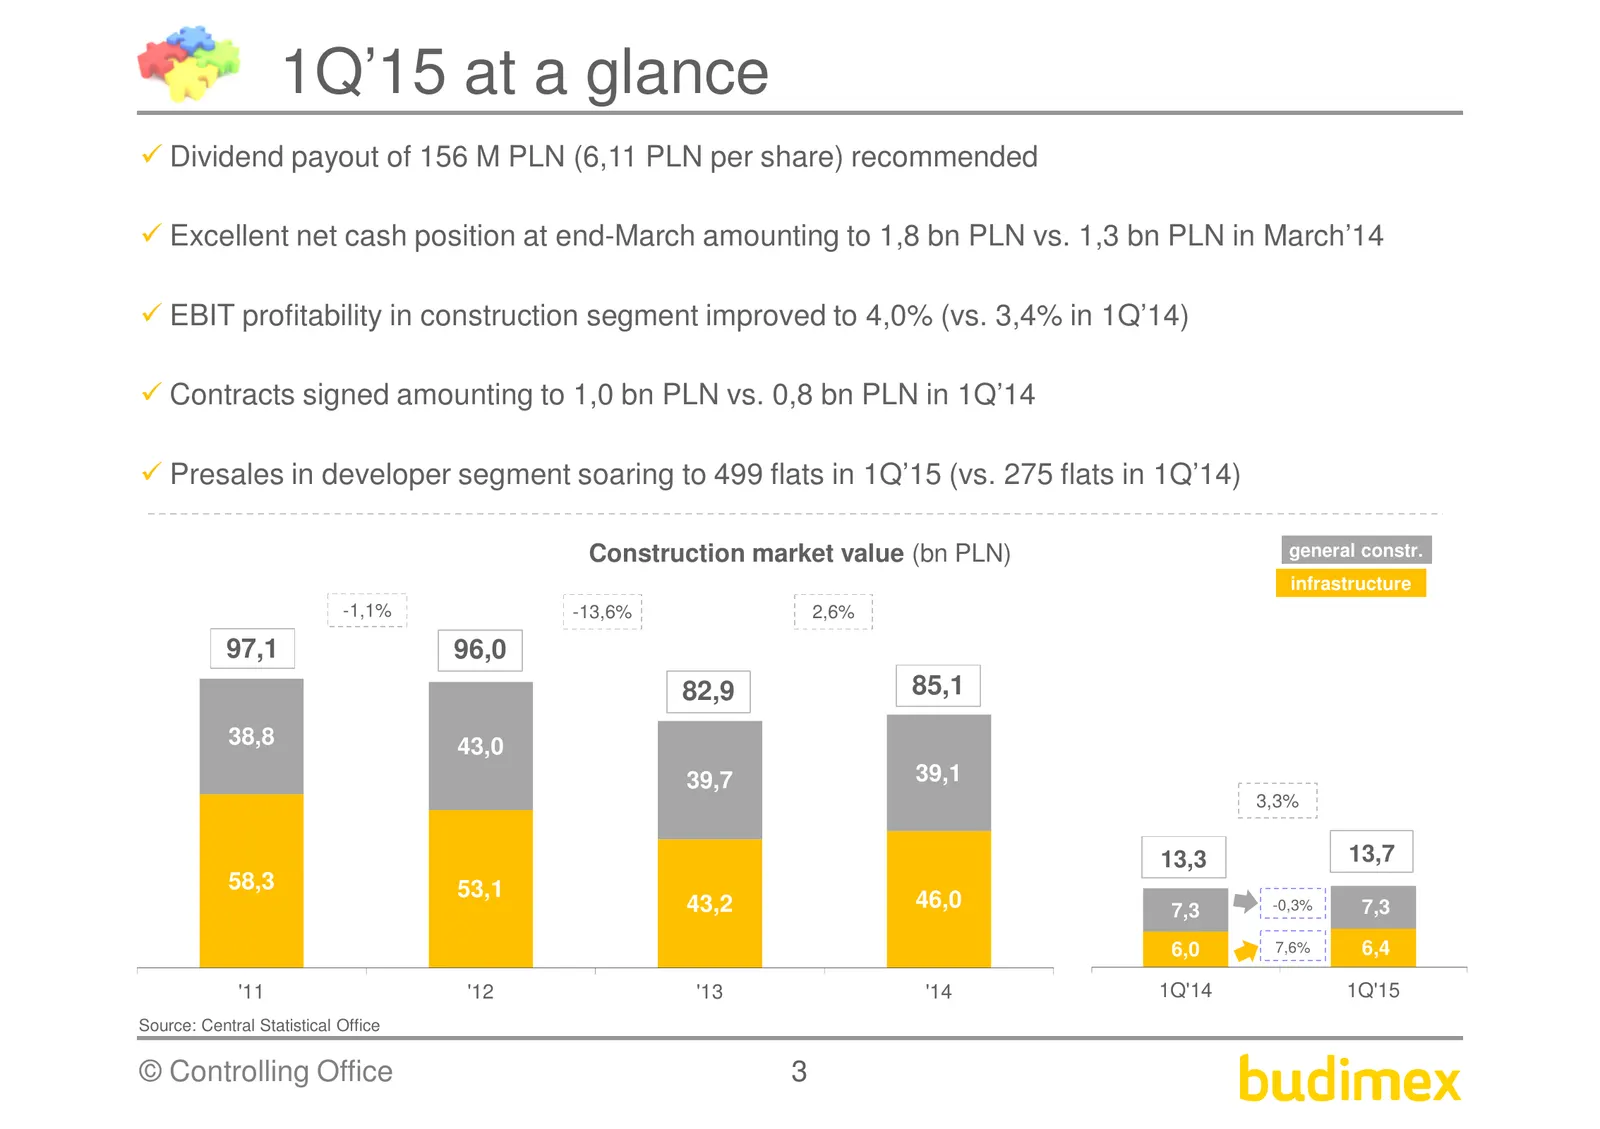
1Q’15 at a glance Dividend payout of 156 M PLN (6,11 PLN per share) recommended Excellent net cash position at end-March amounting to 1,8 bn PLN vs. 1,3 bn PLN in March’14 EBIT profitability in construction segment improved to 4,0% (vs. 3,4% in 1Q’14) Contracts signed amounting to 1,0 bn PLN vs. 0,8
Slide 4: Material prices evolution
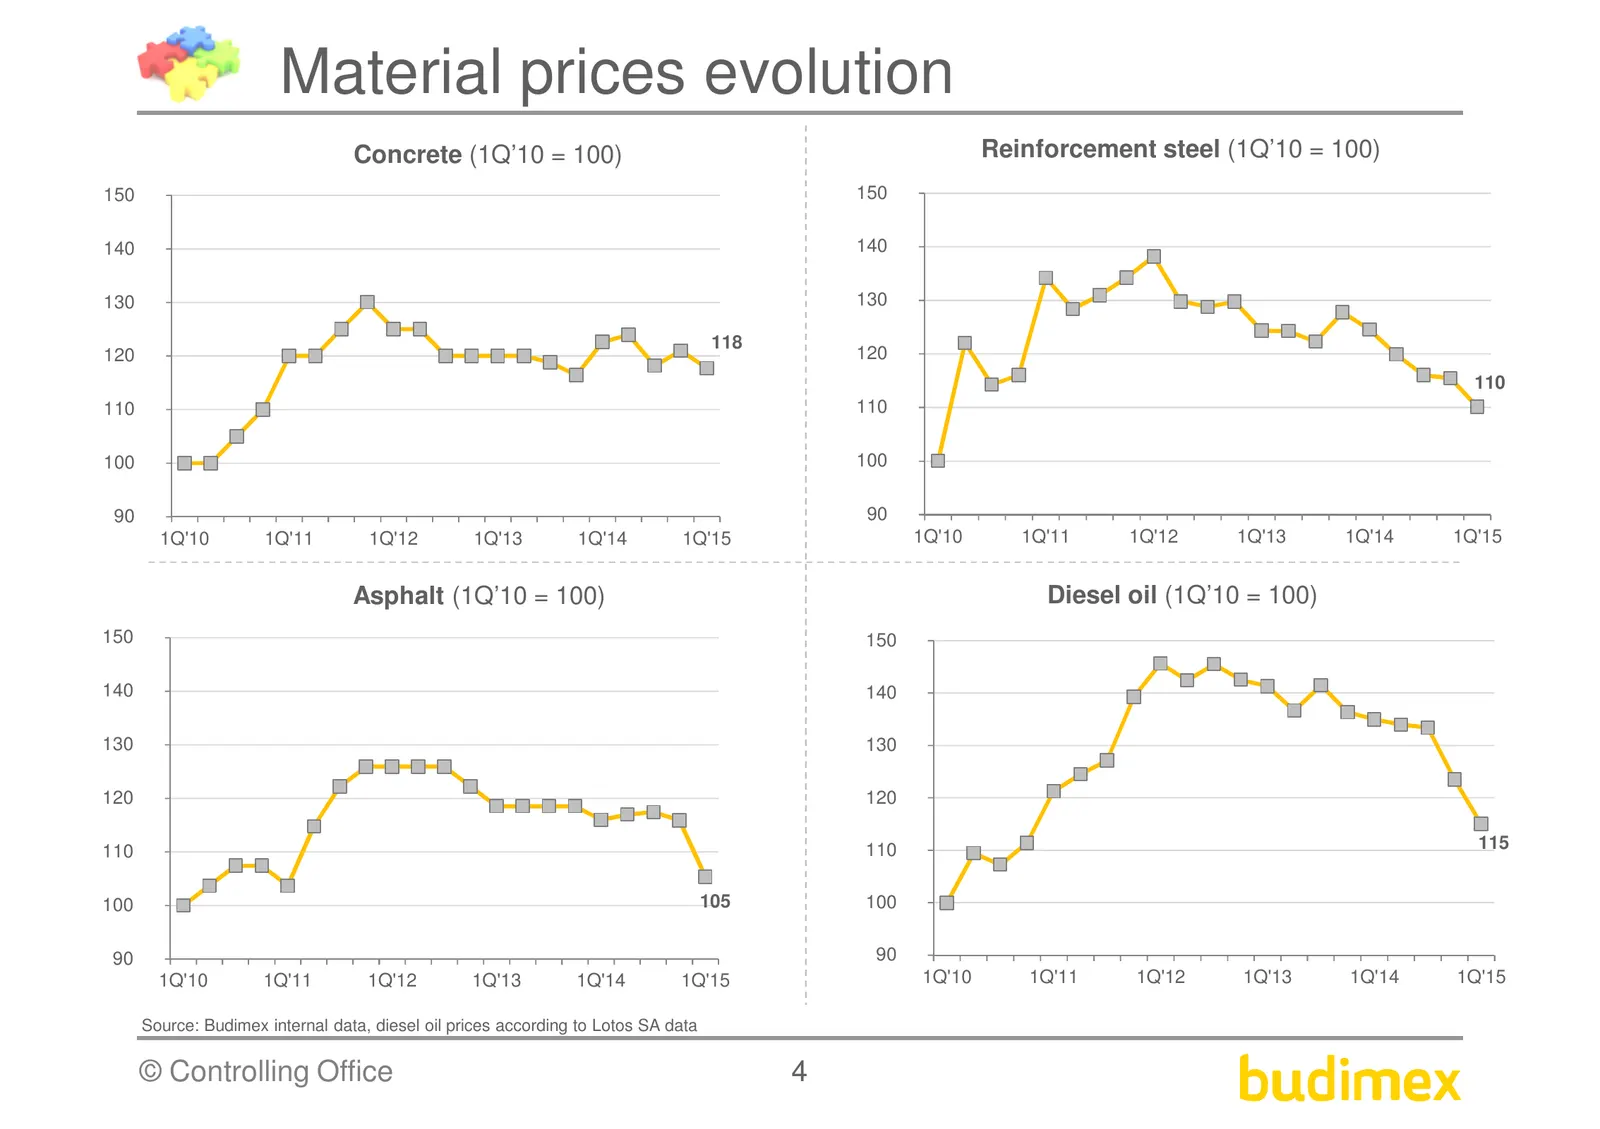
Material prices evolution Concrete (1Q’10 = 100) Reinforcement steel (1Q’10 = 100) 150 150 140 140 130 130 118 120 120 110 110 110 100 100 90 90 1Q'10 1Q'11 1Q'12 1Q'13 1Q'14 1Q'15 1Q'10 1Q'11 1Q'12 1Q'13 1Q'14 1Q'15 Asphalt (1Q’10 = 100) Diesel oil (1Q’10 = 100) 150 150 140 140 130 130 120 120 110
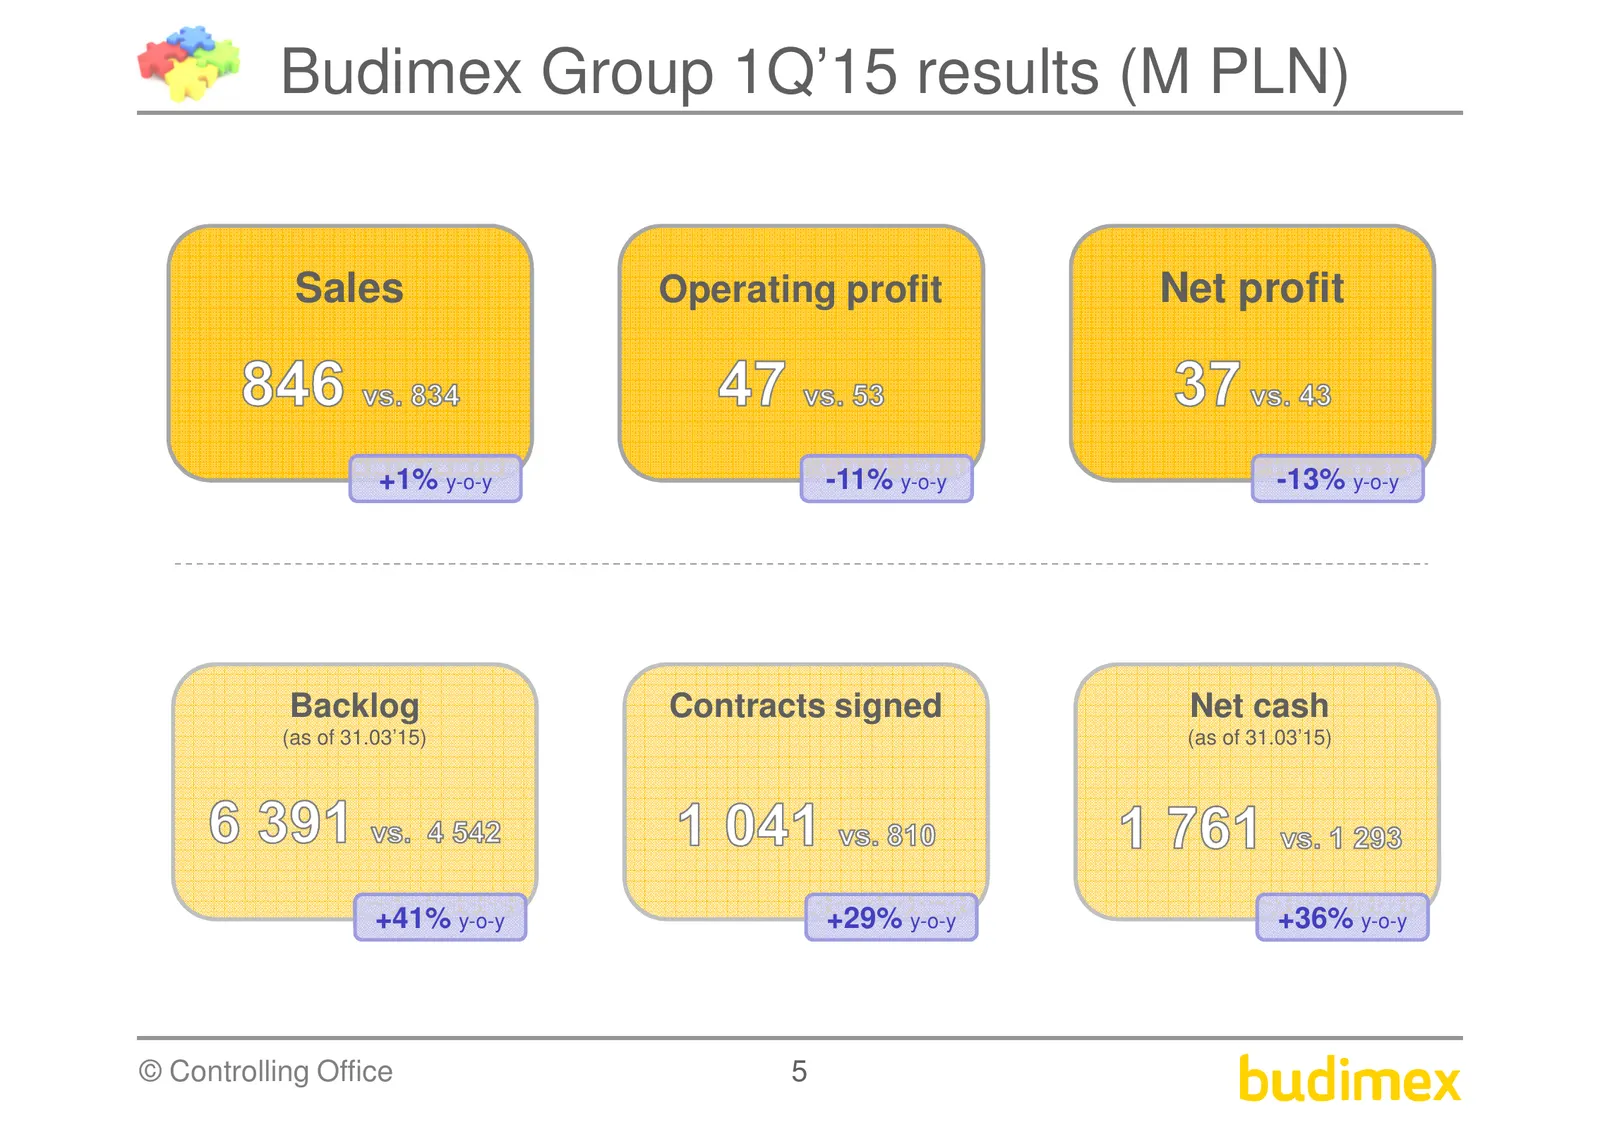
Slide 5: Budimex Group 1Q'15 results (M PLN)
Budimex Group 1Q’15 results (M PLN) Sales Operating profit Net profit +1% y-o-y -11% y-o-y -13% y-o-y Backlog Contracts signed Net cash (as of 31.03’15) (as of 31.03’15) +41% y-o-y +29% y-o-y +36% y-o-y © Controlling Office 5
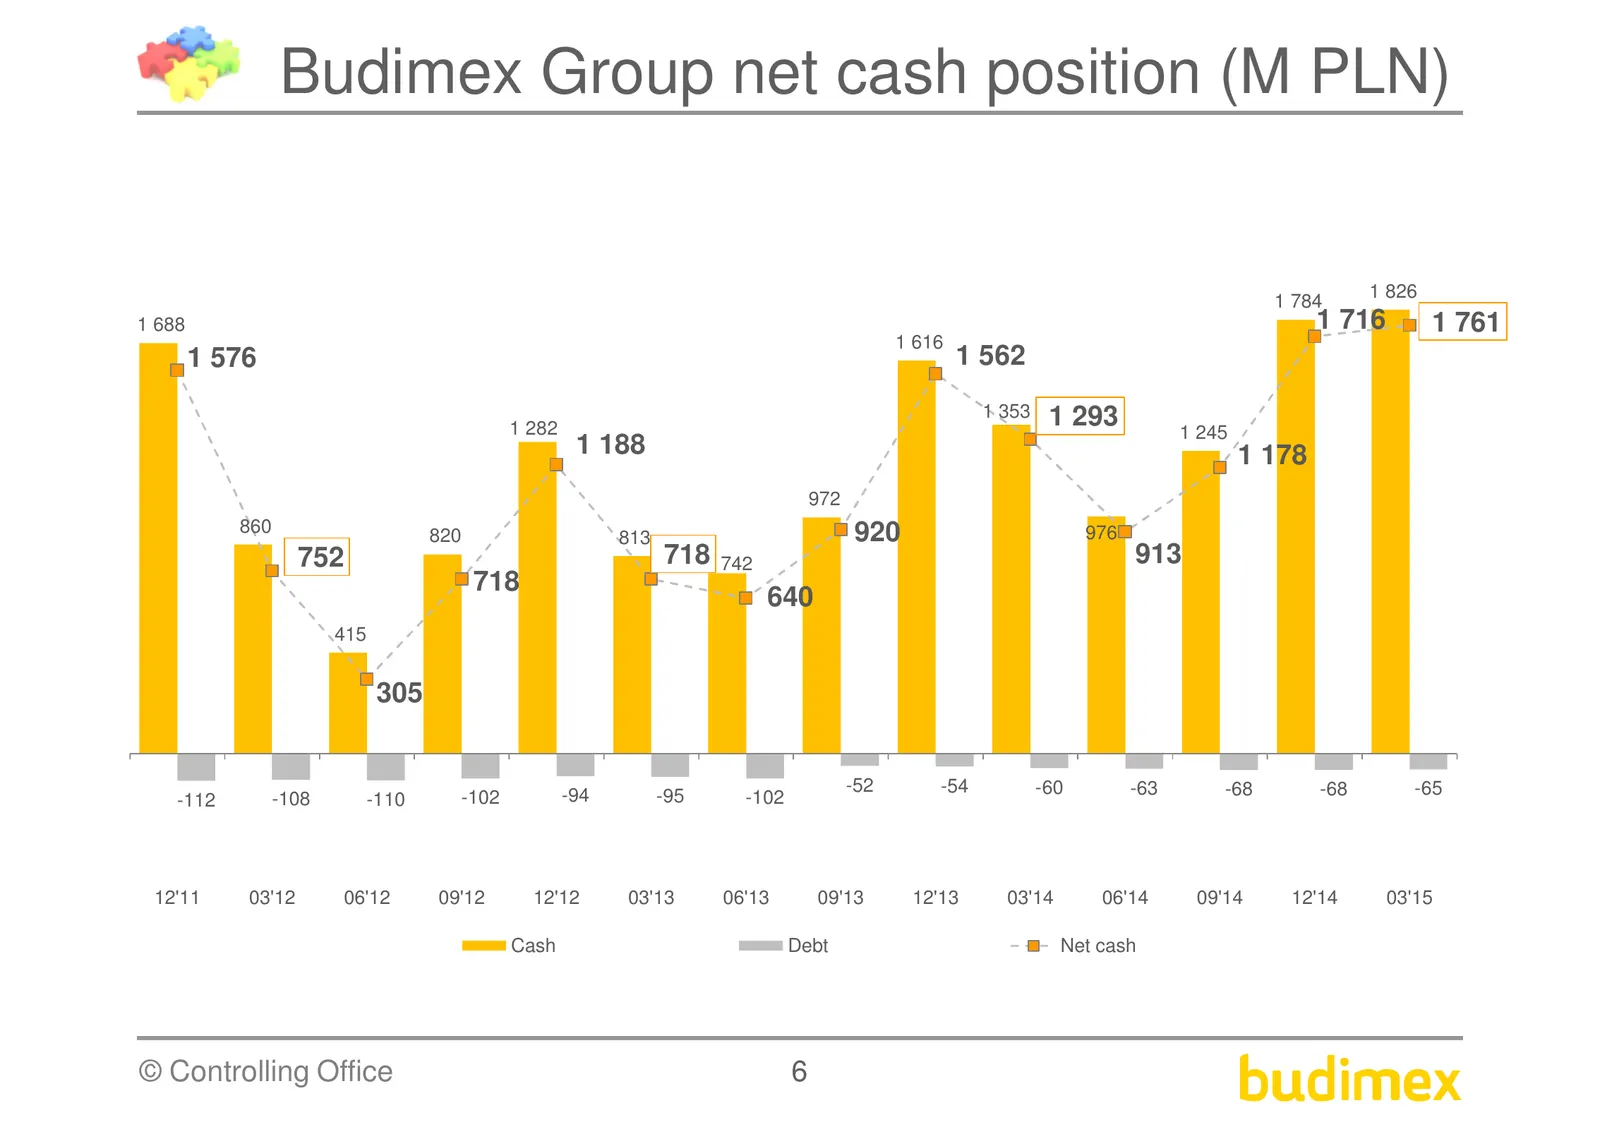
Slide 6: Budimex Group net cash position (M PLN)
Budimex Group net cash position (M PLN) 1 826 1 784 1 688 1 716 1 761 1 616 1 576 1 562 1 353 1 293 1 282 1 245 1 188 1 178 972 860 920 976 820 813 752 718 742 913 718 640 415 305 -52 -54 -60 -63 -68 -68 -65 -112 -108 -110 -102 -94 -95 -102 12'11 03'12 06'12 09'12 12'12 03'13 06'13 09'13 12'13 03'14
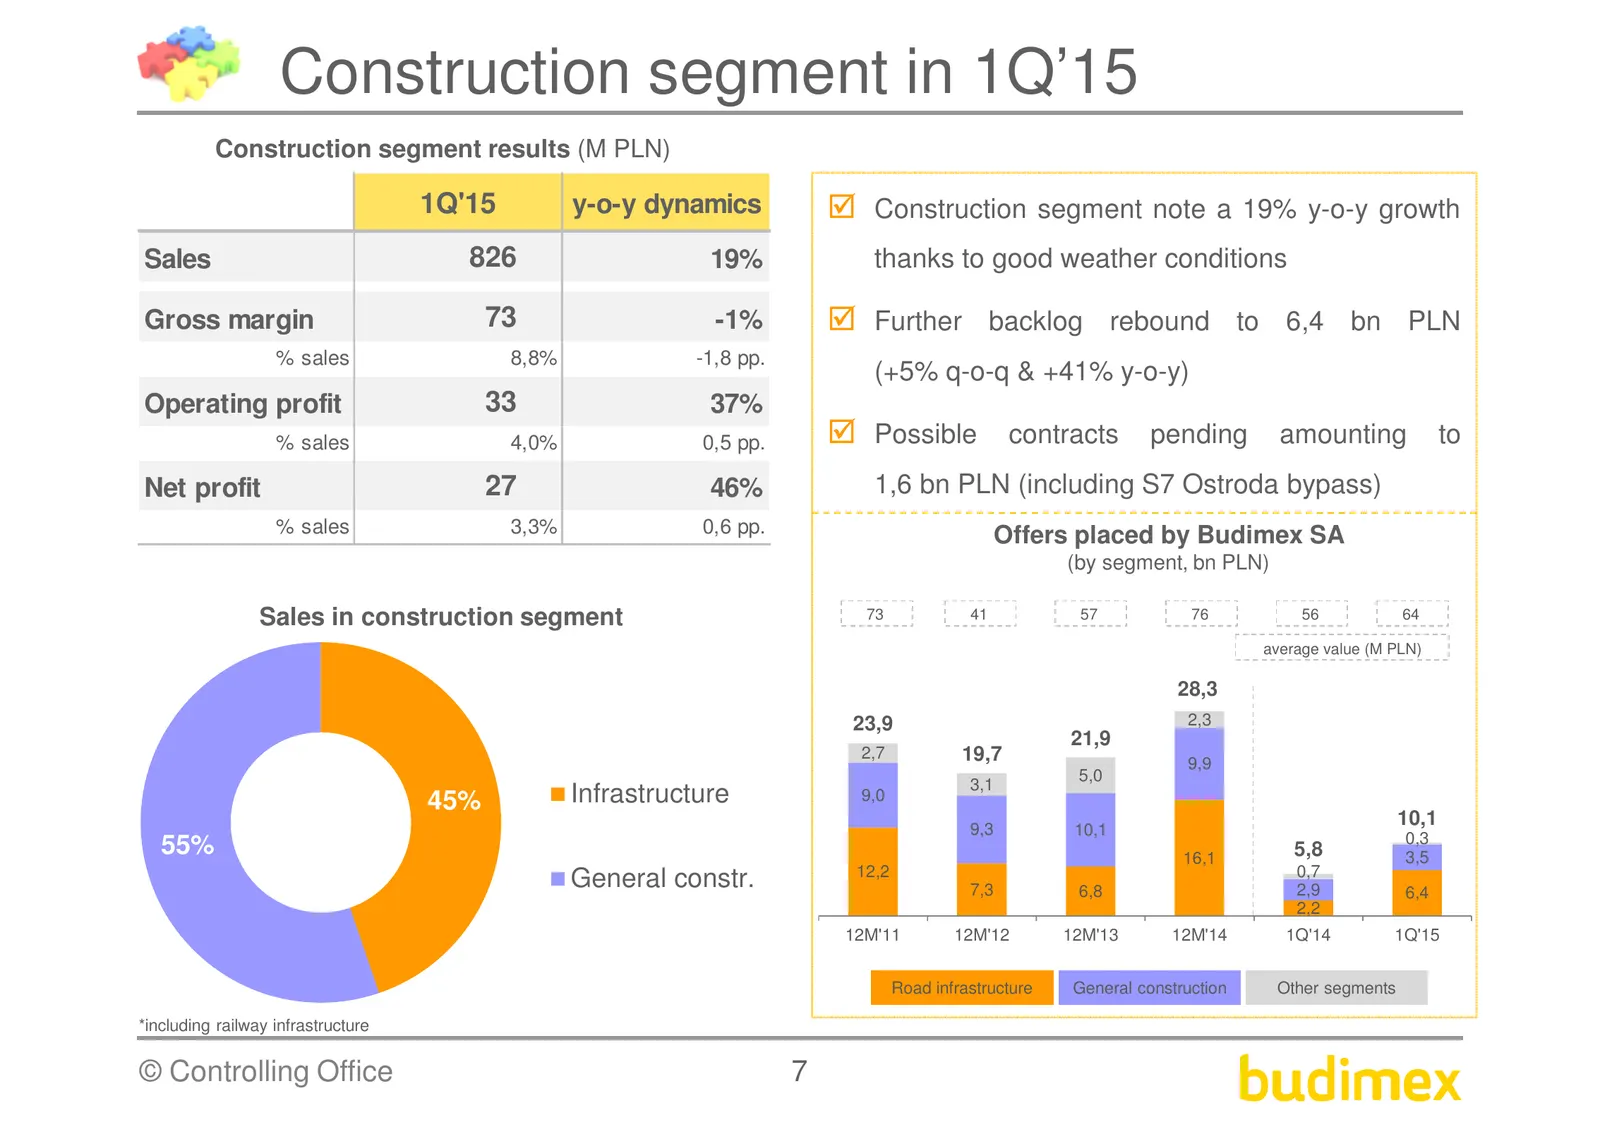
Slide 7: Construction segment in 1Q'15
Construction segment in 1Q’15 Construction segment results (M PLN) 1Q'15 y-o-y dynamics Construction segment note a 19% y-o-y growth Sales 826 19% thanks to good weather conditions Gross margin 73 -1% Further backlog rebound to 6,4 bn PLN % sales 8,8% -1,8 pp. (+5% q-o-q & +41% y-o-y) Operating prof
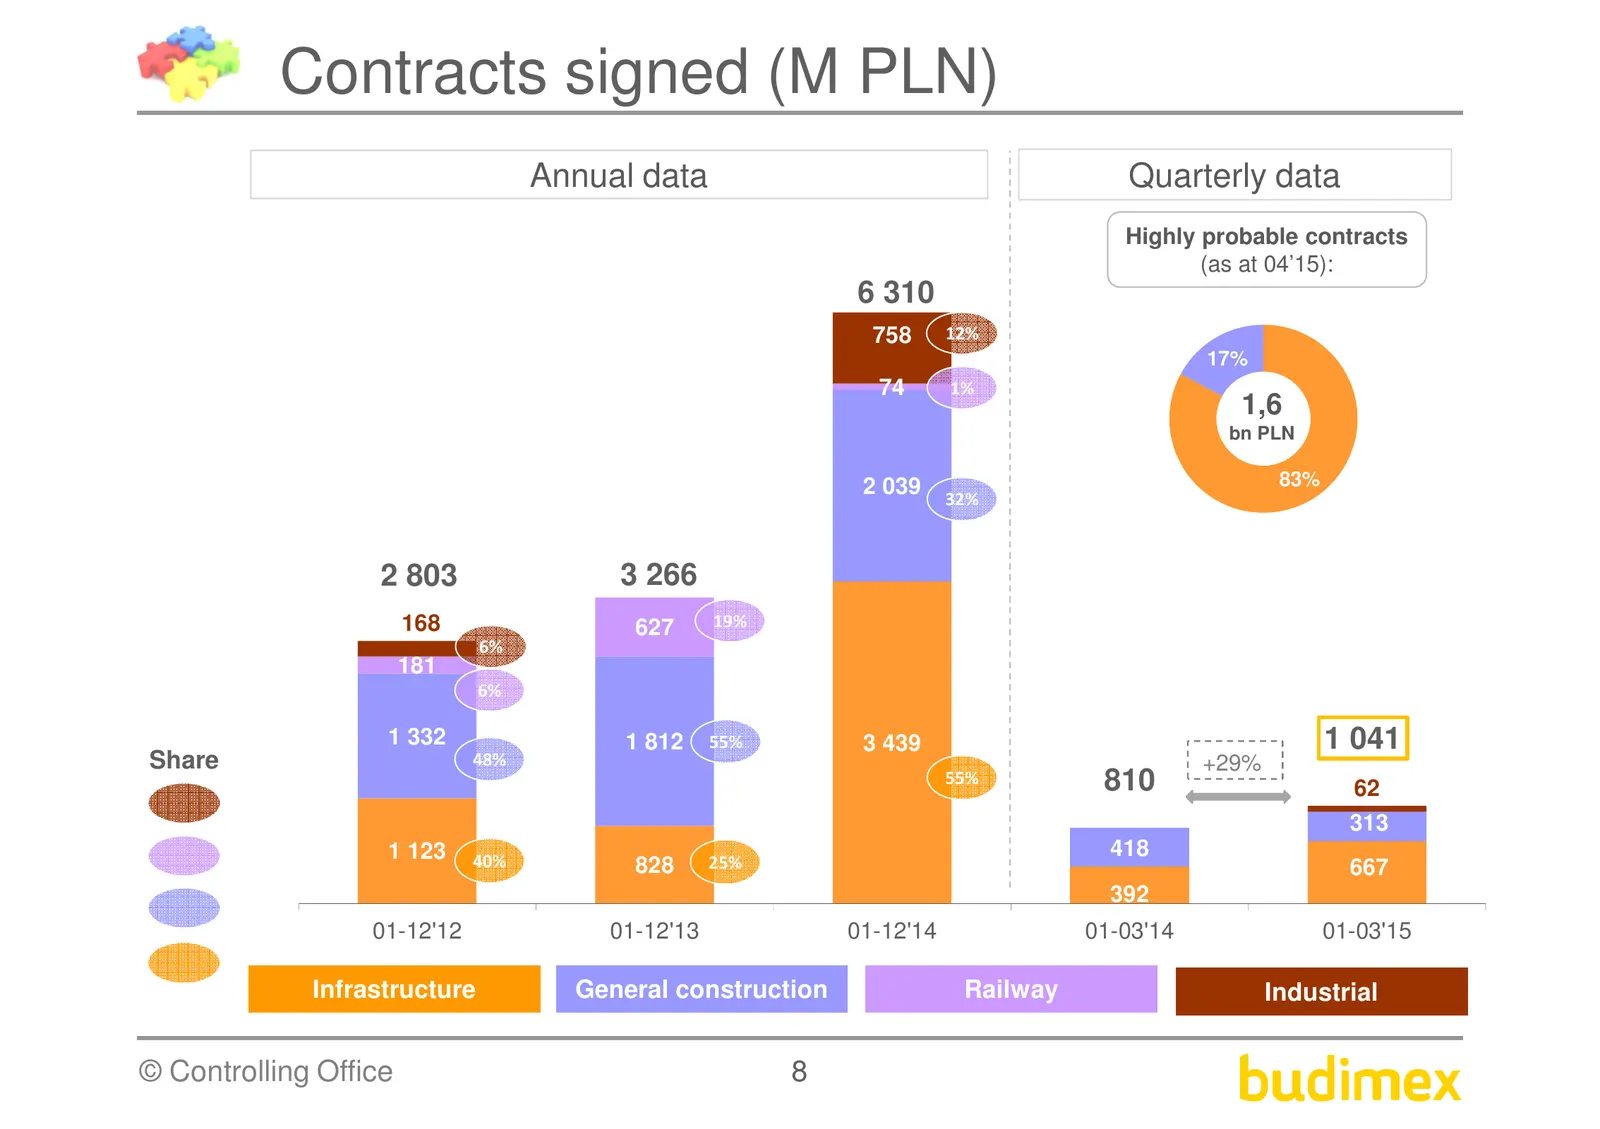
Slide 8: Contracts signed (M PLN)
Contracts signed (M PLN) Annual data Quarterly data Highly probable contracts (as at 04’15): 6 310 758 12% 17% 74 1% 1,6 bn PLN 2 039 83% 32% 2 803 3 266 168 627 19% 6% 181 6% 1 332 1 812 55% 3 439 1 041 Share 48% +29% 55% 810 62 313 1 123 40% 418 828 25% 667 392 01-12'12 01-12'13 01-12'14 01-03'14
Slide 9: Backlog (M PLN)
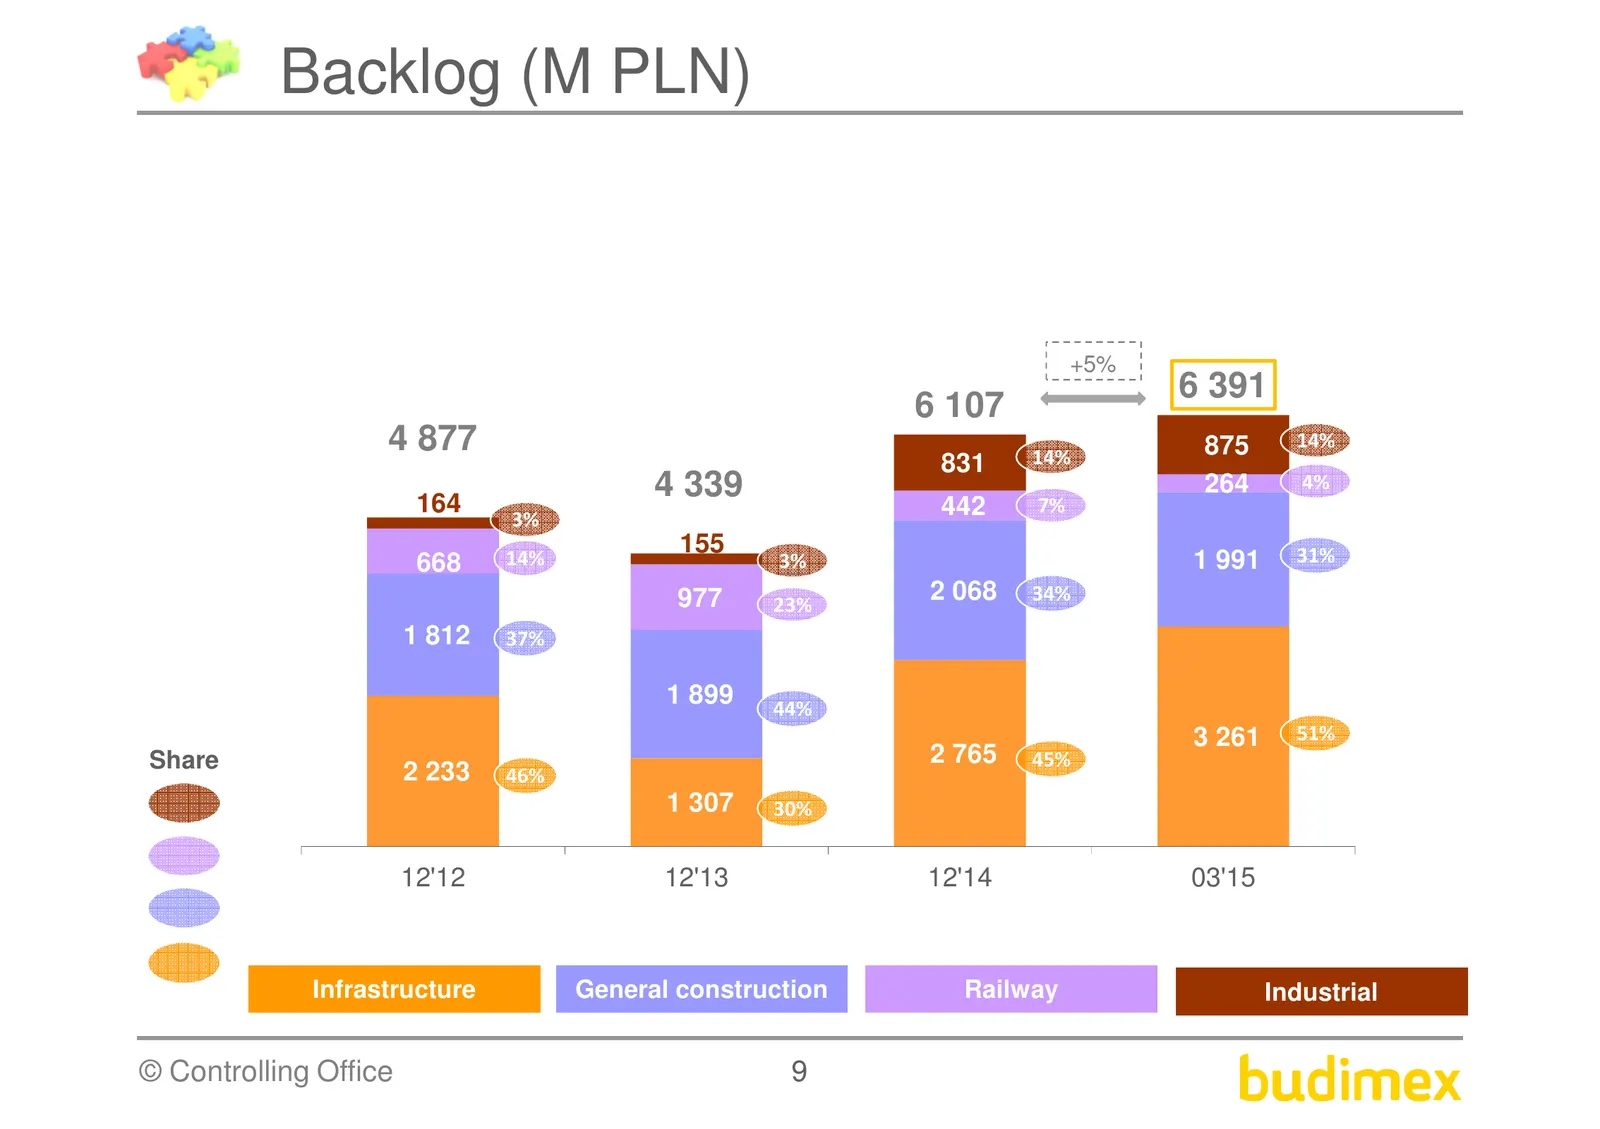
Backlog (M PLN) +5% 6 391 6 107 4 877 14% 875 14% 831 164 4 339 264 4% 3% 442 7% 155 31% 668 14% 3% 1 991 977 23% 2 068 34% 1 812 37% 1 899 44% 3 261 51% Share 2 765 45% 2 233 46% 1 307 30% 12'12 12'13 12'14 03'15 Infrastructure General construction Railway Industrial © Controlling Office 9
Slide 10: Developer segment in 1Q'15
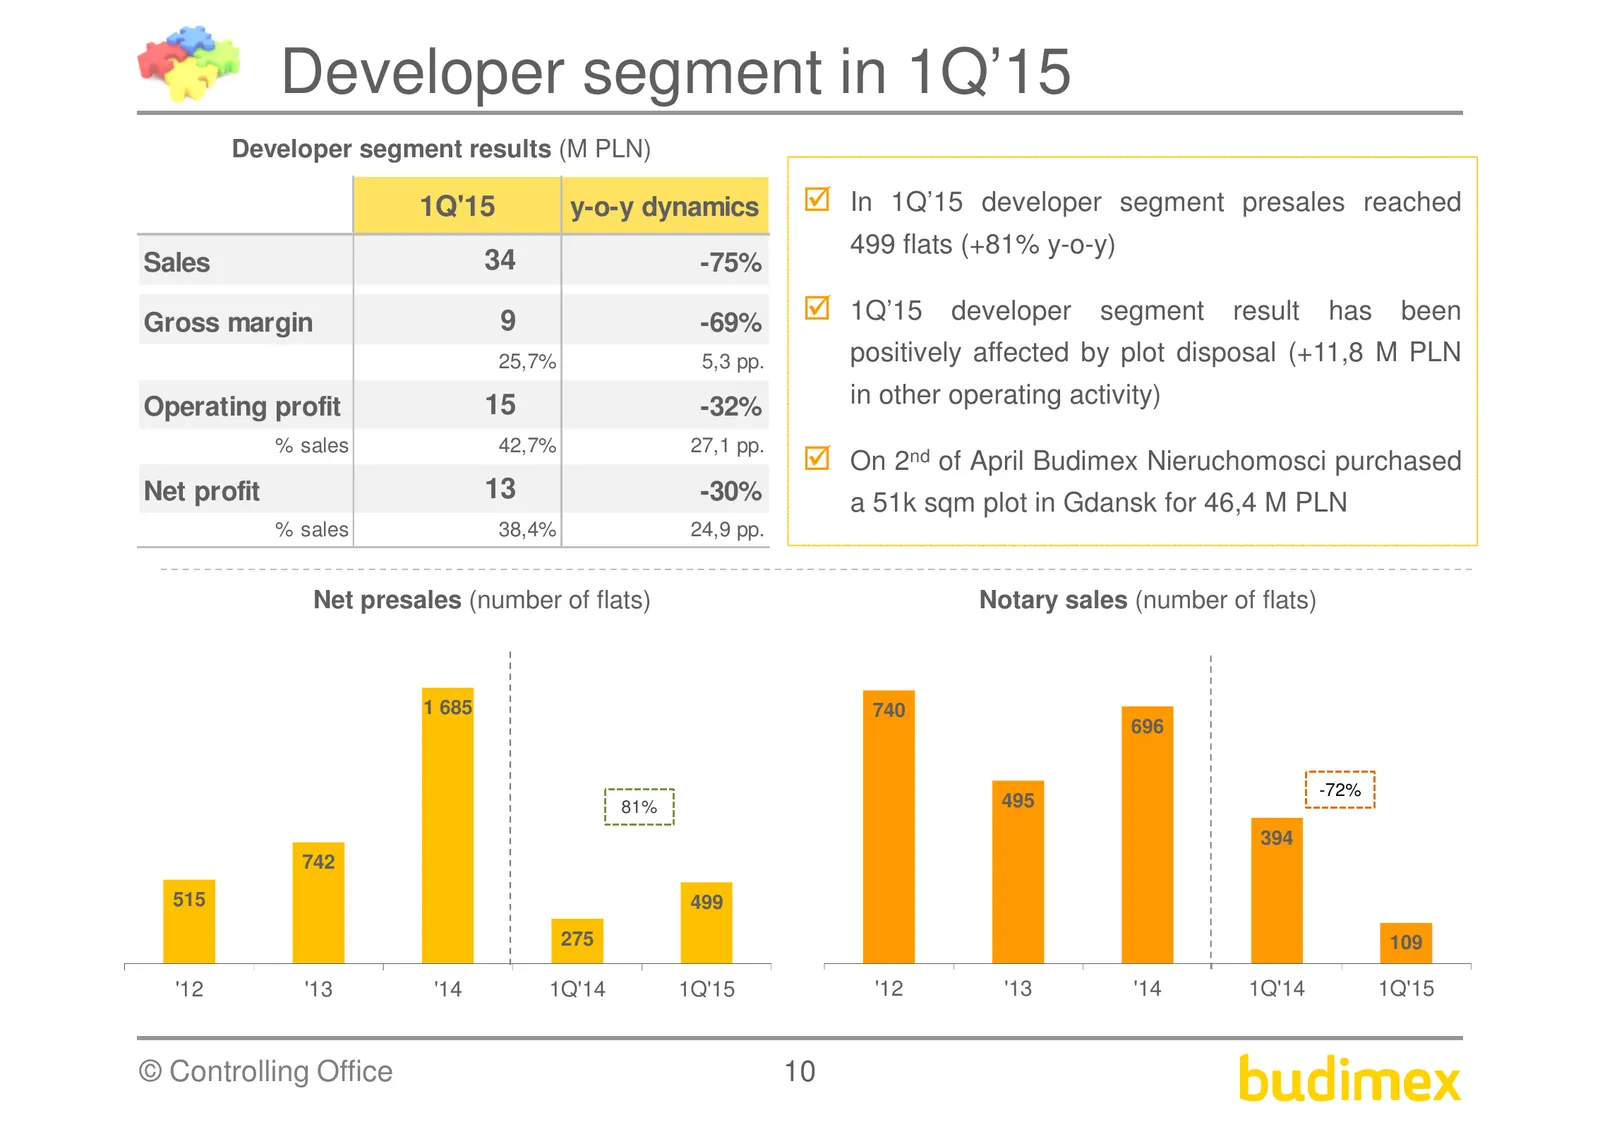
Developer segment in 1Q’15 Developer segment results (M PLN) 1Q'15 y-o-y dynamics In 1Q’15 developer segment presales reached 499 flats (+81% y-o-y) Sales 34 -75% Gross margin 9 -69% 1Q’15 developer segment result has been 25,7% 5,3 pp. positively affected by plot disposal (+11,8 M PLN Operating pro
Slide 11: Budimex Nieruchomosci offer
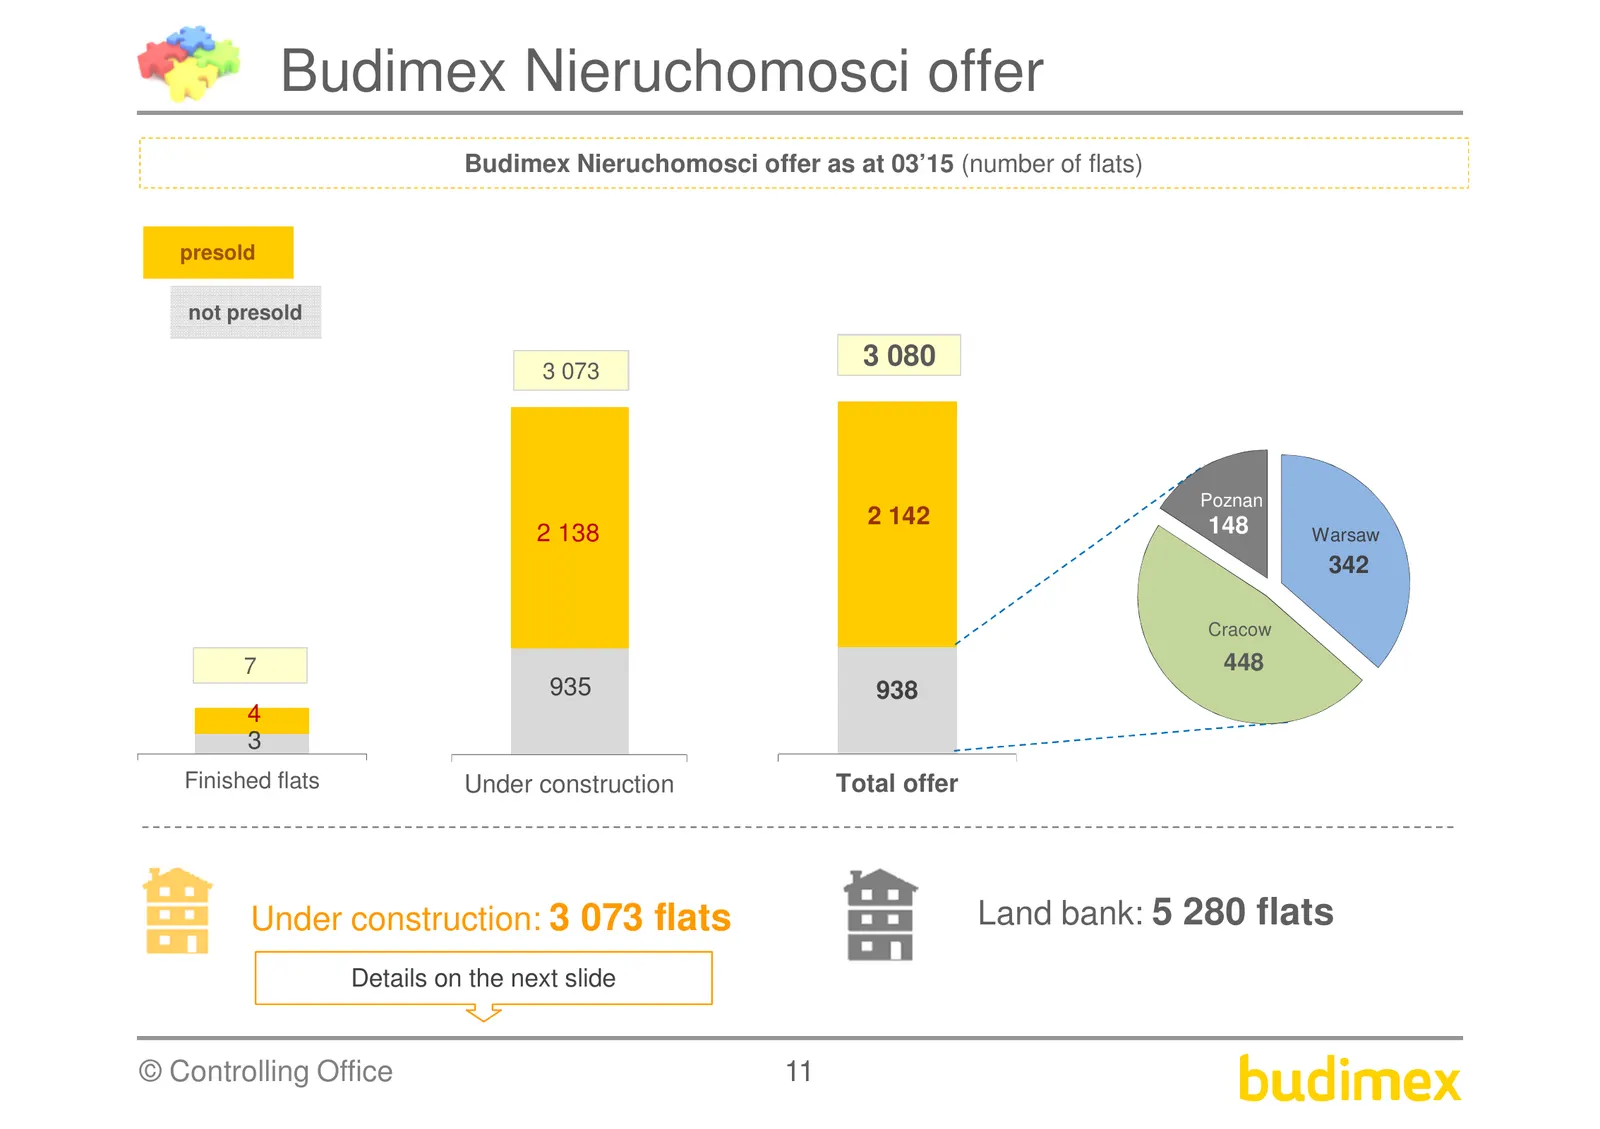
Budimex Nieruchomosci offer Budimex Nieruchomosci offer as at 03’15 (number of flats) presold not presold 3 073 3 080 Poznan 2 142 148 2 138 Warsaw 342 Cracow 7 448 935 938 4 3 Finished flats Under construction Total offer Under construction: 3 073 flats Land bank: 5 280 flats Details on the next sl
Slide 12: Projects under construction (details)
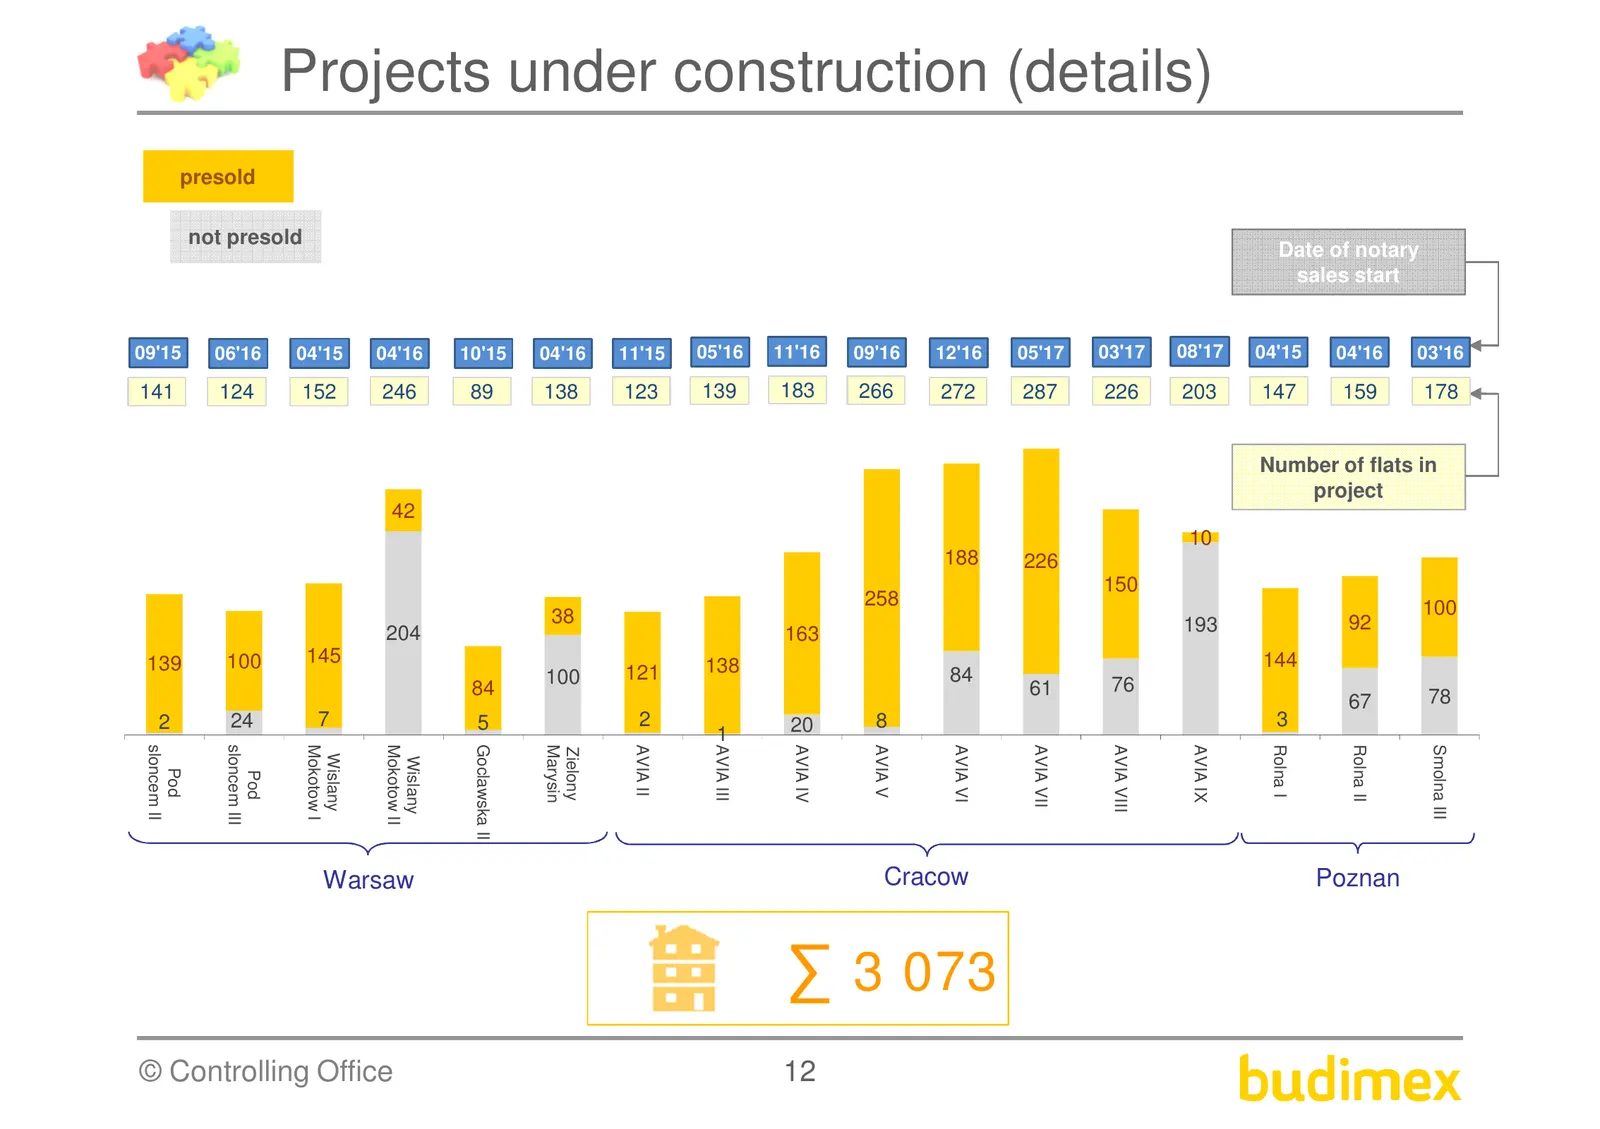
Projects under construction (details) presold not presold Date of notary sales start 09'15 06'16 04'15 04'16 10'15 04'16 11'15 05'16 11'16 09'16 12'16 05'17 03'17 08'17 04'15 04'16 03'16 141 124 152 246 89 138 123 139 183 266 272 287 226 203 147 159 178 Number of flats in project 42 10 188 226 150 2
Slide 13: Other activities in 1Q'15
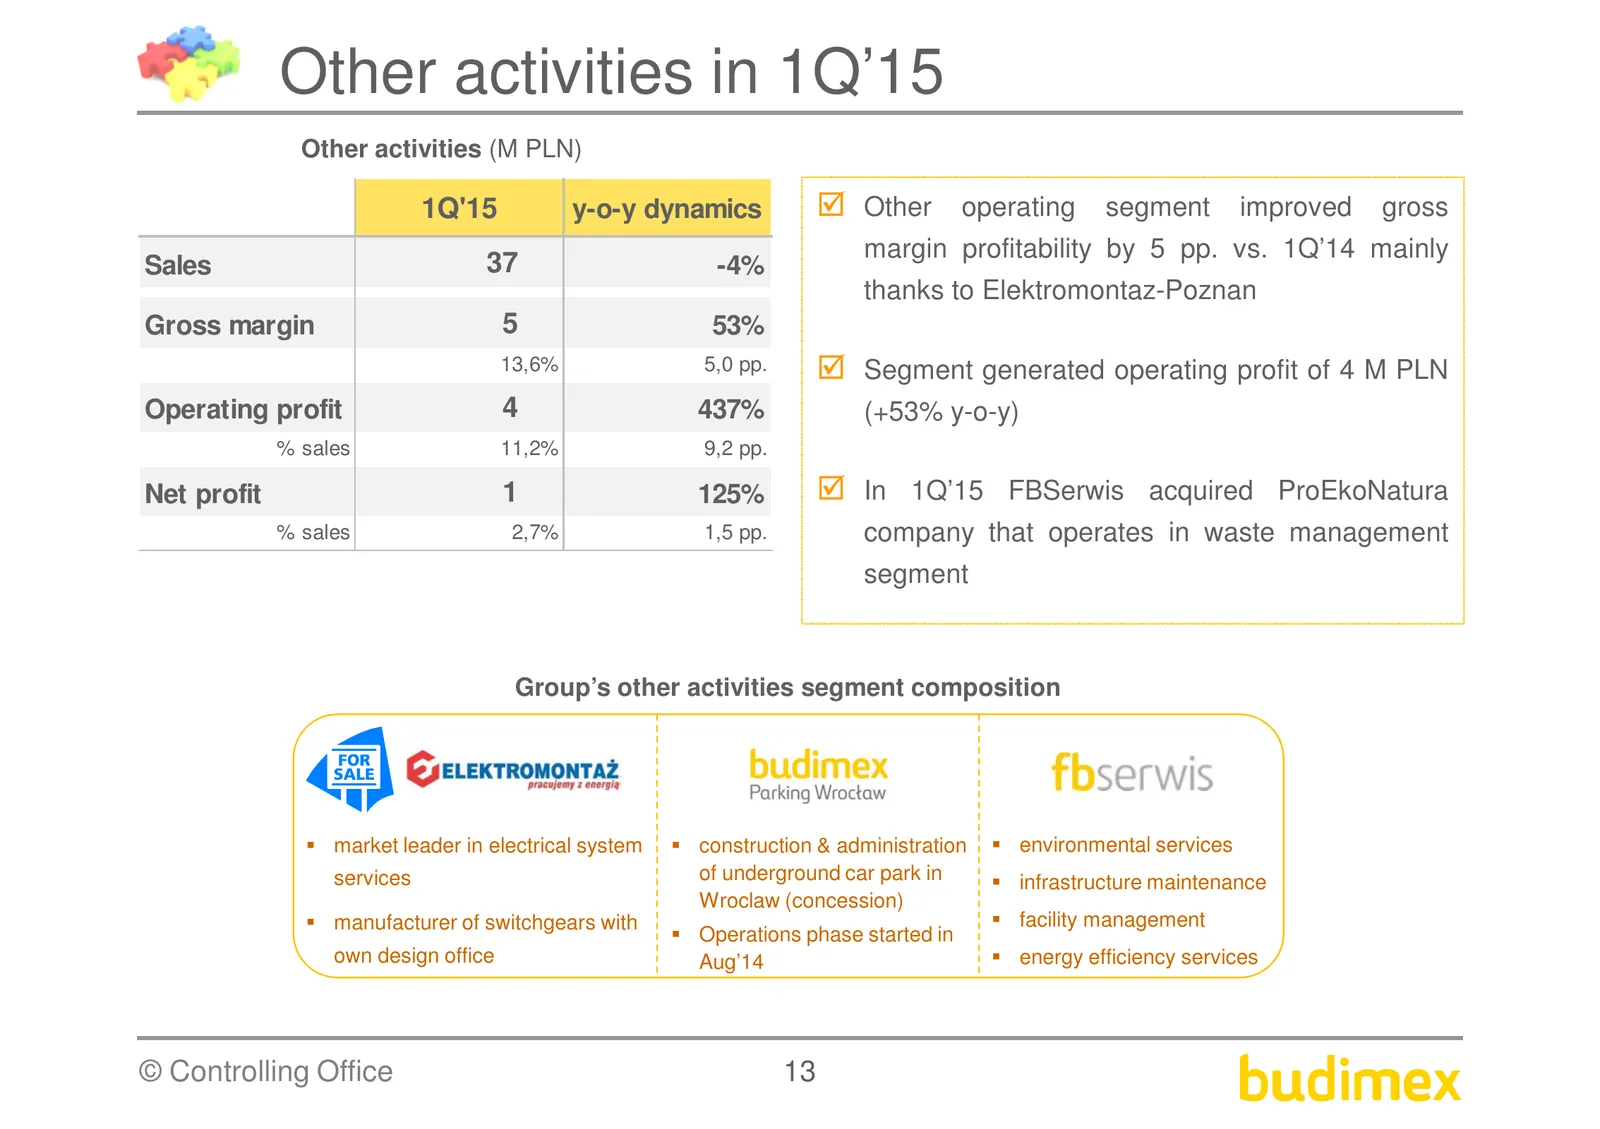
Other activities in 1Q’15 Other activities (M PLN) 1Q'15 y-o-y dynamics Other operating segment improved gross margin profitability by 5 pp. vs. 1Q’14 mainly Sales 37 -4% thanks to Elektromontaz-Poznan Gross margin 5 53% 13,6% 5,0 pp. Segment generated operating profit of 4 M PLN Operating profit 4
Slide 14: Construction companies market value
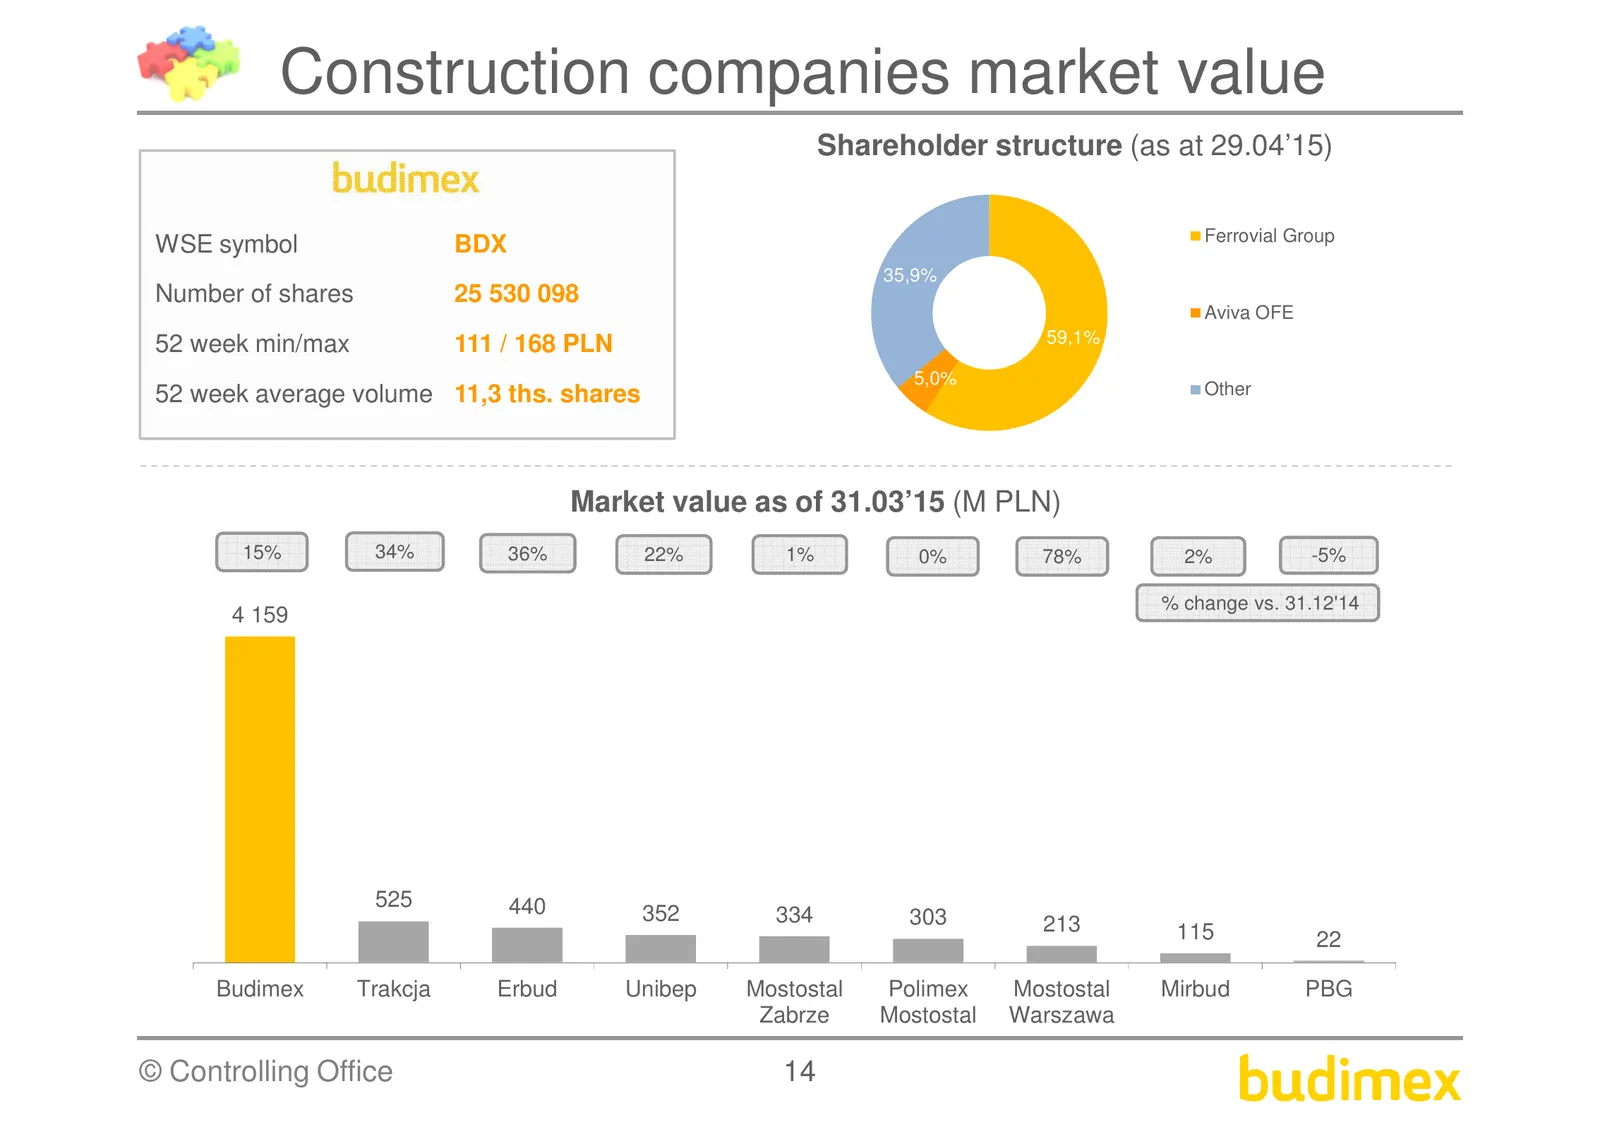
Construction companies market value Shareholder structure (as at 29.04’15) Ferrovial Group WSE symbol BDX 35,9% Number of shares 25 530 098 Aviva OFE 52 week min/max 111 / 168 PLN 59,1% 5,0% 52 week average volume 11,3 ths. shares Other Market value as of 31.03’15 (M PLN) 15% 34% 36% 22% 1% 0% 78% 2
Slide 15: Budimex SA contact details
Budimex SA Stawki 40, 01-040 Warszawa www.budimex.com.pl e-mail: relacje.inwestorskie@budimex.pl
Source: Internet Archive copy of budimex.pl
More decks from Budimex SA
 H1 2026 Earnings Presentation36 slides · Jul 1, 2026
 H1 2026 Earnings Presentation36 slides · Jul 1, 2026
 Investor Presentation (March 2026)47 slides · March 2026
 Q3 2025 Earnings Presentation44 slides · October 2025
 Investor Presentation (July 2025)37 slides · July 2025
 Q1 2025 Earnings Presentation29 slides · May 2025