MidWestOne Financial Group Inc
MidWestOne Financial — Investor Presentation (January 2024)
36 slides from MidWestOne Financial's investor presentation, Jan 30, 2024
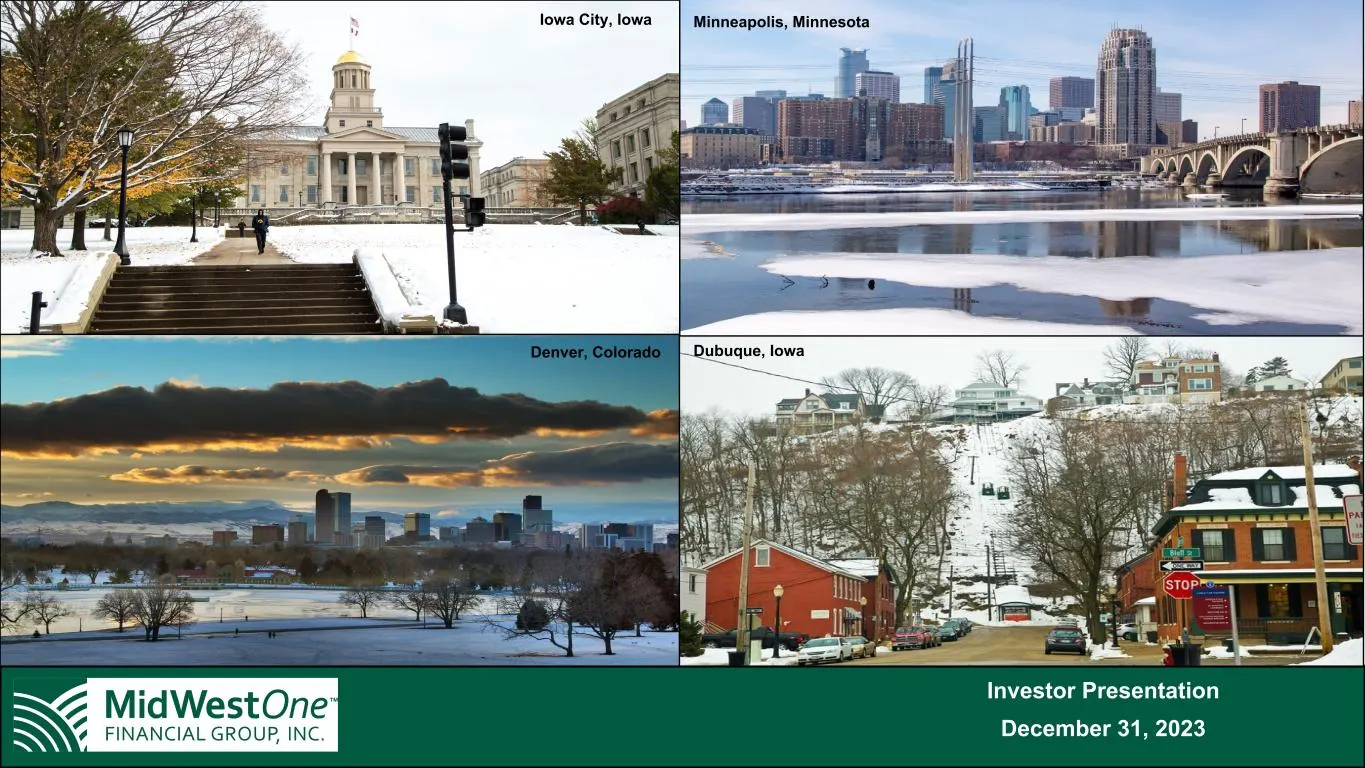
Slide 1: Investor Presentation December 31, 2023
Investor Presentation December 31, 2023 Iowa City, Iowa Denver, Colorado Naples, Florida Minneapolis, Minnesota Iowa City, Iowa Minneapolis, Minnesota Denver, Colorado Dubuque, Iowa
Slide 2: Forward Looking Statements & Non-GAAP Measures
2 Forward Looking Statements & Non-GAAP Measures Cautionary Note Regarding Forward-Looking Statements This presentation contains certain “forward-looking statements” within the meaning of such term in the Private Securities Litigation Reform Act of 1995. We and our representatives may, from time to
Slide 3: Overview of MidWestOne
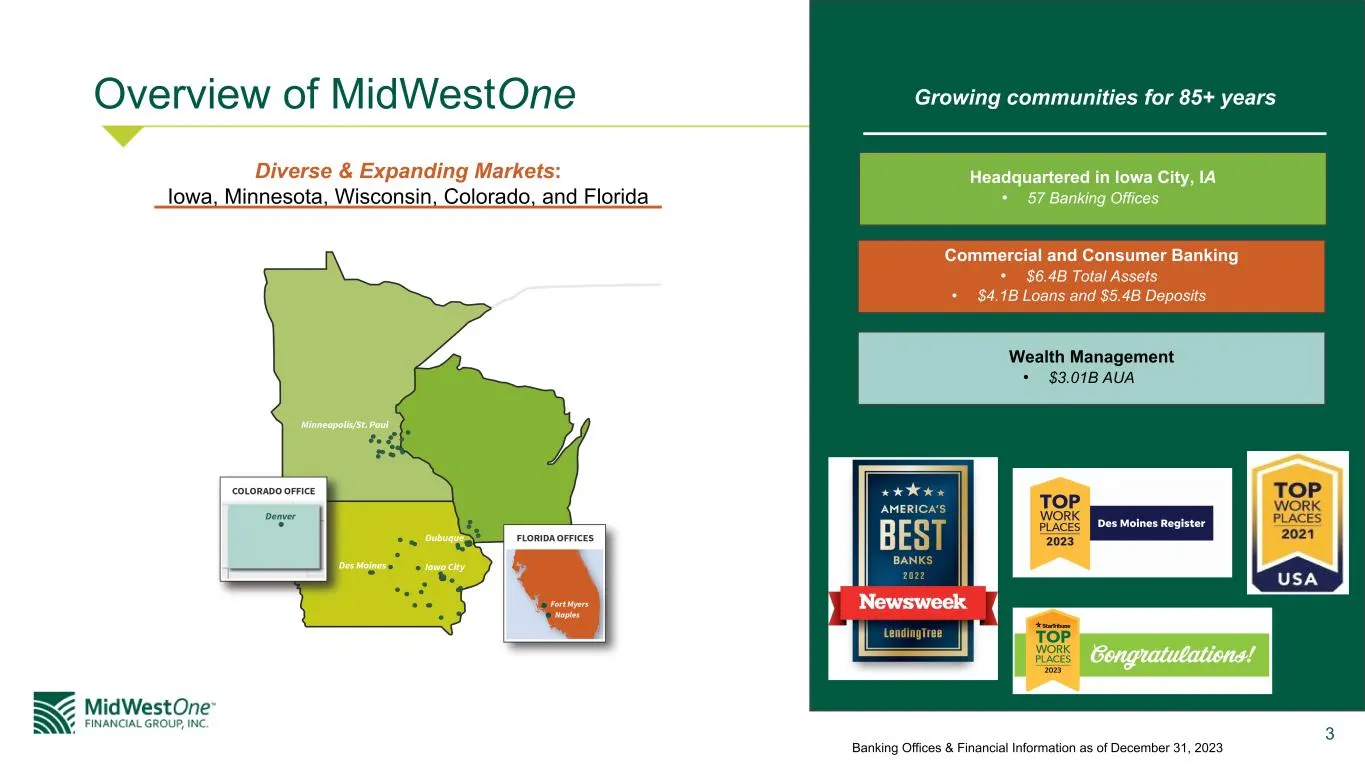
3 Overview of MidWestOne Diverse & Expanding Markets: Iowa, Minnesota, Wisconsin, Colorado, and Florida Growing communities for 85+ years Headquartered in Iowa City, IA • 57 Banking Offices Commercial and Consumer Banking • $6.4B Total Assets • $4.1B Loans and $5.4B Deposits Wealth Management • $3.0
Slide 4: Our History and Growth Profile
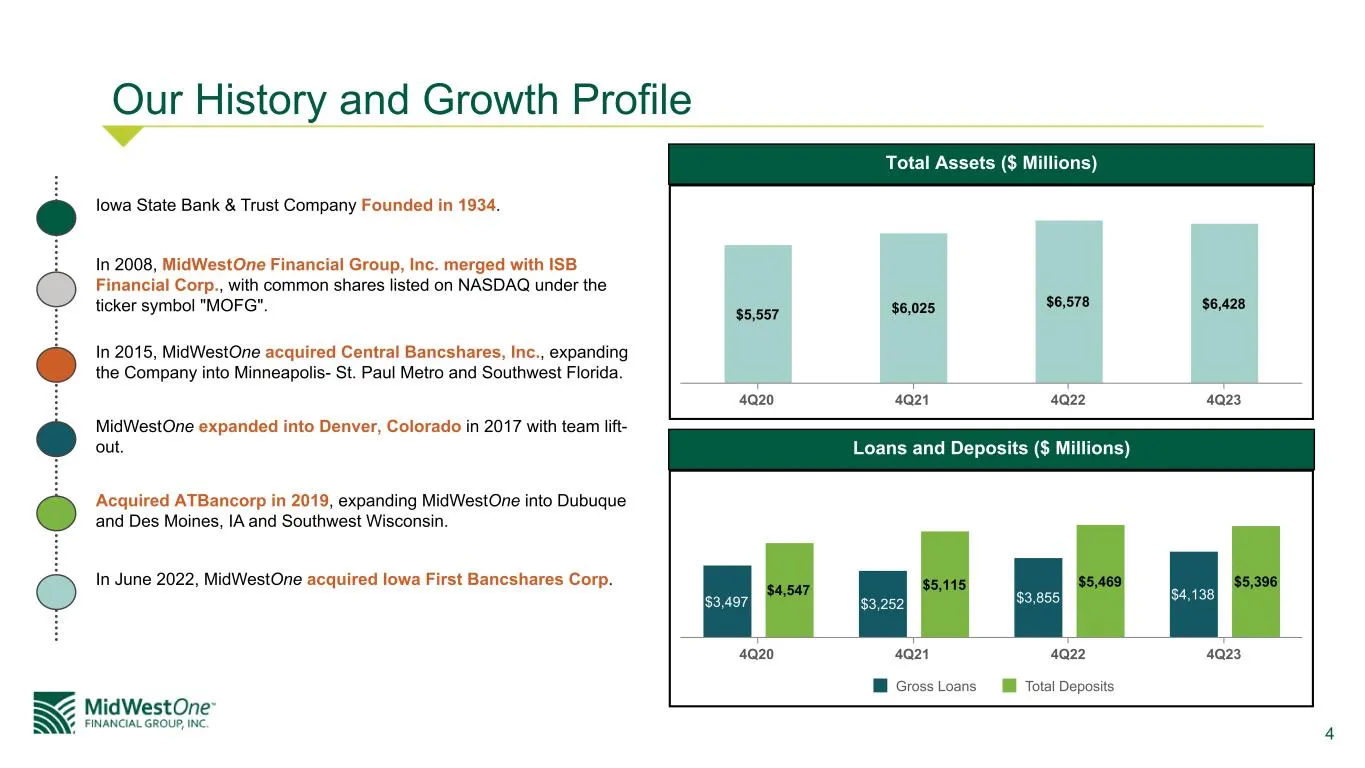
4 Our History and Growth Profile Total Assets ($ Millions) $5,557 $6,025 $6,578 $6,428 4Q20 4Q21 4Q22 4Q23 Loans and Deposits ($ Millions) $3,497 $3,252 $3,855 $4,138$4,547 $5,115 $5,469 $5,396 Gross Loans Total Deposits 4Q20 4Q21 4Q22 4Q23 Iowa State Bank & Trust Company Founded in 1934. In 2008, M
Slide 5: MOFG's Attractive and Growing Core Markets
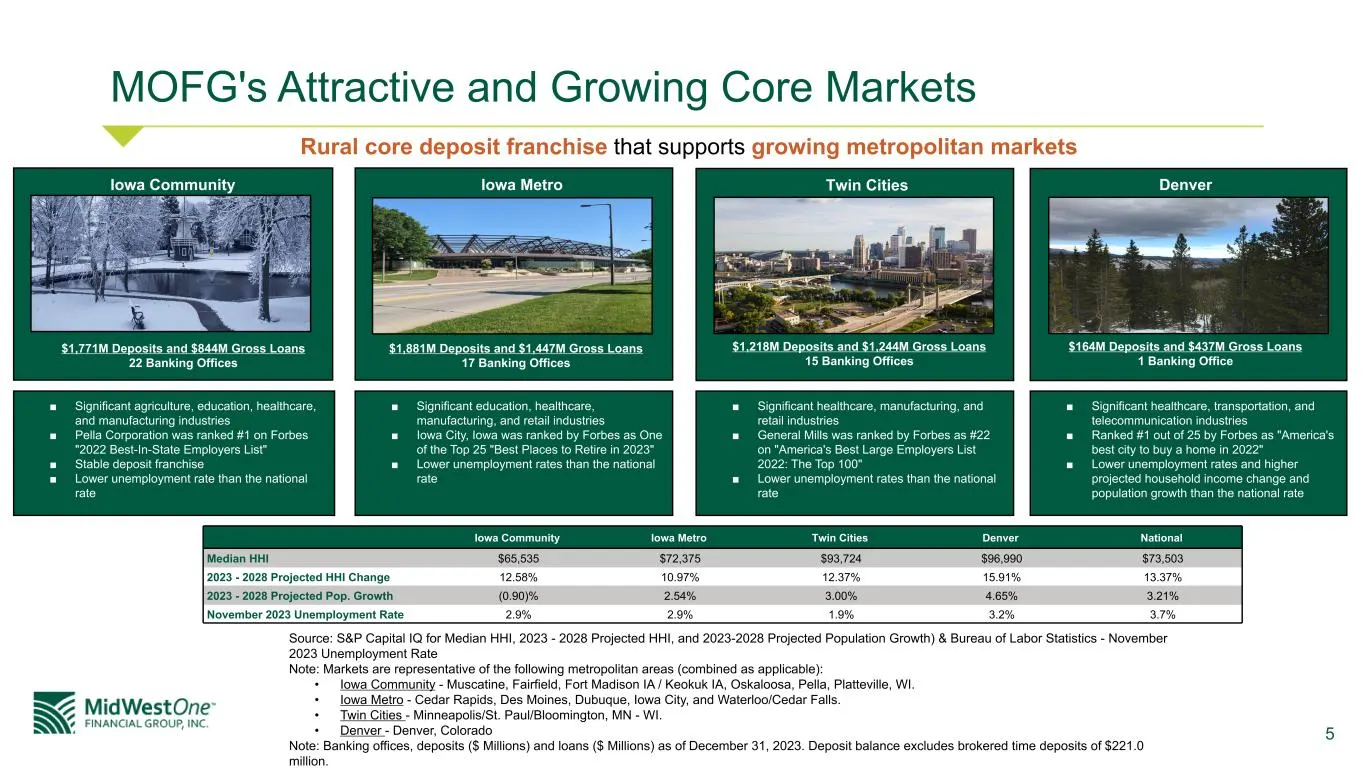
5 MOFG's Attractive and Growing Core Markets Iowa Community Iowa Metro Twin Cities Denver National Median HHI $65,535 $72,375 $93,724 $96,990 $73,503 2023 - 2028 Projected HHI Change 12.58% 10.97% 12.37% 15.91% 13.37% 2023 - 2028 Projected Pop. Growth (0.90)% 2.54% 3.00% 4.65% 3.21% November 2023 Un
Slide 6: Our Vision
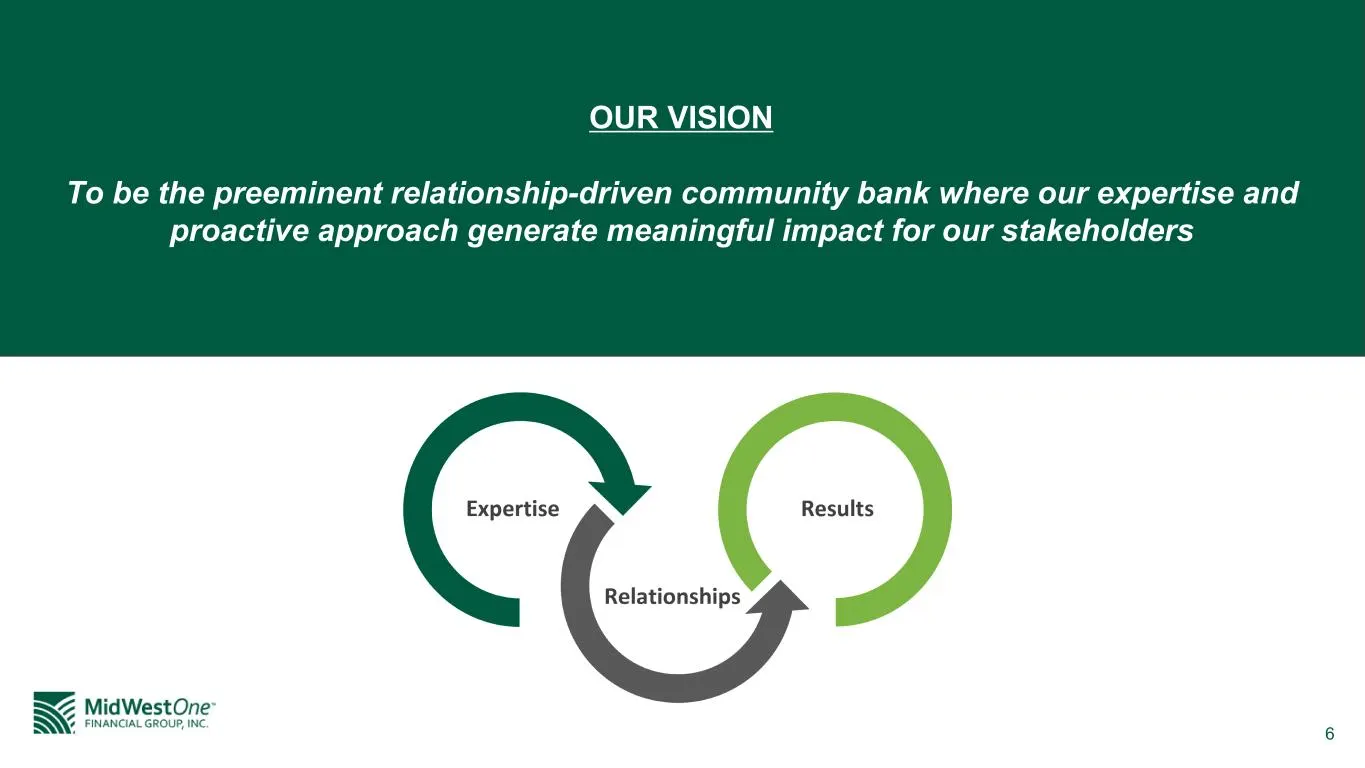
6 OUR VISION To be the preeminent relationship-driven community bank where our expertise and proactive approach generate meaningful impact for our stakeholders
Slide 7: Shareholder Value Strategy
7 Shareholder Value Strategy
Slide 8: Executive Management Driving Change
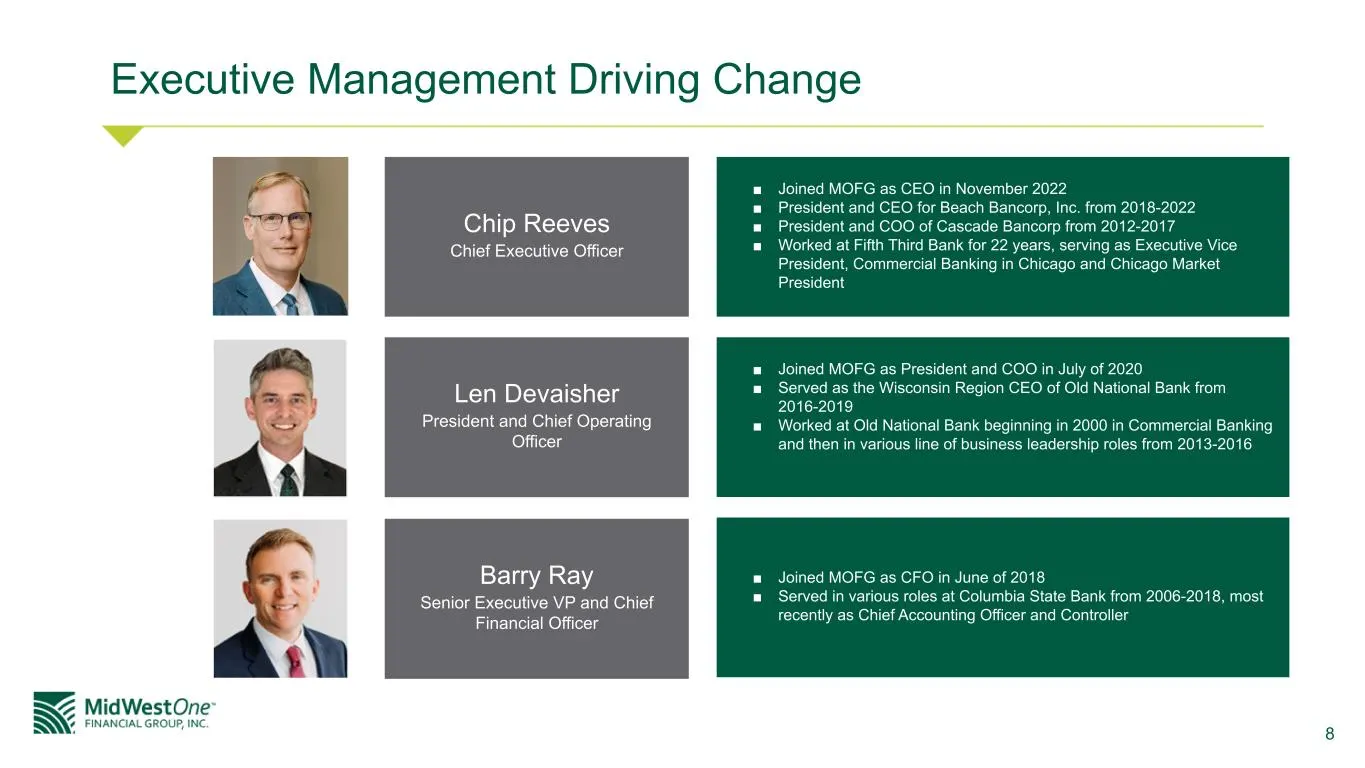
8 Executive Management Driving Change Chip Reeves Chief Executive Officer Len Devaisher President and Chief Operating Officer Barry Ray Senior Executive VP and Chief Financial Officer ■ Joined MOFG as CEO in November 2022 ■ President and CEO for Beach Bancorp, Inc. from 2018-2022 ■ President and COO
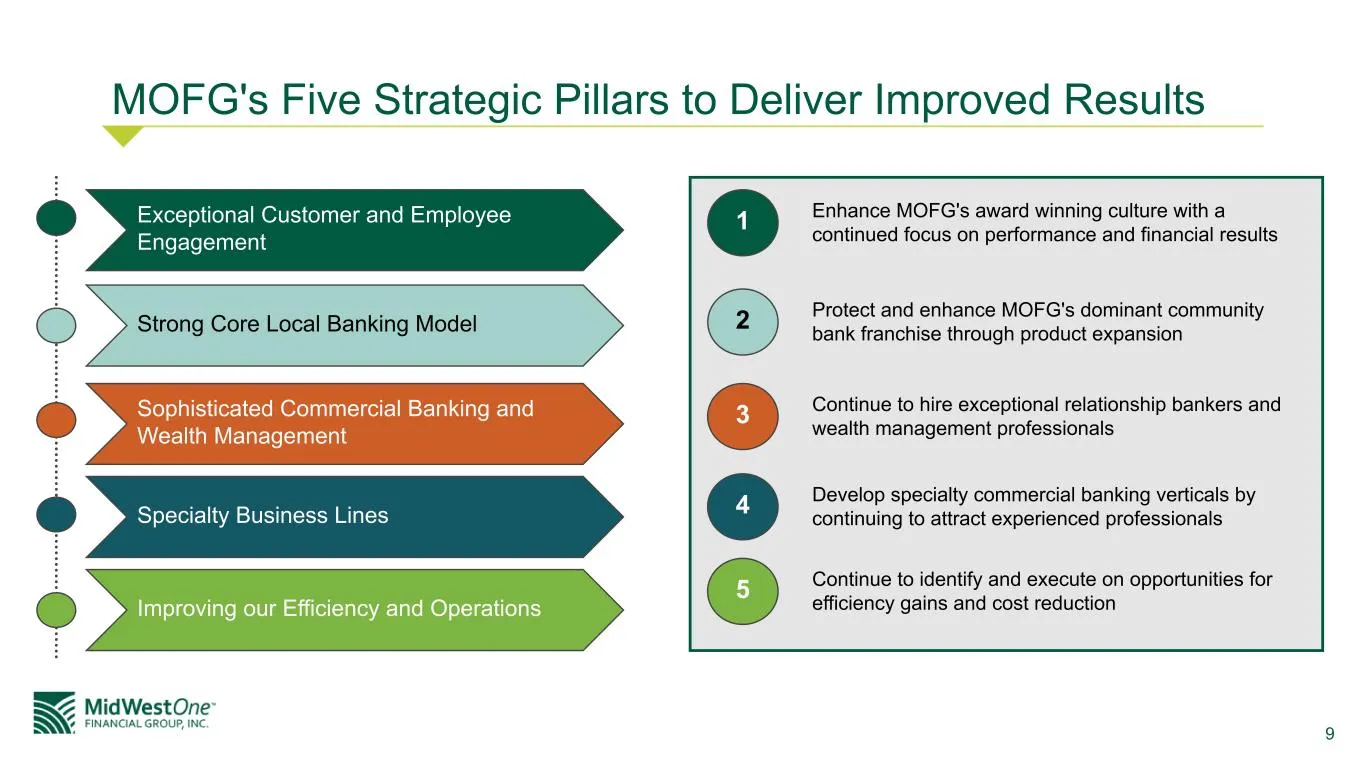
Slide 9: MOFG's Five Strategic Pillars to Deliver Improved Results
9 MOFG's Five Strategic Pillars to Deliver Improved Results Exceptional Customer and Employee Engagement 1 Enhance MOFG's award winning culture with a continued focus on performance and financial results 2 Protect and enhance MOFG's dominant community bank franchise through product expansion 3 Conti
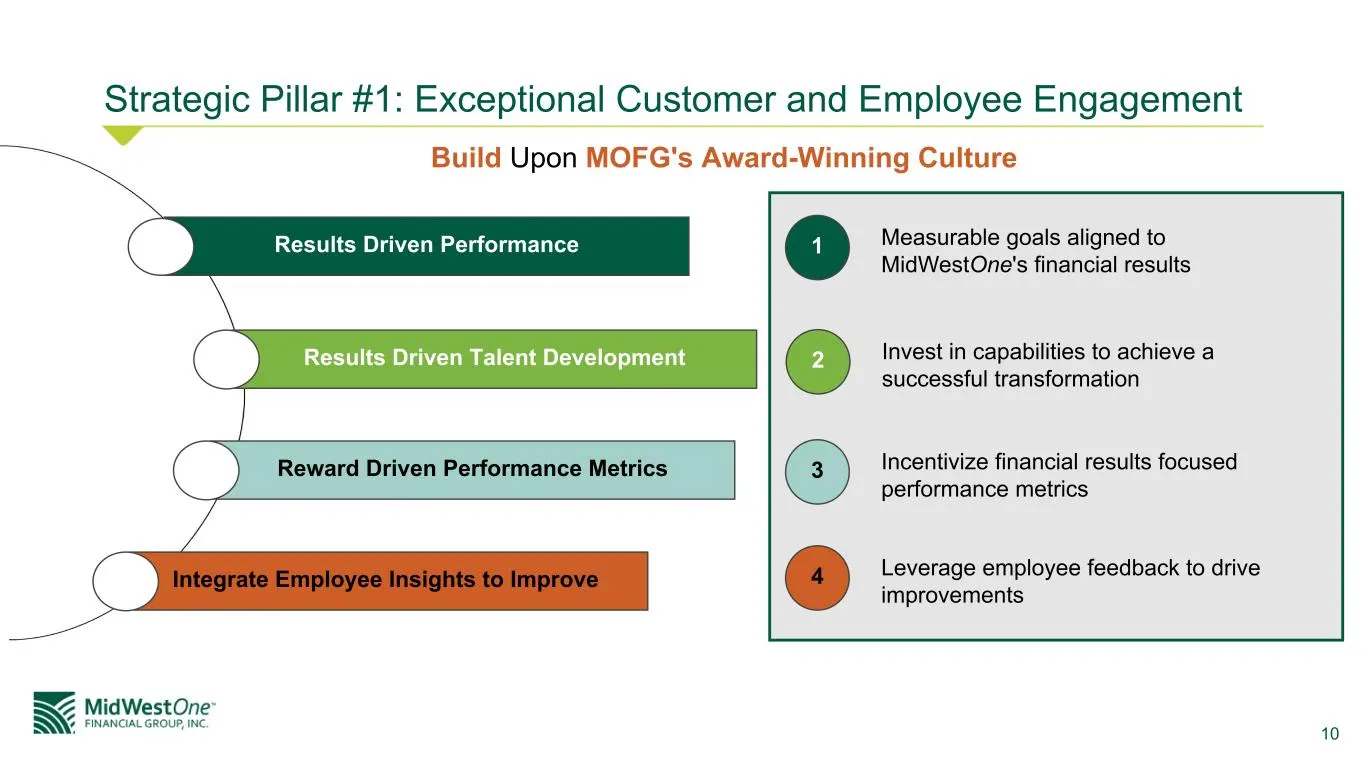
Slide 10: Strategic Pillar #1: Exceptional Customer and Employee Engagement
10 Strategic Pillar #1: Exceptional Customer and Employee Engagement Build Upon MOFG's Award-Winning Culture 1 Measurable goals aligned to MidWestOne's financial results 2 Invest in capabilities to achieve a successful transformation 3 Incentivize financial results focused performance metrics 4 Leve
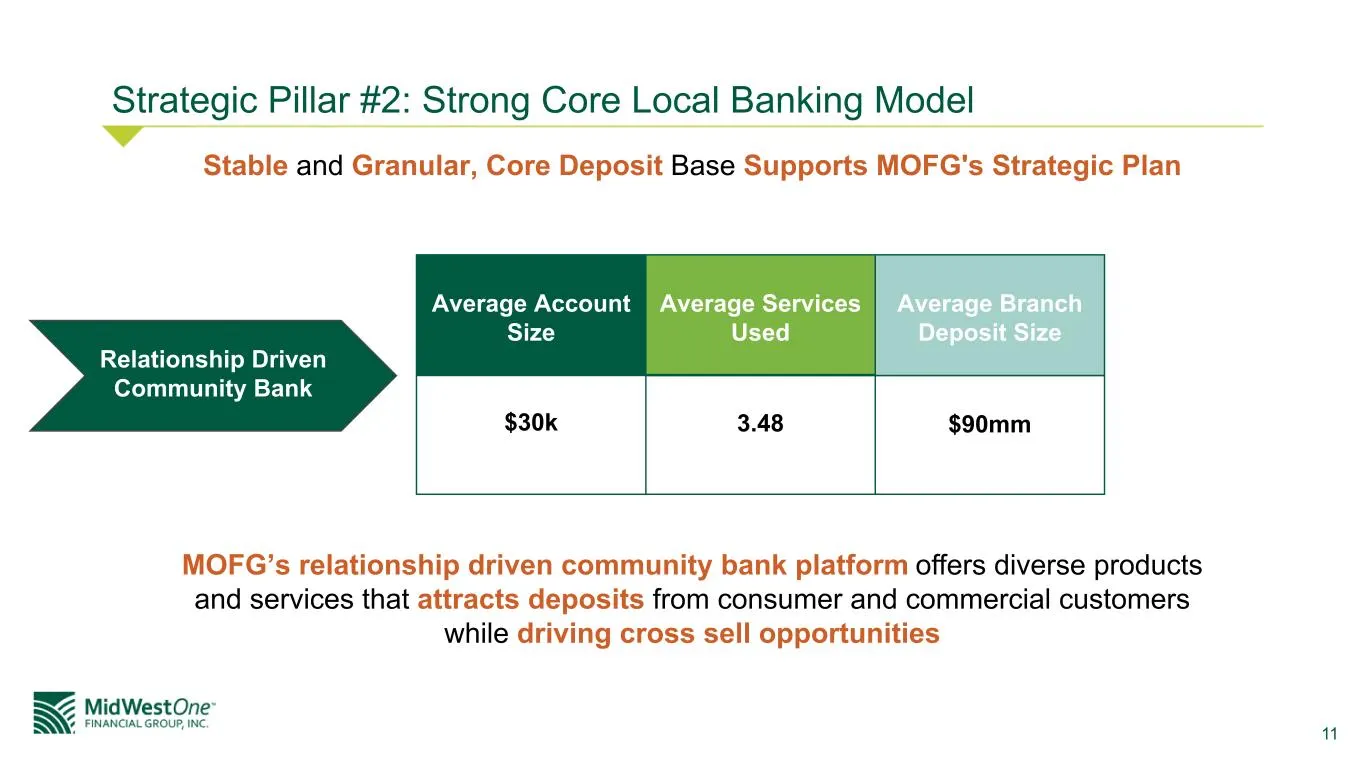
Slide 11: Strategic Pillar #2: Strong Core Local Banking Model
11 Strategic Pillar #2: Strong Core Local Banking Model Stable and Granular, Core Deposit Base Supports MOFG's Strategic Plan MOFG’s relationship driven community bank platform offers diverse products and services that attracts deposits from consumer and commercial customers while driving cross sell
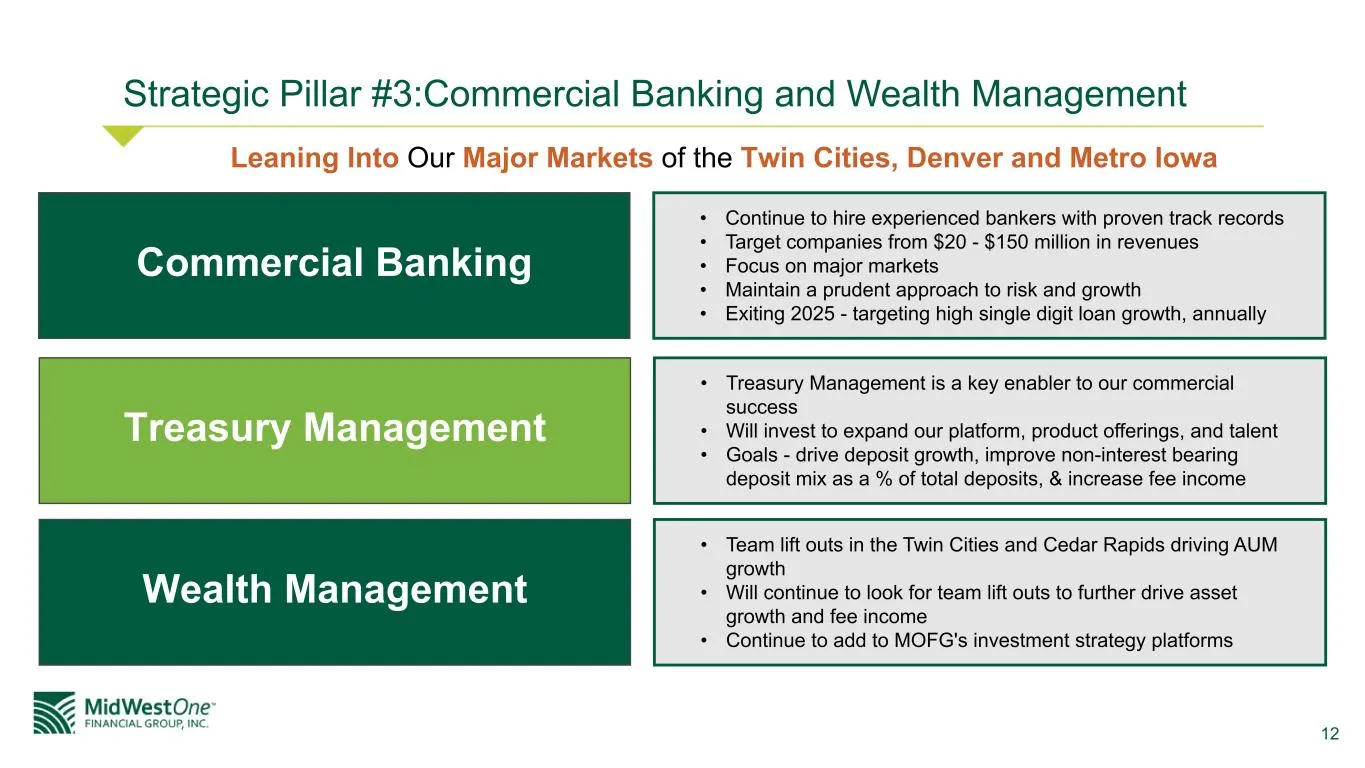
Slide 12: Strategic Pillar #3: Commercial Banking and Wealth Management
12 Strategic Pillar #3:Commercial Banking and Wealth Management Leaning Into Our Major Markets of the Twin Cities, Denver and Metro Iowa • Continue to hire experienced bankers with proven track records • Target companies from $20 - $150 million in revenues • Focus on major markets • Maintain a prude
Slide 13: Commercial Loan Portfolio
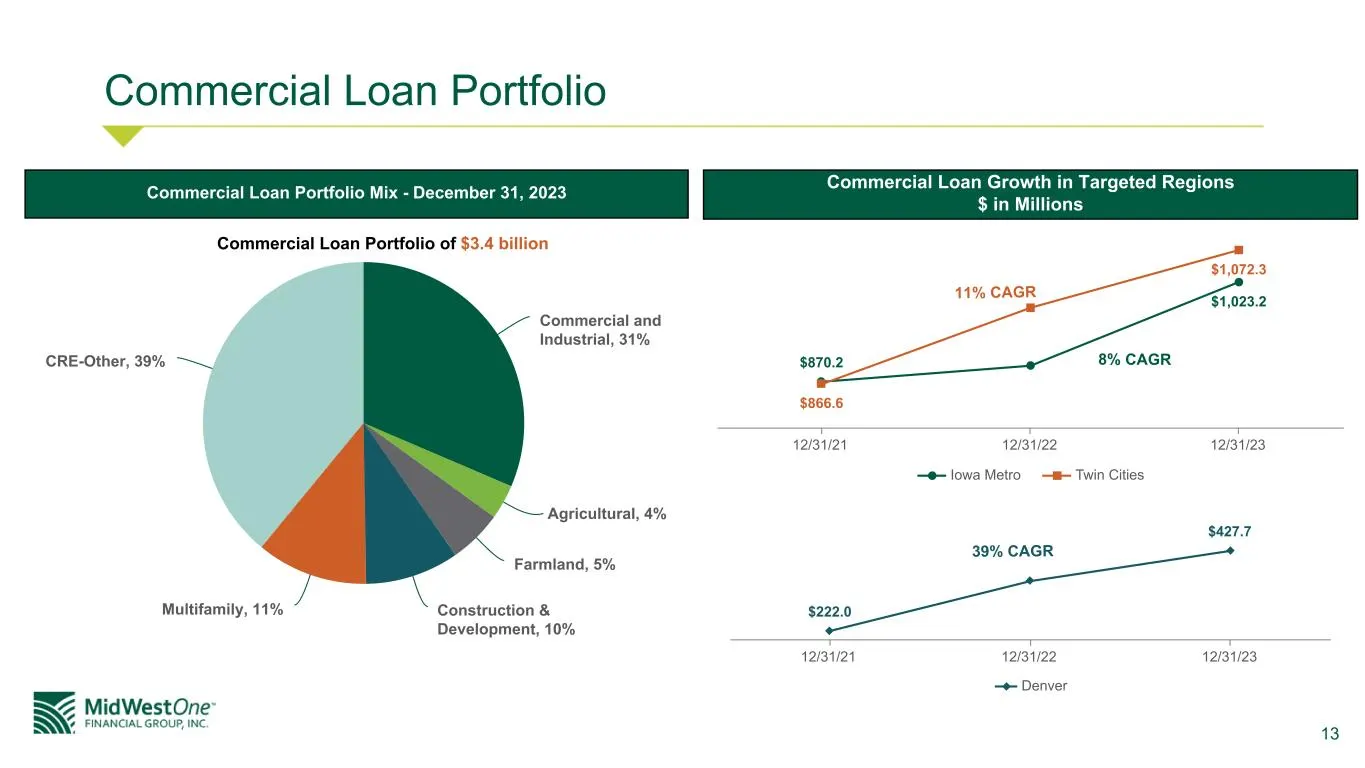
13 Commercial Loan Portfolio Commercial and Industrial, 31% Agricultural, 4% Farmland, 5% Construction & Development, 10% Multifamily, 11% CRE-Other, 39% Commercial Loan Portfolio Mix - December 31, 2023 Commercial Loan Portfolio of $3.4 billion Commercial Loan Growth in Targeted Regions $ in Millio
Slide 14: Focusing on Growth in Wealth Management
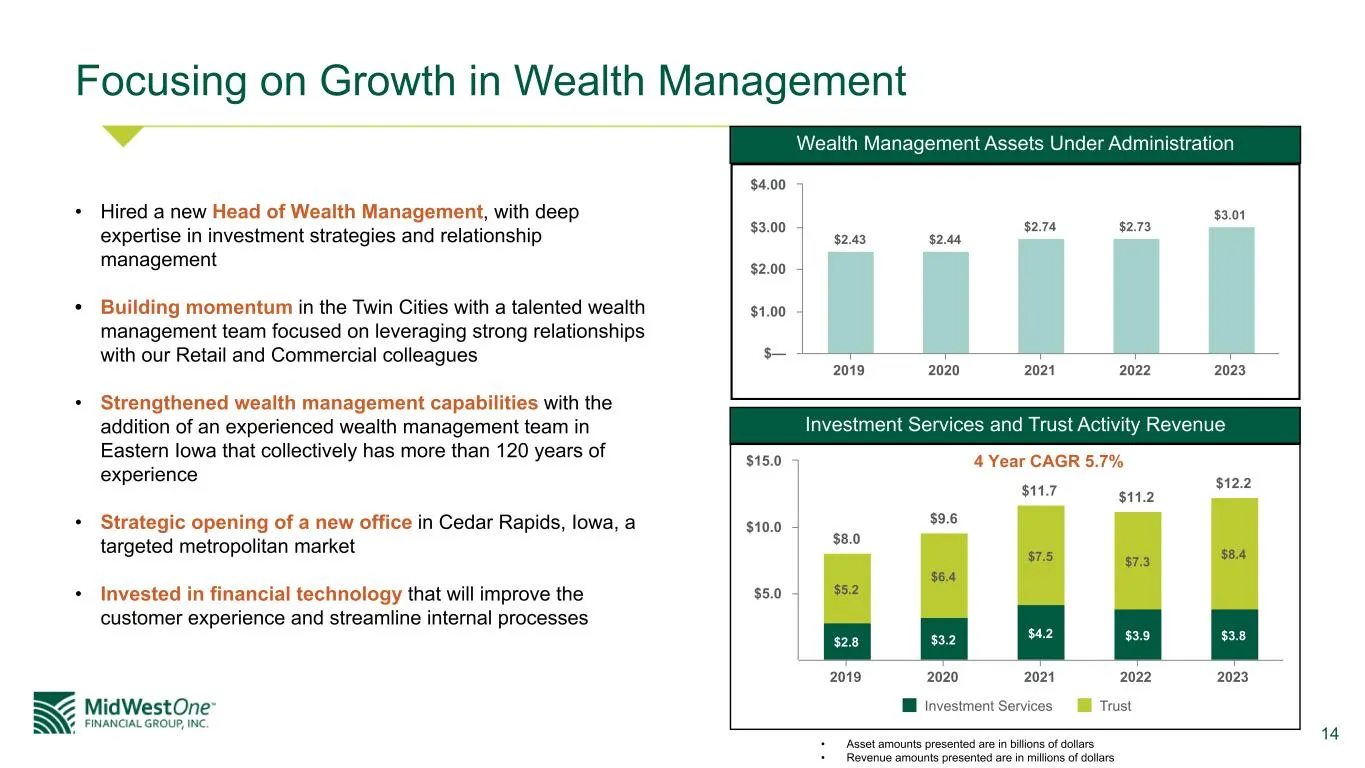
14 Focusing on Growth in Wealth Management $2.43 $2.44 $2.74 $2.73 $3.01 2019 2020 2021 2022 2023 $— $1.00 $2.00 $3.00 $4.00 Investment Services and Trust Activity Revenue • Asset amounts presented are in billions of dollars • Revenue amounts presented are in millions of dollars $8.0 $9.6 $11.7 $11.
Slide 15: Strategic Pillar #4: Specialty Business Lines
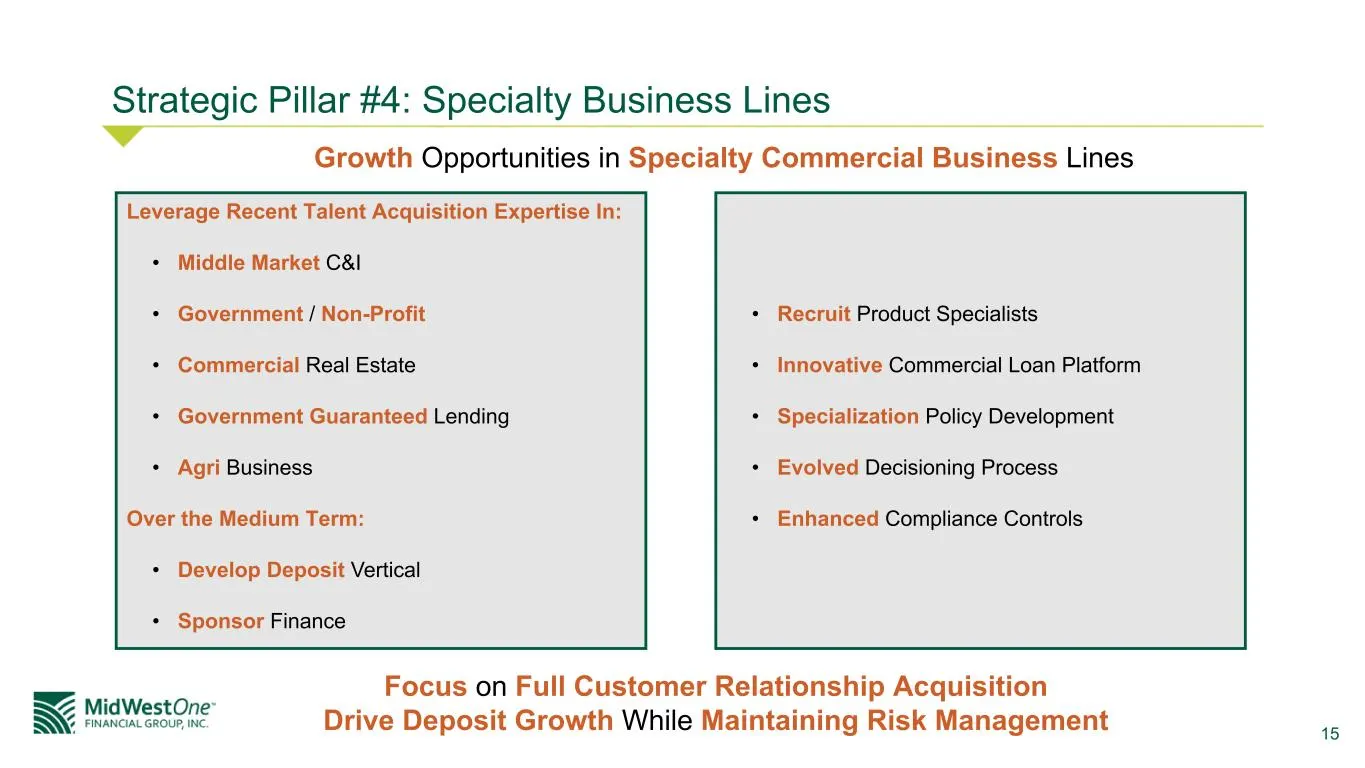
15 Strategic Pillar #4: Specialty Business Lines Growth Opportunities in Specialty Commercial Business Lines Leverage Recent Talent Acquisition Expertise In: • Middle Market C&I • Government / Non-Profit • Commercial Real Estate • Government Guaranteed Lending • Agri Business Over the Medium Term: •
Slide 16: Strategic Pillar #5: Improving Our Efficiency and Operations
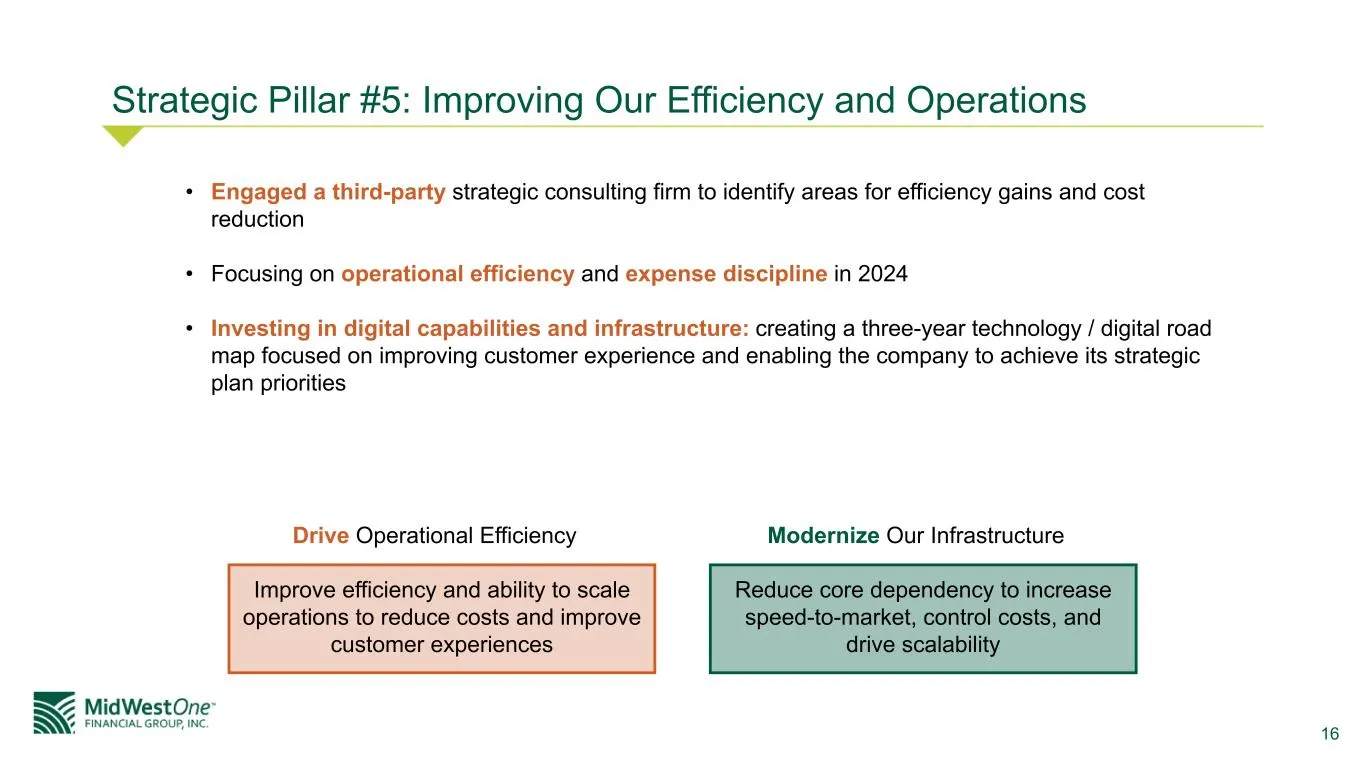
16 Strategic Pillar #5: Improving Our Efficiency and Operations • Engaged a third-party strategic consulting firm to identify areas for efficiency gains and cost reduction • Focusing on operational efficiency and expense discipline in 2024 • Investing in digital capabilities and infrastructure: crea
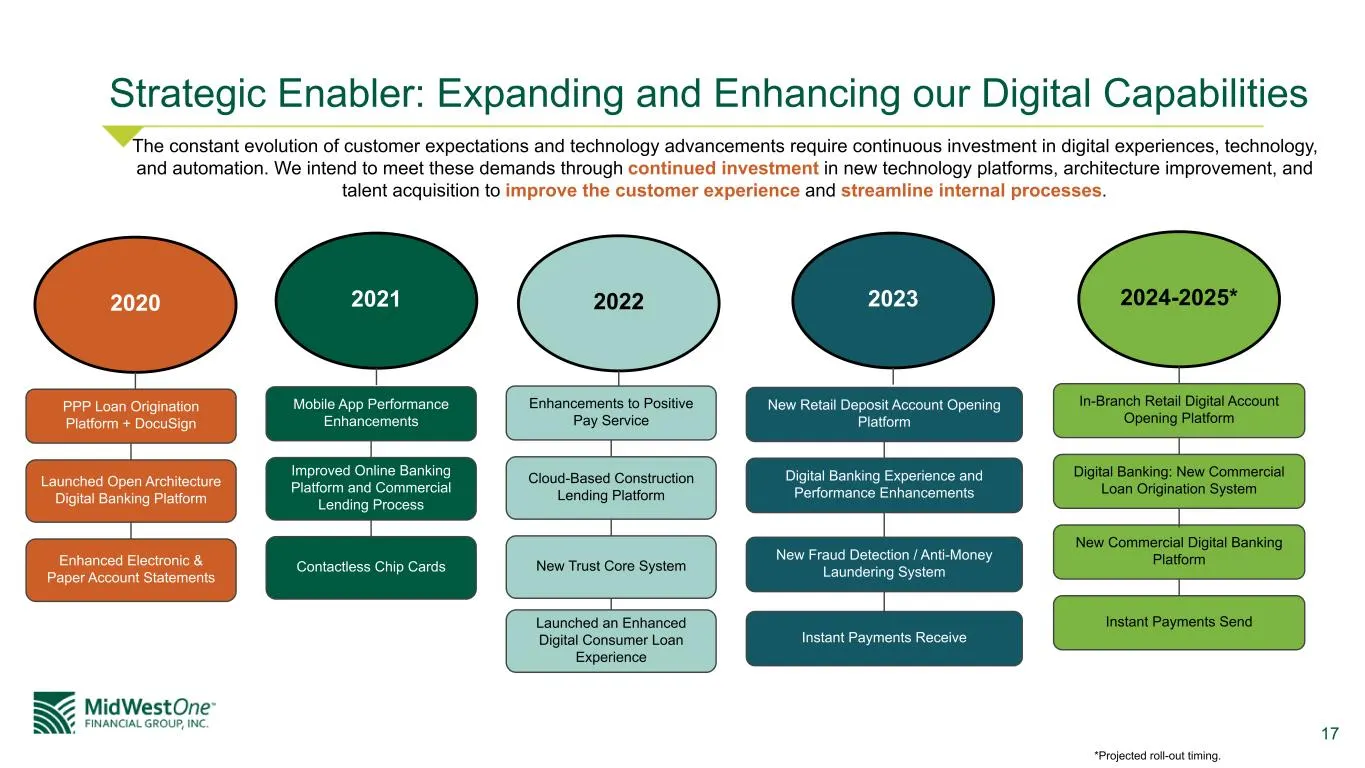
Slide 17: Strategic Enabler: Expanding and Enhancing our Digital Capabilities
17 Strategic Enabler: Expanding and Enhancing our Digital Capabilities The constant evolution of customer expectations and technology advancements require continuous investment in digital experiences, technology, and automation. We intend to meet these demands through continued investment in new tec
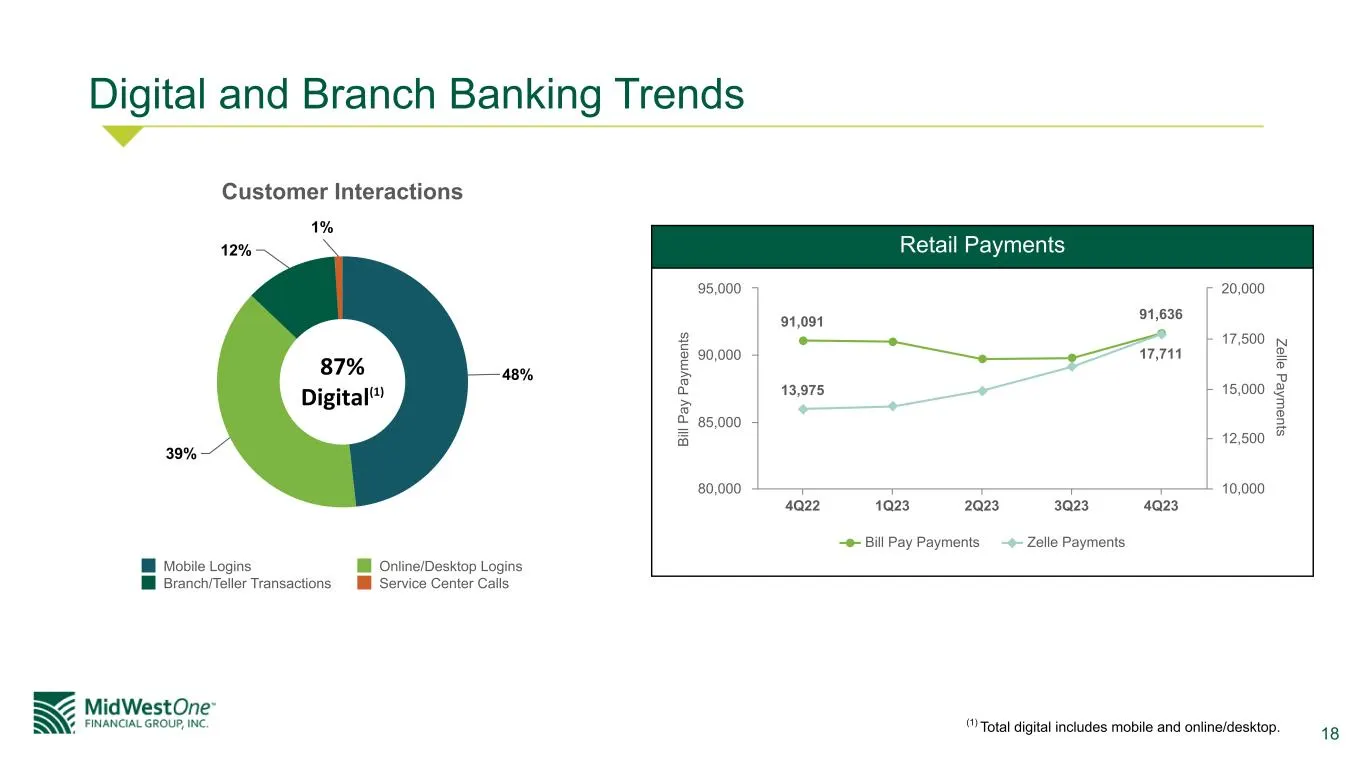
Slide 18: Digital and Branch Banking Trends
18 Digital and Branch Banking Trends (1) Total digital includes mobile and online/desktop. Customer Interactions 48% 39% 12% 1% Mobile Logins Online/Desktop Logins Branch/Teller Transactions Service Center Calls 87% Digital(1) B ill P ay P ay m en ts Zelle P aym ents 91,091 91,636 13,975 17,711 Bill
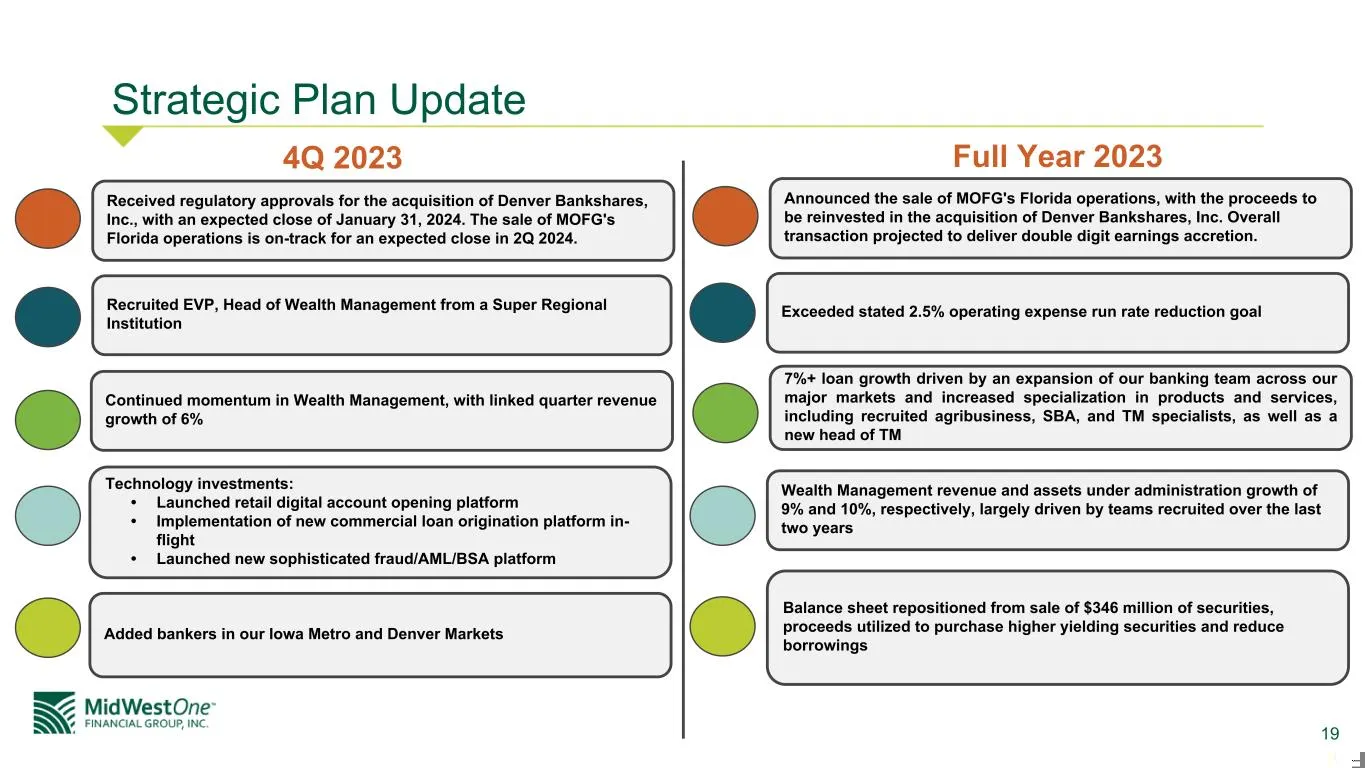
Slide 19: Strategic Plan Update
19 Strategic Plan Update Received regulatory approvals for the acquisition of Denver Bankshares, Inc., with an expected close of January 31, 2024. The sale of MOFG's Florida operations is on-track for an expected close in 2Q 2024. Recruited EVP, Head of Wealth Management from a Super Regional Instit
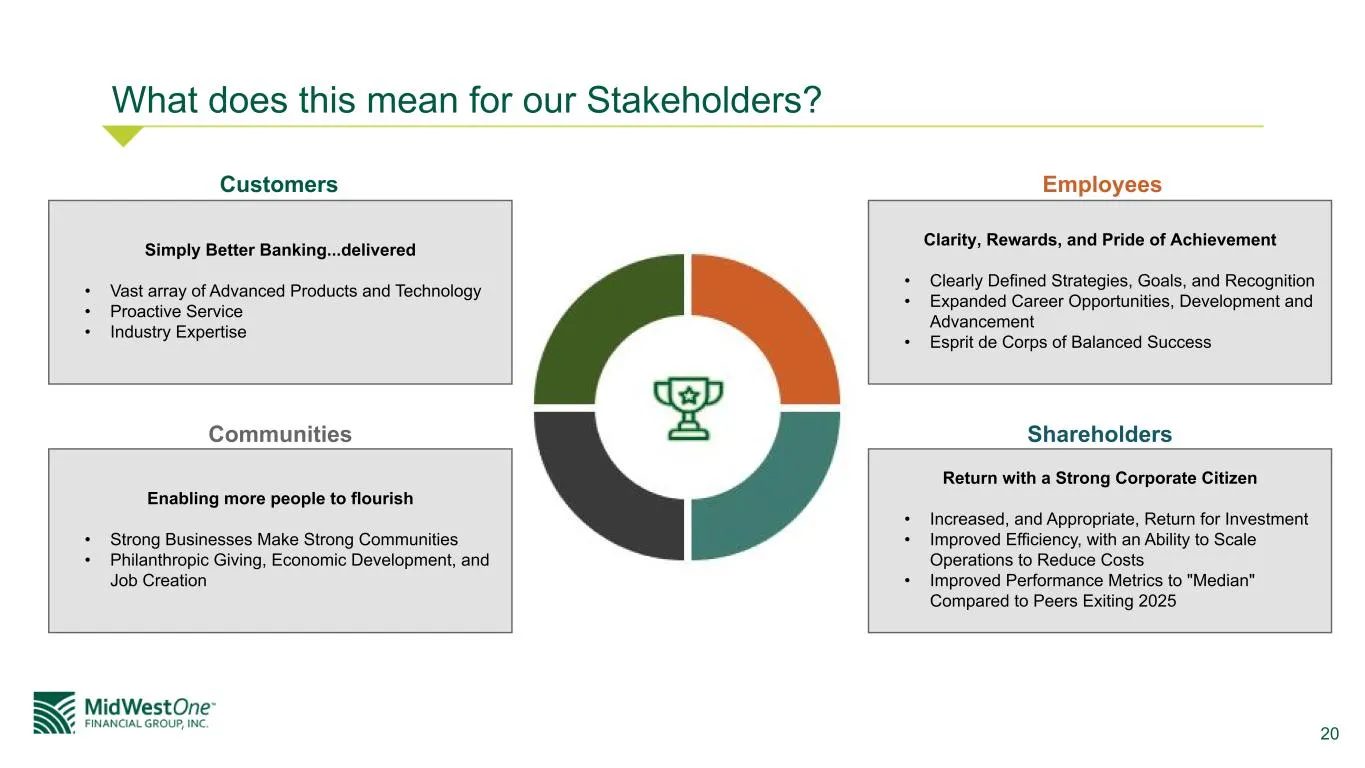
Slide 20: What does this mean for our Stakeholders?
20 What does this mean for our Stakeholders? Simply Better Banking...delivered • Vast array of Advanced Products and Technology • Proactive Service • Industry Expertise Enabling more people to flourish • Strong Businesses Make Strong Communities • Philanthropic Giving, Economic Development, and Job
Slide 21: MidWestOne-
= A q MidWestOne- FINANCIAL GROUP, INC. 21
Slide 22: Financial Highlights
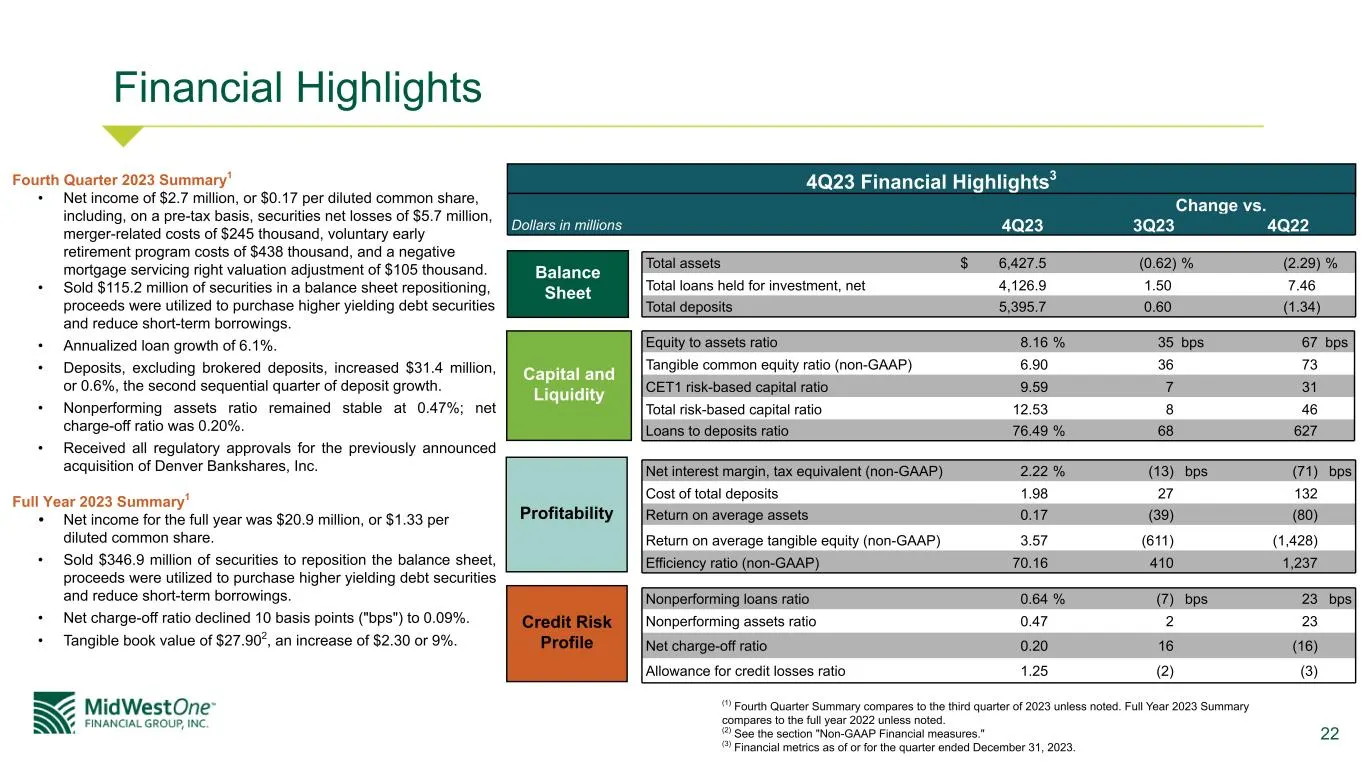
22 Financial Highlights Total assets $ 6,427.5 (0.62) % (2.29) % Total loans held for investment, net 4,126.9 1.50 7.46 Total deposits 5,395.7 0.60 (1.34) Balance Sheet Equity to assets ratio 8.16 % 35 bps 67 bps Tangible common equity ratio (non-GAAP) 6.90 36 73 CET1 risk-based capital ratio 9.59 7
Slide 23: Balance Sheet
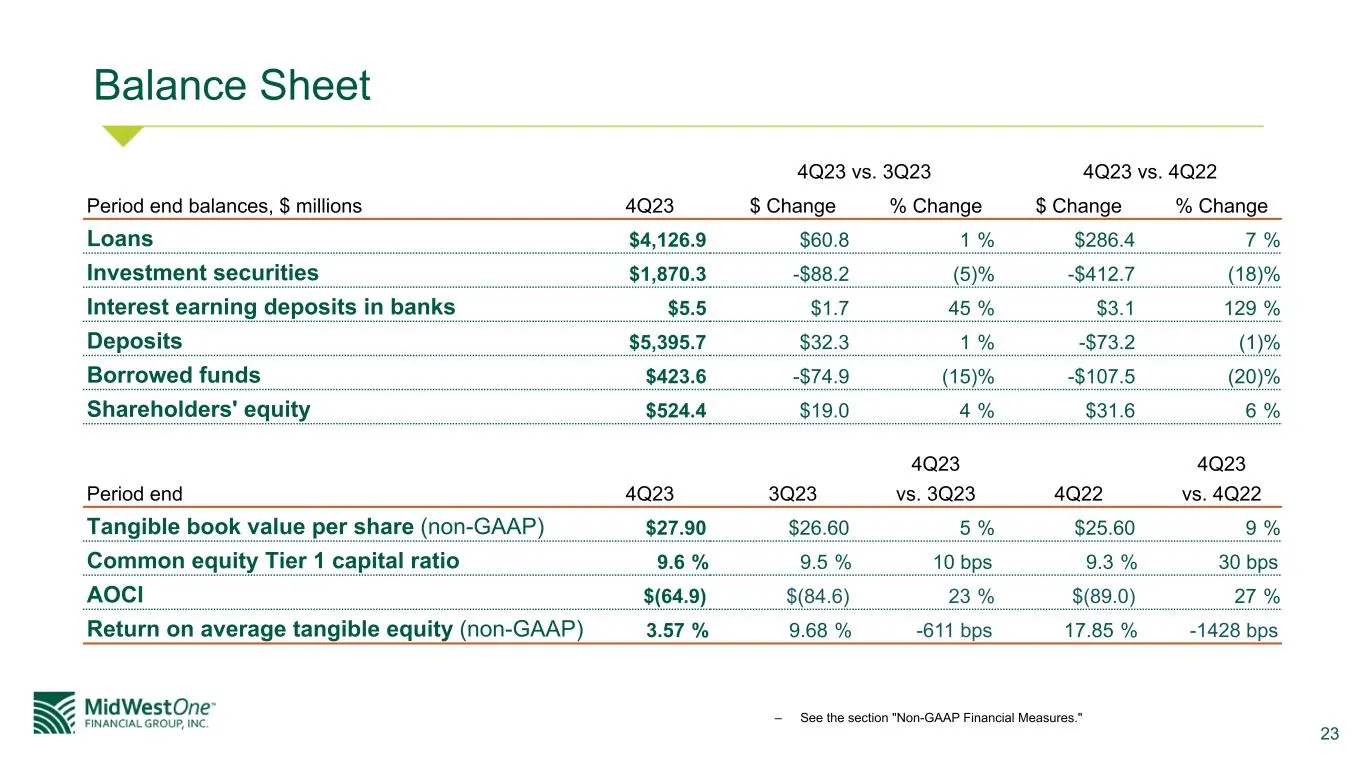
23 Balance Sheet 4Q23 vs. 3Q23 4Q23 vs. 4Q22 Period end balances, $ millions 4Q23 $ Change % Change $ Change % Change Loans $4,126.9 $60.8 1 % $286.4 7 % Investment securities $1,870.3 -$88.2 (5) % -$412.7 (18) % Interest earning deposits in banks $5.5 $1.7 45 % $3.1 129 % Deposits $5,395.7 $32.3 1
Slide 24: Balance Sheet - Debt Securities Portfolio
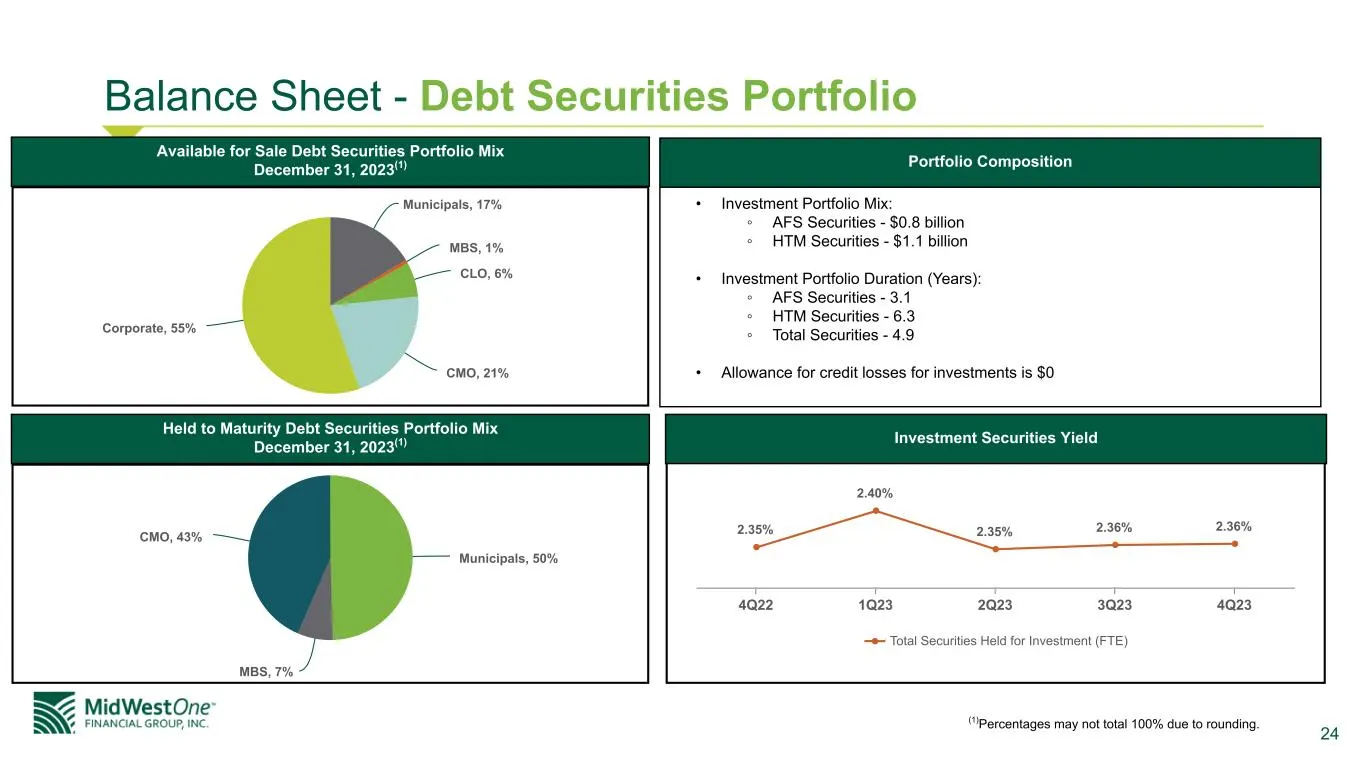
24 Balance Sheet - Debt Securities Portfolio Municipals, 17% MBS, 1% CLO, 6% CMO, 21% Corporate, 55% 2.35% 2.40% 2.35% 2.36% 2.36% Total Securities Held for Investment (FTE) 4Q22 1Q23 2Q23 3Q23 4Q23 Investment Securities Yield Available for Sale Debt Securities Portfolio Mix December 31, 2023(1) Mun
Slide 25: Balance Sheet - Average Loans and Deposits
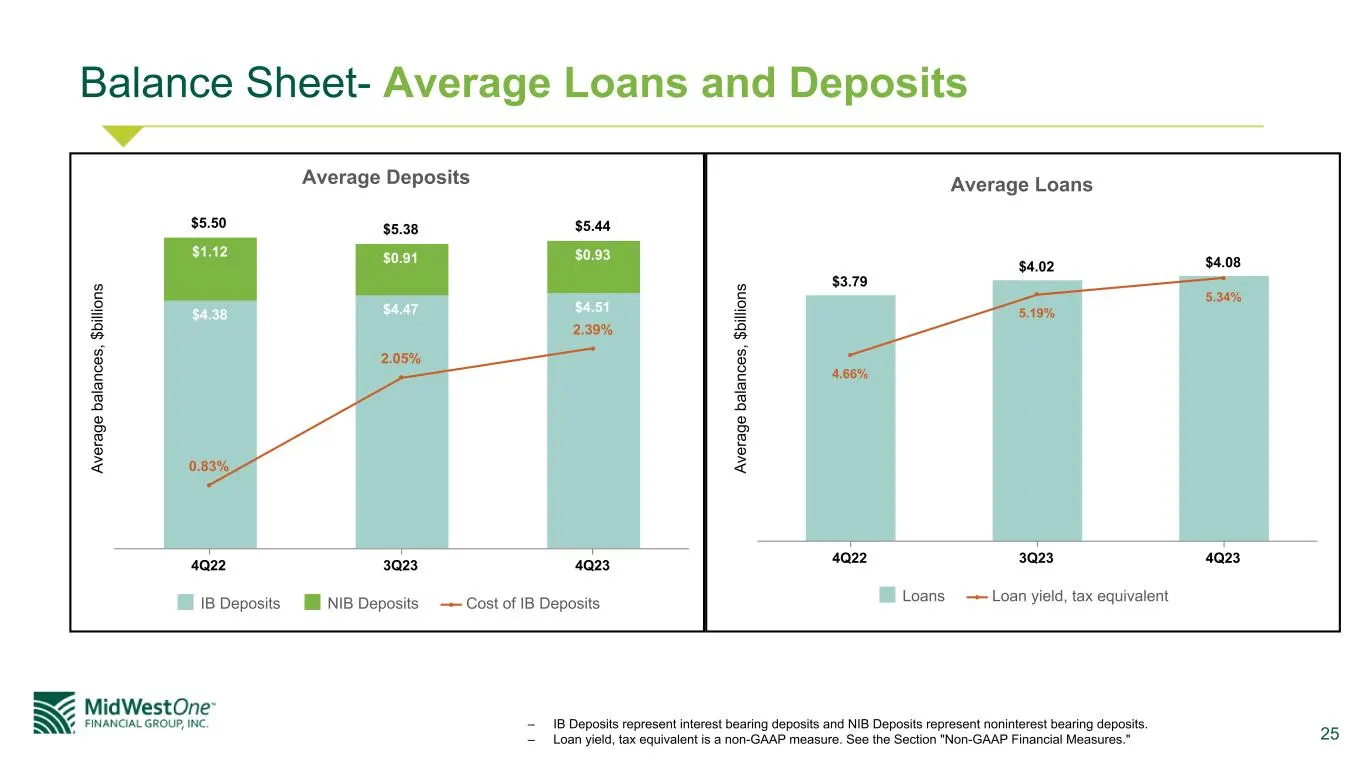
25 Balance Sheet- Average Loans and Deposits – IB Deposits represent interest bearing deposits and NIB Deposits represent noninterest bearing deposits. – Loan yield, tax equivalent is a non-GAAP measure. See the Section "Non-GAAP Financial Measures." Av er ag e ba la nc es , $ bi lli on s Average De
Slide 26: Credit
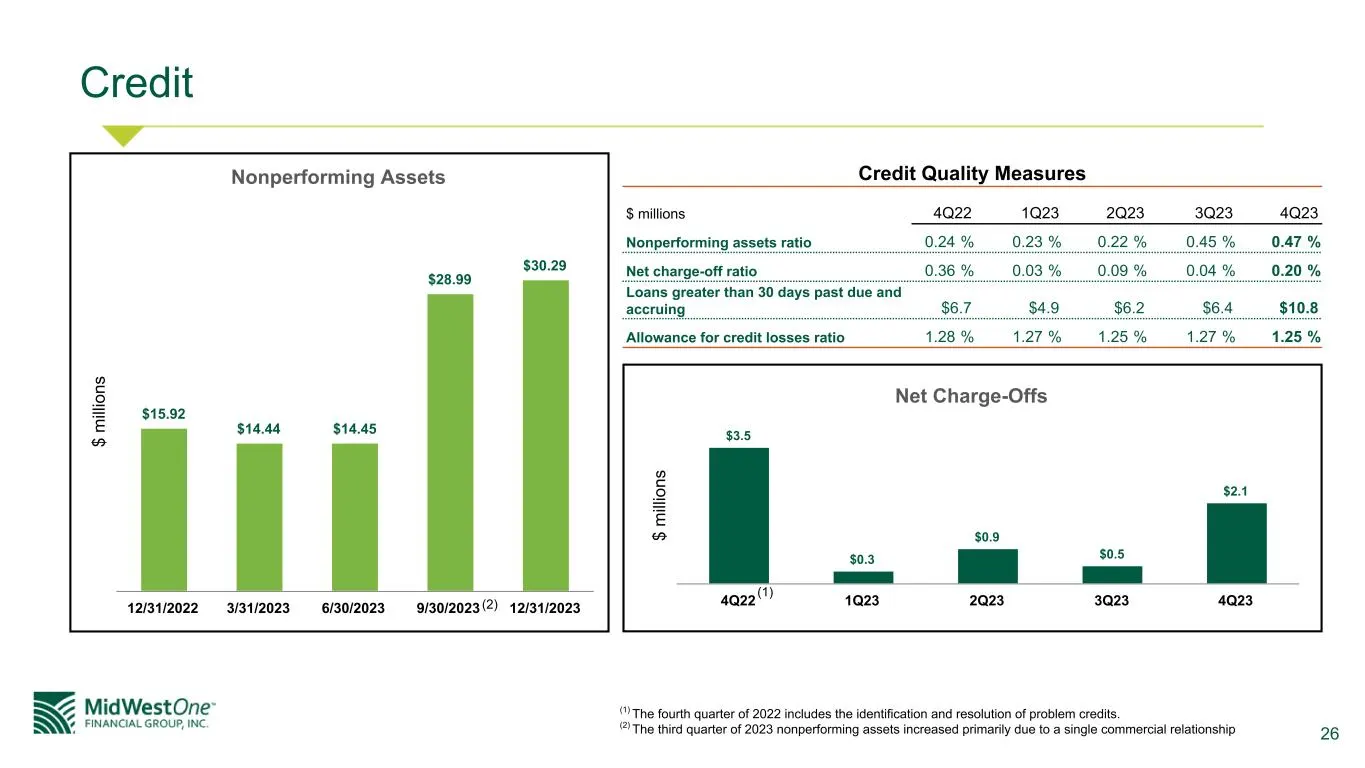
26 Credit $ m illi on s Nonperforming Assets $15.92 $14.44 $14.45 $28.99 $30.29 12/31/2022 3/31/2023 6/30/2023 9/30/2023 12/31/2023 $ m illi on s Net Charge-Offs $3.5 $0.3 $0.9 $0.5 $2.1 4Q22 1Q23 2Q23 3Q23 4Q23 Credit Quality Measures $ millions 4Q22 1Q23 2Q23 3Q23 4Q23 Nonperforming assets ratio 0
Slide 27: Commercial Real Estate
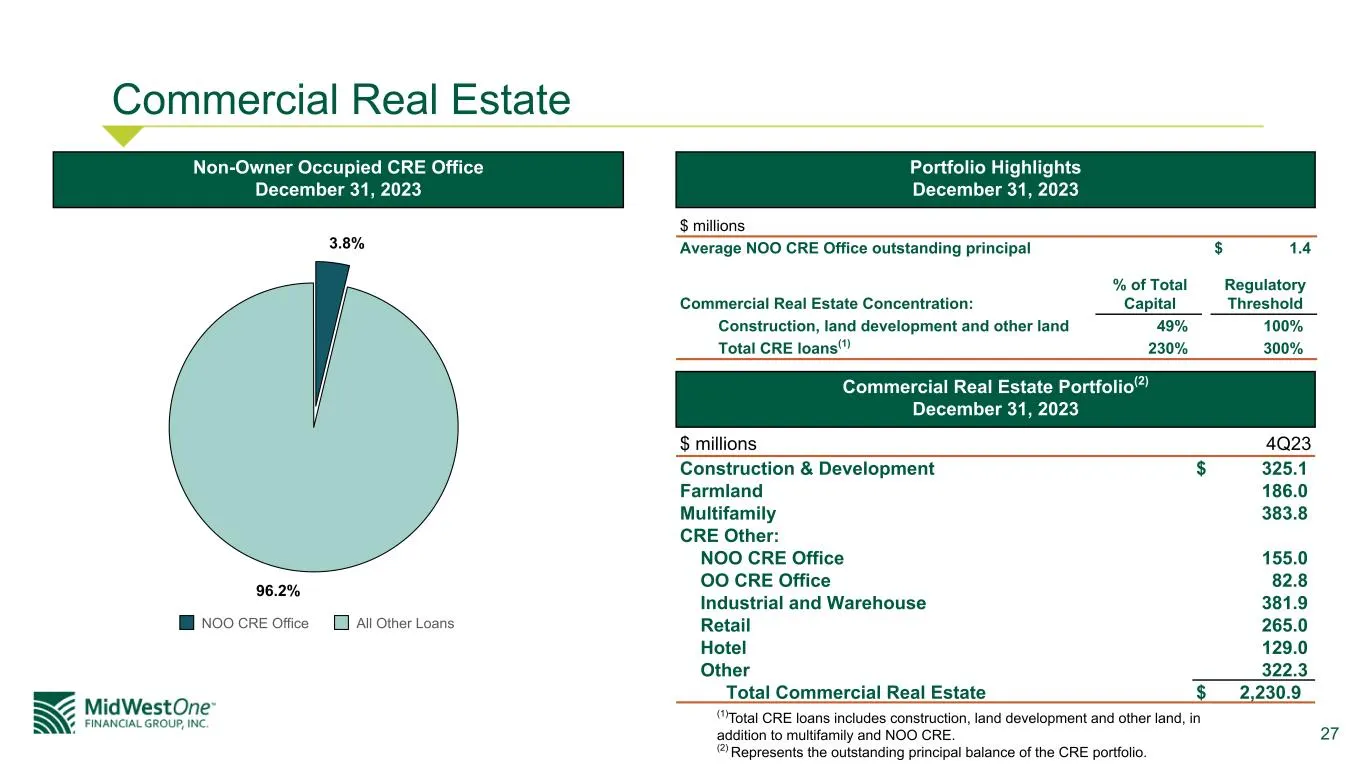
27 Commercial Real Estate 3.8% 96.2% NOO CRE Office All Other Loans Non-Owner Occupied CRE Office December 31, 2023 $ millions 4Q23 Construction & Development $ 325.1 Farmland 186.0 Multifamily 383.8 CRE Other: NOO CRE Office 155.0 OO CRE Office 82.8 Industrial and Warehouse 381.9 Retail 265.0 Hotel
Slide 28: Income Statement
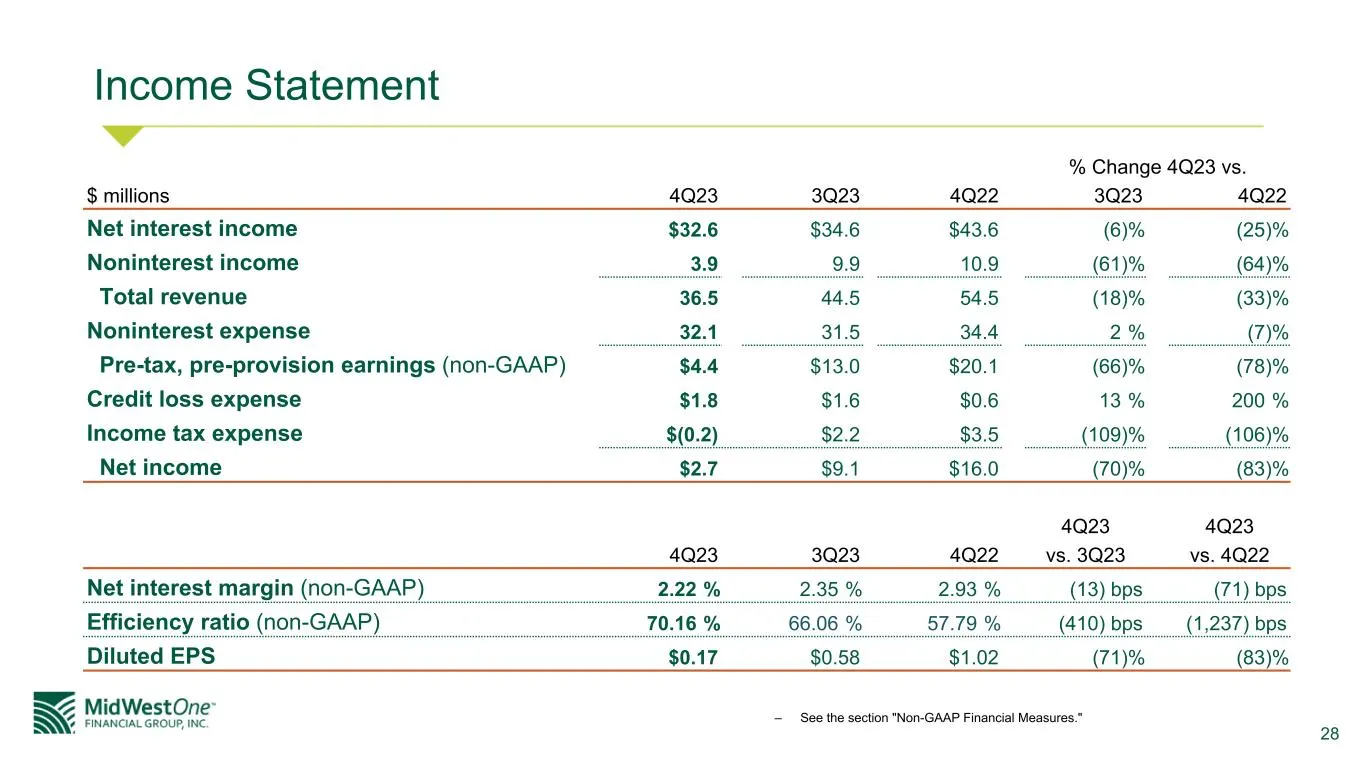
28 Income Statement % Change 4Q23 vs. $ millions 4Q23 3Q23 4Q22 3Q23 4Q22 Net interest income $32.6 $34.6 $43.6 (6) % (25) % Noninterest income 3.9 9.9 10.9 (61) % (64) % Total revenue 36.5 44.5 54.5 (18) % (33) % Noninterest expense 32.1 31.5 34.4 2 % (7) % Pre-tax, pre-provision earnings (non-GAAP
Slide 29: MidWestOne
MidWestOne FINANCIAL GROUP, INC. 29
Slide 30: Our Mission and Our Operating Principles
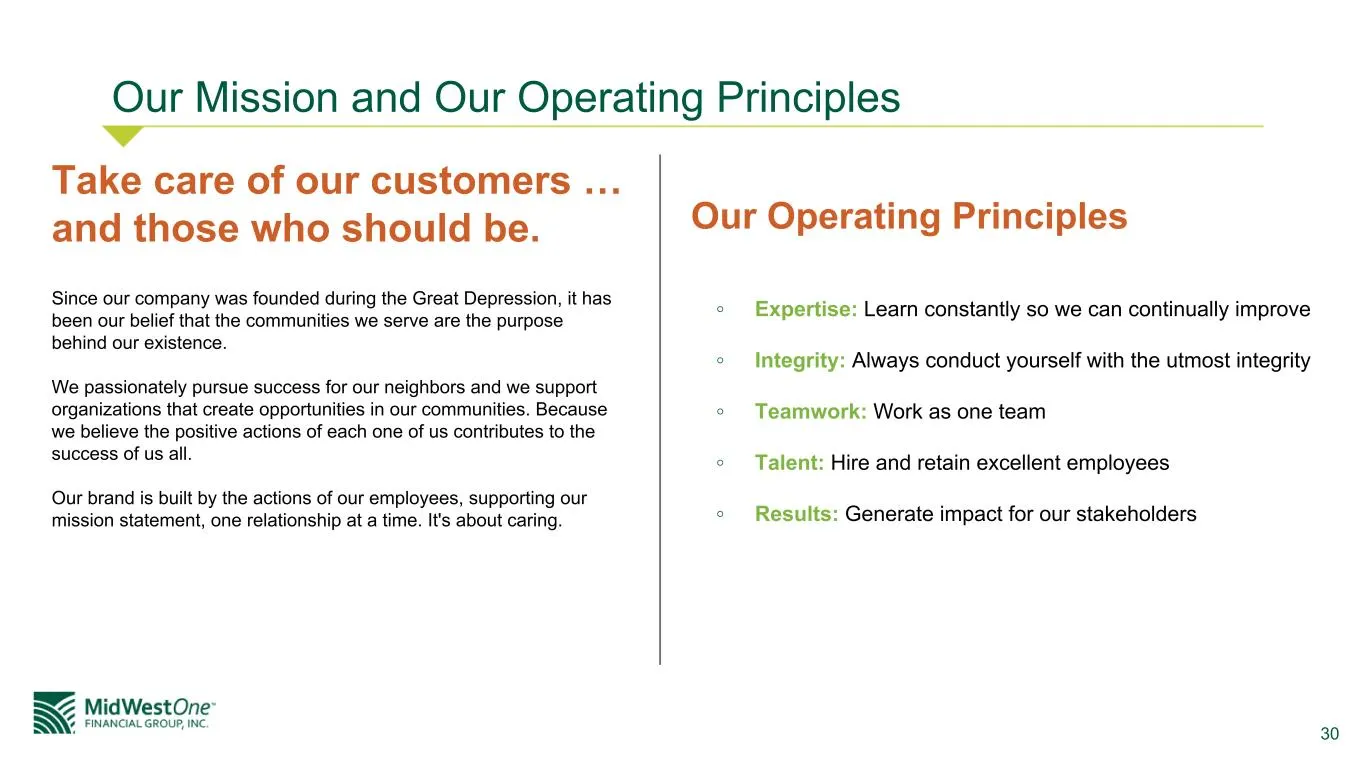
30 Our Mission and Our Operating Principles Take care of our customers … and those who should be. Since our company was founded during the Great Depression, it has been our belief that the communities we serve are the purpose behind our existence. We passionately pursue success for our neighbors and
Slide 31: Leadership within the Community
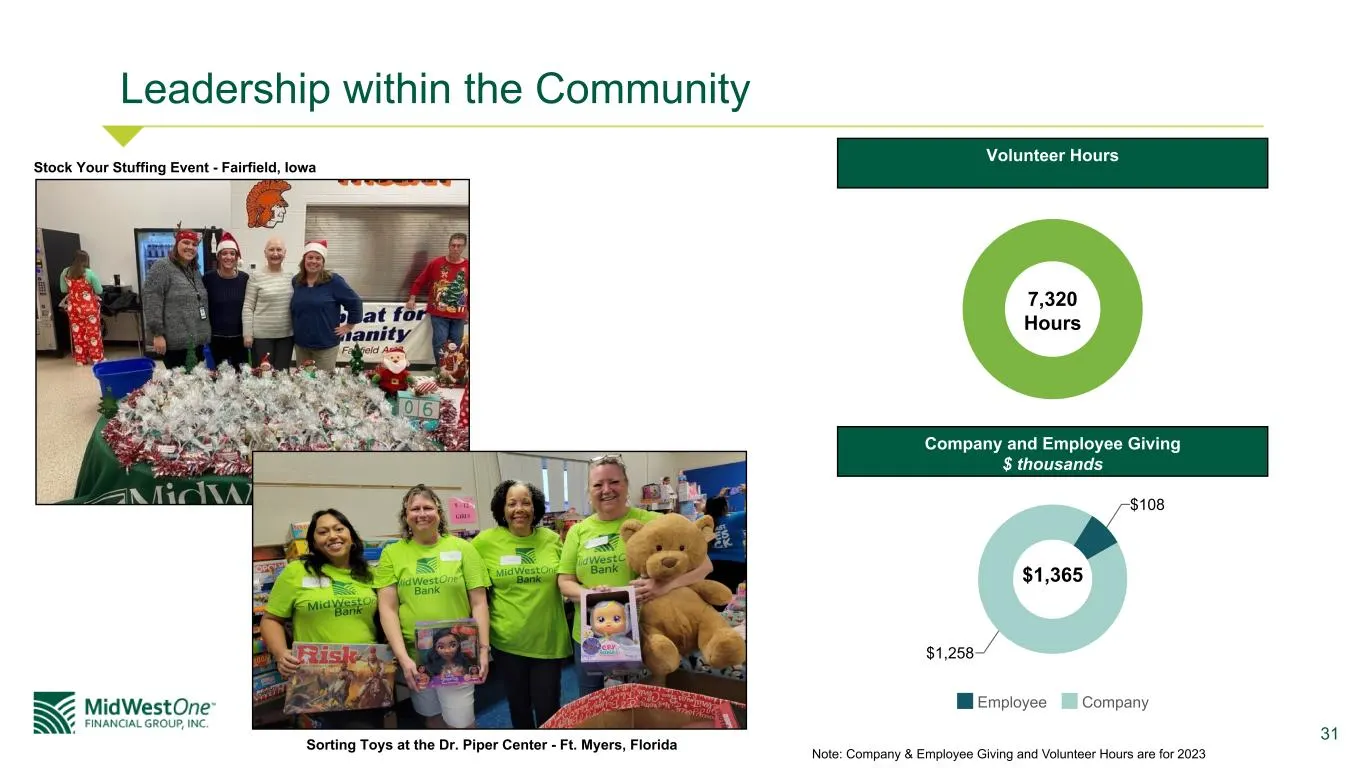
31 Leadership within the Community $108 $1,258 Employee Company Company and Employee Giving $ thousands Note: Company & Employee Giving and Volunteer Hours are for 2023 Volunteer Hours 7,320 Hours $1,365 Sorting Toys at the Dr. Piper Center - Ft. Myers, Florida Stock Your Stuffing Event - Fairfield,
Slide 32: Long-term Shareholder Return
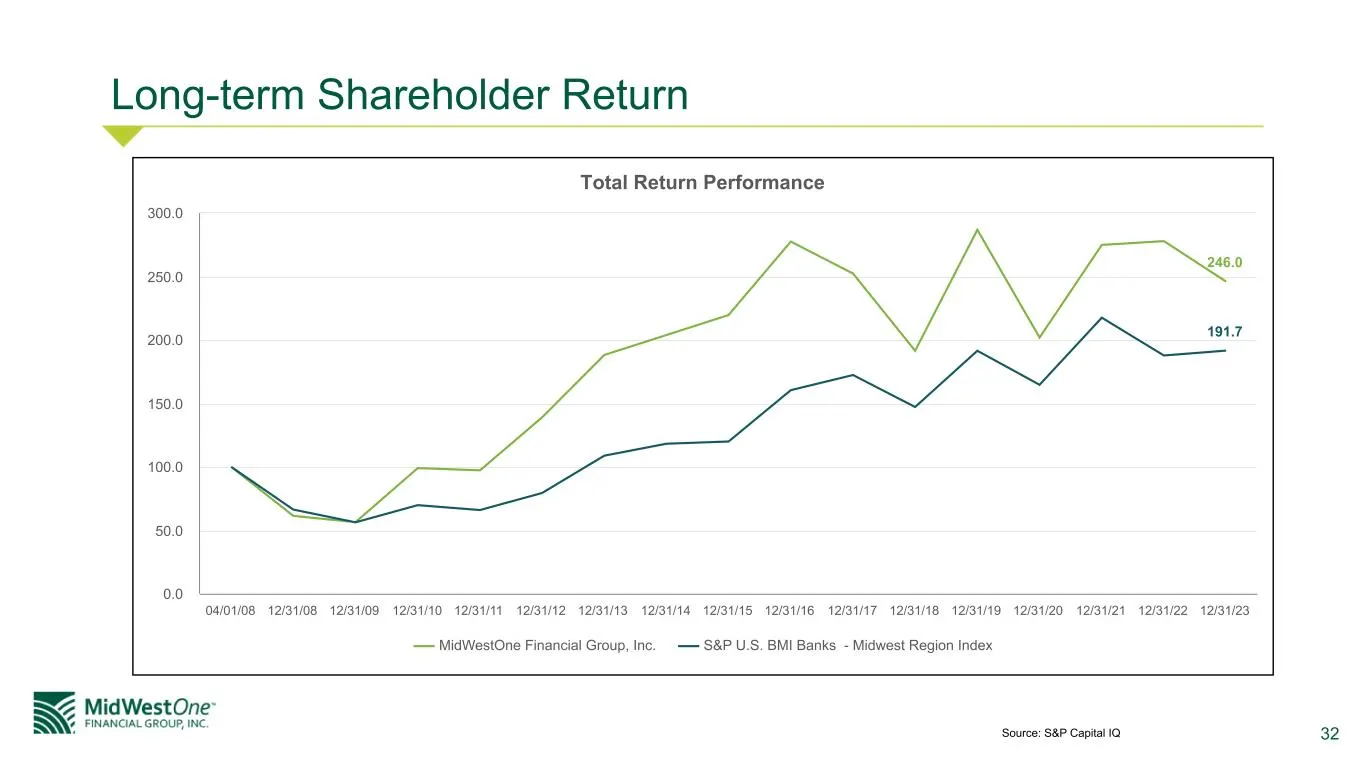
32 Long-term Shareholder Return Source: S&P Capital IQ Total Return Performance 246.0 191.7 MidWestOne Financial Group, Inc. S&P U.S. BMI Banks - Midwest Region Index 04/01/08 12/31/08 12/31/09 12/31/10 12/31/11 12/31/12 12/31/13 12/31/14 12/31/15 12/31/16 12/31/17 12/31/18 12/31/19 12/31/20 12/31/2
Slide 33: Non-GAAP Financial Measures
33 Non-GAAP Financial Measures
Slide 34: Non-GAAP Financial Measures
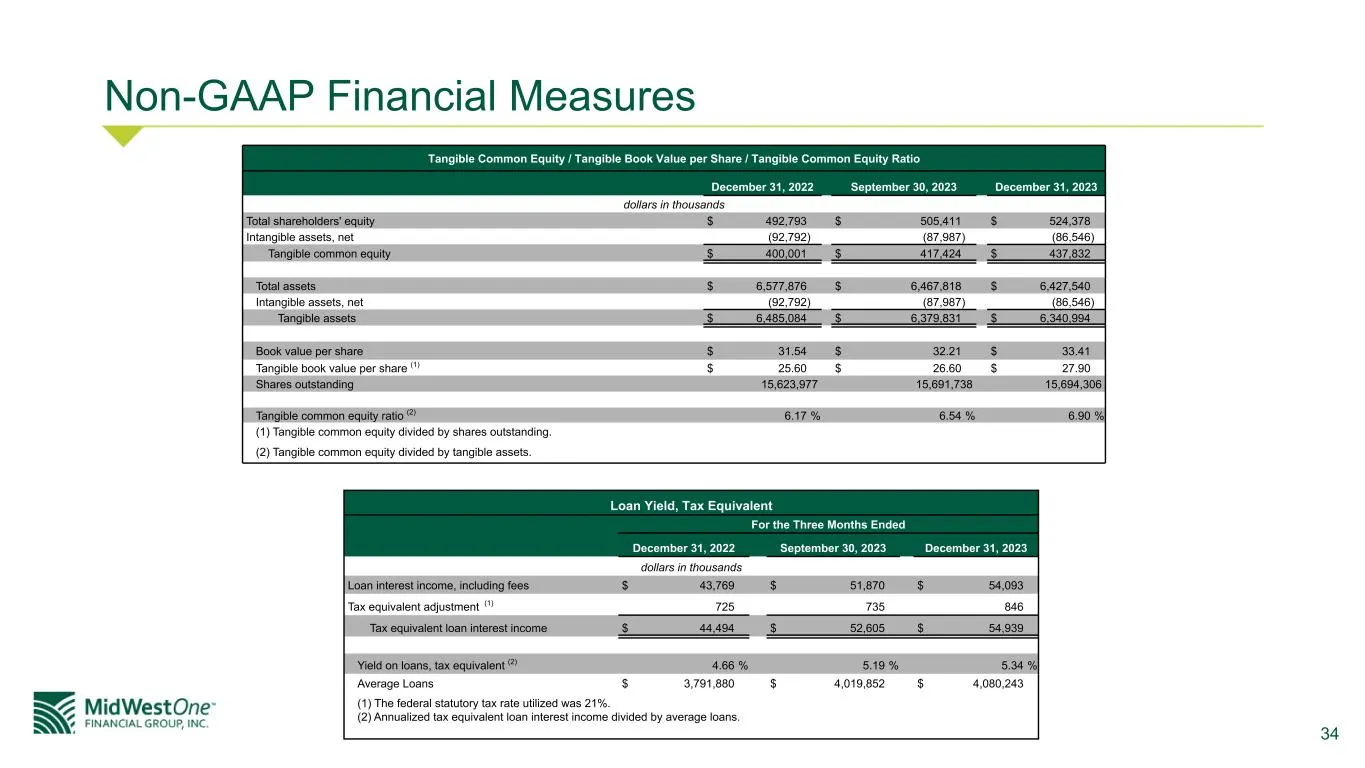
34 Non-GAAP Financial Measures Tangible Common Equity / Tangible Book Value per Share / Tangible Common Equity Ratio December 31, 2022 September 30, 2023 December 31, 2023 dollars in thousands Total shareholders' equity $ 492,793 $ 505,411 $ 524,378 Intangible assets, net (92,792) (87,987) (86,546)
Slide 35: Non-GAAP Financial Measures: Efficiency Ratio
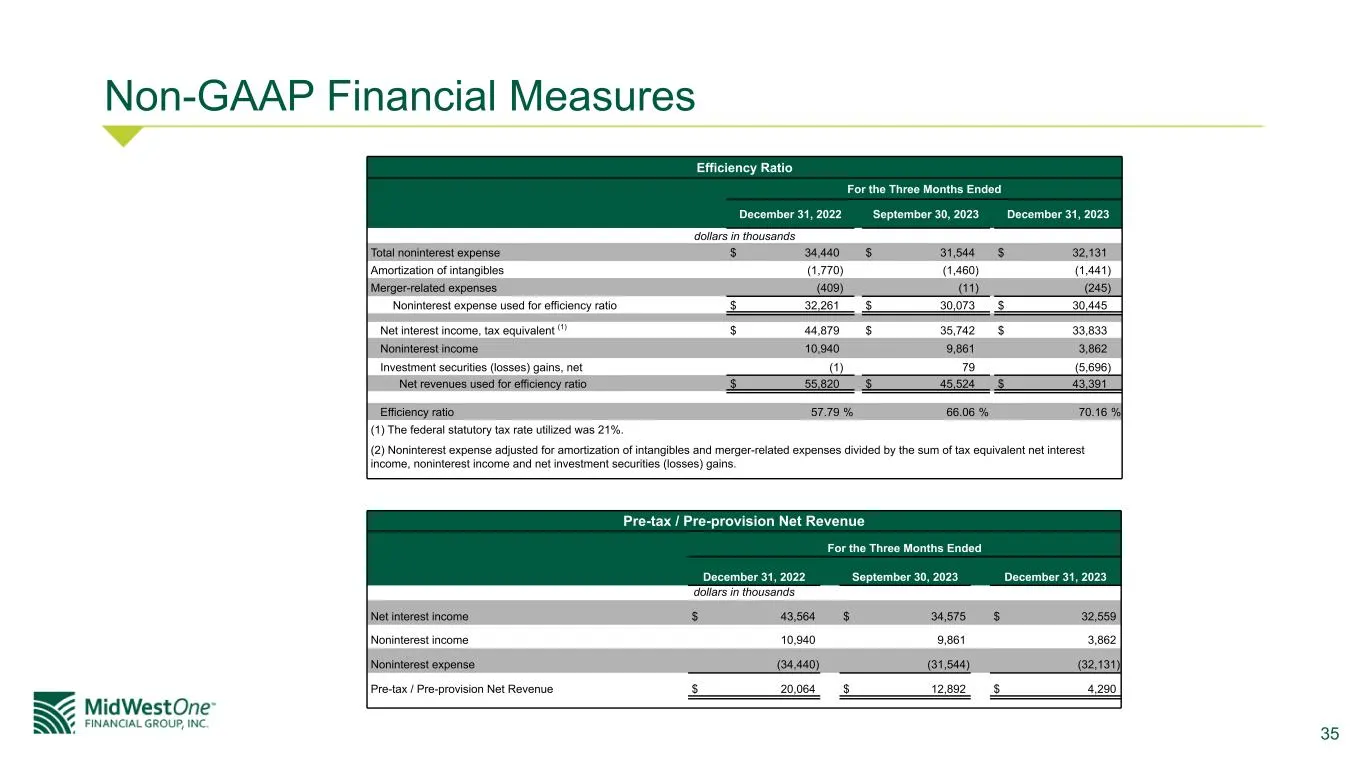
35 Non-GAAP Financial Measures Efficiency Ratio For the Three Months Ended December 31, 2022 September 30, 2023 December 31, 2023 dollars in thousands Total noninterest expense $ 34,440 $ 31,544 $ 32,131 Amortization of intangibles (1,770) (1,460) (1,441) Merger-related expenses (409) (11) (245) Non
Slide 36: Non-GAAP Financial Measures: Return on Average Tangible Equity
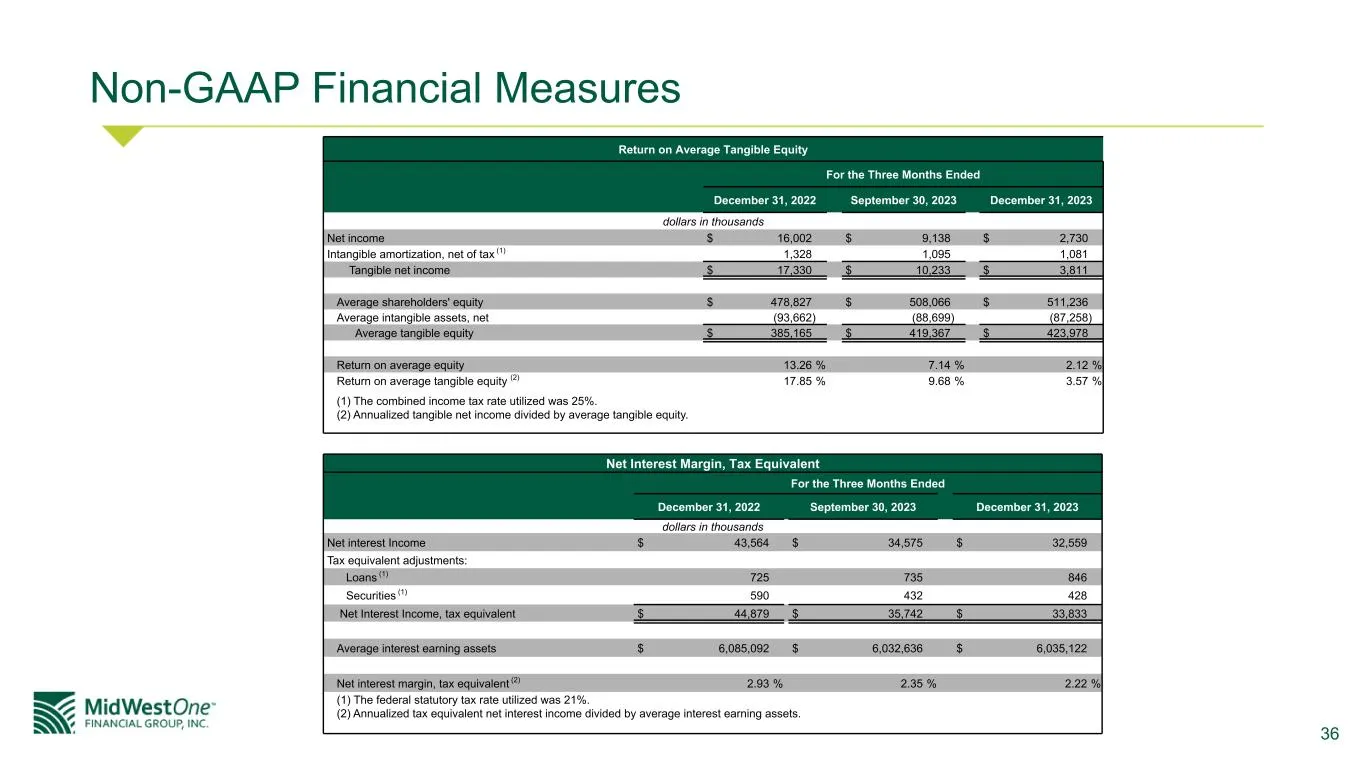
36 Non-GAAP Financial Measures Return on Average Tangible Equity For the Three Months Ended December 31, 2022 September 30, 2023 December 31, 2023 dollars in thousands Net income $ 16,002 $ 9,138 $ 2,730 Intangible amortization, net of tax (1) 1,328 1,095 1,081 Tangible net income $ 17,330 $ 10,233
Source: SEC EDGAR · 8-K filed Jan 30, 2024
More decks from MidWestOne Financial Group Inc
 Q3 2025 Earnings Presentation18 slides · Oct 23, 2025
 Merger or Acquisition (October 2025)20 slides · Oct 23, 2025
 Q2 2025 Earnings Presentation32 slides · Jul 25, 2025
 Q2 2025 Earnings Presentation18 slides · Jul 25, 2025
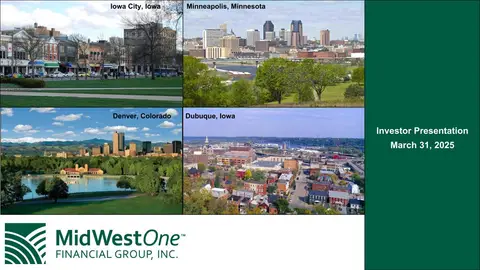 Investor Presentation (April 2025)31 slides · Apr 28, 2025
 Q1 2025 Earnings Presentation17 slides · Apr 25, 2025