Blue Owl Capital Corporation · NYSE:OBDC
Blue Owl Capital — Owl Rock Capital — Q1 2020 Earnings Presentation
19 slides from Blue Owl Capital's earnings presentation, Mar 31, 2020
Slide 1: Quarterly Earnings Presentation
OWL ROCK CAPITAL CORPORATION Quarterly Earnings Presentation March 31, 2020
Slide 2: Owl Rock Capital Corporation Business Update
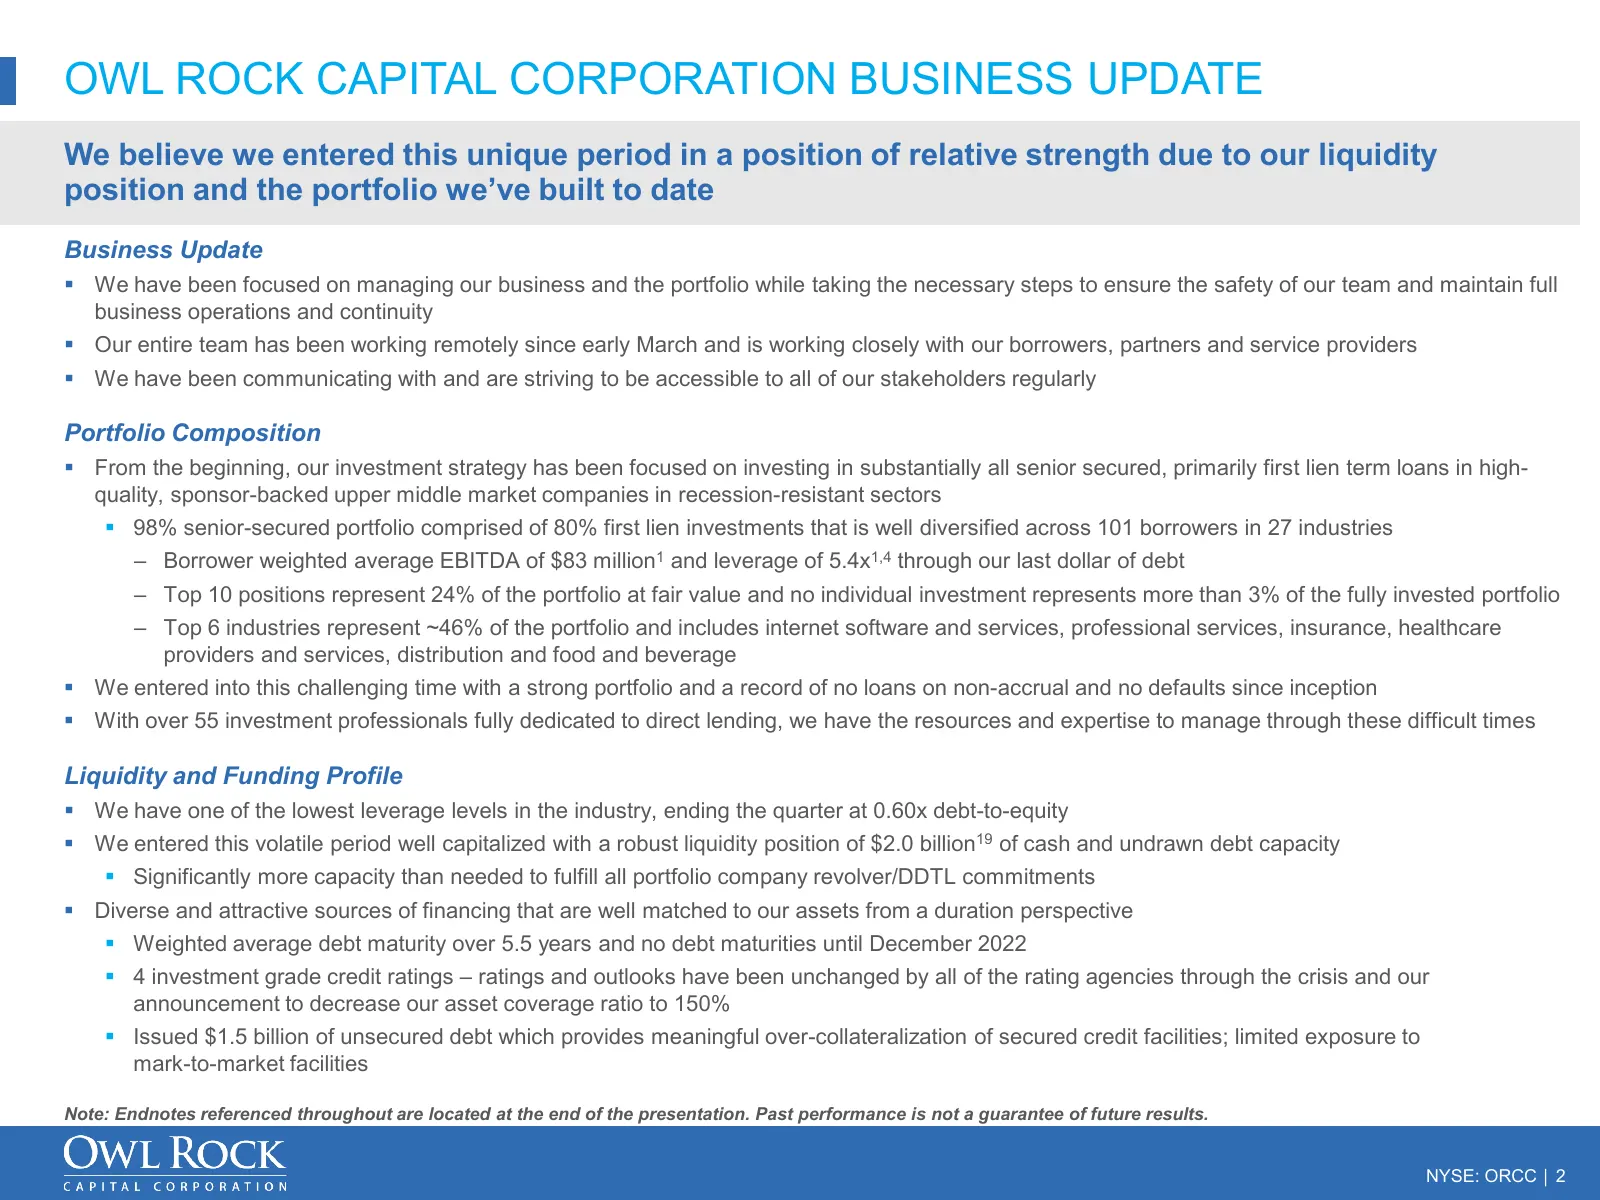
OWL ROCK CAPITAL CORPORATION BUSINESS UPDATE We believe we entered this unique period in a position of relative strength due to our liquidity position and the portfolio we’ve built to date Business Update We have been focused on managing our business and the portfolio while taking the necessary st
Slide 3: Overview of Owl Rock Capital Corporation
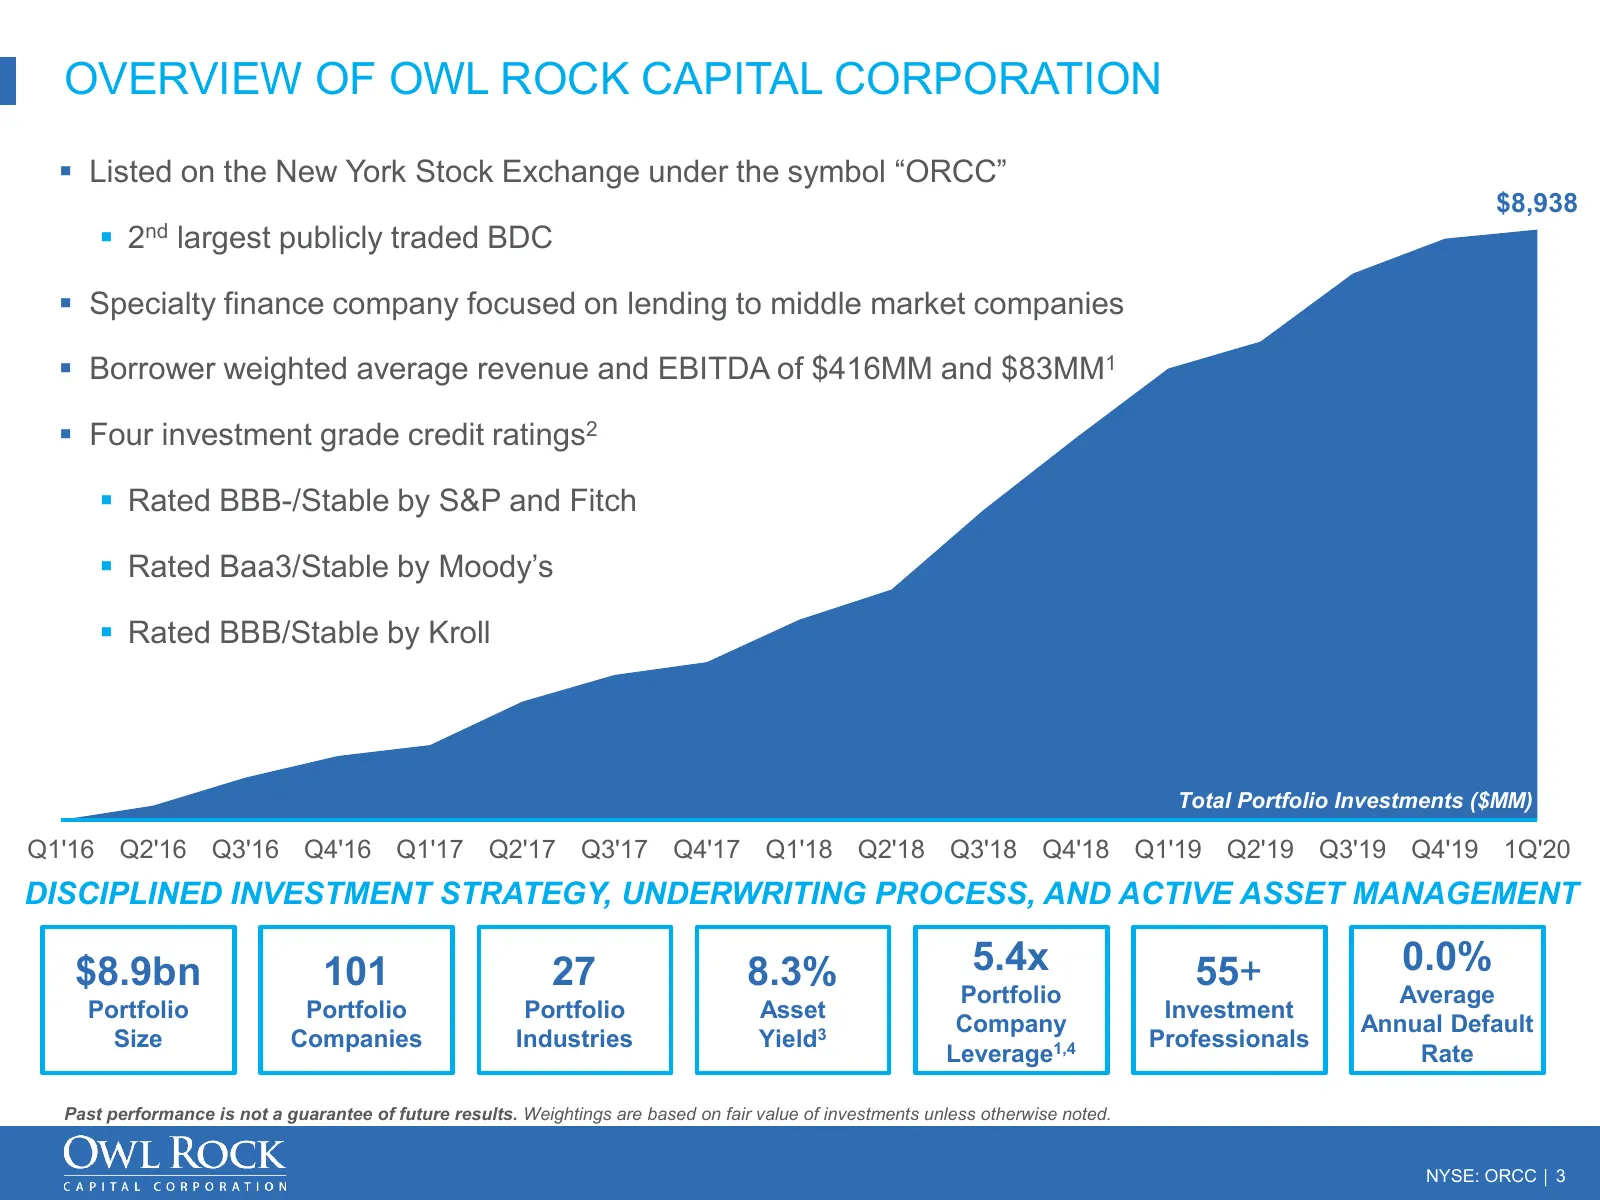
OVERVIEW OF OWL ROCK CAPITAL CORPORATION Listed on the New York Stock Exchange under the symbol “ORCC” $8,938 2nd largest publicly traded BDC Specialty finance company focused on lending to middle market companies Borrower weighted average revenue and EBITDA of $416MM and $83MM1 Four inves
Slide 4: Key Highlights
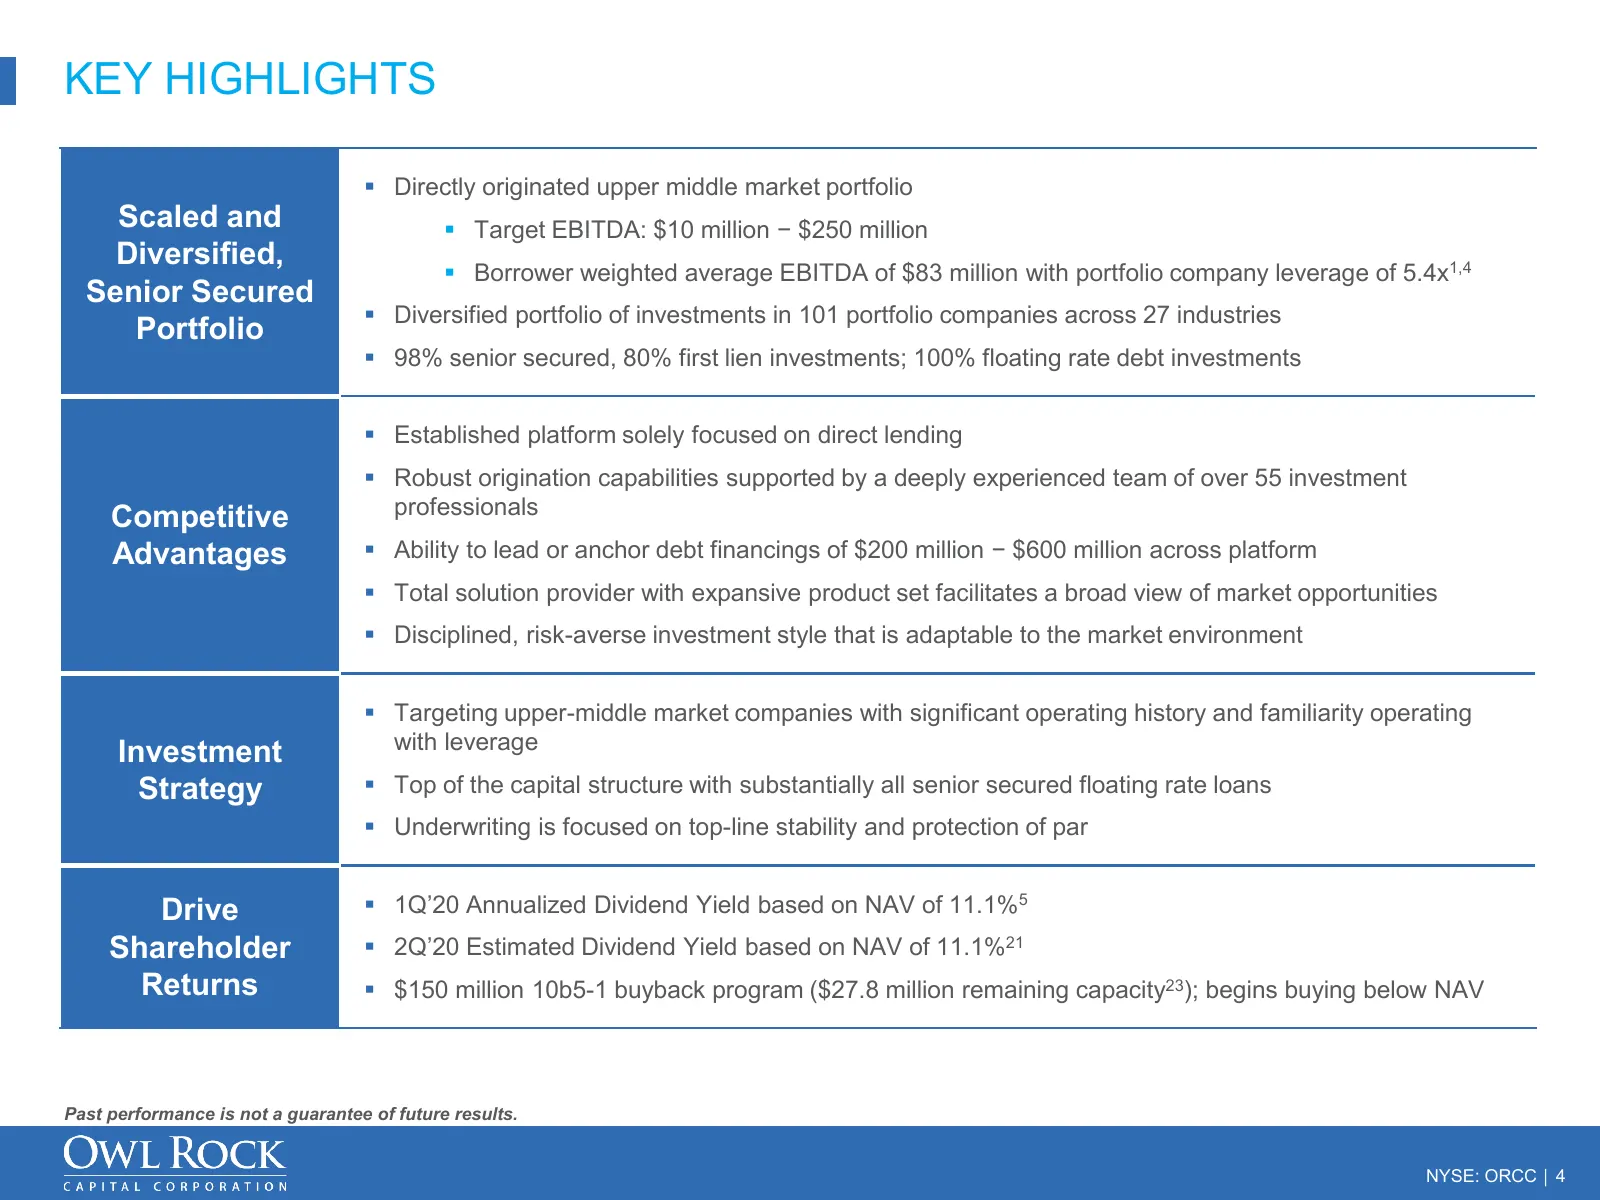
KEY HIGHLIGHTS Directly originated upper middle market portfolio Scaled and Target EBITDA: $10 million − $250 million Diversified, Borrower weighted average EBITDA of $83 million with portfolio company leverage of 5.4x1,4 Senior Secured Diversified portfolio of investments in 101 portfolio c
Slide 5: Financial Highlights
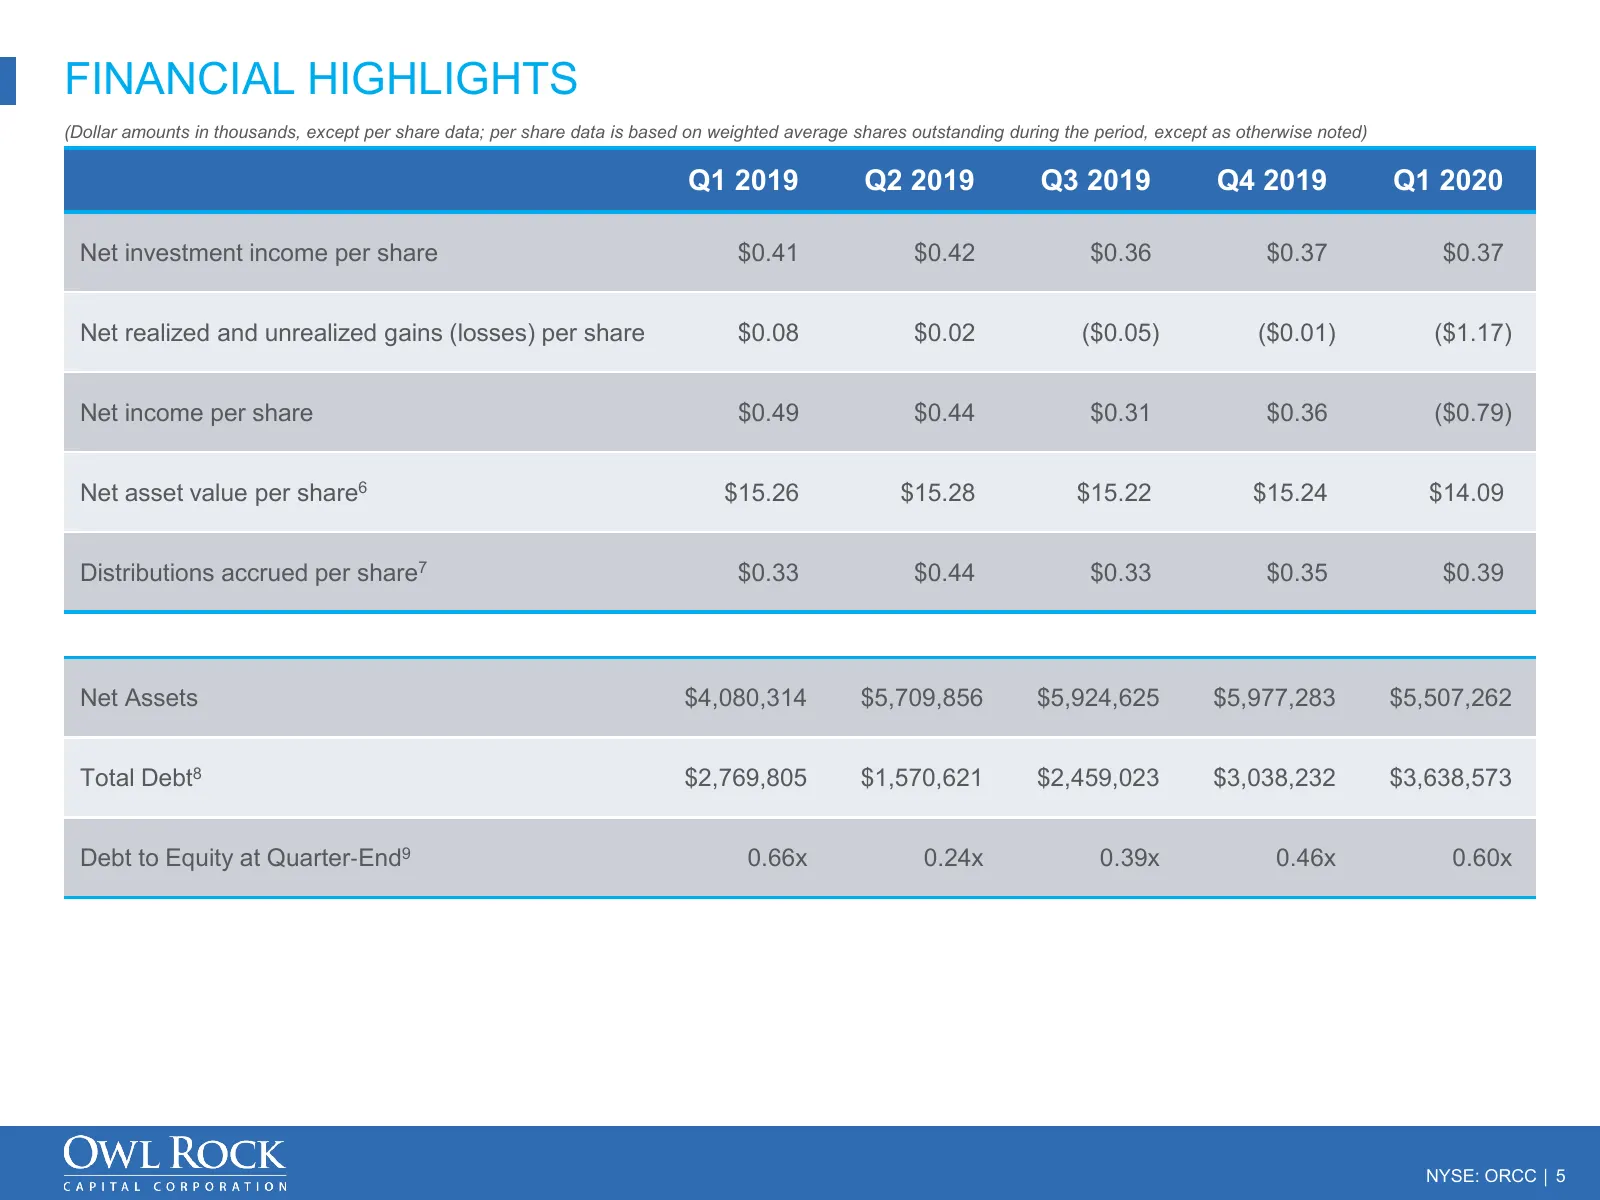
FINANCIAL HIGHLIGHTS (Dollar amounts in thousands, except per share data; per share data is based on weighted average shares outstanding during the period, except as otherwise noted) Q1 2019 Q2 2019 Q3 2019 Q4 2019 Q1 2020 Net investment income per share $0.41 $0.42 $0.36 $0.37 $0.37 Net realized an
Slide 6: Portfolio Highlights – Selected Metrics
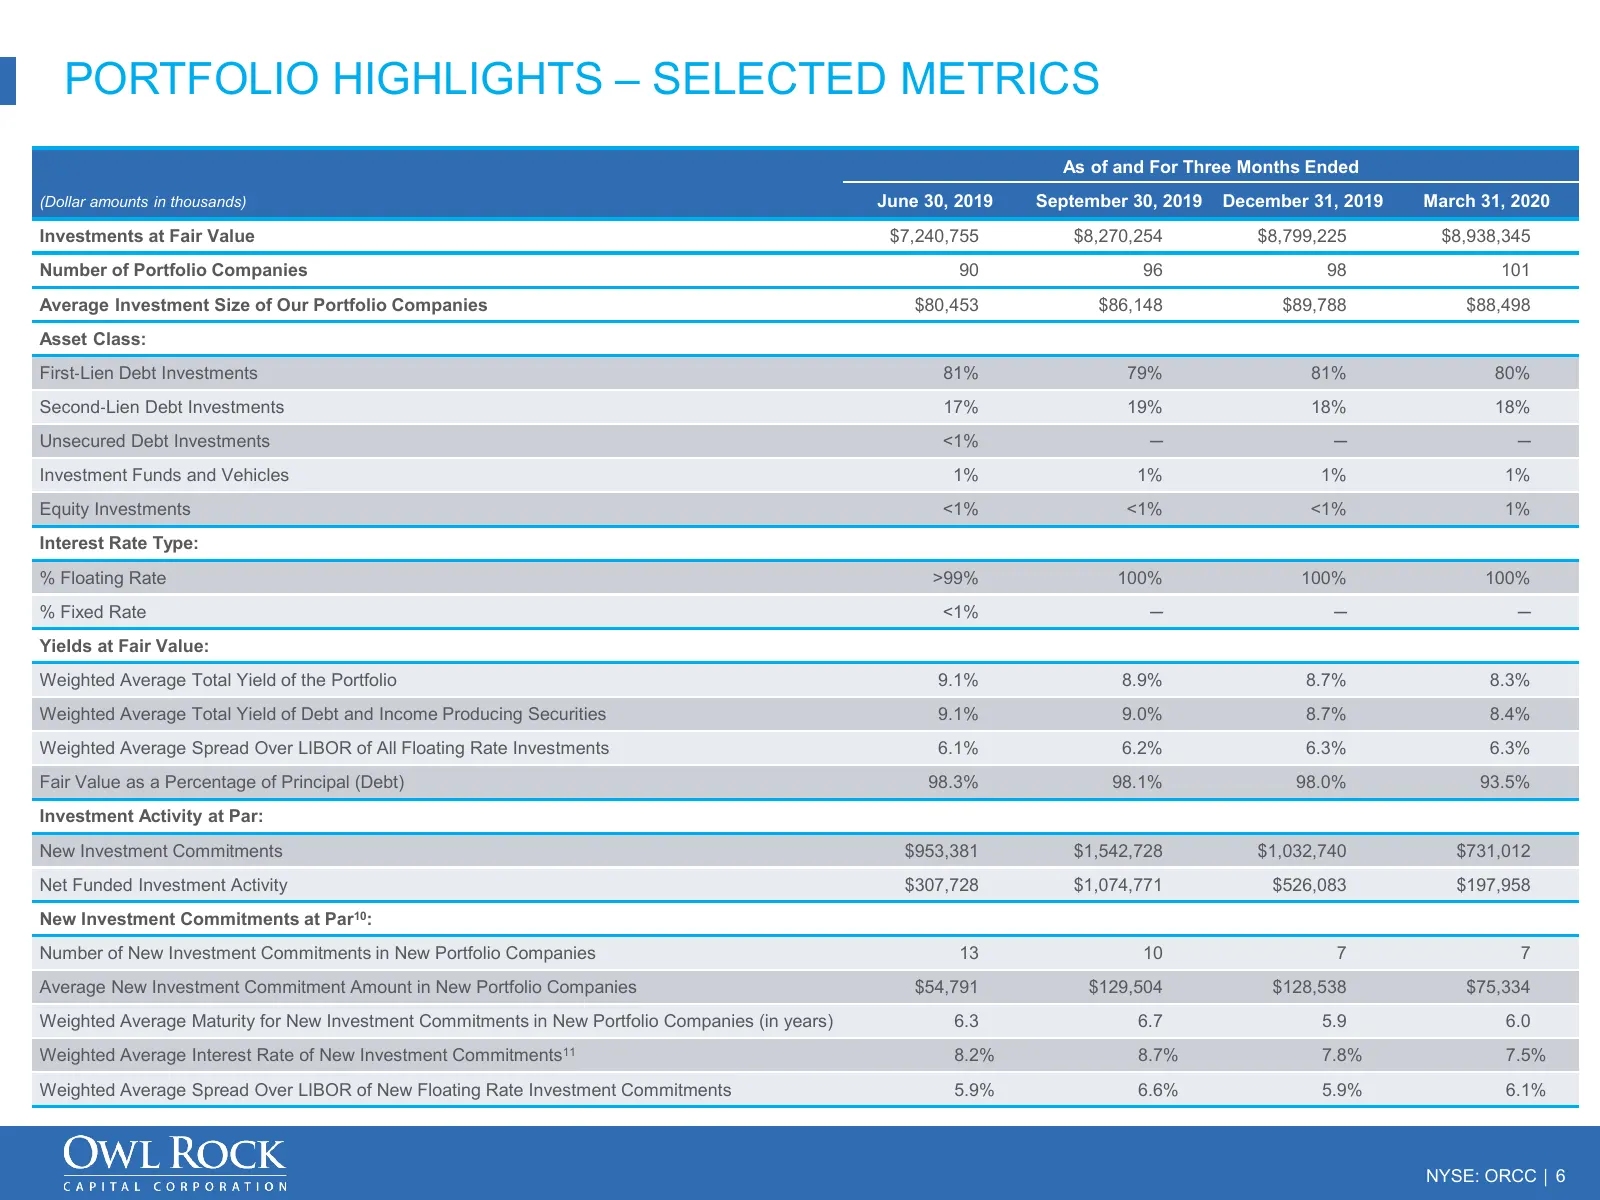
PORTFOLIO HIGHLIGHTS – SELECTED METRICS As of and For Three Months Ended (Dollar amounts in thousands) June 30, 2019 September 30, 2019 December 31, 2019 March 31, 2020 Investments at Fair Value $7,240,755 $8,270,254 $8,799,225 $8,938,345 Number of Portfolio Companies 90 96 98 101 Average Investment
Slide 7: Quarterly Statements of Financial Condition
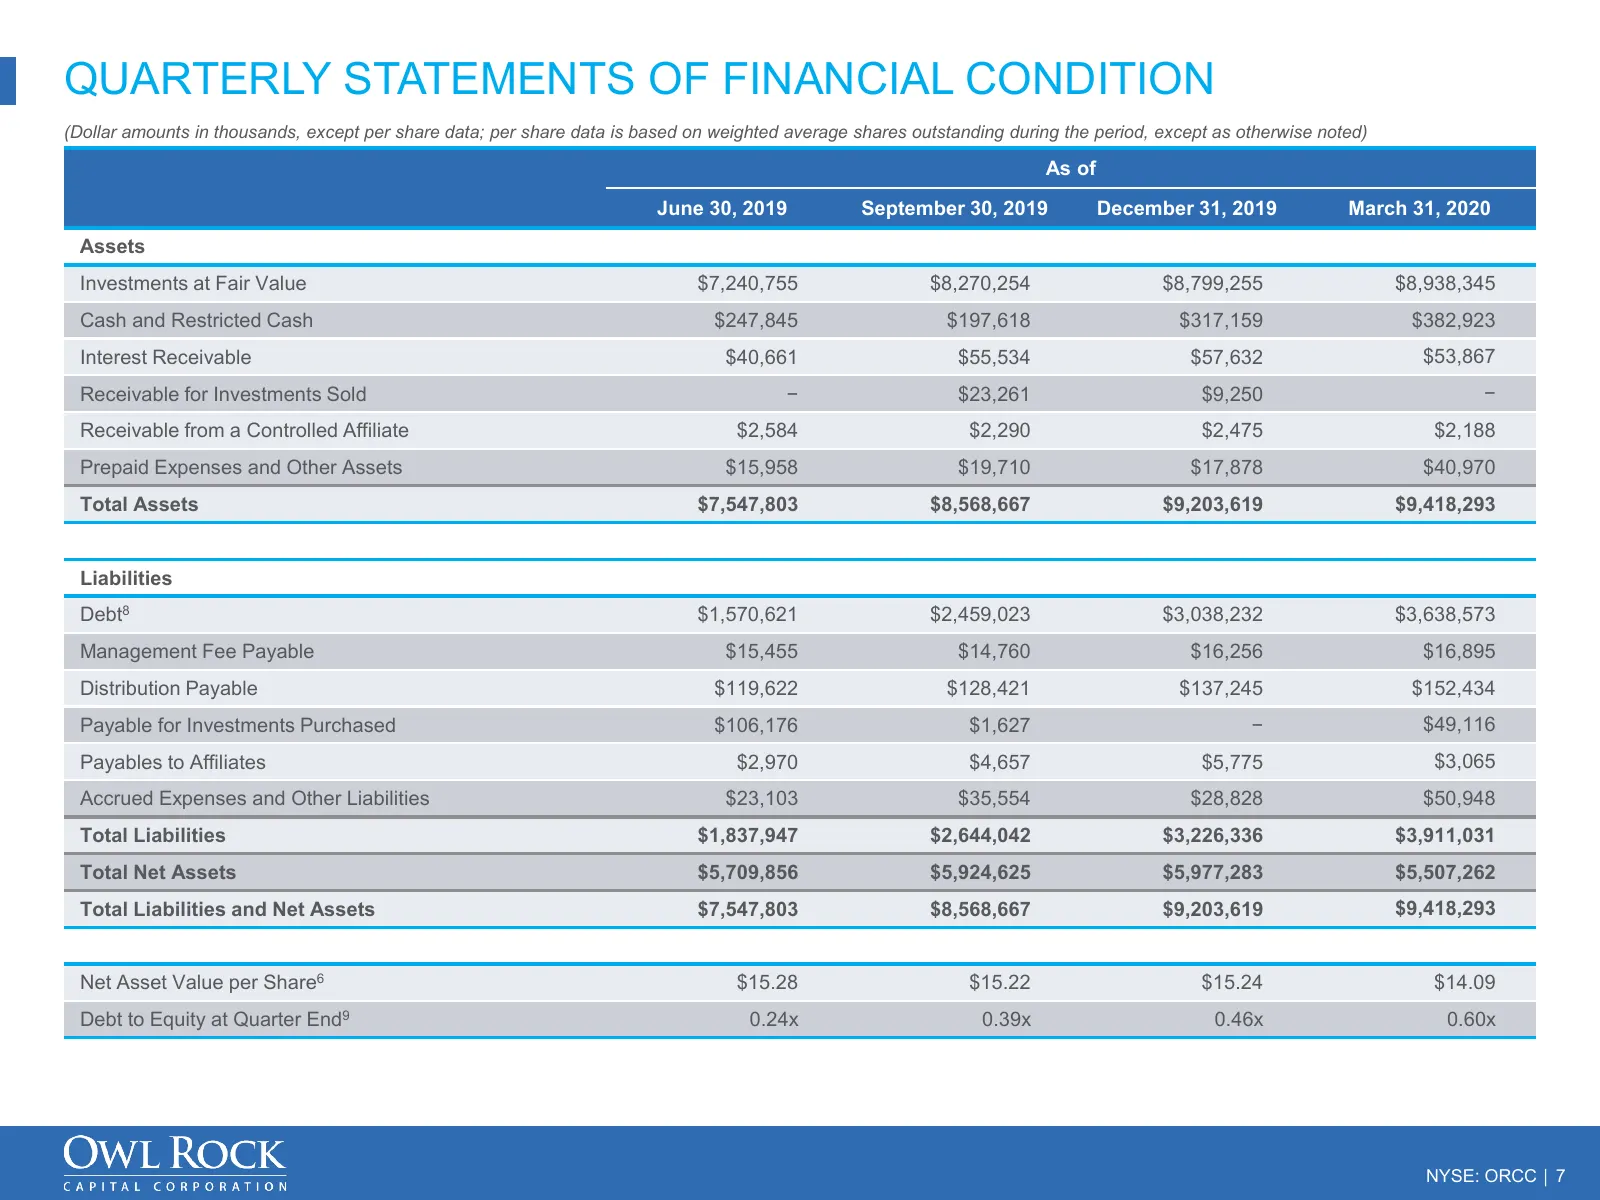
QUARTERLY STATEMENTS OF FINANCIAL CONDITION (Dollar amounts in thousands, except per share data; per share data is based on weighted average shares outstanding during the period, except as otherwise noted) As of June 30, 2019 September 30, 2019 December 31, 2019 March 31, 2020 Assets Investments at
Slide 8: Quarterly Operating Results Detail
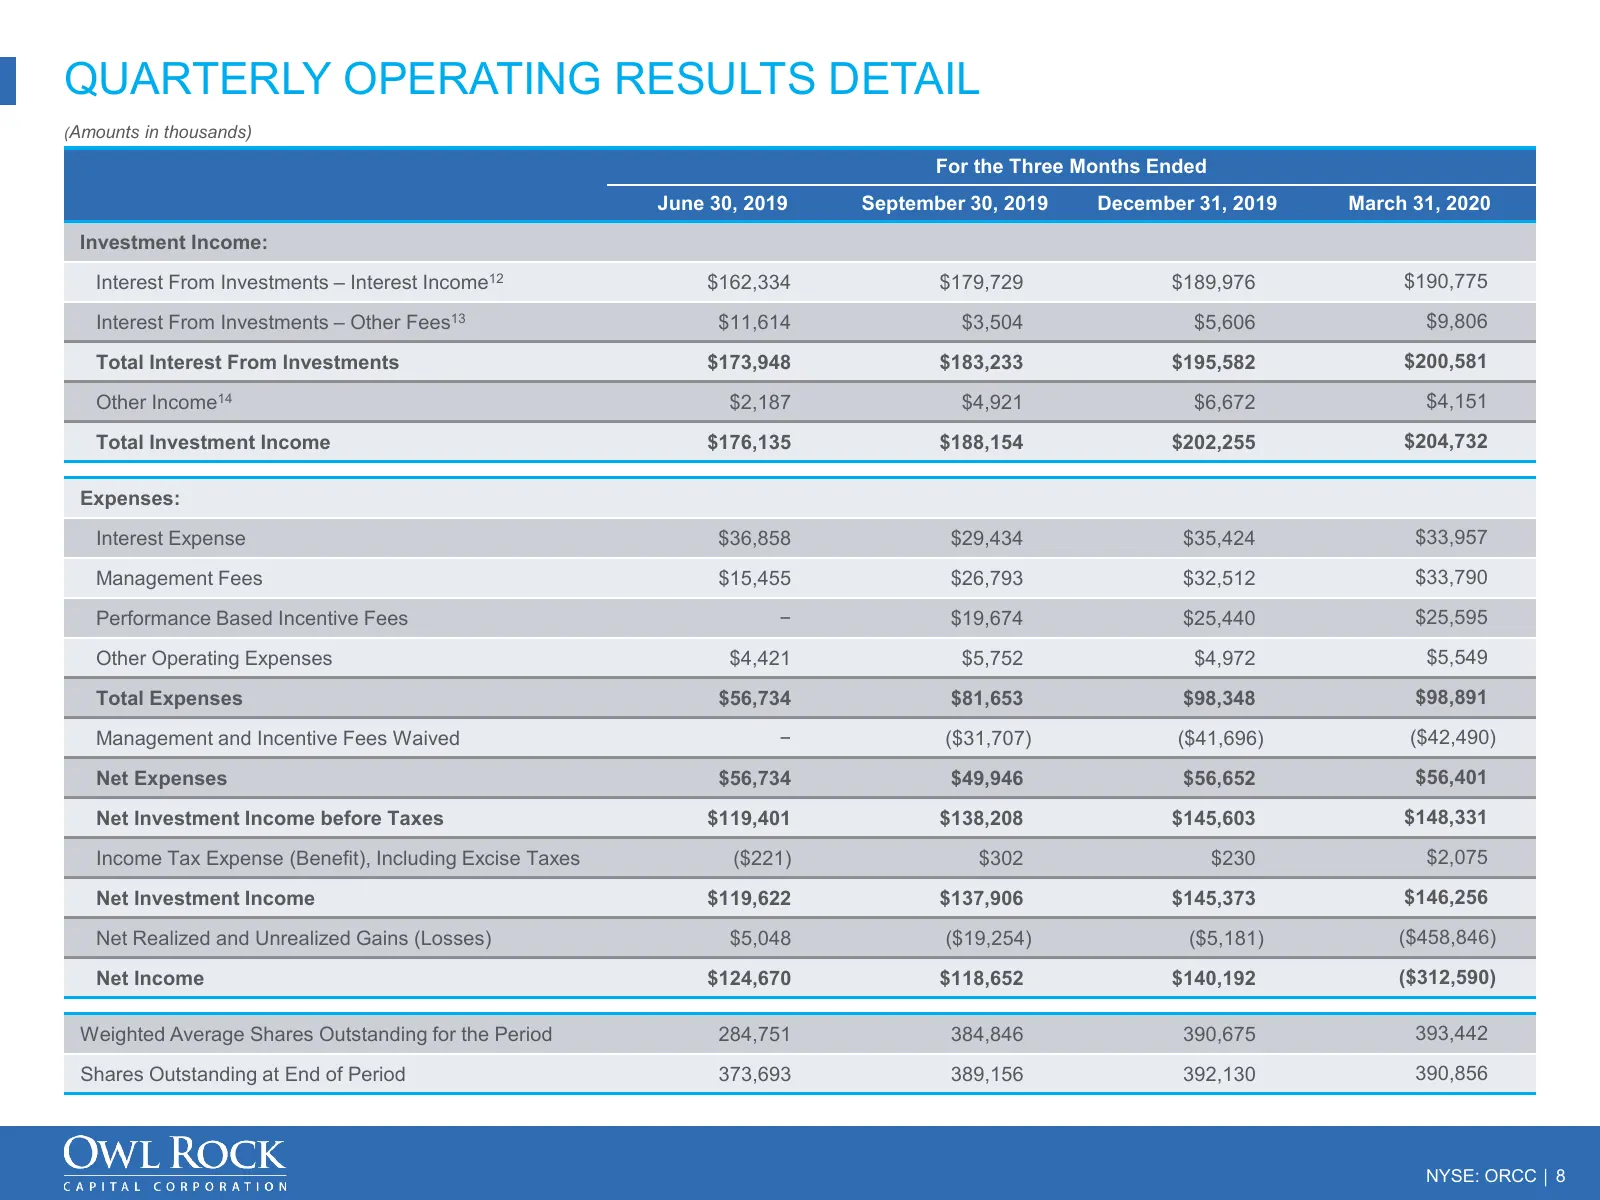
QUARTERLY OPERATING RESULTS DETAIL (Amounts in thousands) For the Three Months Ended June 30, 2019 September 30, 2019 December 31, 2019 March 31, 2020 Investment Income: Interest From Investments – Interest Income12 $162,334 $179,729 $189,976 $190,775 Interest From Investments – Other Fees13 $11,614
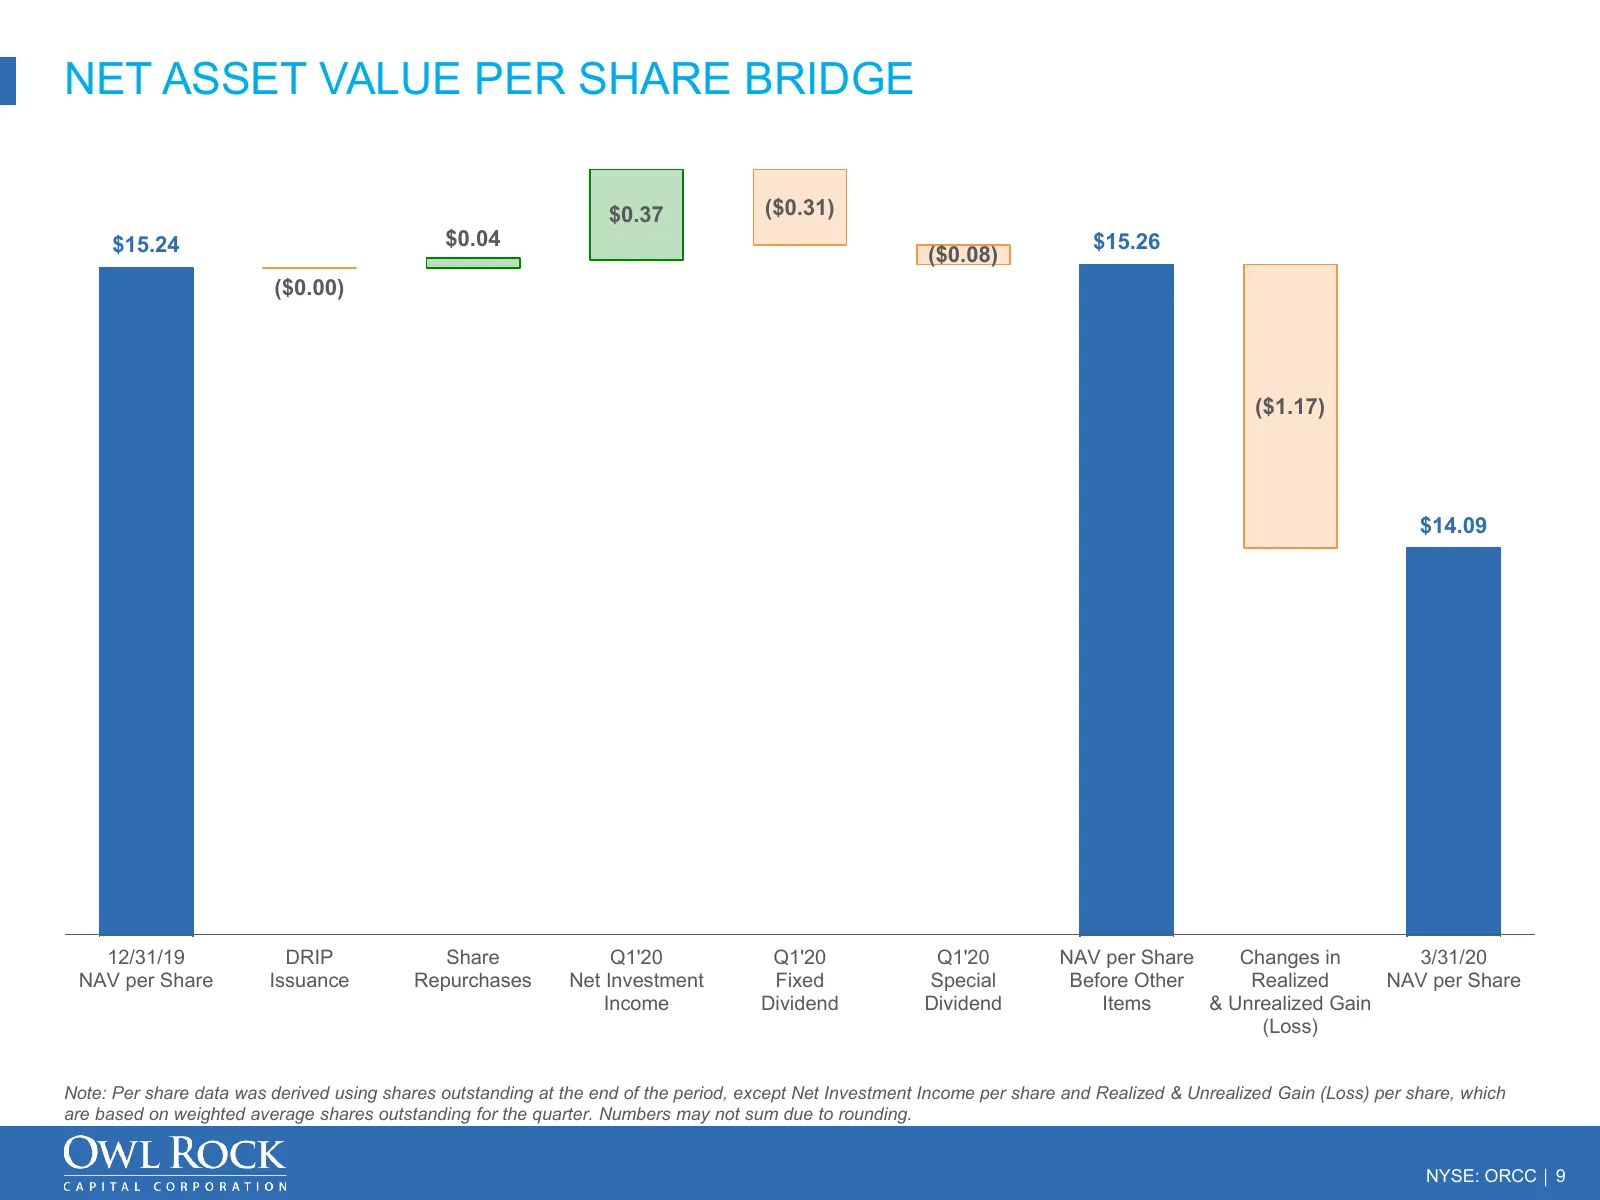
Slide 9: Net Asset Value Per Share Bridge
NET ASSET VALUE PER SHARE BRIDGE $0.37 ($0.31) $15.24 $0.04 $15.26 ($0.08) ($0.00) ($1.17) $14.09 12/31/19 DRIP Share Q1'20 Q1'20 Q1'20 NAV per Share Changes in 3/31/20 NAV per Share Issuance Repurchases Net Investment Fixed Special Before Other Realized NAV per Share Income Dividend Dividend Items
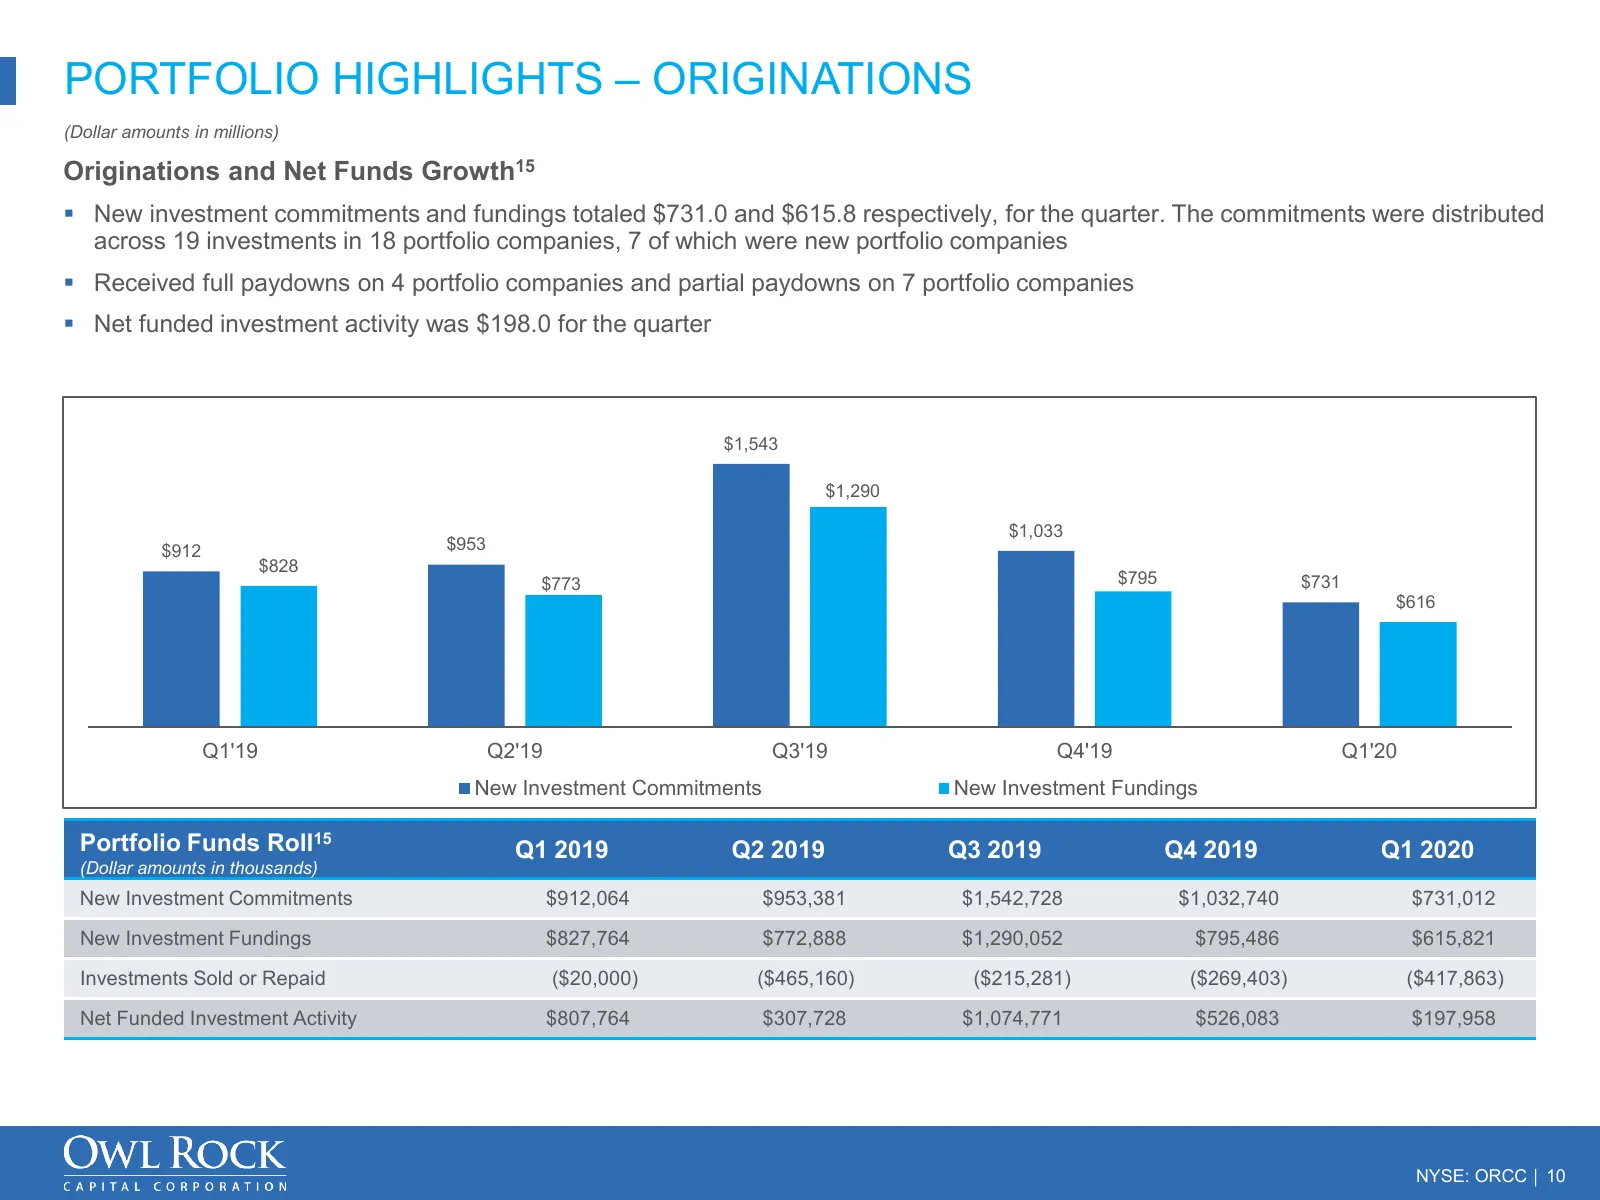
Slide 10: Portfolio Highlights – Originations
PORTFOLIO HIGHLIGHTS – ORIGINATIONS (Dollar amounts in millions) Originations and Net Funds Growth15 New investment commitments and fundings totaled $731.0 and $615.8 respectively, for the quarter. The commitments were distributed across 19 investments in 18 portfolio companies, 7 of which were ne
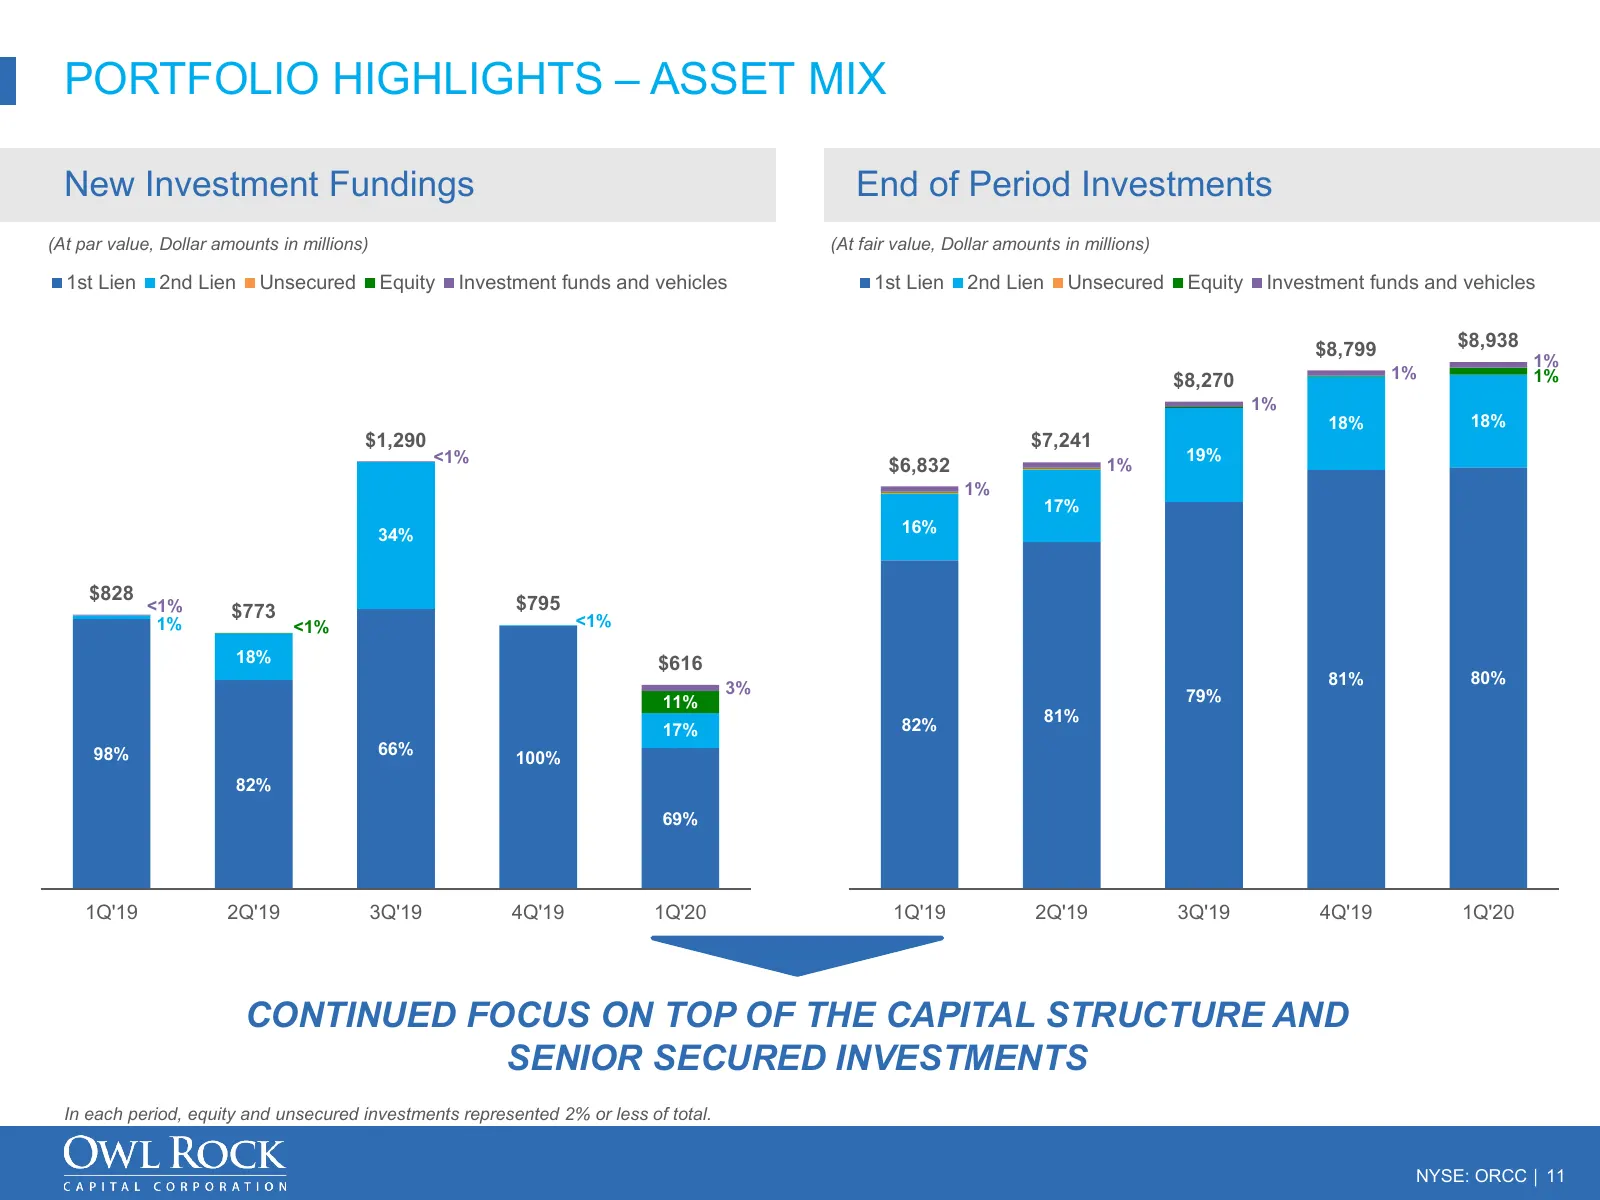
Slide 11: Portfolio Highlights – Asset Mix
PORTFOLIO HIGHLIGHTS – ASSET MIX New Investment Fundings End of Period Investments (At par value, Dollar amounts in millions) (At fair value, Dollar amounts in millions) 1st Lien 2nd Lien Unsecured Equity Investment funds and vehicles 1st Lien 2nd Lien Unsecured Equity Investment funds and vehicles
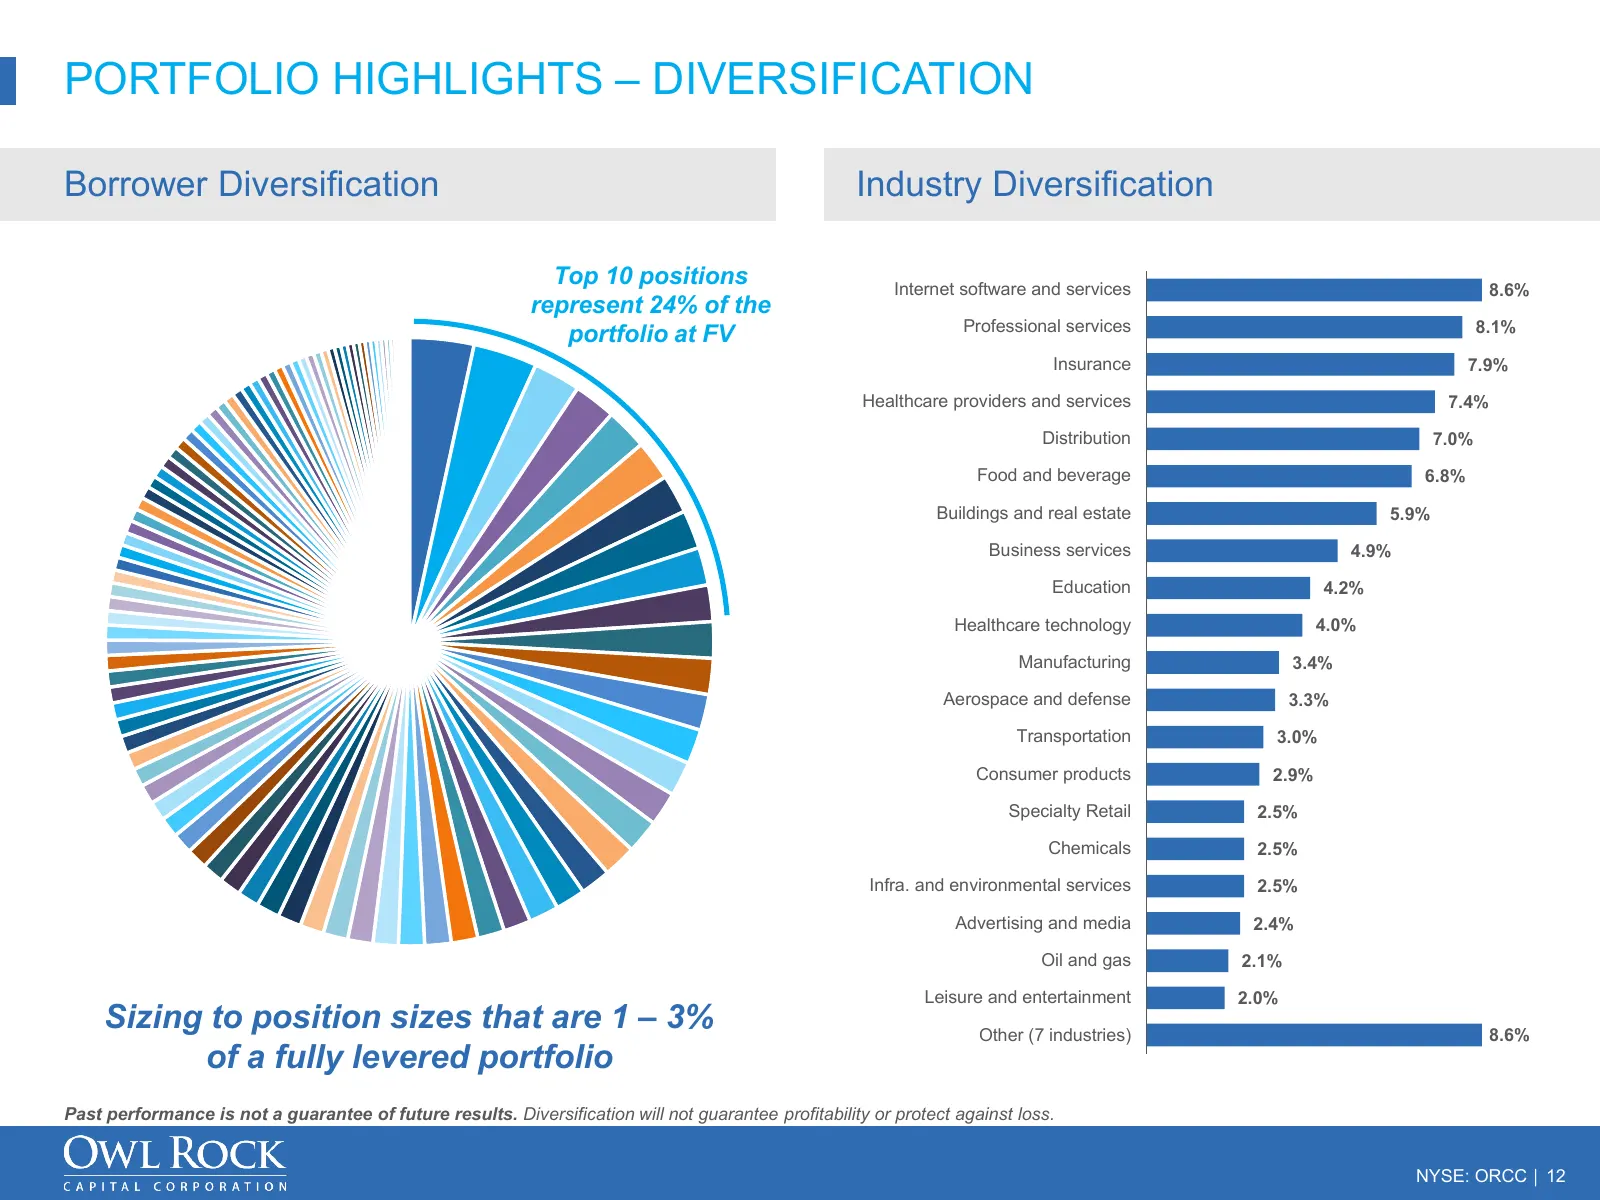
Slide 12: Portfolio Highlights – Diversification
PORTFOLIO HIGHLIGHTS – DIVERSIFICATION Borrower Diversification Industry Diversification Top 10 positions Internet software and services 8.6% represent 24% of the Professional services 8.1% portfolio at FV Insurance 7.9% Healthcare providers and services 7.4% Distribution 7.0% Food and beverage 6.8%
Slide 13: Portfolio Highlights – Net Interest Margin
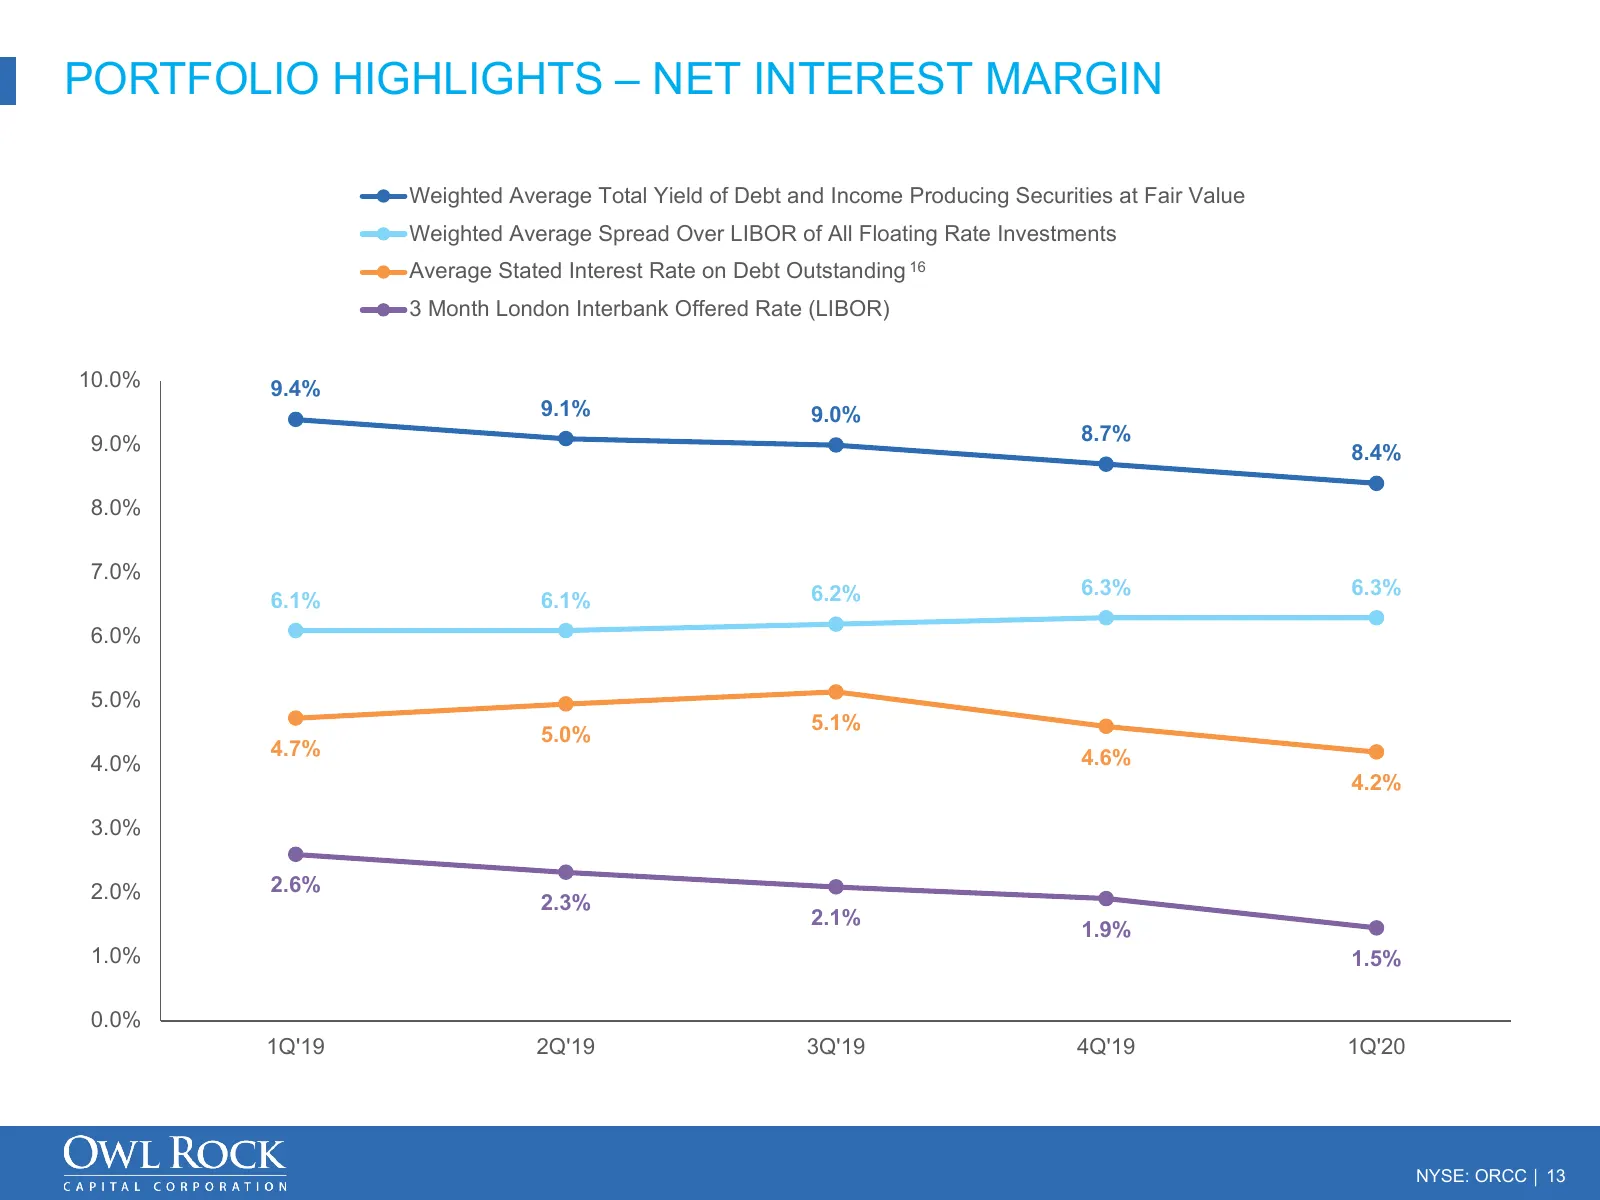
PORTFOLIO HIGHLIGHTS – NET INTEREST MARGIN Weighted Average Total Yield of Debt and Income Producing Securities at Fair Value Weighted Average Spread Over LIBOR of All Floating Rate Investments Average Stated Interest Rate on Debt Outstanding 16 3 Month London Interbank Offered Rate (LIBOR) 10.0% 9.
Slide 14: Portfolio Highlights – Portfolio Ratings
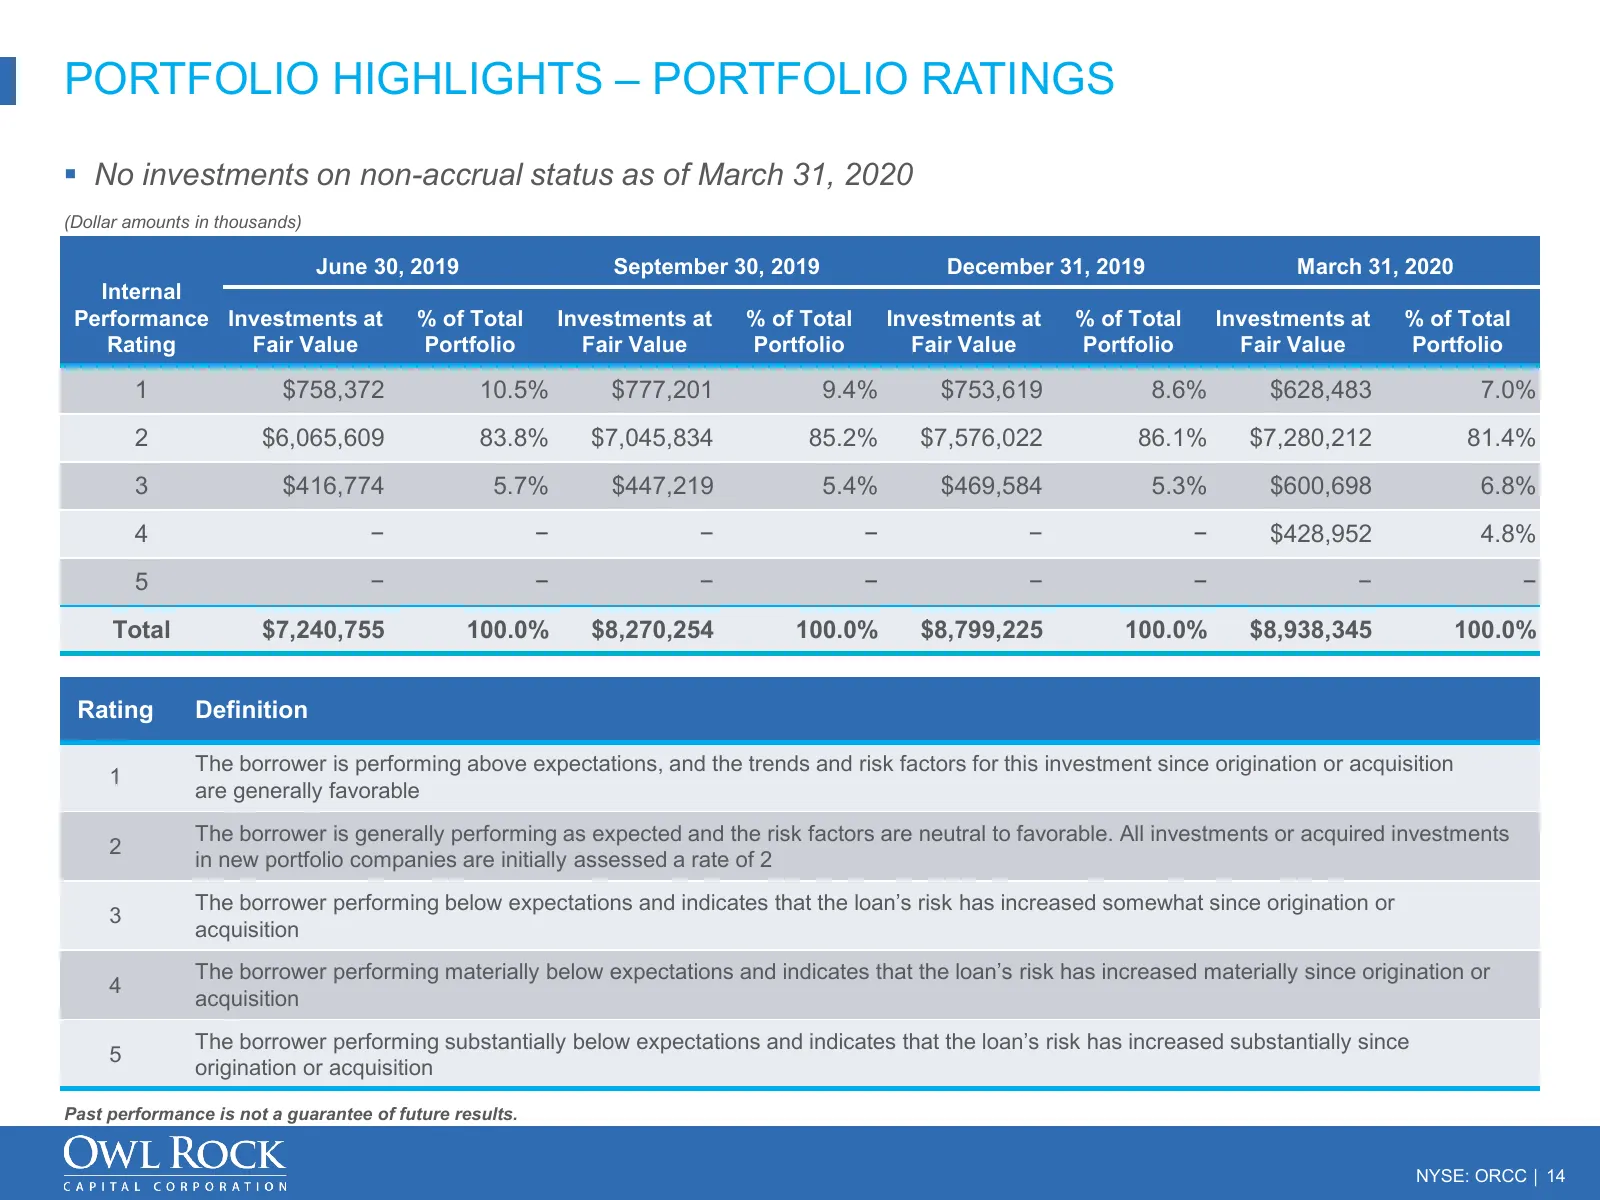
PORTFOLIO HIGHLIGHTS – PORTFOLIO RATINGS No investments on non-accrual status as of March 31, 2020 (Dollar amounts in thousands) June 30, 2019 September 30, 2019 December 31, 2019 March 31, 2020 Internal Performance Investments at % of Total Investments at % of Total Investments at % of Total Inve
Slide 15: Diverse Access to Financing with Well Laddered Maturities
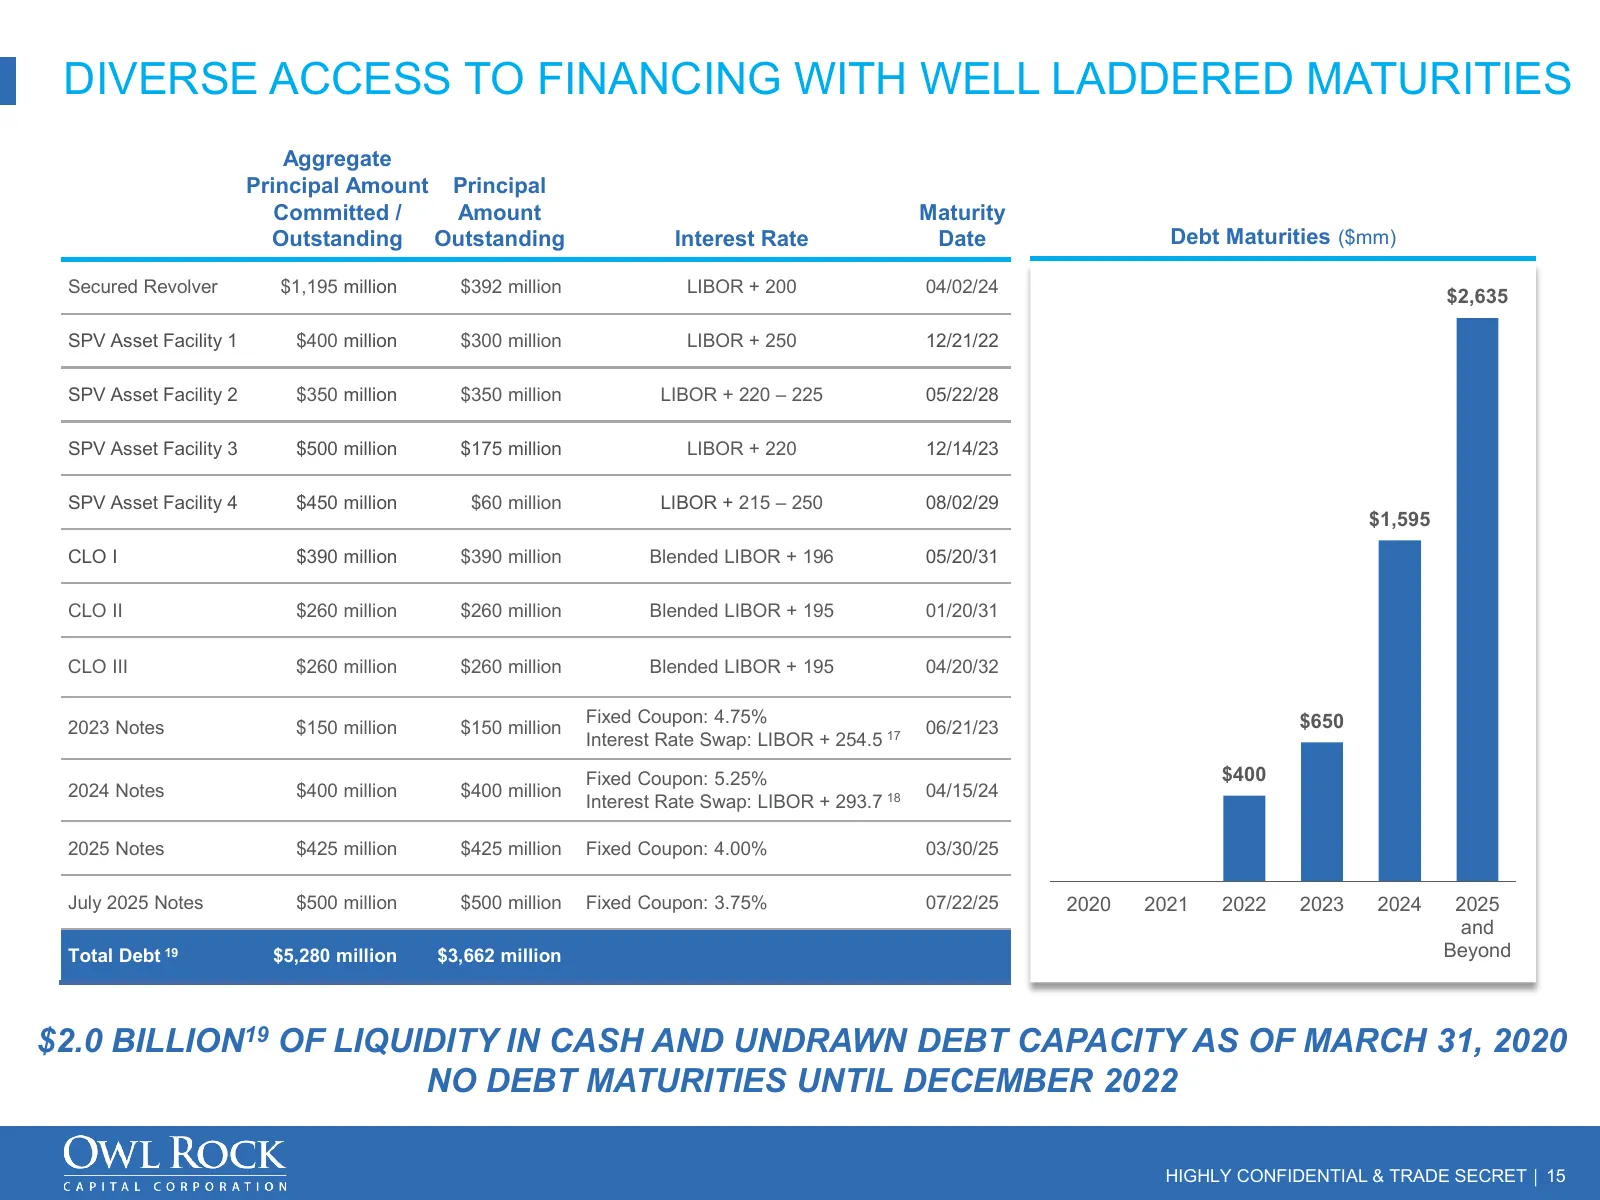
DIVERSE ACCESS TO FINANCING WITH WELL LADDERED MATURITIES Aggregate Principal Amount Principal Committed / Amount Maturity Outstanding Outstanding Interest Rate Date Debt Maturities ($mm) Secured Revolver $1,195 million $392 million LIBOR + 200 04/02/24 $2,635 SPV Asset Facility 1 $400 million $300
Slide 16: Distribution Information
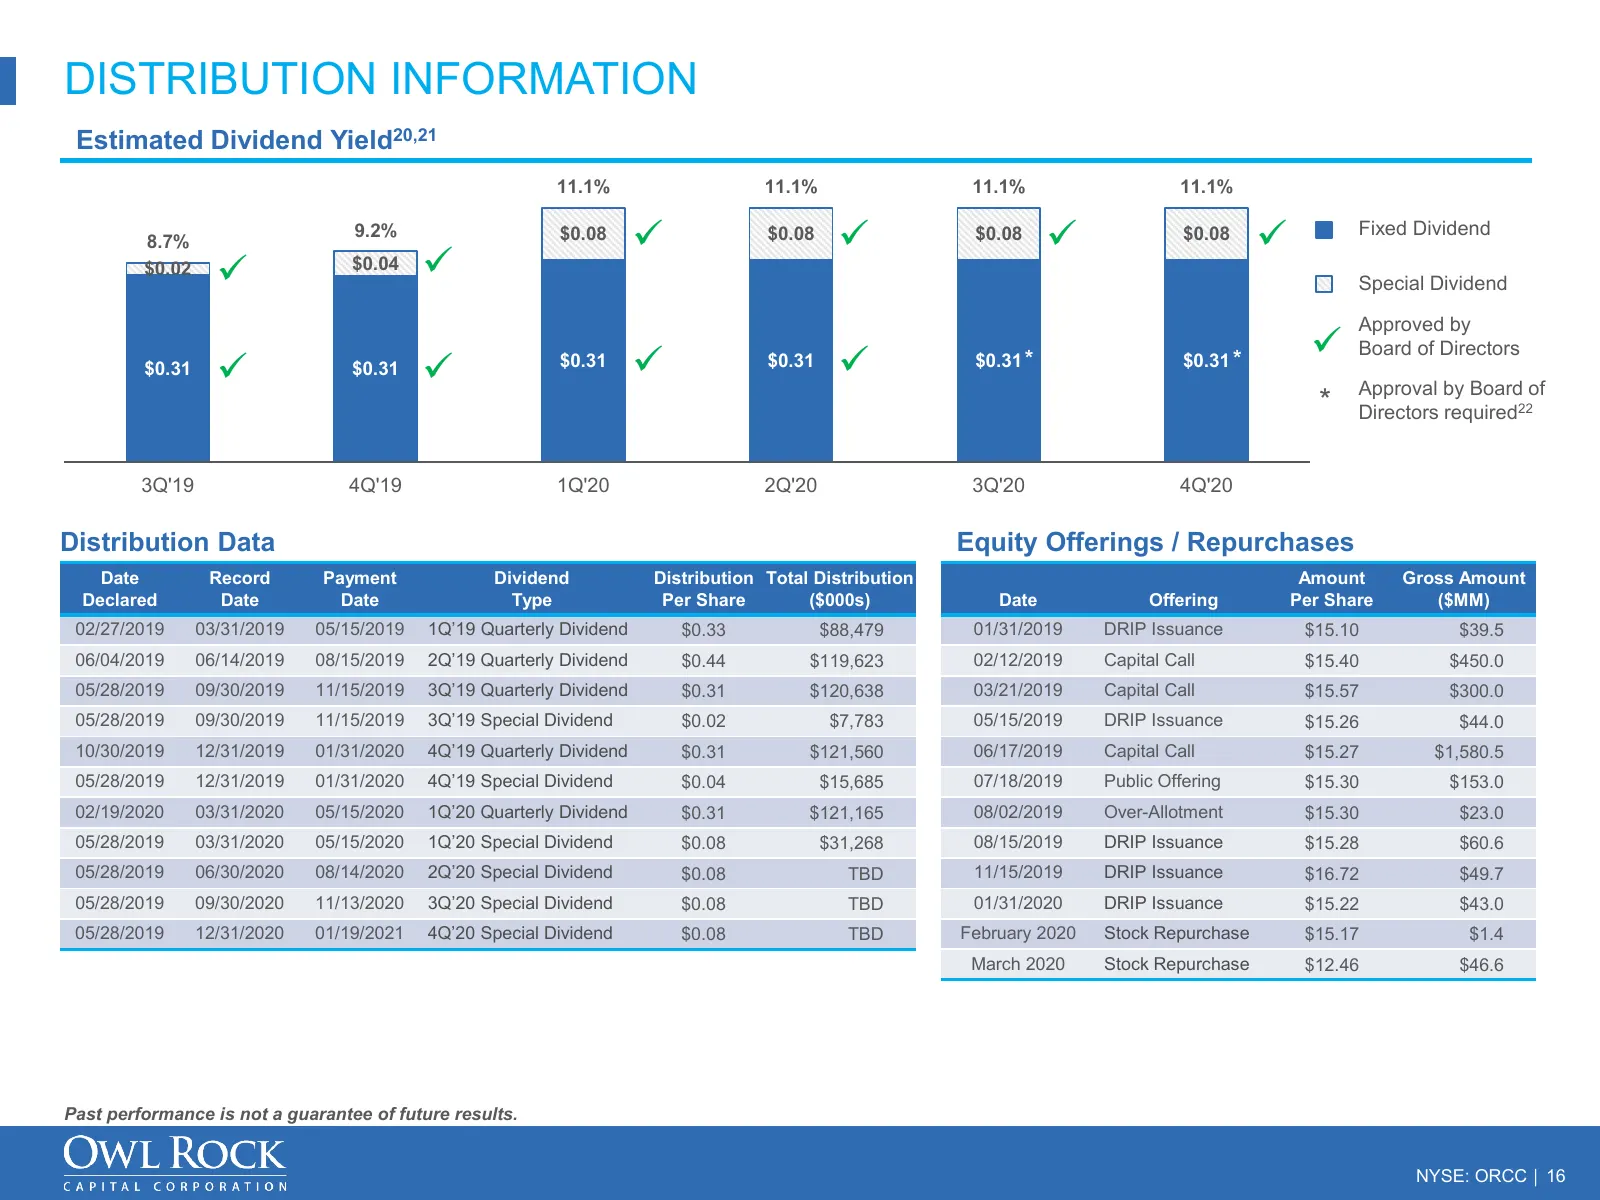
DISTRIBUTION INFORMATION Estimated Dividend Yield20,21 11.1% 11.1% 11.1% 11.1% 8.7% 9.2% $0.08 $0.08 $0.08 $0.08 Fixed Dividend $0.02 $0.04 Special Dividend Approved by $0.31 * $0.31 * Board of Directors $0.31 $0.31 $0.31 $0.31 Approval by Board of * Directors required22 3Q'19
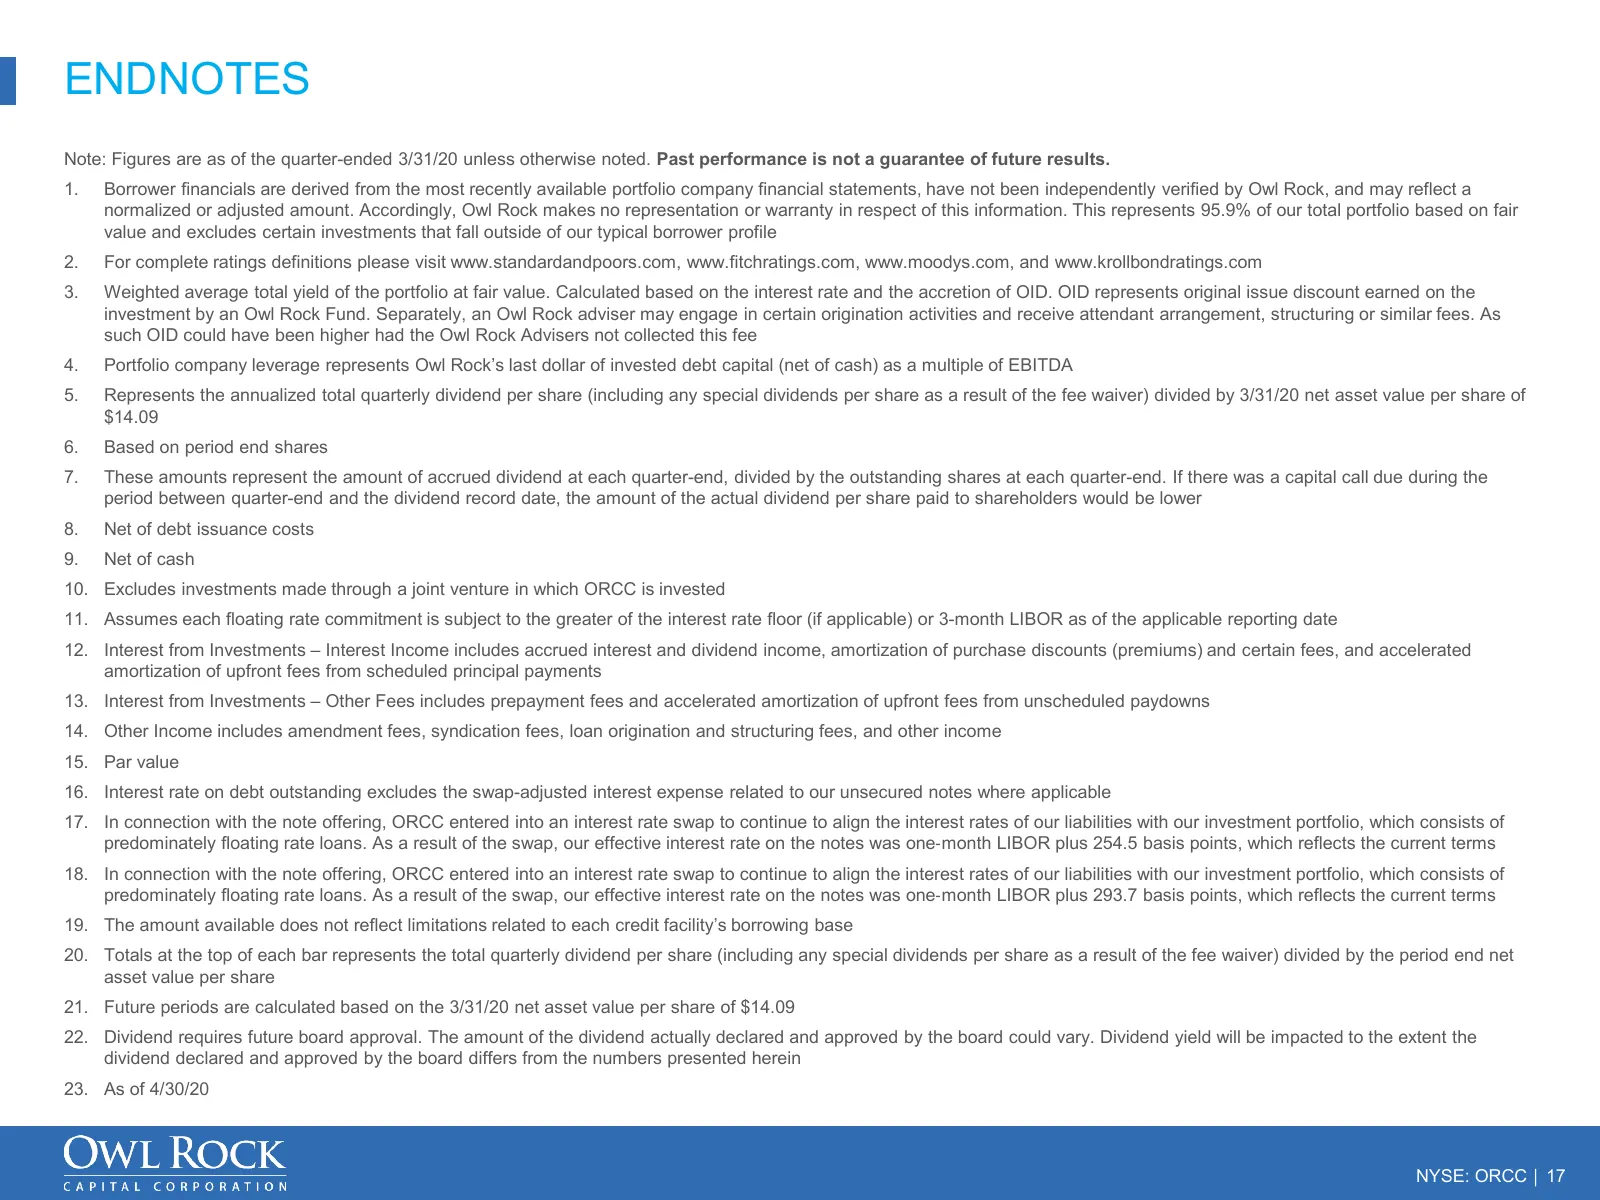
Slide 17: Endnotes
ENDNOTES Note: Figures are as of the quarter-ended 3/31/20 unless otherwise noted. Past performance is not a guarantee of future results. 1. Borrower financials are derived from the most recently available portfolio company financial statements, have not been independently verified by Owl Rock, and
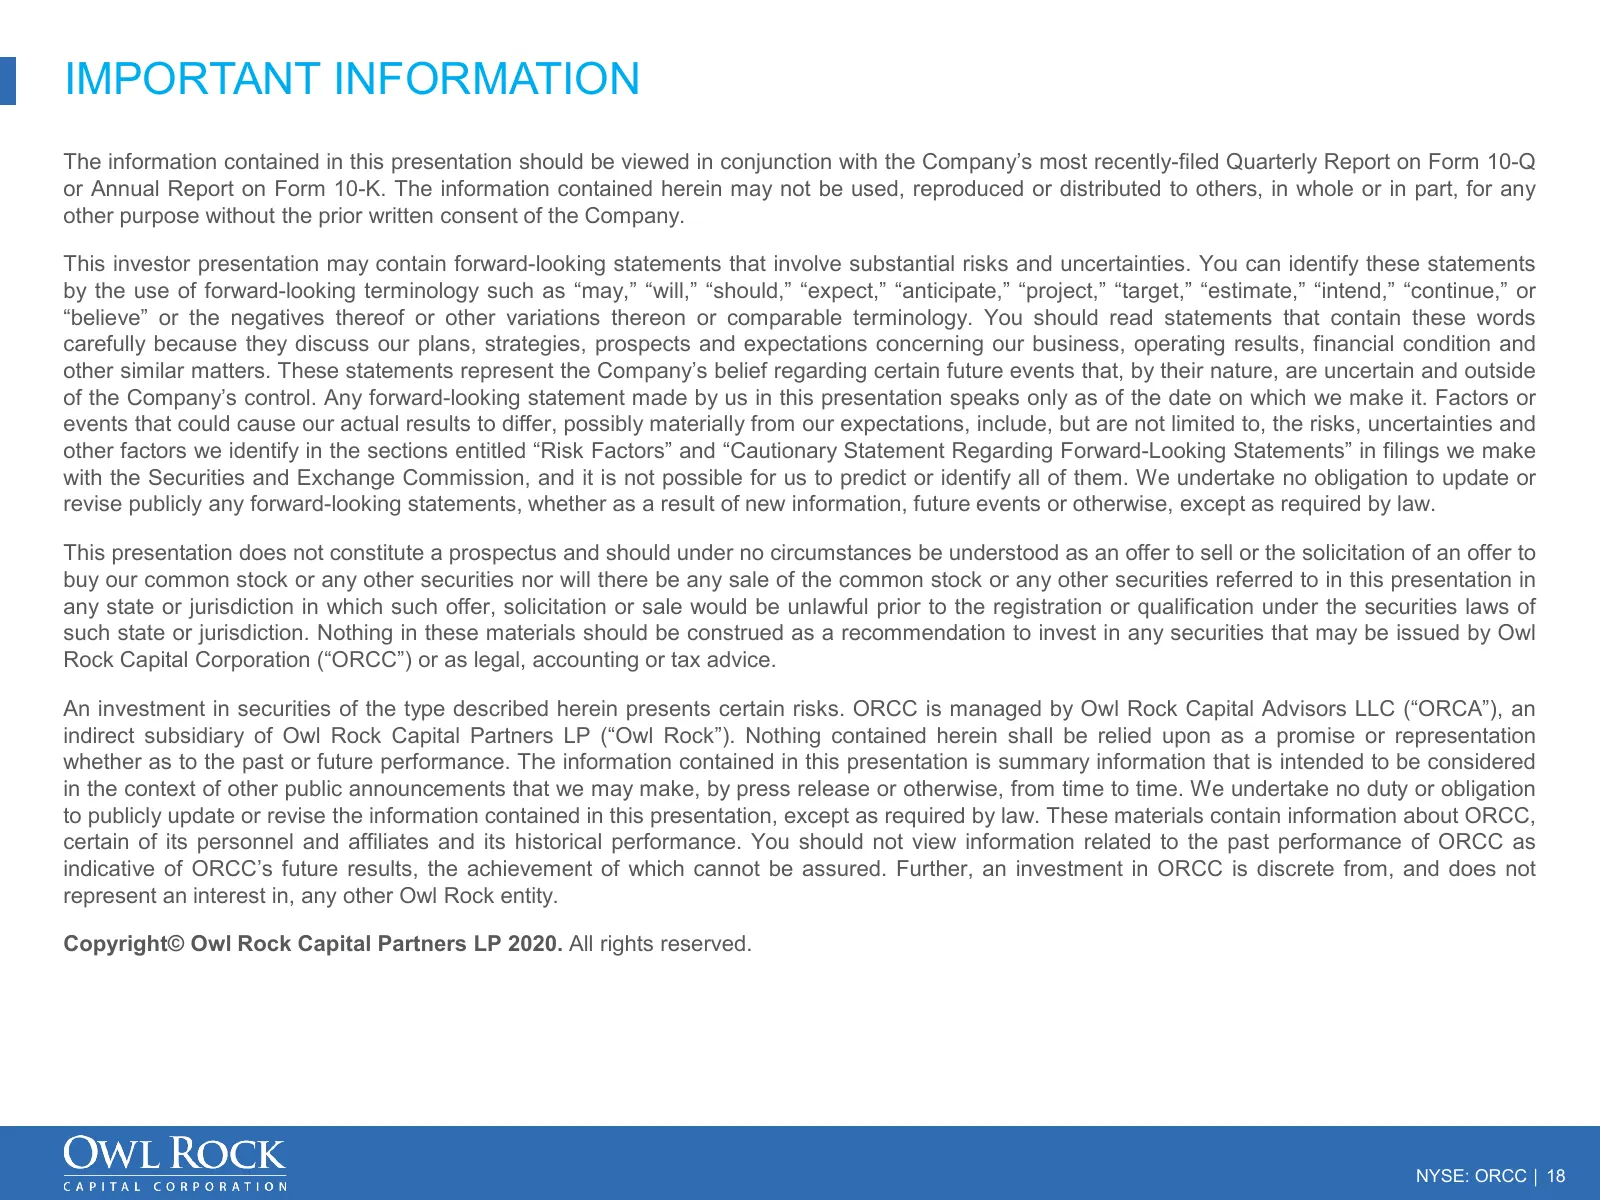
Slide 18: Important Information
IMPORTANT INFORMATION The information contained in this presentation should be viewed in conjunction with the Company’s most recently-filed Quarterly Report on Form 10-Q or Annual Report on Form 10-K. The information contained herein may not be used, reproduced or distributed to others, in whole or
Slide 19: ORCC Investor Relations
ANY QUESTIONS PLEASE CONTACT: ORCC Investor Relations ORCCIR@owlrock.com (212) 651-4705 www.OwlRockCapitalCorporation.com NYSE: ORCC │ 19
Source: company website
More decks from Blue Owl Capital Corporation
 Q3 2026 Earnings Presentation30 slides · November 2026
 Q3 2026 Earnings Presentation21 slides · Sep 30, 2026
 Q2 2026 Earnings Presentation21 slides · Aug 6, 2026
 Q2 2026 Earnings Presentation30 slides · August 2026
 Q1 2026 Earnings Presentation21 slides · May 7, 2026
 Q1 2026 Earnings Presentation31 slides · May 2026