SKF AB Class A · OMXSTO:SKF_A
SKF AB Class A — Q3 2014 Earnings Presentation
35 slides from SKF AB Class A's earnings presentation, Oct 15, 2014
Slide 1: SKF Nine-month results 2014
SKF Nine-month results 2014 Tom Johnstone, President and CEO 15 October 2014
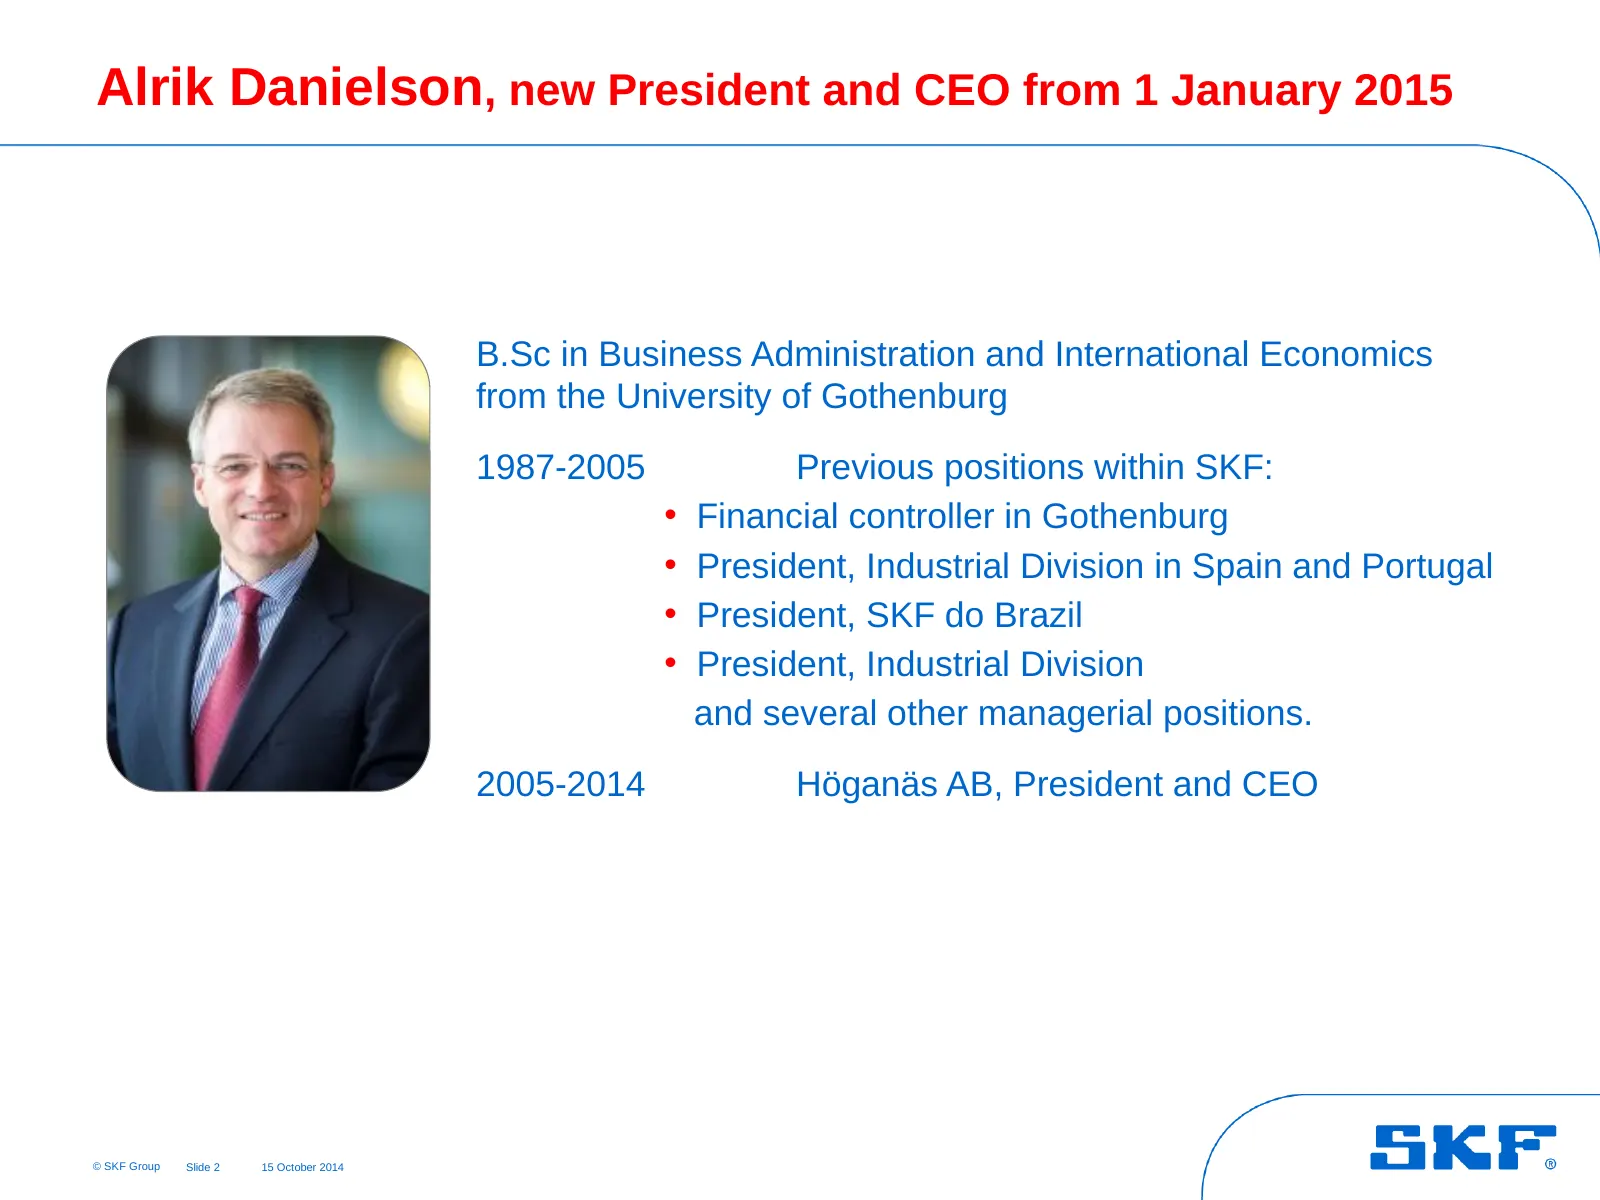
Slide 2: Alrik Danielson, new President and CEO from 1 January 2015
Alrik Danielson, new President and CEO from 1 January 2015 B.Sc in Business Administration and International Economics from the University of Gothenburg 1987-2005 Previous positions within SKF: • Financial controller in Gothenburg • President, Industrial Division in Spain and Portugal • President, S
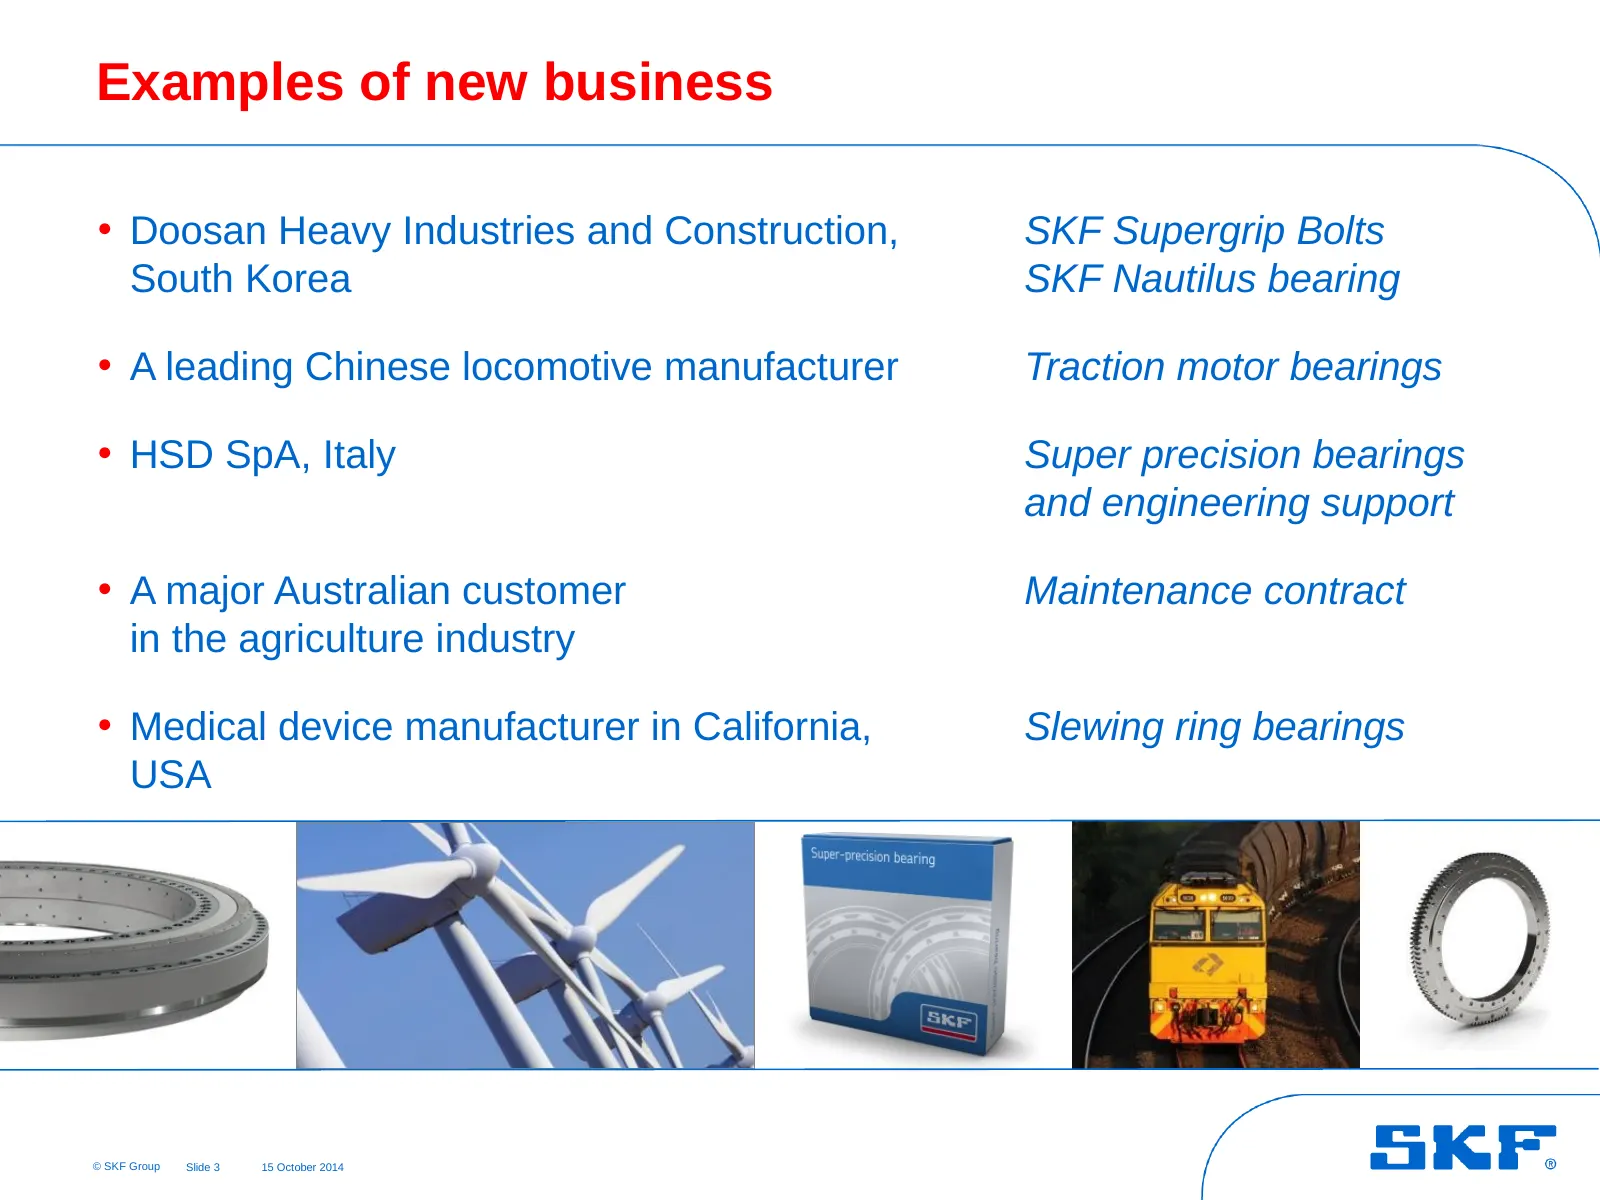
Slide 3: Examples of new business
Examples of new business • Doosan Heavy Industries and Construction, SKF Supergrip Bolts South Korea SKF Nautilus bearing • A leading Chinese locomotive manufacturer Traction motor bearings • HSD SpA, Italy Super precision bearings and engineering support • A major Australian customer Maintenance co
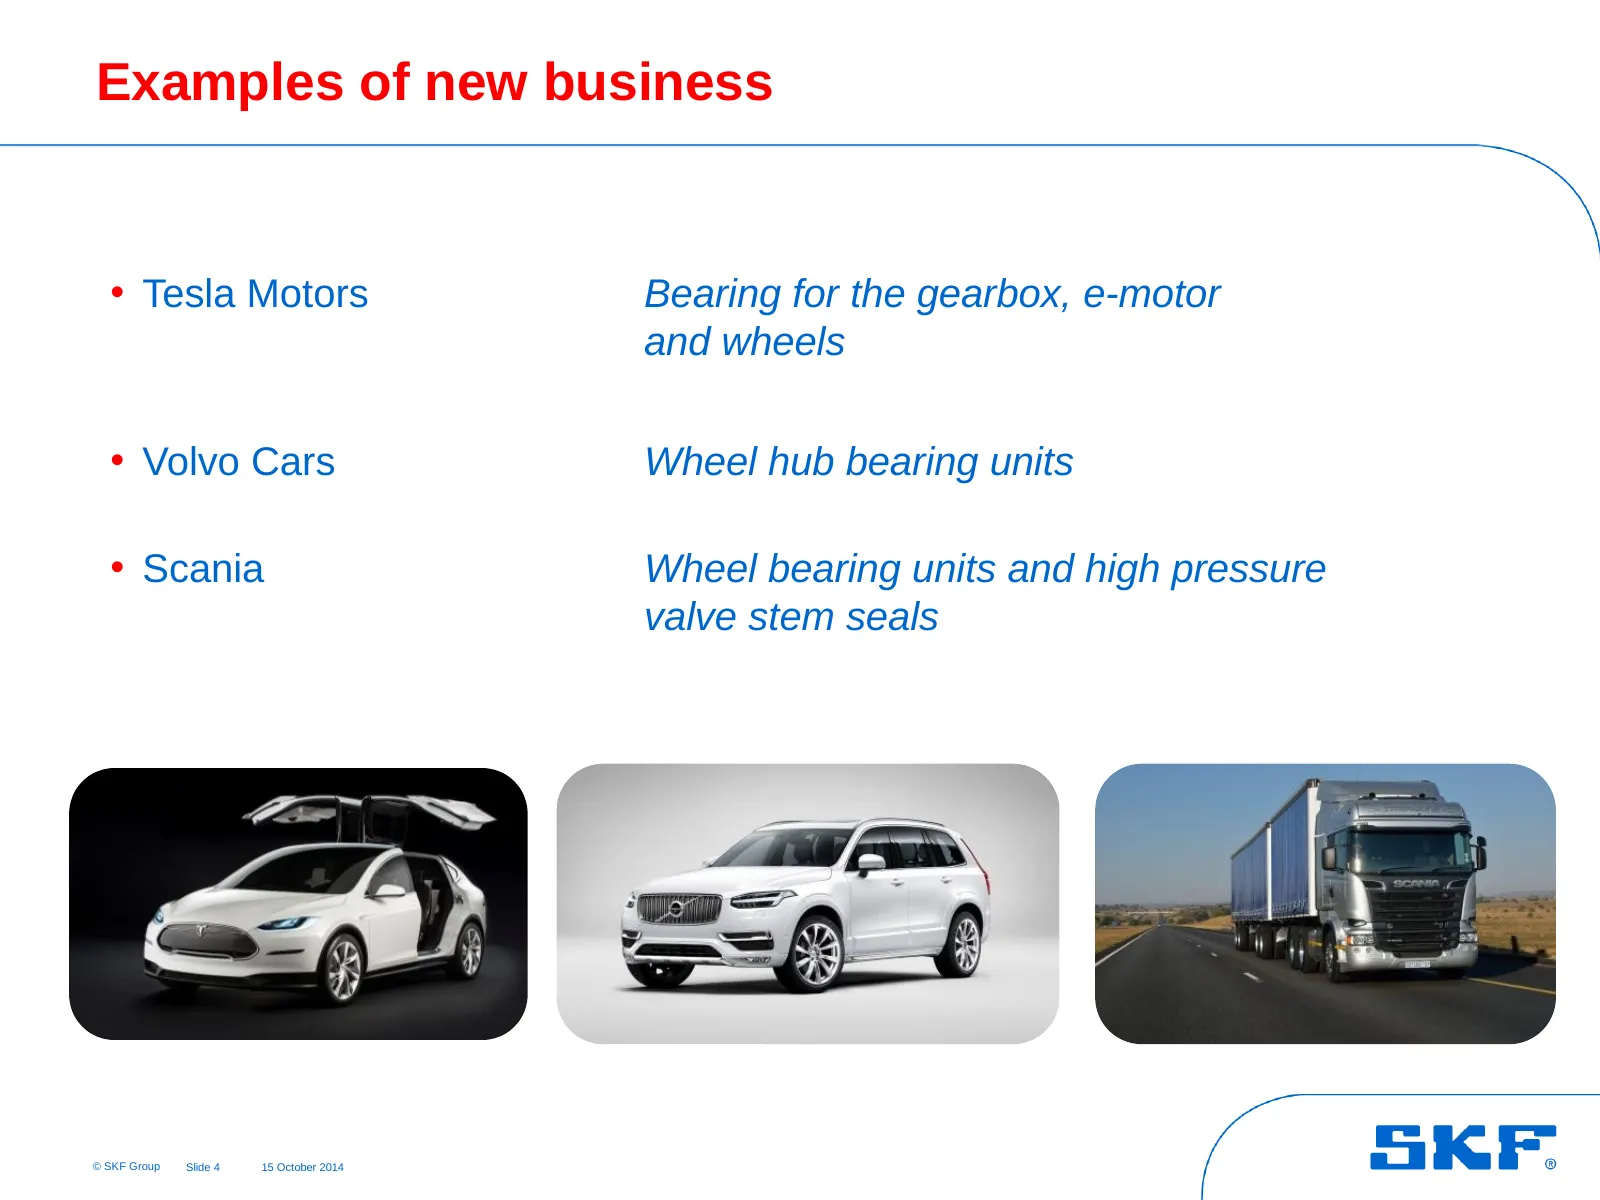
Slide 4: Examples of new business
Examples of new business • Tesla Motors Bearing for the gearbox, e-motor and wheels • Volvo Cars Wheel hub bearing units • Scania Wheel bearing units and high pressure valve stem seals © SKF Group Slide 4 15 October 2014
Slide 5: Customer awards
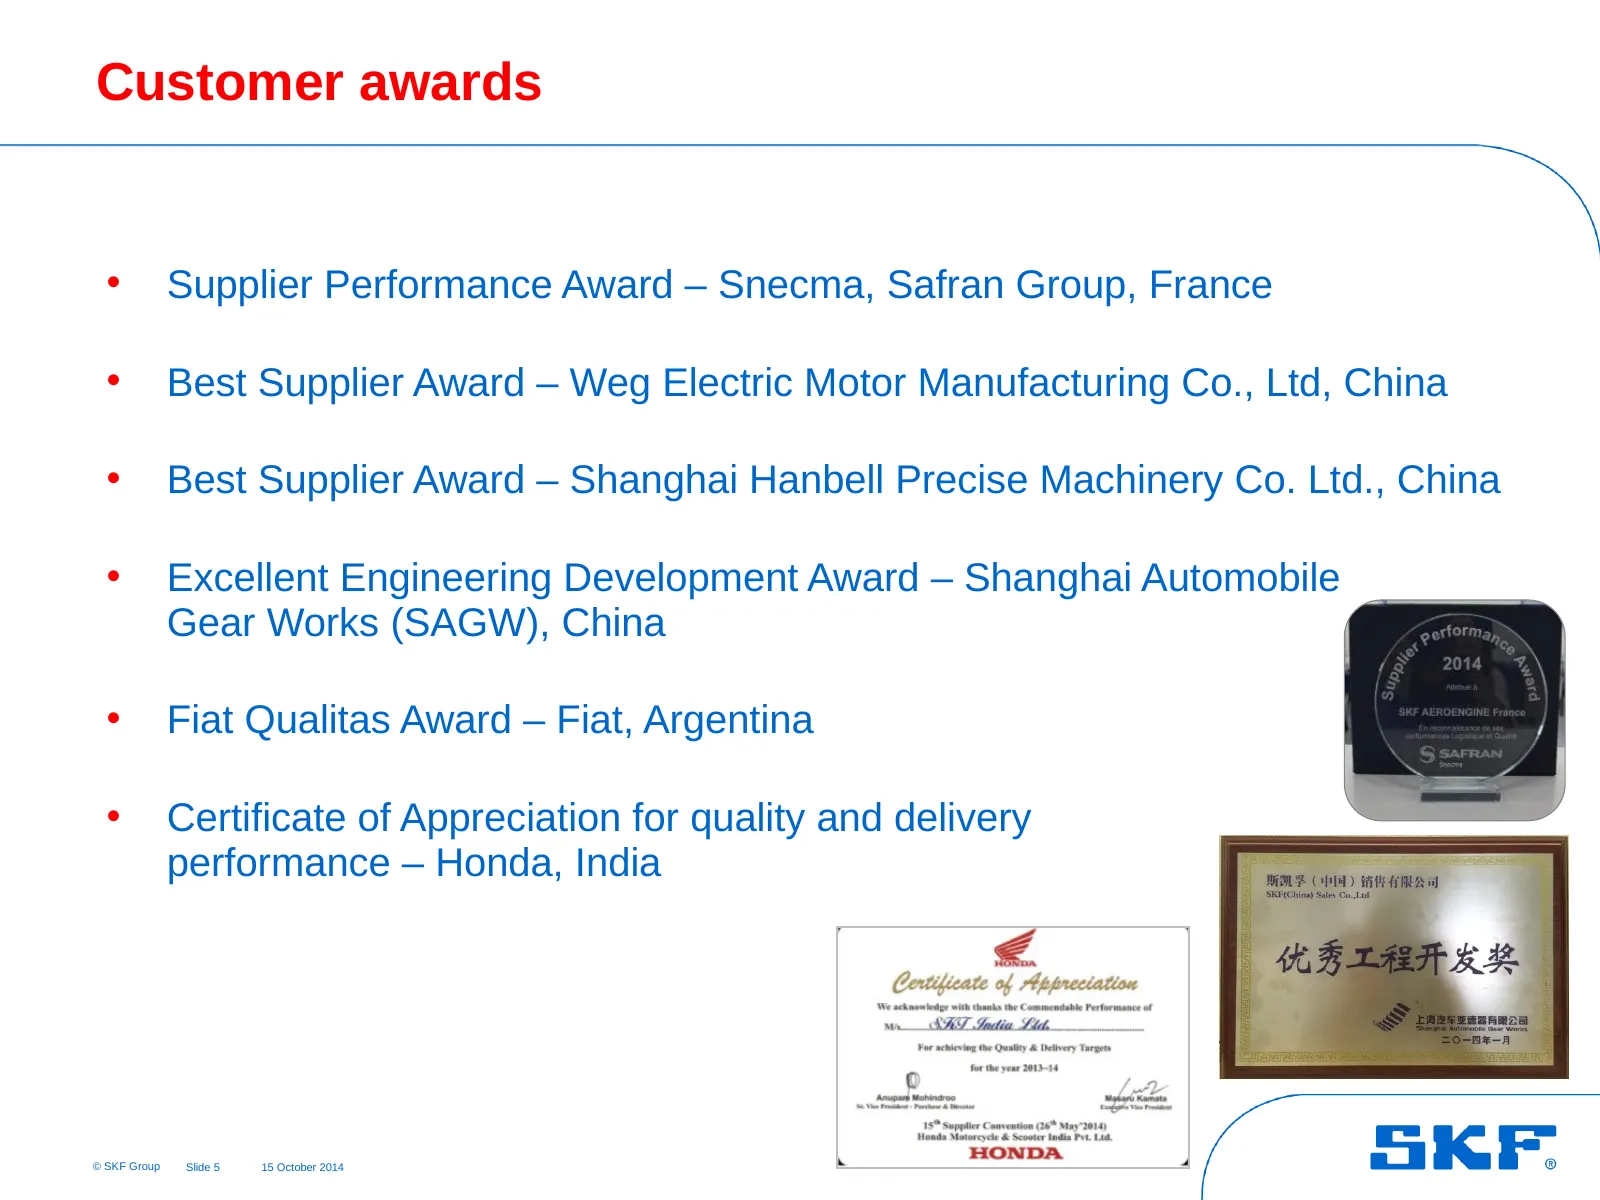
Customer awards • Supplier Performance Award – Snecma, Safran Group, France • Best Supplier Award – Weg Electric Motor Manufacturing Co., Ltd, China • Best Supplier Award – Shanghai Hanbell Precise Machinery Co. Ltd., China • Excellent Engineering Development Award – Shanghai Automobile Gear Works (
Slide 6: Highlights
Highlights • New Kaydon factory at the SKF Campus in Cajamar, Brazil. • New Global Technical Center in the greater Chicago area, US. • For the 15th year in a row, one of the world’s most sustainable companies by the Dow Jones Sustainability World Index (DJSI). • For the 14th consecutive year, a cons
Slide 7: Examples of new products and solutions
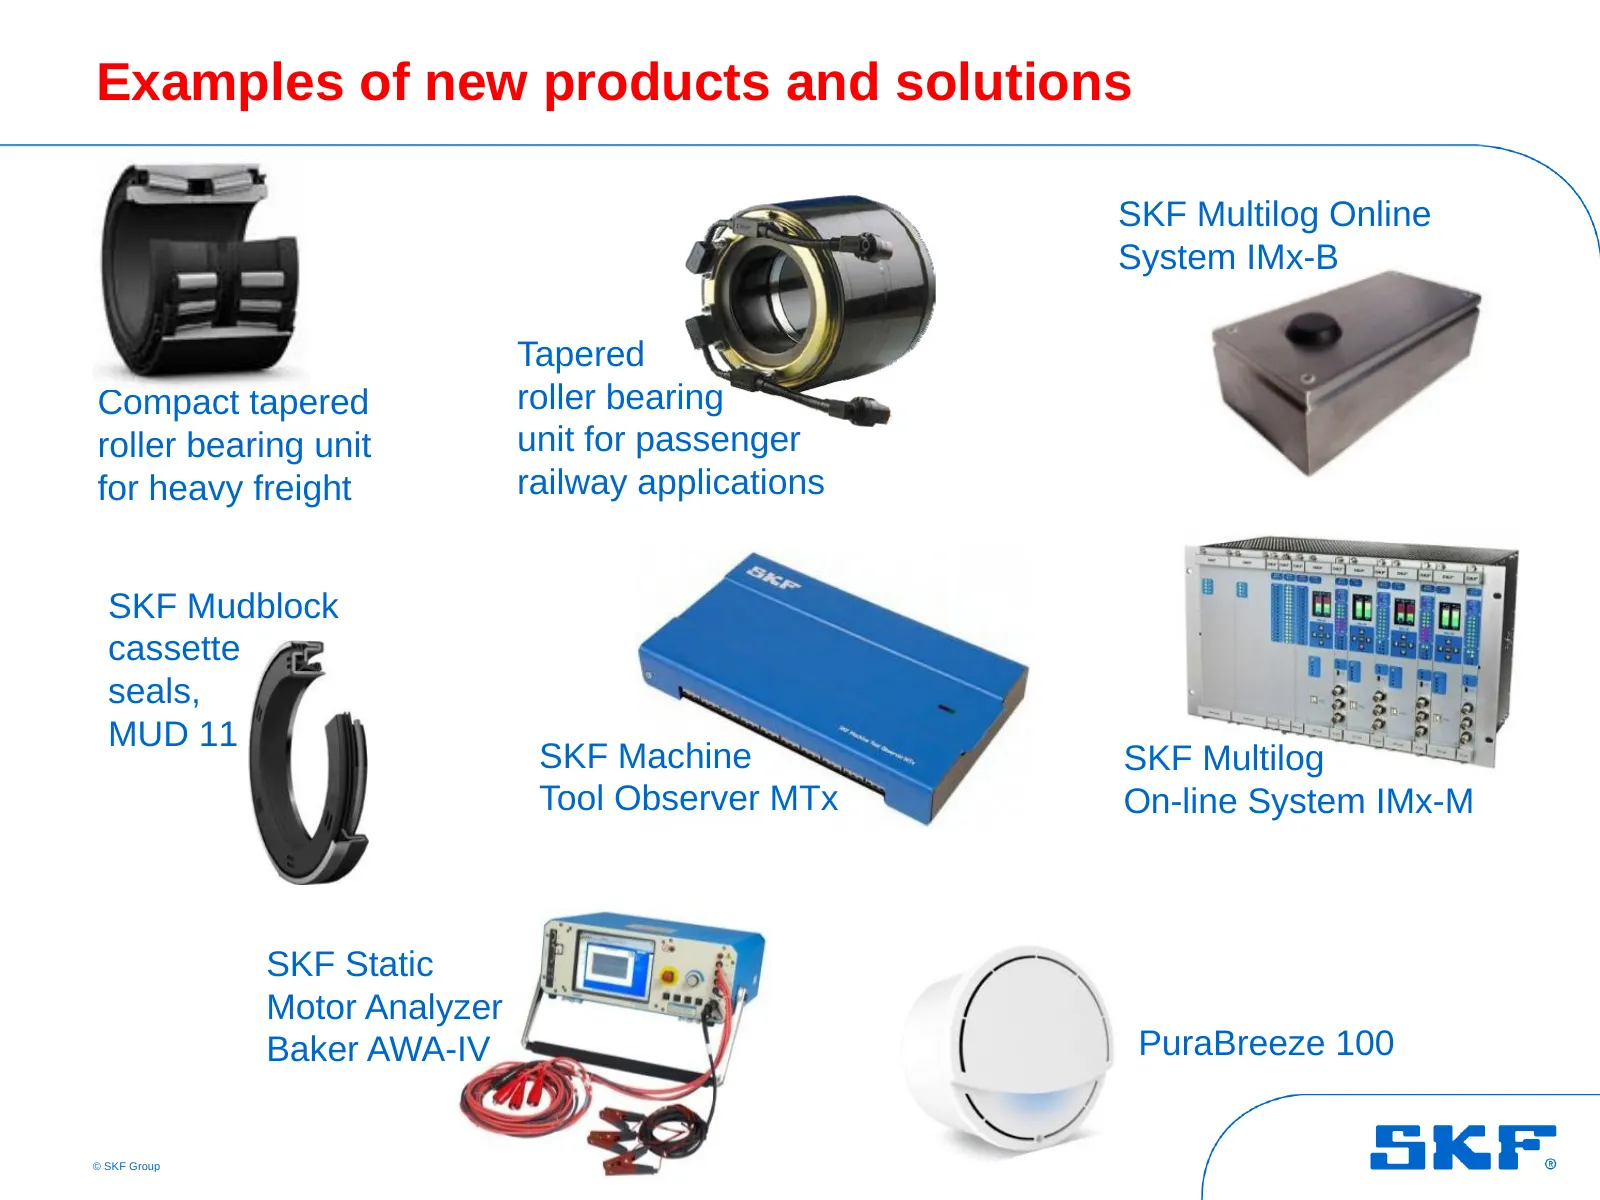
Examples of new products and solutions SKF Multilog Online System IMx-B Tapered Compact tapered roller bearing roller bearing unit unit for passenger for heavy freight railway applications SKF Mudblock cassette seals, MUD 11 SKF Machine SKF Multilog Tool Observer MTx On-line System IMx-M SKF Static
Slide 8: SKF Group – Q3 2014
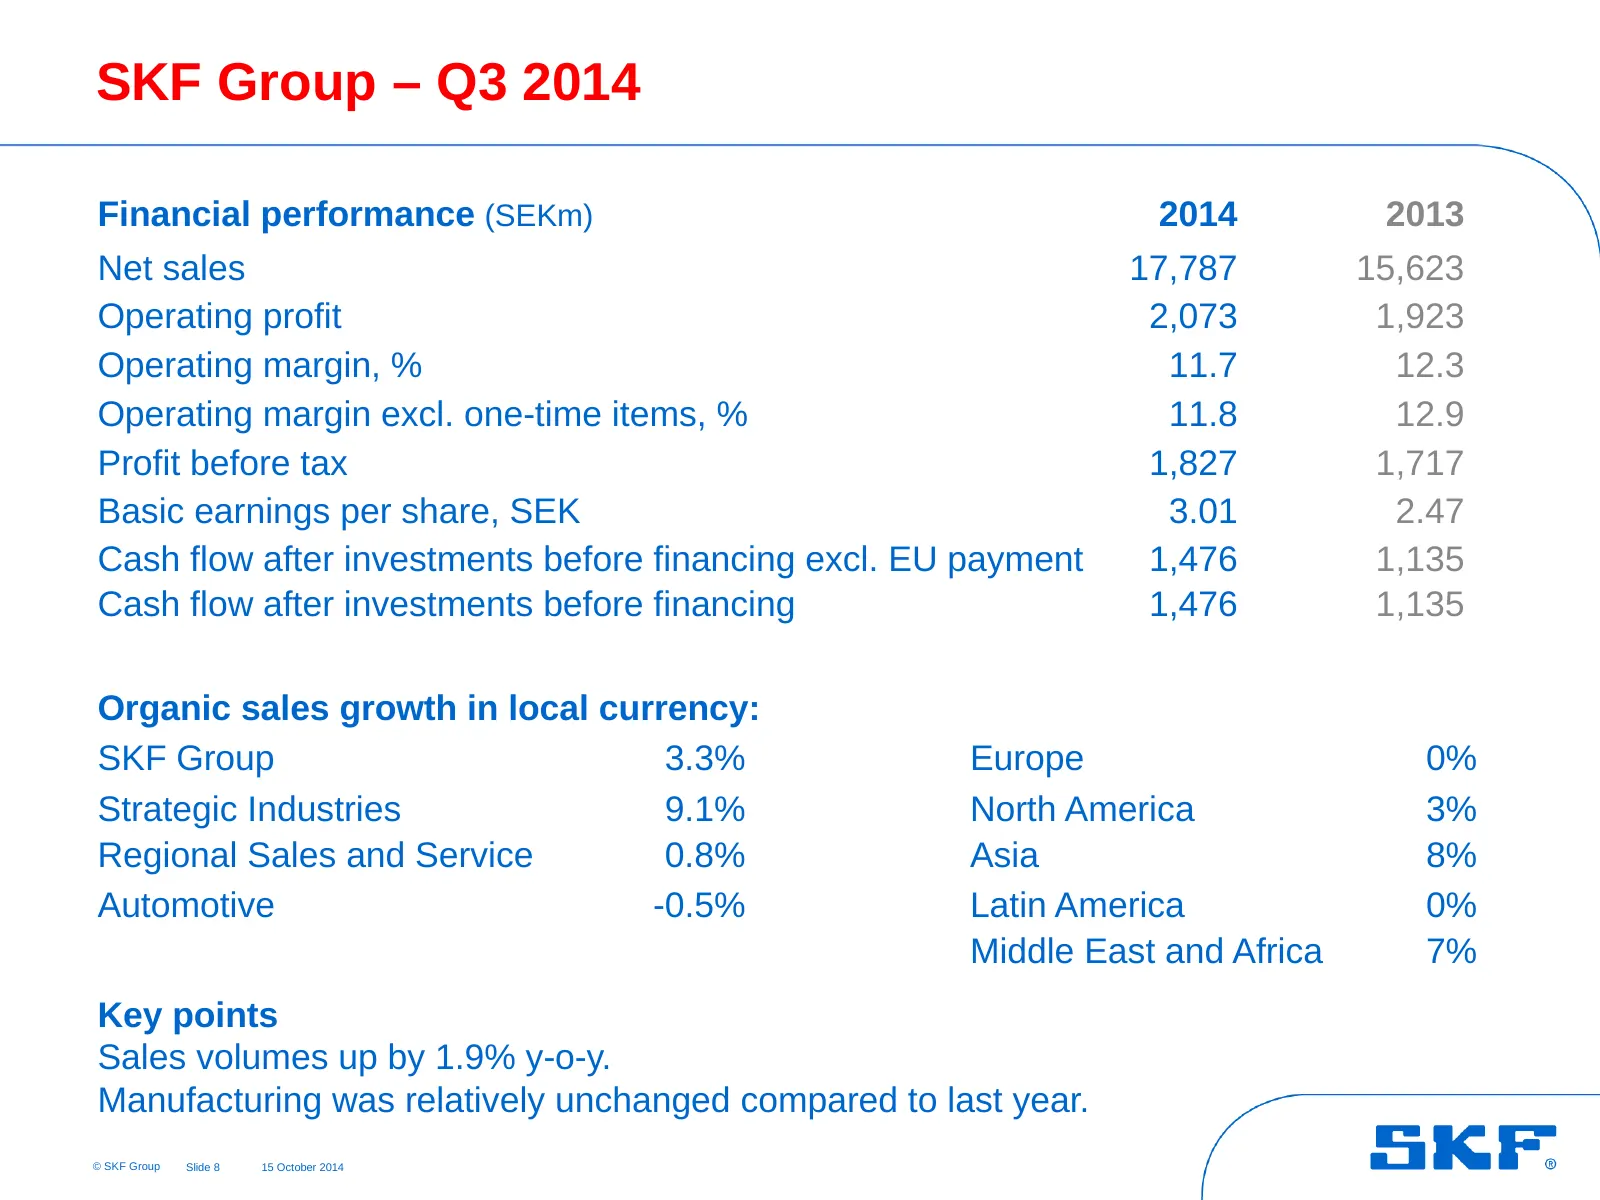
SKF Group – Q3 2014 Financial performance (SEKm) 2014 2013 Net sales 17,787 15,623 Operating profit 2,073 1,923 Operating margin, % 11.7 12.3 Operating margin excl. one-time items, % 11.8 12.9 Profit before tax 1,827 1,717 Basic earnings per share, SEK 3.01 2.47 Cash flow after investments before fi
Slide 9: SKF Group – Nine month 2014
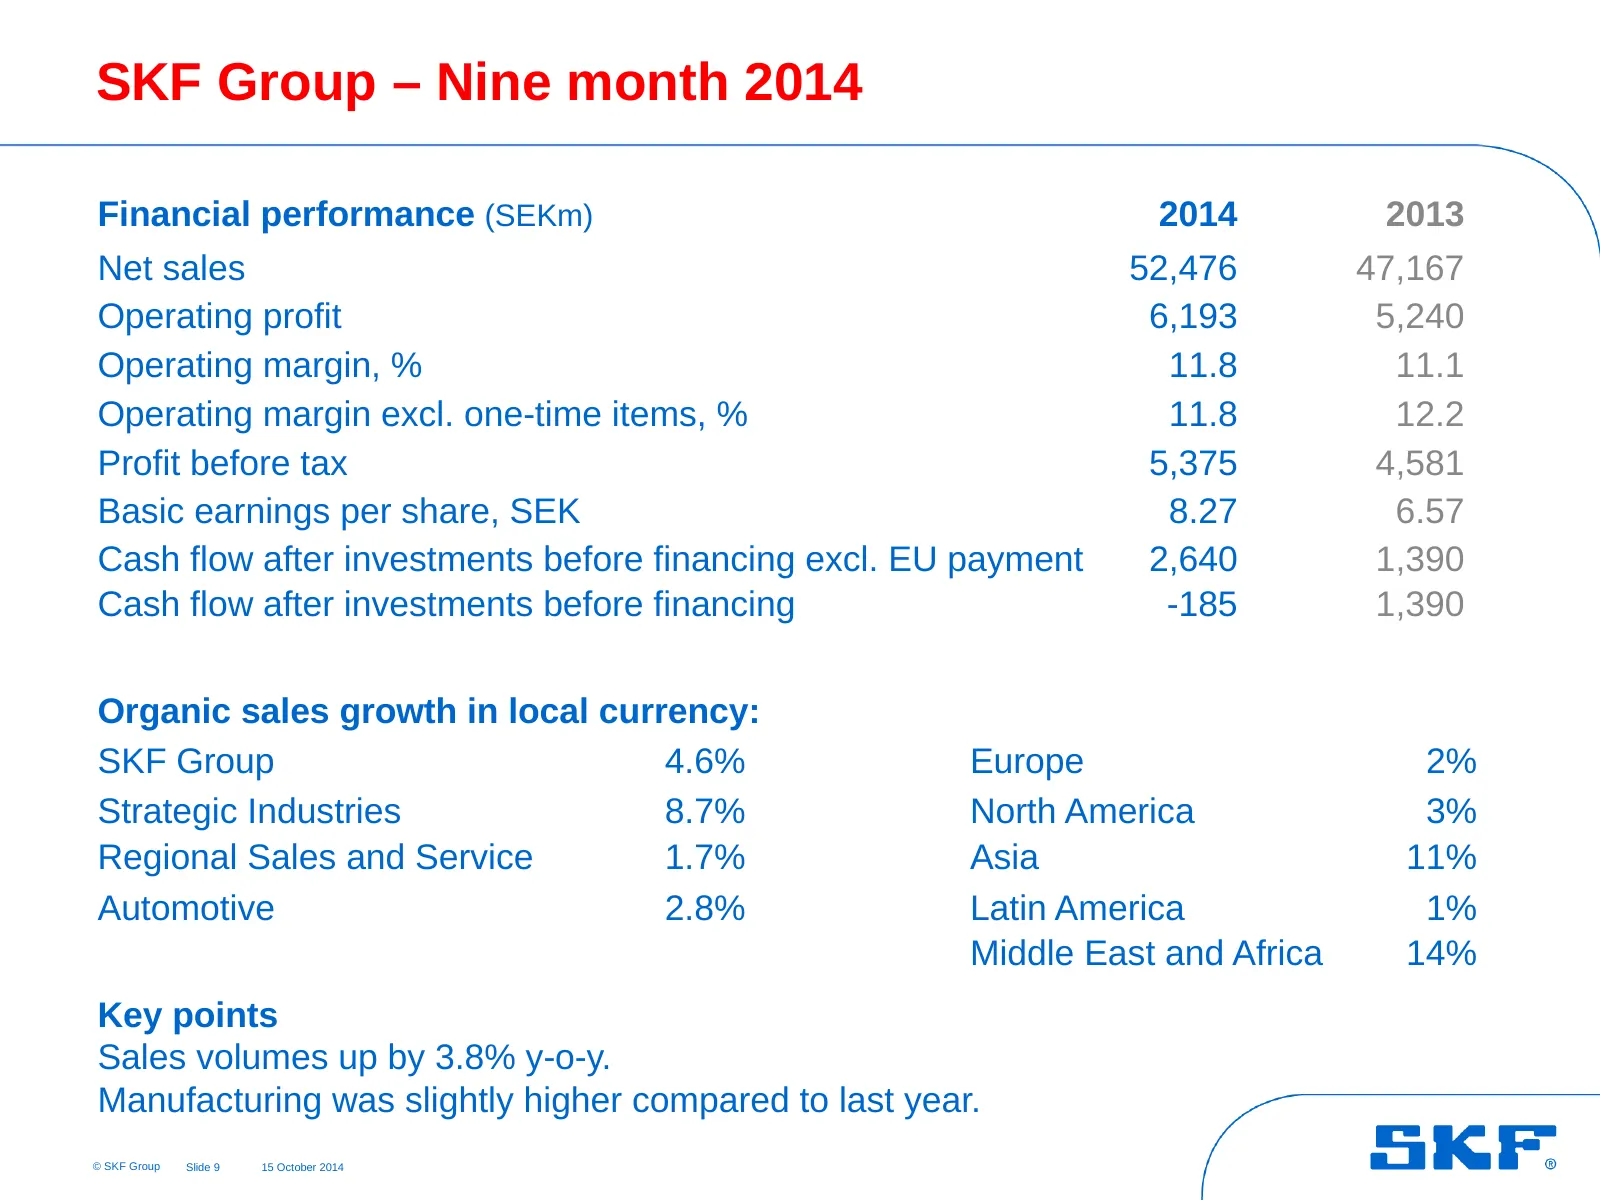
SKF Group – Nine month 2014 Financial performance (SEKm) 2014 2013 Net sales 52,476 47,167 Operating profit 6,193 5,240 Operating margin, % 11.8 11.1 Operating margin excl. one-time items, % 11.8 12.2 Profit before tax 5,375 4,581 Basic earnings per share, SEK 8.27 6.57 Cash flow after investments b
Slide 10: Organic sales growth in local currency
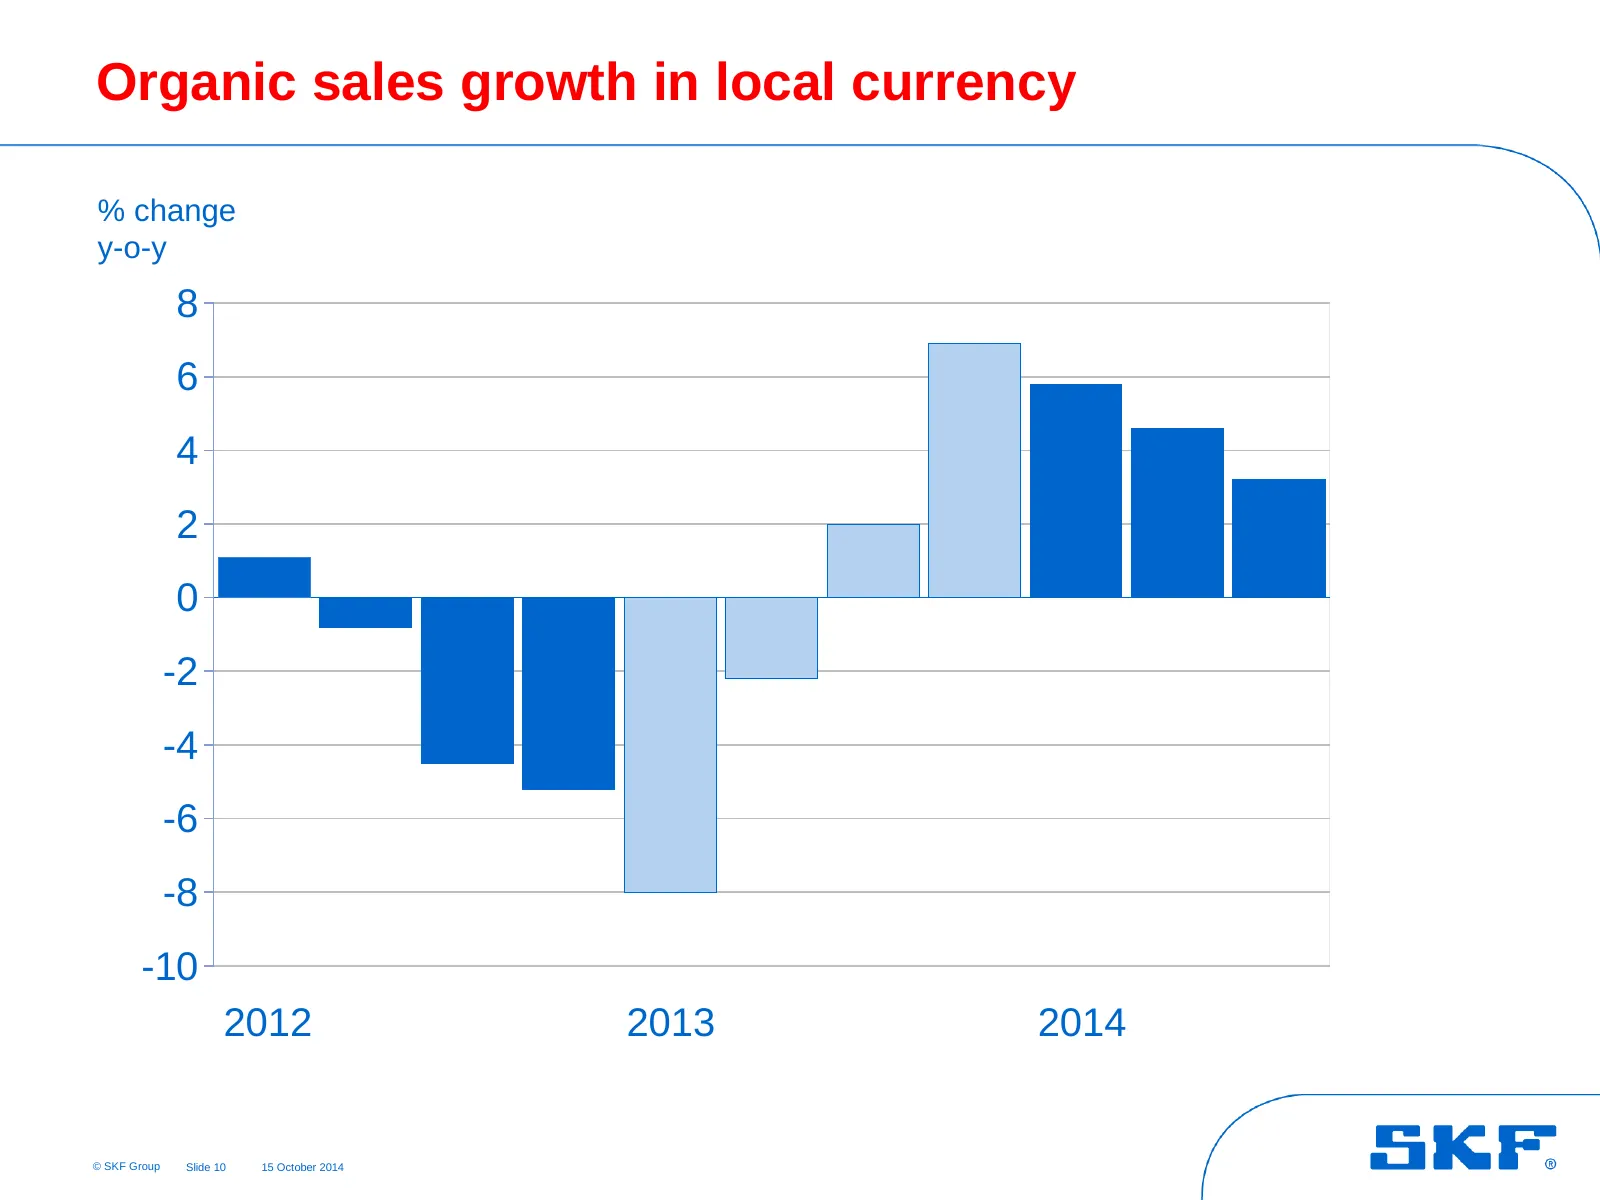
Organic sales growth in local currency % change y-o-y 8 6 4 2 0 -2 -4 -6 -8 -10 2012 2013 2014 © SKF Group Slide 10 15 October 2014
Slide 11: Organic sales growth in local currency
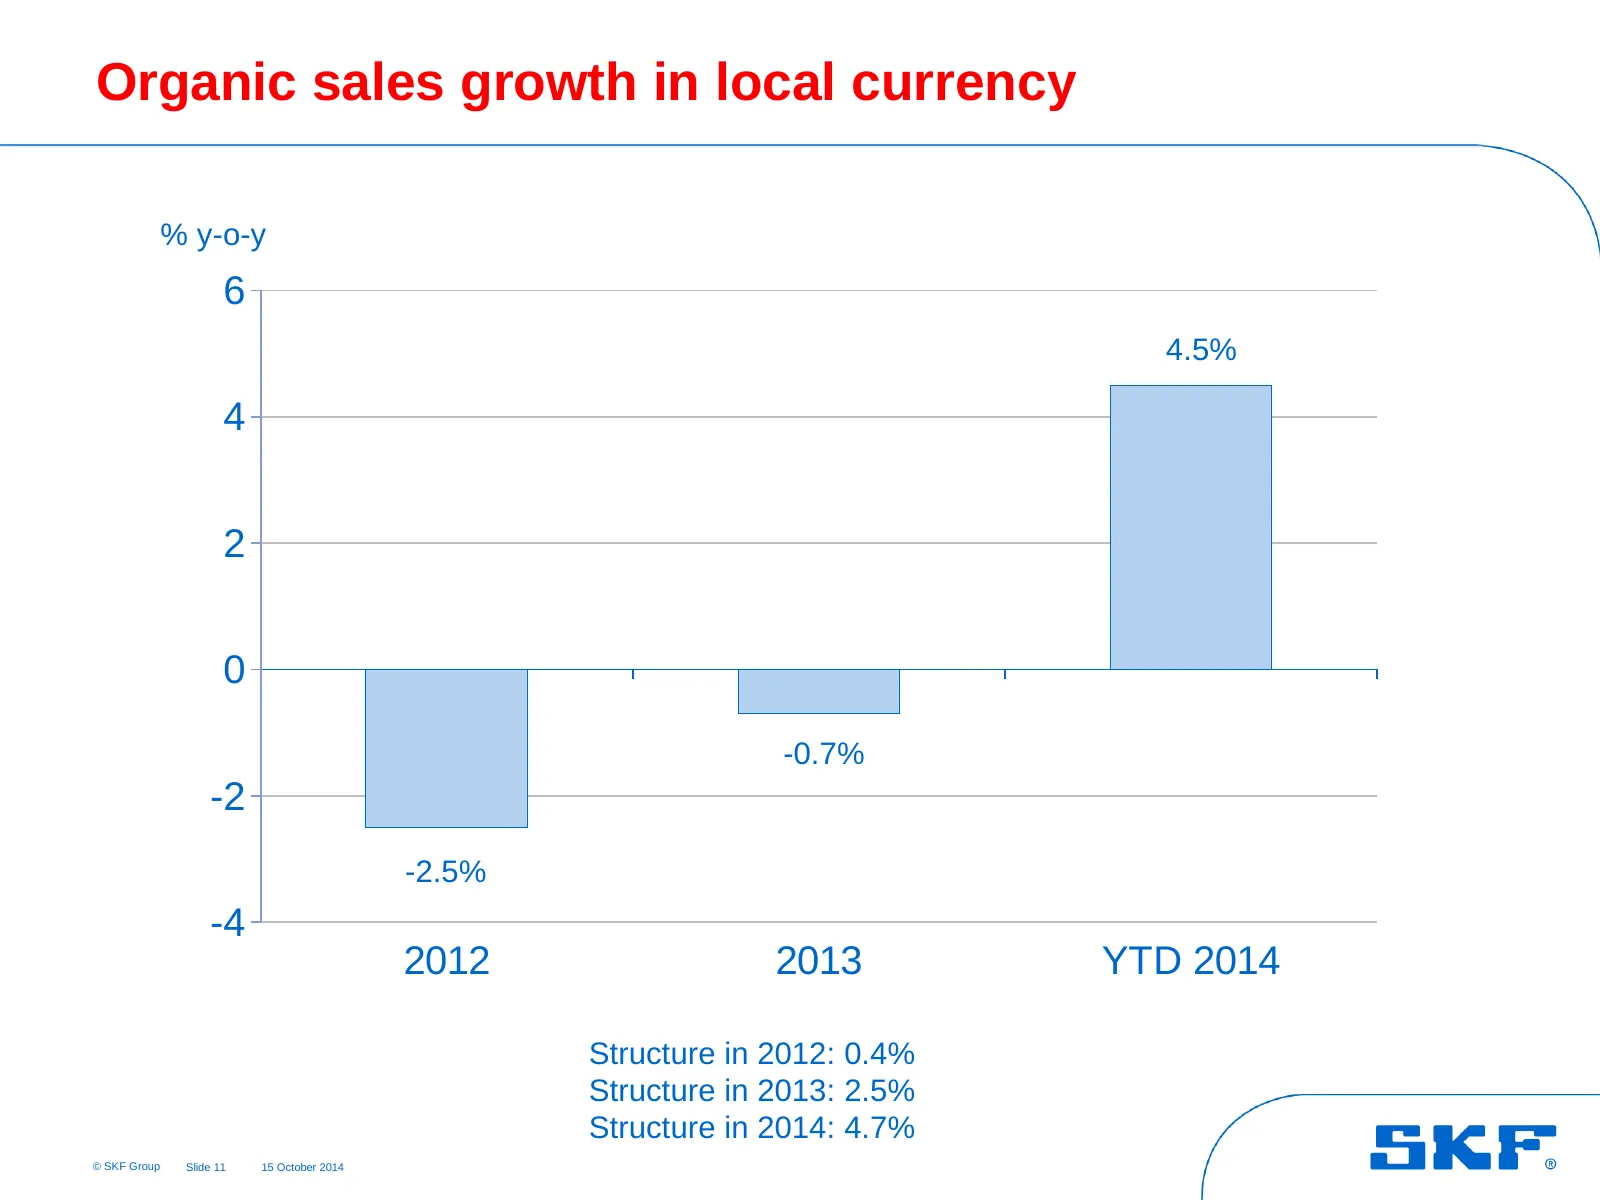
Organic sales growth in local currency % y-o-y 6 4.5% 4 2 0 -0.7% -2 -2.5% -4 2012 2013 YTD 2014 Structure in 2012: 0.4% Structure in 2013: 2.5% Structure in 2014: 4.7% © SKF Group Slide 11 15 October 2014
Slide 12: Sales development by geography
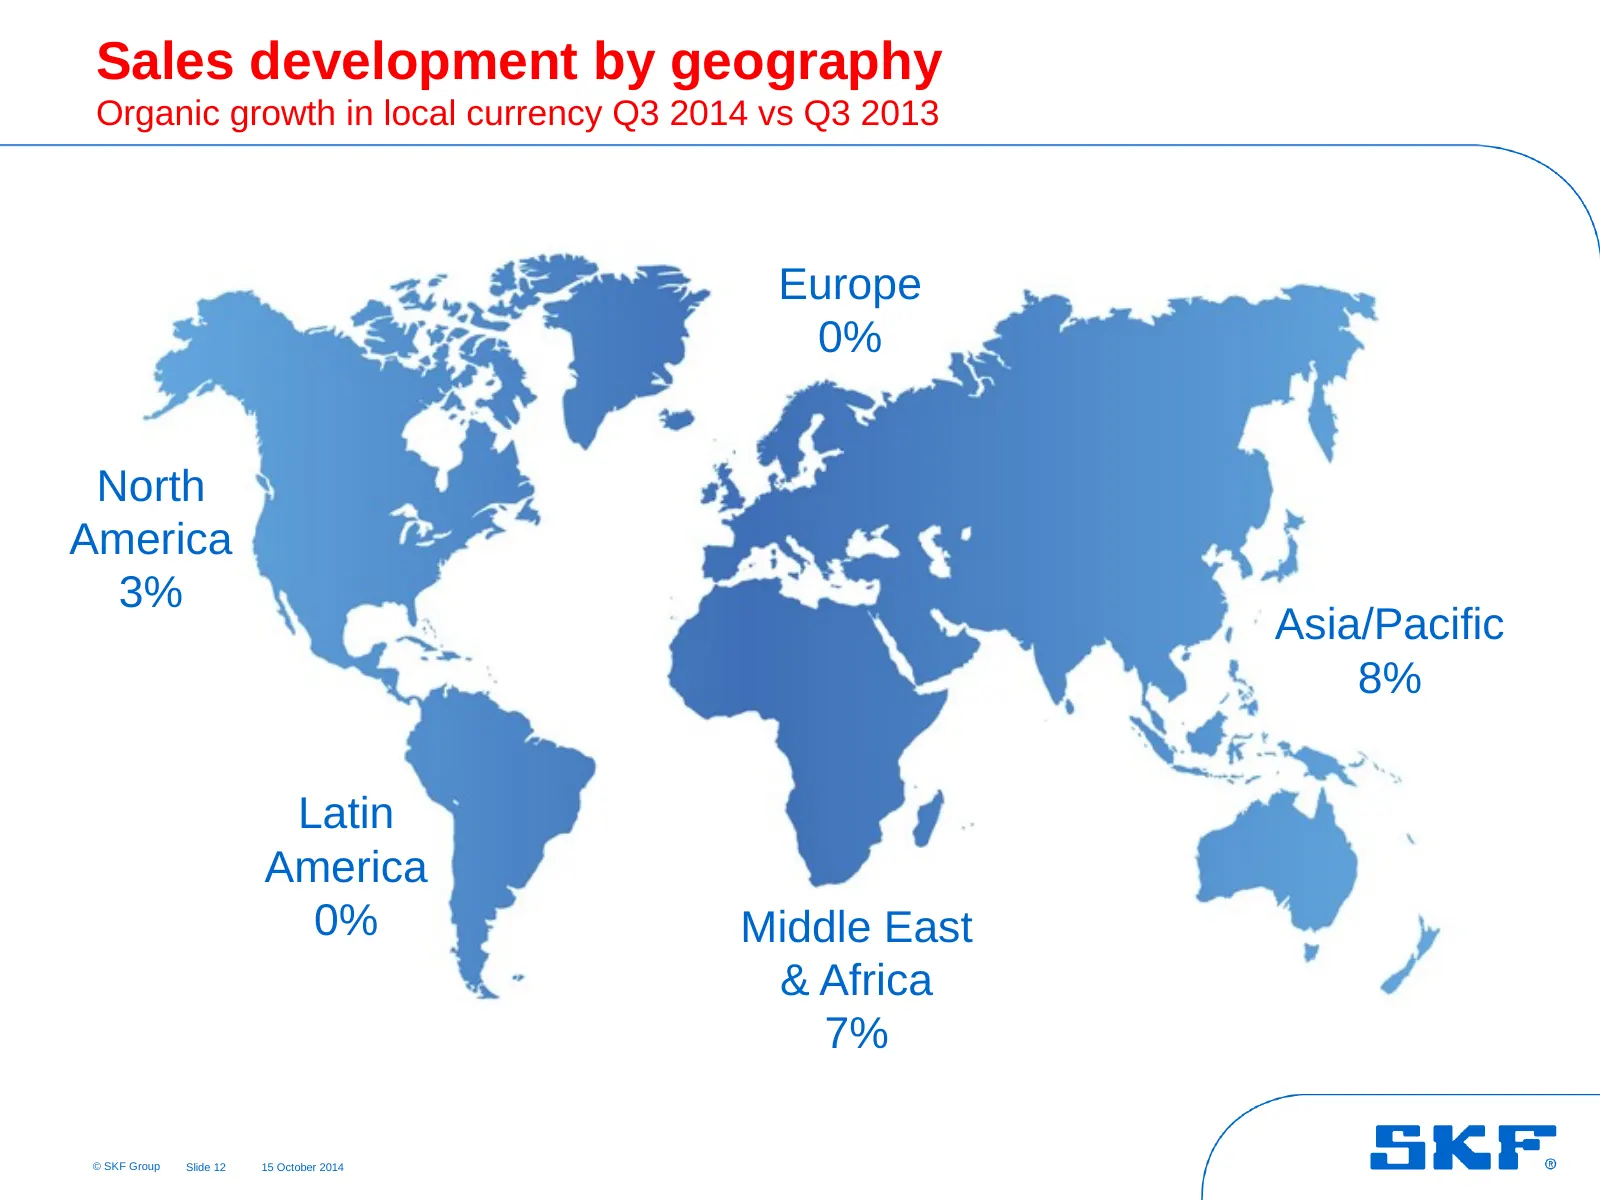
Sales development by geography Organic growth in local currency Q3 2014 vs Q3 2013 Europe 0% North America 3% Asia/Pacific 8% Latin America 0% Middle East & Africa 7% © SKF Group Slide 12 15 October 2014
Slide 13: Sales development by geography
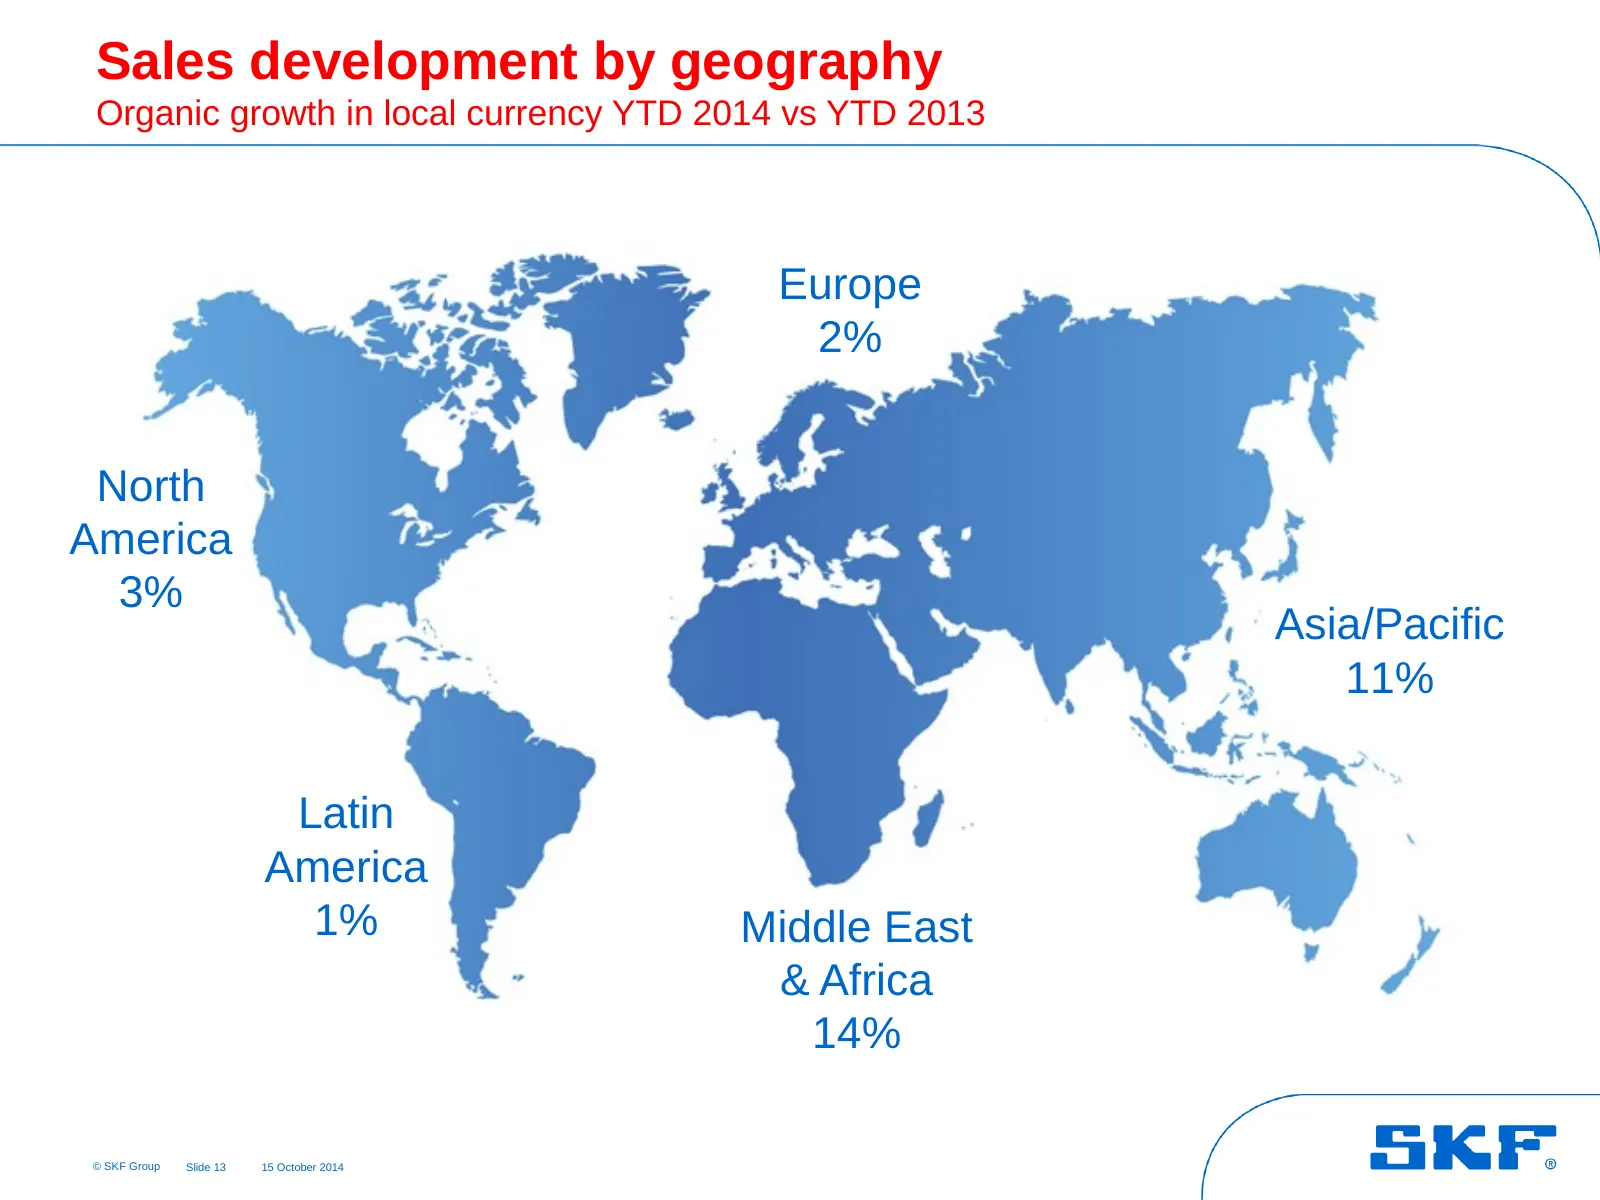
Sales development by geography Organic growth in local currency YTD 2014 vs YTD 2013 Europe 2% North America 3% Asia/Pacific 11% Latin America 1% Middle East & Africa 14% © SKF Group Slide 13 15 October 2014
Slide 14: Components in net sales
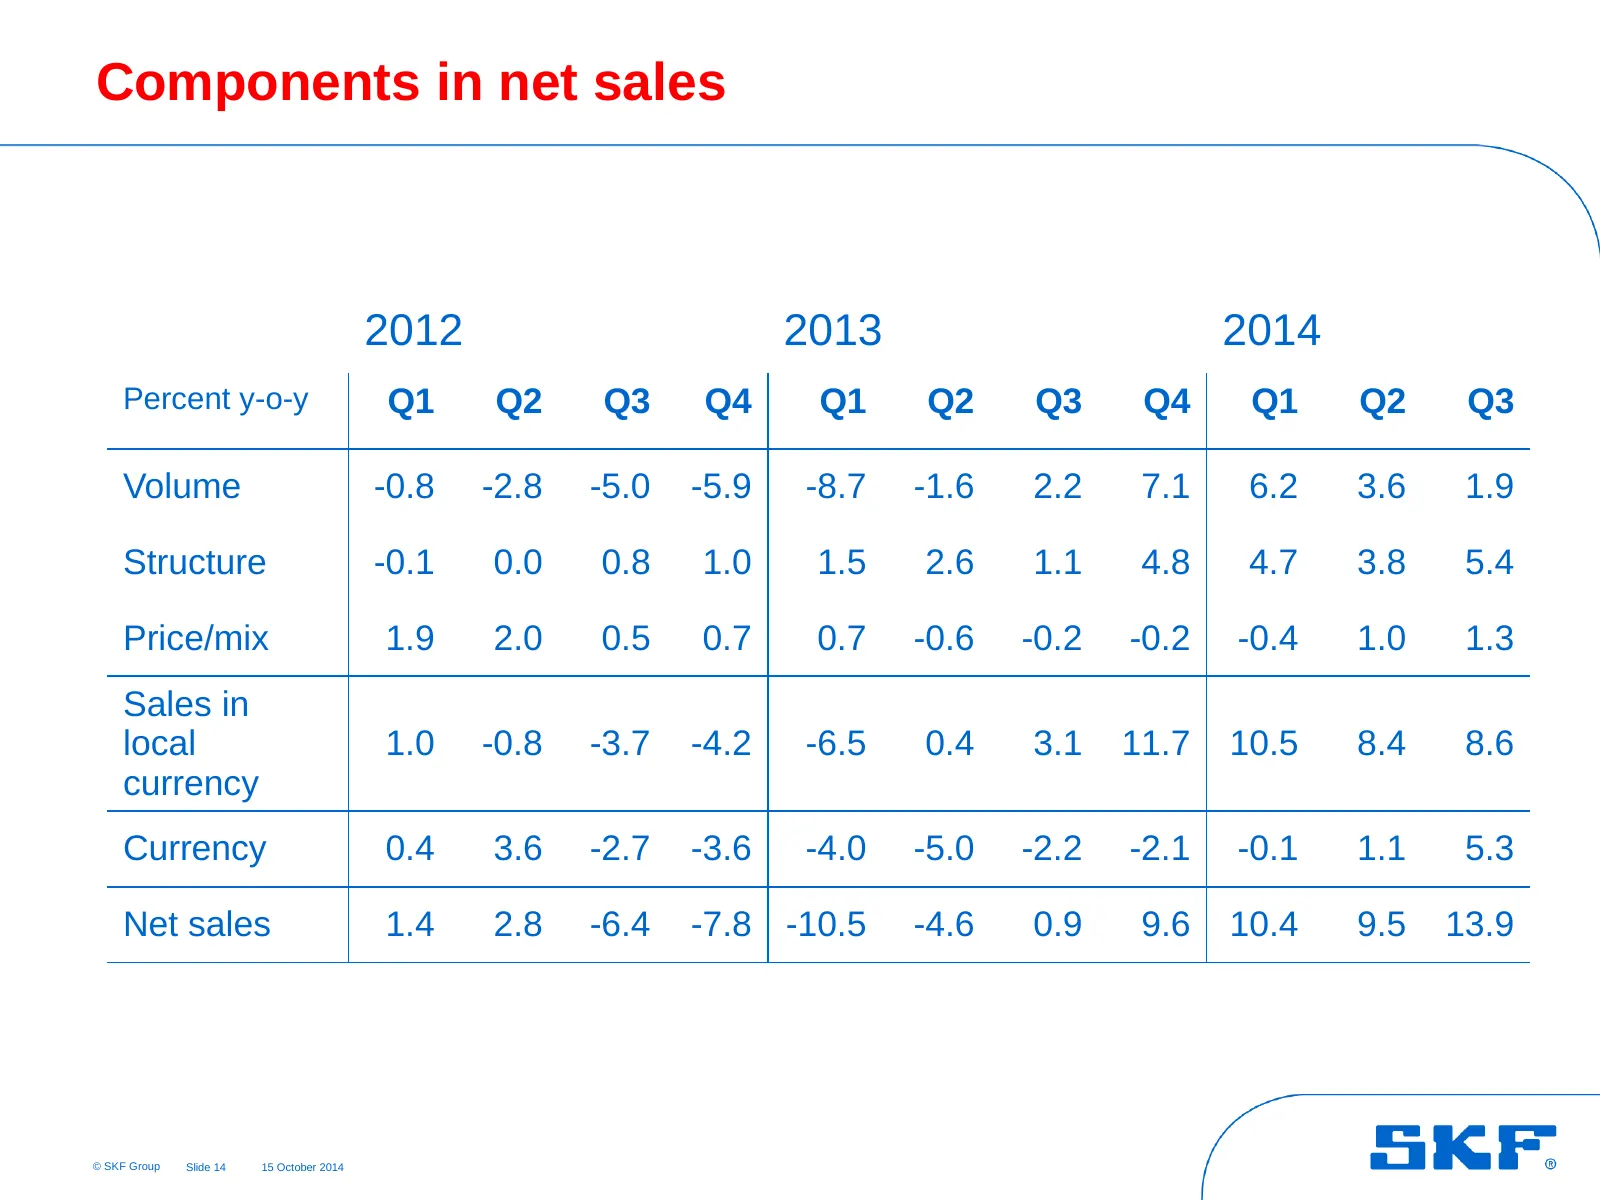
Components in net sales 2012 2013 2014 Percent y-o-y Q1 Q2 Q3 Q4 Q1 Q2 Q3 Q4 Q1 Q2 Q3 Volume -0.8 -2.8 -5.0 -5.9 -8.7 -1.6 2.2 7.1 6.2 3.6 1.9 Structure -0.1 0.0 0.8 1.0 1.5 2.6 1.1 4.8 4.7 3.8 5.4 Price/mix 1.9 2.0 0.5 0.7 0.7 -0.6 -0.2 -0.2 -0.4 1.0 1.3 Sales in local 1.0 -0.8 -3.7 -4.2 -6.5 0.4 3
Slide 15: Operating profit as reported
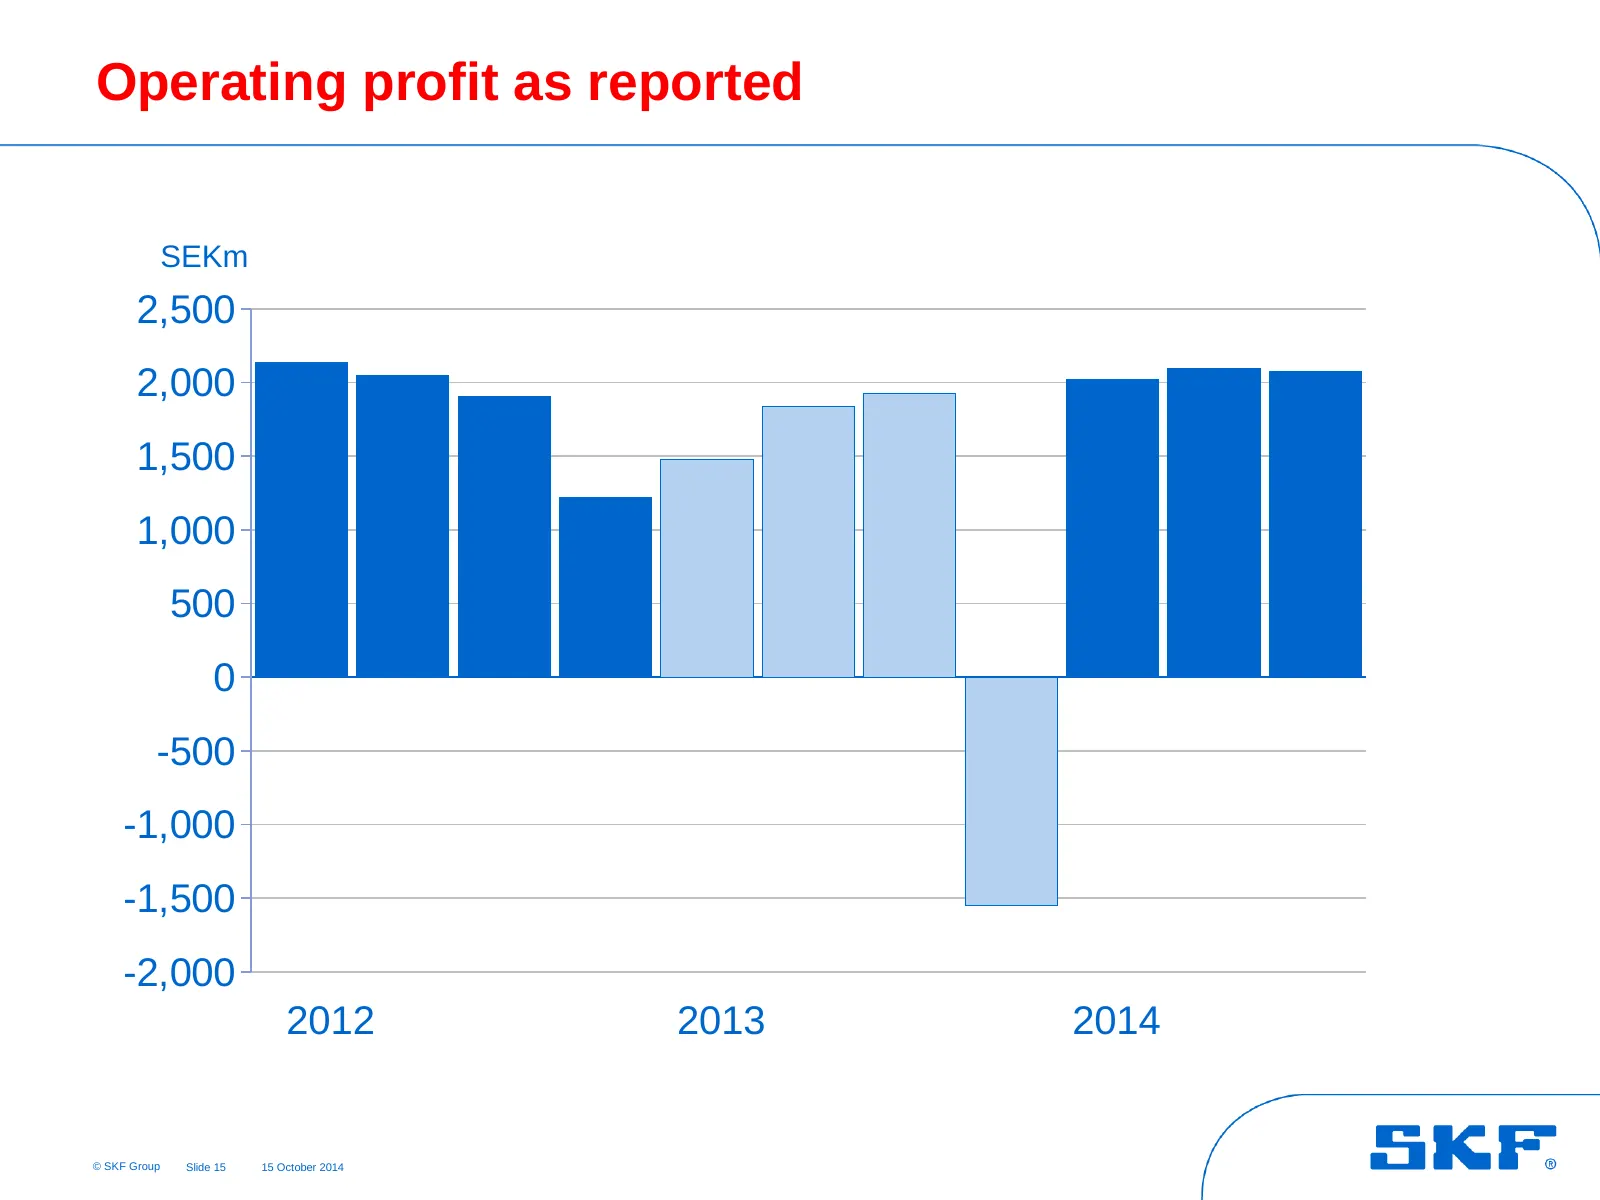
Operating profit as reported SEKm 2,500 2,000 1,500 1,000 500 0 -500 -1,000 -1,500 -2,000 2012 2013 2014 © SKF Group Slide 15 15 October 2014
Slide 16: Operating profit excluding one-time items
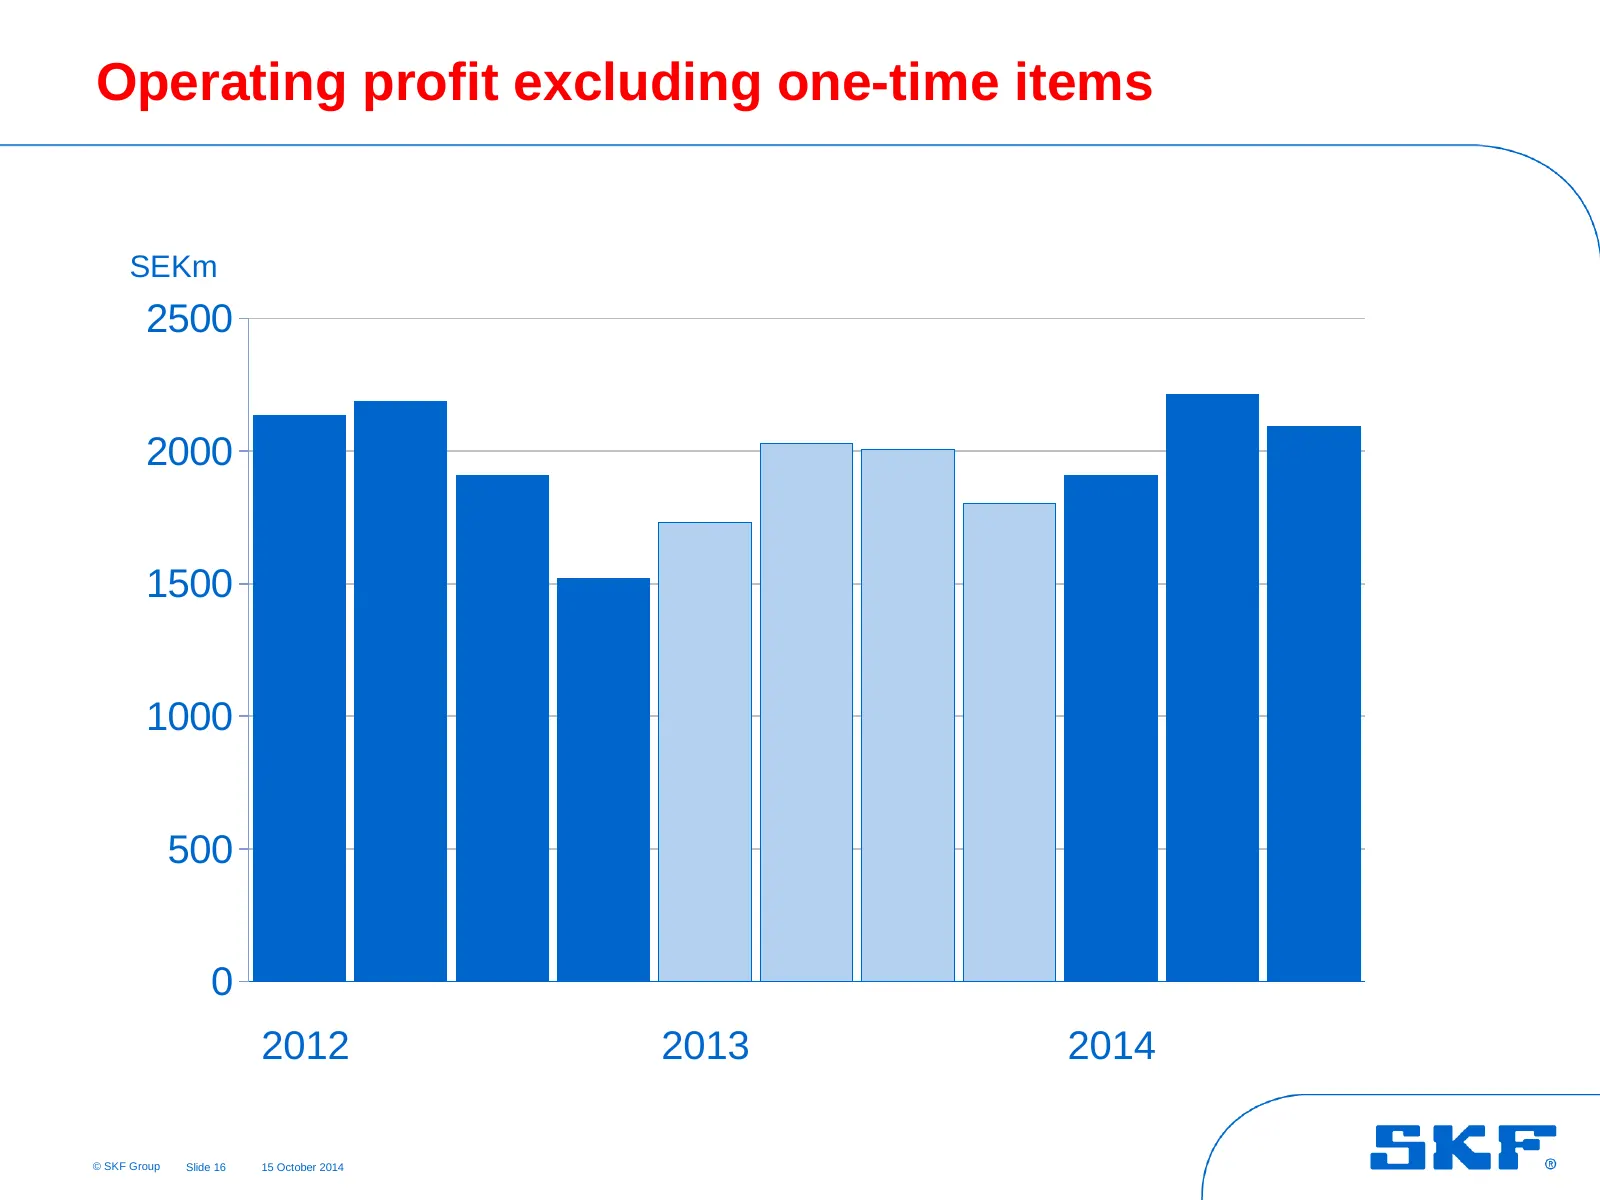
Operating profit excluding one-time items SEKm 2500 2000 1500 1000 500 0 2012 2013 2014 © SKF Group Slide 16 15 October 2014
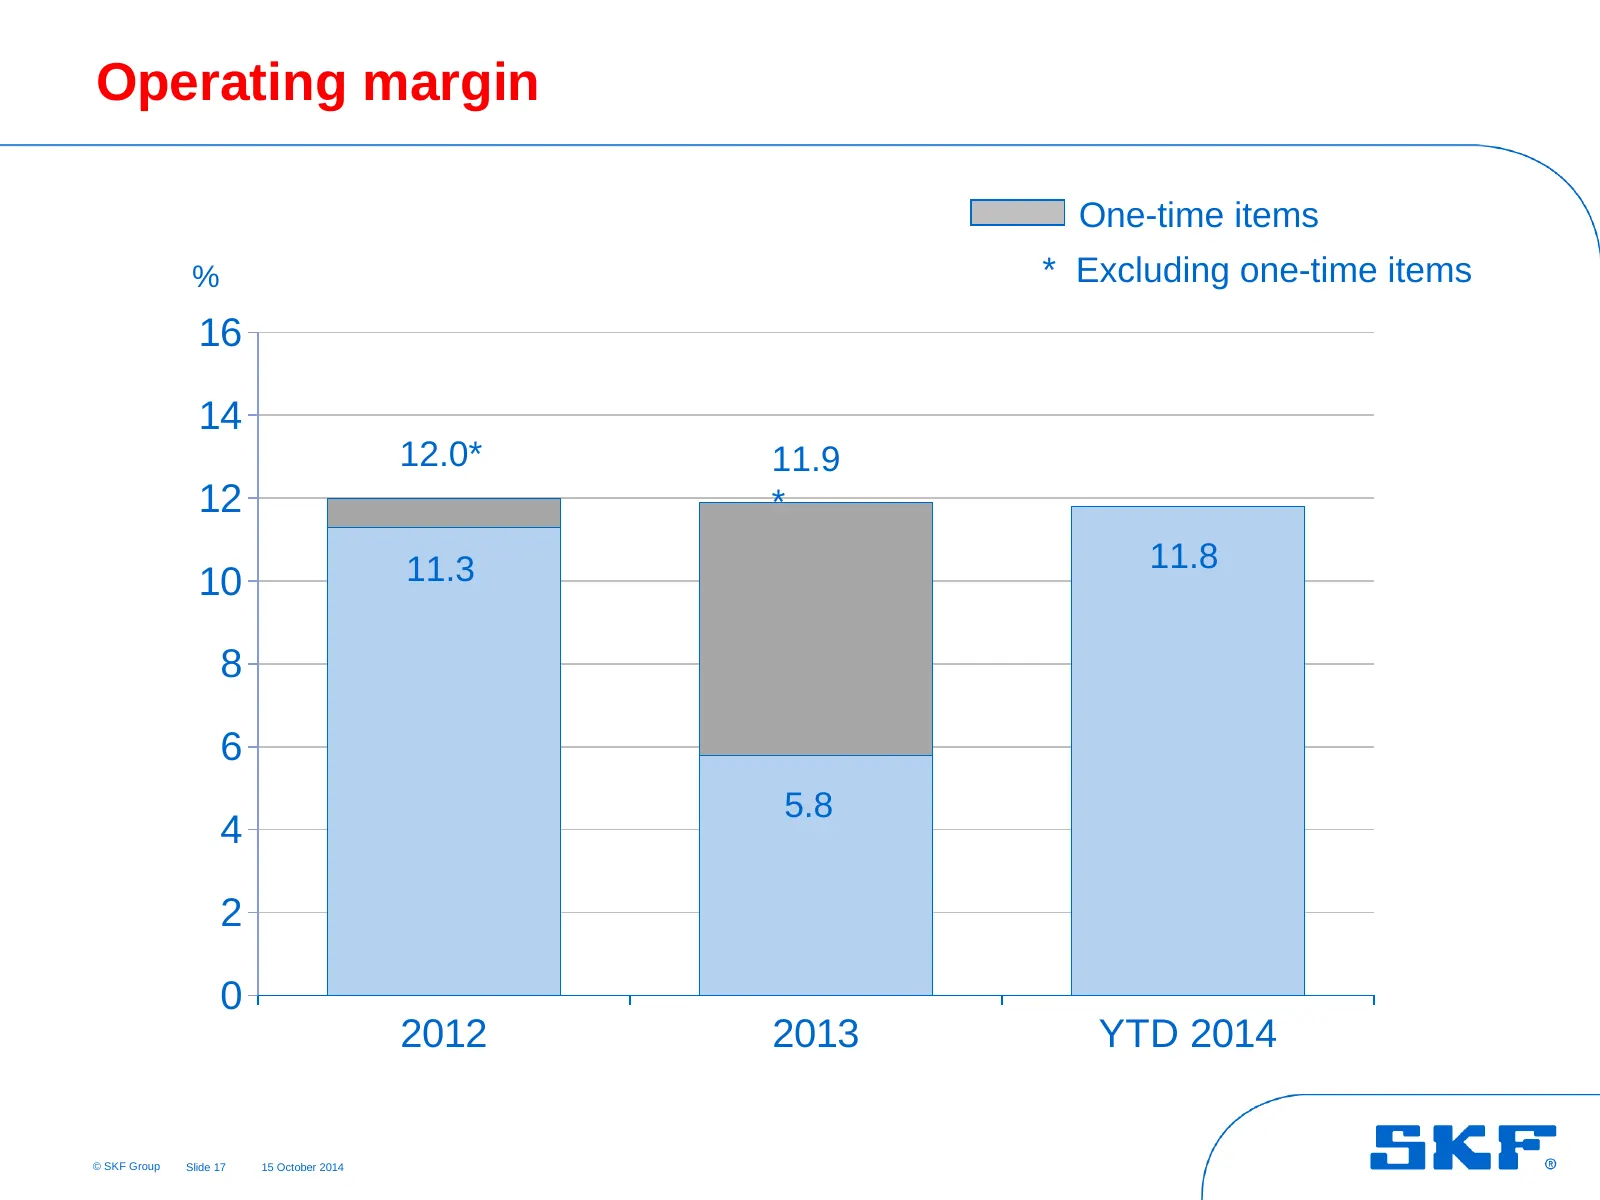
Slide 17: Operating margin
Operating margin One-time items % * Excluding one-time items 16 14 12.0* 11.9 12 * 11.3 11.8 10 8 6 5.8 4 2 0 2012 2013 YTD 2014 © SKF Group Slide 17 15 October 2014
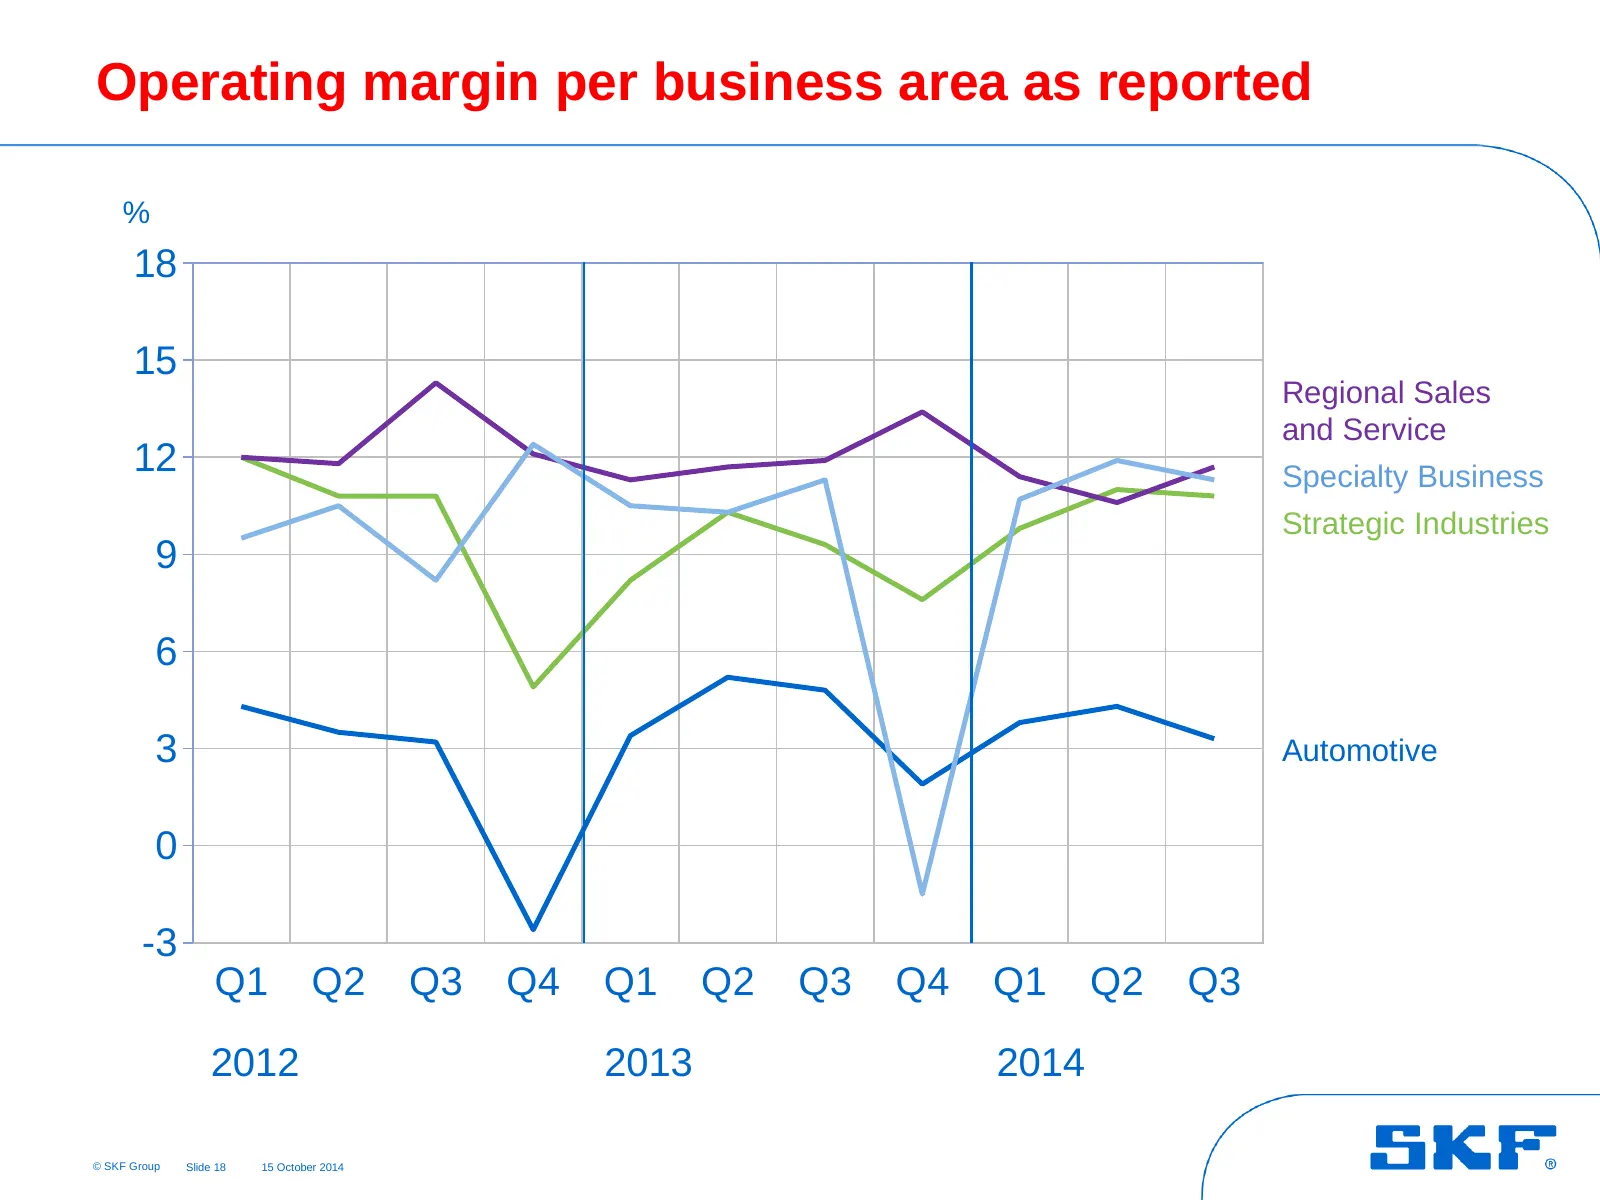
Slide 18: Operating margin per business area as reported
Operating margin per business area as reported % 18 15 Regional Sales and Service 12 Specialty Business Strategic Industries 9 6 3 Automotive 0 -3 Q1 Q2 Q3 Q4 Q1 Q2 Q3 Q4 Q1 Q2 Q3 2012 2013 2014 © SKF Group Slide 18 15 October 2014
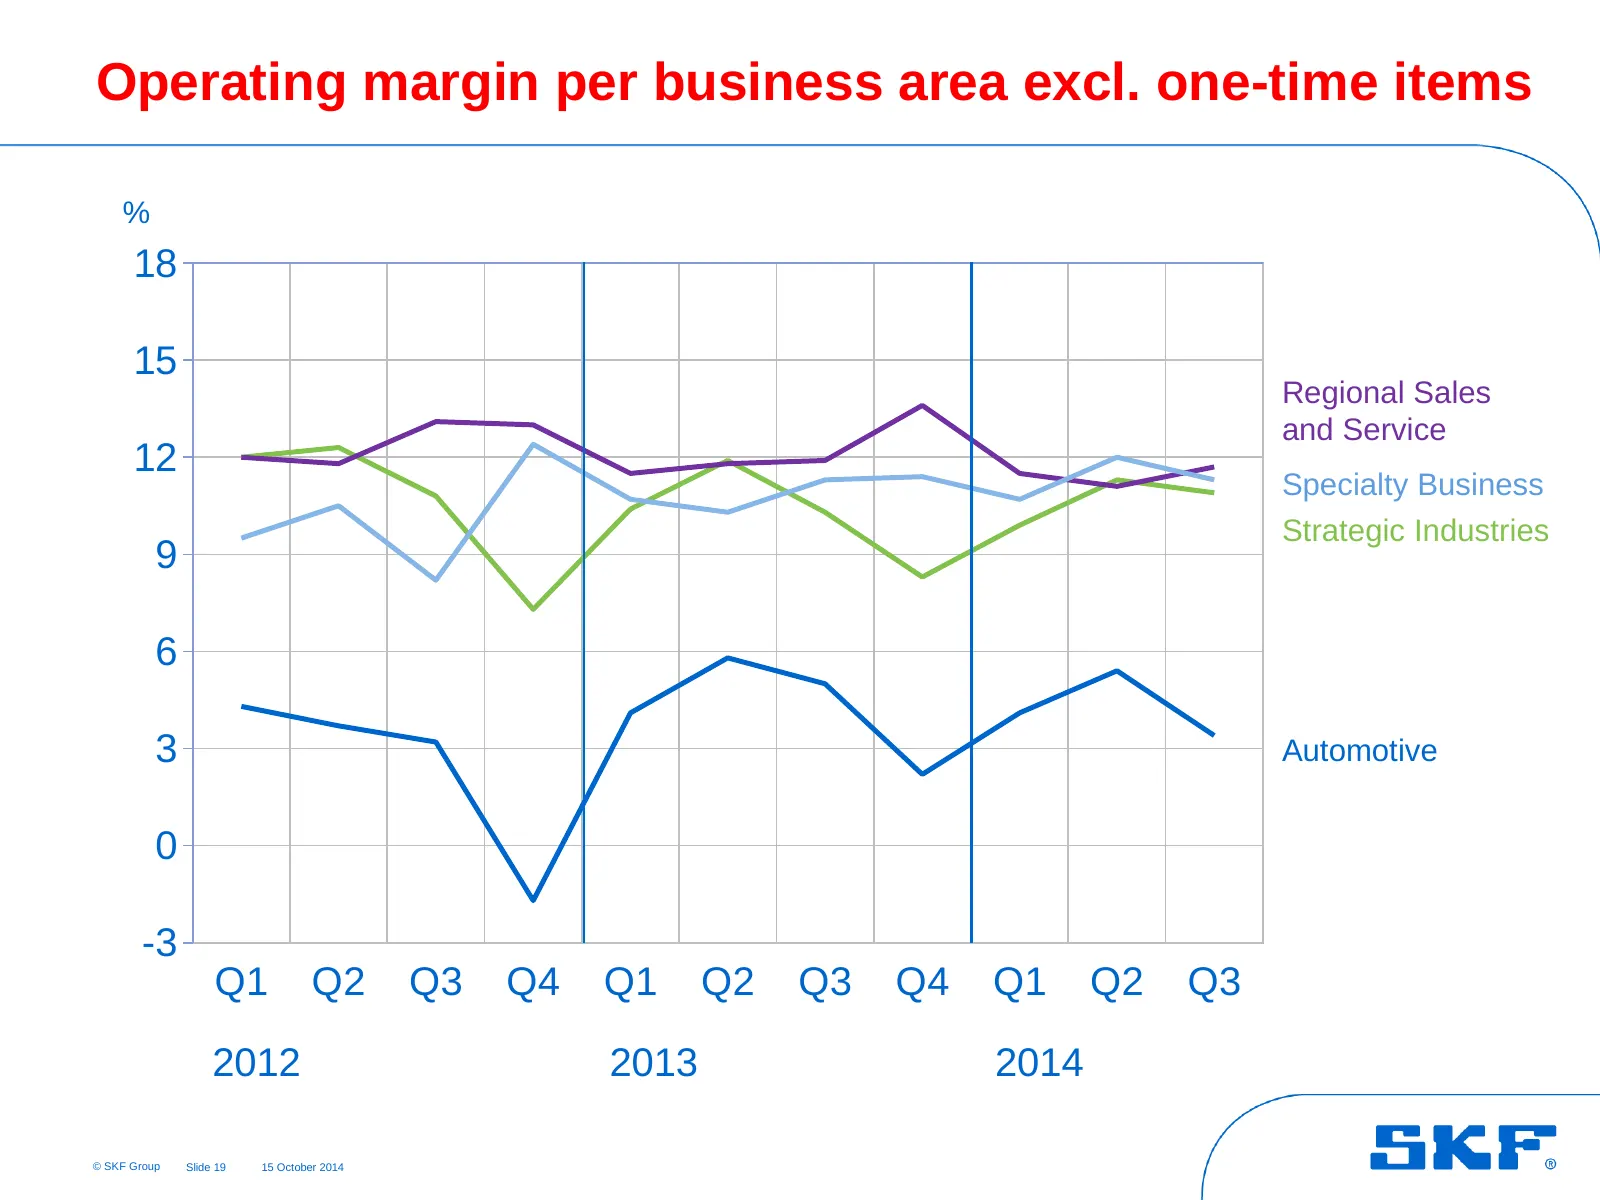
Slide 19: Operating margin per business area excl. one-time items
Operating margin per business area excl. one-time items % 18 15 Regional Sales and Service 12 Specialty Business Strategic Industries 9 6 3 Automotive 0 -3 Q1 Q2 Q3 Q4 Q1 Q2 Q3 Q4 Q1 Q2 Q3 2012 2013 2014 © SKF Group Slide 19 15 October 2014
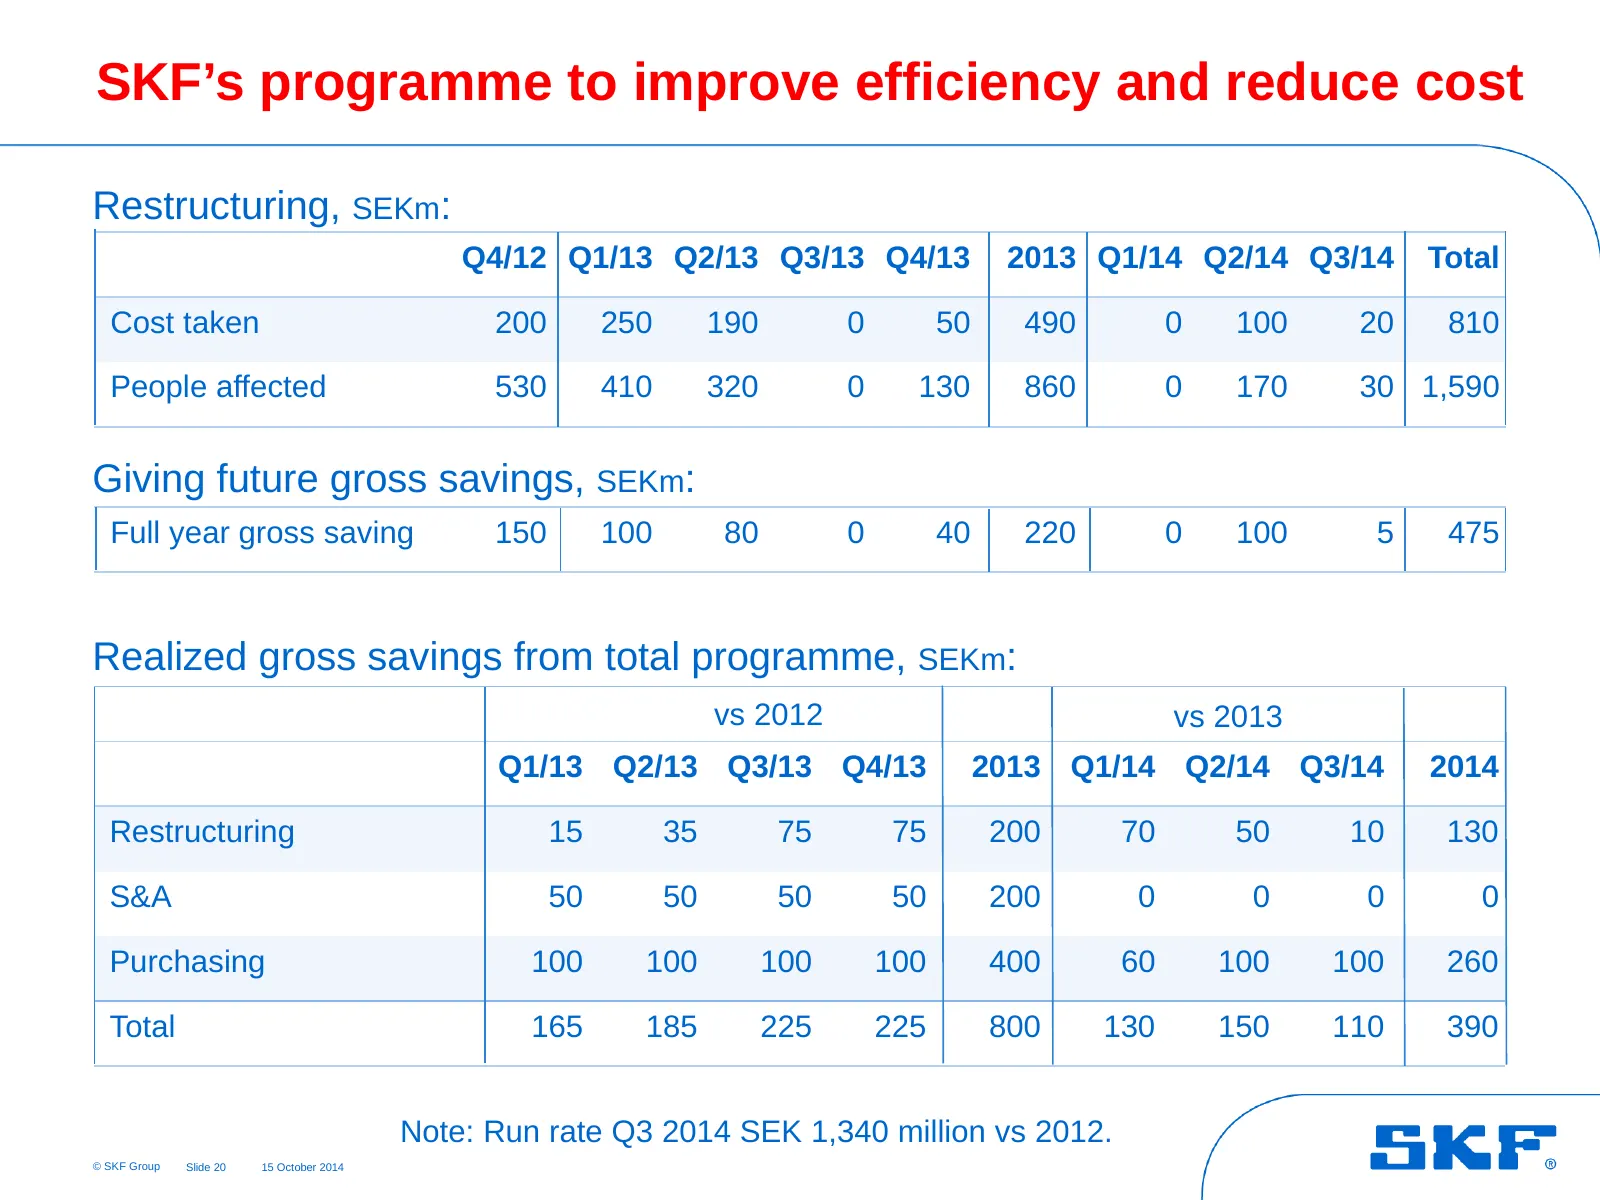
Slide 20: SKF's programme to improve efficiency and reduce cost
SKF’s programme to improve efficiency and reduce cost Restructuring, SEKm: Q4/12 Q1/13 Q2/13 Q3/13 Q4/13 2013 Q1/14 Q2/14 Q3/14 Total Cost taken 200 250 190 0 50 490 0 100 20 810 People affected 530 410 320 0 130 860 0 170 30 1,590 Giving future gross savings, SEKm: Full year gross saving 150 100 80
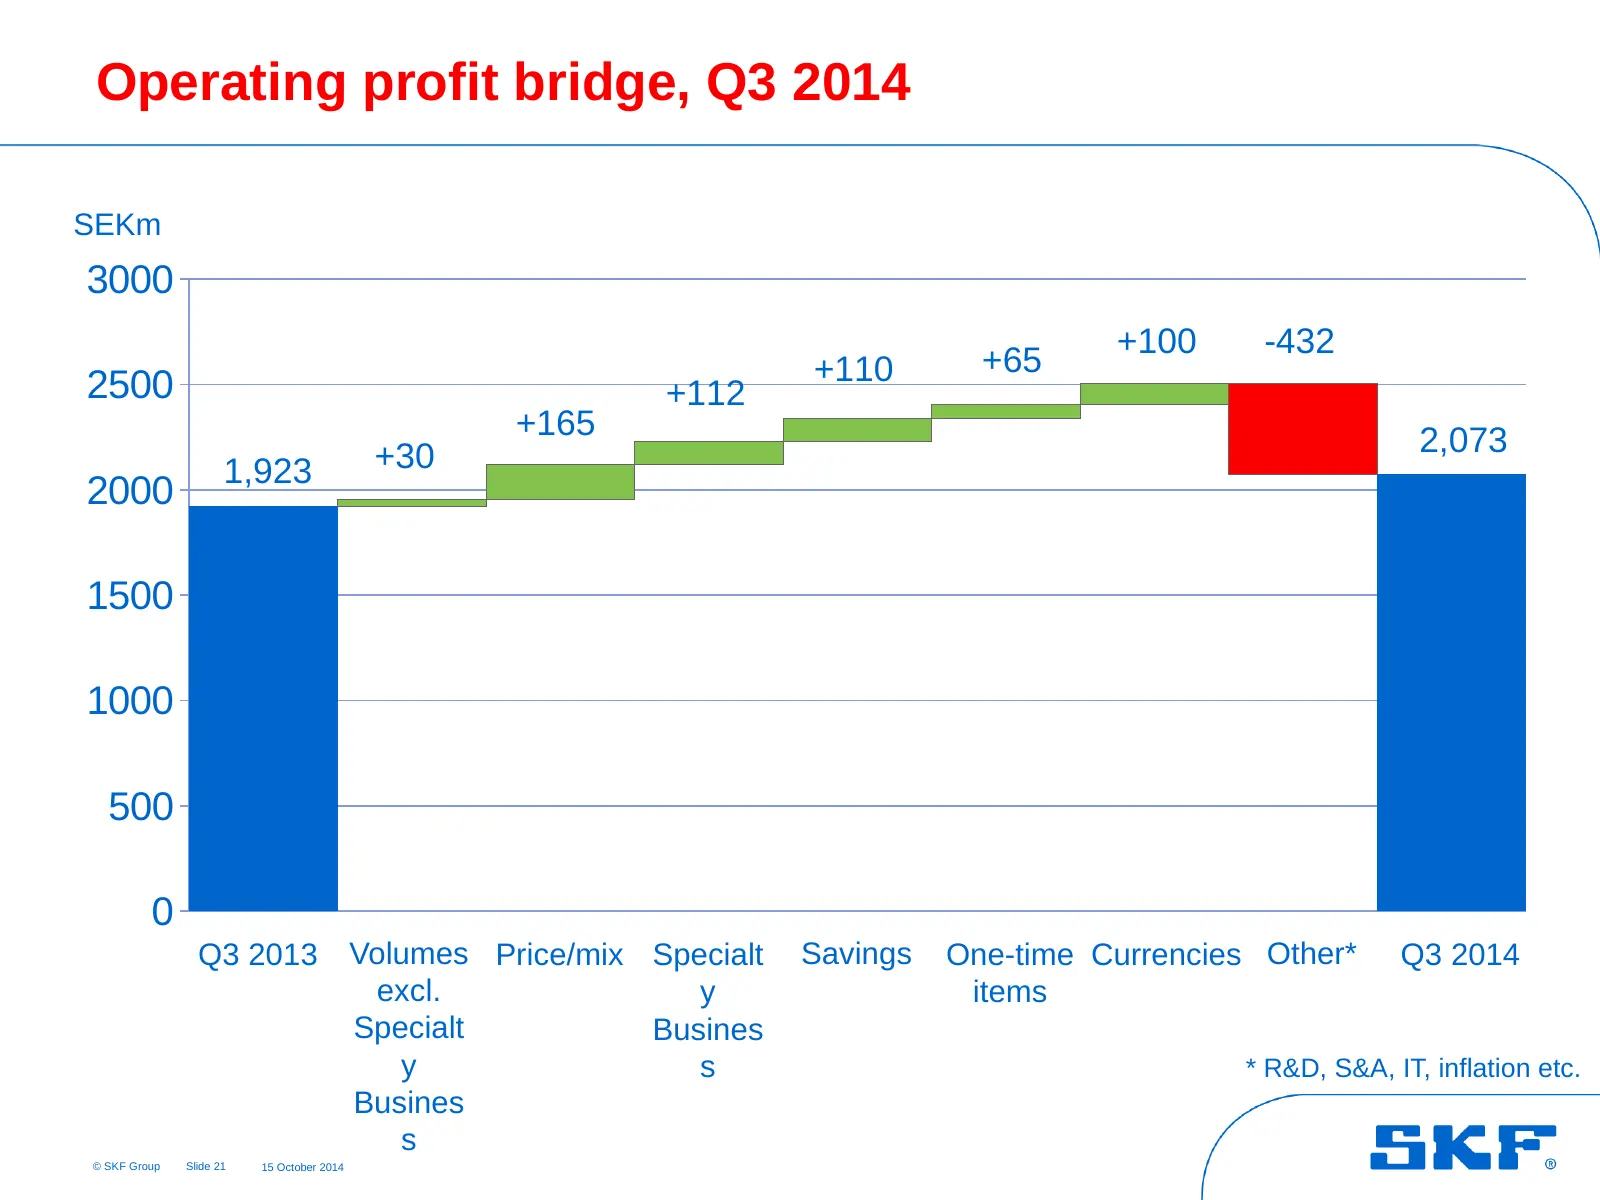
Slide 21: Operating profit bridge, Q3 2014
Operating profit bridge, Q3 2014 SEKm 3000 +100 -432 +110 +65 2500 +112 +165 2,073 1,923 +30 2000 1500 1000 500 0 Q3 2013 Volumes Price/mix Specialt Savings One-time Currencies Other* Q3 2014 excl. y items Specialt Busines y s * R&D, S&A, IT, inflation etc. Busines s © SKF Group Slide 21 15 October
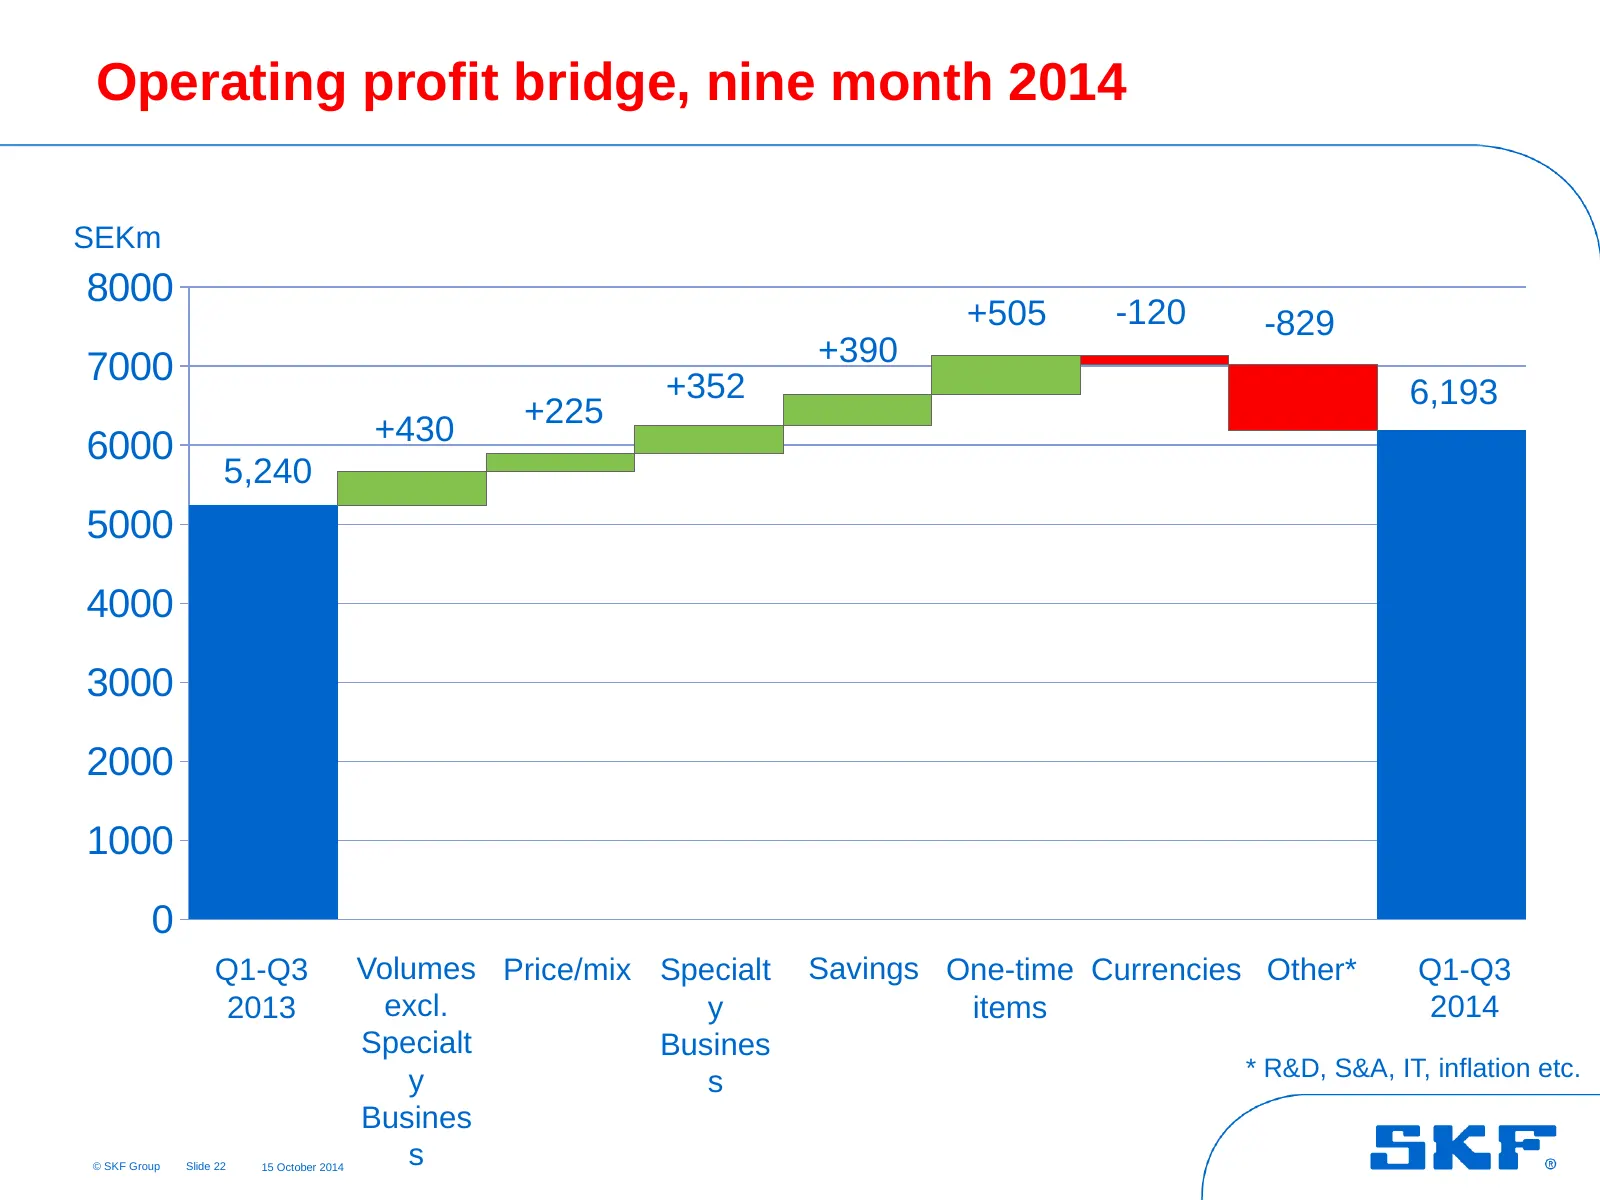
Slide 22: Operating profit bridge, nine month 2014
Operating profit bridge, nine month 2014 SEKm 8000 +505 -120 -829 +390 7000 +352 6,193 +430 +225 6000 5,240 5000 4000 3000 2000 1000 0 Q1-Q3 Volumes Price/mix Specialt Savings One-time Currencies Other* Q1-Q3 2013 excl. y items 2014 Specialt Busines * R&D, S&A, IT, inflation etc. y s Busines © SKF G
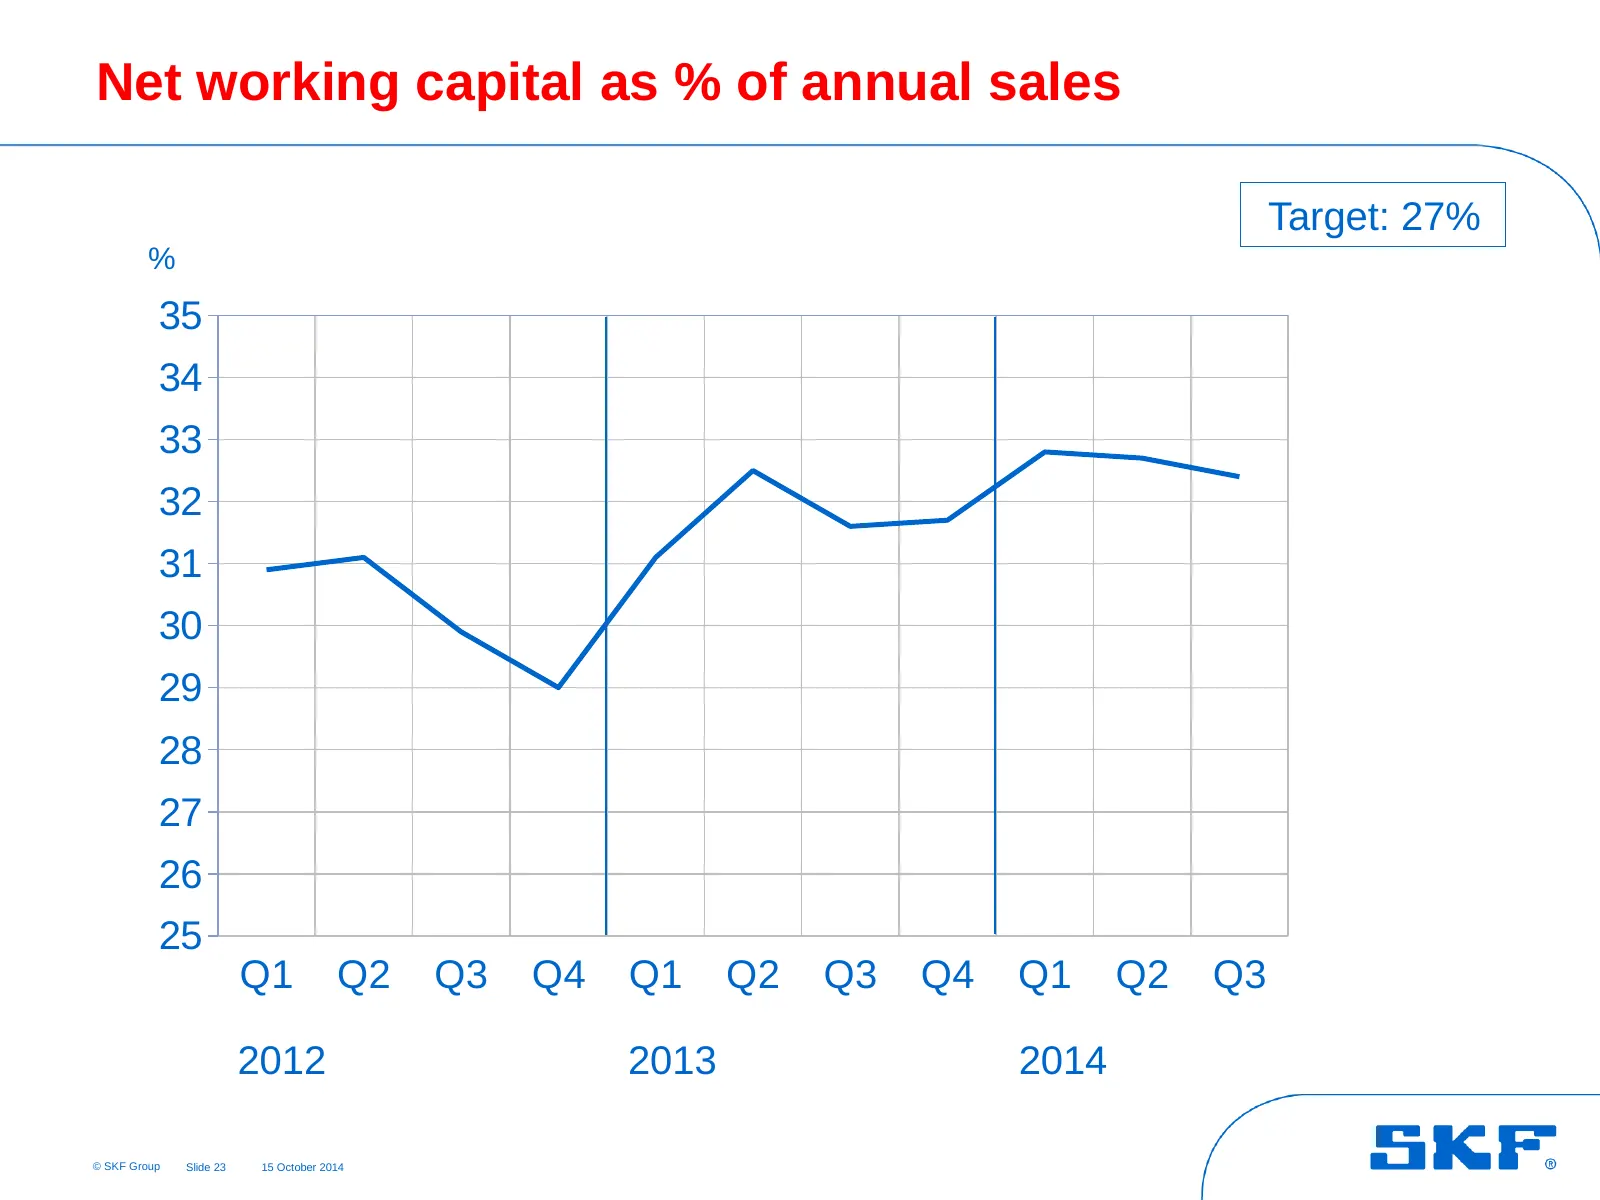
Slide 23: Net working capital as % of annual sales
Net working capital as % of annual sales Target: 27% % 35 34 33 32 31 30 29 28 27 26 25 Q1 Q2 Q3 Q4 Q1 Q2 Q3 Q4 Q1 Q2 Q3 2012 2013 2014 © SKF Group Slide 23 15 October 2014
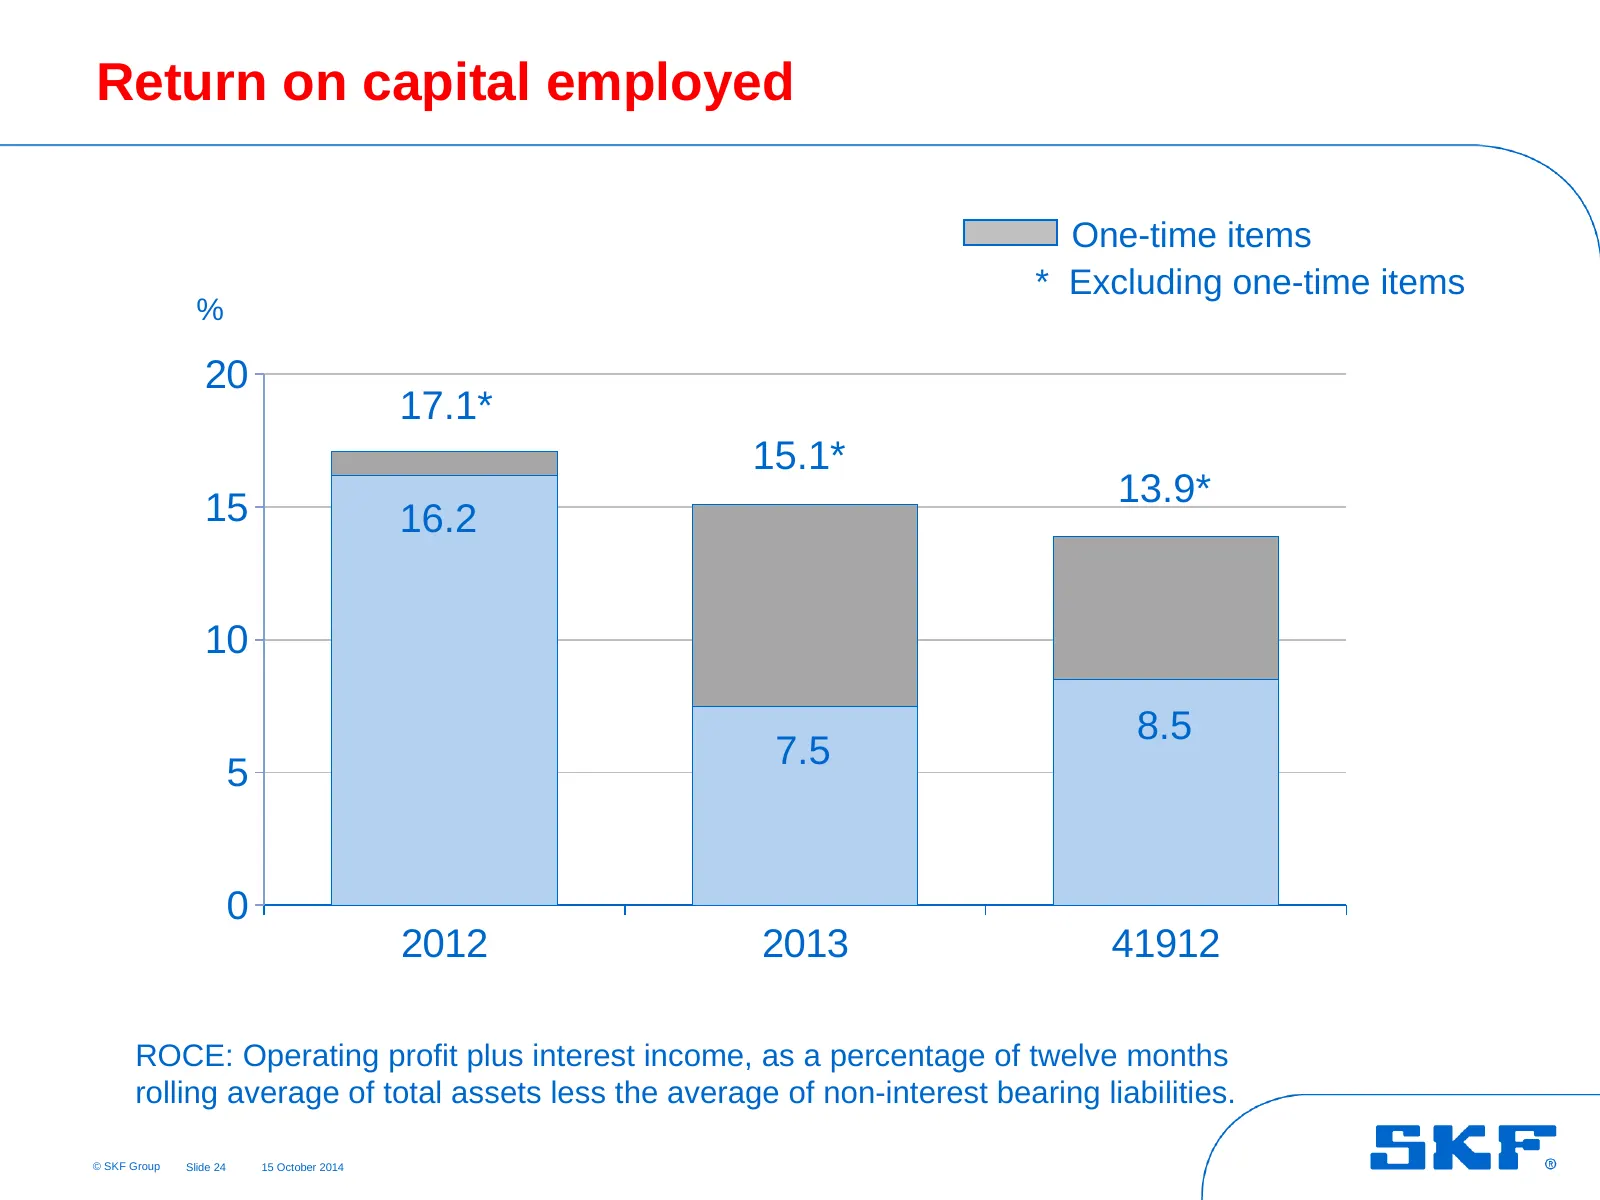
Slide 24: Return on capital employed
Return on capital employed One-time items * Excluding one-time items % 20 17.1* 15.1* 15 13.9* 16.2 10 8.5 7.5 5 0 2012 2013 41912 ROCE: Operating profit plus interest income, as a percentage of twelve months rolling average of total assets less the average of non-interest bearing liabilities. © SKF
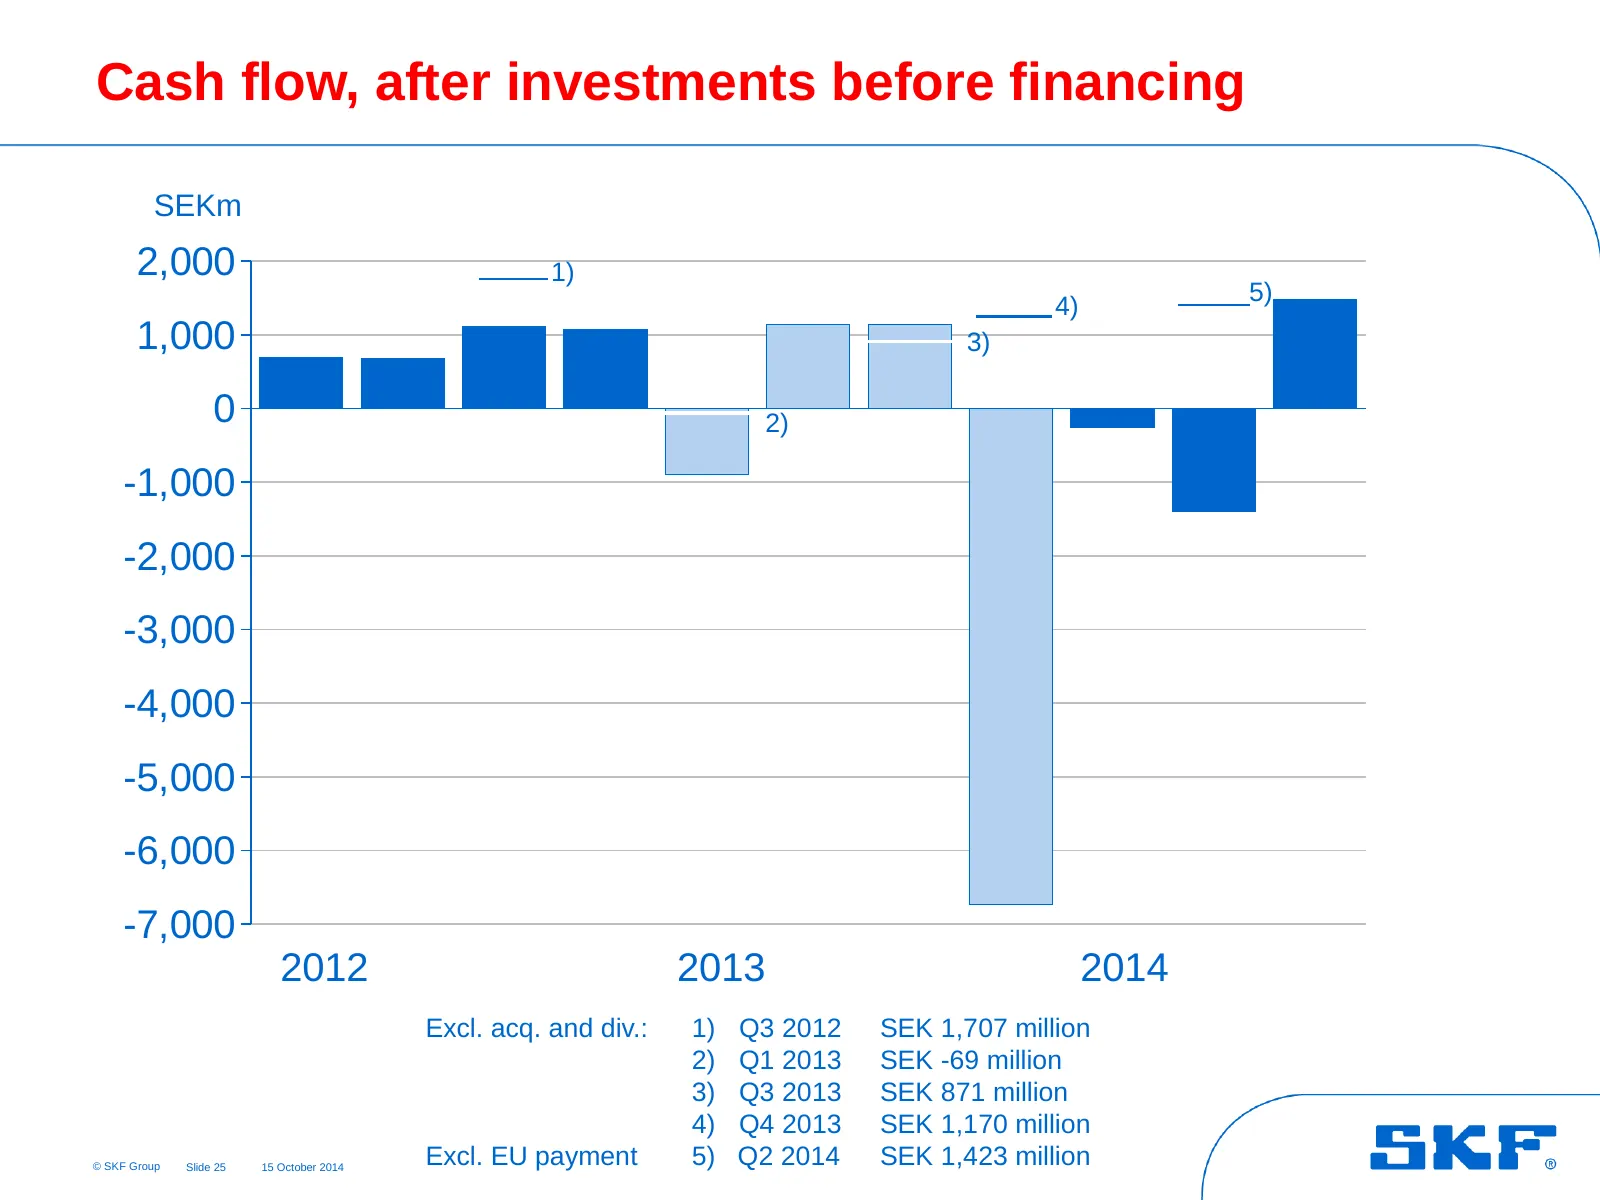
Slide 25: Cash flow, after investments before financing
Cash flow, after investments before financing SEKm 2,000 1) 5) 4) 1,000 3) 0 2) -1,000 -2,000 -3,000 -4,000 -5,000 -6,000 -7,000 2012 2013 2014 Excl. acq. and div.: 1) Q3 2012 SEK 1,707 million 2) Q1 2013 SEK -69 million 3) Q3 2013 SEK 871 million 4) Q4 2013 SEK 1,170 million © SKF Group Slide 25 15
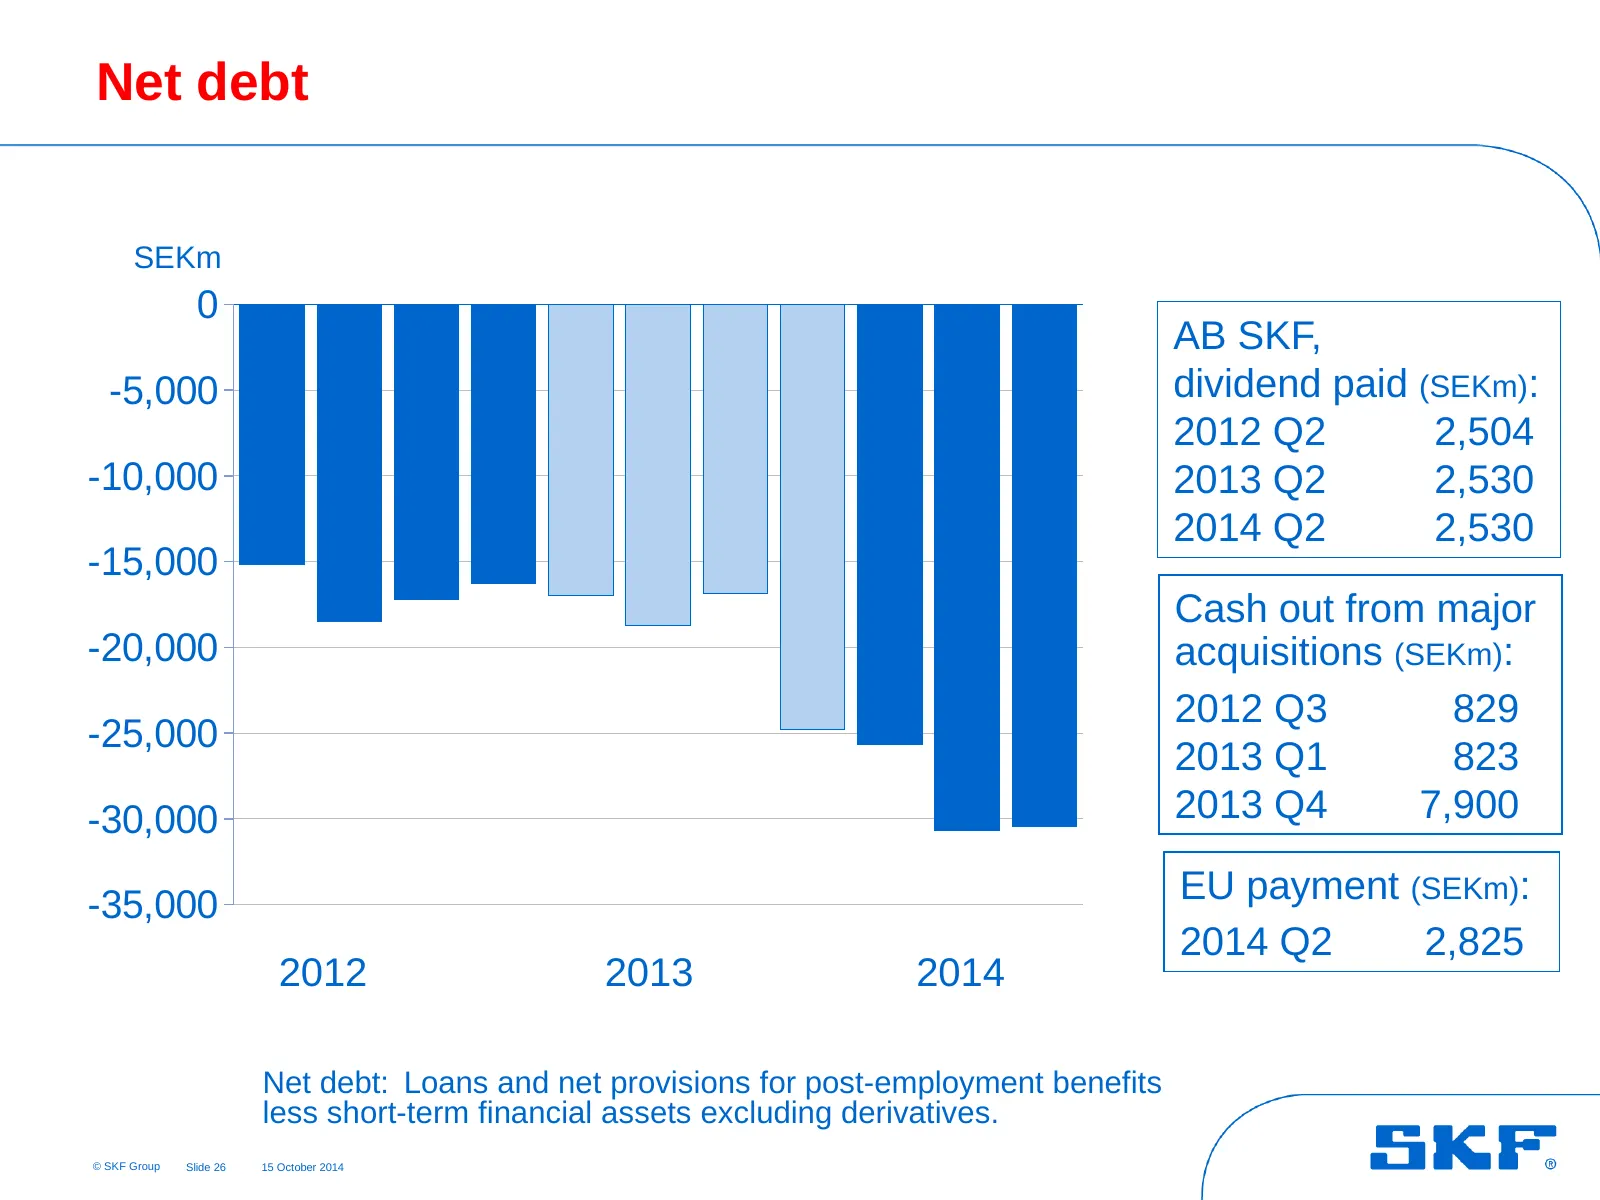
Slide 26: Net debt
Net debt SEKm 0 AB SKF, -5,000 dividend paid (SEKm): 2012 Q2 2,504 -10,000 2013 Q2 2,530 2014 Q2 2,530 -15,000 Cash out from major -20,000 acquisitions (SEKm): 2012 Q3 829 -25,000 2013 Q1 823 -30,000 2013 Q4 7,900 -35,000 EU payment (SEKm): 2014 Q2 2,825 2012 2013 2014 Net debt: Loans and net provis
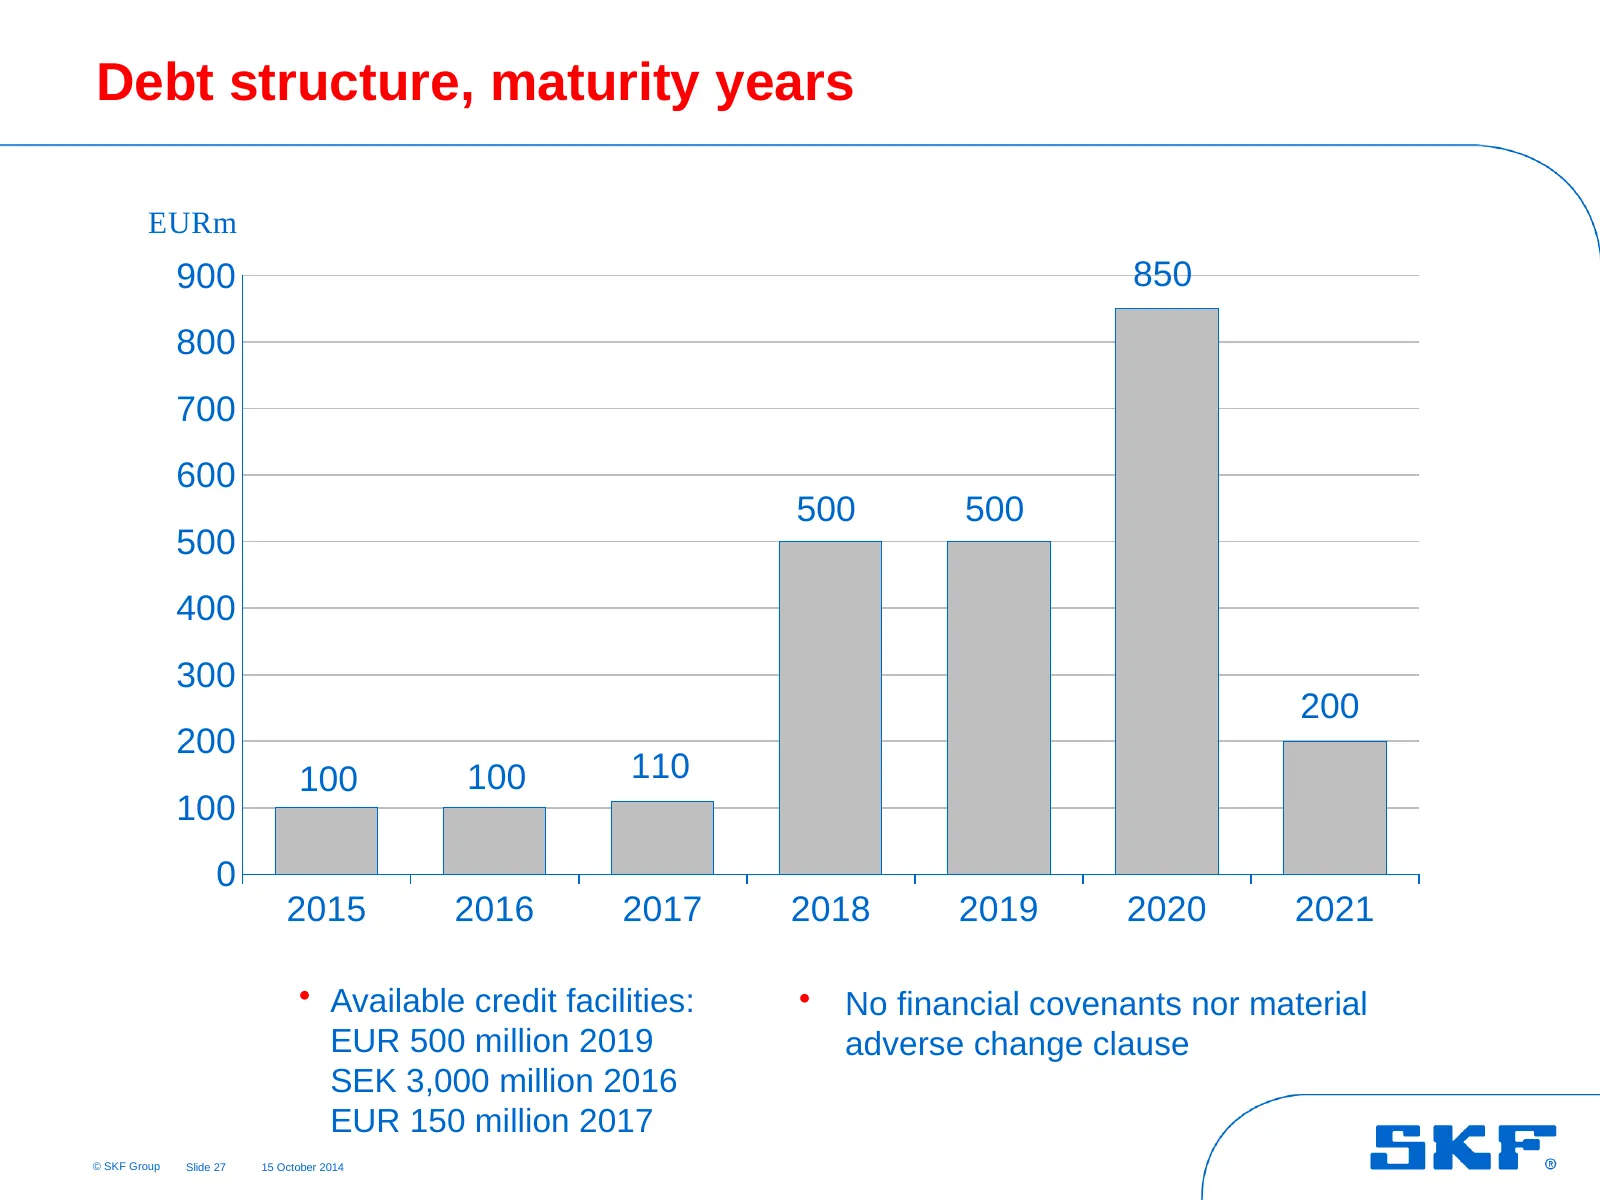
Slide 27: Debt structure, maturity years
Debt structure, maturity years EURm 900 850 800 700 600 500 500 500 400 300 200 200 100 100 110 100 0 2015 2016 2017 2018 2019 2020 2021 • Available credit facilities: • No financial covenants nor material EUR 500 million 2019 adverse change clause SEK 3,000 million 2016 EUR 150 million 2017 © SKF G
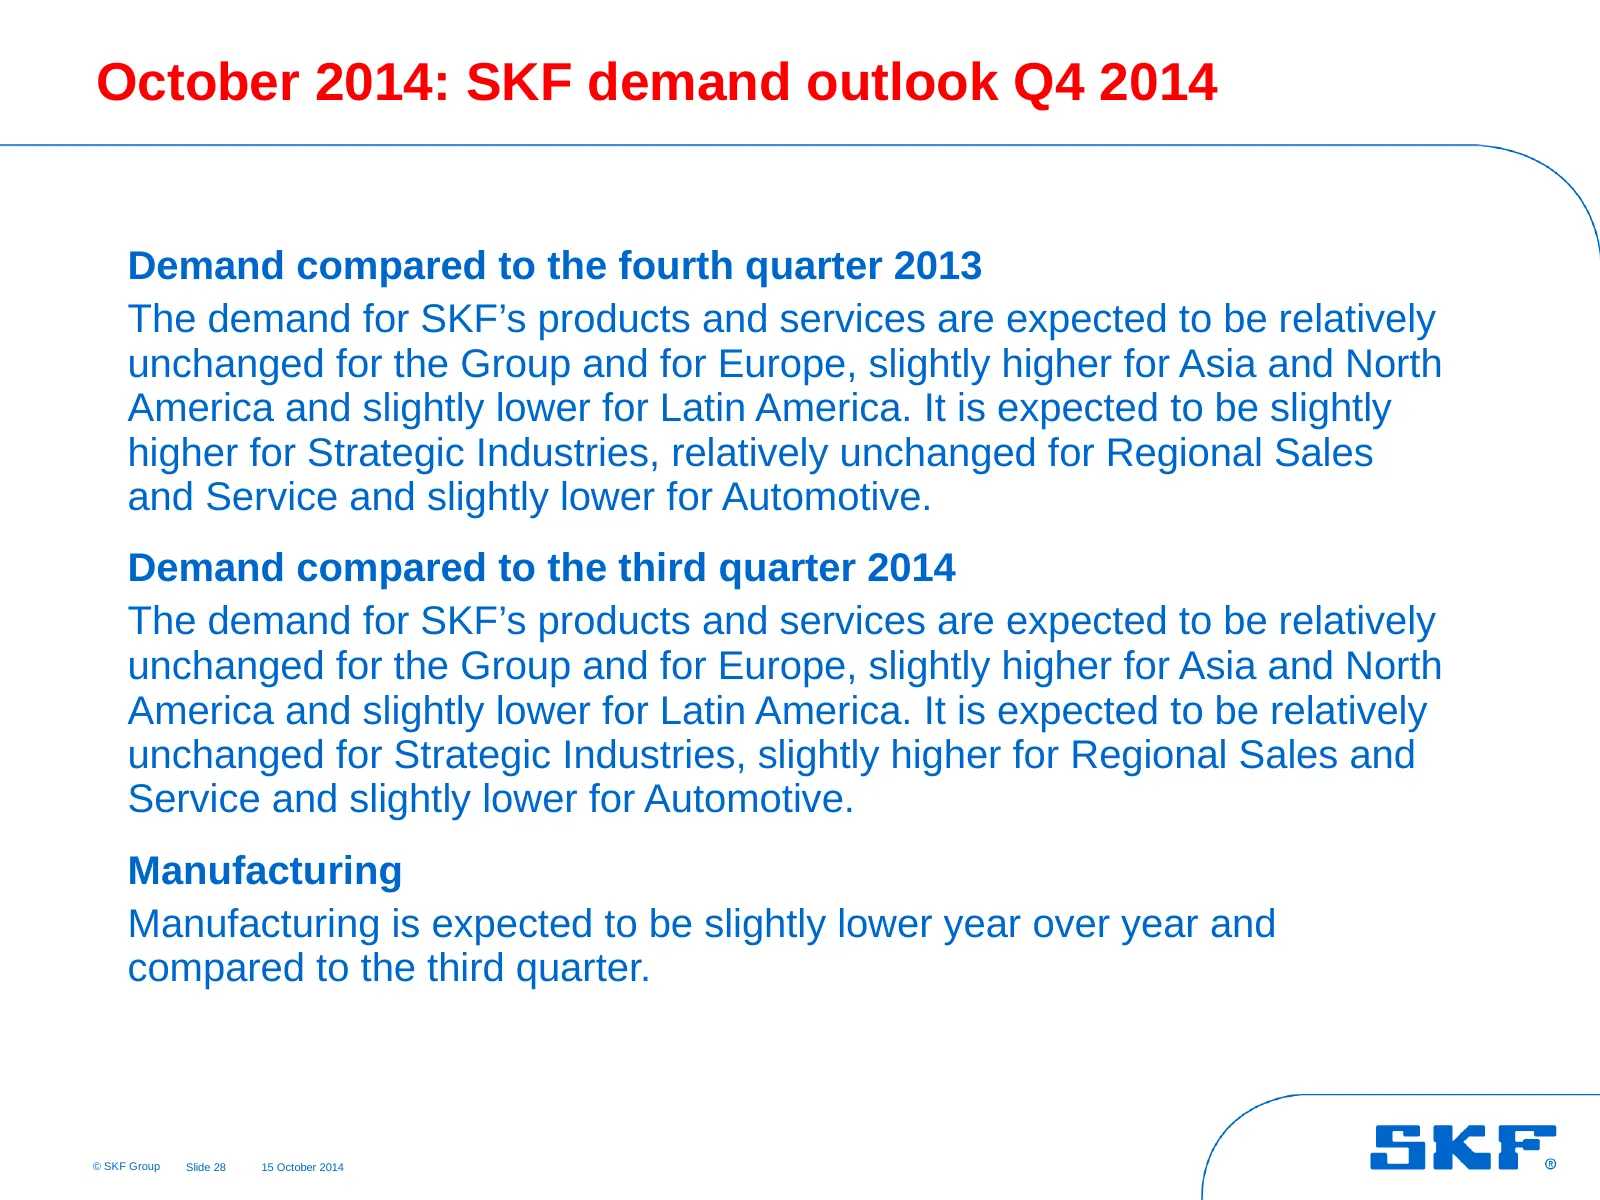
Slide 28: October 2014: SKF demand outlook Q4 2014
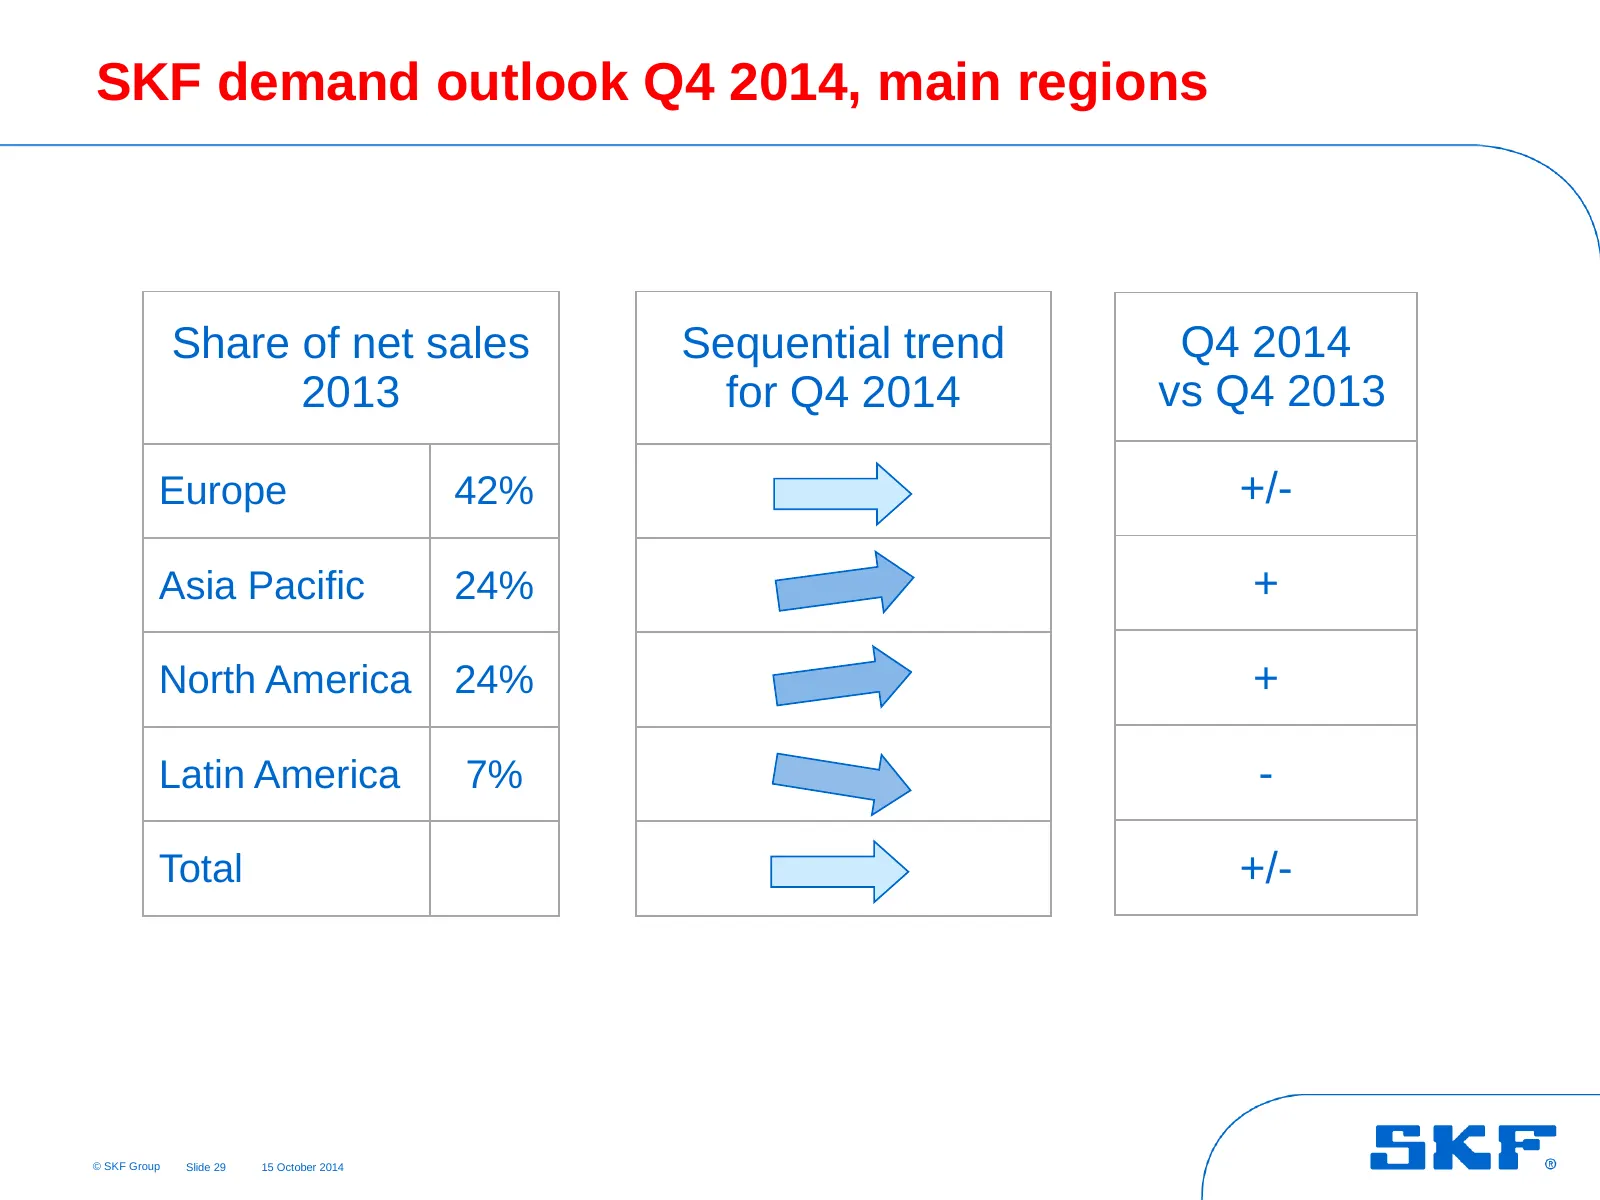
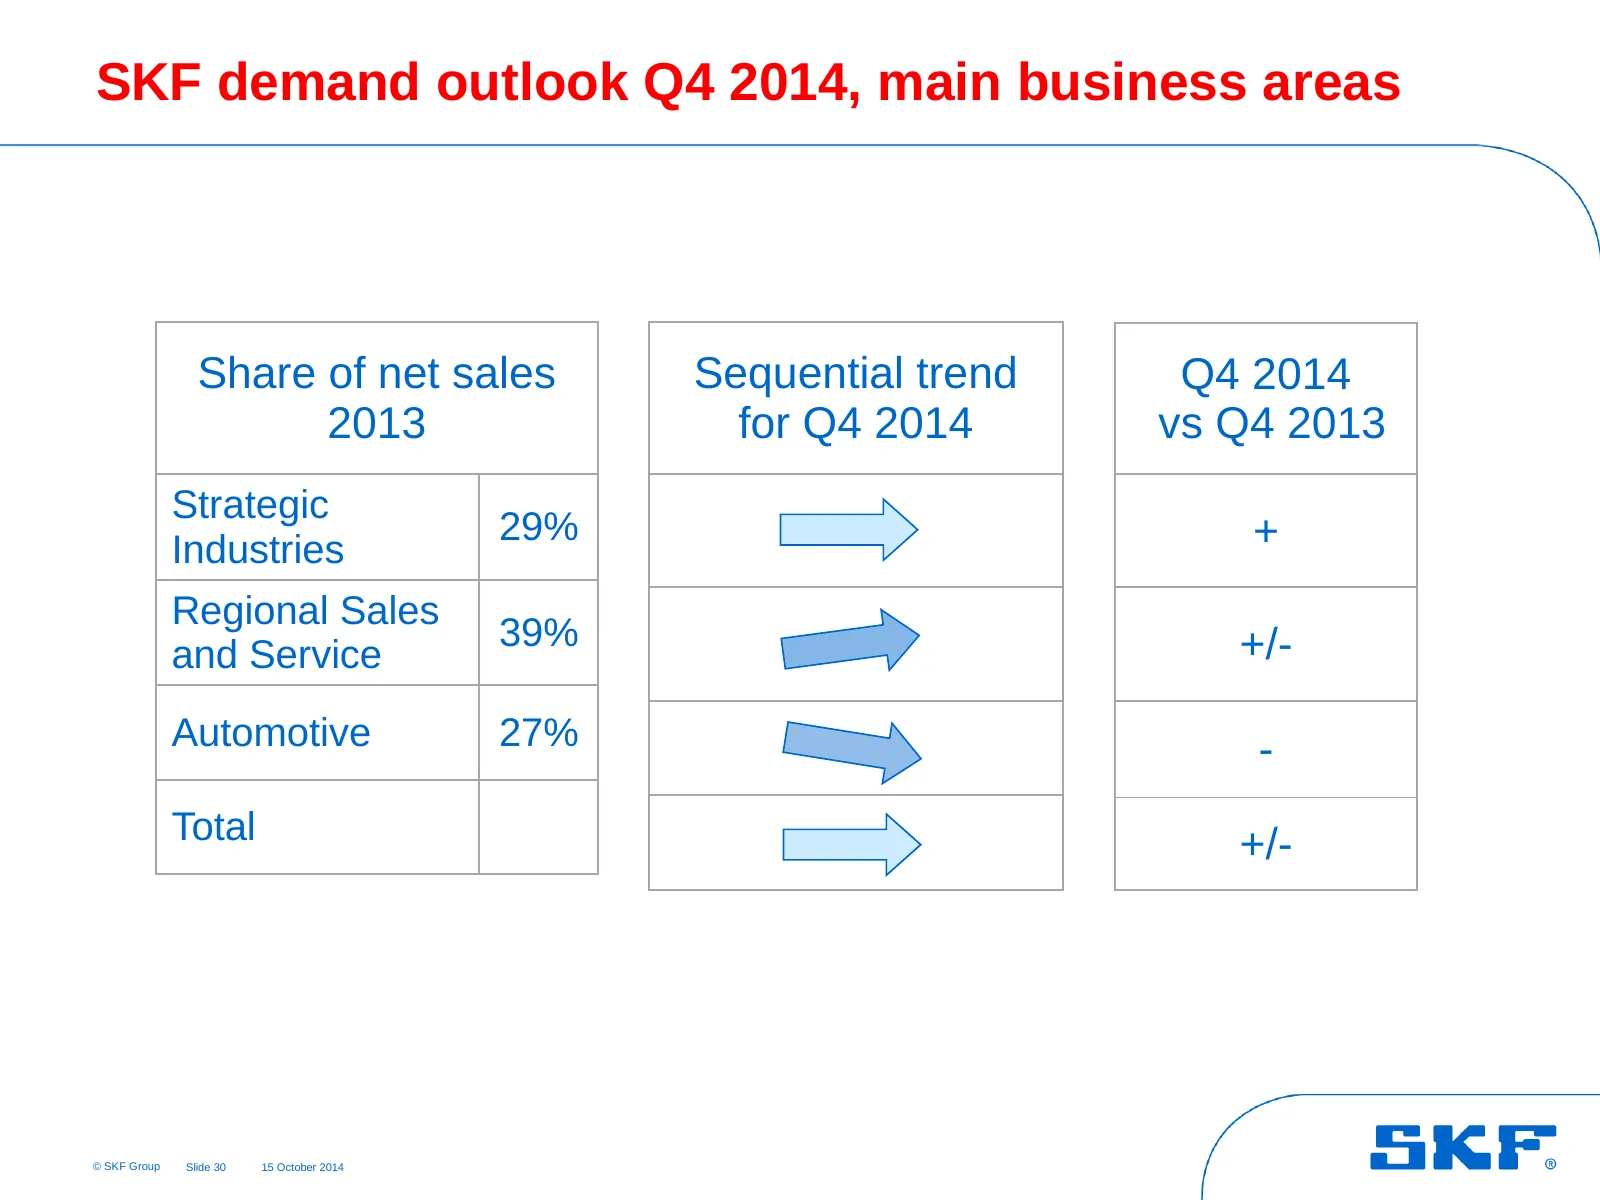
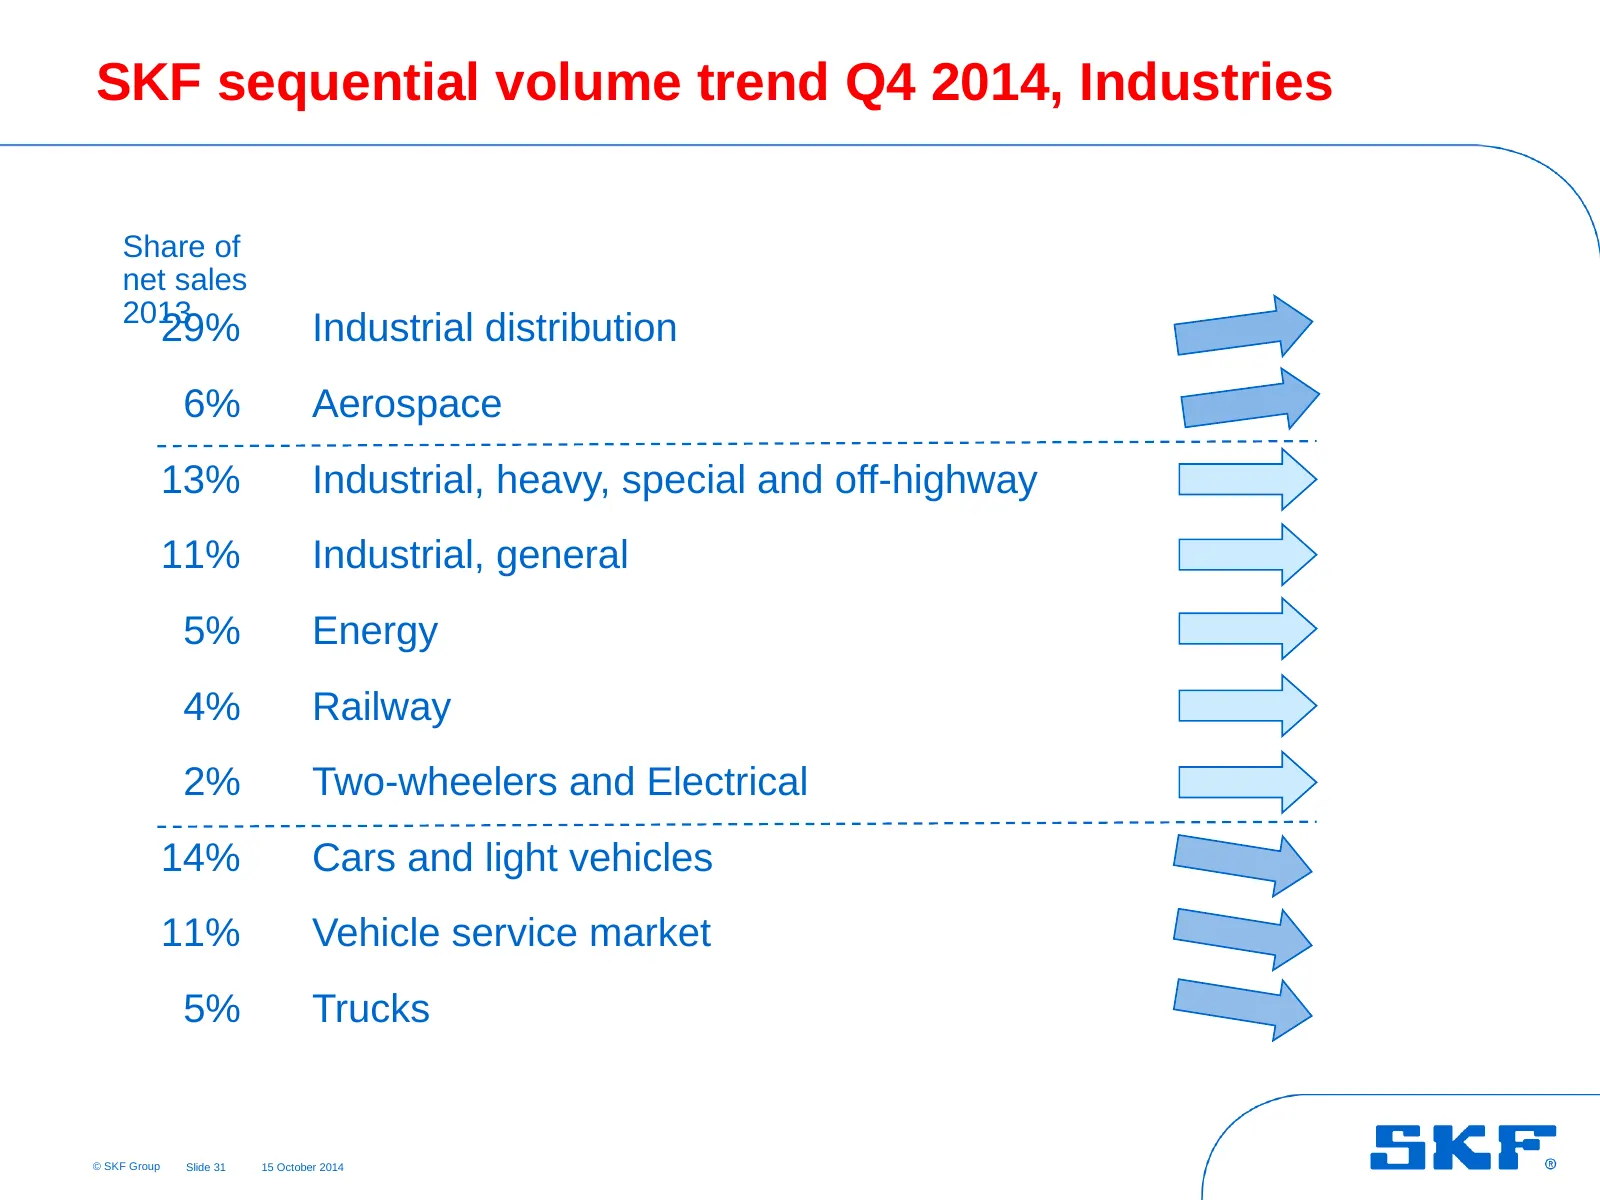
October 2014: SKF demand outlook Q4 2014 Demand compared to the fourth quarter 2013 The demand for SKF’s products and services are expected to be relatively unchanged for the Group and for Europe, slightly higher for Asia and North America and slightly lower for Latin America. It is expected to be s
Slide 29: SKF demand outlook Q4 2014, main regions
SKF demand outlook Q4 2014, main regions Share of net sales Sequential trend Q4 2014 2013 for Q4 2014 vs Q4 2013 Europe 42% +/- Asia Pacific 24% + North America 24% + Latin America 7% - Total +/- © SKF Group Slide 29 15 October 2014
Slide 30: SKF demand outlook Q4 2014, main business areas
SKF demand outlook Q4 2014, main business areas Share of net sales Sequential trend Q4 2014 2013 for Q4 2014 vs Q4 2013 Strategic 29% + Industries Regional Sales 39% +/- and Service Automotive 27% - Total +/- © SKF Group Slide 30 15 October 2014
Slide 31: SKF sequential volume trend Q4 2014, Industries
SKF sequential volume trend Q4 2014, Industries Share of net sales 2013 29% Industrial distribution 6% Aerospace 13% Industrial, heavy, special and off-highway 11% Industrial, general 5% Energy 4% Railway 2% Two-wheelers and Electrical 14% Cars and light vehicles 11% Vehicle service market 5% Trucks
Slide 32: Guidance for the fourth quarter 2014
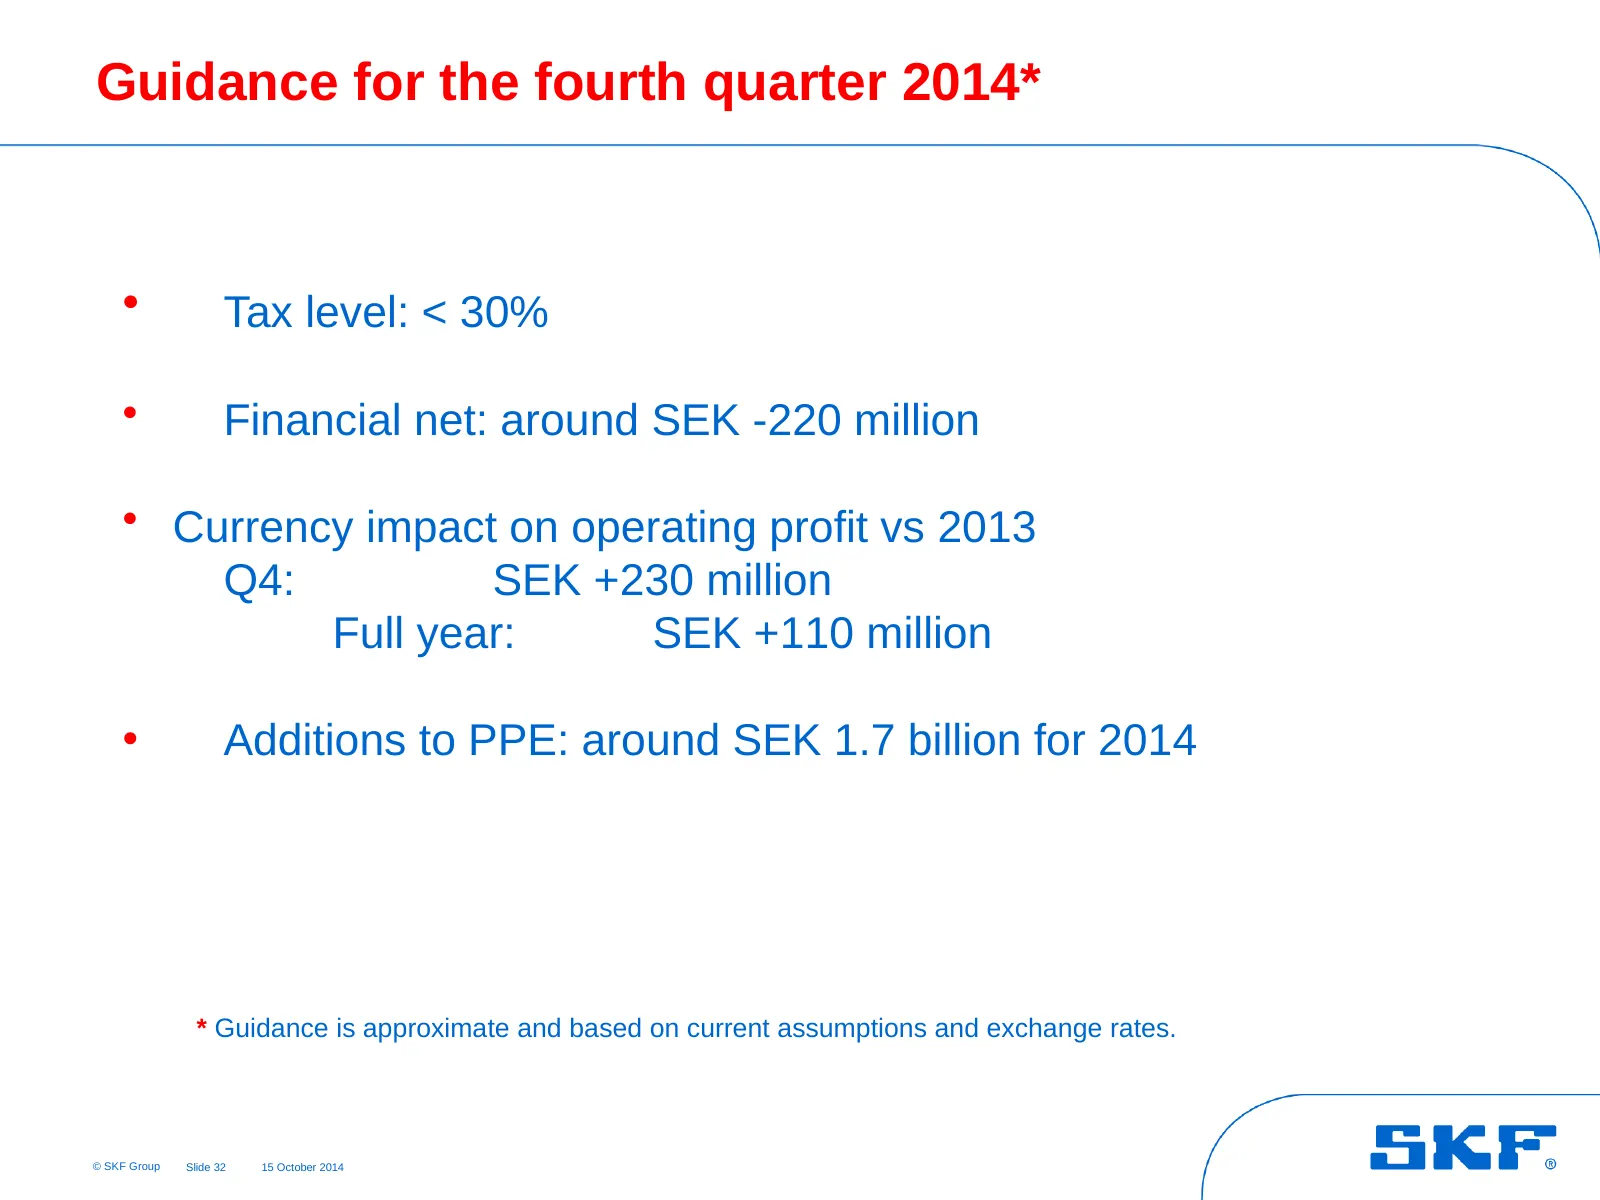
Guidance for the fourth quarter 2014* • Tax level: < 30% • Financial net: around SEK -220 million • Currency impact on operating profit vs 2013 Q4: SEK +230 million Full year: SEK +110 million • Additions to PPE: around SEK 1.7 billion for 2014 * Guidance is approximate and based on current assumpti
Slide 33: SKF's priorities
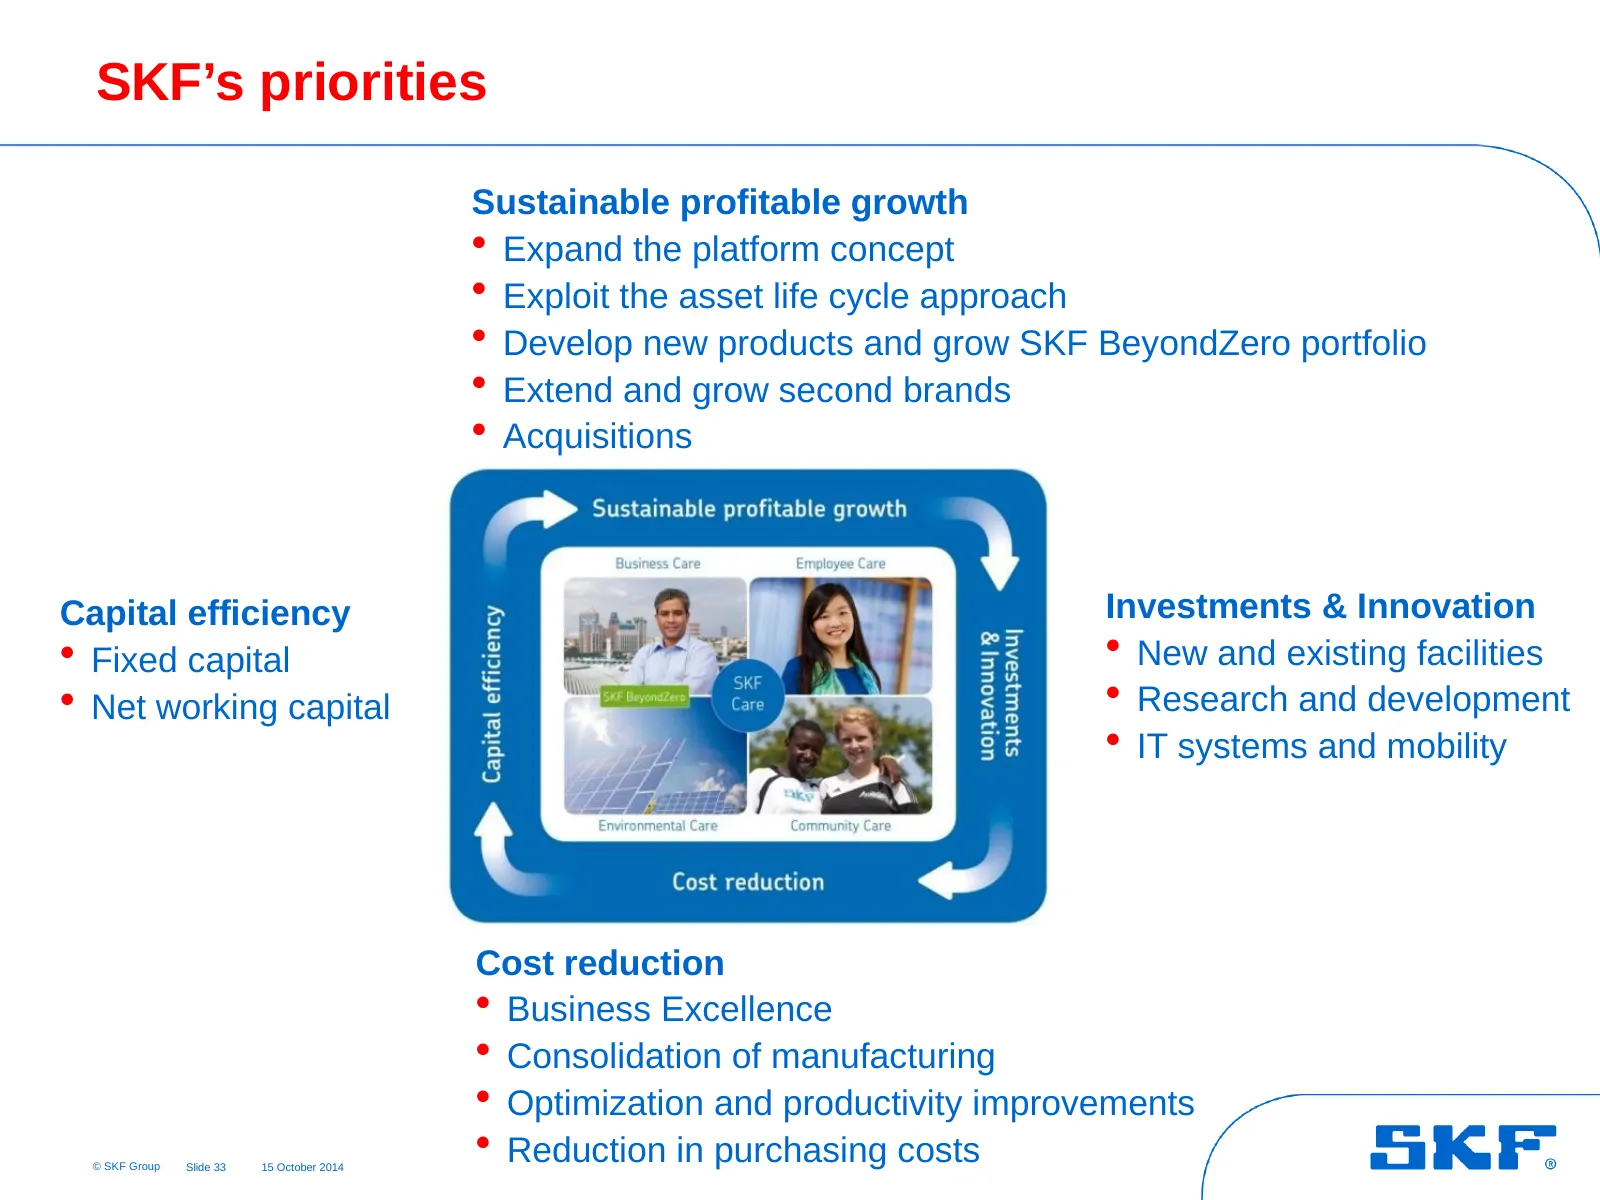
SKF’s priorities Sustainable profitable growth • Expand the platform concept • Exploit the asset life cycle approach • Develop new products and grow SKF BeyondZero portfolio • Extend and grow second brands • Acquisitions Capital efficiency Investments & Innovation • Fixed capital • New and existing
Slide 34: Cautionary statement
Cautionary statement This presentation contains forward-looking statements that are based on the current expectations of the management of SKF. Although management believes that the expectations reflected in such forward-looking statements are reasonable, no assurance can be given that such expectat
Slide 35: Kr.
Kr.
Source: Internet Archive copy of skf.com
More decks from SKF AB Class A
 Q3 2026 Earnings Presentation20 slides · Oct 21, 2026
 SKF India — Q1 FY2026-27 Earnings Presentation20 slides · Aug 17, 2026
 Q2 2026 Earnings Presentation21 slides · Jul 17, 2026
 SKF India (Industrial) — Q4 FY2026 Earnings Presentation20 slides · May 13, 2026
 Q1 2026 Earnings Presentation22 slides · Apr 21, 2026
 Q4 2025 Earnings Presentation19 slides · Jan 30, 2026