Arden Realty — 2005 NAREIT Institutional Investor Forum
37 slides from Arden Realty's conference presentation, Jun 8, 2005

Slide 1: 2005 NAREIT Institutional Investor Forum
2005 NAREIT Institutional Investor Forum June 8-10, 2005
Slide 2: Arden Realty Overview
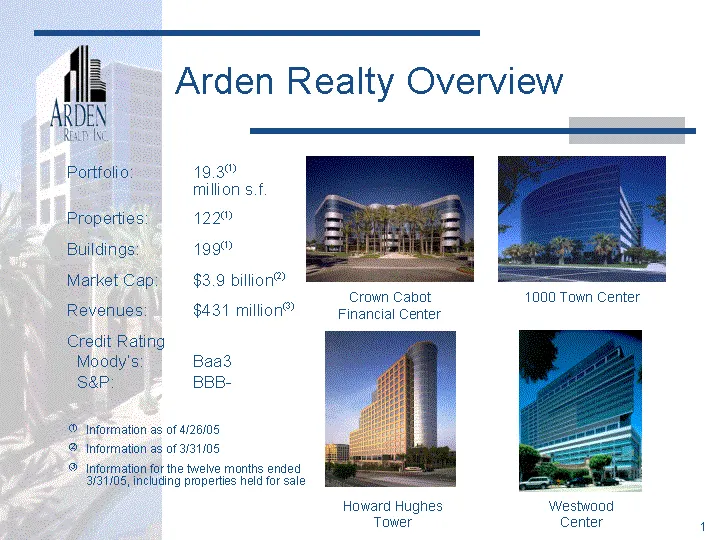
Arden Realty Overview Portfolio: 19.3(1) million s.f. Properties: 122(1) Buildings: 199(1) Market Cap: $3.9 billion(2) Revenues: $431 million(3) Credit Rating Moody's: Baa3 S&P: BBB- Howard Hughes Tower 1000 Town Center Crown Cabot Financial Center Westwood Center (1) Information as of 4/26/05 (2) I
Slide 3: Arden Realty Overview
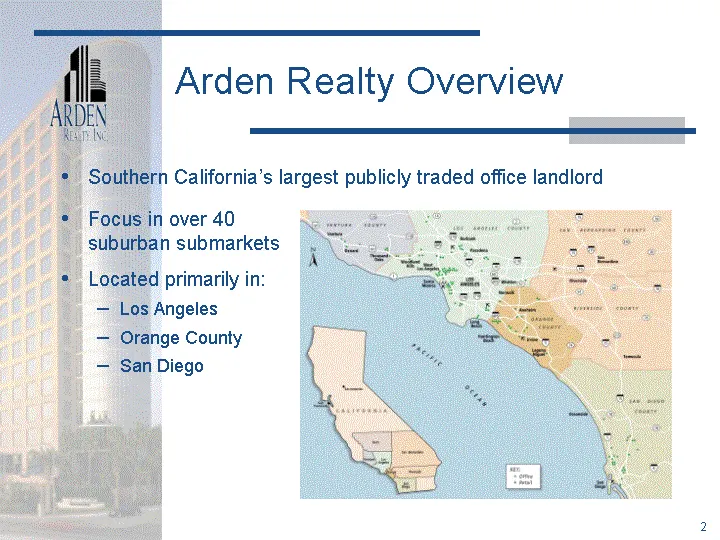
Arden Realty Overview Southern California's largest publicly traded office landlord Focus in over 40 suburban submarkets Located primarily in: Los Angeles Orange County San Diego
Slide 4: Arden Realty Overview
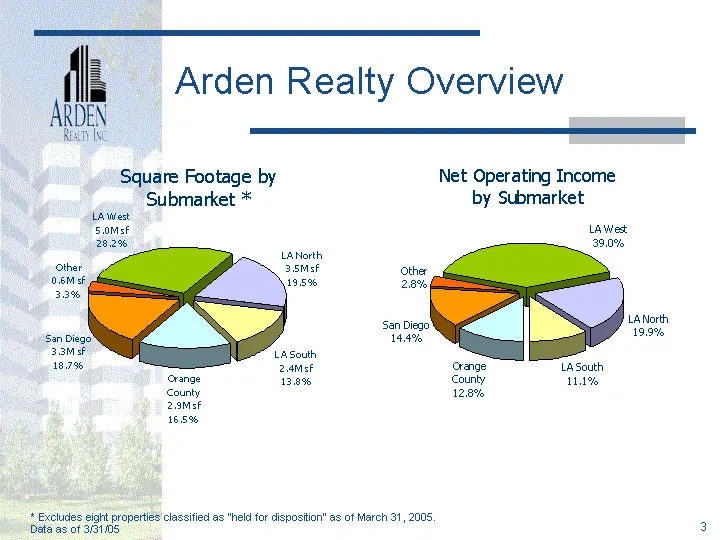
Arden Realty Overview LA West LA North LA South Orange County San Diego Other - 39 19.9 11.1 12.8 14.4 3.5 LA West 5.1M sf LA North 3.2M sf LA South 3.1M sf Orange County 3.6M sf San Diego 3.0M sf Other 0.6M sf - 5 3.5 2.4 2.9 3.3 0.6 * Excludes eight properties classified as "held for disposition"
Slide 5: Overview of California's Economy
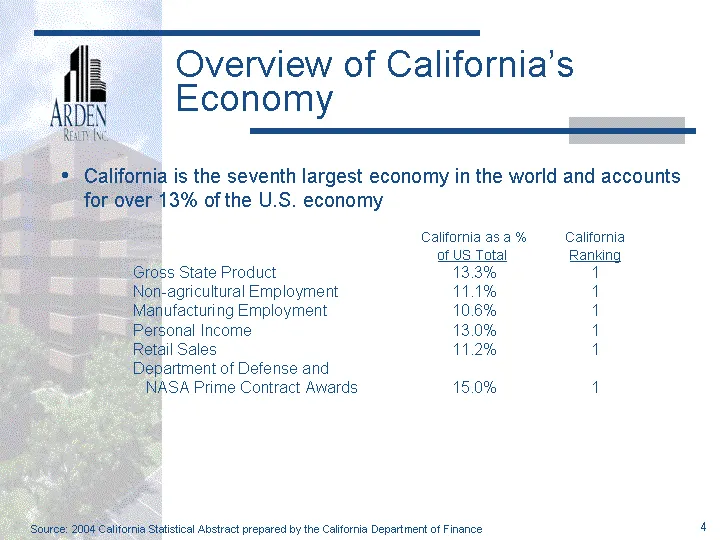
Overview of California's Economy California is the seventh largest economy in the world and accounts for over 13% of the U.S. economy California as a % California of US Total Ranking Gross State Product 13.3% 1 Non-agricultural Employment 11.1% 1 Manufacturing Employment 10.6% 1 Personal Income 13.0
Slide 6: Overview of Southern California's Economy
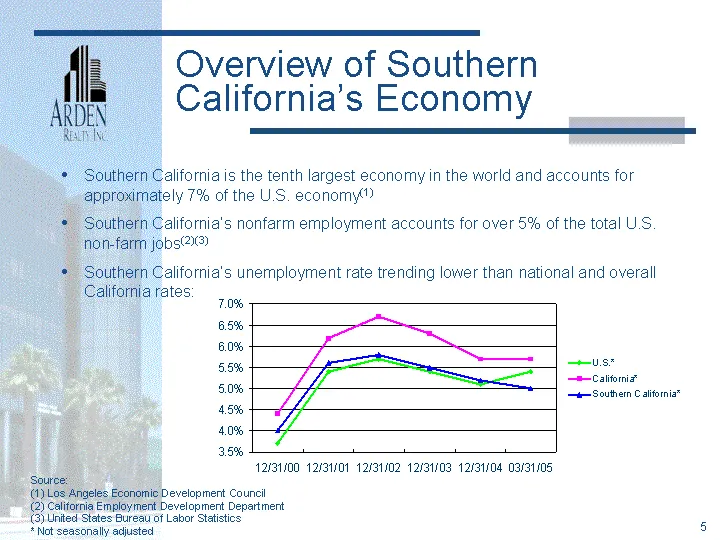
Overview of Southern California's Economy Southern California is the tenth largest economy in the world and accounts for approximately 7% of the U.S. economy(1) Southern California's nonfarm employment accounts for over 5% of the total U.S. non-farm jobs(2)(3) Southern California's unemployment rate
Slide 7: Diverse Economy
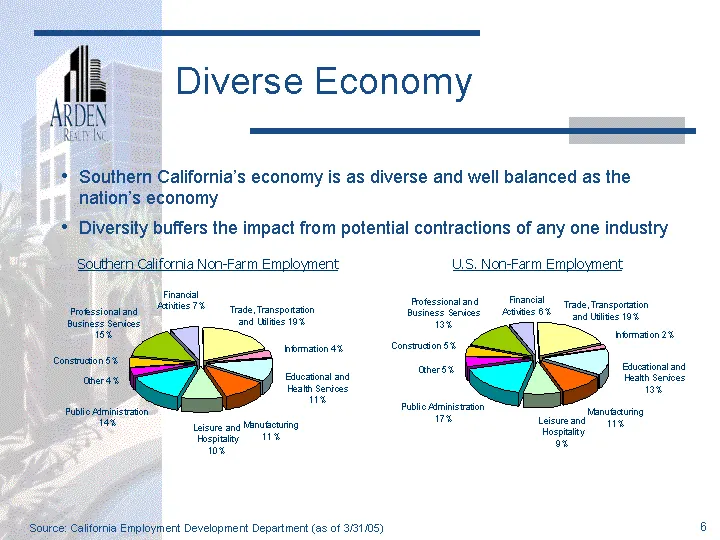
Professional and Business Services Financial Activities Trade, Transportation and Utilities Information Educational and Health Services Manufacturing Leisure and Hospitality Public Administration Other Construction - 0.15 0.07 0.19 0.04 0.11 0.11 0.1 0.14 0.04 0.05 Southern California's economy is a
Slide 8: Tenant Diversity
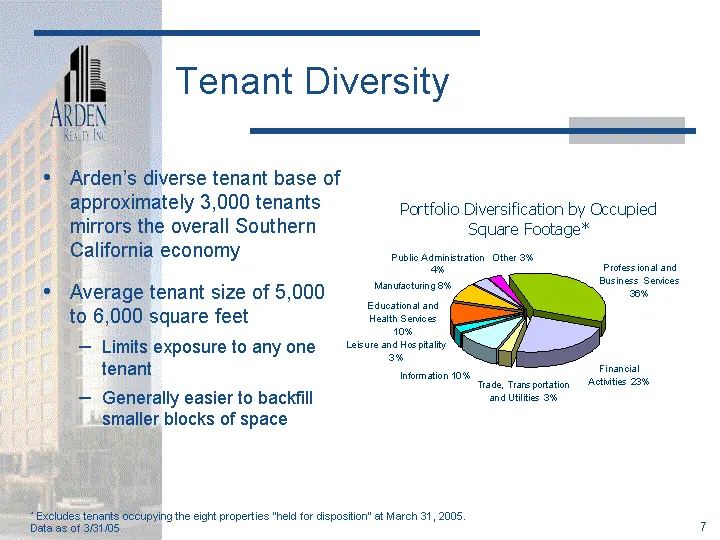
Tenant Diversity Arden's diverse tenant base of approximately 3,000 tenants mirrors the overall Southern California economy Average tenant size of 5,000 to 6,000 square feet Limits exposure to any one tenant Generally easier to backfill smaller blocks of space * Excludes tenants occupying the eight
Slide 9: Tenant Quality
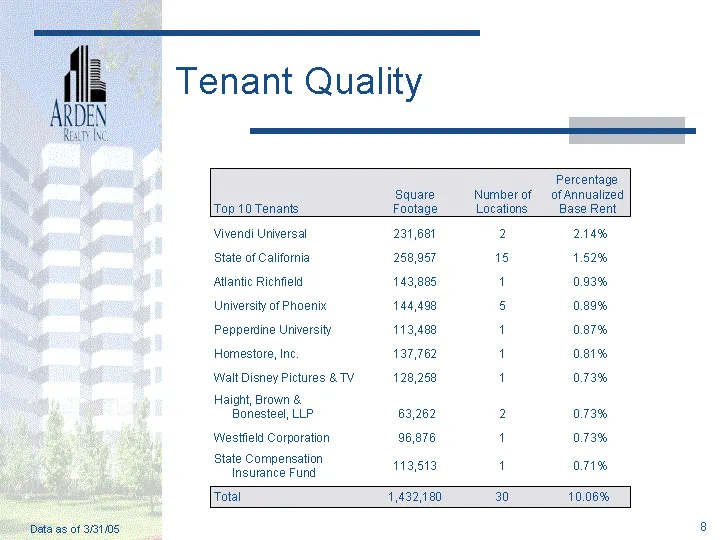
Tenant Quality Data as of 3/31/05 Top 10 Tenants Square Footage Number of Locations Percentage of Annualized Base Rent Vivendi Universal 231,681 2 2.14% State of California 258,957 15 1.52% Atlantic Richfield 143,885 1 0.93% University of Phoenix 144,498 5 0.89% Pepperdine University 113,488 1 0.87%
Slide 10: Focus for 2005
Retention and stabilize occupancy Minimize transaction and capital costs Execute capital allocation plan Dispose of non-core or mature assets Pursue strategic investment opportunities Maintain financial flexibility and reduce cost of capital Focus for 2005
Slide 11: Operations - Existing Portfolio
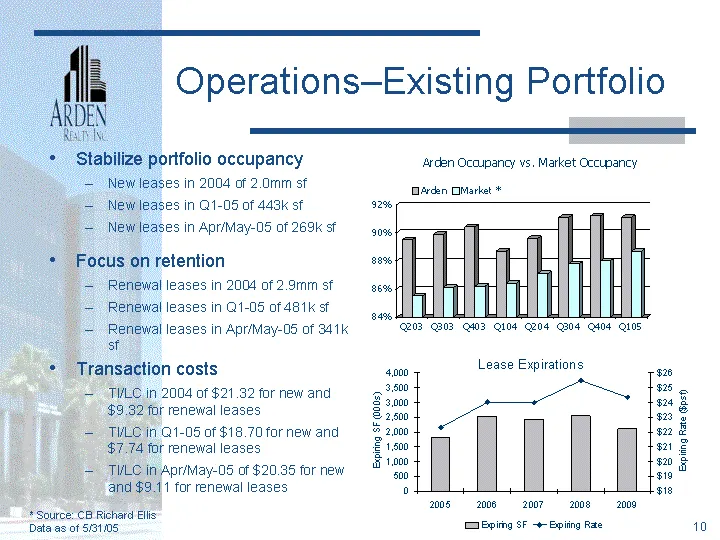
Q203 Q303 Q403 Q104 Q204 Q304 Q404 Q105 Arden 0.895 0.899 0.904 0.887 0.896 0.911 0.912 0.911 Market * 0.855 0.861 0.862 0.864 0.871 0.878 0.88 0.887 Stabilize portfolio occupancy New leases in 2004 of 2.0mm sf New leases in Q1-05 of 443k sf New leases in Apr/May-05 of 269k sf Operations-Existing Po
Slide 12: Capital Allocation Strategy
Capital Allocation Strategy Continue to upgrade our portfolio through the purchase of superior quality assets in highly desirable markets and the sale of non-core or mature assets Pursue strategic investment opportunities through: Acquisition of long term hold and value added assets Development Rede
Slide 13: Recent Acquisitions
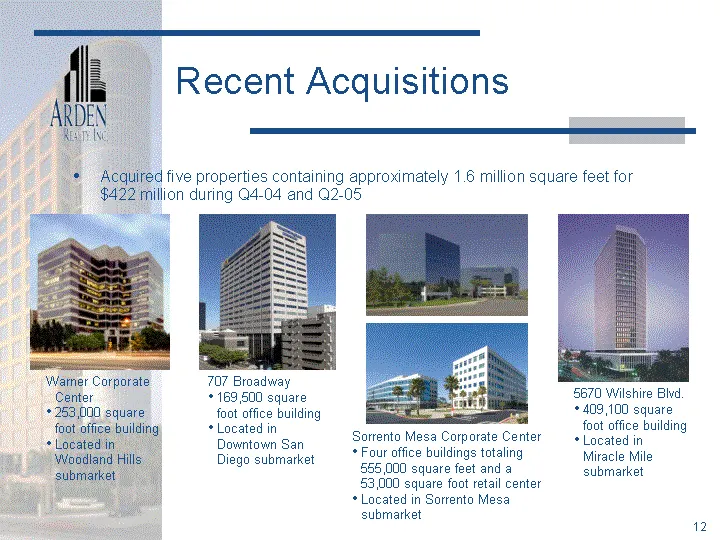
Recent Acquisitions Acquired five properties containing approximately 1.6 million square feet for $422 million during Q4-04 and Q2-05 Warner Corporate Center 253,000 square foot office building Located in Woodland Hills submarket 707 Broadway 169,500 square foot office building Located in Downtown S
Slide 14: Howard Hughes Center
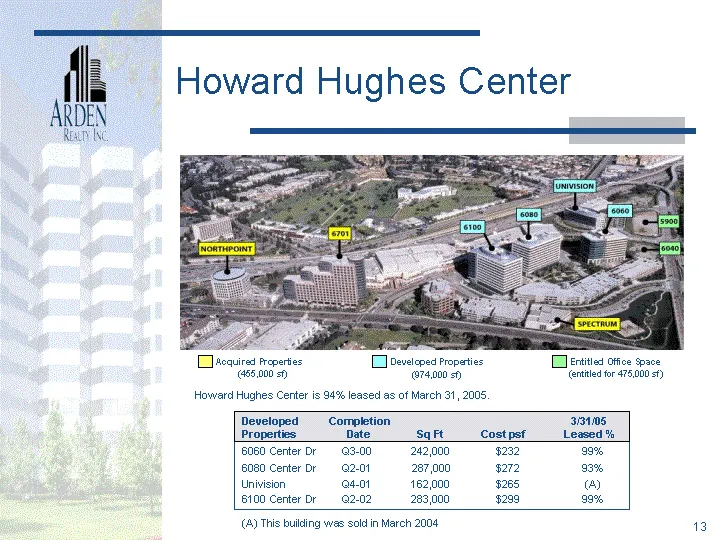
Howard Hughes Center Howard Hughes Center is 94% leased as of March 31, 2005. 6060 Center Dr Q3-00 242,000 $232 99% 6080 Center Dr Q2-01 287,000 $272 93% Univision Q4-01 162,000 $265 (A) 6100 Center Dr Q2-02 283,000 $299 99% Developed Completion 3/31/05 Properties Date Sq Ft Cost psf Leased % (A) Th
Slide 15: Capital Recycling Summary
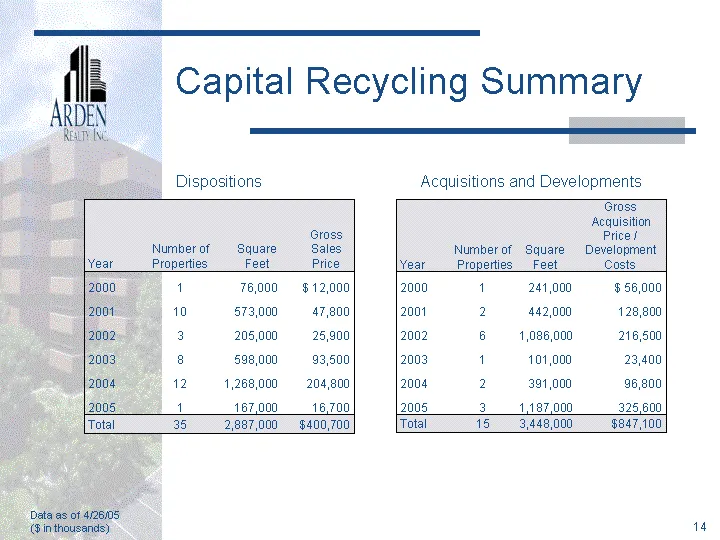
Capital Recycling Summary Data as of 4/26/05 ($ in thousands) Year Number of Properties Square Feet Gross Sales Price 2000 1 76,000 $ 12,000 2001 10 573,000 47,800 2002 3 205,000 25,900 2003 8 598,000 93,500 2004 12 1,268,000 204,800 2005 1 167,000 16,700 Total 35 2,887,000 $400,700 Year Number of P
Slide 16: Recent Office Investment Trends
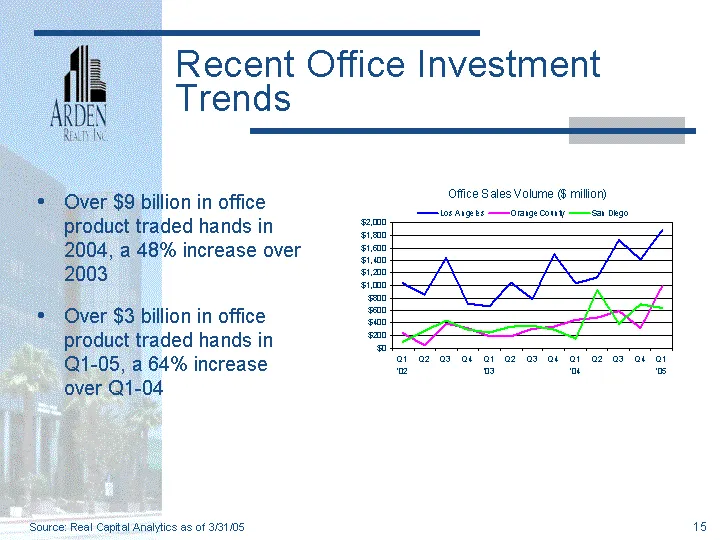
Source: Real Capital Analytics as of 3/31/05 Q1 '02 Q2 Q3 Q4 Q1 '03 Q2 Q3 Q4 Q1 '04 Q2 Q3 Q4 Q1 '05 Los Angeles 1038.71 852.7 1445.12 720.22 661.77 1043.32 785.64 1500.15 1039.55 1126.61 1726.63 1417.32 1875.3 Orange County 235.42 52.6 395.96 316 191.92 190.57 313.21 346.33 453.71 482.39 598.87 325.
Slide 17: Conservative and Flexible Capital Structure
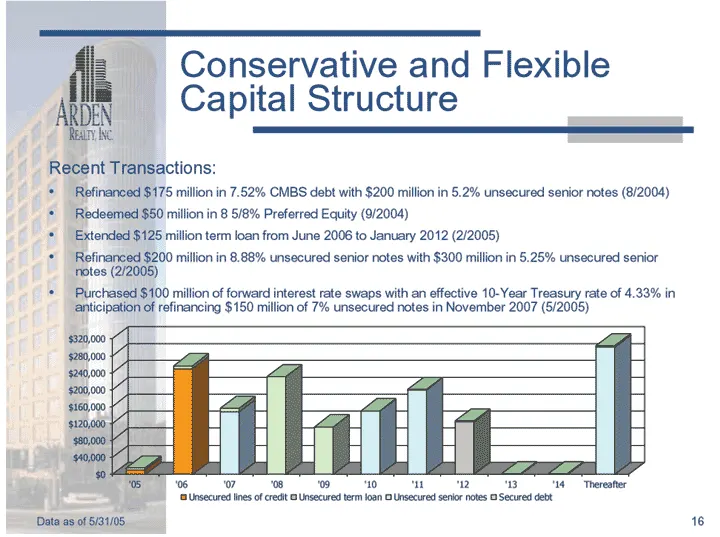
Conservative and Flexible Capital Structure Recent Transactions: Refinanced $175 million in 7.52% CMBS debt with $200 million in 5.2% unsecured senior notes (8/2004) Redeemed $50 million in 8 5/8% Preferred Equity (9/2004) Extended $125 million term loan from June 2006 to January 2012 (2/2005) Refin
Slide 18: Financial Ratios
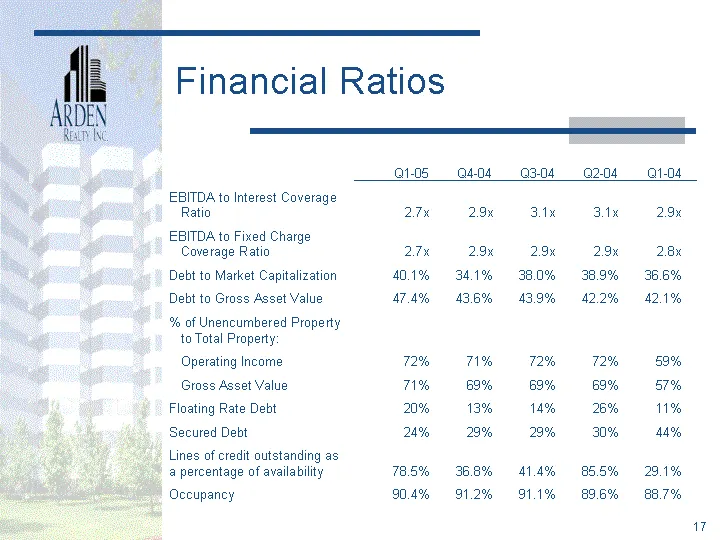
Q1-05 Q4-04 Q3-04 Q2-04 Q1-04 EBITDA to Interest Coverage Ratio 2.7x 2.9x 3.1x 3.1x 2.9x EBITDA to Fixed Charge Coverage Ratio 2.7x 2.9x 2.9x 2.9x 2.8x Debt to Market Capitalization 40.1% 34.1% 38.0% 38.9% 36.6% Debt to Gross Asset Value 47.4% 43.6% 43.9% 42.2% 42.1% % of Unencumbered Property to To
Slide 19: Southern California Real Estate Markets
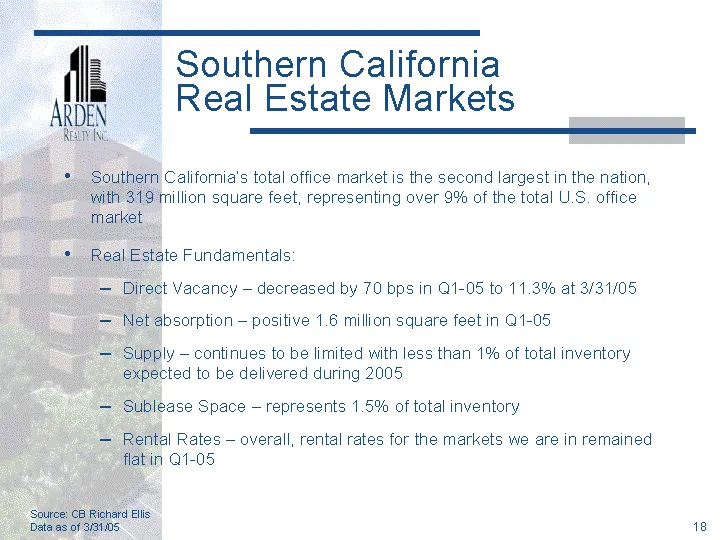
Southern California Real Estate Markets Southern California's total office market is the second largest in the nation, with 319 million square feet, representing over 9% of the total U.S. office market Real Estate Fundamentals: Direct Vacancy - decreased by 70 bps in Q1-05 to 11.3% at 3/31/05 Net ab
Slide 20: Southern California Real Estate Markets (cont'd)
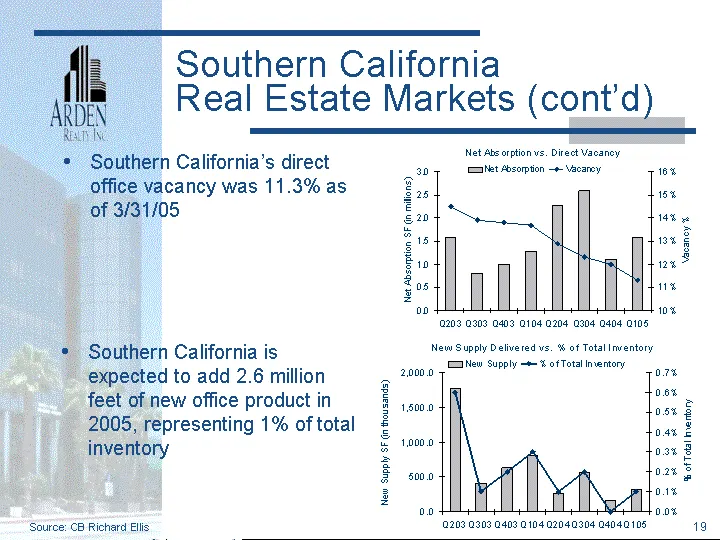
Southern California Real Estate Markets (cont'd) Source: CB Richard Ellis Q203 Q303 Q403 Q104 Q204 Q304 Q404 Q105 Net Absorption 1.581244 0.809351 0.994435 1.27999 2.26281 2.5867 1.105452 1.585121 Vacancy 0.145 0.139 0.138 0.137 0.129 0.123 0.12 0.113 Southern California's direct office vacancy was
Slide 21: Southern California Real Estate Markets (cont'd)
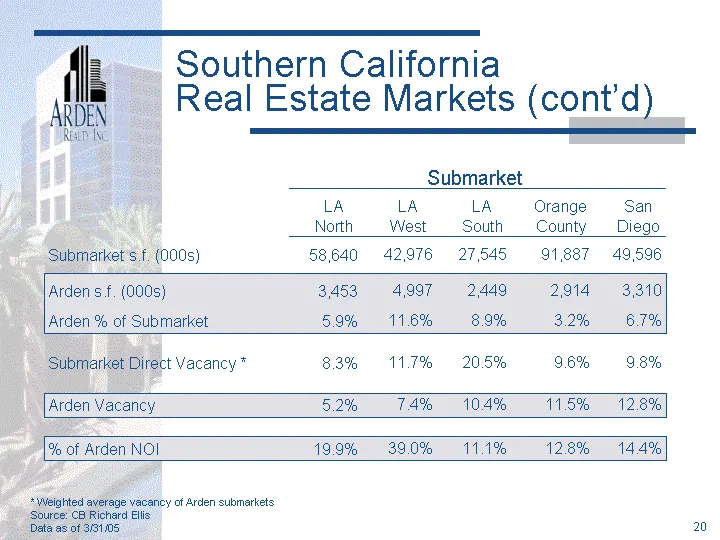
Southern California Real Estate Markets (cont'd) Submarket * Weighted average vacancy of Arden submarkets Source: CB Richard Ellis Data as of 3/31/05 LA North LA West LA South Orange County San Diego Submarket s.f. (000s) 58,640 42,976 27,545 91,887 49,596 Arden s.f. (000s) 3,453 4,997 2,449 2,914 3
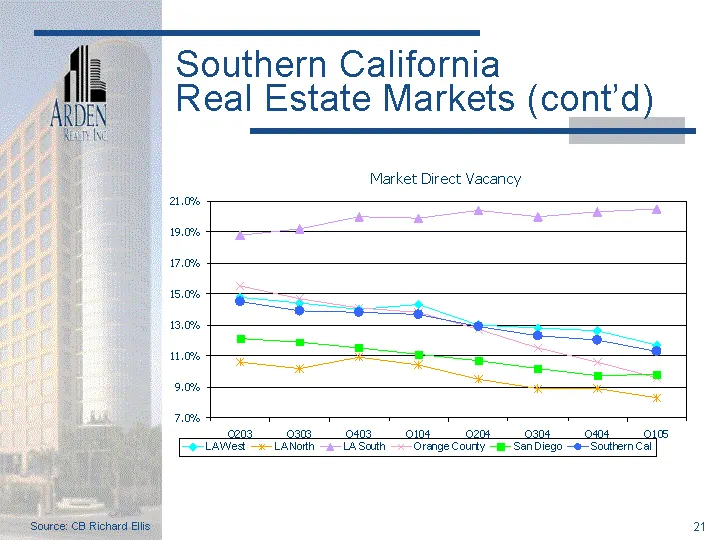
Slide 22: Southern California Real Estate Markets (cont'd)
Southern California Real Estate Markets (cont'd) Source: CB Richard Ellis Q203 Q303 Q403 Q104 Q204 Q304 Q404 Q105 LA West 0.148 0.144 0.14 0.143 0.13 0.128 0.126 0.117 LA North 0.106 0.102 0.109 0.104 0.095 0.089 0.089 0.083 LA South 0.188 0.192 0.2 0.199 0.204 0.2 0.203 0.205 Orange County 0.155 0.
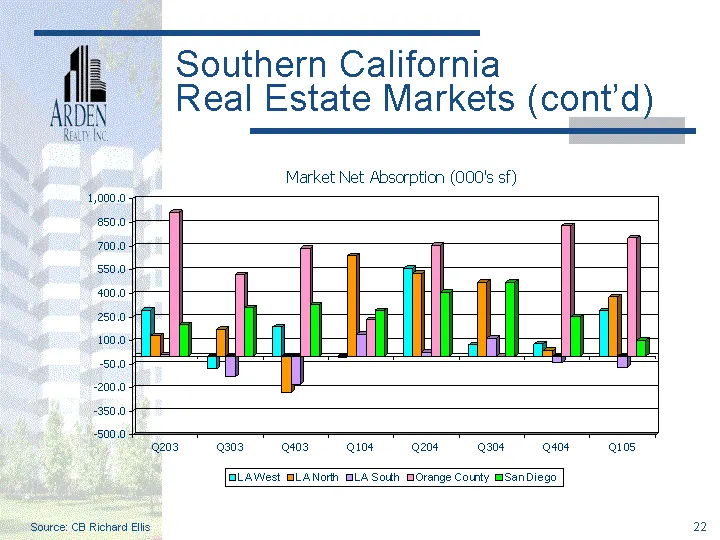
Slide 23: Southern California Real Estate Markets (cont'd)
Southern California Real Estate Markets (cont'd) Source: CB Richard Ellis Q203 Q303 Q403 Q104 Q204 Q304 Q404 Q105 LA West 293.7 -79.6 186 -5.8 558.2 74.179 78.544 291.538 LA North 132.9 172.2 -231 641.2 526.3 472.048 35.523 378.903 LA South 8.7 -131.3 -177.9 139 27.5 115.784 -40.494 -70.656 Orange C
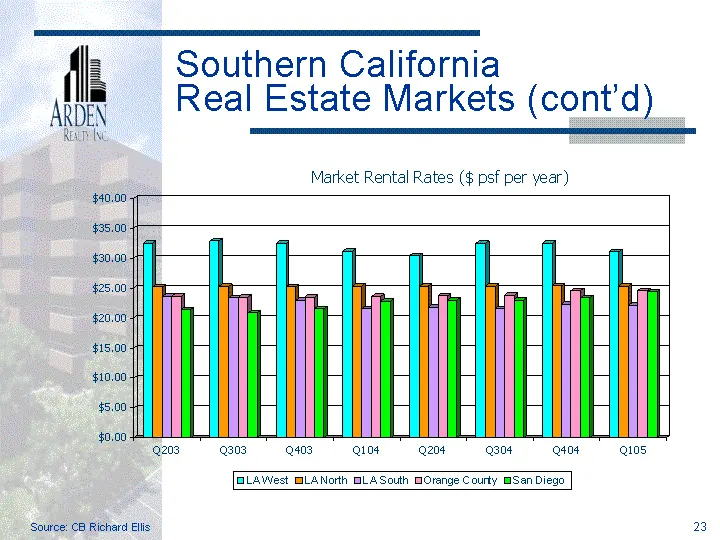
Slide 24: Southern California Real Estate Markets (cont'd)
Southern California Real Estate Markets (cont'd) Source: CB Richard Ellis Q203 Q303 Q403 Q104 Q204 Q304 Q404 Q105 LA West 32.52 32.88 32.52 31.2 30.48 32.52 32.52 31.08 LA North 25.2 25.33 25.17 25.39 25.32 25.35 25.41 25.37 LA South 23.64 23.4 22.92 21.6 21.84 21.6 22.32 22.08 Orange County 23.64 2
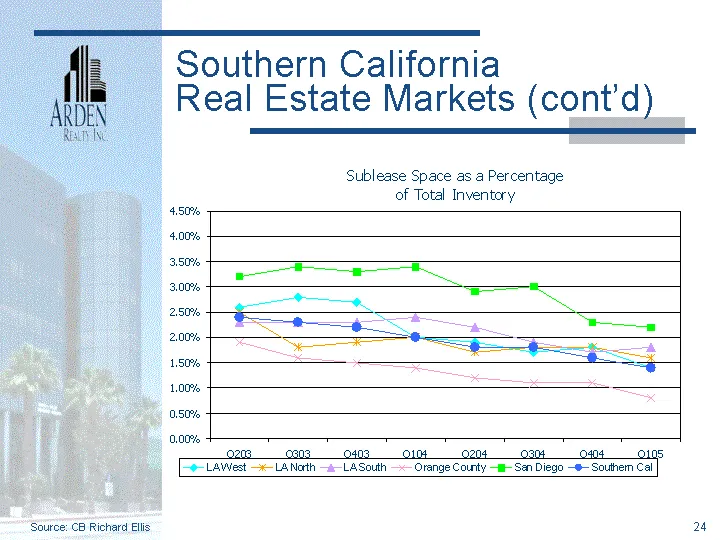
Slide 25: Southern California Real Estate Markets (cont'd)
Southern California Real Estate Markets (cont'd) Q203 Q303 Q403 Q104 Q204 Q304 Q404 Q105 LA West 0.026 0.028 0.027 0.02 0.019 0.017 0.018 0.014 LA North 0.025 0.018 0.019 0.02 0.017 0.018 0.018 0.016 LA South 0.023 0.023 0.023 0.024 0.022 0.019 0.017 0.018 Orange County 0.019 0.016 0.015 0.014 0.012
Slide 26: Southern California Real Estate Markets
Southern California Real Estate Markets Los Angeles - 177 million square foot market, over 5% of the U.S. office market Major submarkets include San Fernando Valley, Tri-Cities, San Gabriel Valley, West Los Angeles, South Bay, Hollywood/Wilshire and Downtown Orange County - 92 million square foot ma
Slide 27: Los Angeles North
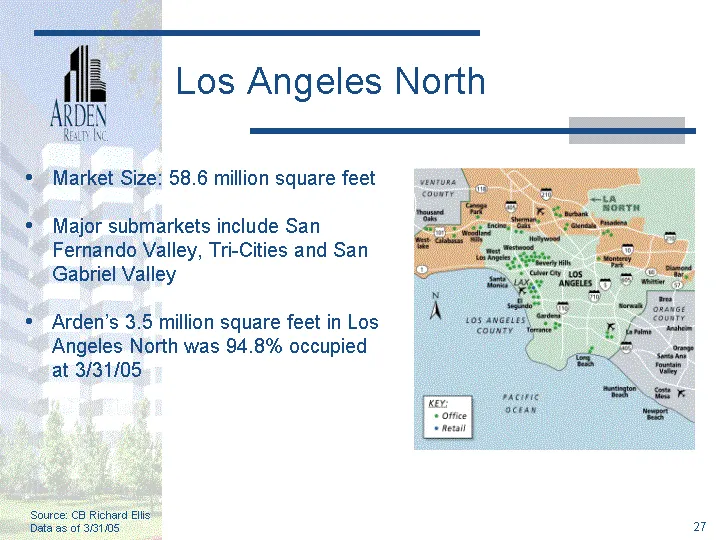
Los Angeles North Market Size: 58.6 million square feet Major submarkets include San Fernando Valley, Tri-Cities and San Gabriel Valley Arden's 3.5 million square feet in Los Angeles North was 94.8% occupied at 3/31/05 Source: CB Richard Ellis Data as of 3/31/05
Slide 28: LA North Major Submarkets
LA North Major Submarkets San Fernando Valley - 22 million square foot submarket Sherman Oaks, Encino and Woodland Hills: Submarket Size: 11.9 million square feet Major Industries: Professional Services, Insurance, Banking and Healthcare Tri-Cities - 24 million square foot submarket Pasadena: Submar
Slide 29: Los Angeles West
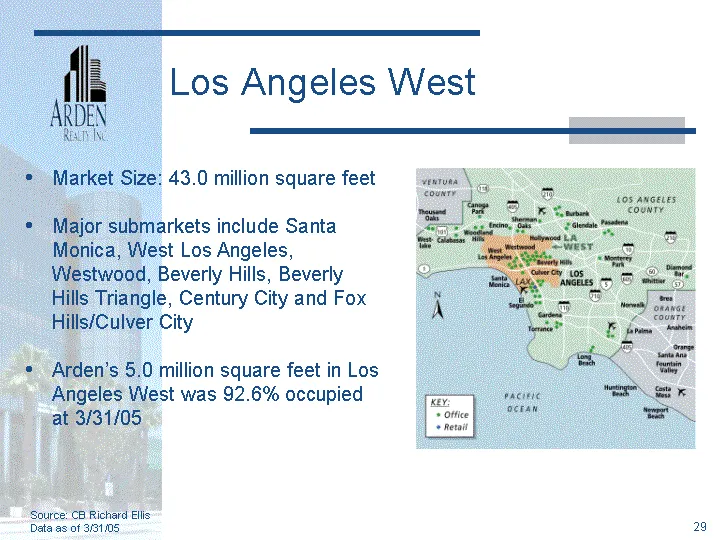
Los Angeles West Market Size: 43.0 million square feet Major submarkets include Santa Monica, West Los Angeles, Westwood, Beverly Hills, Beverly Hills Triangle, Century City and Fox Hills/Culver City Arden's 5.0 million square feet in Los Angeles West was 92.6% occupied at 3/31/05 Source: CB Richard
Slide 30: LA West Major Submarkets
LA West Major Submarkets Santa Monica and West Los Angeles: Submarket Size: 10.6 million square feet Major Industries: Entertainment, Advertising, Professional Services and High Tech. Westwood: Submarket Size: 3.4 million square feet Major Industries: Entertainment, Financial Services, Healthcare, P
Slide 31: LA South Major Submarkets
LA South Major Submarkets LAX (Los Angeles International Airport): Submarket Size: 3.0 million square feet Major Industries: Travel related industries and Professional Services El Segundo: Submarket Size: 9.1 million square feet Major Industries: Aerospace, Defense, Airlines, Entertainment and Profe
Slide 32: Orange County Market
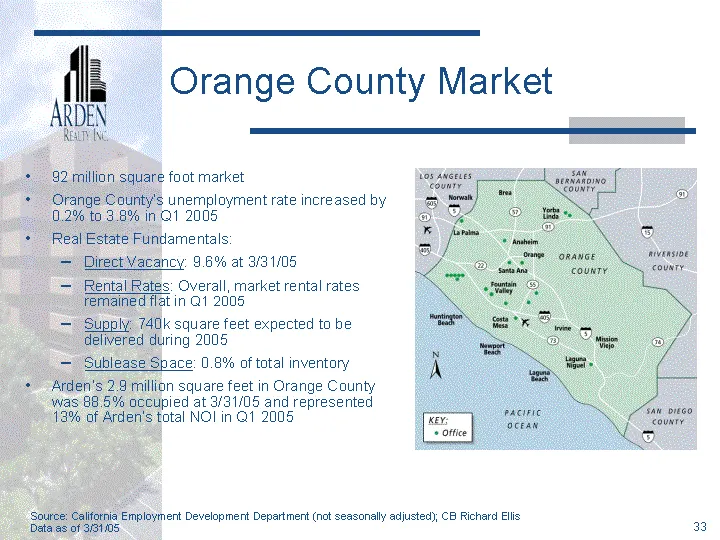
92 million square foot market Orange County's unemployment rate increased by 0.2% to 3.8% in Q1 2005 Real Estate Fundamentals: Direct Vacancy: 9.6% at 3/31/05 Rental Rates: Overall, market rental rates remained flat in Q1 2005 Supply: 740k square feet expected to be delivered during 2005 Sublease Sp
Slide 33: Orange County Major Submarkets
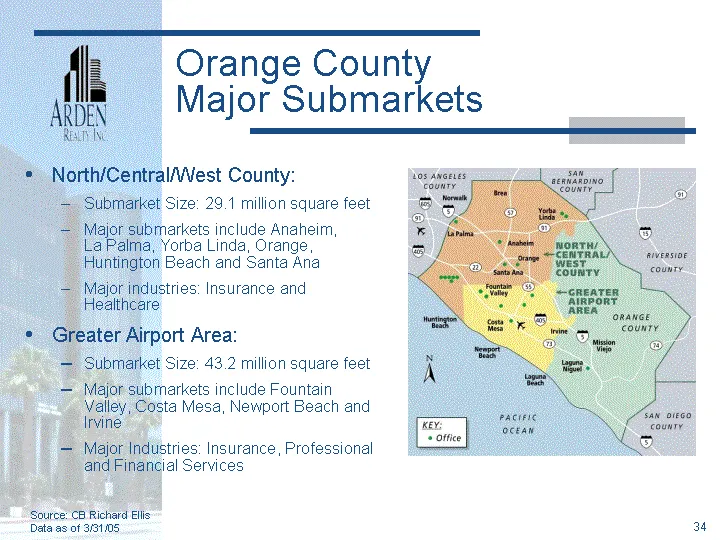
Orange County Major Submarkets Greater Airport Area: Submarket Size: 43.2 million square feet Major submarkets include Fountain Valley, Costa Mesa, Newport Beach and Irvine Major Industries: Insurance, Professional and Financial Services North/Central/West County: Submarket Size: 29.1 million square
Slide 34: Orange County Major Submarkets (cont'd)
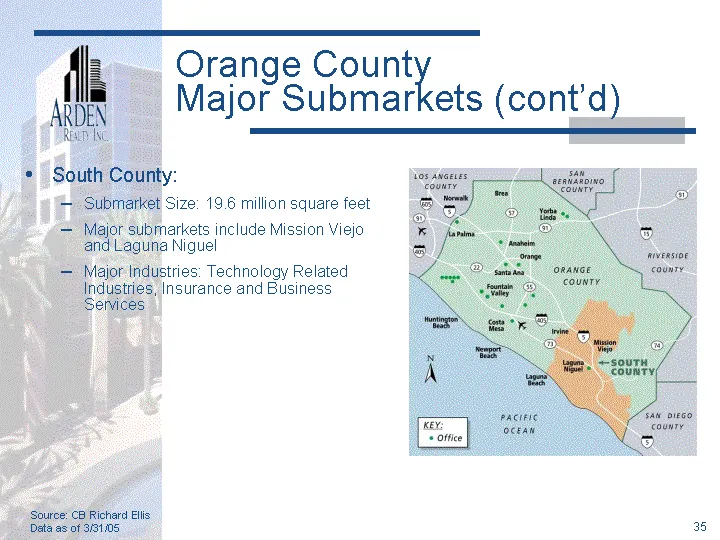
Orange County Major Submarkets (cont'd) South County: Submarket Size: 19.6 million square feet Major submarkets include Mission Viejo and Laguna Niguel Major Industries: Technology Related Industries, Insurance and Business Services Source: CB Richard Ellis Data as of 3/31/05
Slide 35: San Diego Market
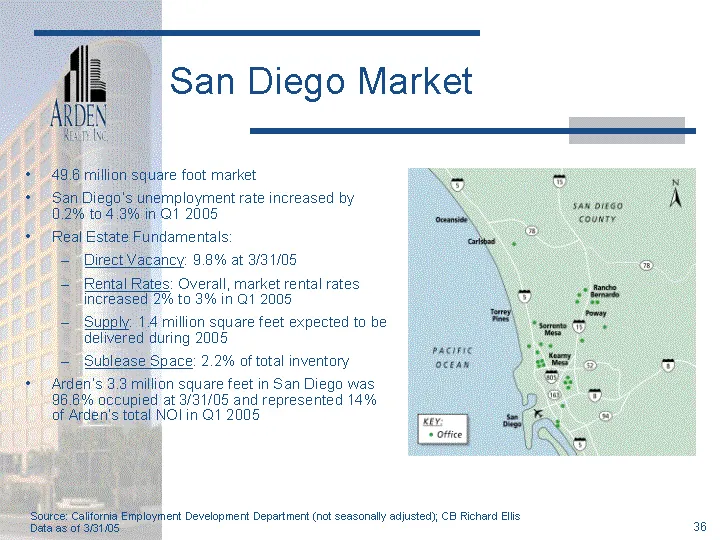
San Diego Market 49.6 million square foot market San Diego's unemployment rate increased by 0.2% to 4.3% in Q1 2005 Real Estate Fundamentals: Direct Vacancy: 9.8% at 3/31/05 Rental Rates: Overall, market rental rates increased 2% to 3% in Q1 2005 Supply: 1.4 million square feet expected to be delive
Slide 36: San Diego Major Submarkets
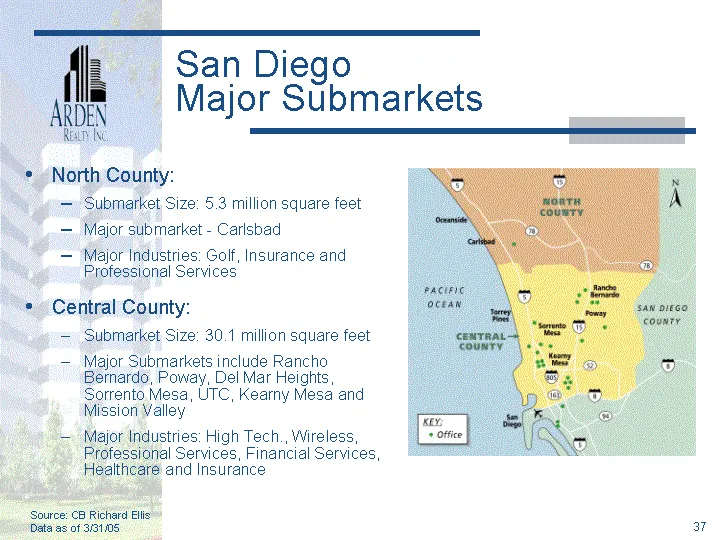
San Diego Major Submarkets North County: Submarket Size: 5.3 million square feet Major submarket - Carlsbad Major Industries: Golf, Insurance and Professional Services Central County: Submarket Size: 30.1 million square feet Major Submarkets include Rancho Bernardo, Poway, Del Mar Heights, Sorrento
Slide 37: San Diego Major Submarkets (cont'd)
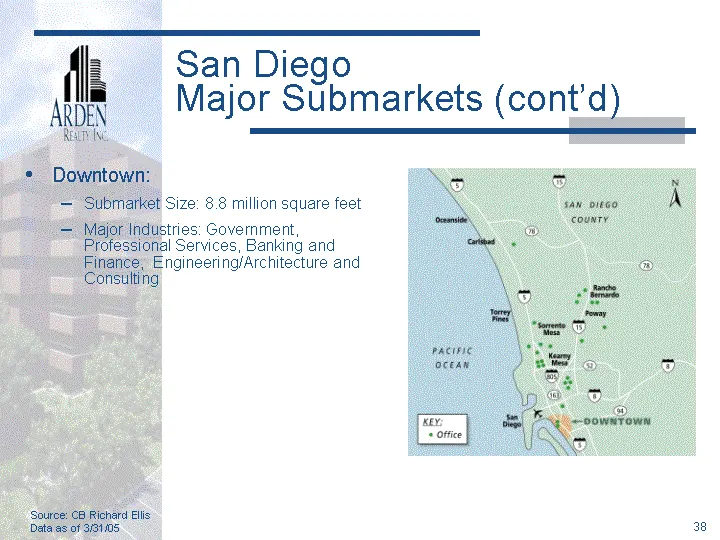
San Diego Major Submarkets (cont'd) Downtown: Submarket Size: 8.8 million square feet Major Industries: Government, Professional Services, Banking and Finance, Engineering/Architecture and Consulting Source: CB Richard Ellis Data as of 3/31/05
Source: SEC EDGAR · 8-K filed Jun 8, 2005