Timken Company (the) · NYSE:TKR
Timken Company (the) — The Timken Company — Investor Presentation (February 2016)
30 slides from Timken Company (the)'s investor presentation, Feb 25, 2016
Slide 1: Investor Presentation February 2016
Investor Presentation February 2016
Slide 2: Forward-Looking Statements Safe Harbor and Non-GAAP Financial Information
FORWARD-LOOKING STATEMENTS SAFE HARBOR AND NON-GAAP FINANCIAL INFORMATION Certain statements in this presentation (including statements regarding the company's forecasts, beliefs, estimates and expectations) that are not historical in nature are "forward-looking" statements within the meaning of the
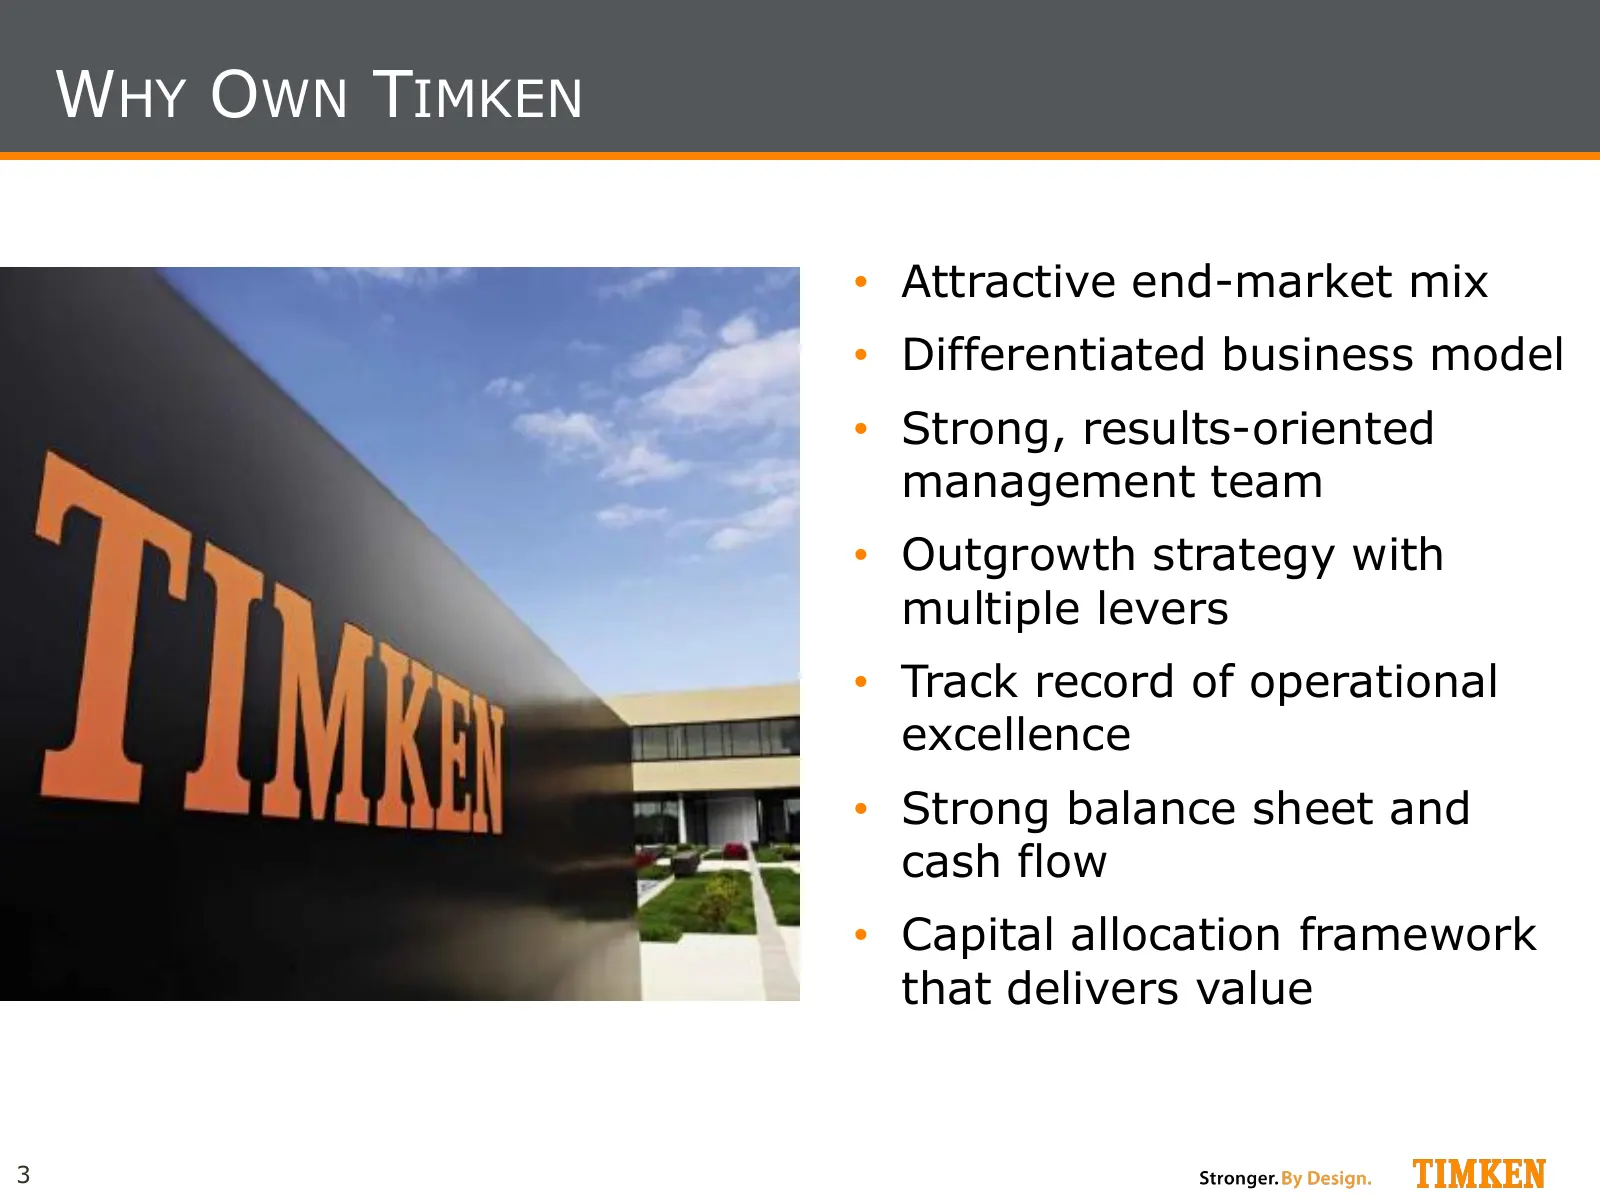
Slide 3: Why Own Timken
WHY OWN TIMKEN • Attractive end-market mix • Differentiated business model • Strong, results-oriented management team • Outgrowth strategy with multiple levers • Track record of operational excellence • Strong balance sheet and cash flow • Capital allocation framework that delivers value 3
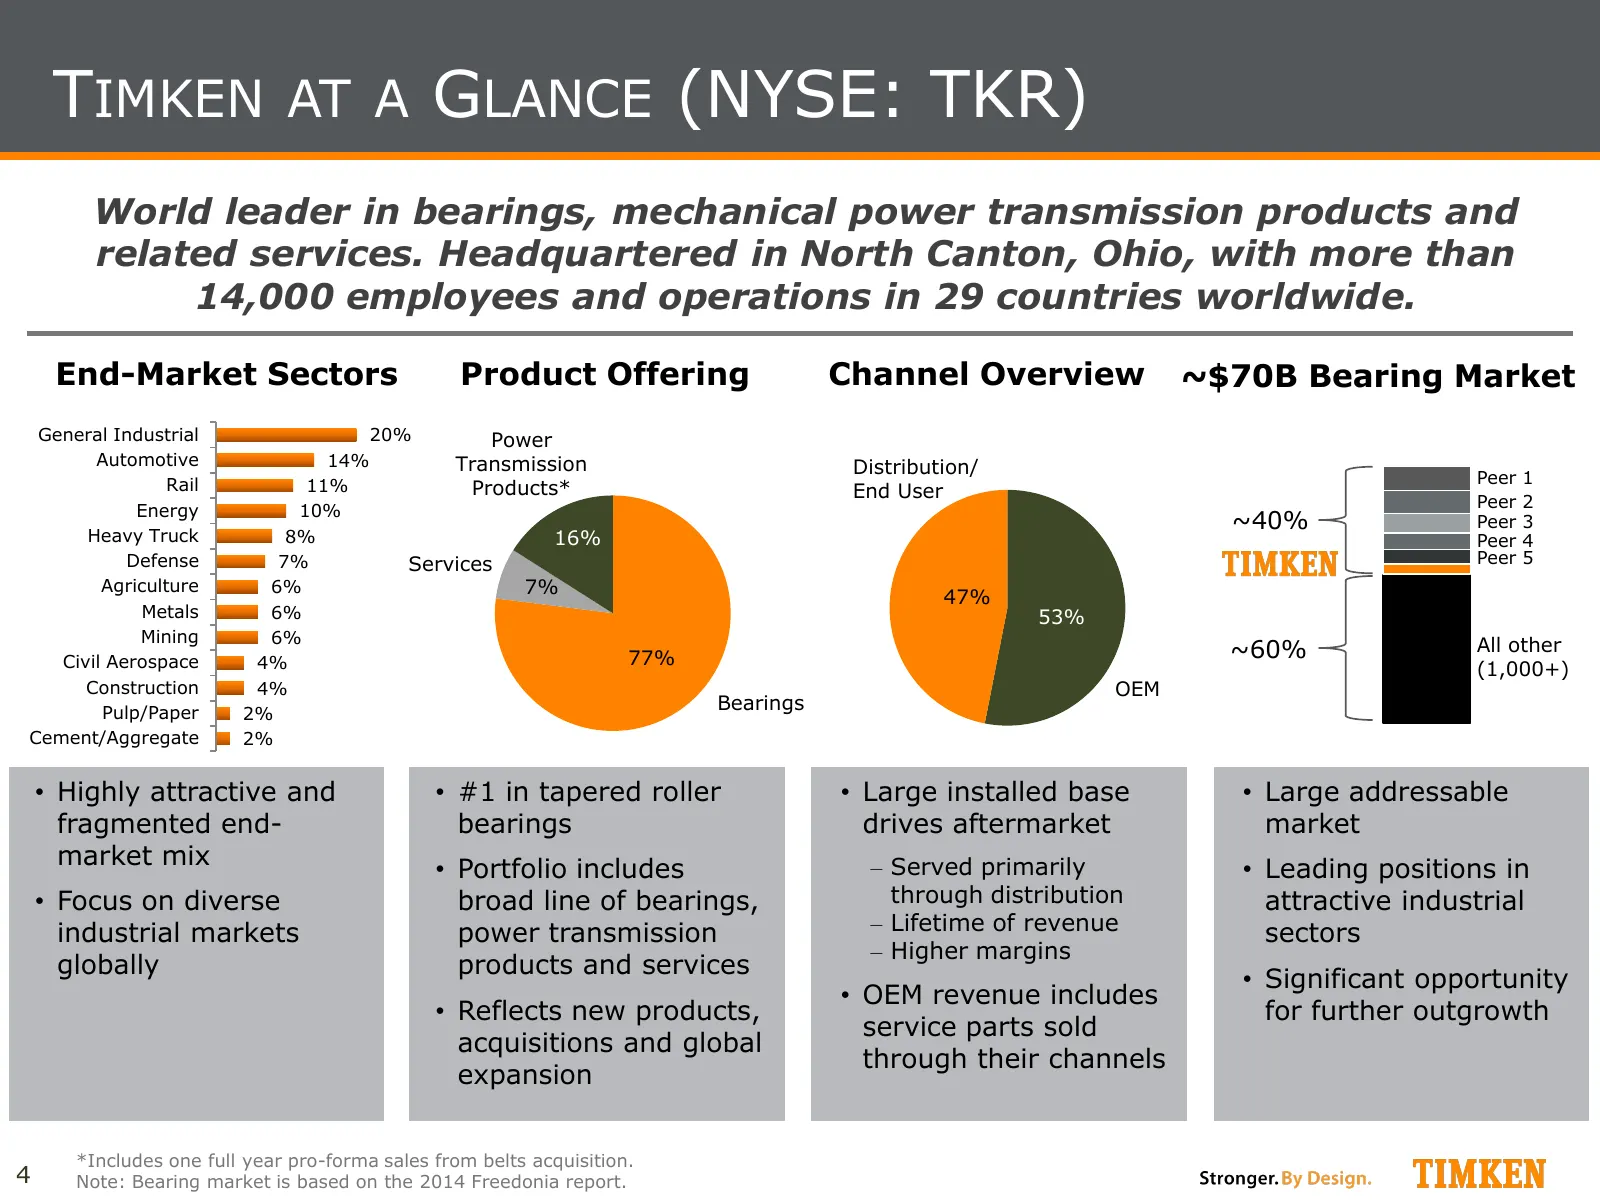
Slide 4: Timken at a Glance
TIMKEN AT A GLANCE (NYSE: TKR) World leader in bearings, mechanical power transmission products and related services. Headquartered in North Canton, Ohio, with more than 14,000 employees and operations in 29 countries worldwide. End-Market Sectors Product Offering Channel Overview ~$70B Bearing Mark
Slide 5: Segment Overviews
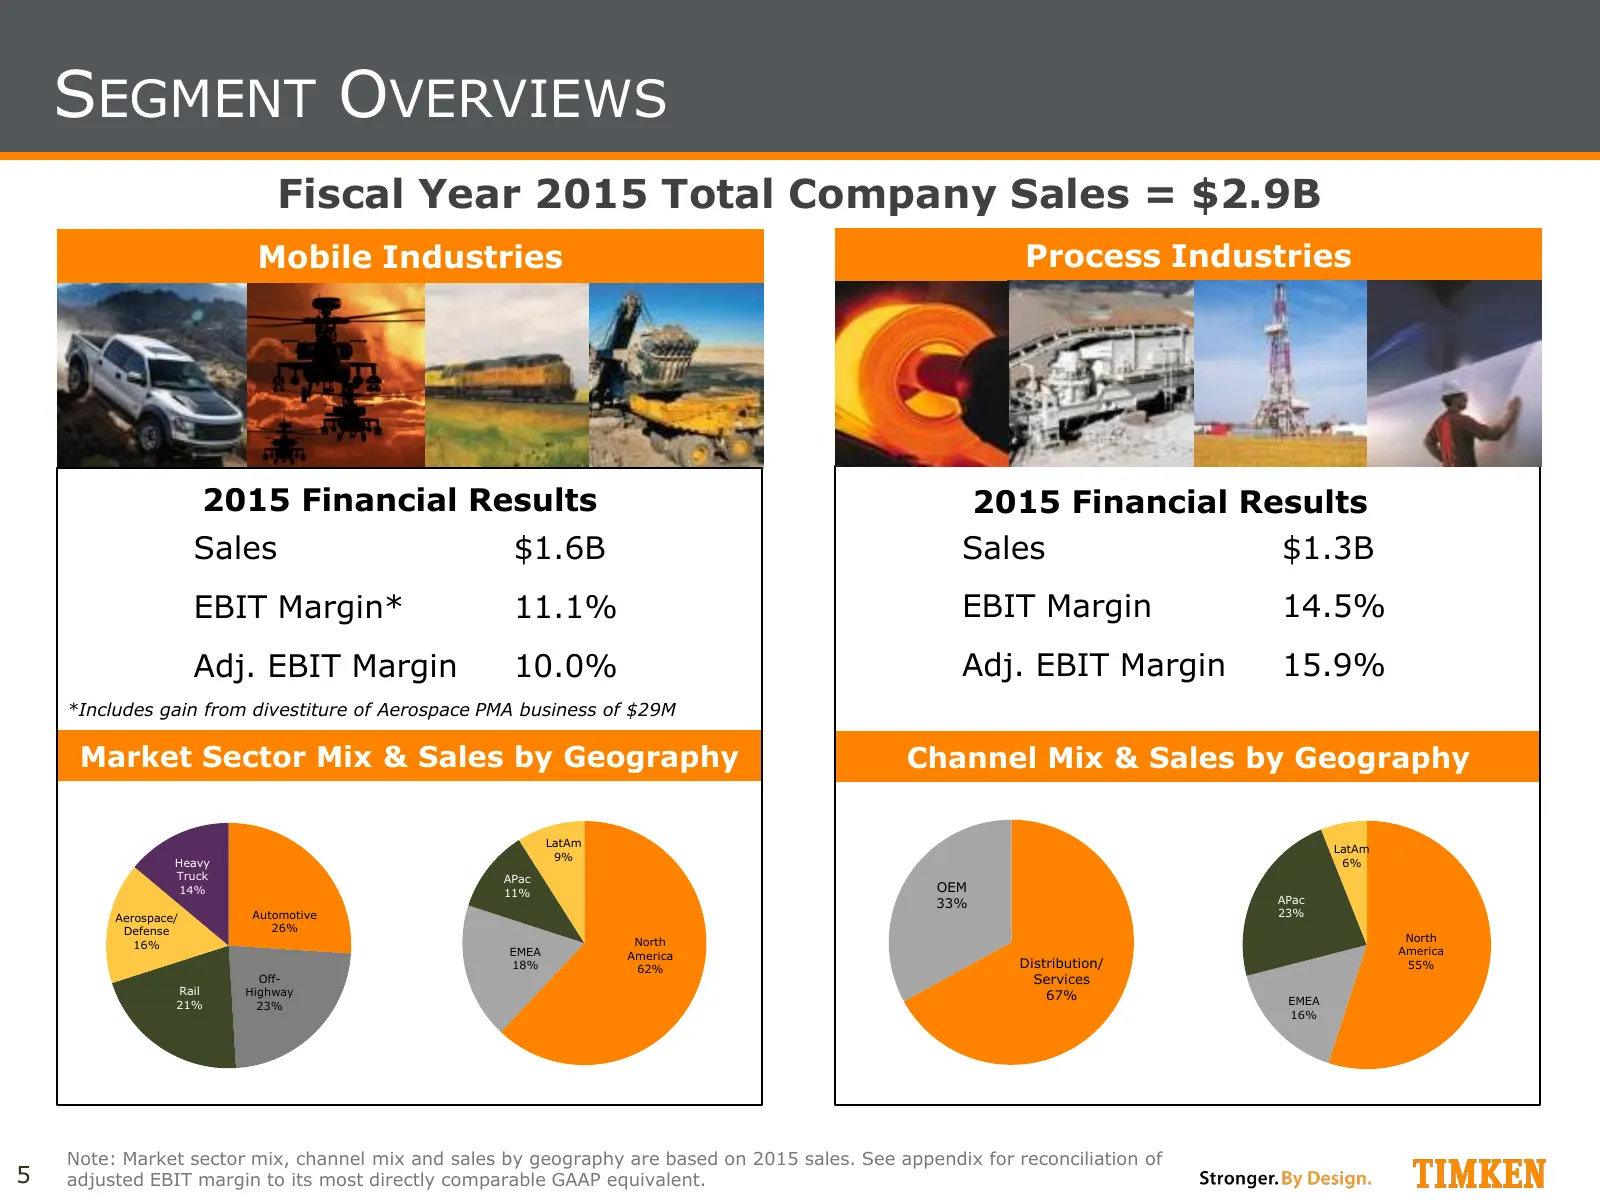
SEGMENT OVERVIEWS Fiscal Year 2015 Total Company Sales = $2.9B Mobile Industries Process Industries 2015 Financial Results 2015 Financial Results Sales $1.6B Sales $1.3B EBIT Margin* 11.1% EBIT Margin 14.5% Adj. EBIT Margin 10.0% Adj. EBIT Margin 15.9% *Includes gain from divestiture of Aerospace PM
Slide 6: Executing Our Strategy
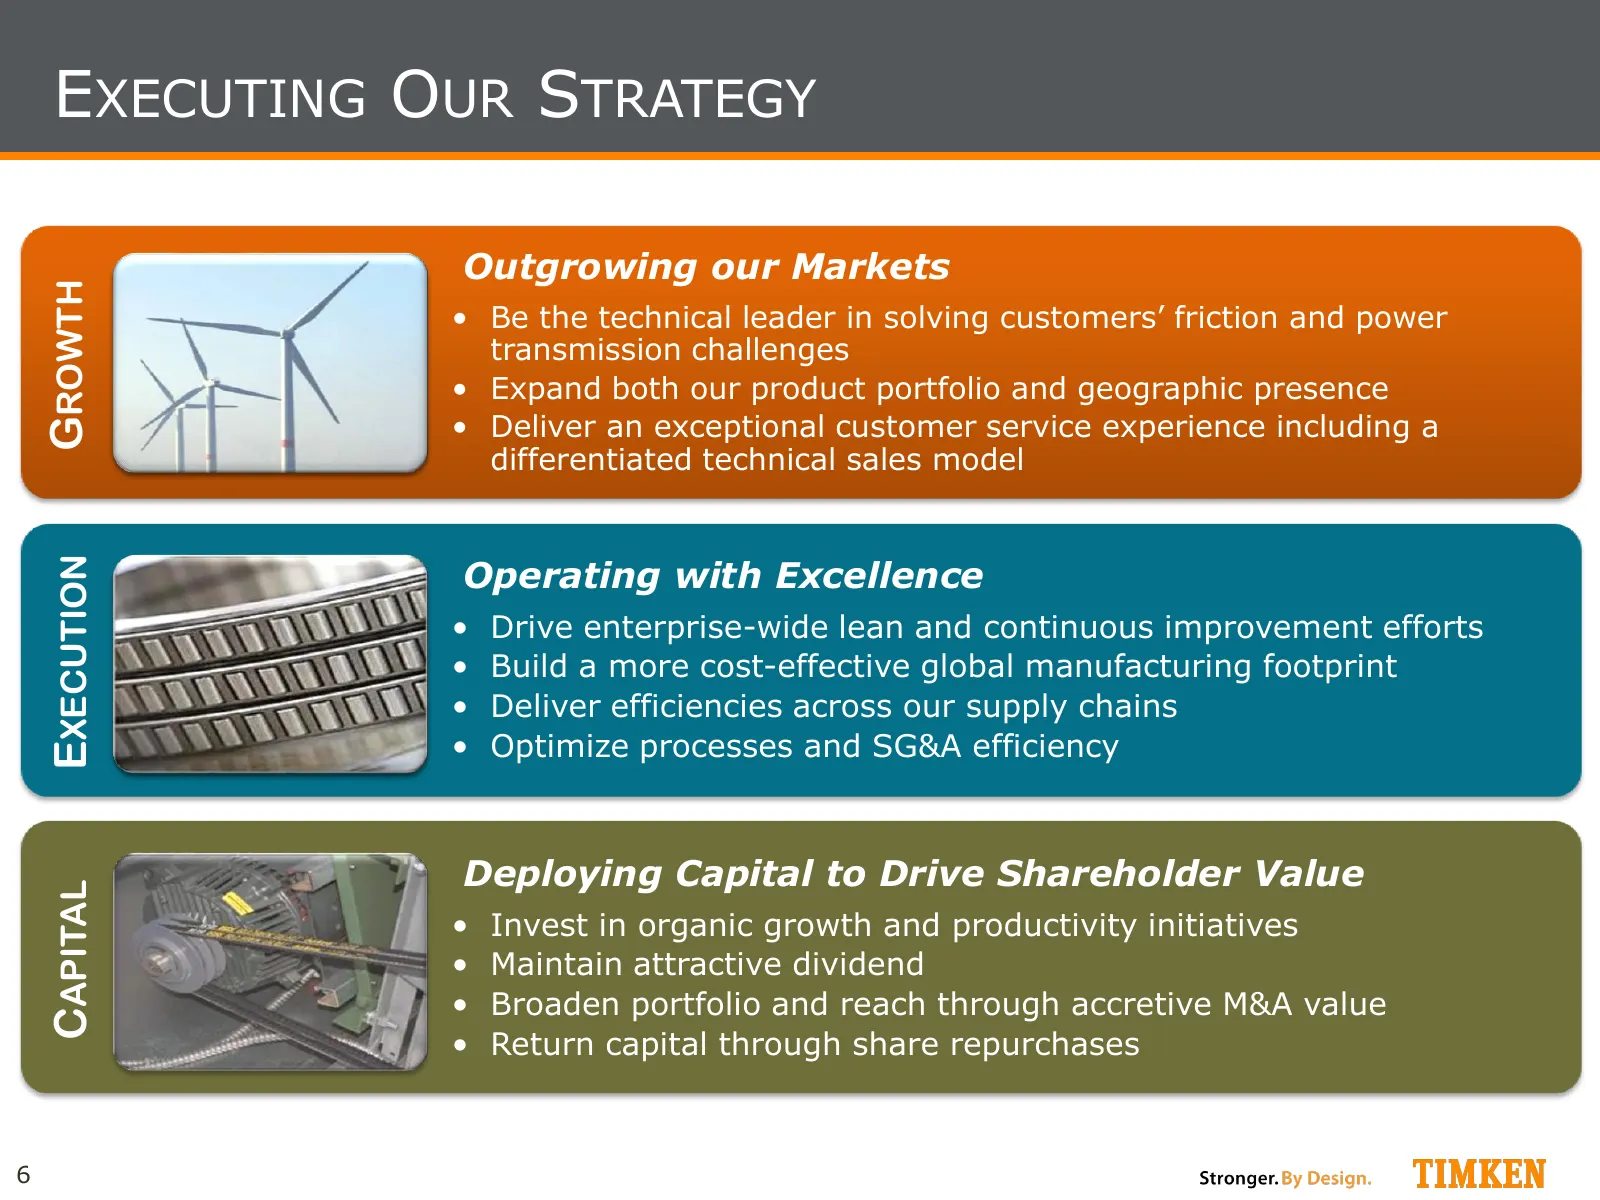
EXECUTING OUR STRATEGY Outgrowing our Markets GROWTH • Be the technical leader in solving customers’ friction and power transmission challenges • Expand both our product portfolio and geographic presence • Deliver an exceptional customer service experience including a differentiated technical sales
Slide 7: The Timken Business Model
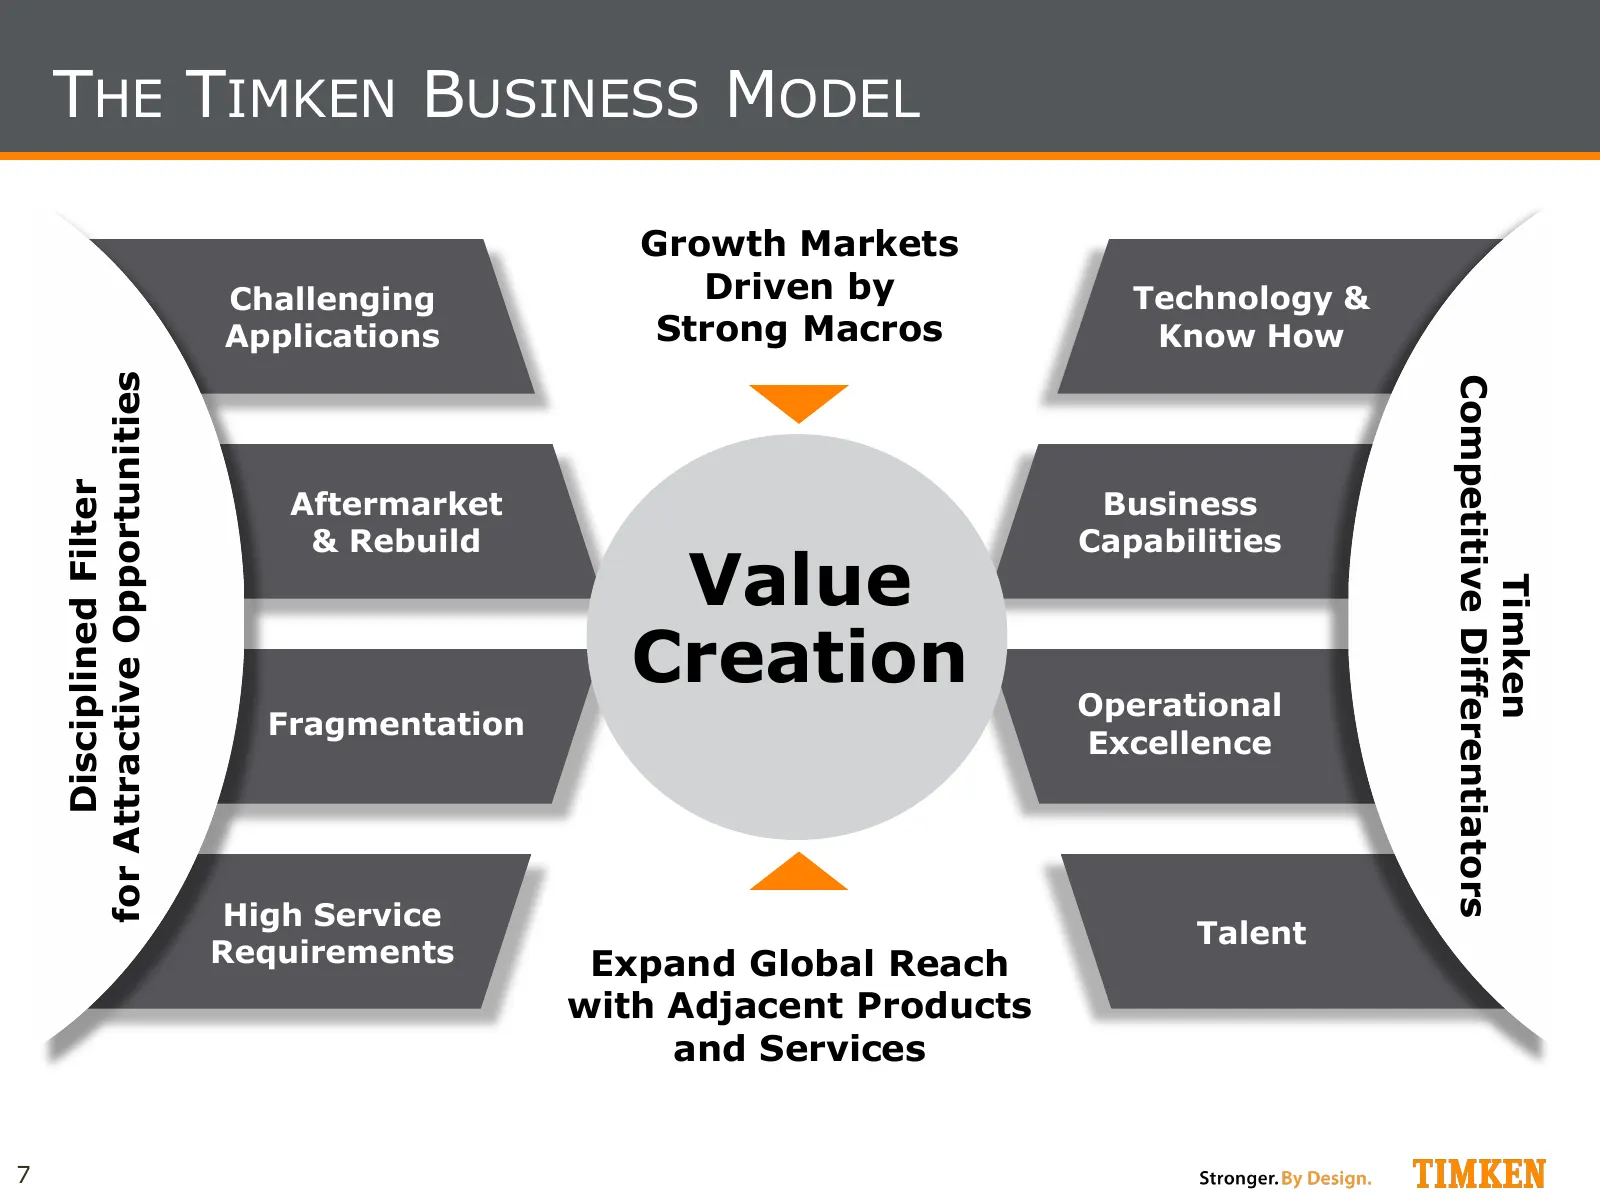
THE TIMKEN BUSINESS MODEL Growth Markets Challenging Driven by Technology & Applications Strong Macros Know How for Attractive Opportunities Competitive Differentiators Disciplined Filter Aftermarket Business & Rebuild Capabilities Value Timken Creation Operational Fragmentation Excellence High Serv
Slide 8: Accelerating Organic Growth
ACCELERATING ORGANIC GROWTH Multi-year, multi-faceted global initiative to accelerate organic growth in bearings and win in the marketplace: • Increase and accelerate product and application development • Enhance and expand our best-in-class collaborative technical sales model • Increase market pene
Slide 9: 2015: A Year of Strong Execution
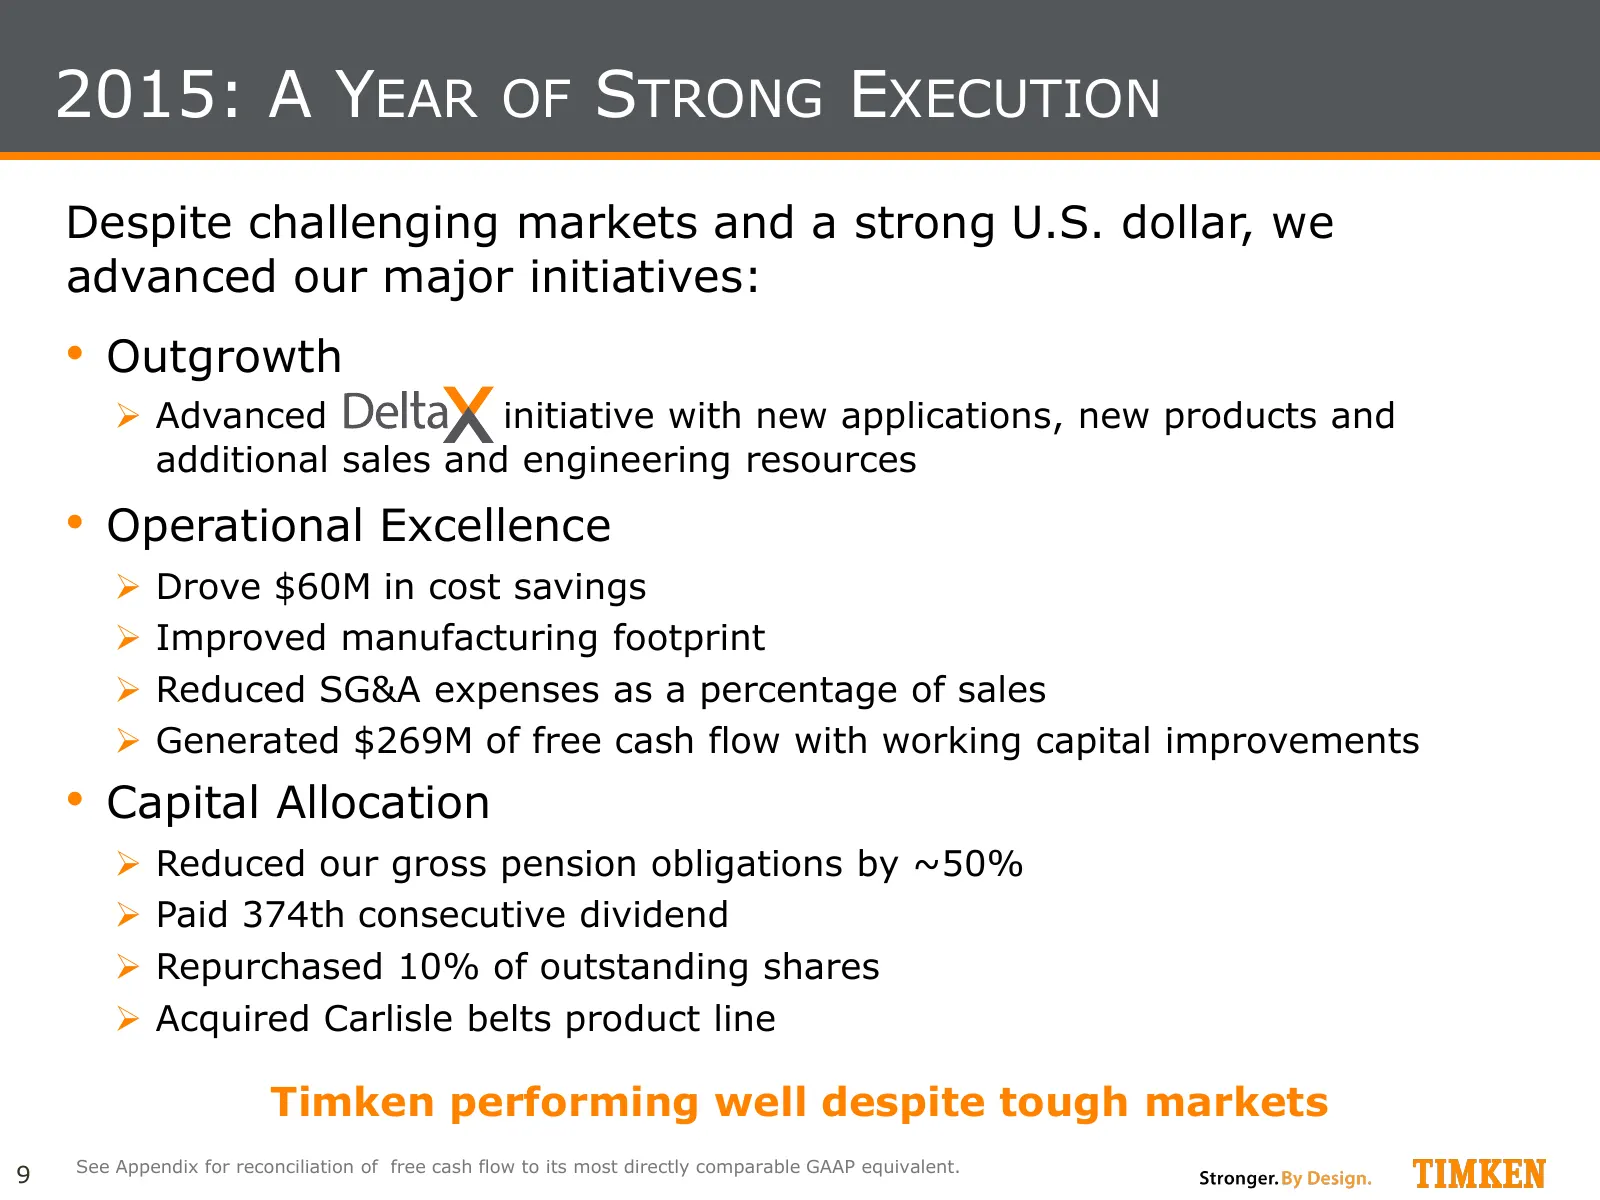
2015: A YEAR OF STRONG EXECUTION Despite challenging markets and a strong U.S. dollar, we advanced our major initiatives: • Outgrowth Advanced initiative with new applications, new products and additional sales and engineering resources • Operational Excellence Drove $60M in cost savings Impro
Slide 10: 2015 Financial Summary
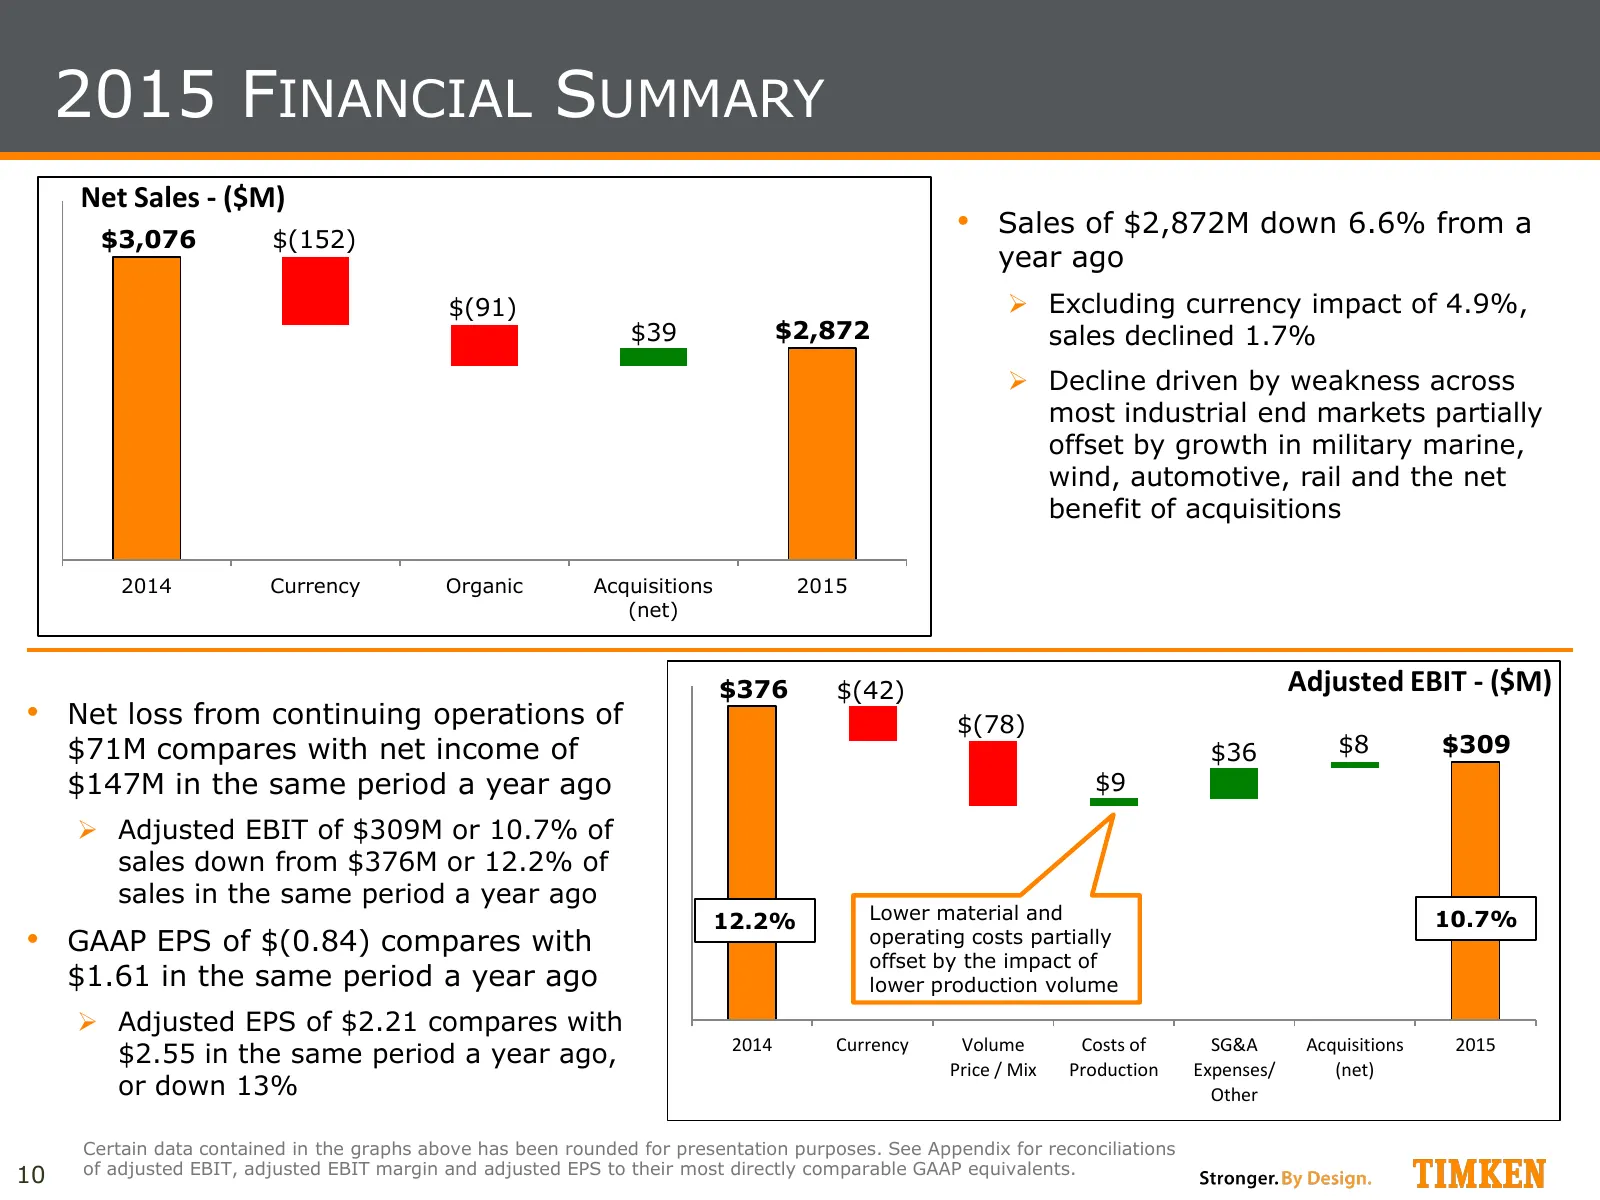
2015 FINANCIAL SUMMARY Net Sales - ($M) $3,076 $(152) • Sales of $2,872M down 6.6% from a year ago $(91) Excluding currency impact of 4.9%, $39 $2,872 sales declined 1.7% Decline driven by weakness across most industrial end markets partially offset by growth in military marine, wind, automotive
Slide 11: Improving Cost Structure - SG&A
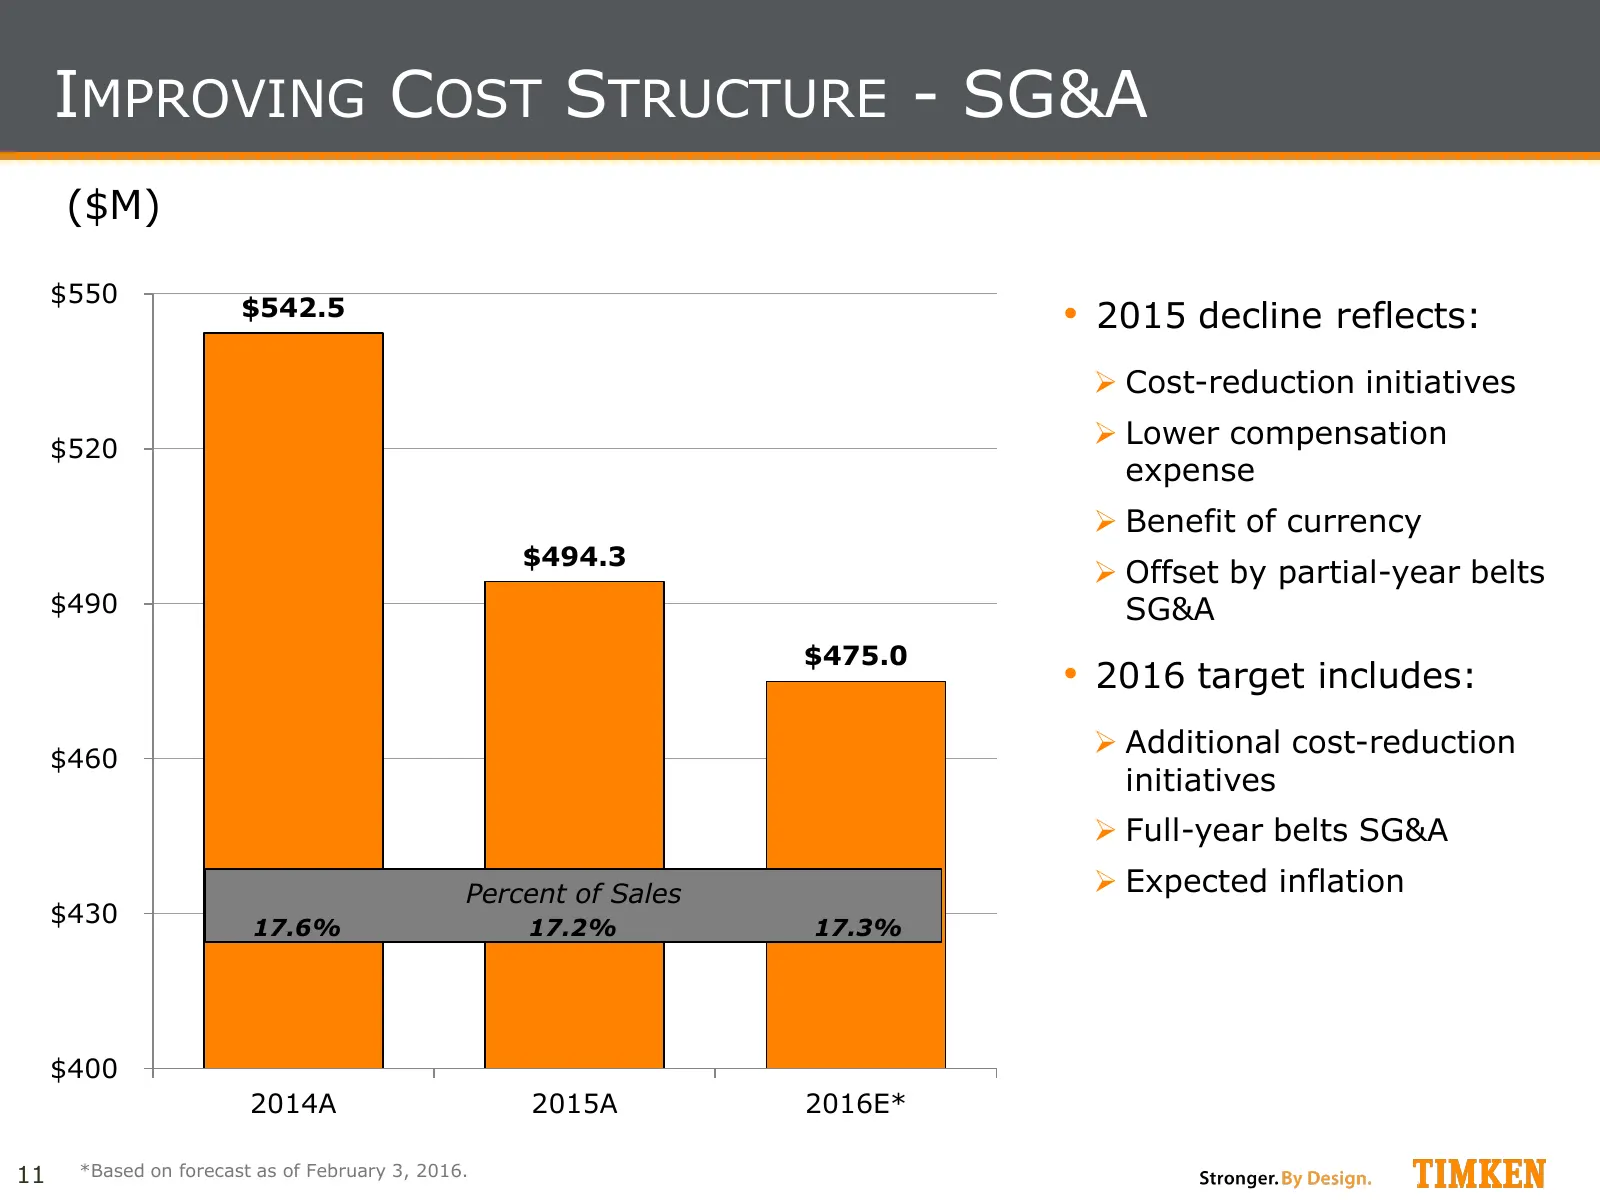
IMPROVING COST STRUCTURE - SG&A ($M) $550 $542.5 • 2015 decline reflects: Cost-reduction initiatives $520 Lower compensation expense Benefit of currency $494.3 Offset by partial-year belts $490 SG&A $475.0 • 2016 target includes: $460 Additional cost-reduction initiatives Full-year belts
Slide 12: Capital Allocation
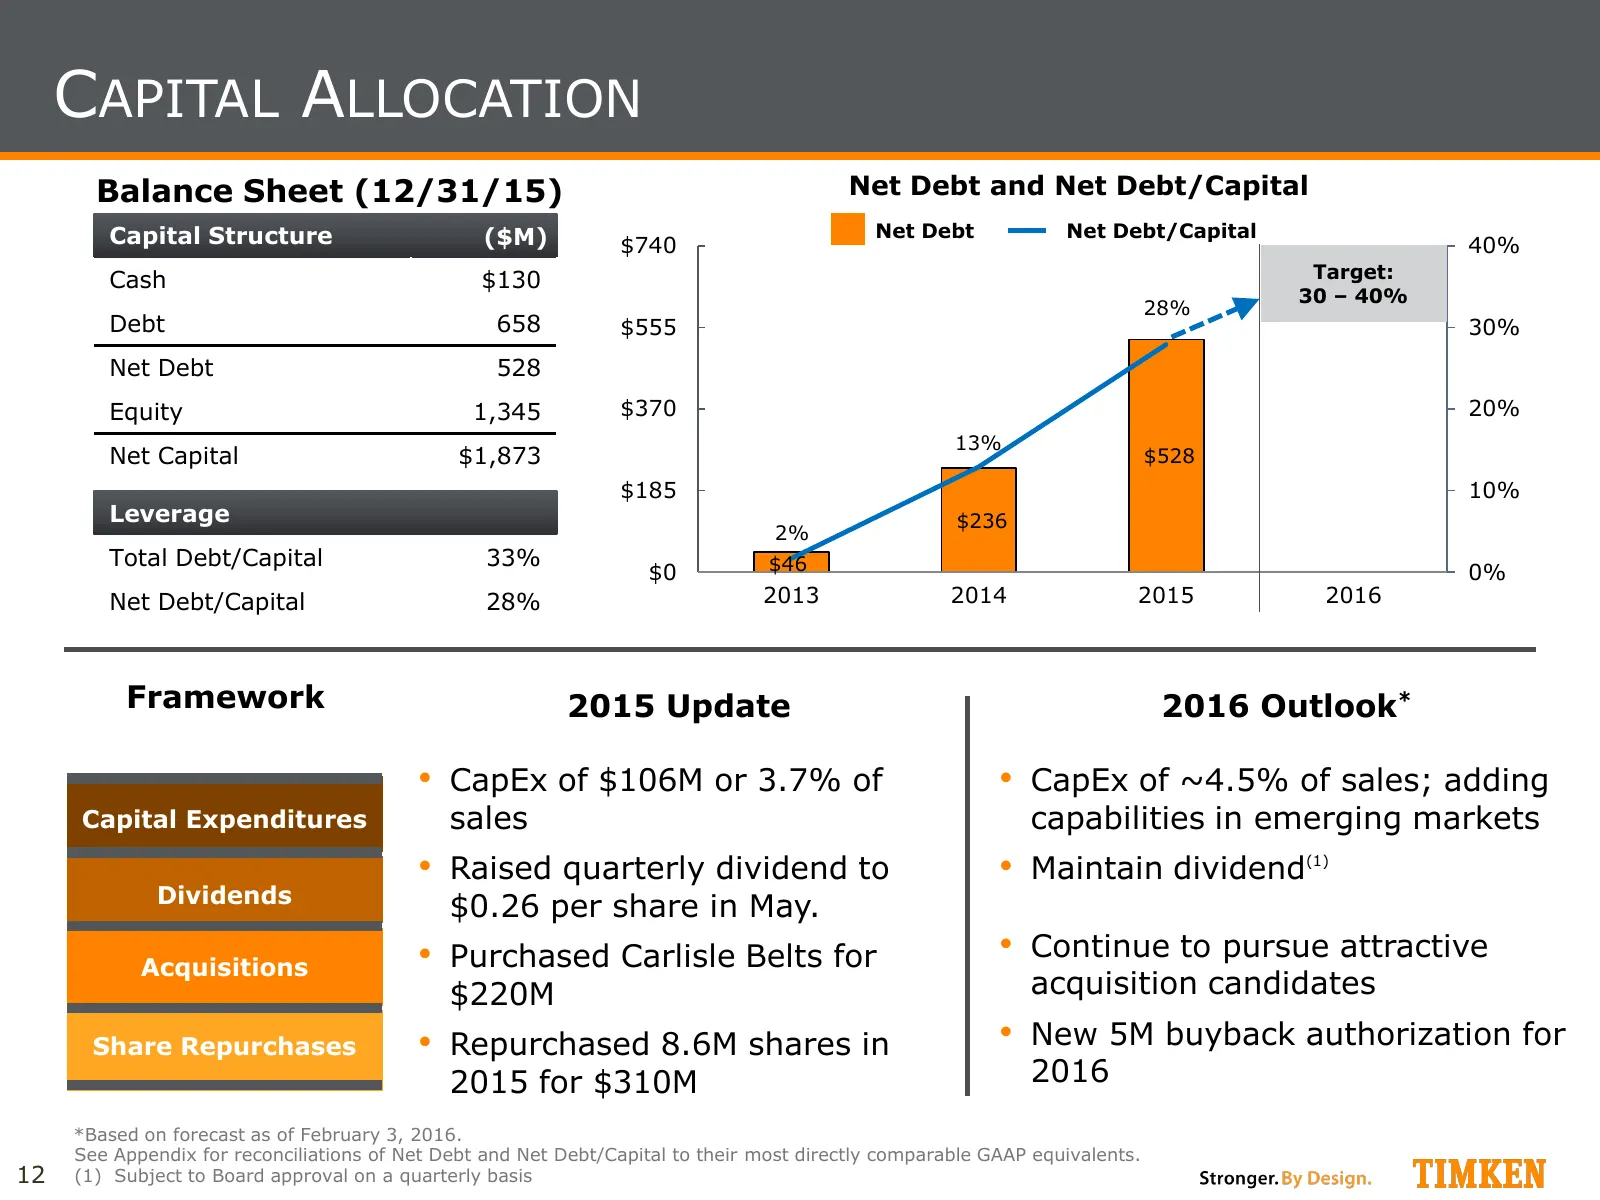
CAPITAL ALLOCATION Balance Sheet (12/31/15) Net Debt and Net Debt/Capital Capital Structure ($M) Net Debt Net Debt/Capital $740 40% Cash $130 Target: 30 – 40% 28% Debt 658 $555 30% Net Debt 528 Equity 1,345 $370 20% 13% Net Capital $1,873 $528 $185 10% Leverage $236 2% Total Debt/Capital 33% $46 $0
Slide 13: 2016 Market Outlook and Drivers
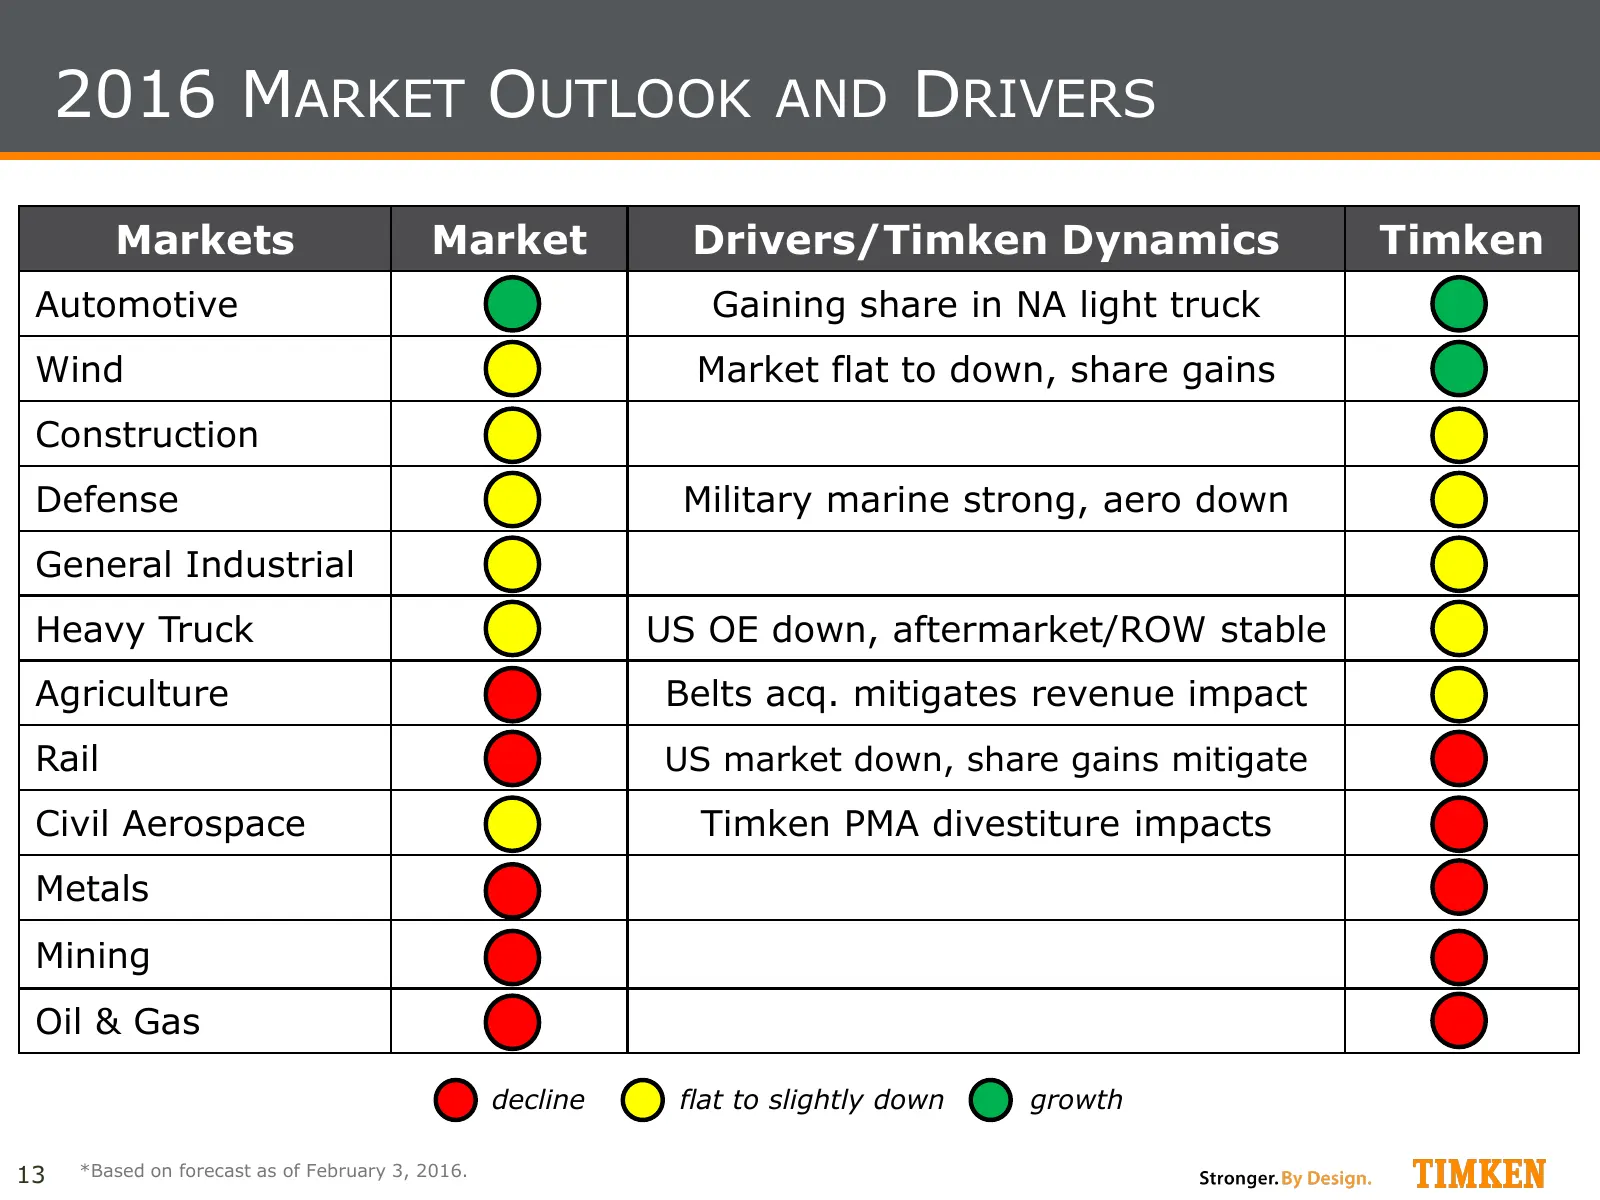
2016 MARKET OUTLOOK AND DRIVERS Markets Market Drivers/Timken Dynamics Timken Automotive Gaining share in NA light truck Wind Market flat to down, share gains Construction Defense Military marine strong, aero down General Industrial Heavy Truck US OE down, aftermarket/ROW stable Agriculture Belts ac
Slide 14: What to Expect in 2016
WHAT TO EXPECT IN 2016 • Emphasis on outgrowing our markets • Drive further margin enhancement/competitiveness initiatives Operational excellence SG&A efficiency Investments in the business • Effective capital deployment 14
Slide 15: Timken Continues to Be a Compelling Investment
TIMKEN CONTINUES TO BE A COMPELLING INVESTMENT • Attractive end-market mix • Differentiated business model • Strong, results-oriented management team • Outgrowth strategy with multiple levers • Track record of operational excellence • Strong balance sheet and cash flow • Capital allocation framework
Slide 16: Appendix
T I M KE N Stronger. By Design. «) = >. : Pere O56. Seis <8 — - 5 ORD ~ I= 3 Sep oy oe ) Sz coy el) ) & ; <<“ s.** - - » © <2) ) ~~ >, #) OOF Oe < 4 P ‘ Po: 4) , ) ee r}. ’ 4 WF >) 3) oe % WE, Cera Oe < ~ * at 7 . ae C a AY)
Slide 17: Capital Allocation Priorities
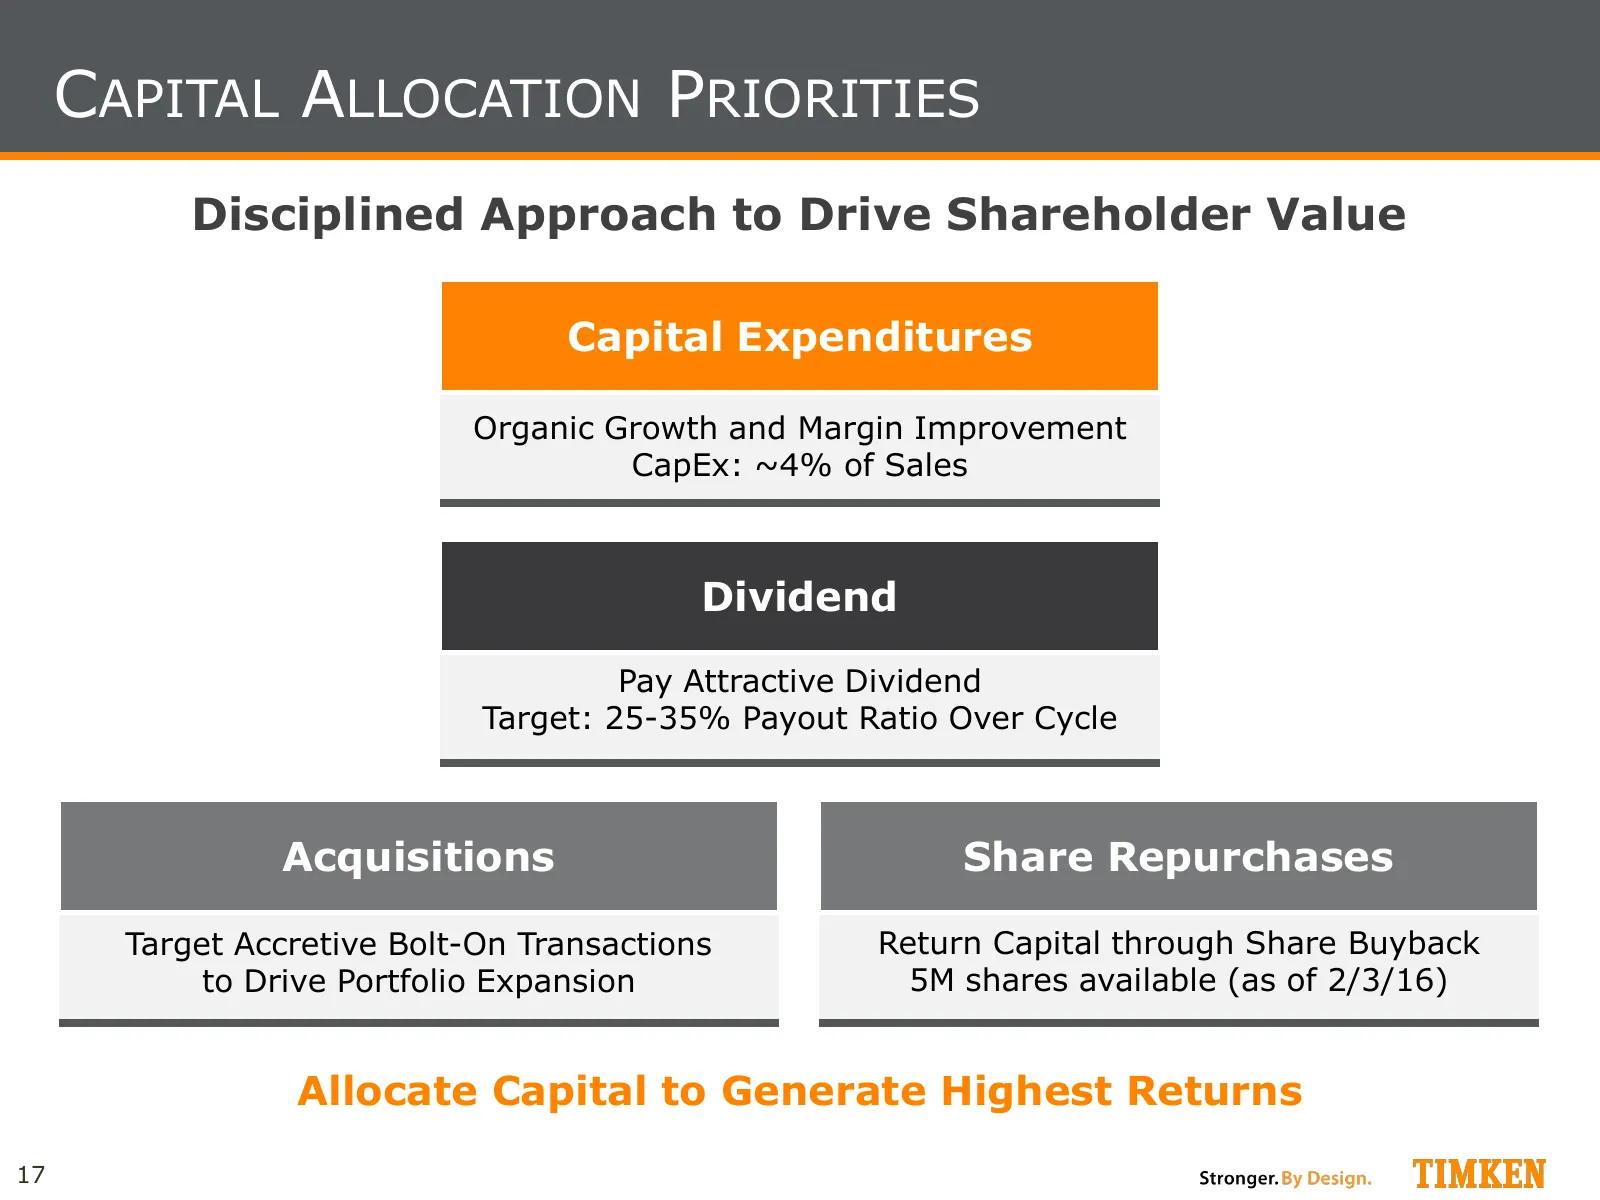
CAPITAL ALLOCATION PRIORITIES Disciplined Approach to Drive Shareholder Value Capital Expenditures Organic Growth and Margin Improvement CapEx: ~4% of Sales Dividend Pay Attractive Dividend Target: 25-35% Payout Ratio Over Cycle Acquisitions Share Repurchases Target Accretive Bolt-On Transactions Re
Slide 18: The Timken Business Model in Action
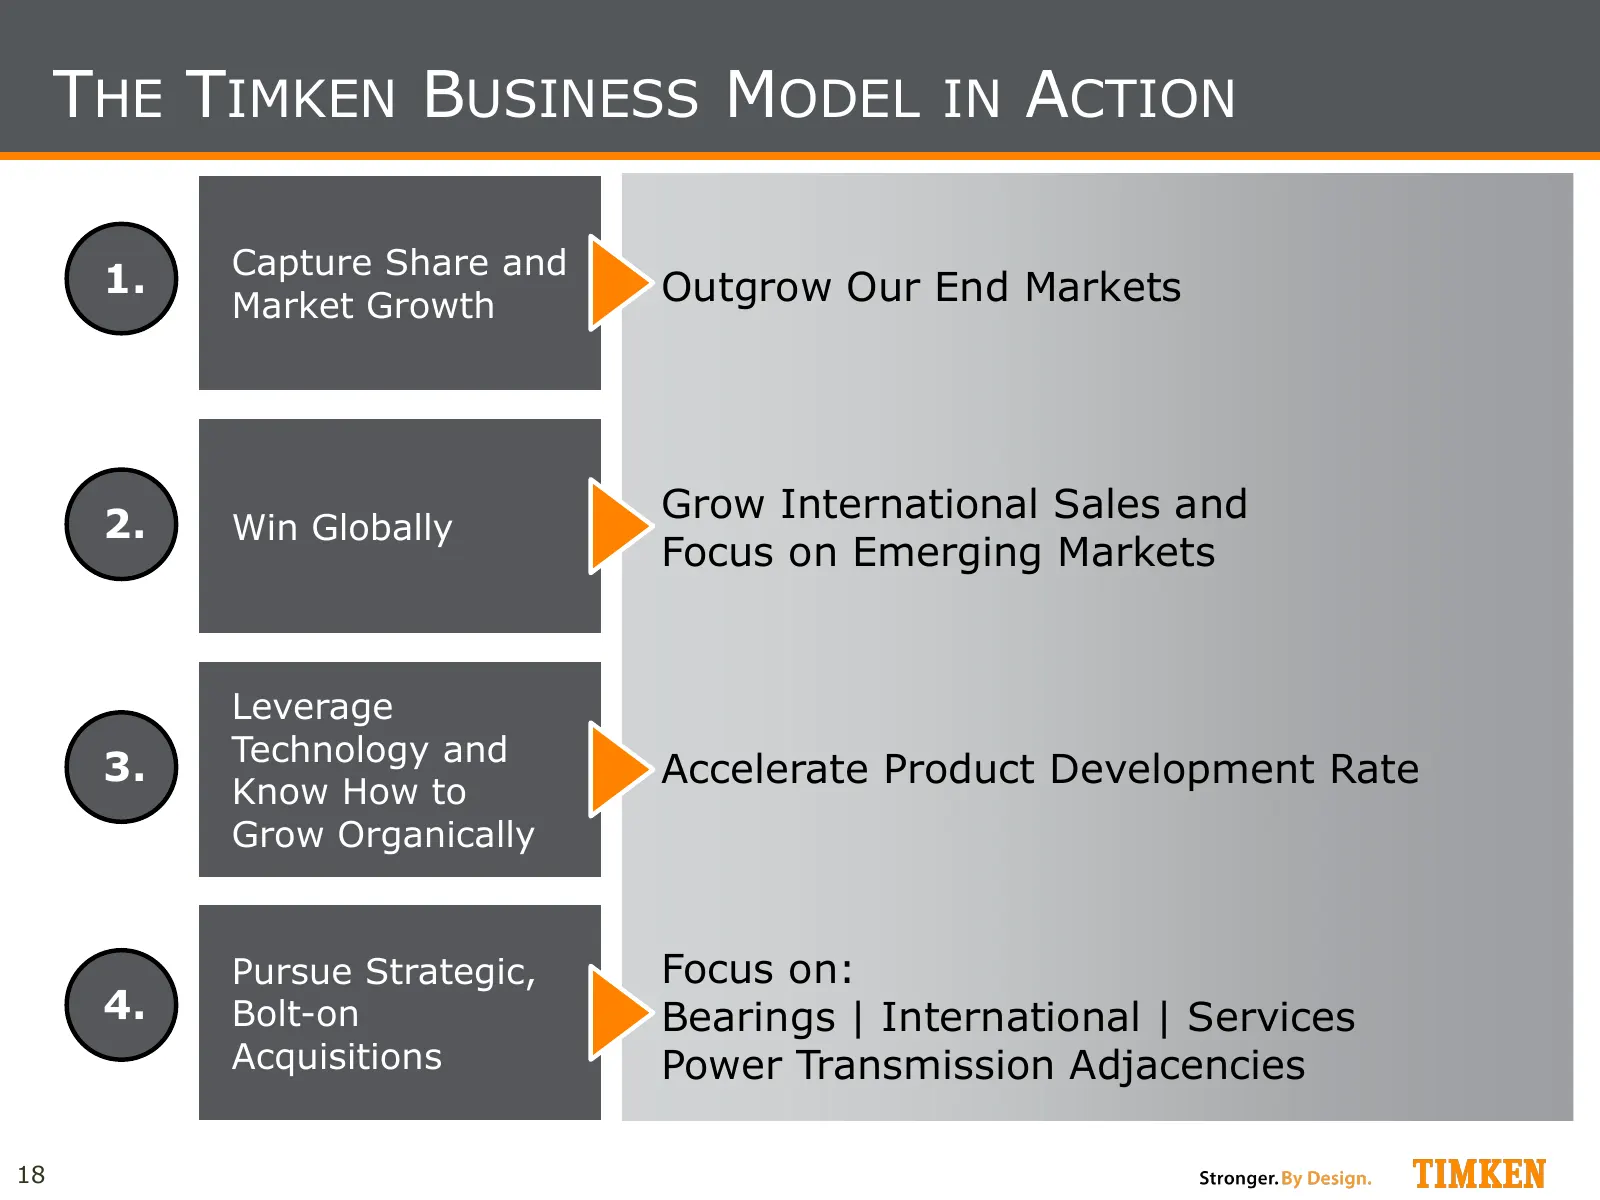
THE TIMKEN BUSINESS MODEL IN ACTION Capture Share and 1. Outgrow Our End Markets Market Growth Grow International Sales and 2. Win Globally Focus on Emerging Markets Leverage Technology and 3. Accelerate Product Development Rate Know How to Grow Organically Pursue Strategic, Focus on: 4. Bolt-on Bea
Slide 19: Capture Share and Market Growth
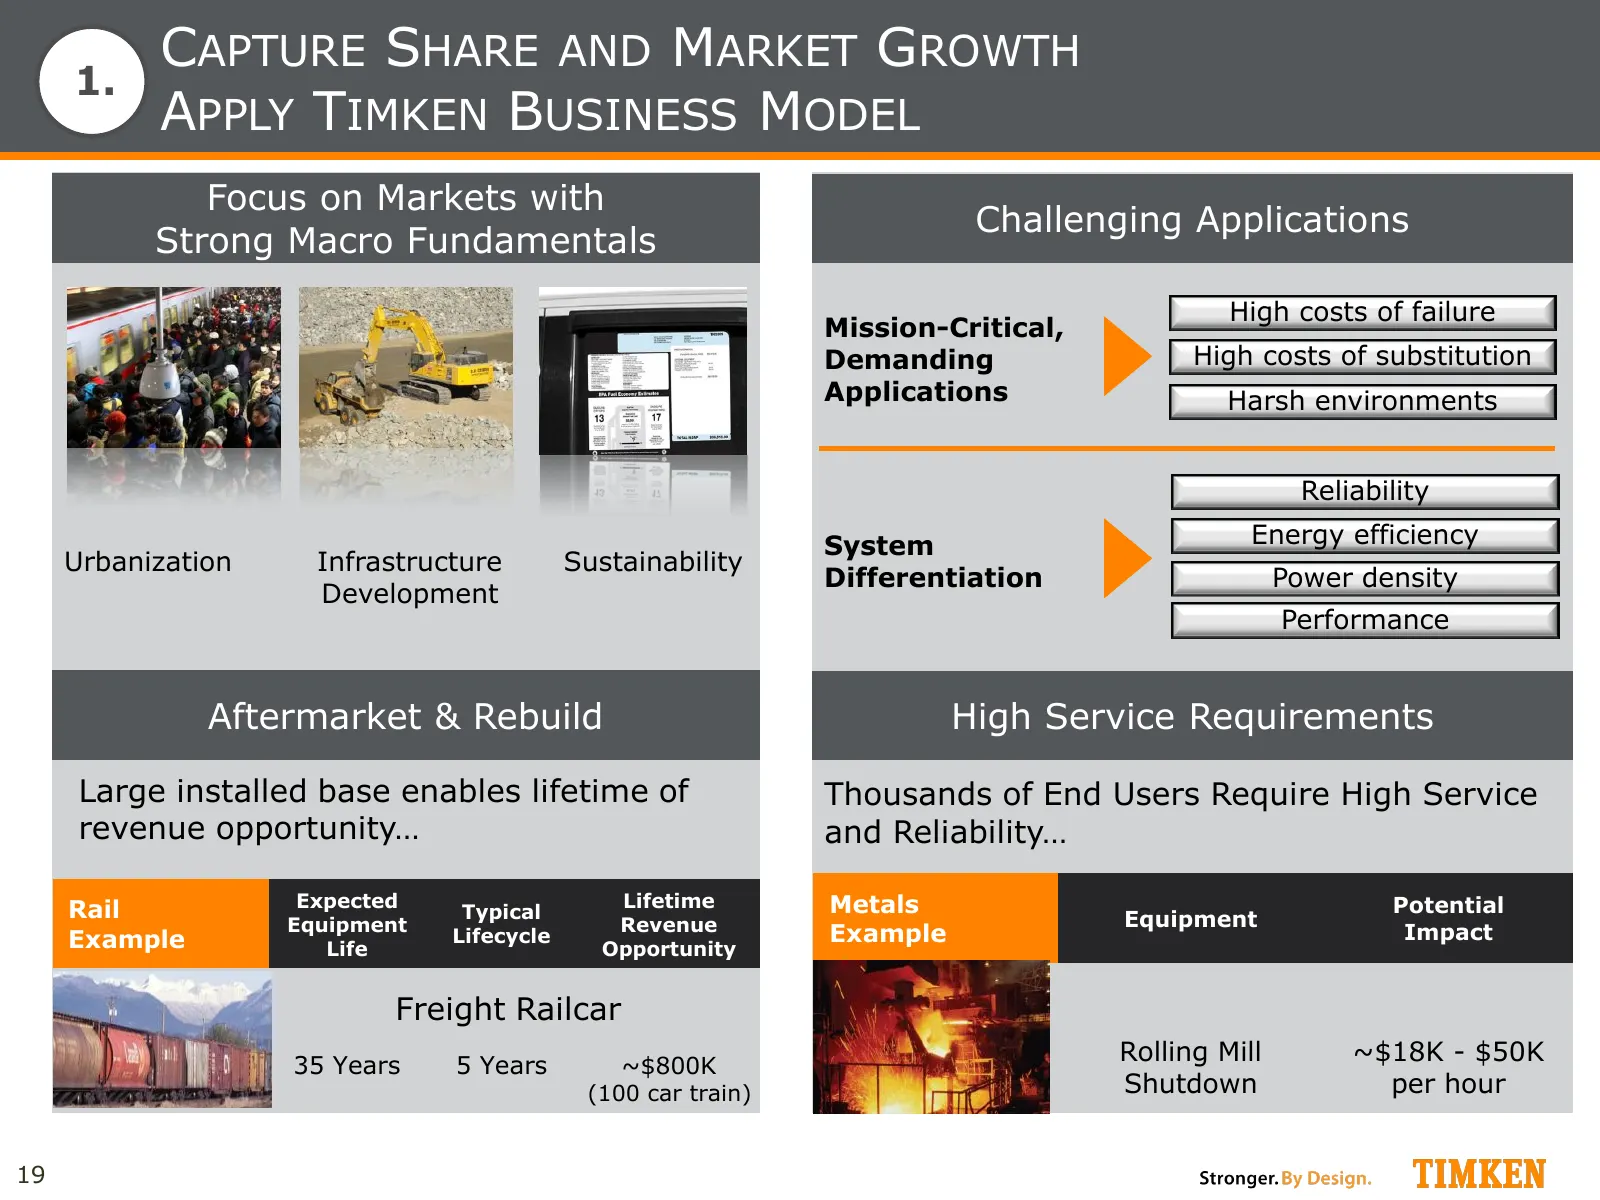
CAPTURE SHARE AND MARKET GROWTH 1. APPLY TIMKEN BUSINESS MODEL Focus on Markets with Challenging Applications Strong Macro Fundamentals High costs of failure Mission-Critical, Demanding High costs of substitution Applications Harsh environments Reliability System Energy efficiency Urbanization Infra
Slide 20: Win Globally: An Expanding International Footprint
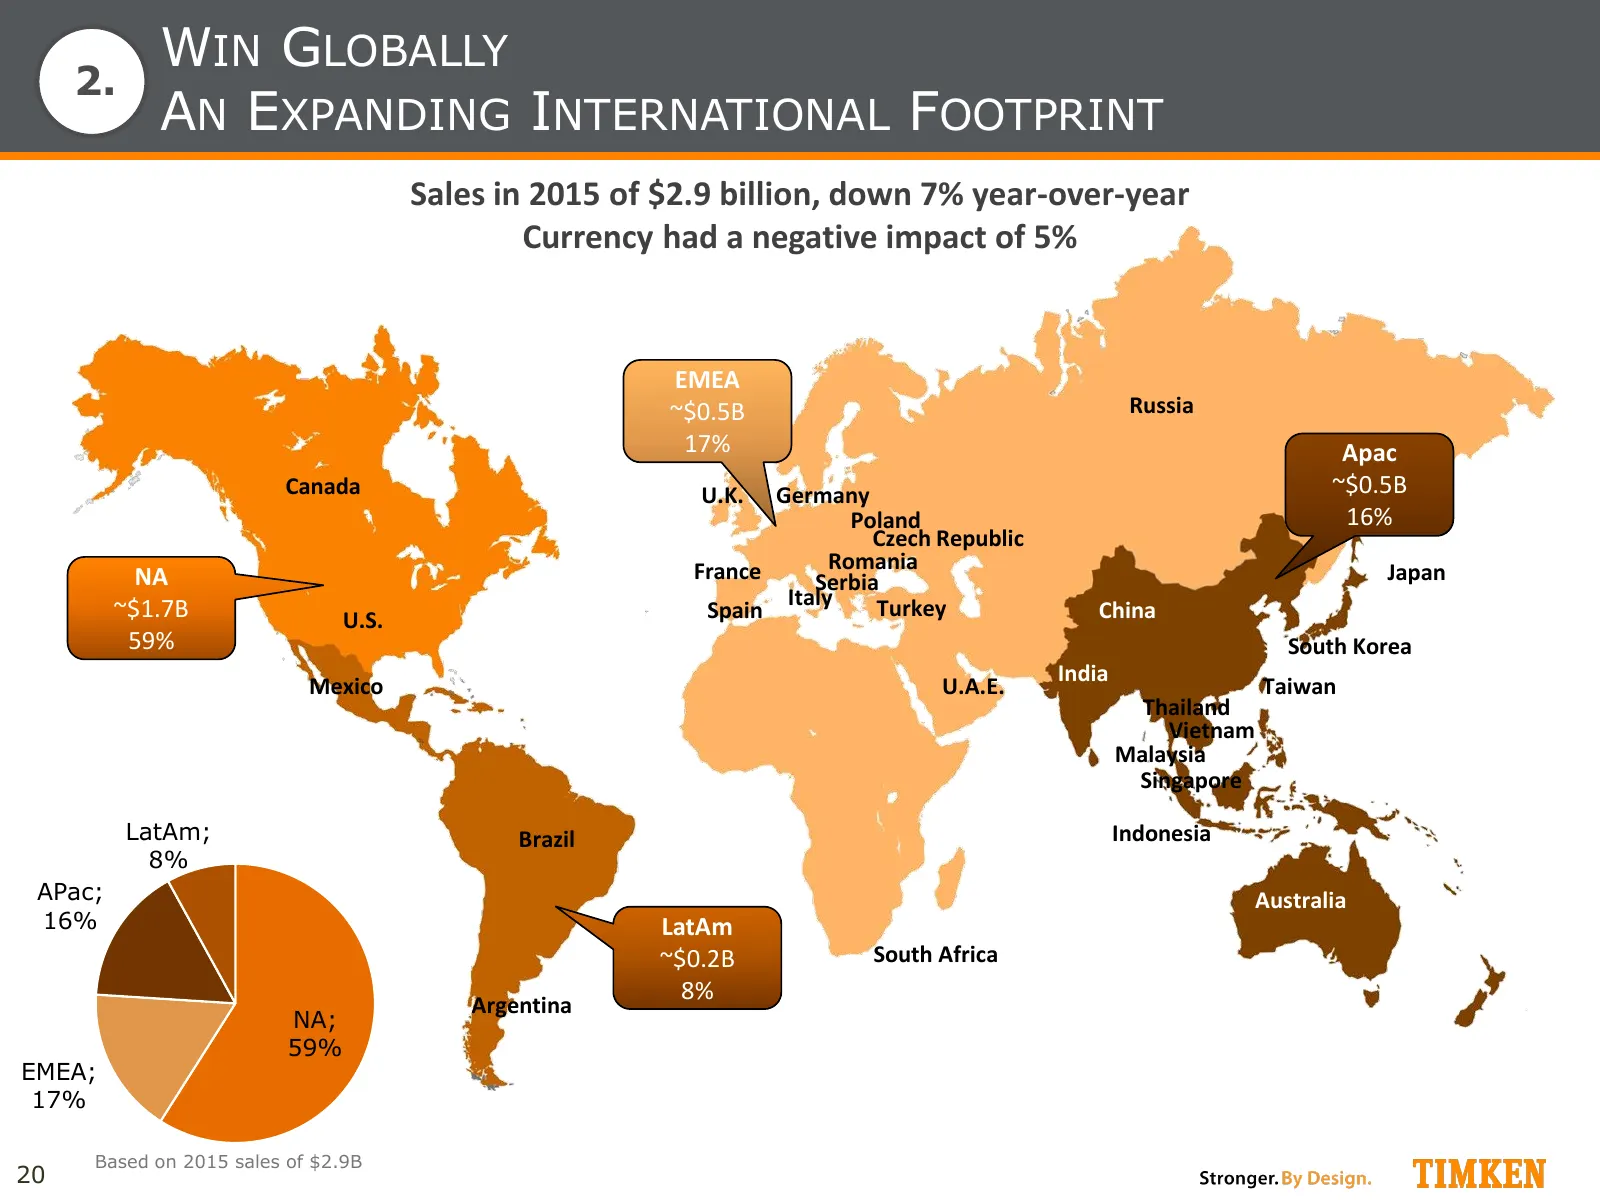
WIN GLOBALLY 2. AN EXPANDING INTERNATIONAL FOOTPRINT Sales in 2015 of $2.9 billion, down 7% year-over-year Currency had a negative impact of 5% EMEA ~$0.5B Russia 17% Apac Canada U.K. Germany ~$0.5B Poland 16% Czech Republic France Romania Japan NA Serbia ~$1.7B Italy Turkey U.S. Spain China 59% Sou
Slide 21: Leverage Technology and Know How to Grow Organically
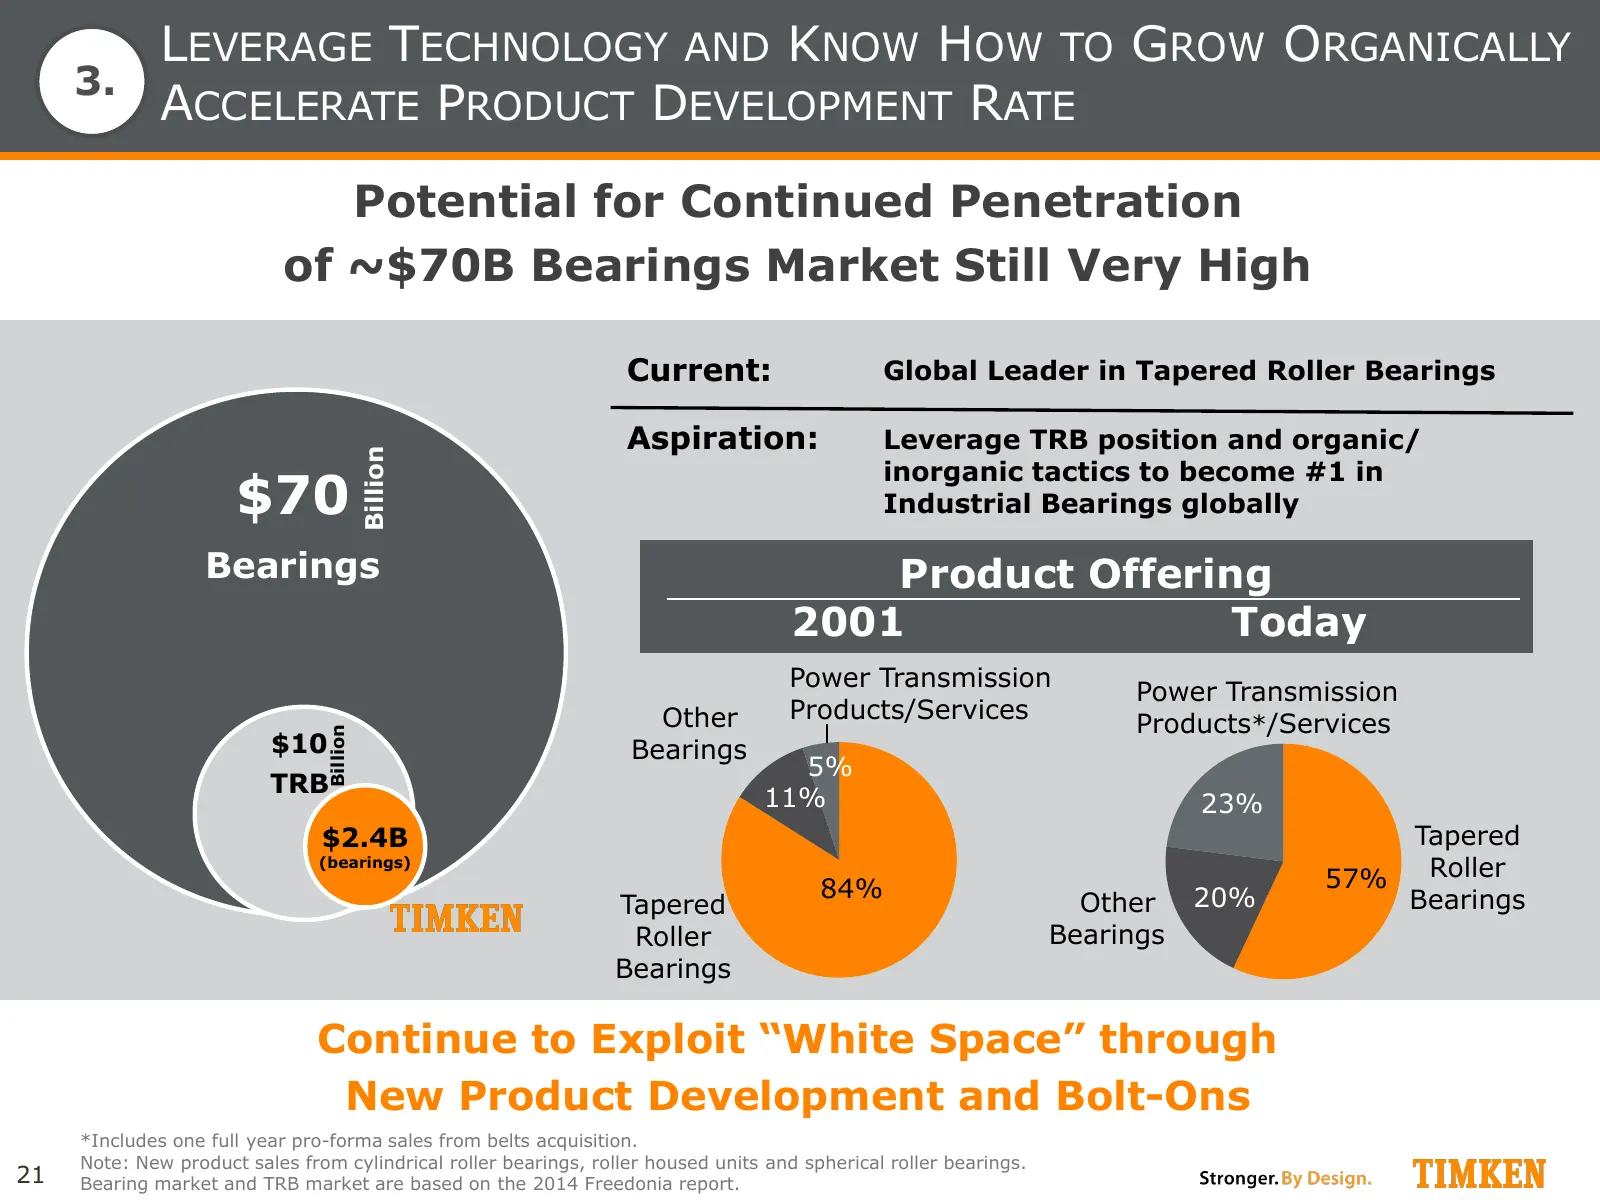
LEVERAGE TECHNOLOGY AND KNOW HOW TO GROW ORGANICALLY 3. ACCELERATE PRODUCT DEVELOPMENT RATE Potential for Continued Penetration of ~$70B Bearings Market Still Very High Current: Global Leader in Tapered Roller Bearings Aspiration: Leverage TRB position and organic/ Billion Billio inorganic tactics t
Slide 22: Bearing Housed Unit Portfolio Transformation
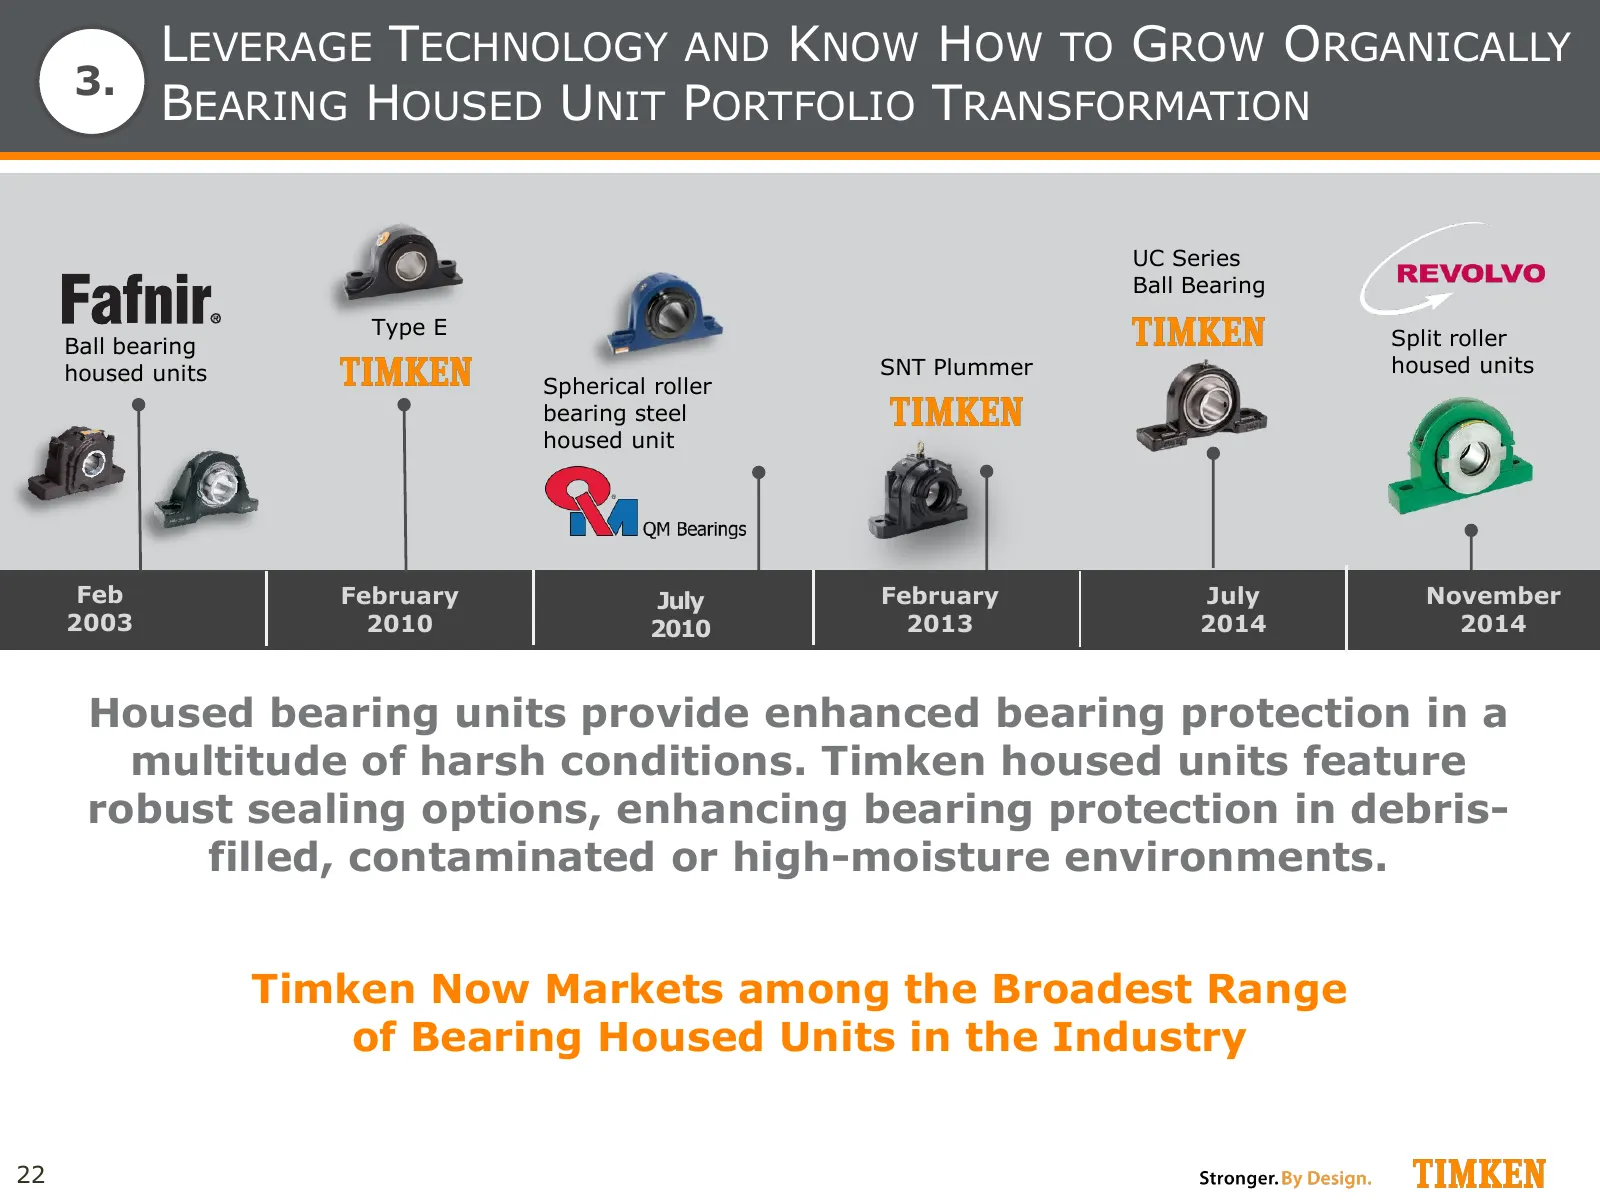
LEVERAGE TECHNOLOGY AND KNOW HOW TO GROW ORGANICALLY 3. BEARING HOUSED UNIT PORTFOLIO TRANSFORMATION UC Series Ball Bearing Type E Ball bearing Split roller housed units SNT Plummer housed units Spherical roller bearing steel housed unit Feb February July February July November 2003 2010 2010 2013 2
Slide 23: Pursue Strategic Bolt-On Acquisitions: Market and Product Expansion
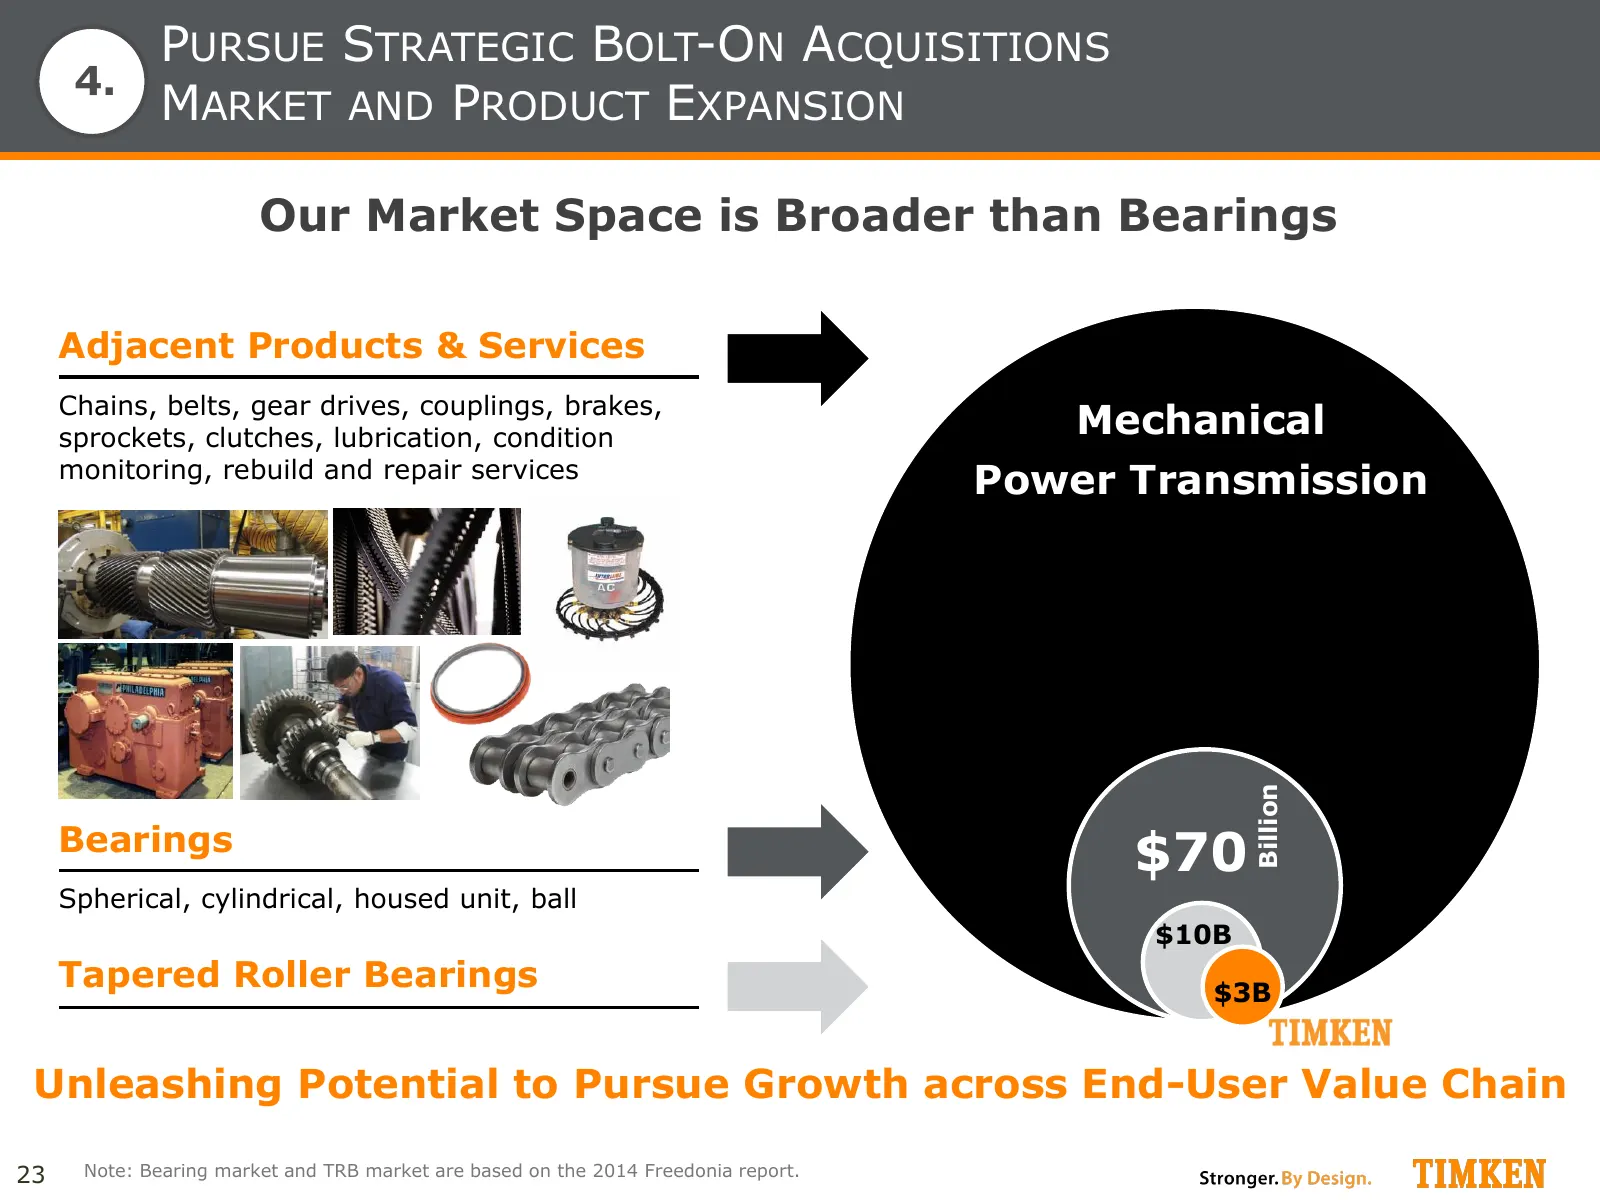
PURSUE STRATEGIC BOLT-ON ACQUISITIONS 4. MARKET AND PRODUCT EXPANSION Our Market Space is Broader than Bearings Adjacent Products & Services Chains, belts, gear drives, couplings, brakes, sprockets, clutches, lubrication, condition Mechanical monitoring, rebuild and repair services Power Transmissio
Slide 24: Portfolio Transformation - Building for Growth
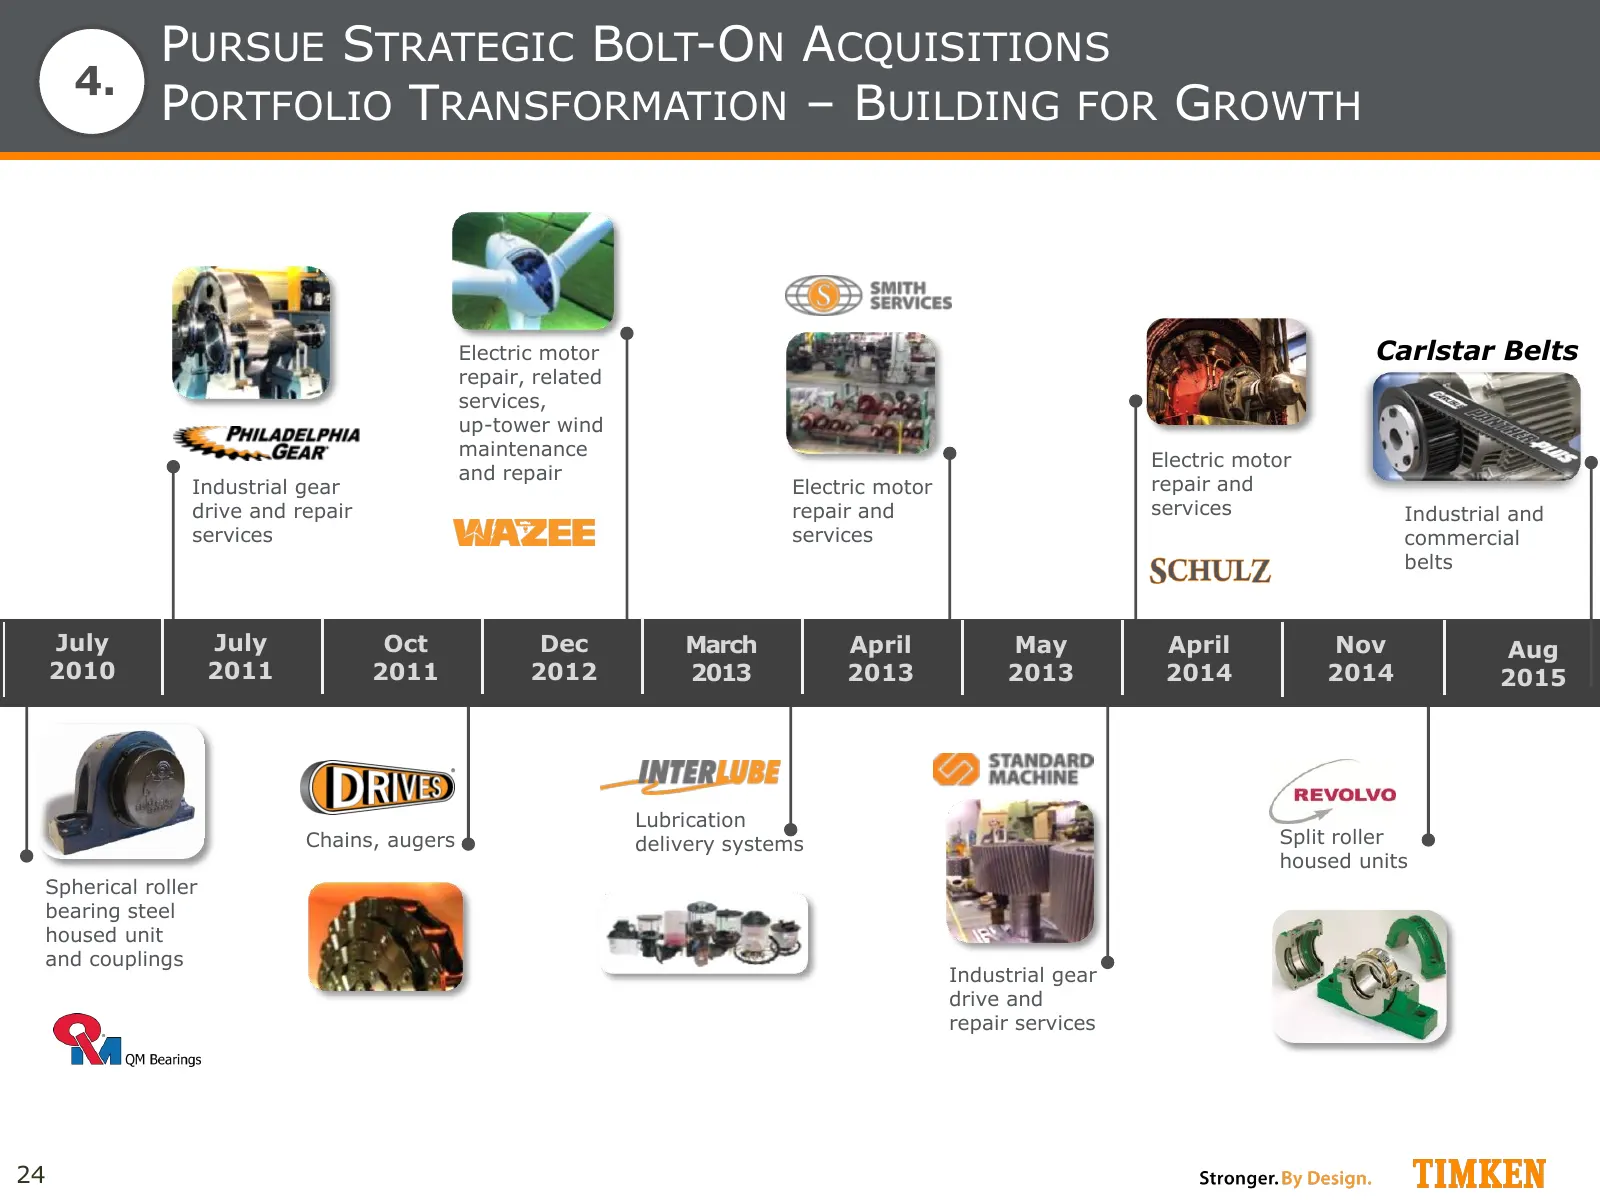
PURSUE STRATEGIC BOLT-ON ACQUISITIONS 4. PORTFOLIO TRANSFORMATION – BUILDING FOR GROWTH Electric motor Carlstar Belts repair, related services, up-tower wind maintenance Electric motor and repair Industrial gear Electric motor repair and drive and repair repair and services Industrial and services s
Slide 25: 2016 Incentive Compensation Plan
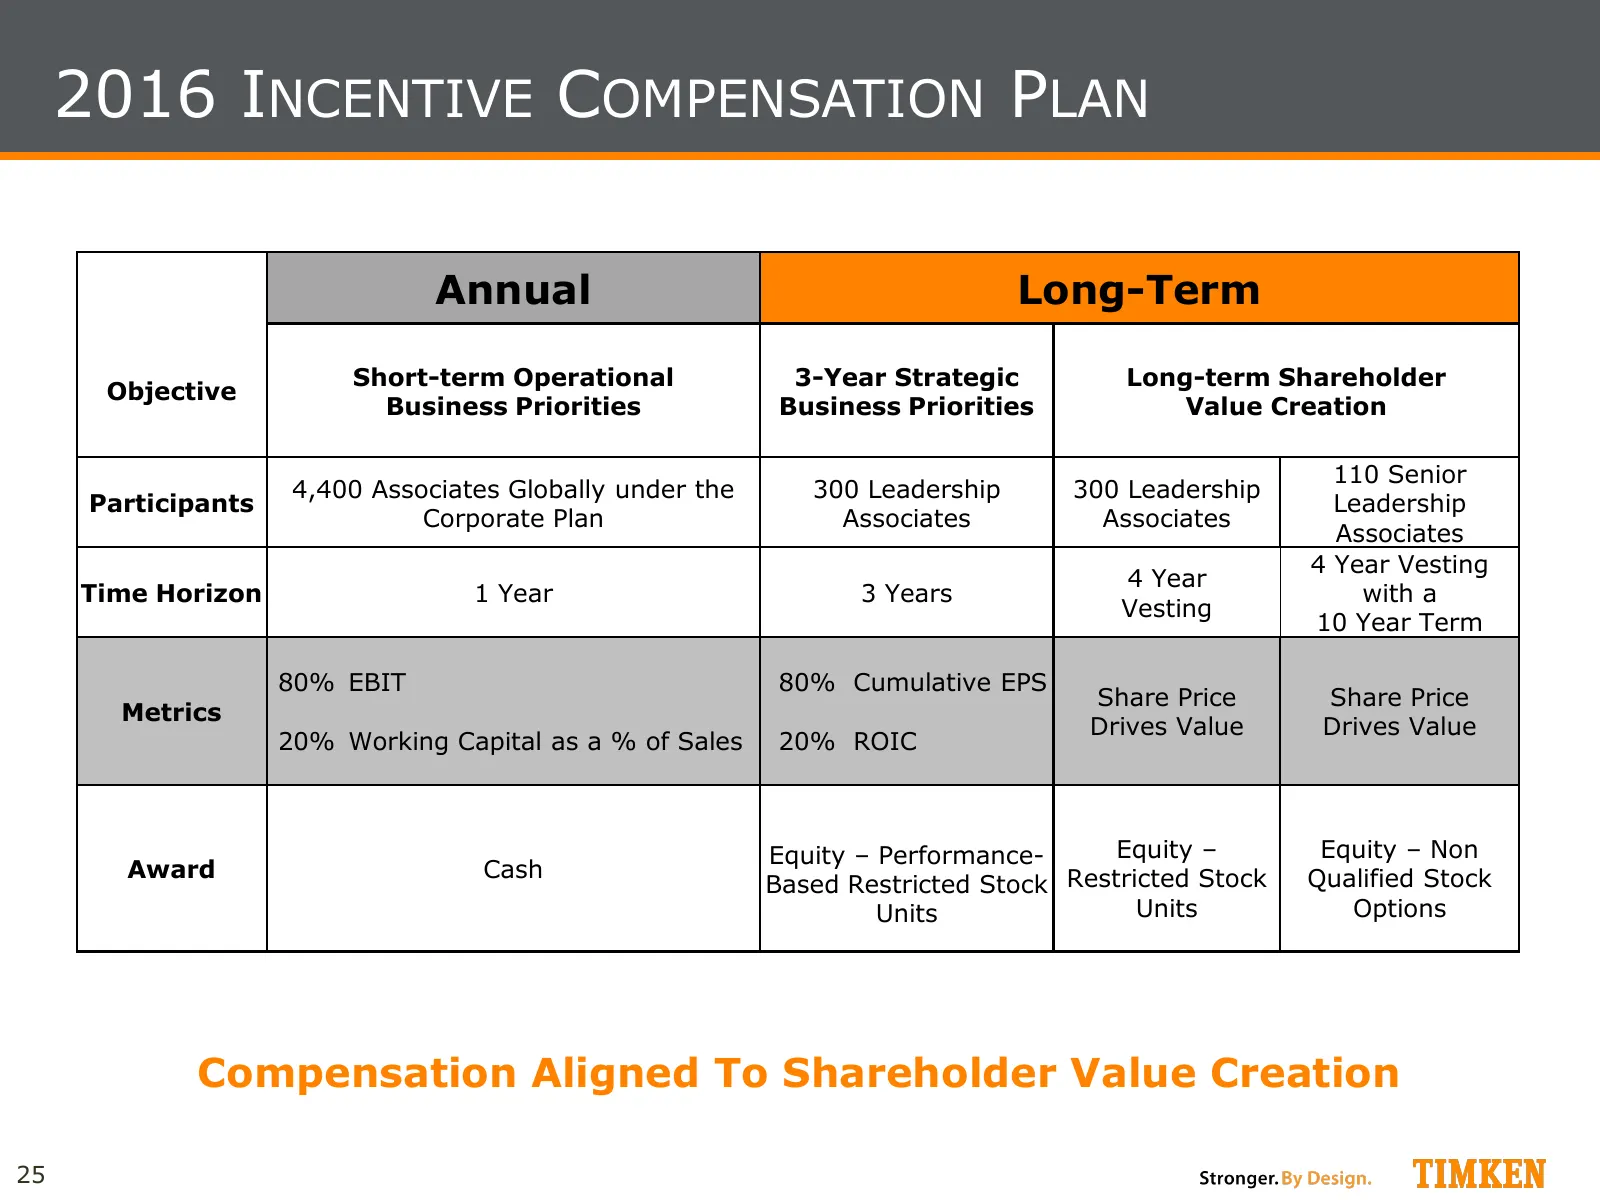
2016 INCENTIVE COMPENSATION PLAN Annual Long-Term Short-term Operational 3-Year Strategic Long-term Shareholder Objective Business Priorities Business Priorities Value Creation 110 Senior 4,400 Associates Globally under the 300 Leadership 300 Leadership Participants Leadership Corporate Plan Associa
Slide 26: GAAP Reconciliation: Segment EBIT & EBIT Margin
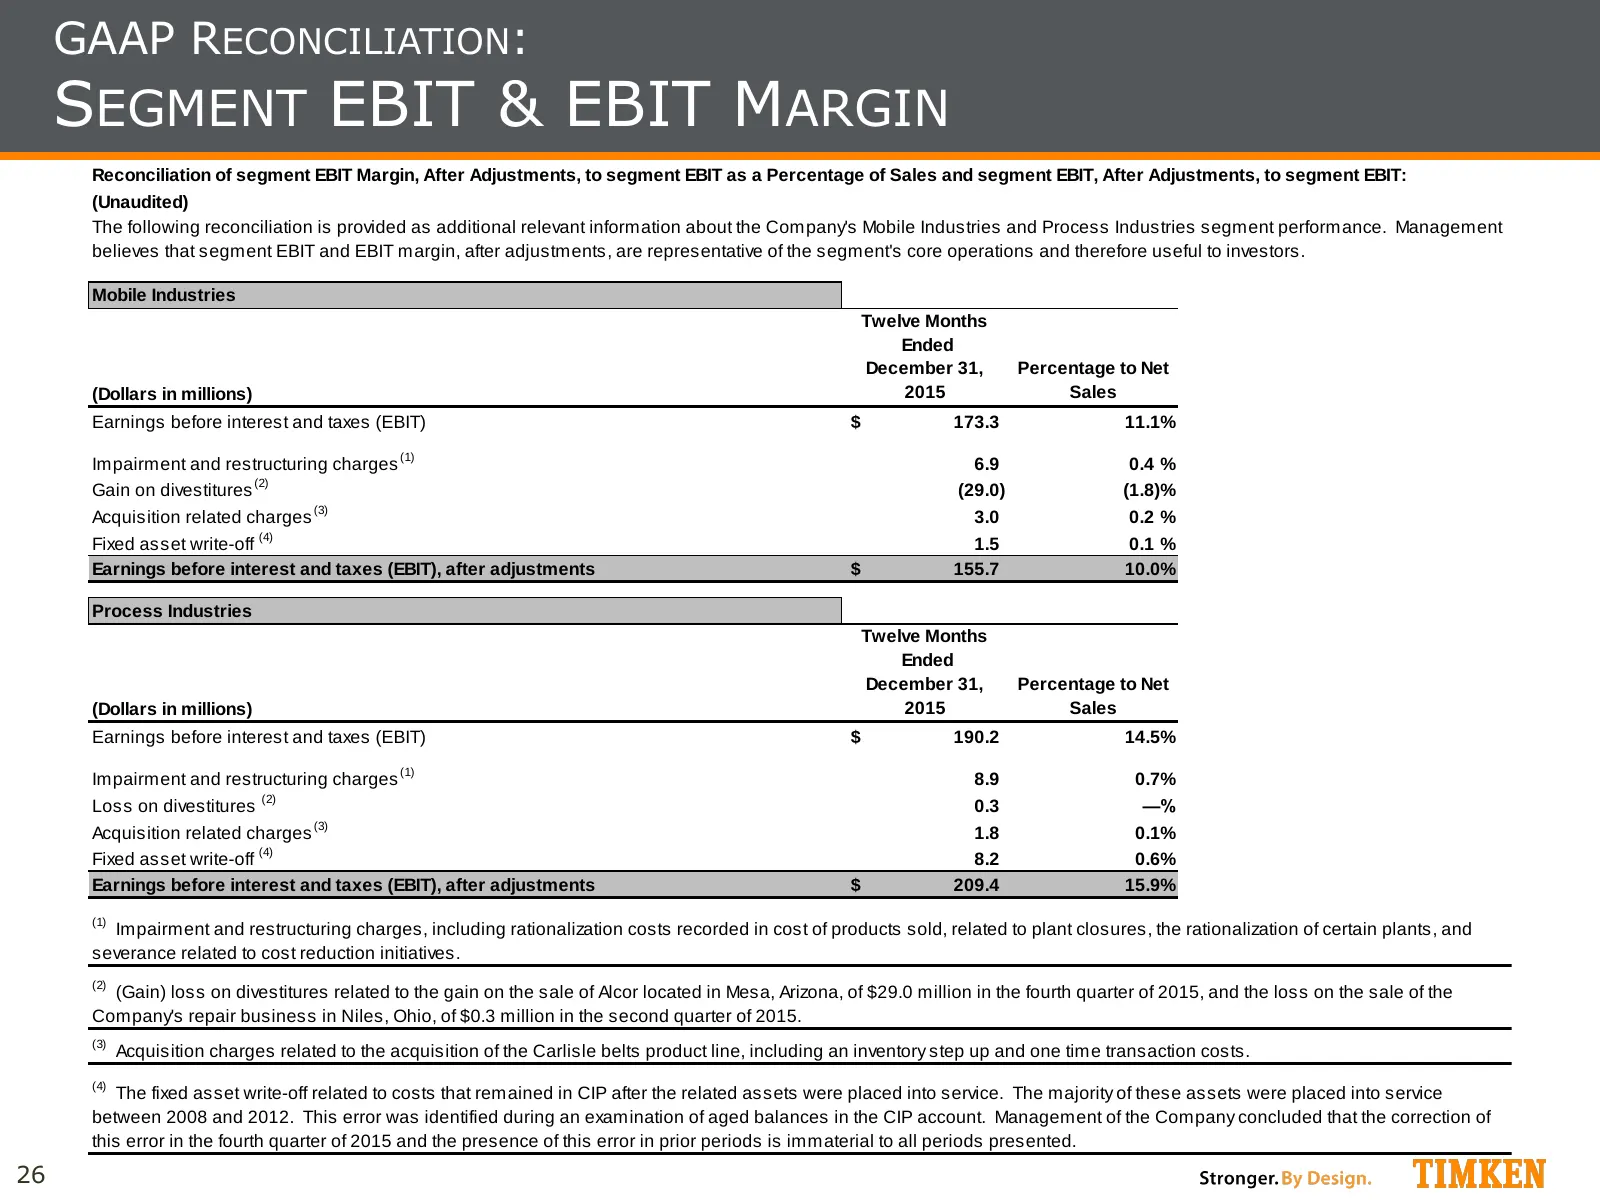
GAAP RECONCILIATION: SEGMENT EBIT & EBIT MARGIN Reconciliation of segment EBIT Margin, After Adjustments, to segment EBIT as a Percentage of Sales and segment EBIT, After Adjustments, to segment EBIT: (Unaudited) The following reconciliation is provided as additional relevant information about the C
Slide 27: GAAP Reconciliation: Net Debt
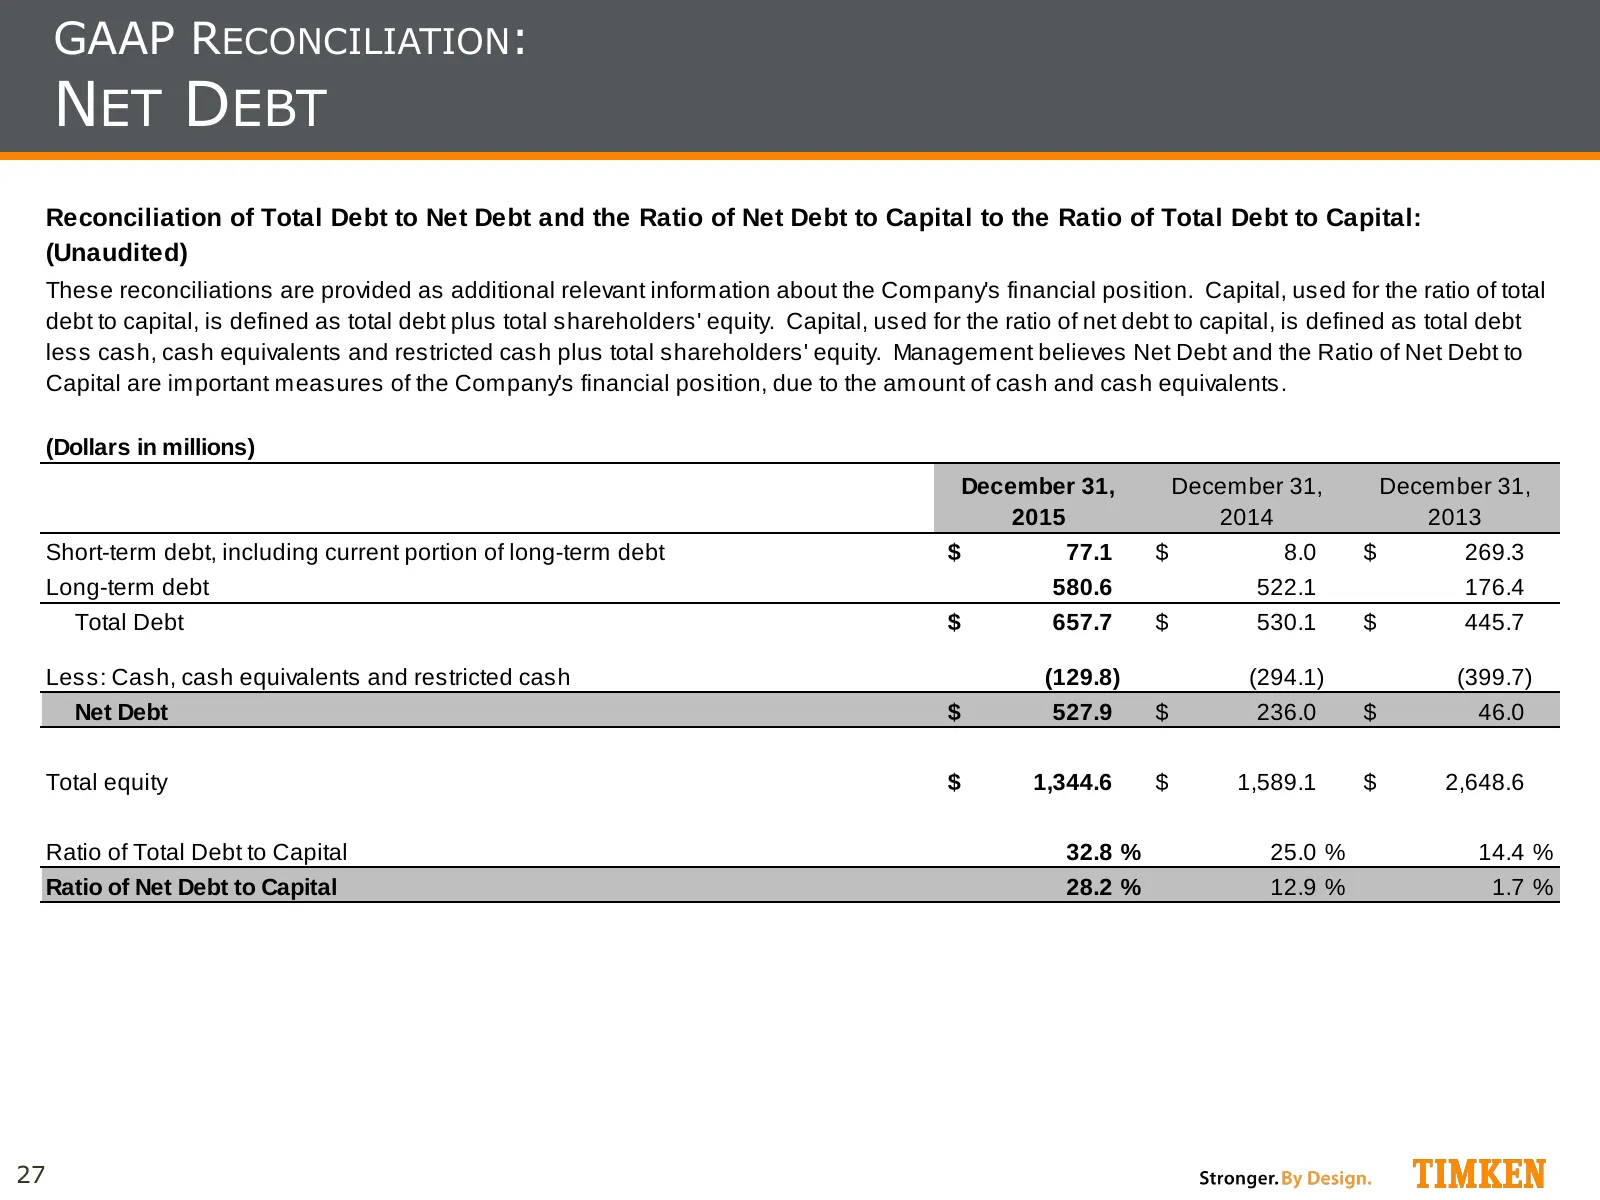
GAAP RECONCILIATION: NET DEBT Reconciliation of Total Debt to Net Debt and the Ratio of Net Debt to Capital to the Ratio of Total Debt to Capital: (Unaudited) These reconciliations are provided as additional relevant information about the Company's financial position. Capital, used for the ratio of
Slide 28: GAAP Reconciliation: Free Cash Flow
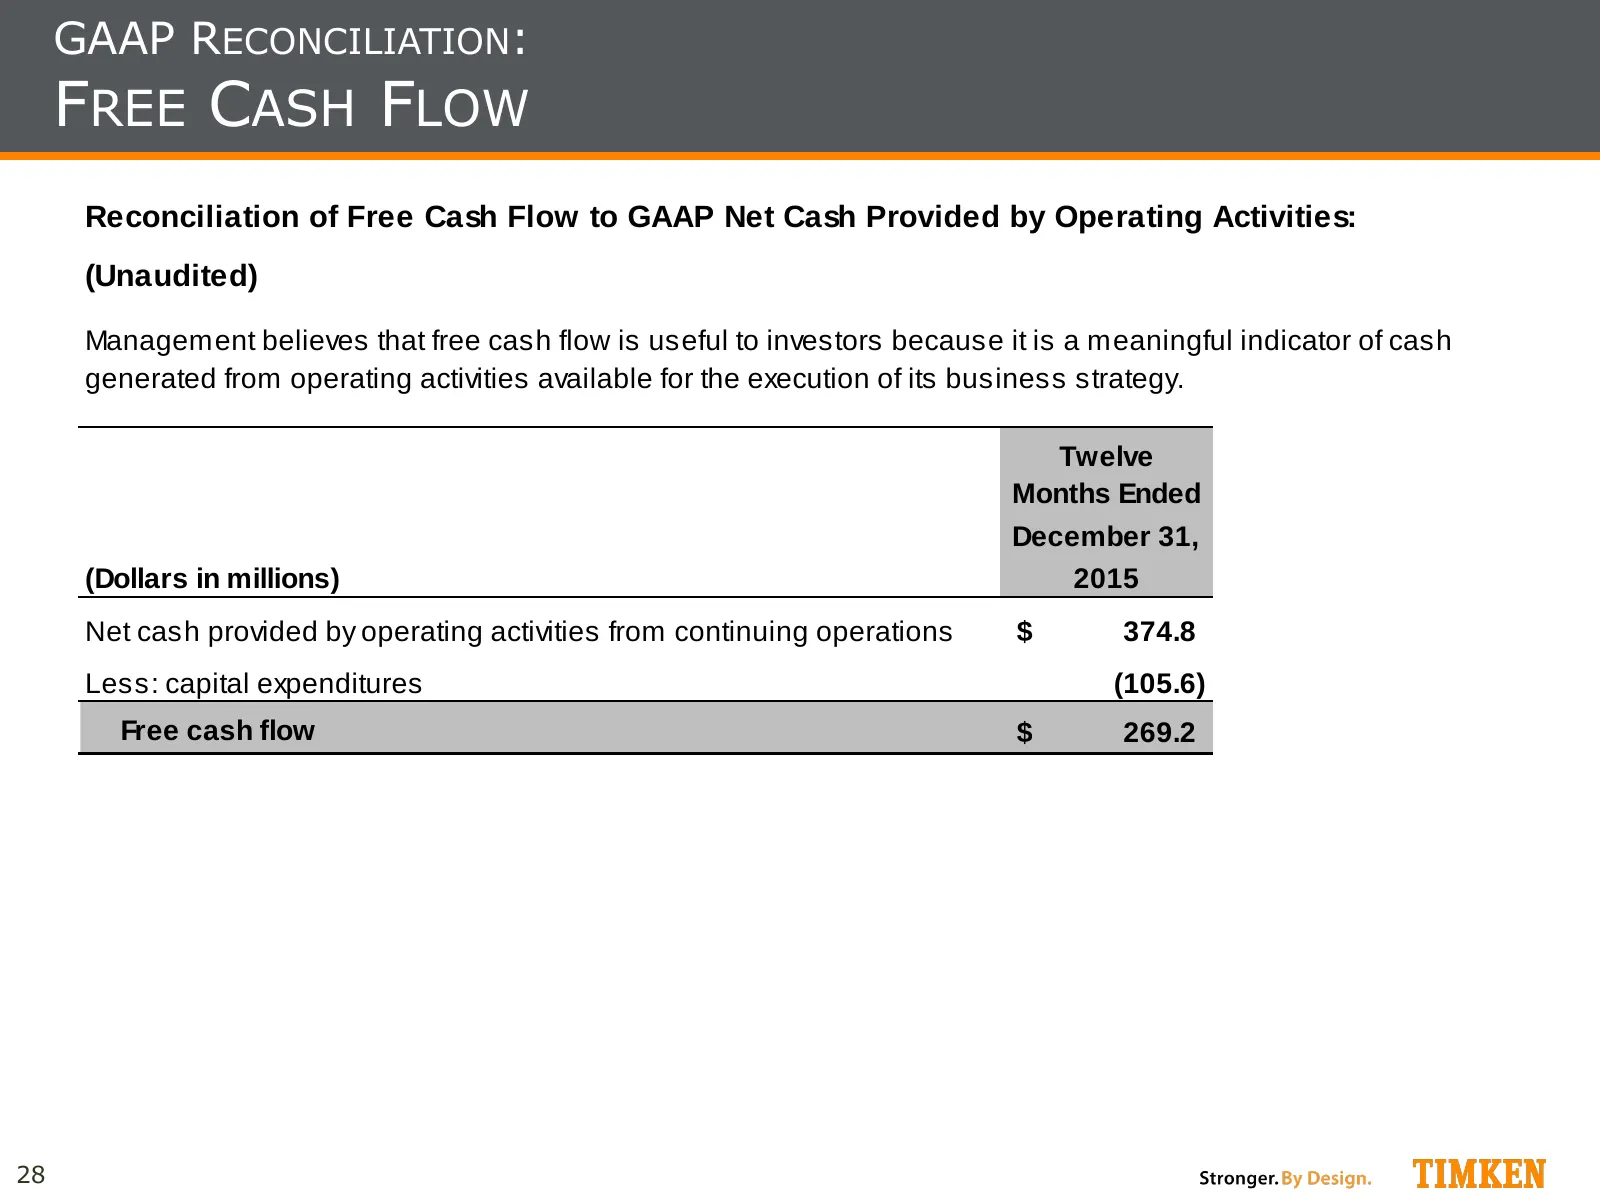
GAAP RECONCILIATION: FREE CASH FLOW Reconciliation of Free Cash Flow to GAAP Net Cash Provided by Operating Activities: (Unaudited) Management believes that free cash flow is useful to investors because it is a meaningful indicator of cash generated from operating activities available for the execut
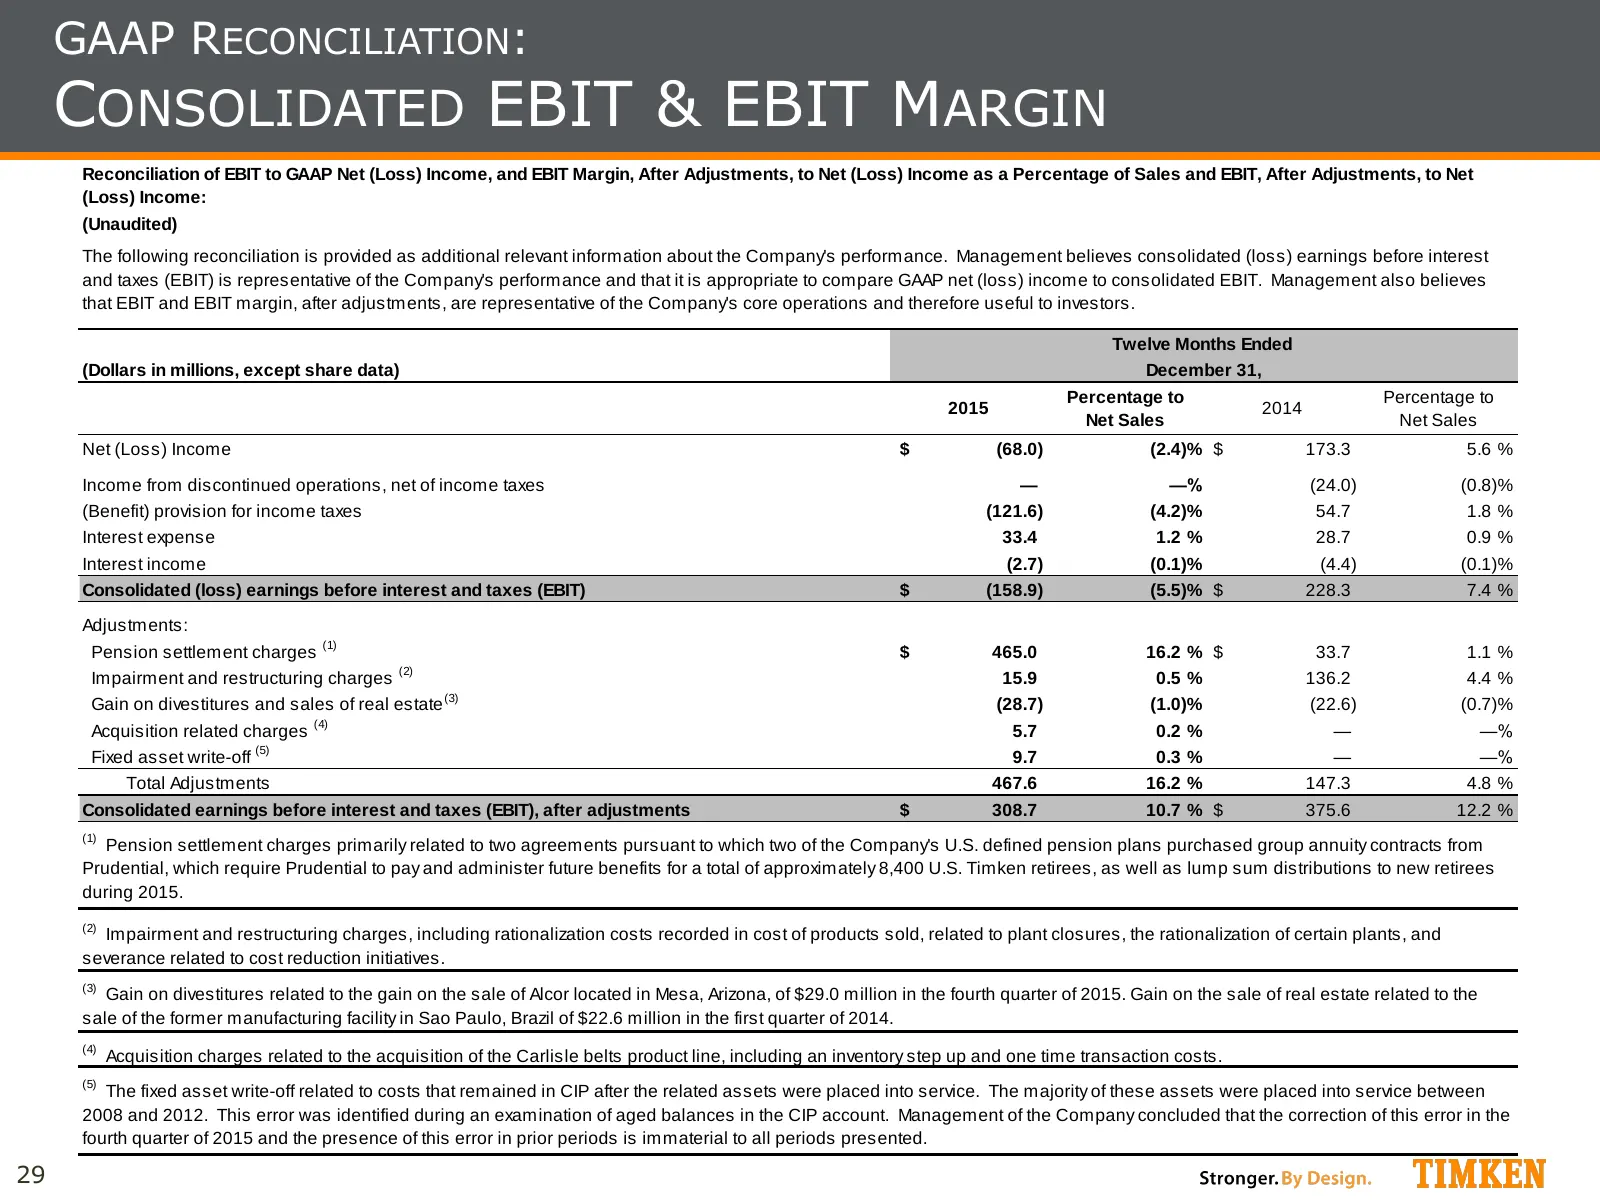
Slide 29: GAAP Reconciliation: Consolidated EBIT & EBIT Margin
GAAP RECONCILIATION: CONSOLIDATED EBIT & EBIT MARGIN Reconciliation of EBIT to GAAP Net (Loss) Income, and EBIT Margin, After Adjustments, to Net (Loss) Income as a Percentage of Sales and EBIT, After Adjustments, to Net (Loss) Income: (Unaudited) The following reconciliation is provided as addition
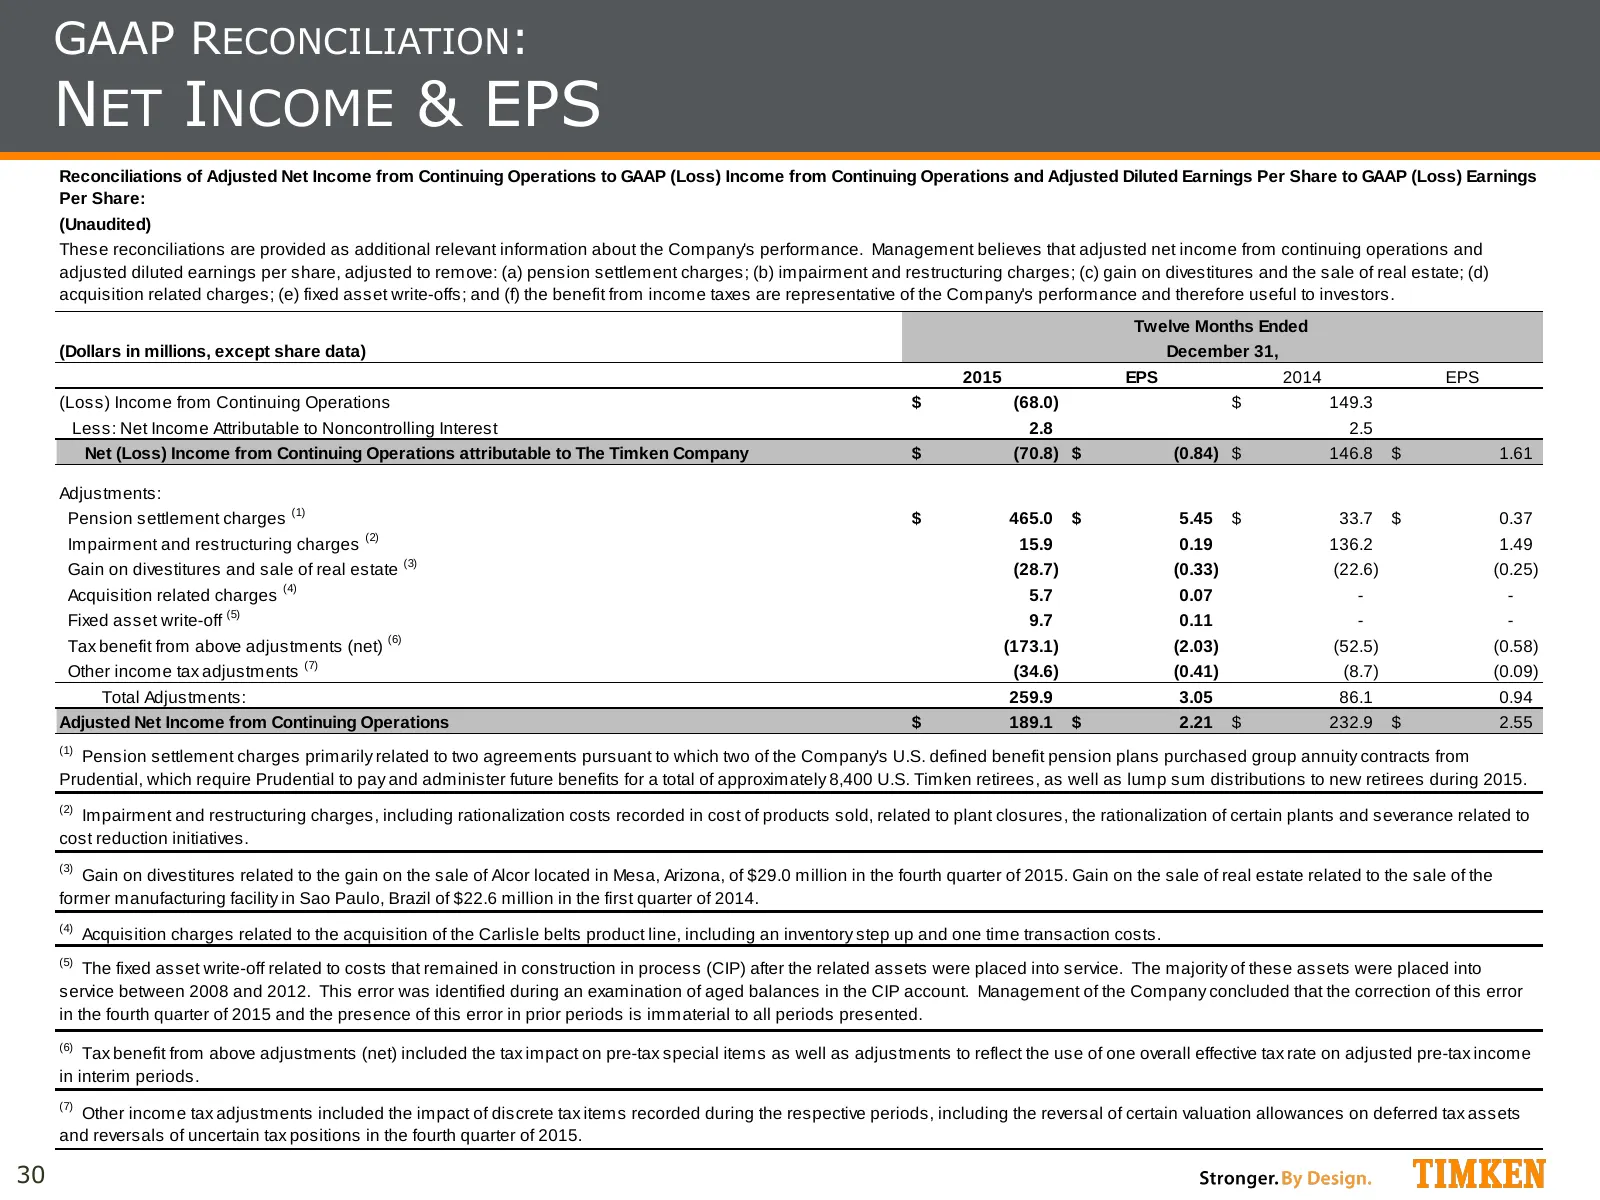
Slide 30: GAAP Reconciliation: Net Income & EPS
GAAP RECONCILIATION: NET INCOME & EPS Reconciliations of Adjusted Net Income from Continuing Operations to GAAP (Loss) Income from Continuing Operations and Adjusted Diluted Earnings Per Share to GAAP (Loss) Earnings Per Share: (Unaudited) These reconciliations are provided as additional relevant in
Source: Internet Archive copy of timken.com
More decks from Timken Company (the)
 The Timken Company — Baird Global Industrial Conference 202641 slides · Nov 10, 2026
 The Timken Company — Q3 2026 Earnings Presentation28 slides · Nov 4, 2026
 The Timken Company — Morgan Stanley Laguna Conference 202639 slides · Sep 16, 2026
 The Timken Company — Q2 2026 Earnings Presentation27 slides · Aug 4, 2026
 The Timken Company — Investor Presentation (August 2026)39 slides · August 2026
 The Timken Company — Investor Presentation (June 2026)38 slides · June 2026