Argo Group International Holdings Ltd
Argo Group International — Investor Presentation (November 2017)
21 slides from Argo Group International's investor presentation, Nov 6, 2017
Slide 1: 2017 Q3 Investor Presentation
2017 Investor Presentation Q3 Exhibit 99.1
Slide 2: Forward-looking statements
This presentation may include forward-looking statements, both with respect to Argo Group and its industry, that reflect our current views with respect to future events and financial performance. These statements are made pursuant to the safe harbor provisions of the Private Securities Litigation Re
Slide 3: Argo Group at a Glance
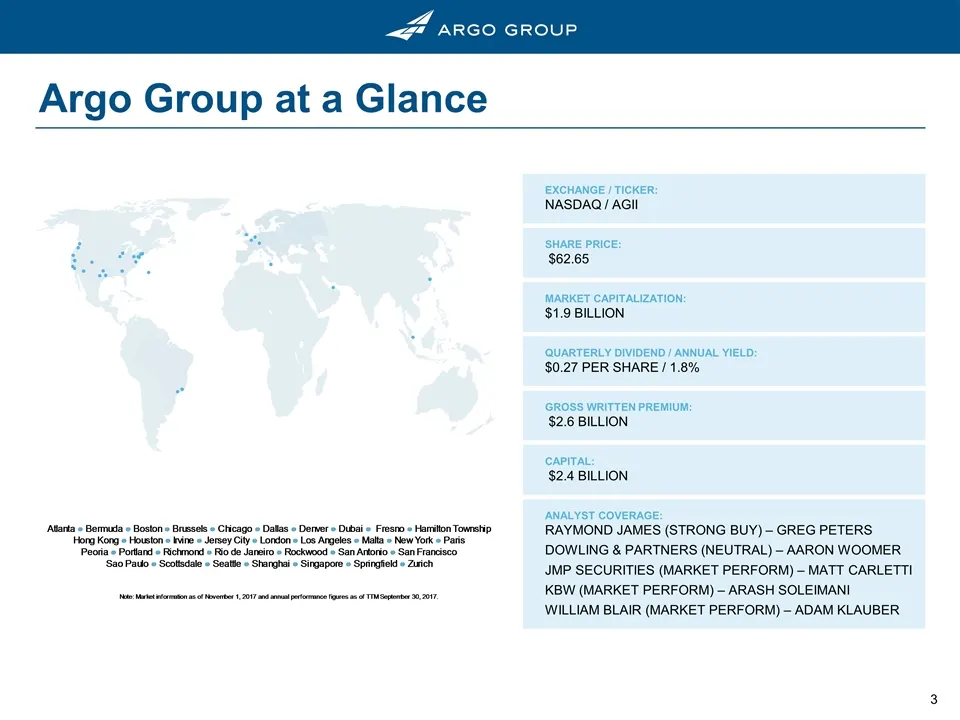
Argo Group at a Glance EXCHANGE / TICKER: NASDAQ / AGII SHARE PRICE: $62.65 MARKET CAPITALIZATION: $1.9 BILLION QUARTERLY DIVIDEND / ANNUAL YIELD: $0.27 PER SHARE / 1.8% GROSS WRITTEN PREMIUM: $2.6 BILLION CAPITAL: $2.4 BILLION ANALYST COVERAGE: RAYMOND JAMES (STRONG BUY) ‒ GREG PETERS DOWLING & PAR
Slide 4: Leading Specialty Platform: Argo Franchise Overview
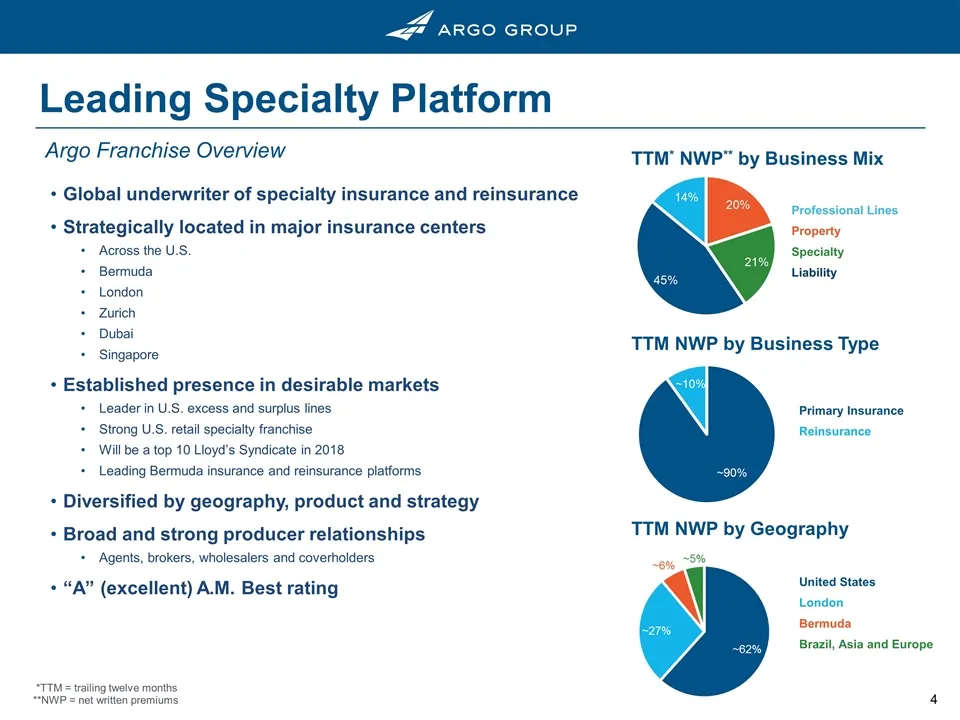
Global underwriter of specialty insurance and reinsurance Strategically located in major insurance centers Across the U.S. Bermuda London Zurich Dubai Singapore Established presence in desirable markets Leader in U.S. excess and surplus lines Strong U.S. retail specialty franchise Will be a top 10 L
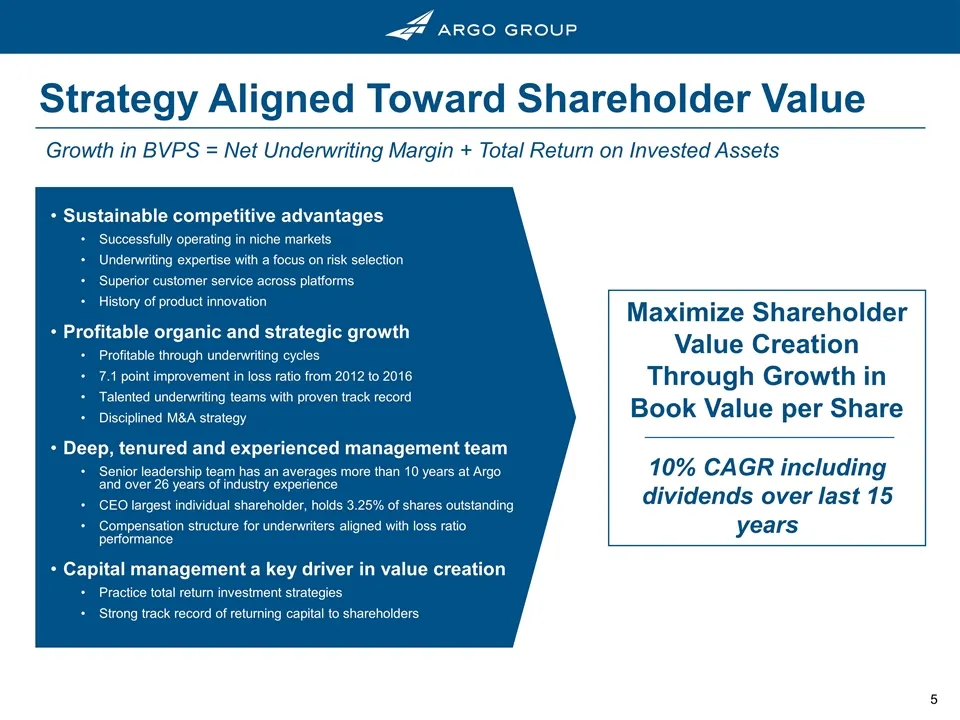
Slide 5: Maximize Shareholder Value Creation Through Growth in Book Value per Share
Growth in BVPS = Net Underwriting Margin + Total Return on Invested Assets Maximize Shareholder Value Creation Through Growth in Book Value per Share 10% CAGR including dividends over last 15 years Strategy Aligned Toward Shareholder Value Sustainable competitive advantages Successfully operating in
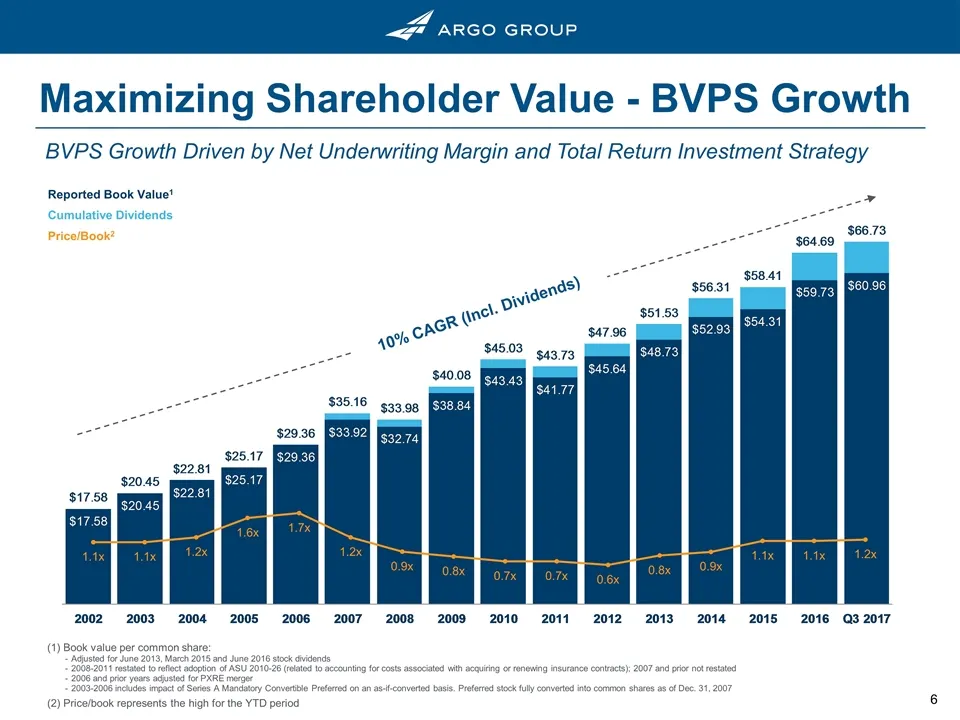
Slide 6: Maximizing Shareholder Value - BVPS Growth
10% CAGR (Incl. Dividends) BVPS Growth Driven by Net Underwriting Margin and Total Return Investment Strategy Reported Book Value1 Cumulative Dividends Price/Book2 (1) Book value per common share: Adjusted for June 2013, March 2015 and June 2016 stock dividends 2008-2011 restated to reflect adoption
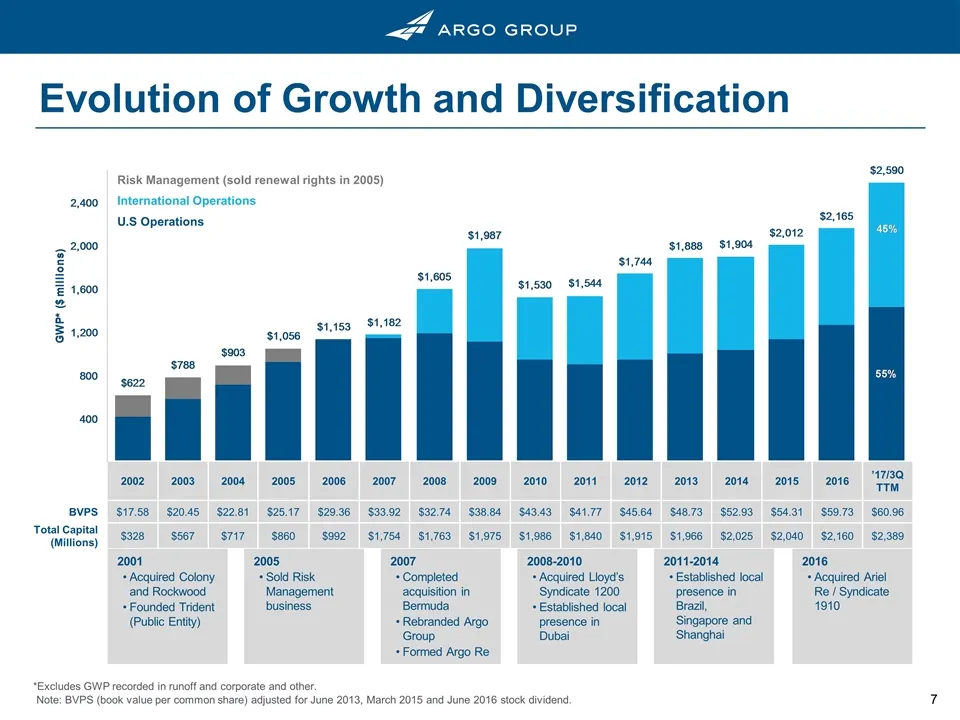
Slide 7: Substantial Growth and Financial Strength: BVPS and Capital History
2002 2003 2004 2005 2006 2007 2008 2009 2010 2011 2012 2013 2014 2015 2016 ’17/3Q TTM BVPS $17.58 $20.45 $22.81 $25.17 $29.36 $33.92 $32.74 $38.84 $43.43 $41.77 $45.64 $48.73 $52.93 $54.31 $59.73 $60.96 Total Capital (Millions) $328 $567 $717 $860 $992 $1,754 $1,763 $1,975 $1,986 $1,840 $1,915 $1,96
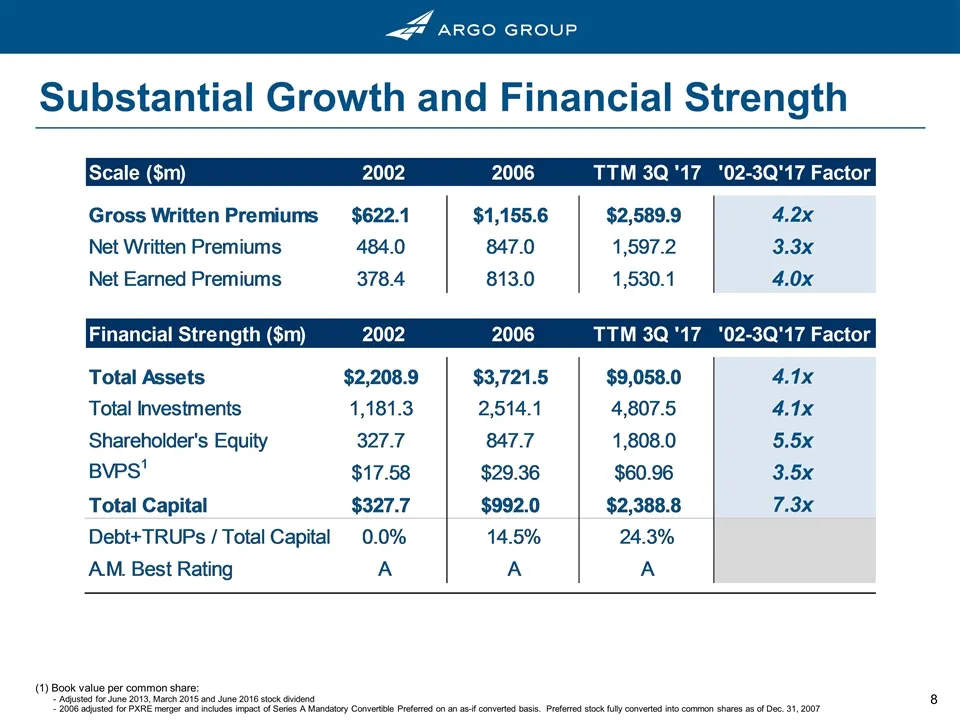
Slide 8: Substantial Growth and Financial Strength
(1) Book value per common share: Adjusted for June 2013, March 2015 and June 2016 stock dividend 2006 adjusted for PXRE merger and includes impact of Series A Mandatory Convertible Preferred on an as-if converted basis. Preferred stock fully converted into common shares as of Dec. 31, 2007 Substanti
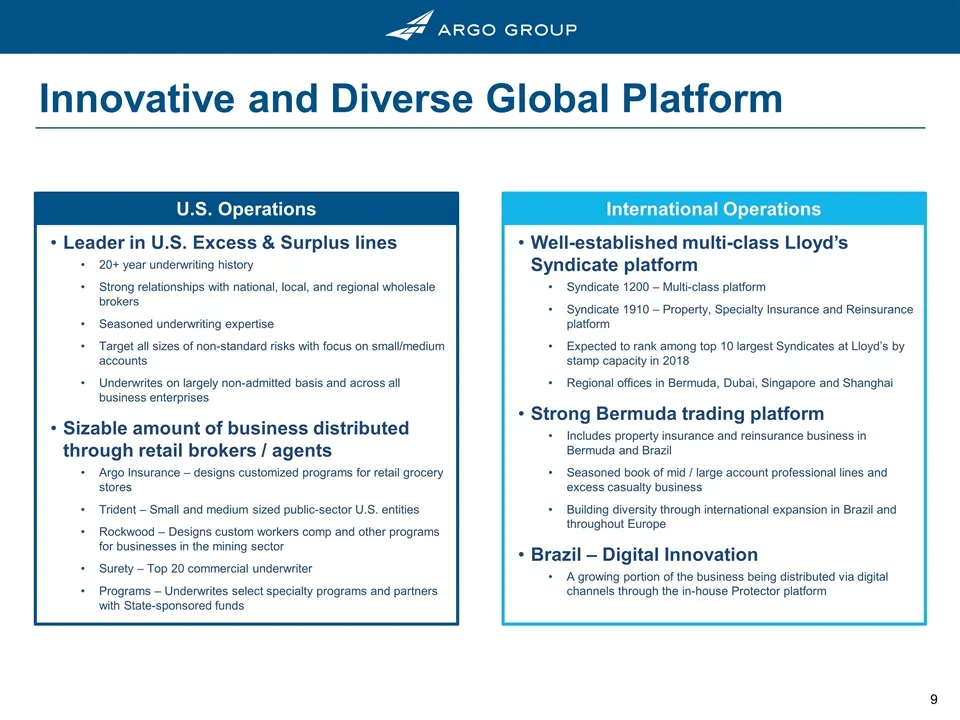
Slide 9: Innovative and Diverse Global Platform
Innovative and Diverse Global Platform Well-established multi-class Lloyd’s Syndicate platform Syndicate 1200 – Multi-class platform Syndicate 1910 – Property, Specialty Insurance and Reinsurance platform Expected to rank among top 10 largest Syndicates at Lloyd’s by stamp capacity in 2018 Regional
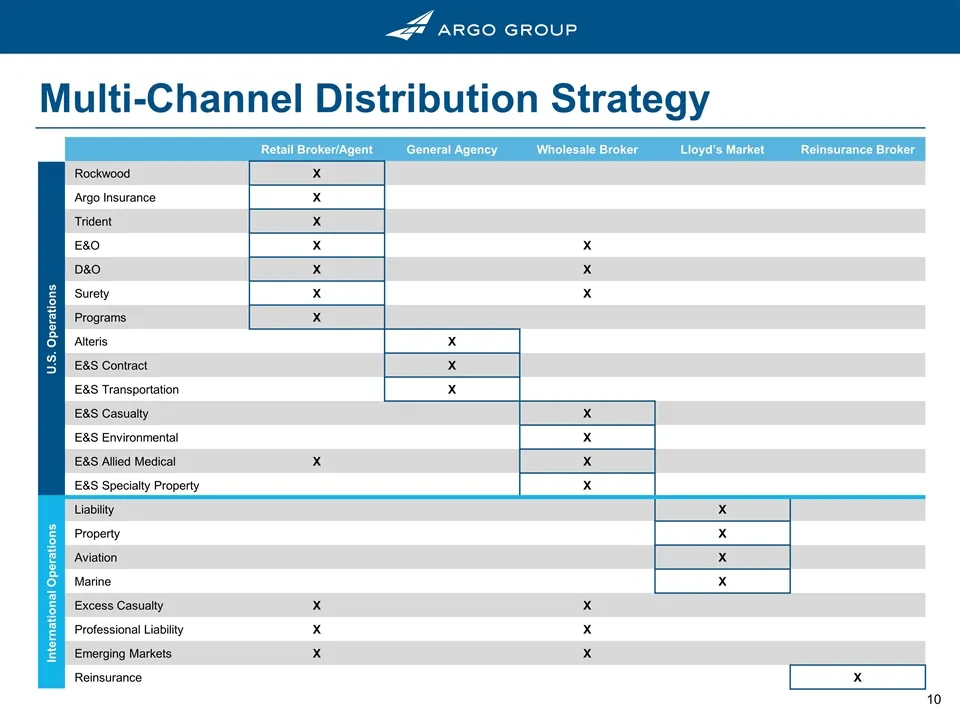
Slide 10: Multi-Channel Distribution Strategy
Multi-Channel Distribution Strategy Retail Broker/Agent General Agency Wholesale Broker Lloyd’s Market Reinsurance Broker U.S. Operations Rockwood X Argo Insurance X Trident X E&O X X D&O X X Surety X X Programs X Alteris X E&S Contract X E&S Transportation X E&S Casualty X E&S Environmental X E&S A
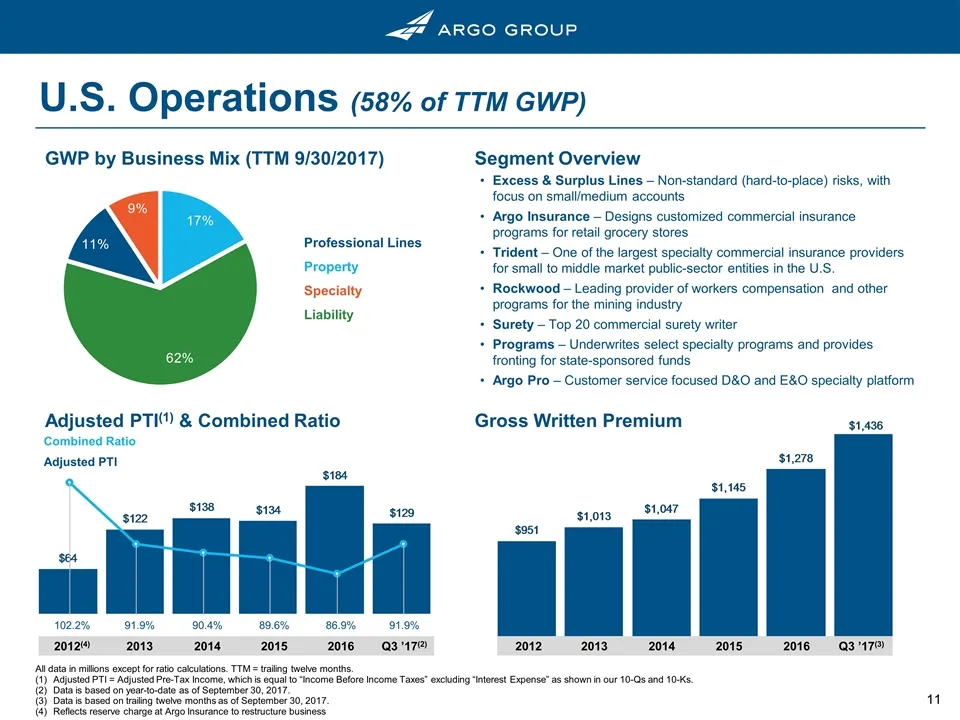
Slide 11: U.S. Operations (58% of TTM GWP)
U.S. Operations (58% of TTM GWP) All data in millions except for ratio calculations. TTM = trailing twelve months. Adjusted PTI = Adjusted Pre-Tax Income, which is equal to “Income Before Income Taxes” excluding “Interest Expense” as shown in our 10-Qs and 10-Ks. Data is based on year-to-date as of
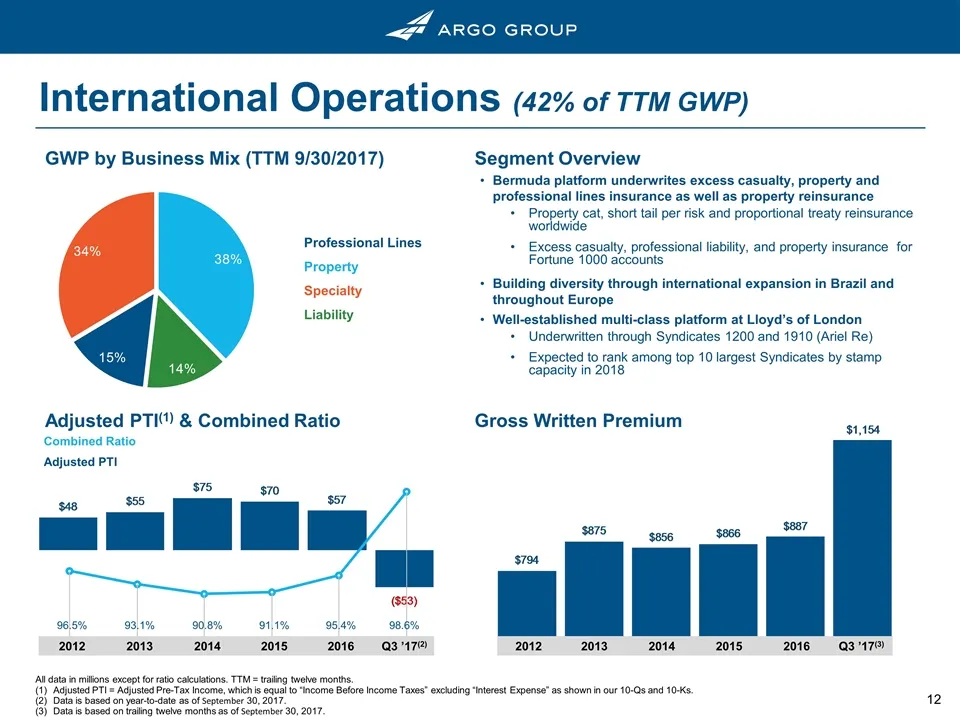
Slide 12: International Operations (42% of TTM GWP)
International Operations (42% of TTM GWP) All data in millions except for ratio calculations. TTM = trailing twelve months. Adjusted PTI = Adjusted Pre-Tax Income, which is equal to “Income Before Income Taxes” excluding “Interest Expense” as shown in our 10-Qs and 10-Ks. Data is based on year-to-da
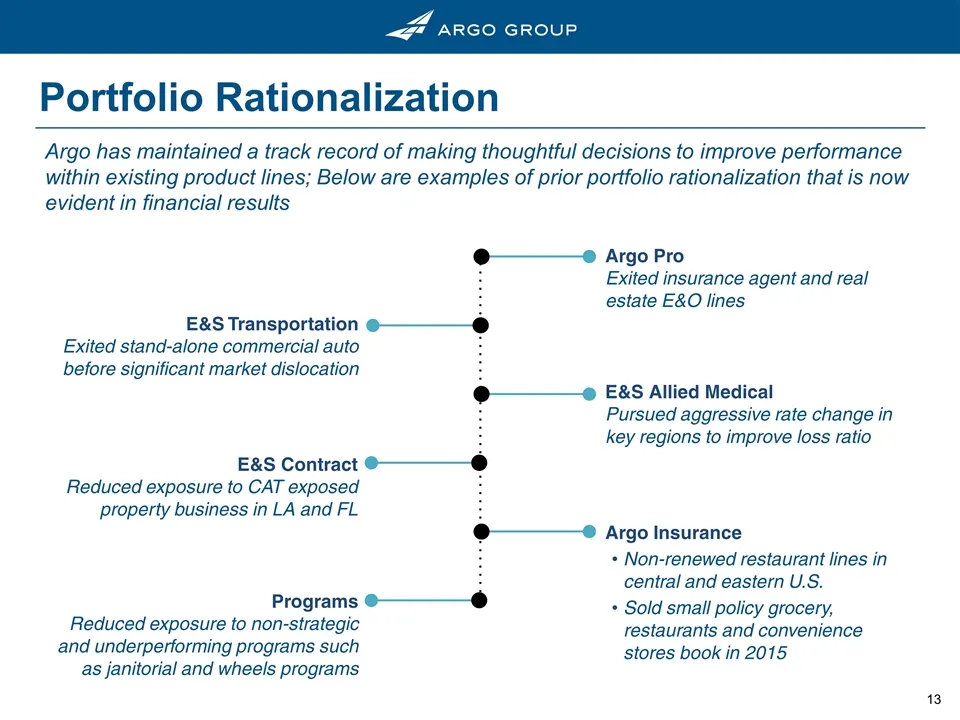
Slide 13: Portfolio Rationalization
Portfolio Rationalization Argo has maintained a track record of making thoughtful decisions to improve performance within existing product lines; Below are examples of prior portfolio rationalization that is now evident in financial results Argo Pro Exited insurance agent and real estate E&O lines E
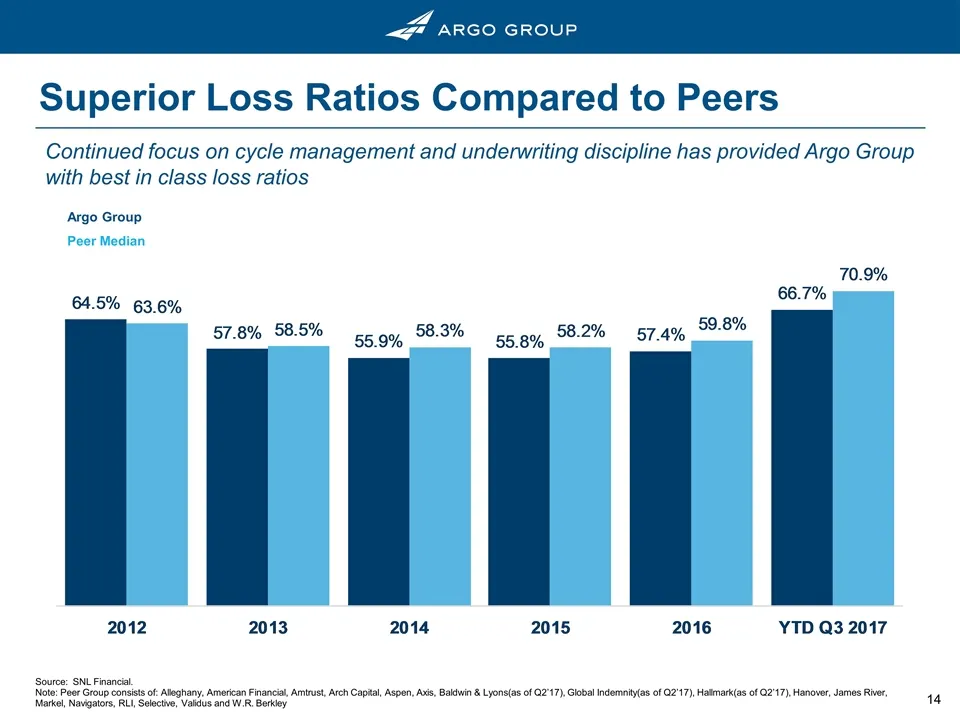
Slide 14: Superior Loss Ratios Compared to Peers
Superior Loss Ratios Compared to Peers Continued focus on cycle management and underwriting discipline has provided Argo Group with best in class loss ratios Argo Group Peer Median Source: SNL Financial. Note: Peer Group consists of: Alleghany, American Financial, Amtrust, Arch Capital, Aspen, Axis,
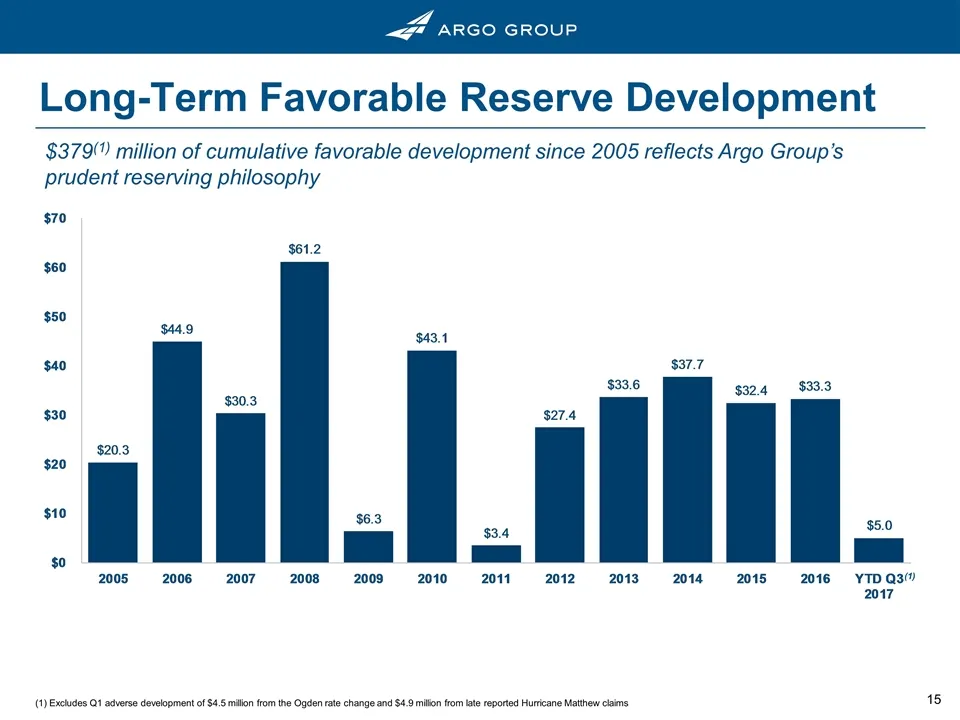
Slide 15: Long-Term Favorable Reserve Development
Long-Term Favorable Reserve Development $379(1) million of cumulative favorable development since 2005 reflects Argo Group’s prudent reserving philosophy (1) (1) Excludes Q1 adverse development of $4.5 million from the Ogden rate change and $4.9 million from late reported Hurricane Matthew claims
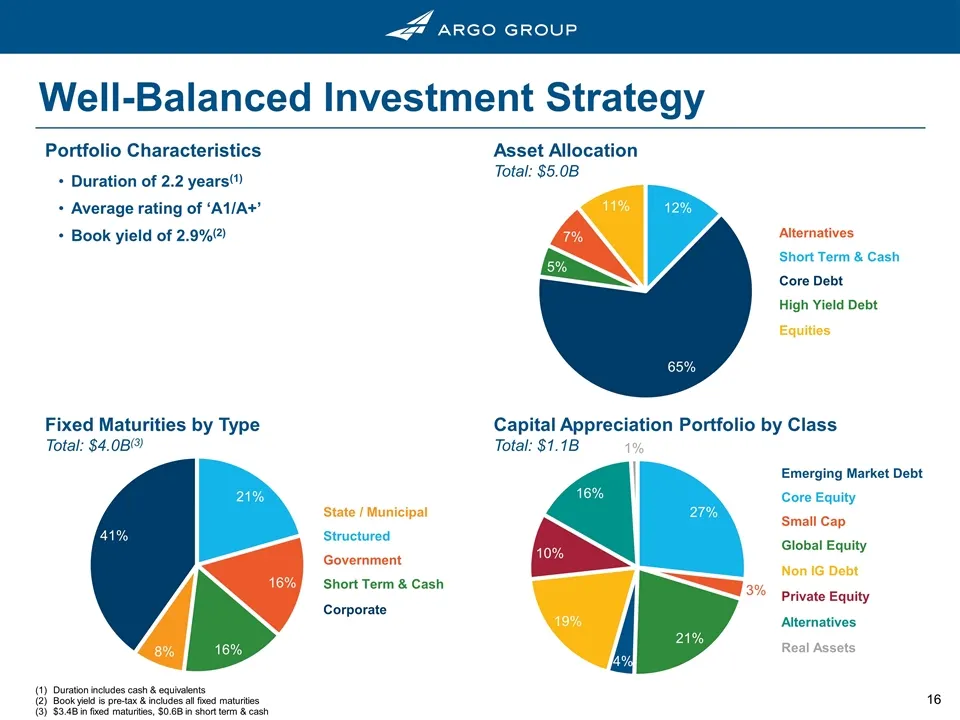
Slide 16: Well-Balanced Investment Strategy
Well-Balanced Investment Strategy Duration includes cash & equivalents Book yield is pre-tax & includes all fixed maturities $3.4B in fixed maturities, $0.6B in short term & cash Portfolio Characteristics Asset Allocation Total: $5.0B Fixed Maturities by Type Total: $4.0B(3) Capital Appreciation Por
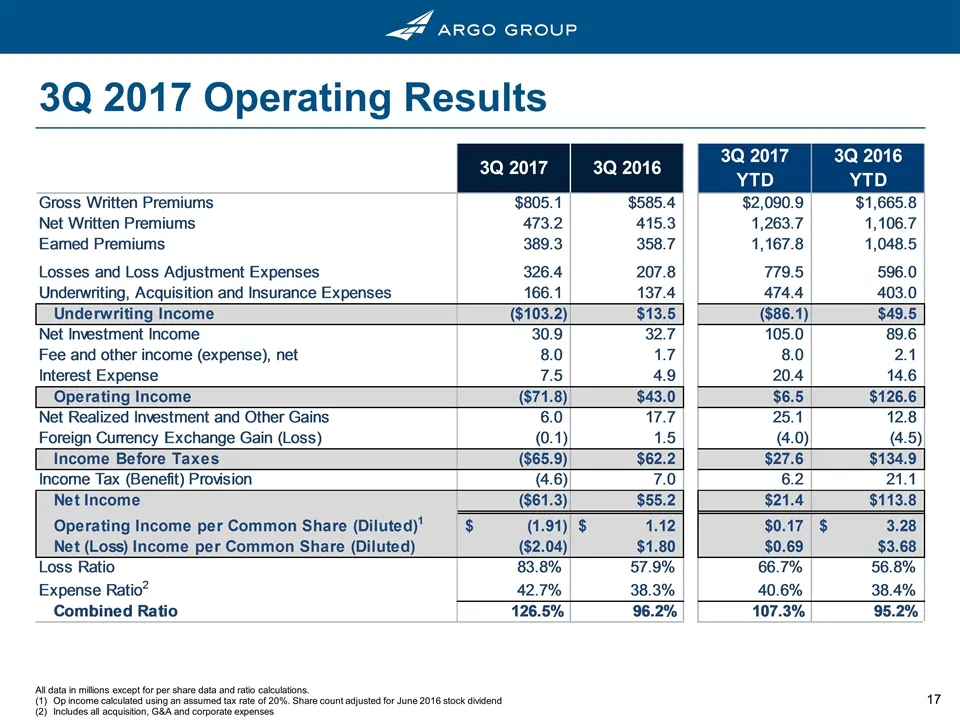
Slide 17: 3Q 2017 Operating Results
3Q 2017 Operating Results All data in millions except for per share data and ratio calculations. Op income calculated using an assumed tax rate of 20%. Share count adjusted for June 2016 stock dividend Includes all acquisition, G&A and corporate expenses
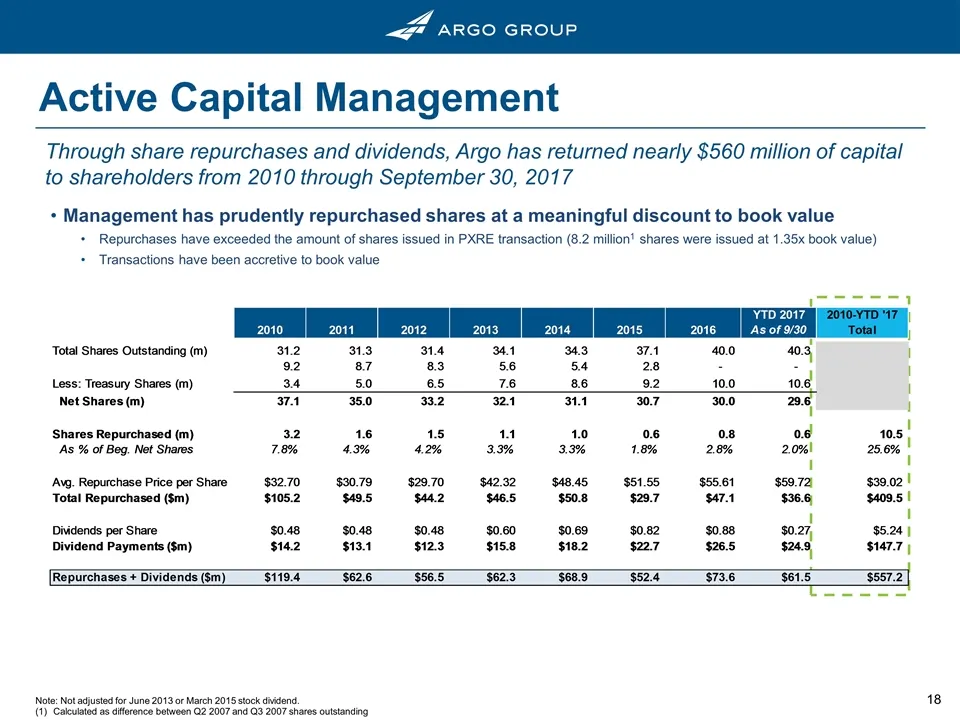
Slide 18: Active Capital Management
Active Capital Management Through share repurchases and dividends, Argo has returned nearly $560 million of capital to shareholders from 2010 through September 30, 2017 Management has prudently repurchased shares at a meaningful discount to book value Repurchases have exceeded the amount of shares i
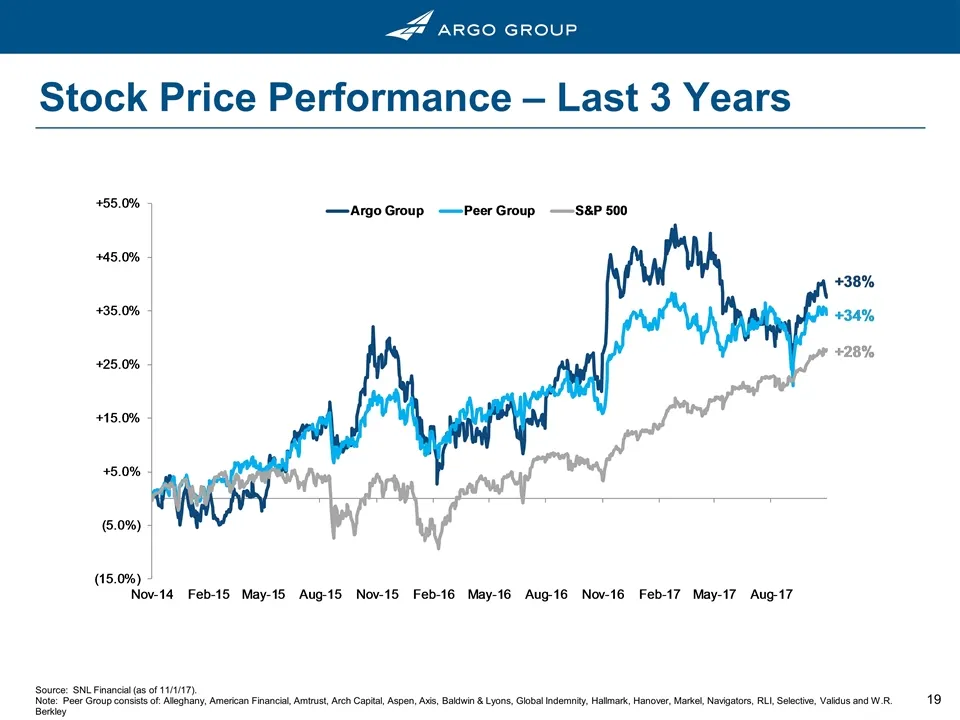
Slide 19: Stock Price Performance
Stock Price Performance – Last 3 Years Source: SNL Financial (as of 11/1/17). Note: Peer Group consists of: Alleghany, American Financial, Amtrust, Arch Capital, Aspen, Axis, Baldwin & Lyons, Global Indemnity, Hallmark, Hanover, Markel, Navigators, RLI, Selective, Validus and W.R. Berkley
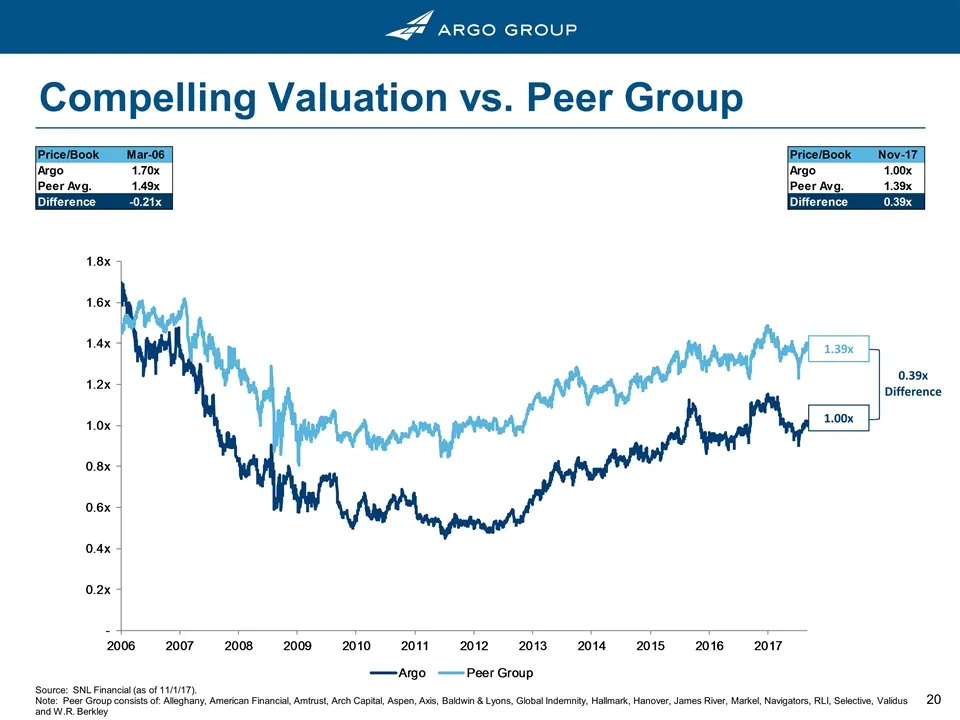
Slide 20: Compelling Valuation vs. Peer Group
Compelling Valuation vs. Peer Group Source: SNL Financial (as of 11/1/17). Note: Peer Group consists of: Alleghany, American Financial, Amtrust, Arch Capital, Aspen, Axis, Baldwin & Lyons, Global Indemnity, Hallmark, Hanover, James River, Markel, Navigators, RLI, Selective, Validus and W.R. Berkley
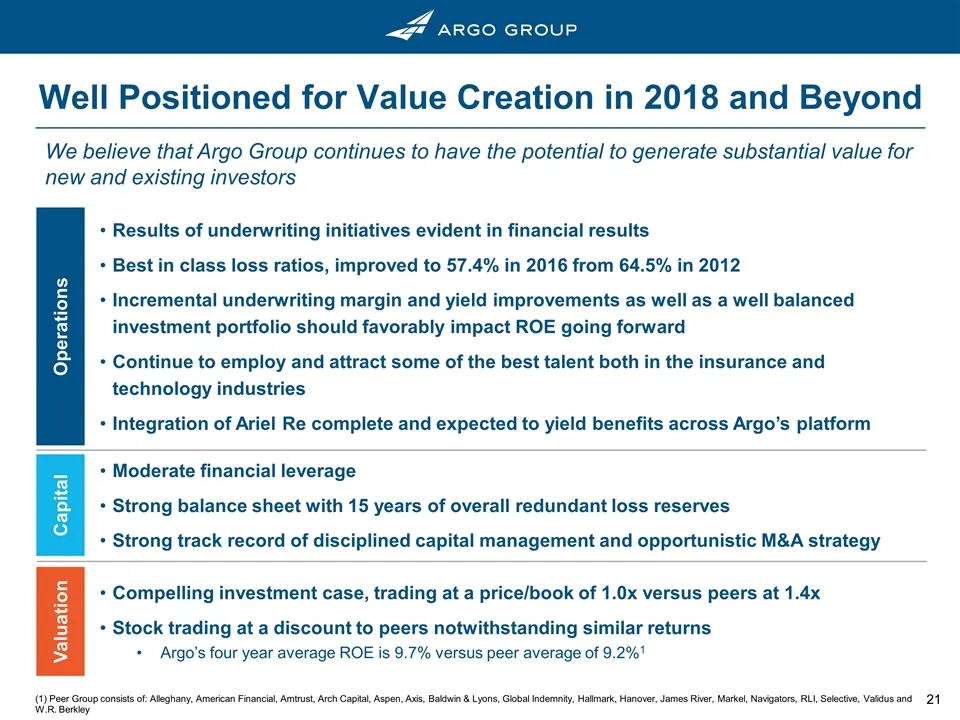
Slide 21: Operations, Capital, Valuation: Investment Case
Operations Capital Valuation Compelling investment case, trading at a price/book of 1.0x versus peers at 1.4x Stock trading at a discount to peers notwithstanding similar returns Argo’s four year average ROE is 9.7% versus peer average of 9.2%1 Moderate financial leverage Strong balance sheet with 1
Source: SEC EDGAR · 8-K filed Nov 6, 2017
More decks from Argo Group International Holdings Ltd
 Proxy Contest (November 2022)39 slides · Nov 18, 2022
 Corporate Update (September 2022)23 slides · Sep 8, 2022
 Investor Presentation (February 2022)24 slides · Feb 23, 2022
 Q3 2021 Earnings Presentation7 slides · Nov 3, 2021
 Investor Day (March 2021)59 slides · Mar 12, 2021
 Investor Presentation (November 2020)17 slides · Nov 10, 2020