Superior Industries International
Superior Industries International — Q2 2023 Earnings Presentation
25 slides from Superior Industries International's earnings presentation, Aug 3, 2023

Slide 1: Second Quarter 2023 Earnings Conference Call
Second Quarter 2023 Earnings Conference Call August 3, 2023
Slide 2: Forward-looking Statements and Non-GAAP Financial Measures
Forward-looking Statements and Non-GAAP Financial Measures Forward-Looking Statements This presentation and webcast contain statements that are forward-looking statements within the meaning of the Private Securities Litigation Reform Act of 1995. Forward-looking statements include all statements tha
Slide 3: Agenda
Agenda Introduction Tim Trenary Executive Vice President and Chief Financial Officer Business Update Majdi Abulaban President and Chief Executive Officer Financial Review Tim Trenary Executive Vice President and Chief Financial Officer Delivering innovative solutions 3
Slide 4: Business Update
Business Update S SREHIOR
Slide 5: Commercial and Operational Discipline in a Challenging Environment
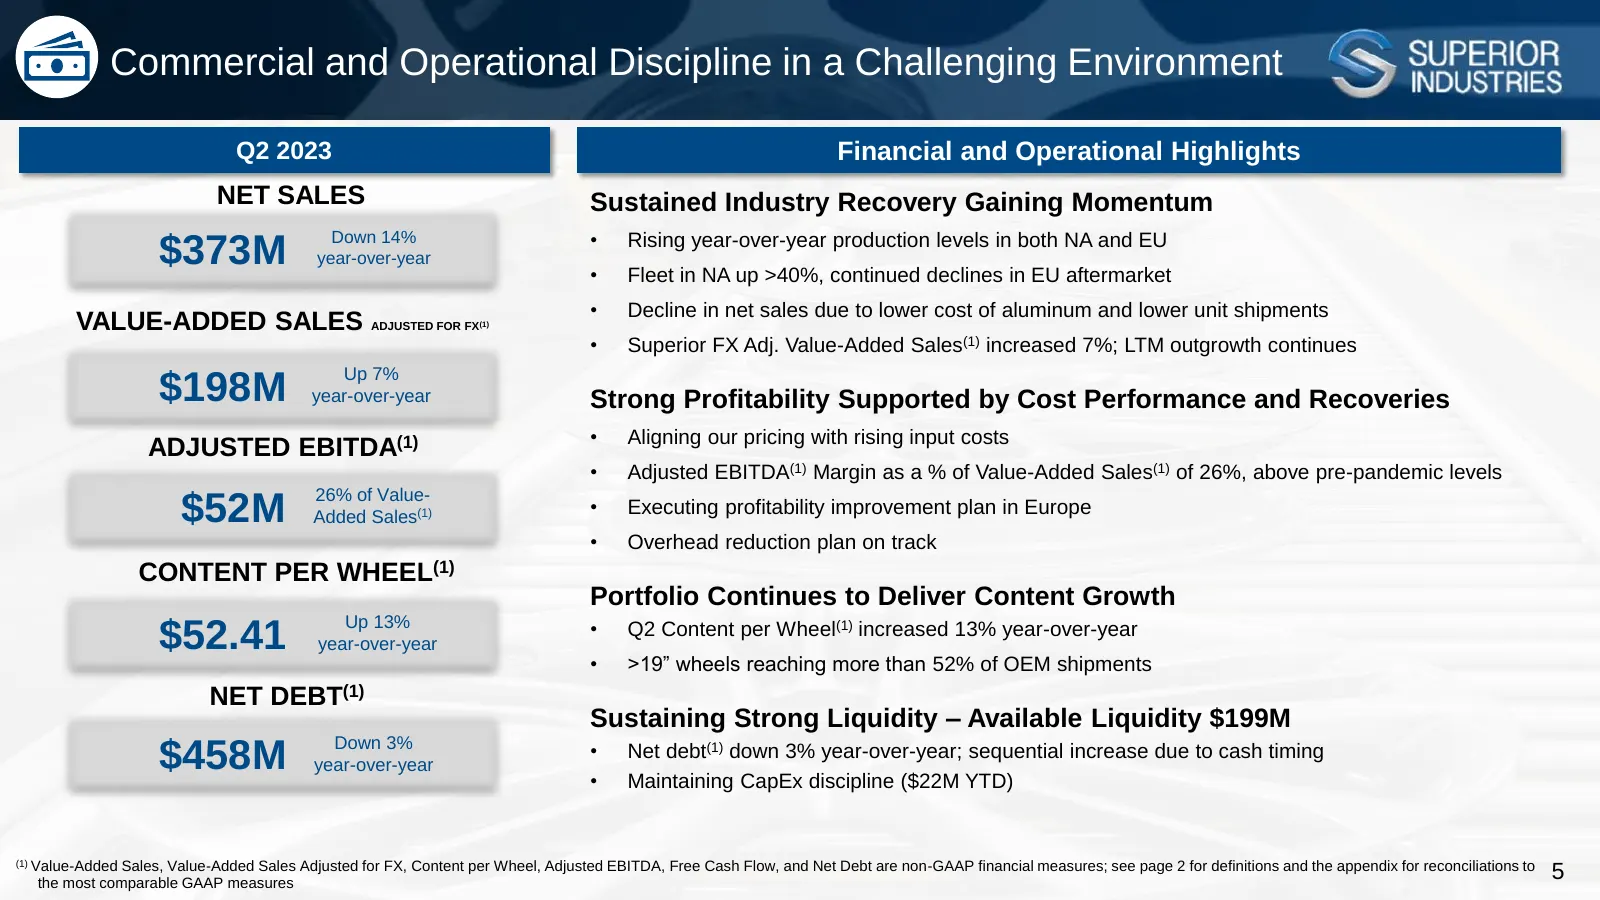
Commercial and Operational Discipline in a Challenging Environment Q2 2023 Financial and Operational Highlights NET SALES Sustained Industry Recovery Gaining Momentum Down 14% • Rising year-over-year production levels in both NA and EU $373M year-over-year • Fleet in NA up >40%, continued declines i
Slide 6: Superior Since 2019
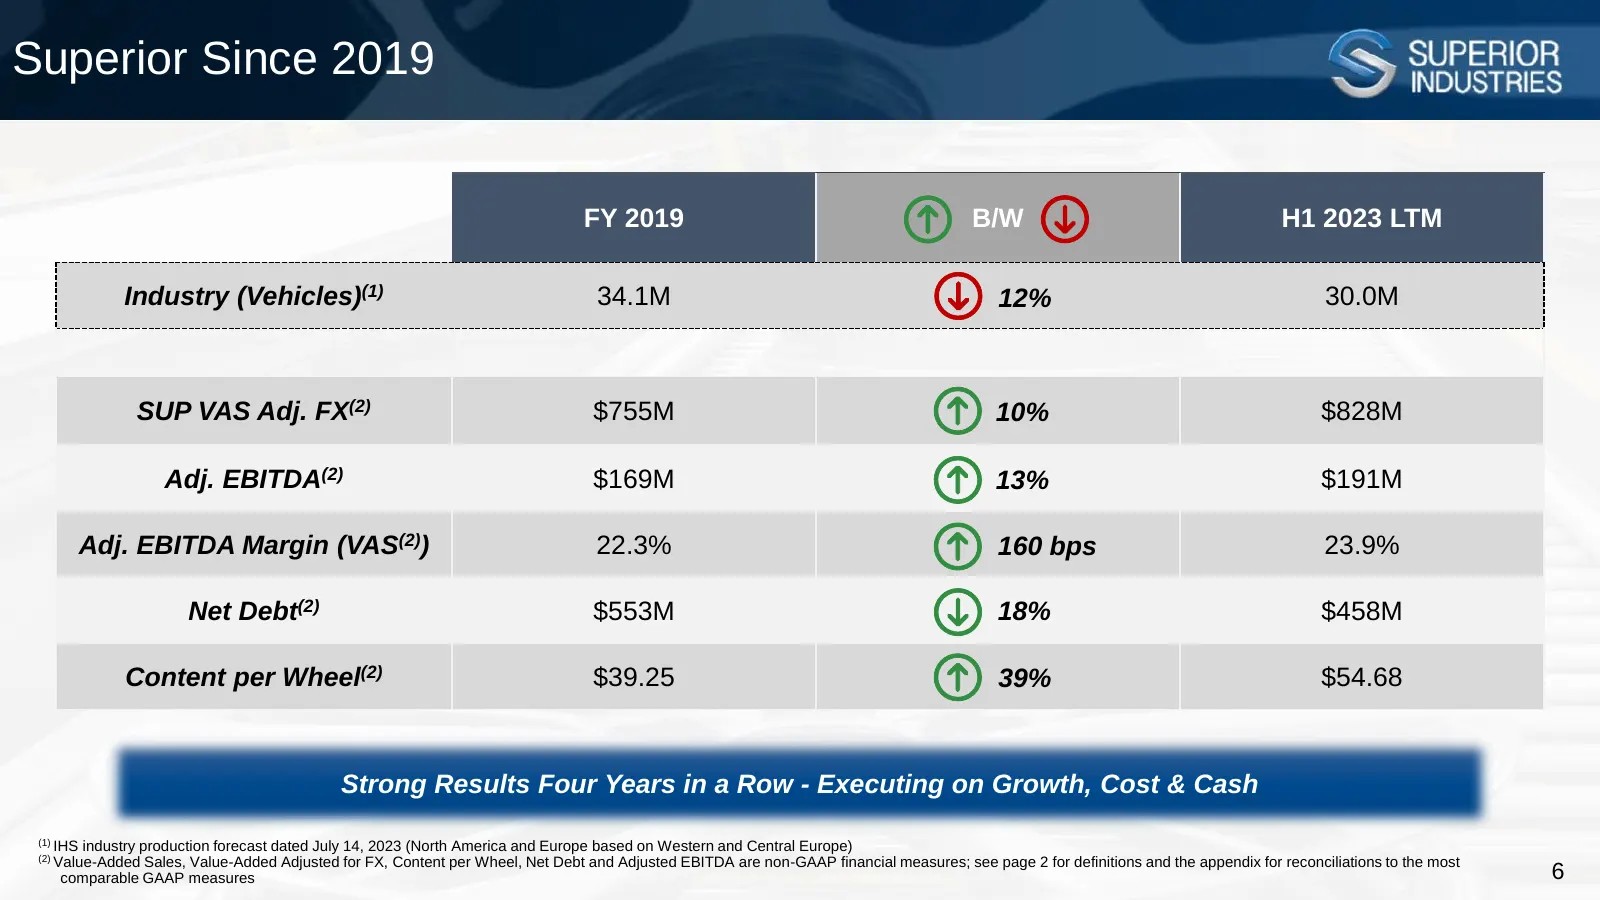
Superior Since 2019 FY 2019 B/W H1 2023 LTM Industry (Vehicles)(1) 34.1M 12% 30.0M SUP VAS Adj. FX(2) $755M 10% $828M Adj. EBITDA(2) $169M 13% $191M Adj. EBITDA Margin (VAS(2)) 22.3% 160 bps 23.9% Net Debt(2) $553M 18% $458M Content per Wheel(2) $39.25 39% $54.68 Strong Results Four Years in a Row -
Slide 7: Commercial Discipline: Aligning Pricing with Cost Reality
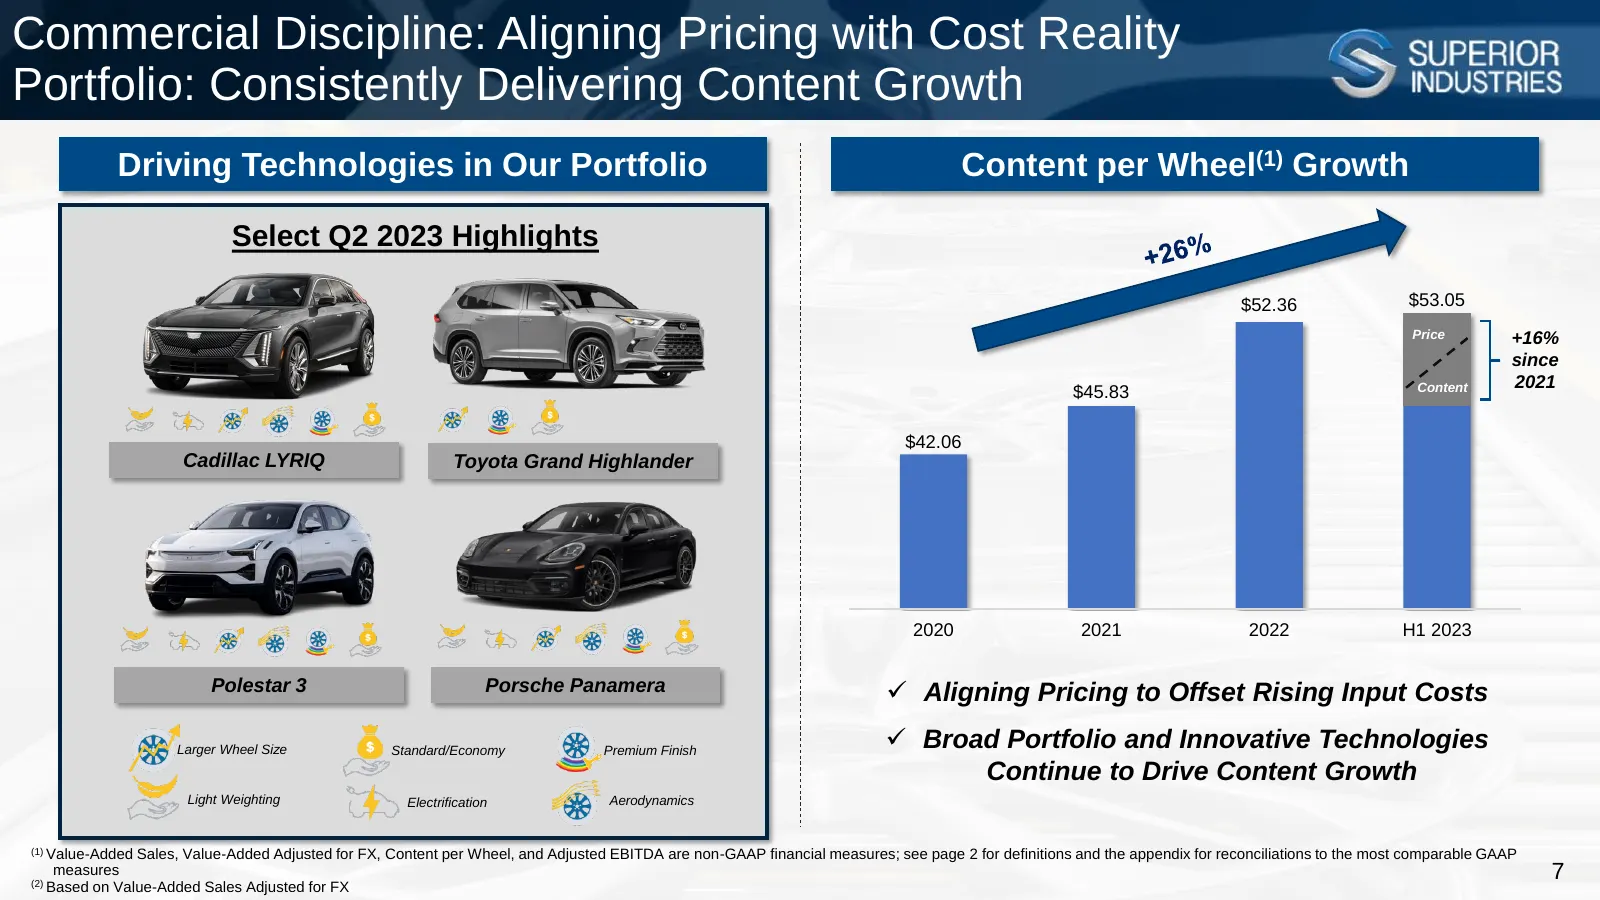
Commercial Discipline: Aligning Pricing with Cost Reality Portfolio: Consistently Delivering Content Growth Driving Technologies in Our Portfolio Content per Wheel(1) Growth Select Q2 2023 Highlights $52.36 $53.05 Price +16% since Content 2021 $45.83 $42.06 Cadillac LYRIQ Toyota Grand Highlander 202
Slide 8: Current Industry Operating Environment
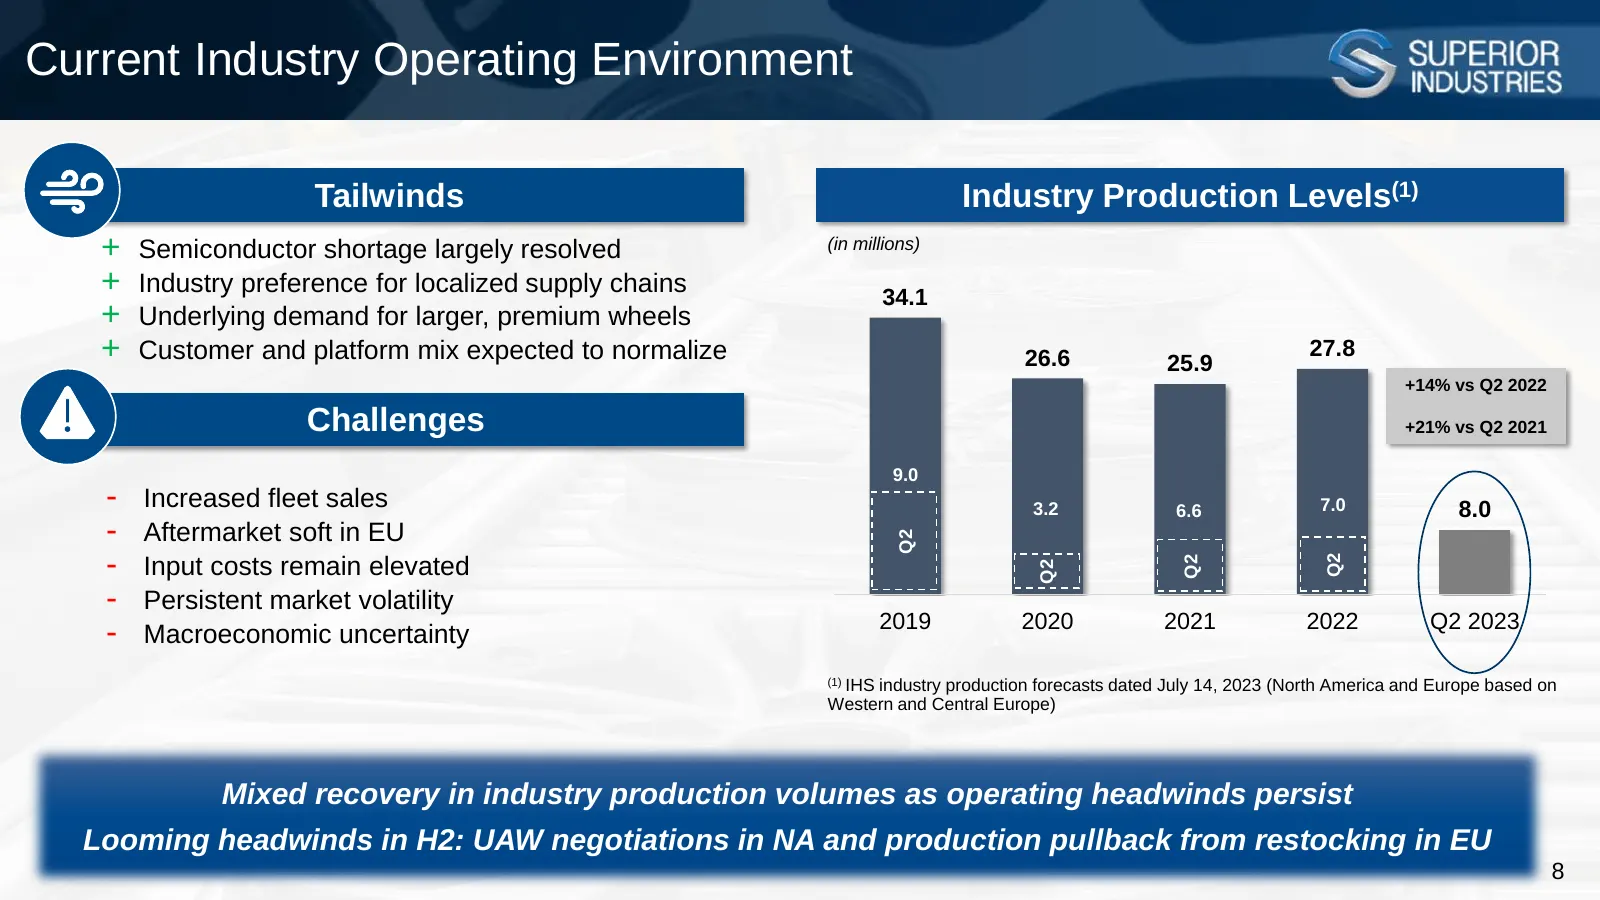
Current Industry Operating Environment Tailwinds Industry Production Levels(1) + Semiconductor shortage largely resolved (in millions) + Industry preference for localized supply chains 34.1 + Underlying demand for larger, premium wheels + Customer and platform mix expected to normalize 26.6 25.9 27.
Slide 9: Industry and Superior Growth
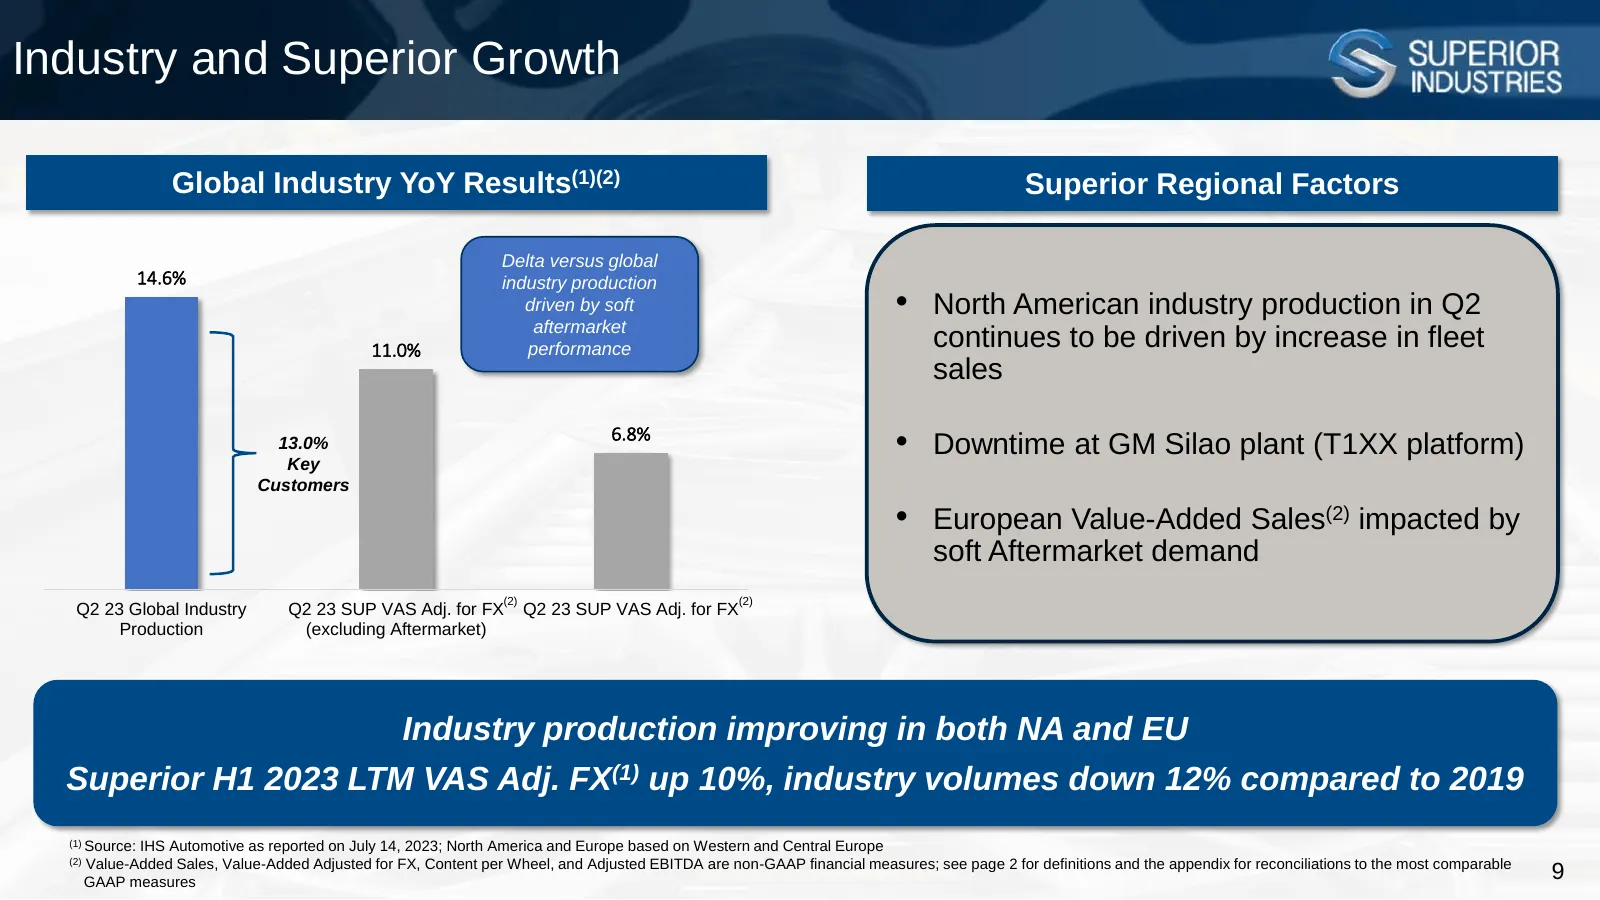
Industry and Superior Growth Global Industry YoY Results(1)(2) Superior Regional Factors Delta versus global 14.6% industry production driven by soft aftermarket • North American industry production in Q2 11.0% performance continues to be driven by increase in fleet sales 13.0% Key 6.8% • Downtime a
Slide 10: Europe Near-Term Margin Enhancement Initiatives
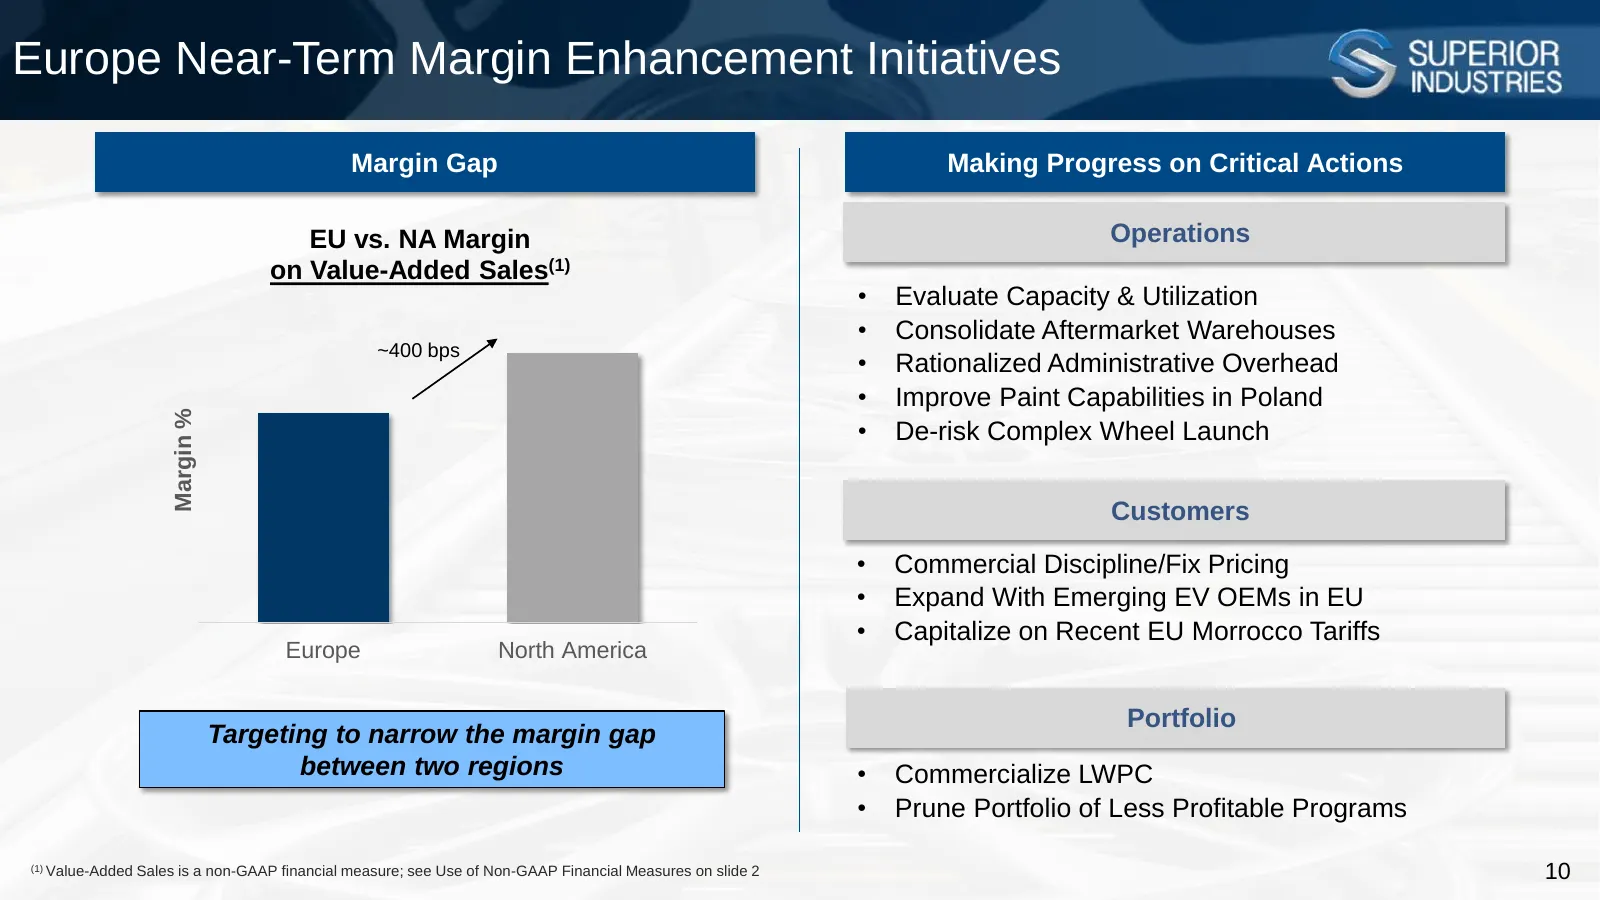
Europe Near-Term Margin Enhancement Initiatives Margin Gap Making Progress on Critical Actions EU vs. NA Margin Operations on Value-Added Sales(1) • Evaluate Capacity & Utilization • Consolidate Aftermarket Warehouses ~400 bps • Rationalized Administrative Overhead • Improve Paint Capabilities in Po
Slide 11: Financial Review
Financial Review S SLLERIOR
Slide 12: Second Quarter 2023 Financial Summary
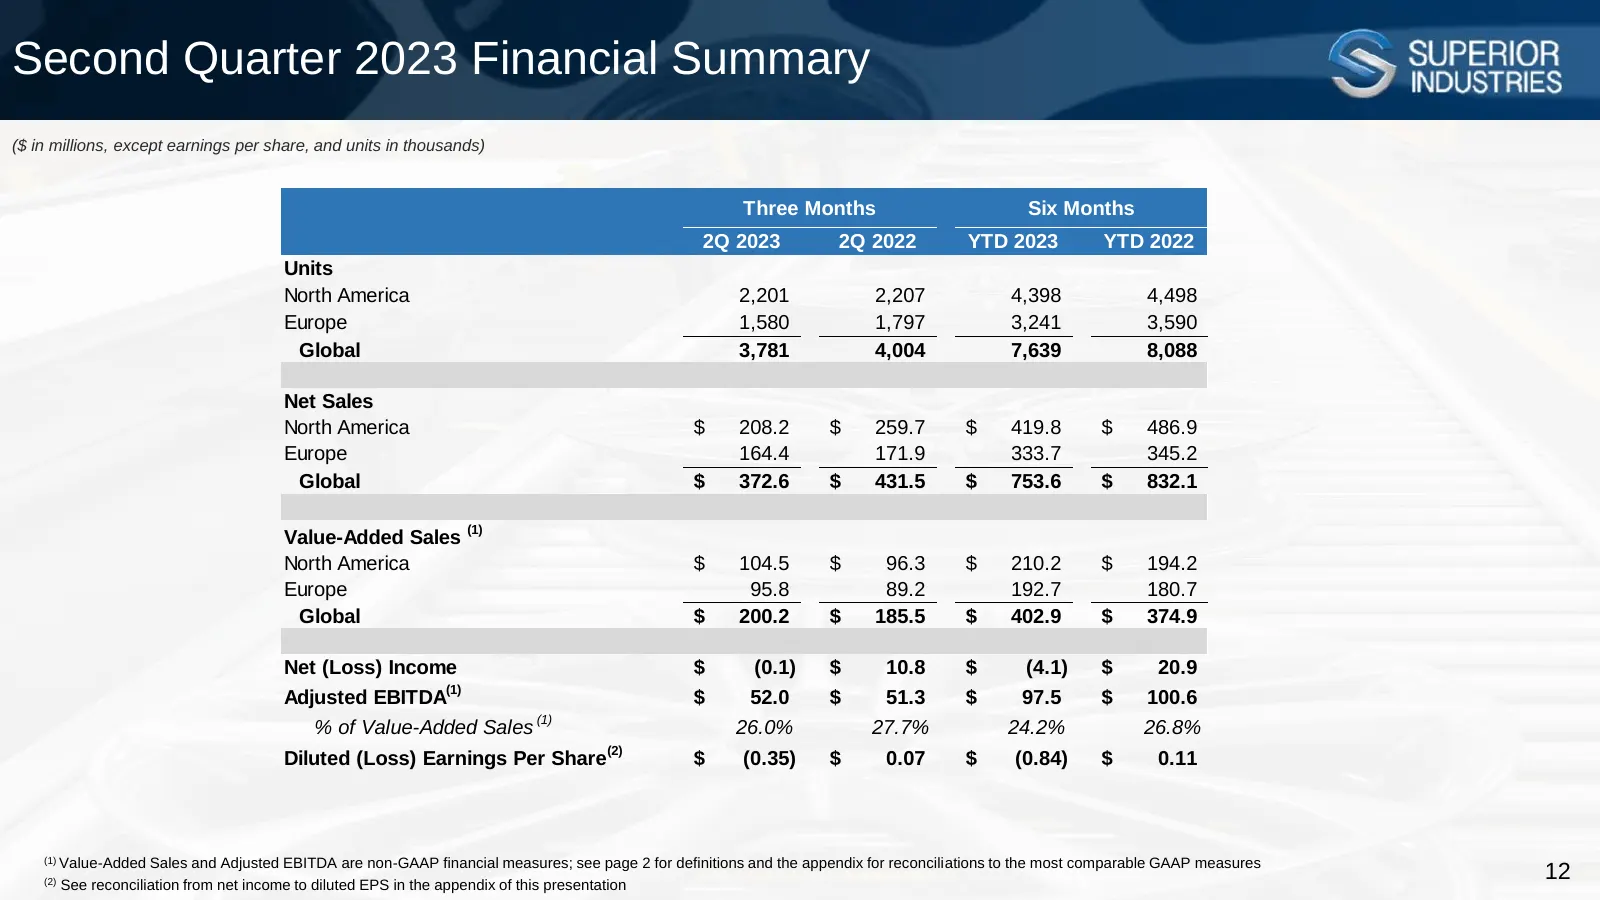
Second Quarter 2023 Financial Summary ($ in millions, except earnings per share, and units in thousands) Three Months Six Months 2Q 2023 2Q 2022 YTD 2023 YTD 2022 Units North America 2,201 2,207 4,398 4,498 Europe 1,580 1,797 3,241 3,590 Global 3,781 4,004 7,639 8,088 Net Sales North America $ 208.2
Slide 13: Second Quarter 2023 Year-over-Year Sales Bridge
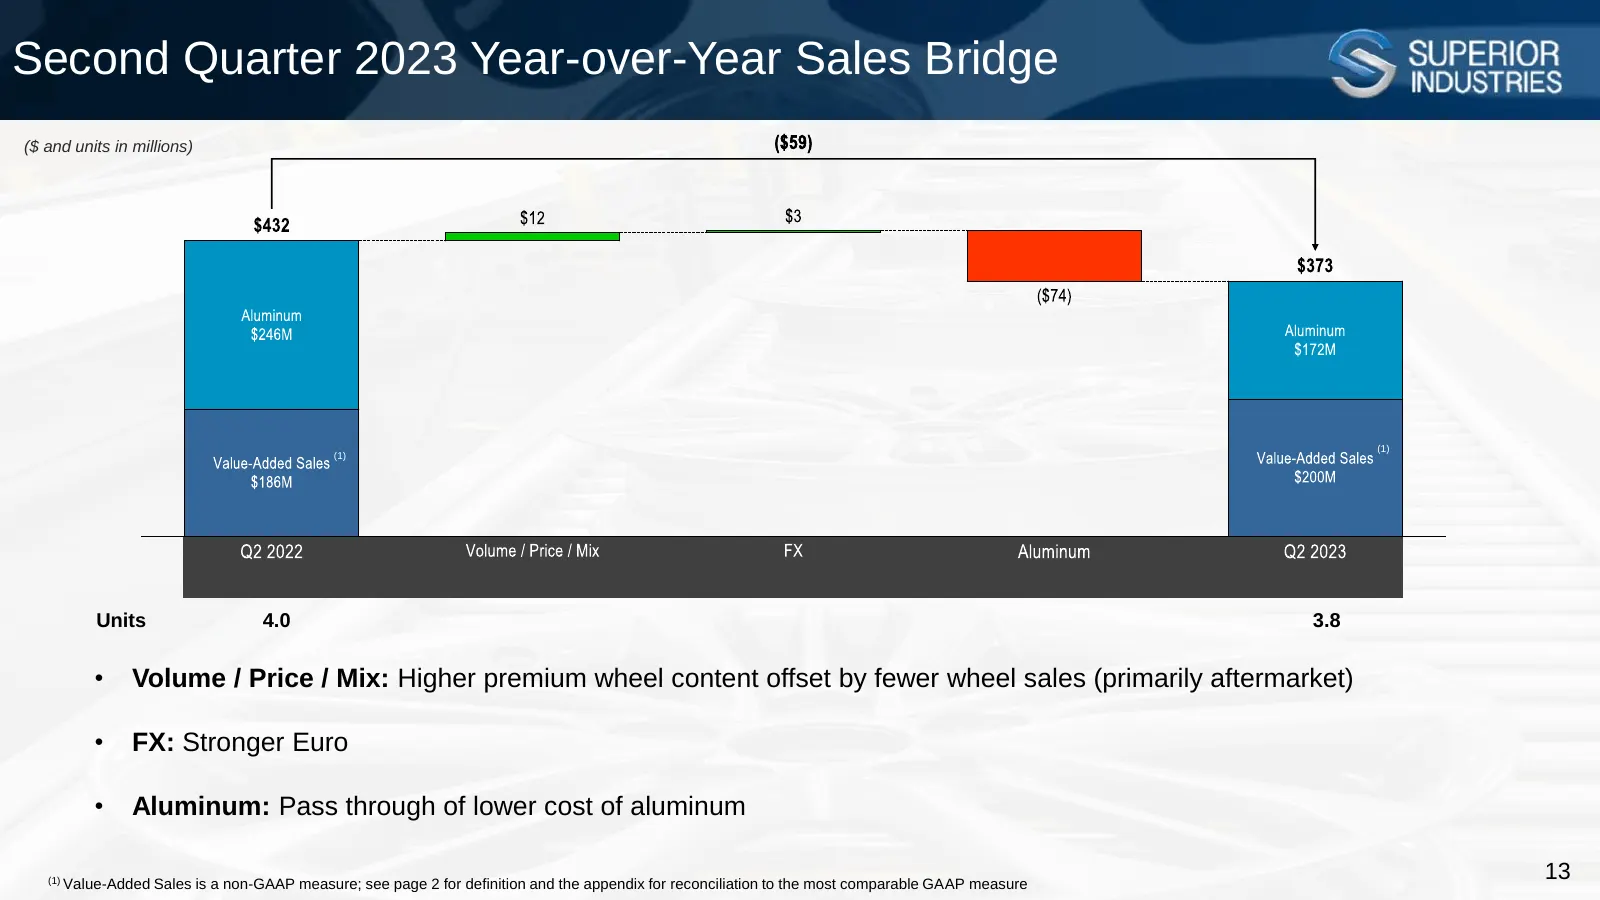
Second Quarter 2023 Year-over-Year Sales Bridge ($ and units in millions) (1) (1) Units 4.0 3.8 • Volume / Price / Mix: Higher premium wheel content offset by fewer wheel sales (primarily aftermarket) • FX: Stronger Euro • Aluminum: Pass through of lower cost of aluminum (1) Value-Added Sales is a n
Slide 14: Second Quarter 2023 Year-over-Year Adjusted EBITDA Bridge
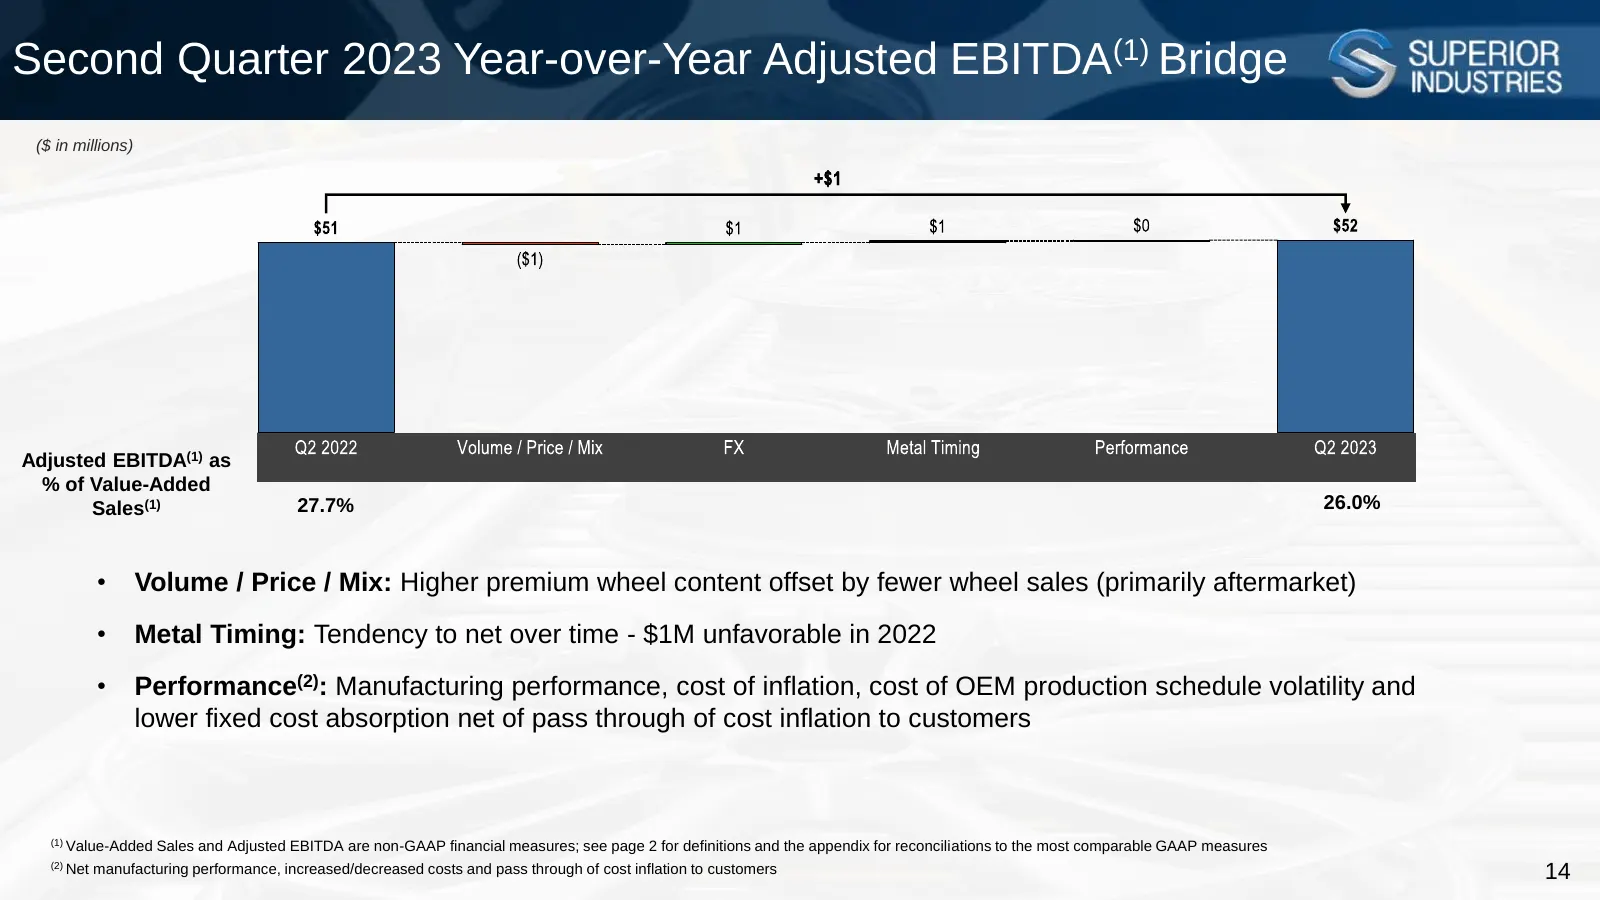
Second Quarter 2023 Year-over-Year Adjusted EBITDA(1) Bridge ($ in millions) Adjusted EBITDA(1) as % of Value-Added Sales(1) 27.7% 26.0% • Volume / Price / Mix: Higher premium wheel content offset by fewer wheel sales (primarily aftermarket) • Metal Timing: Tendency to net over time - $1M unfavorabl
Slide 15: Second Quarter 2023 Free Cash Flow
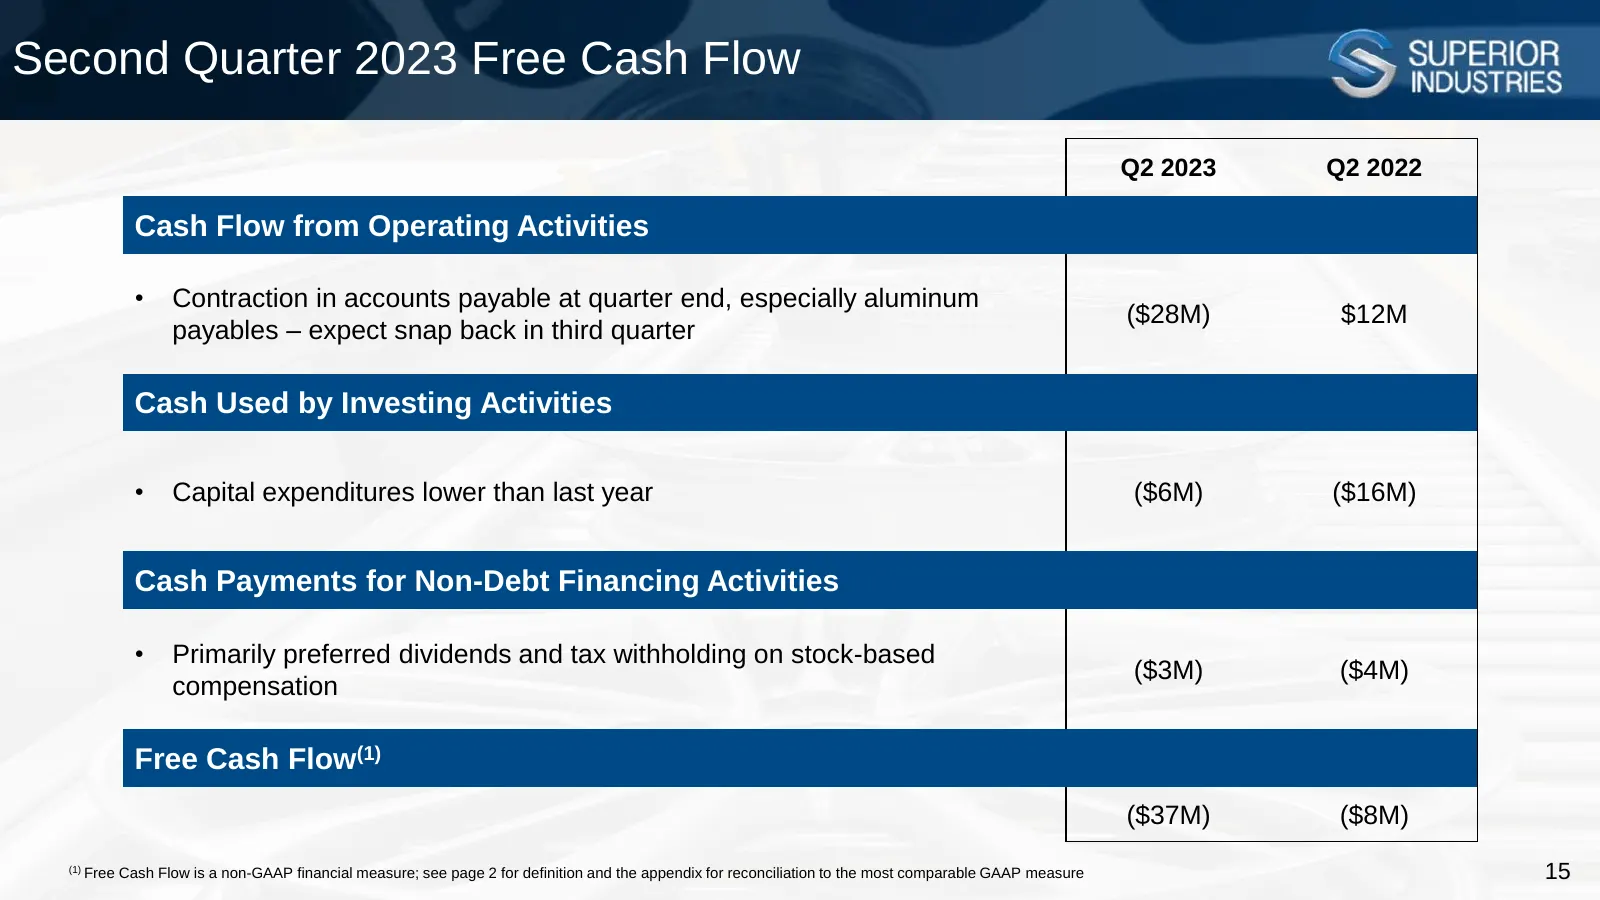
Second Quarter 2023 Free Cash Flow Q2 2023 Q2 2022 Cash Flow from Operating Activities • Contraction in accounts payable at quarter end, especially aluminum ($28M) $12M payables – expect snap back in third quarter Cash Used by Investing Activities • Capital expenditures lower than last year ($6M) ($
Slide 16: Capital Structure as of June 30, 2023
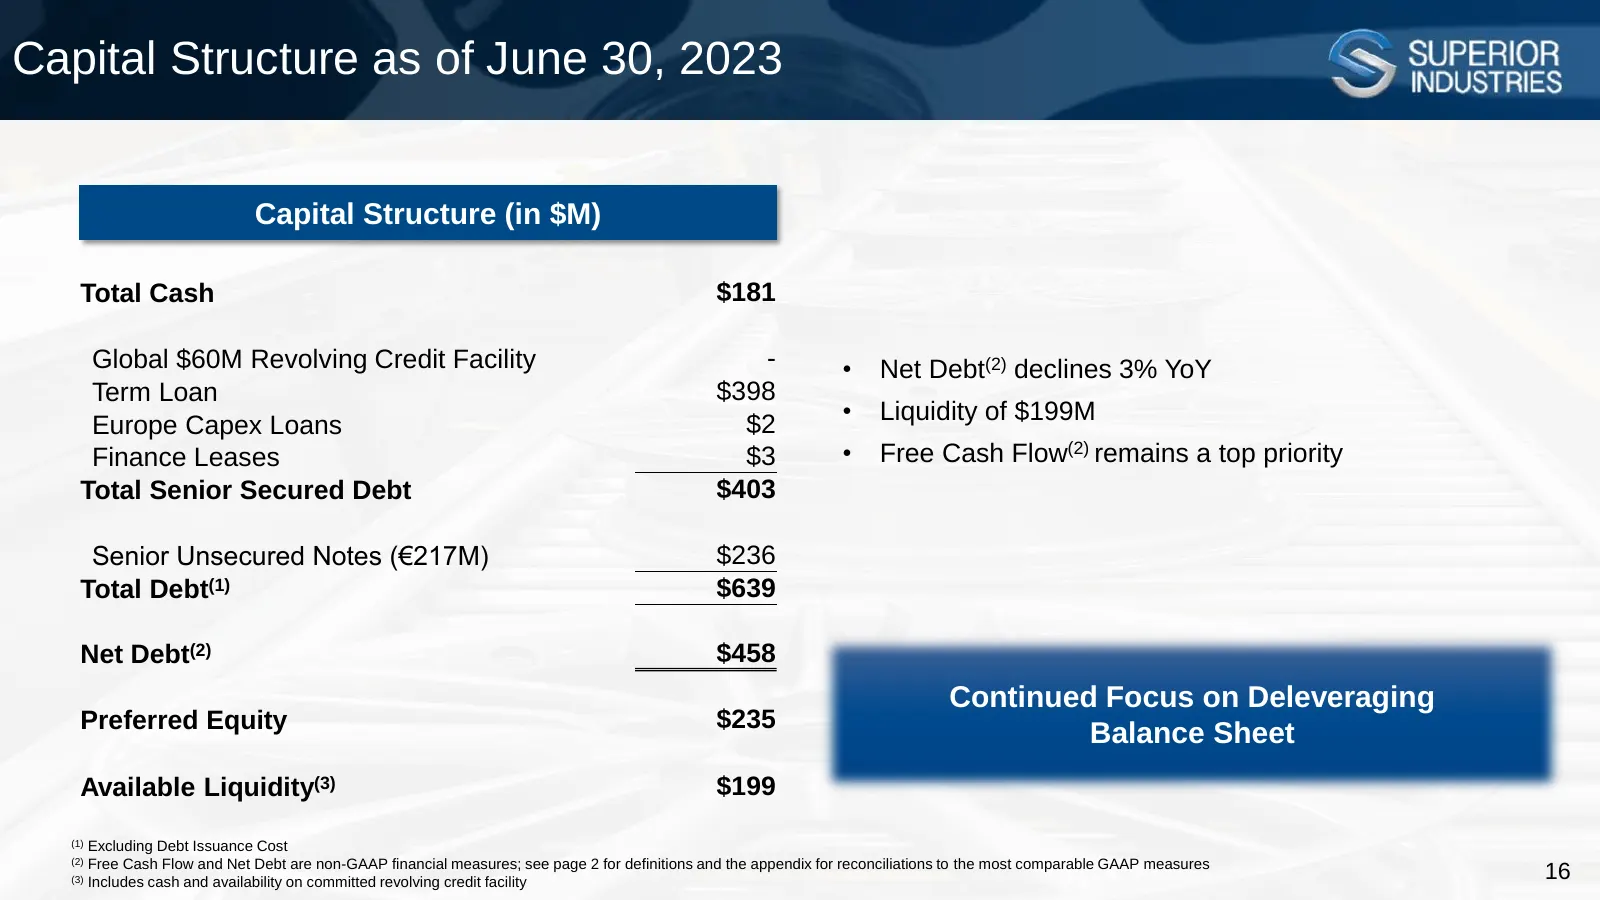
Capital Structure as of June 30, 2023 Capital Structure (in $M) Total Cash $181 Global $60M Revolving Credit Facility - • Net Debt(2) declines 3% YoY Term Loan $398 $2 • Liquidity of $199M Europe Capex Loans Finance Leases $3 • Free Cash Flow(2) remains a top priority Total Senior Secured Debt $403
Slide 17: Debt Maturity Profile as of June 30, 2023
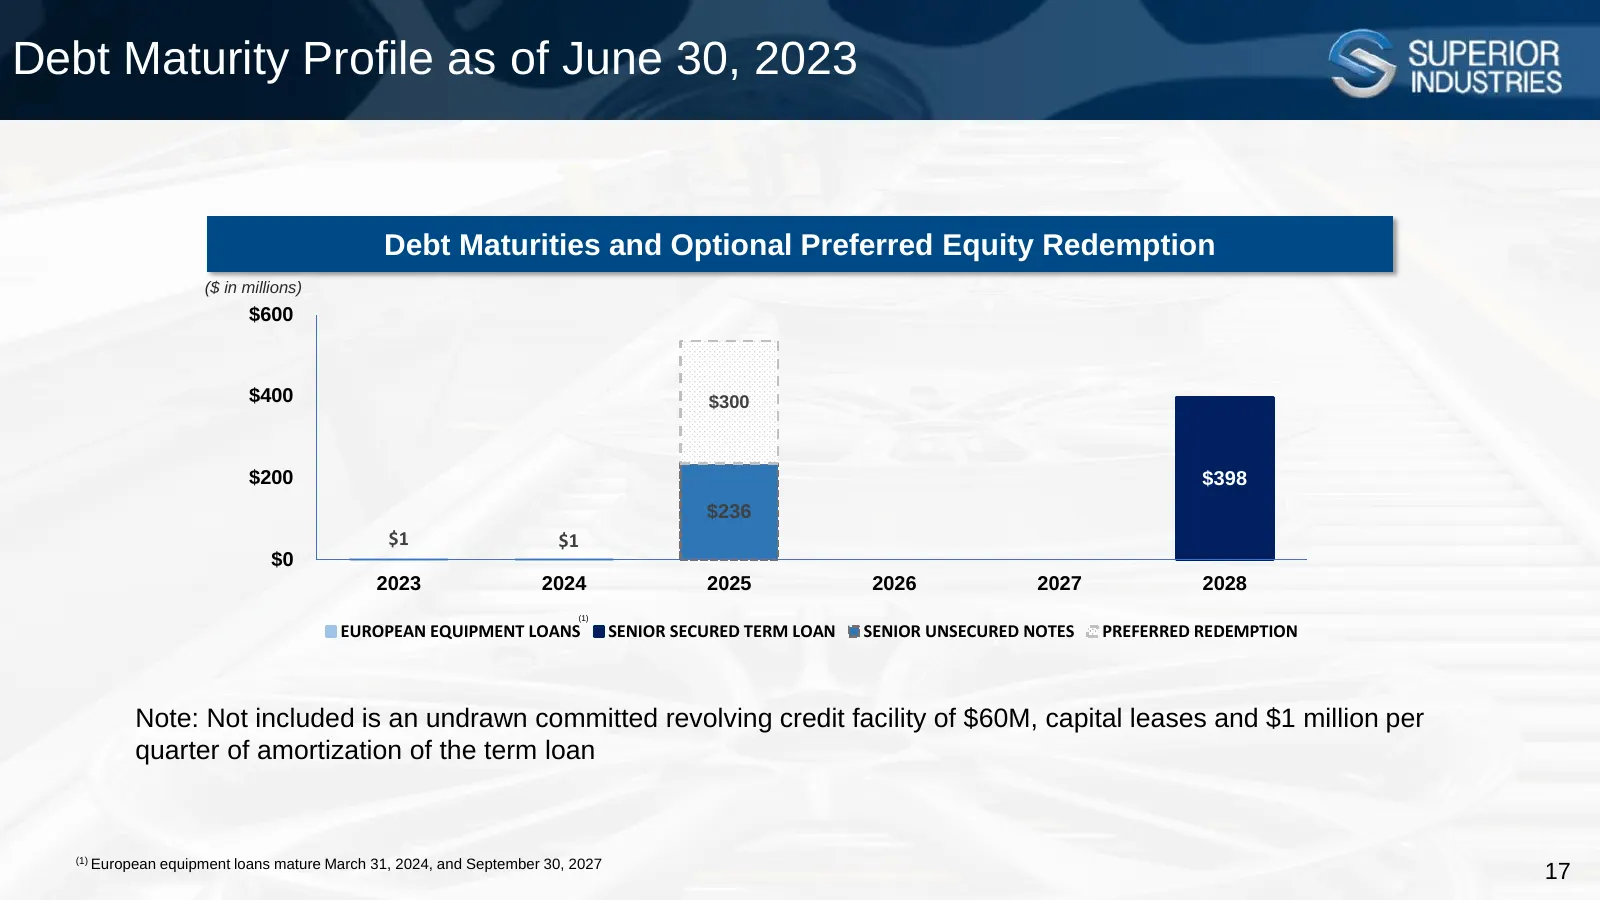
Debt Maturity Profile as of June 30, 2023 Debt Maturities and Optional Preferred Equity Redemption ($ in millions) $600 $400 $300 $200 $398 $236 $1 $1 $0 2023 2024 2025 2026 2027 2028 (1) EUROPEAN EQUIPMENT LOANS SENIOR SECURED TERM LOAN SENIOR UNSECURED NOTES PREFERRED REDEMPTION Note: Not included
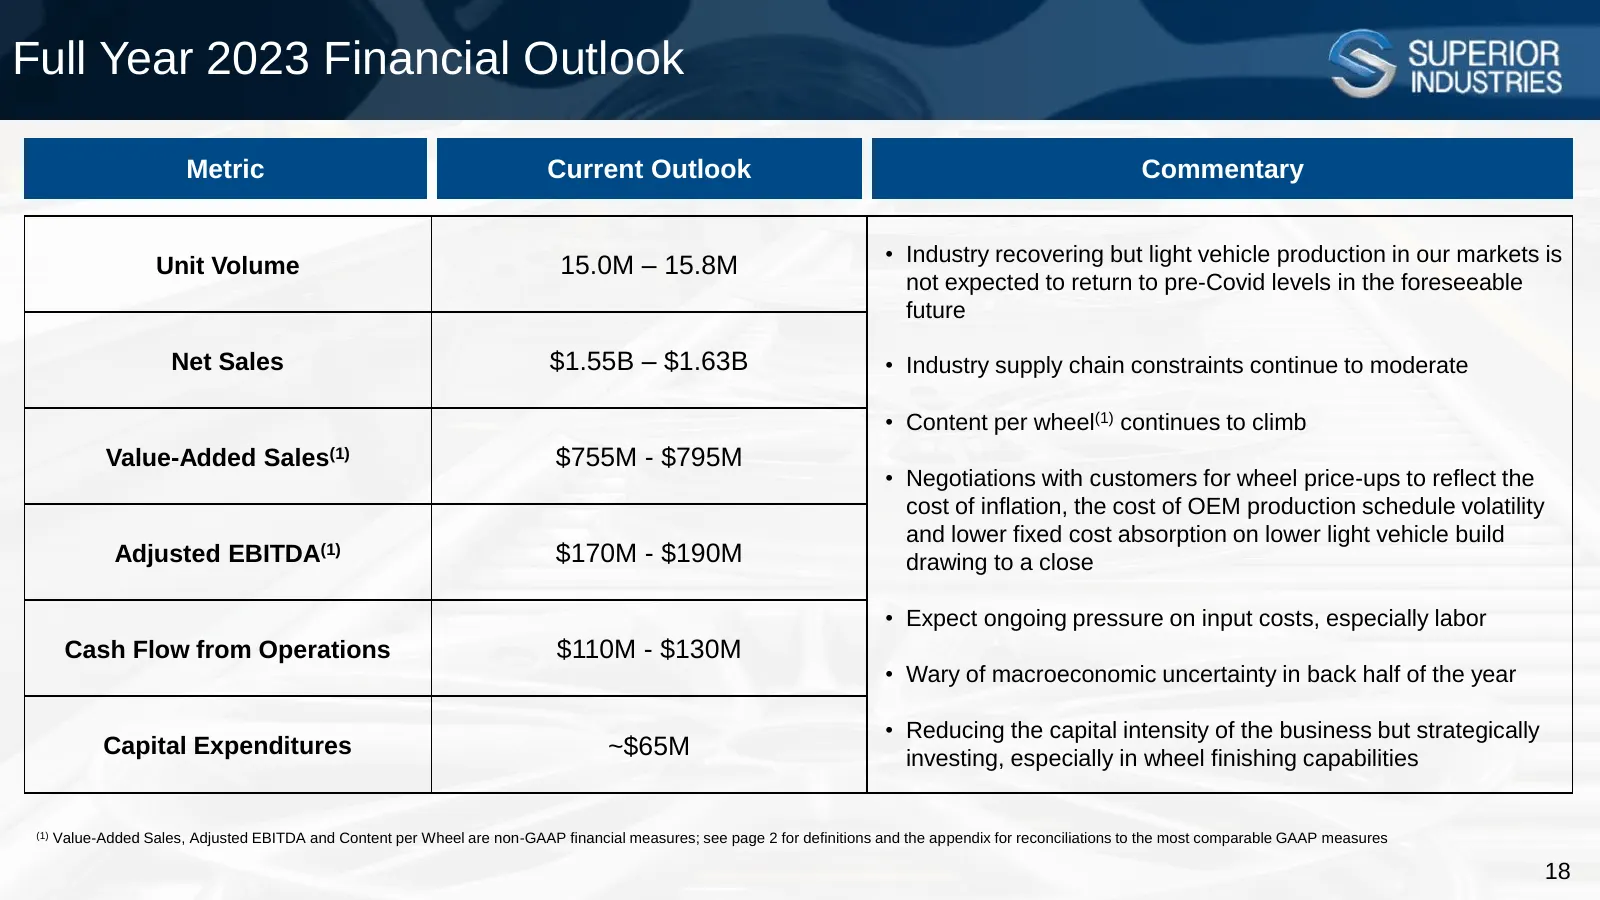
Slide 18: Full Year 2023 Financial Outlook
Full Year 2023 Financial Outlook Metric Current Outlook Commentary • Industry recovering but light vehicle production in our markets is Unit Volume 15.0M – 15.8M not expected to return to pre-Covid levels in the foreseeable future Net Sales $1.55B – $1.63B • Industry supply chain constraints continu

Slide 19: Appendix
Appendix S SLLERIOR
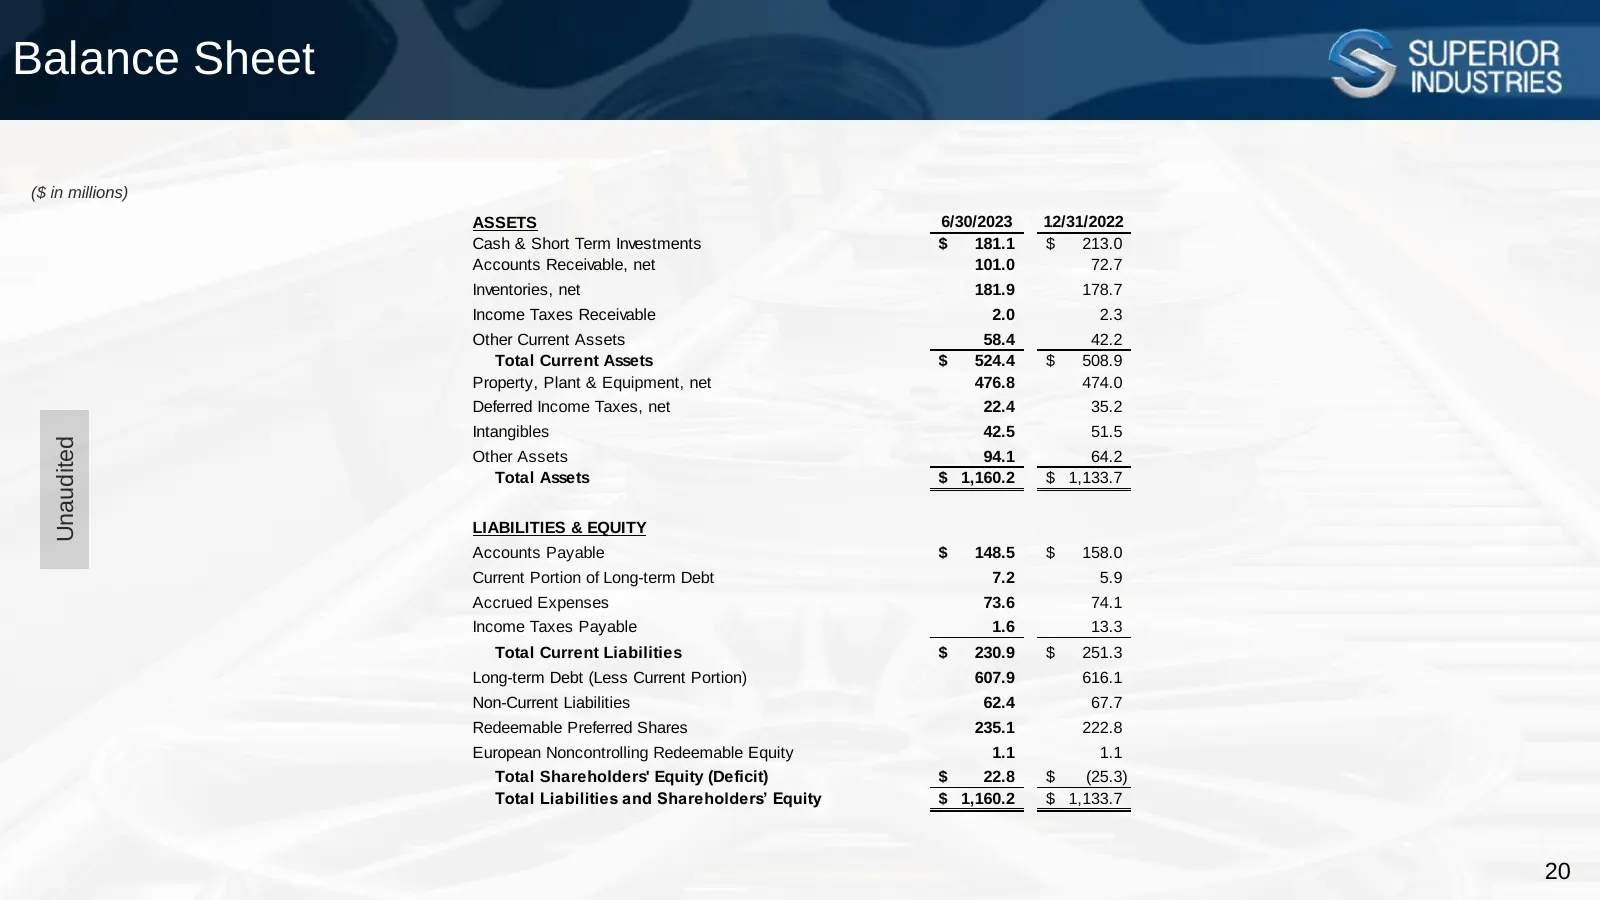
Slide 20: Balance Sheet
Balance Sheet ($ in millions) ASSETS 6/30/2023 12/31/2022 Cash & Short Term Investments $ 181.1 $ 213.0 Accounts Receivable, net 101.0 72.7 Inventories, net 181.9 178.7 Income Taxes Receivable 2.0 2.3 Other Current Assets 58.4 42.2 Total Current Assets $ 524.4 $ 508.9 Property, Plant & Equipment, ne
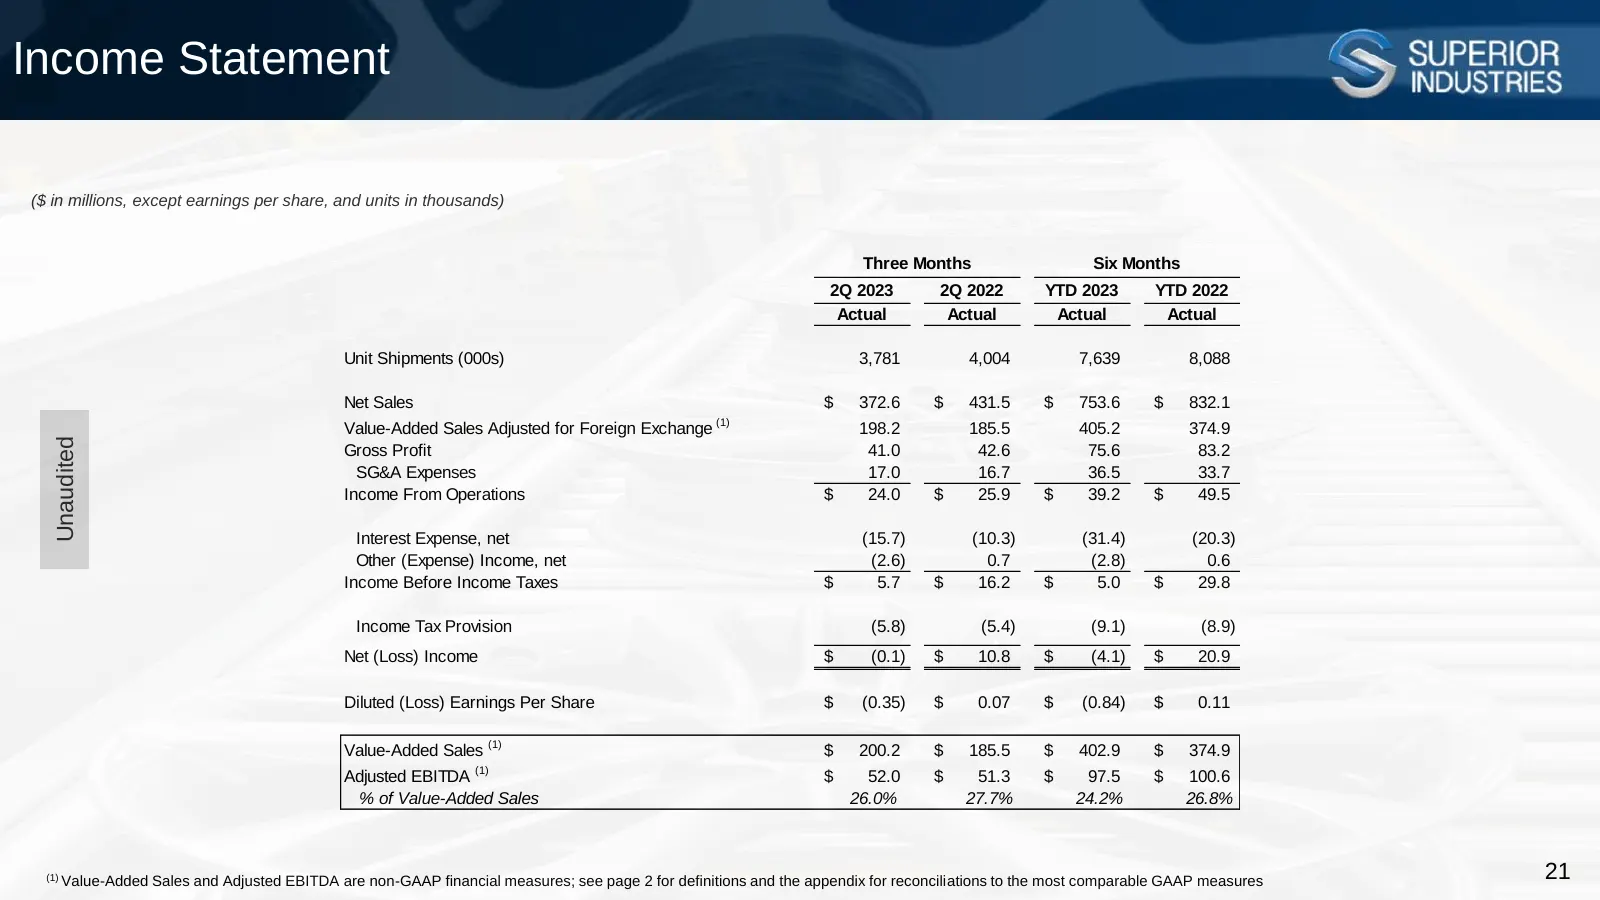
Slide 21: Income Statement
Income Statement ($ in millions, except earnings per share, and units in thousands) Three Months Six Months 2Q 2023 2Q 2022 YTD 2023 YTD 2022 Actual Actual Actual Actual Unit Shipments (000s) 3,781 4,004 7,639 8,088 Net Sales $ 372.6 $ 431.5 $ 753.6 $ 832.1 (1) Value-Added Sales Adjusted for Foreign
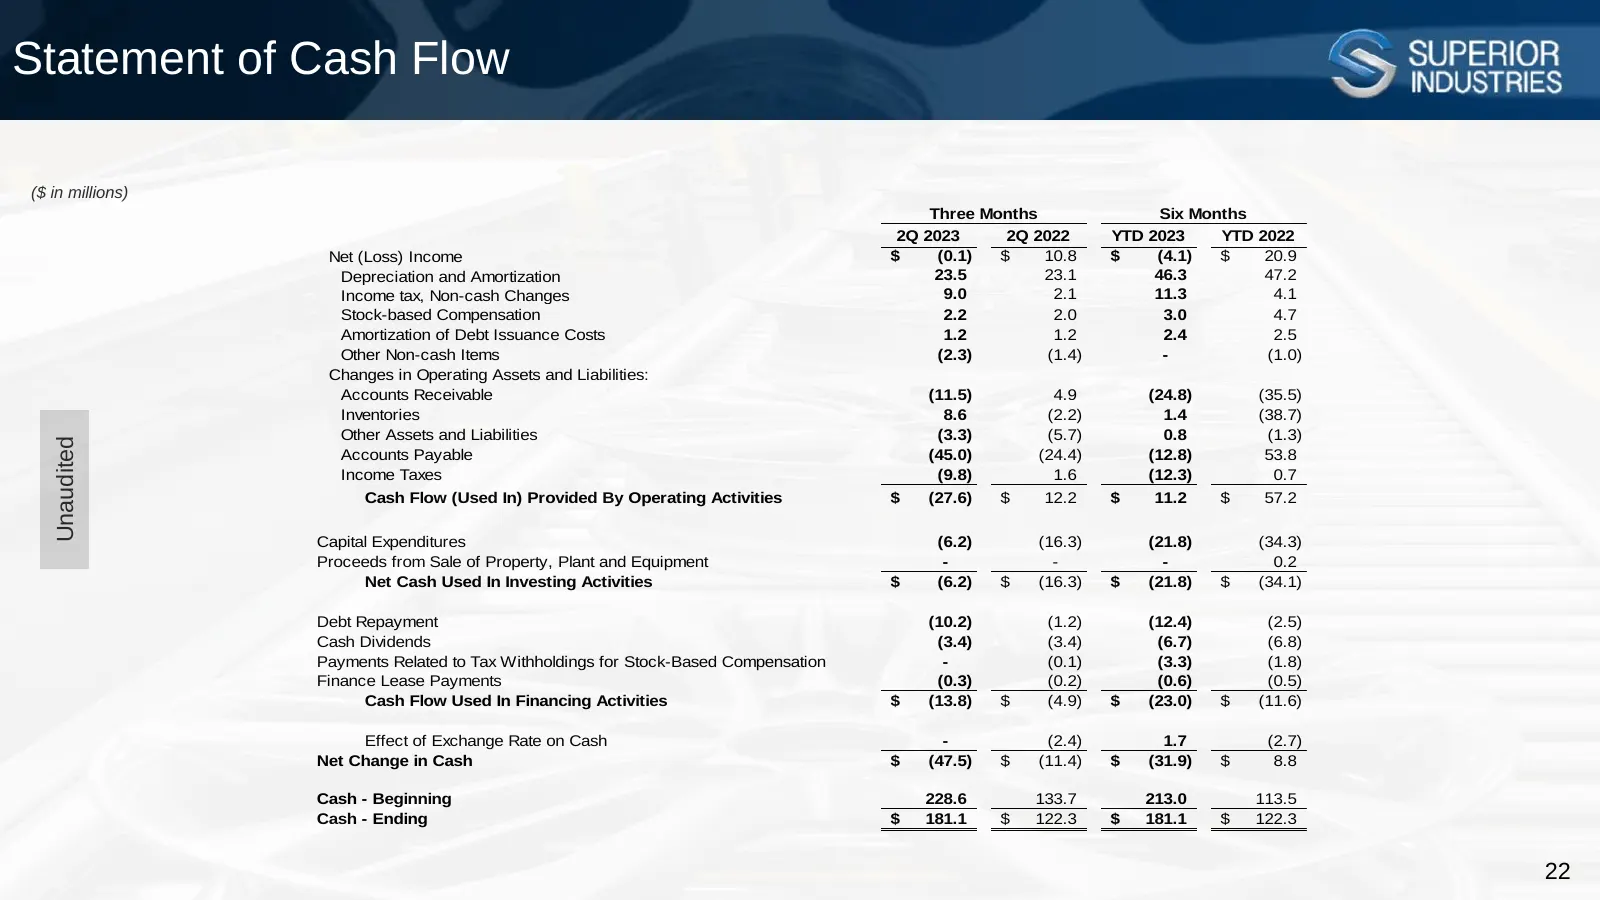
Slide 22: Statement of Cash Flow
Statement of Cash Flow ($ in millions) Three Months Six Months 2Q 2023 2Q 2022 YTD 2023 YTD 2022 Net (Loss) Income $ (0.1) $ 10.8 $ (4.1) $ 20.9 Depreciation and Amortization 23.5 23.1 46.3 47.2 Income tax, Non-cash Changes 9.0 2.1 11.3 4.1 Stock-based Compensation 2.2 2.0 3.0 4.7 Amortization of De
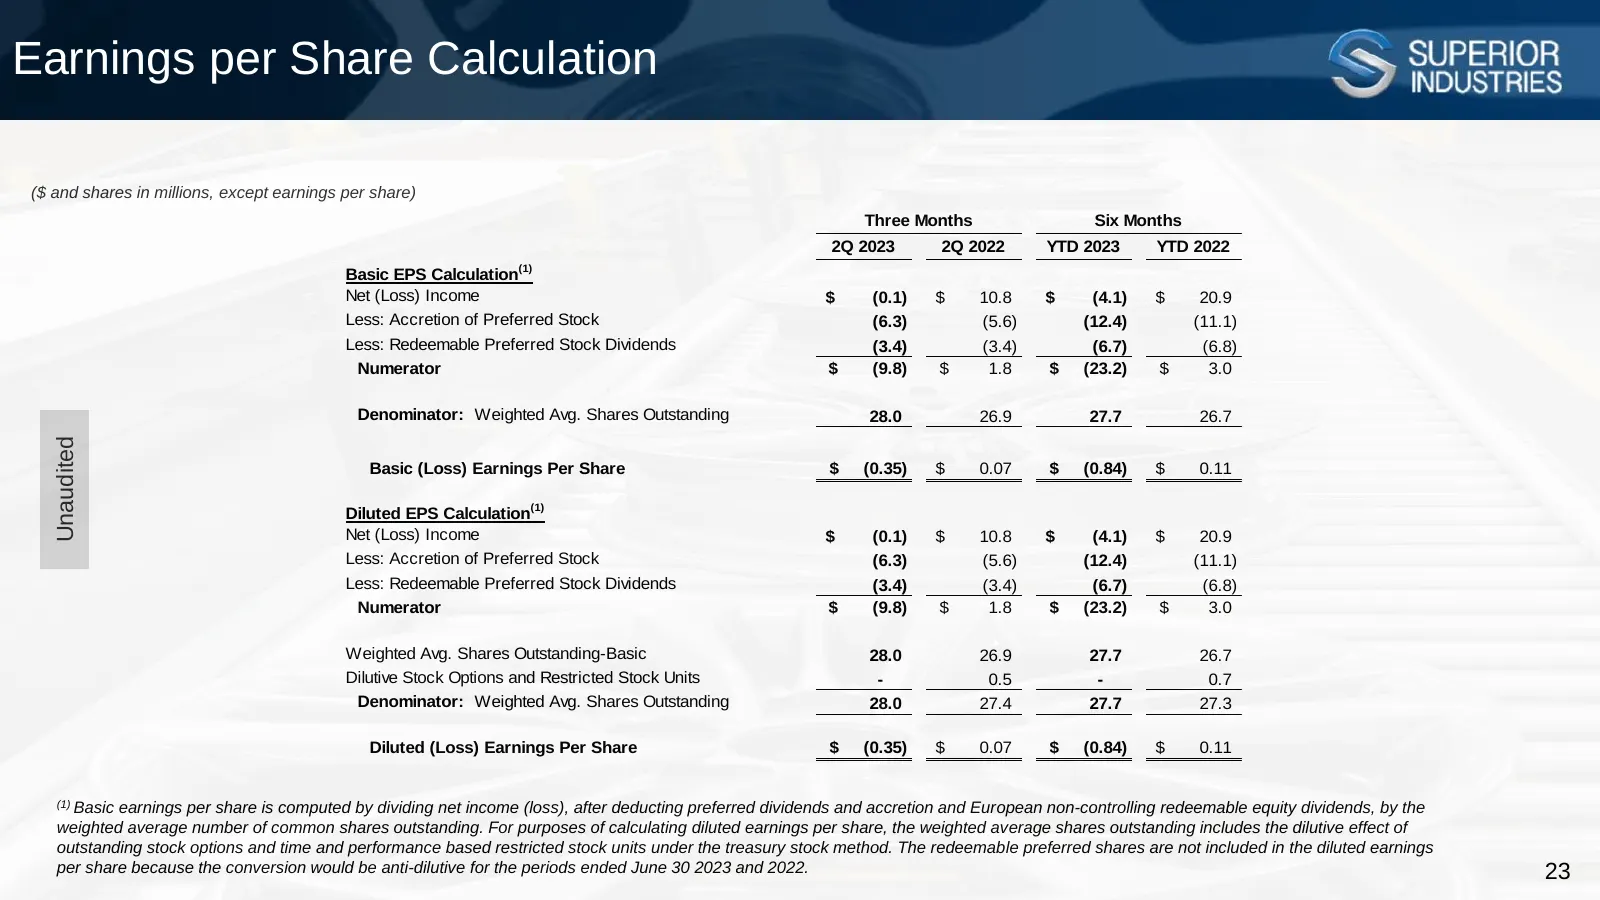
Slide 23: Earnings per Share Calculation
Earnings per Share Calculation ($ and shares in millions, except earnings per share) Three Months Six Months 2Q 2023 2Q 2022 YTD 2023 YTD 2022 (1) Basic EPS Calculation Net (Loss) Income $ (0.1) $ 10.8 $ (4.1) $ 20.9 Less: Accretion of Preferred Stock (6.3) (5.6) (12.4) (11.1) Less: Redeemable Prefe
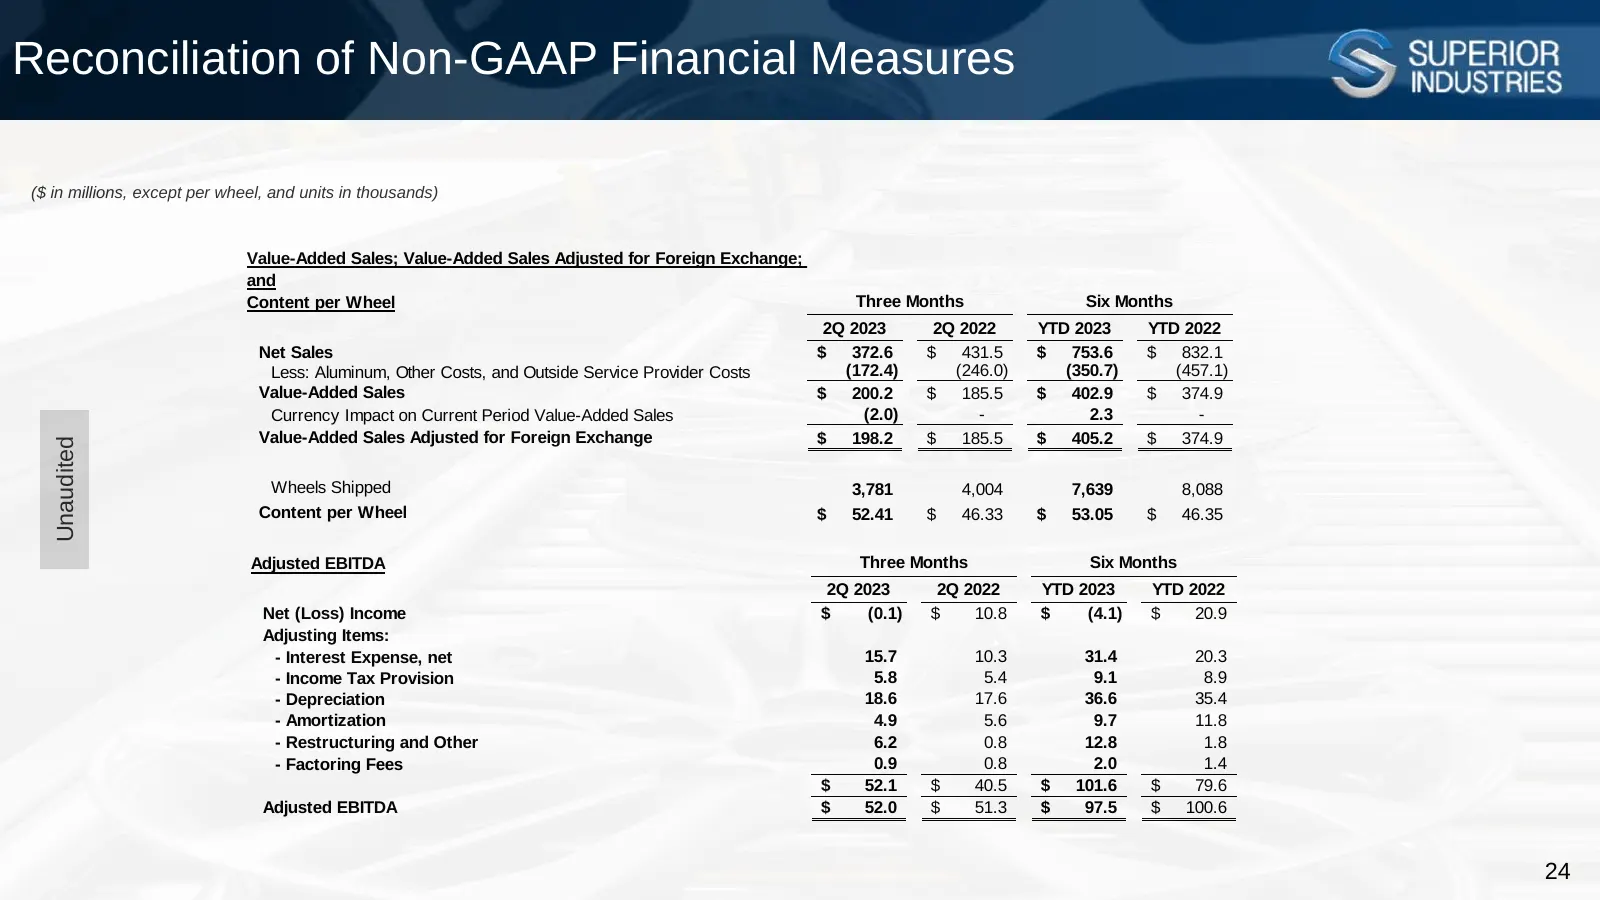
Slide 24: Reconciliation of Non-GAAP Financial Measures
Reconciliation of Non-GAAP Financial Measures ($ in millions, except per wheel, and units in thousands) Value-Added Sales; Value-Added Sales Adjusted for Foreign Exchange; and Content per Wheel Three Months Six Months 2Q 2023 2Q 2022 YTD 2023 YTD 2022 Net Sales $ 372.6 $ 431.5 $ 753.6 $ 832.1 Less:
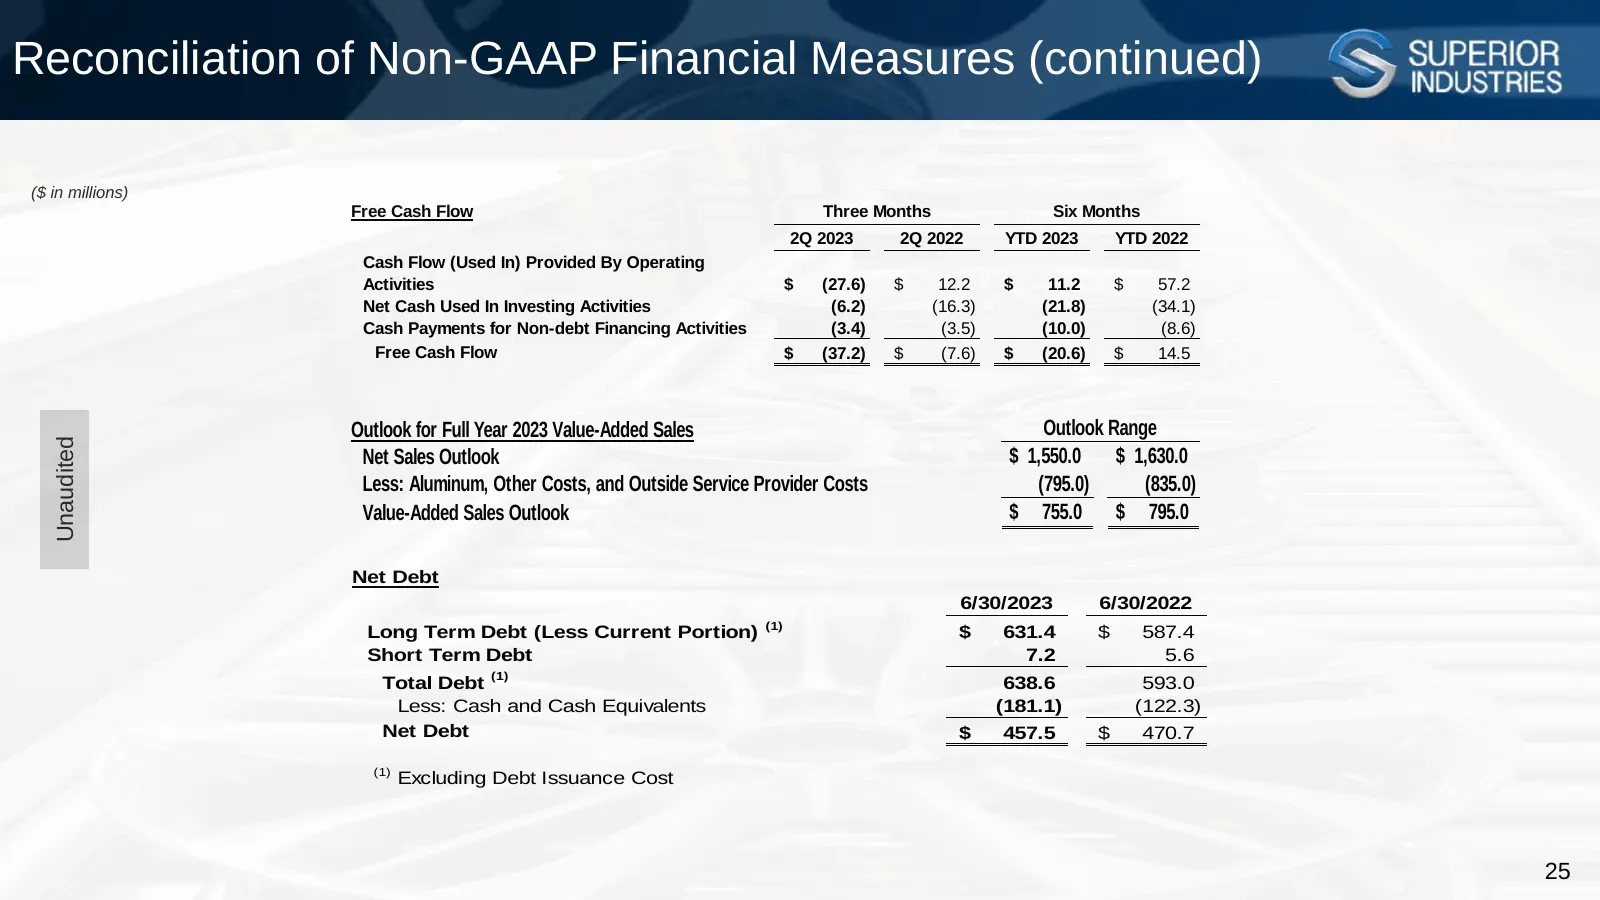
Slide 25: Reconciliation of Non-GAAP Financial Measures (continued)
Reconciliation of Non-GAAP Financial Measures (continued) ($ in millions) Free Cash Flow Three Months Six Months 2Q 2023 2Q 2022 YTD 2023 YTD 2022 Cash Flow (Used In) Provided By Operating Activities $ (27.6) $ 12.2 $ 11.2 $ 57.2 Net Cash Used In Investing Activities (6.2) (16.3) (21.8) (34.1) Cash
Source: EarningsCall slides
More decks from Superior Industries International
 Q1 2025 Earnings Presentation22 slides · May 12, 2025
 FY2024 Earnings Presentation28 slides · Mar 6, 2025
 Q3 2024 Earnings Presentation23 slides · Nov 7, 2024
 Q2 2024 Earnings Presentation26 slides · Aug 8, 2024
 Q1 2024 Earnings Presentation28 slides · May 2, 2024
 FY2023 Earnings Presentation35 slides · Mar 7, 2024