Select Bancorp — New Century Bancorp — Investor Presentation (April 2008)
18 slides from Select Bancorp's investor presentation, Apr 14, 2008
Slide 1: Presentation to Howe Barnes Hoefer & Arnett, Inc.
Exhibit 99.1 Presentation to: Howe Barnes Hoefer & Arnett, Inc. April 14, 2008
Slide 2: Forward Looking Statements
Forward Looking Statements This presentation may contain forward-looking statements. These statements are not historical facts, but rather are based on our current expectations, estimates and projections about our industry, our beliefs and assumptions. Words including “may,” “will,” “could,” “would,
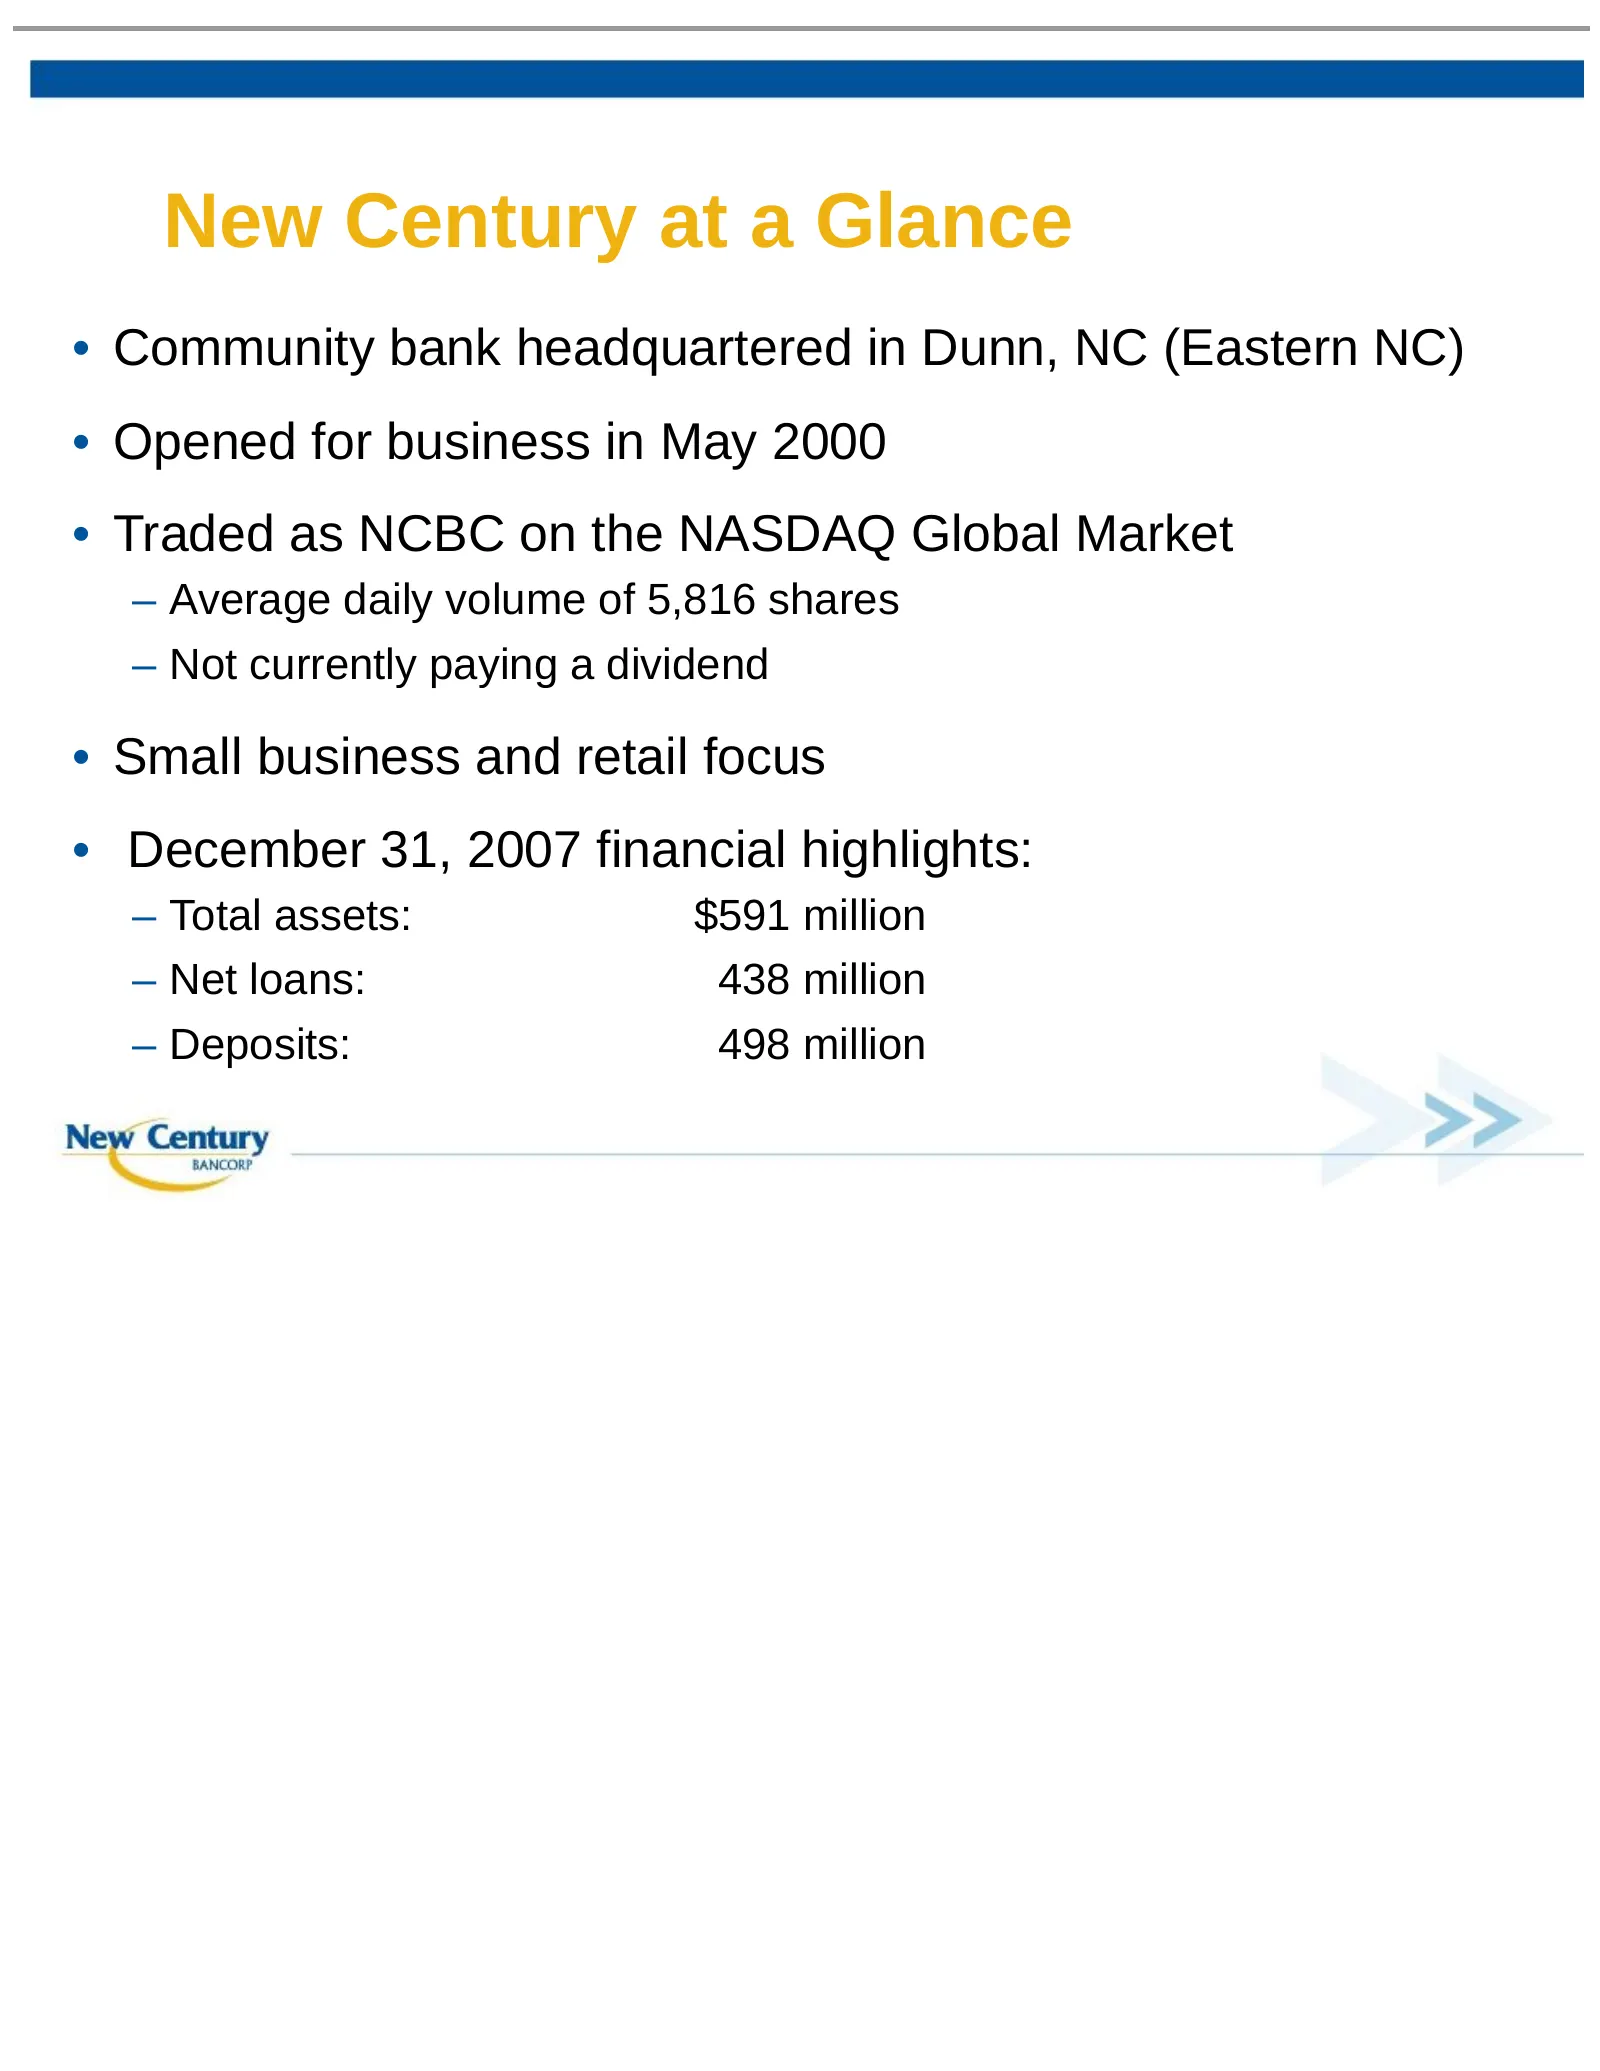
Slide 3: New Century at a Glance
New Century at a Glance • Community bank headquartered in Dunn, NC (Eastern NC) • Opened for business in May 2000 • Traded as NCBC on the NASDAQ Global Market – Average daily volume of 5,816 shares – Not currently paying a dividend • Small business and retail focus • December 31, 2007 financial high
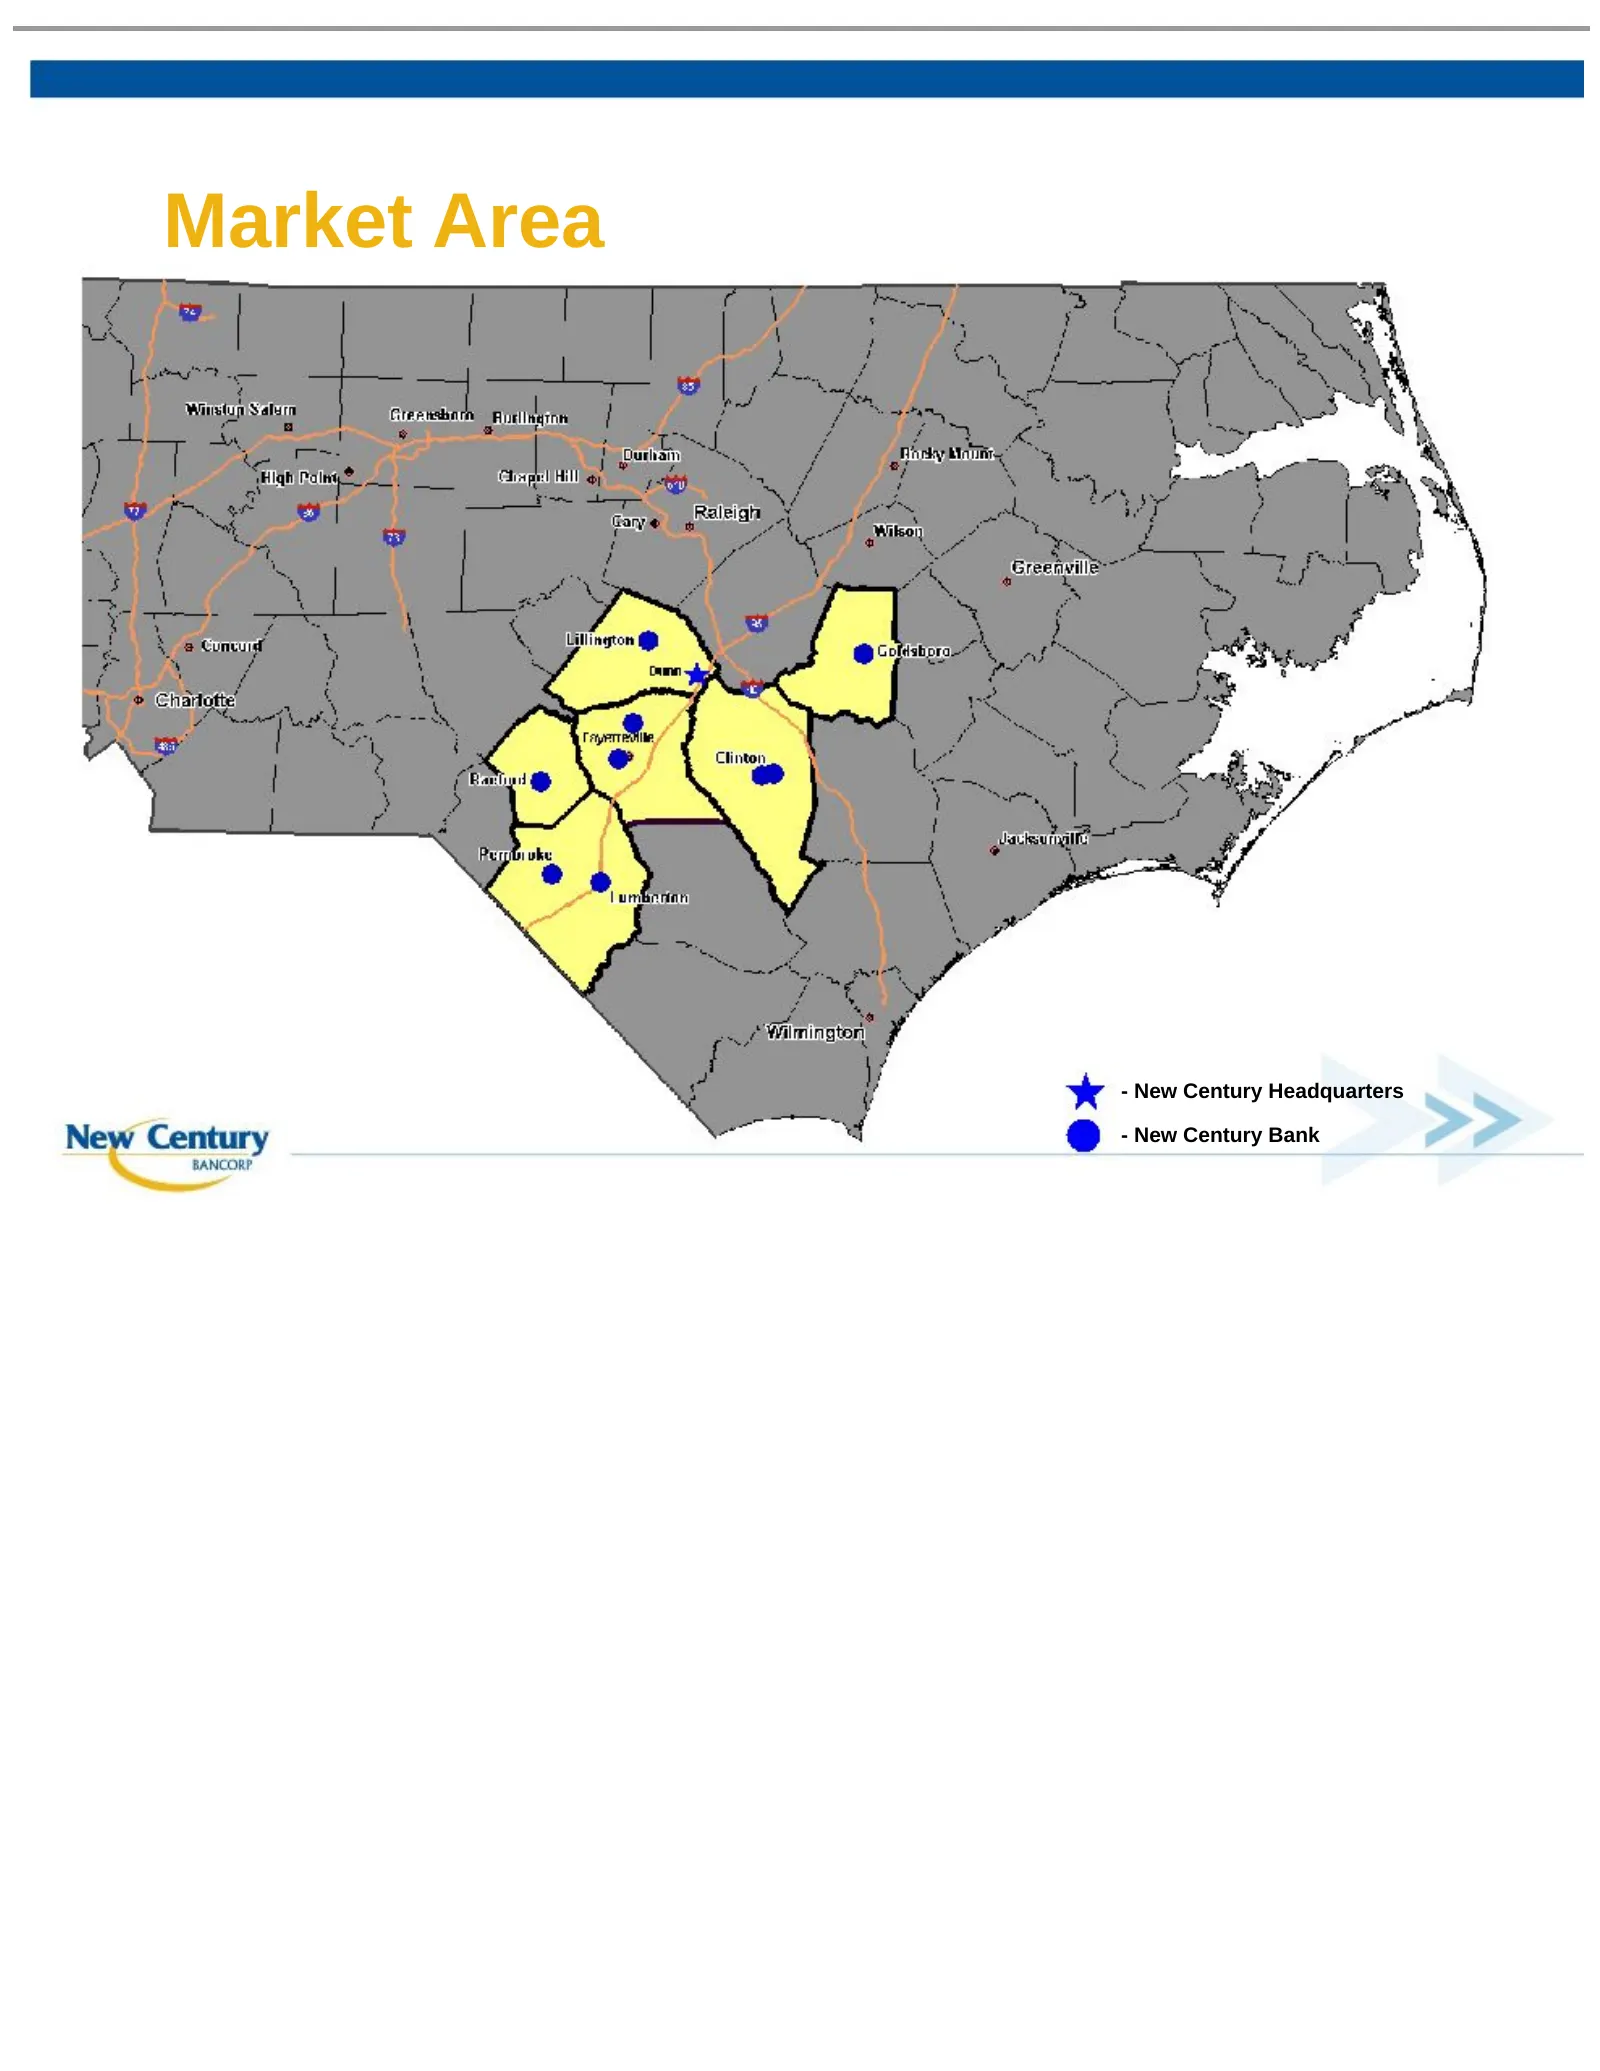
Slide 4: Market Area
Market Area - New Century Headquarters - New Century Bank
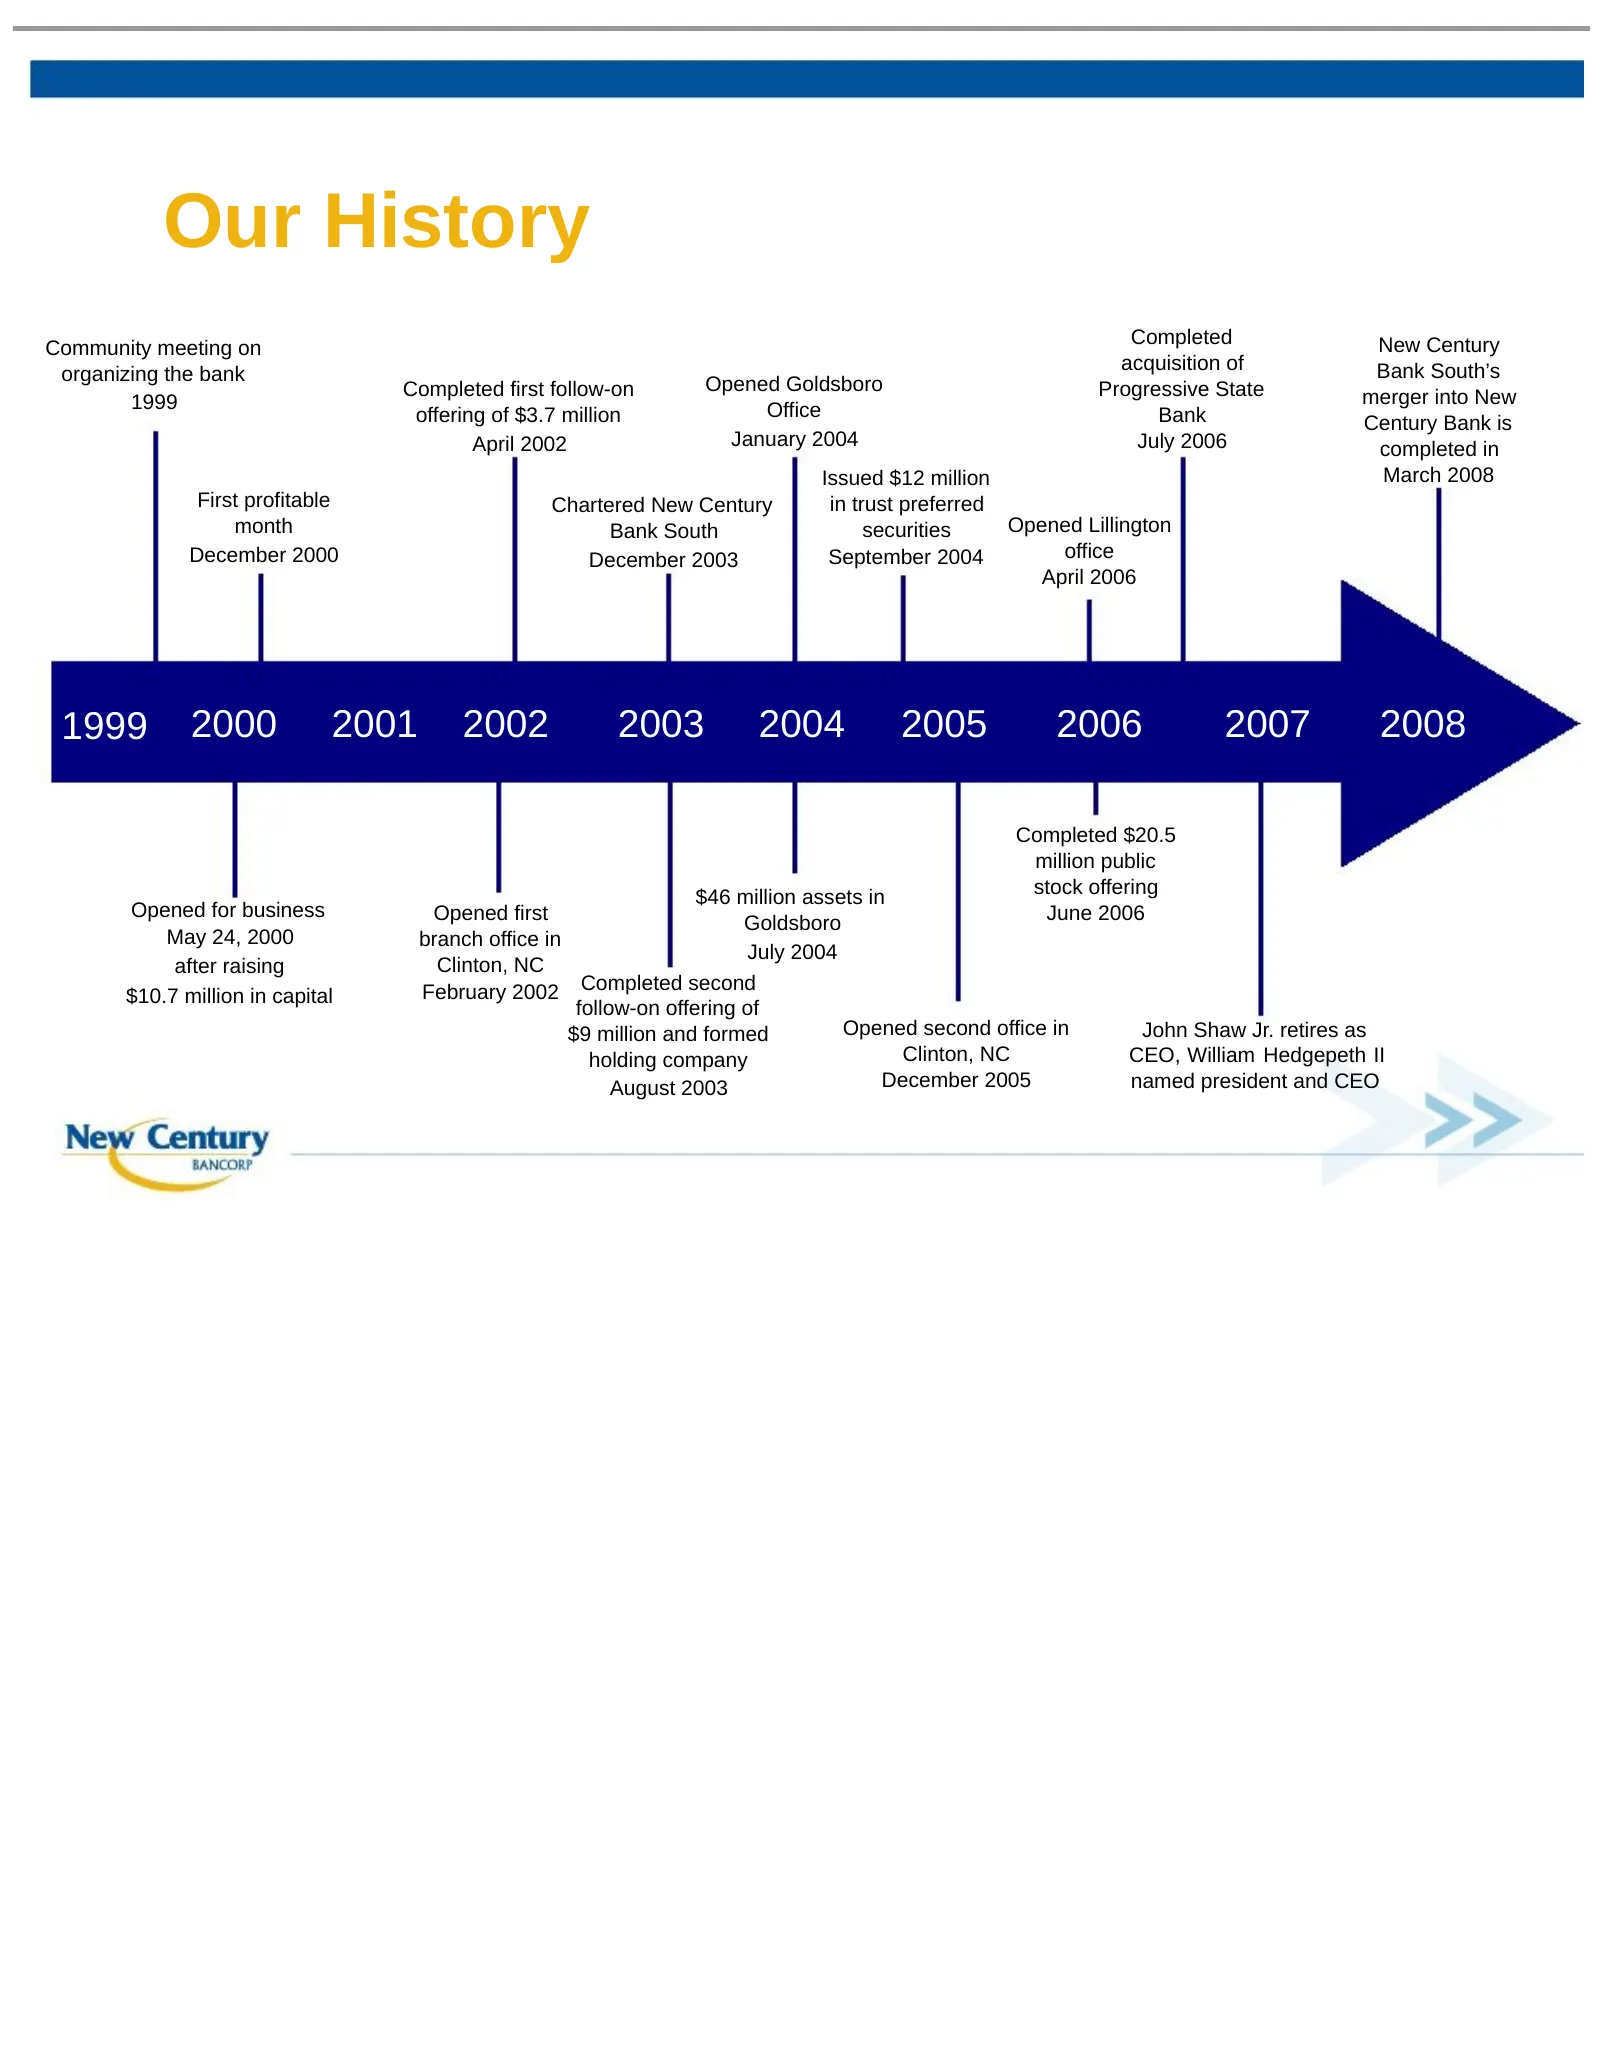
Slide 5: Our History
Our History Completed New Century Community meeting on acquisition of Bank South’s organizing the bank Opened Goldsboro Completed first follow-on Progressive State merger into New 1999 Office offering of $3.7 million Bank Century Bank is April 2002 January 2004 July 2006 completed in Issued $12 mill
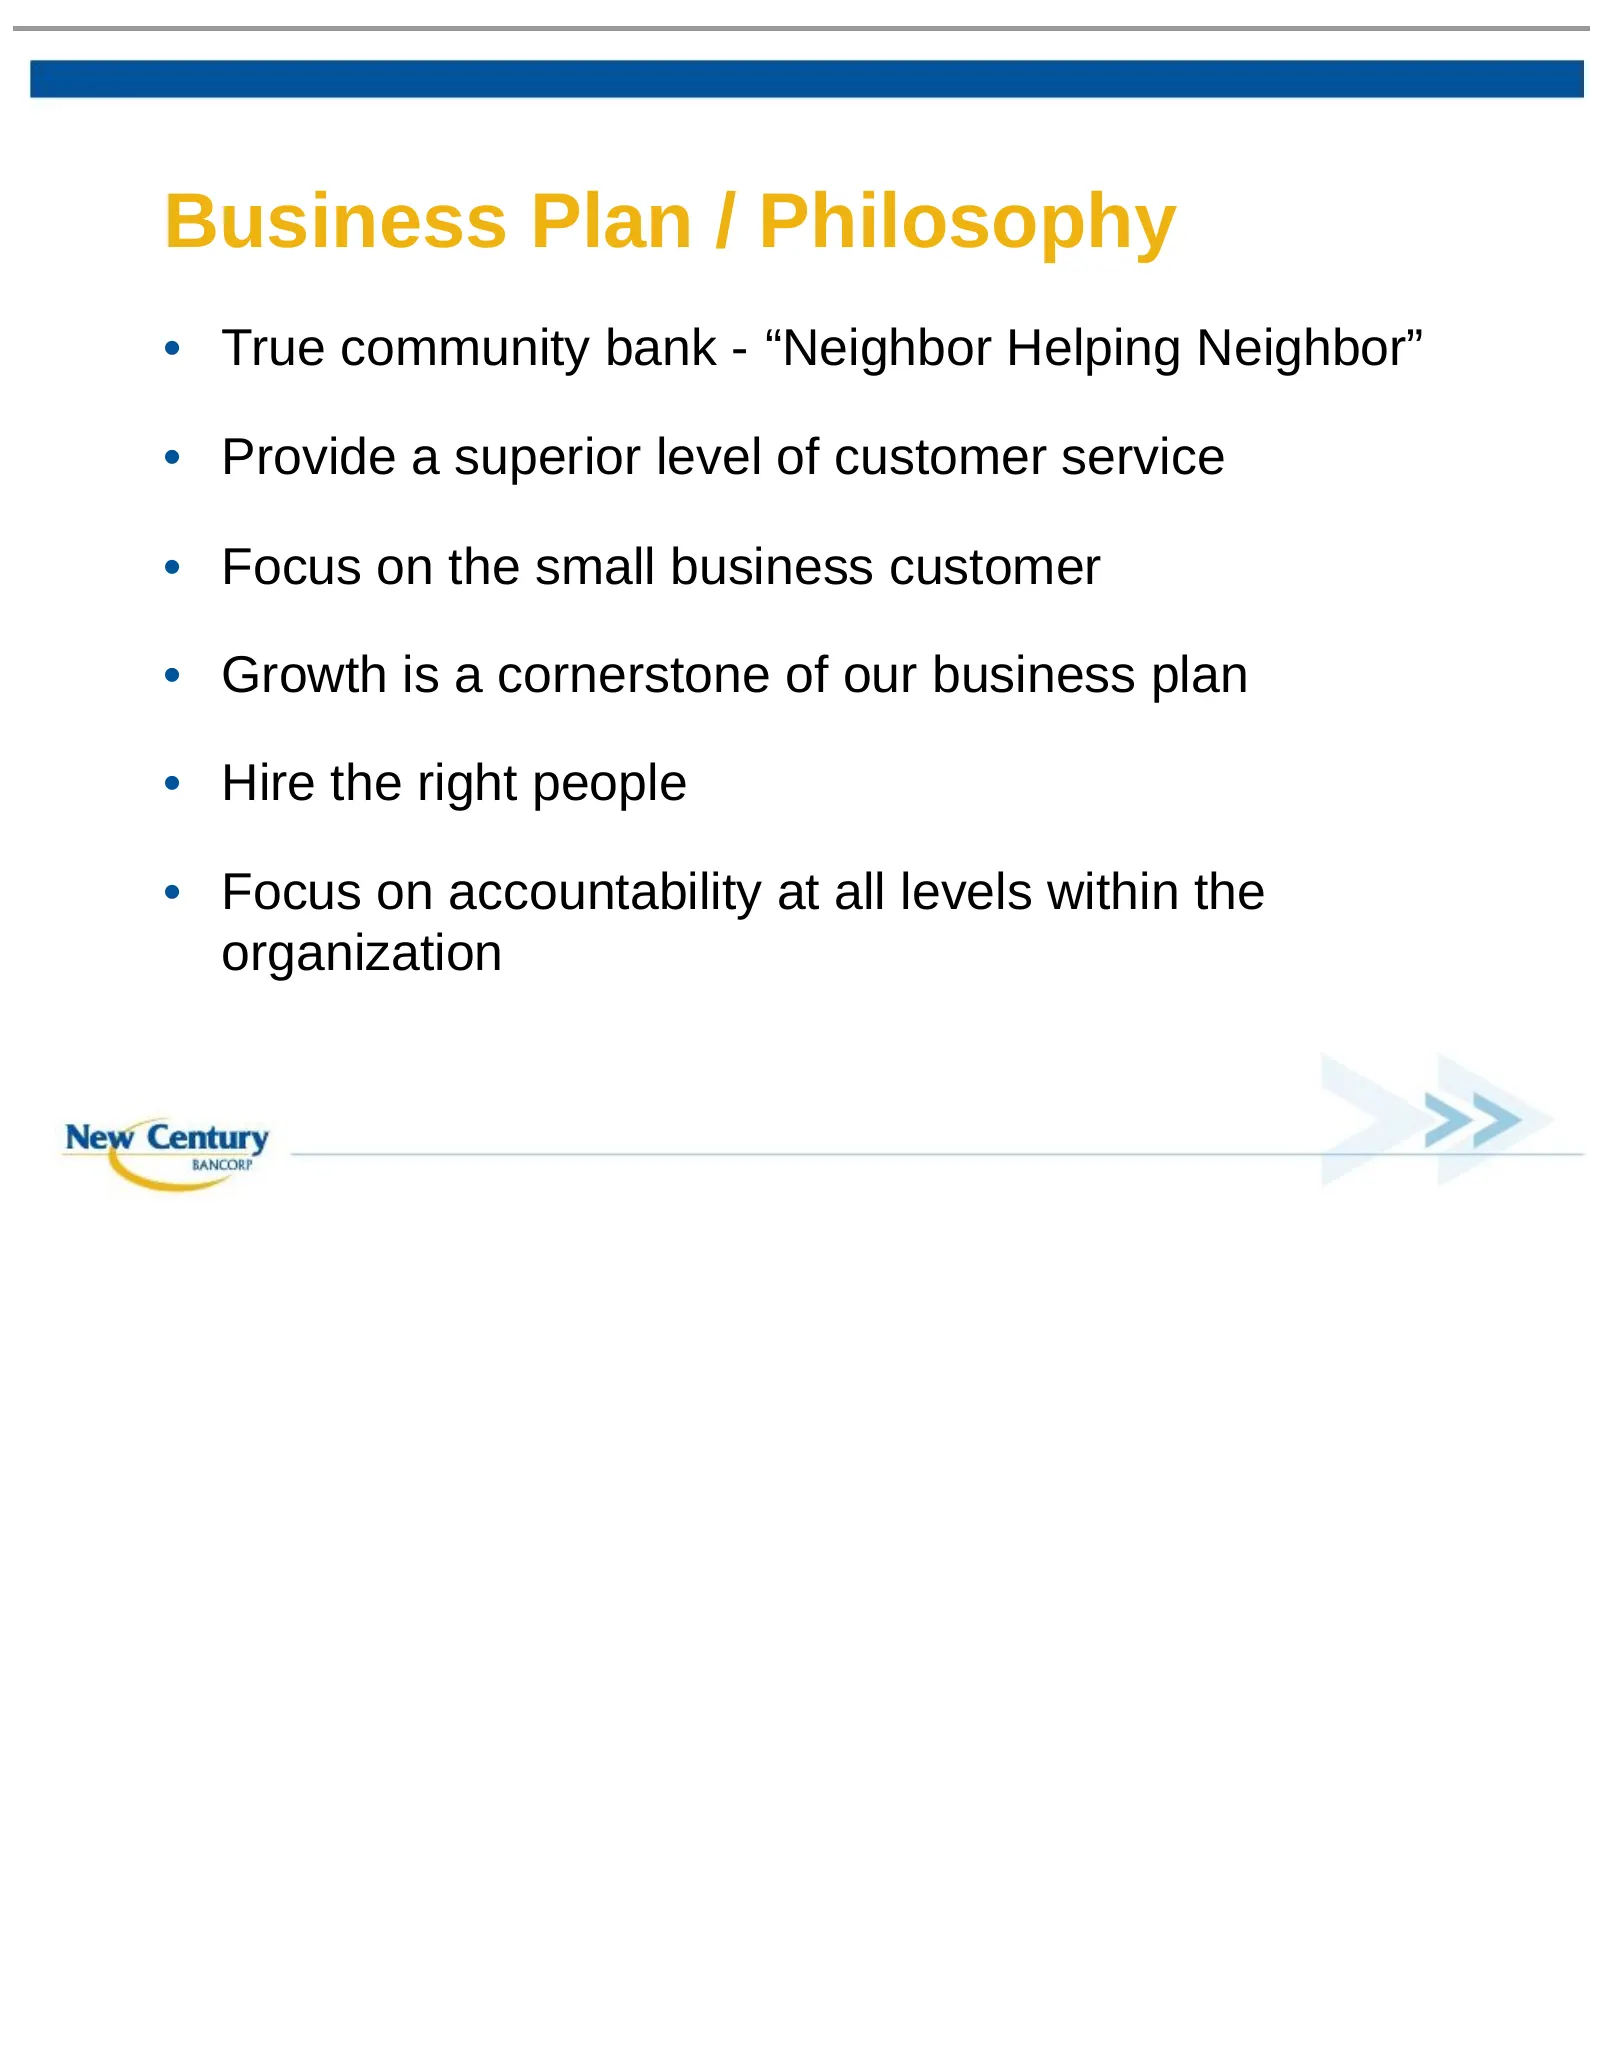
Slide 6: Business Plan / Philosophy
Business Plan / Philosophy • True community bank - “Neighbor Helping Neighbor” • Provide a superior level of customer service • Focus on the small business customer • Growth is a cornerstone of our business plan • Hire the right people • Focus on accountability at all levels within the organization
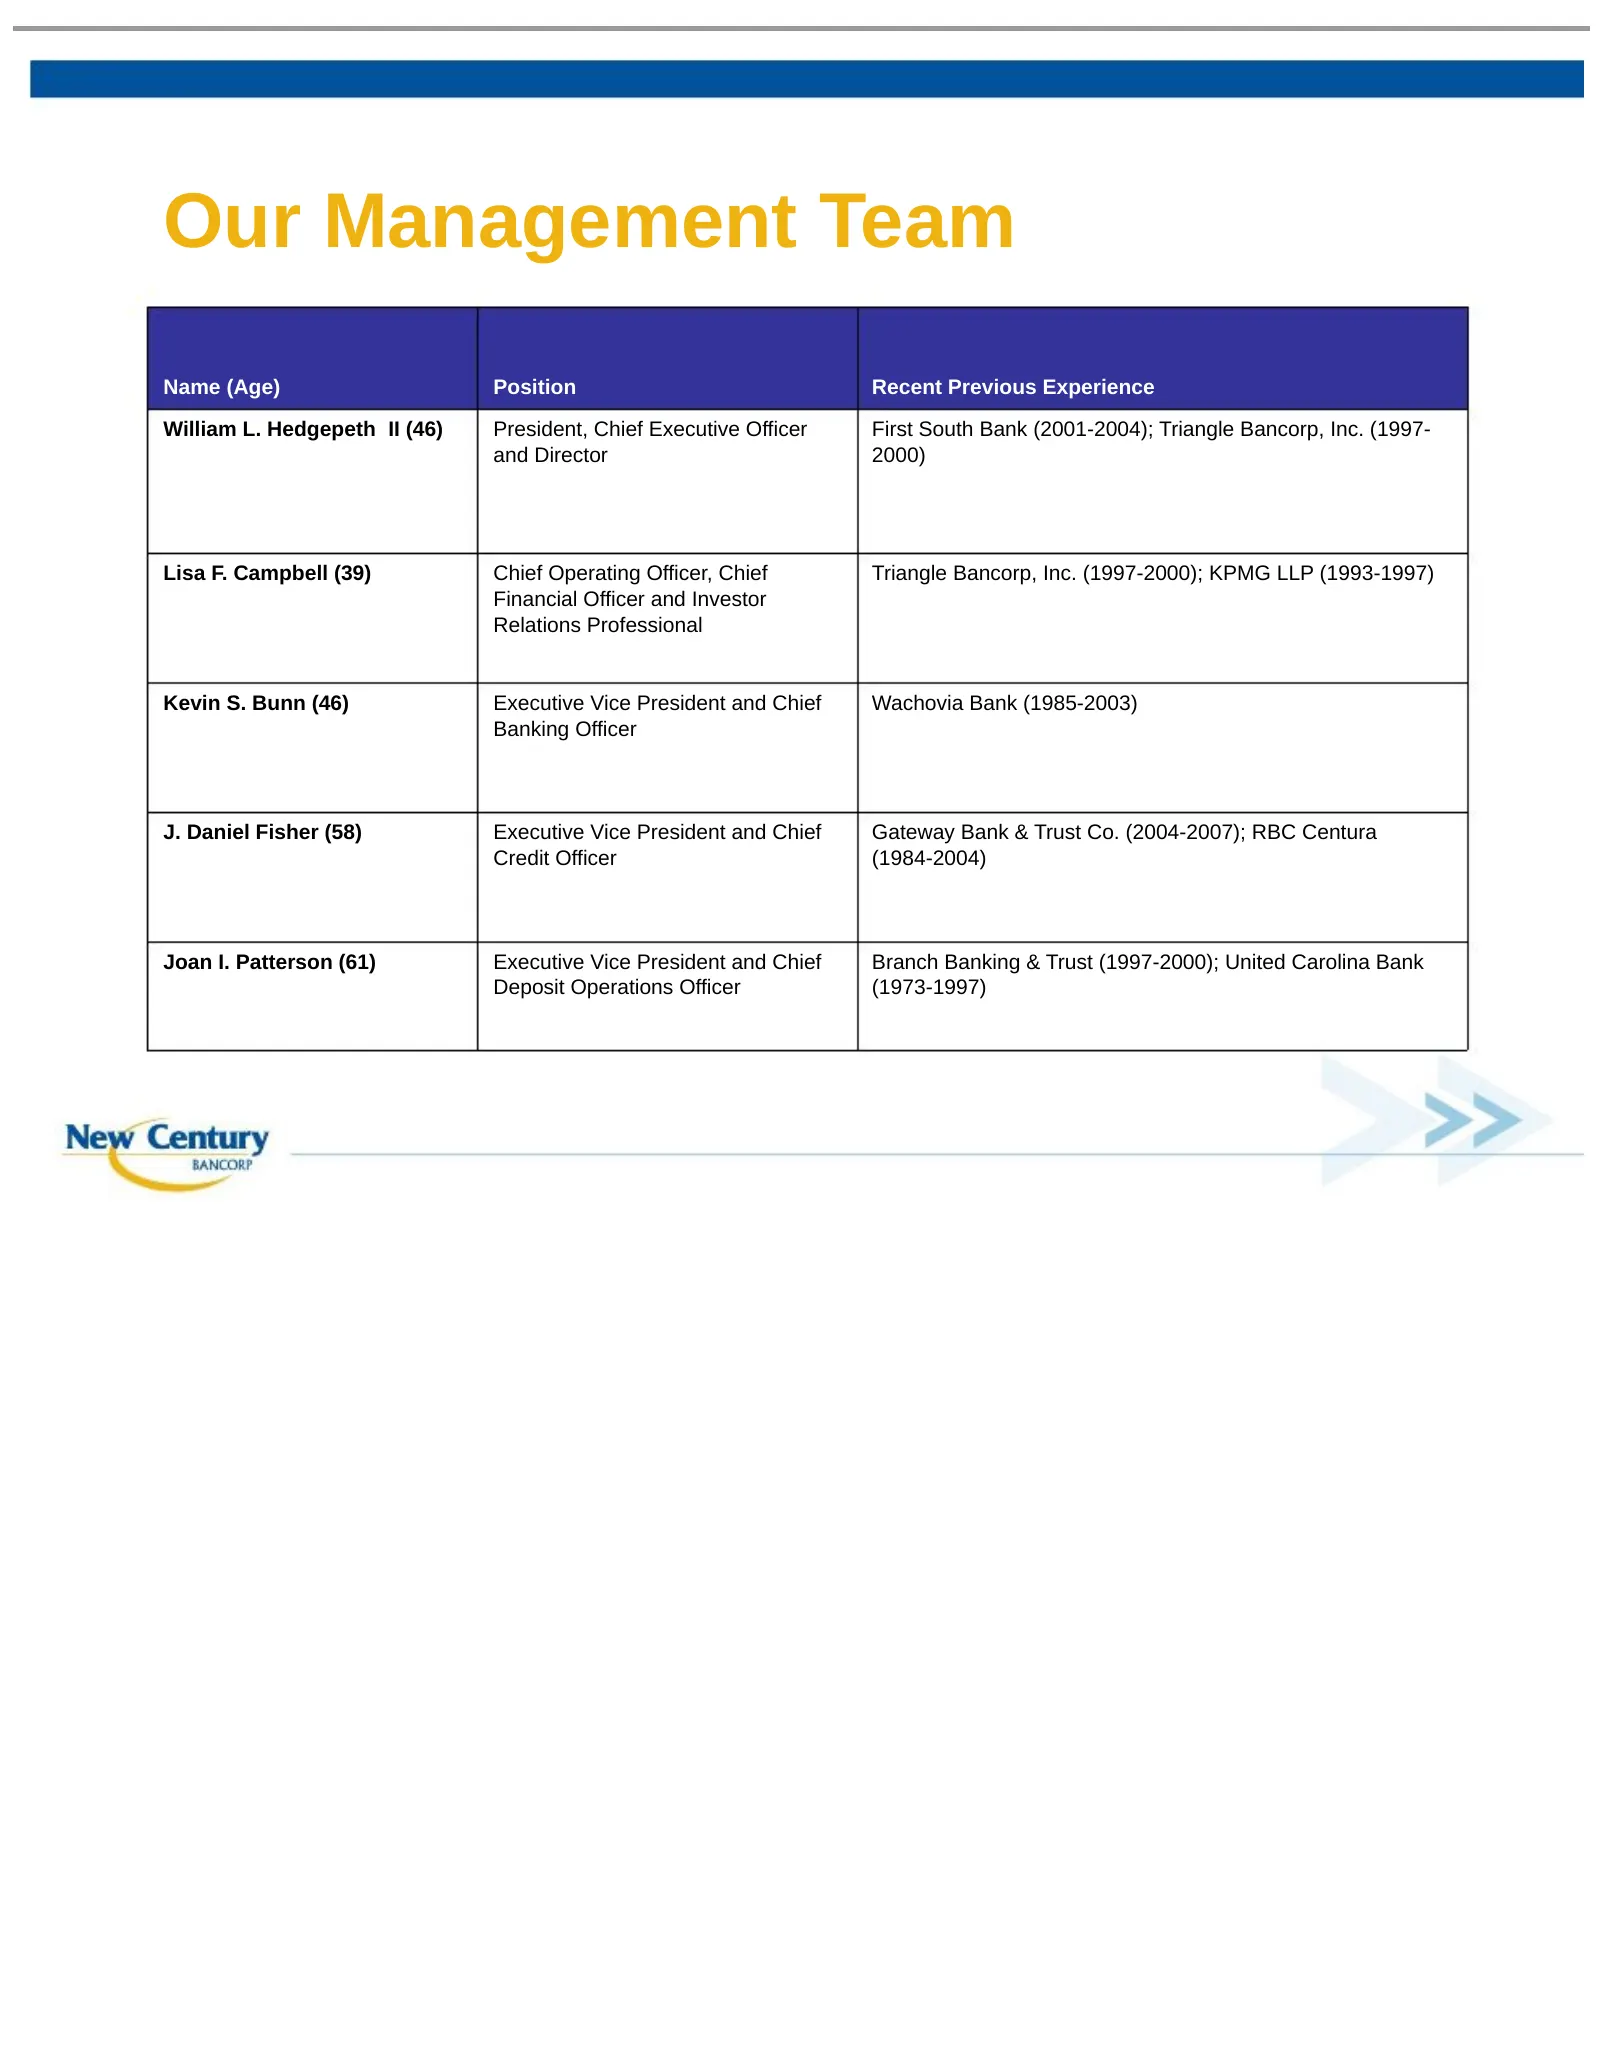
Slide 7: Our Management Team
Our Management Team Name (Age) Position Recent Previous Experience William L. Hedgepeth II (46) President, Chief Executive Officer First South Bank (2001-2004); Triangle Bancorp, Inc. (1997- and Director 2000) Lisa F. Campbell (39) Chief Operating Officer, Chief Triangle Bancorp, Inc. (1997-2000); K
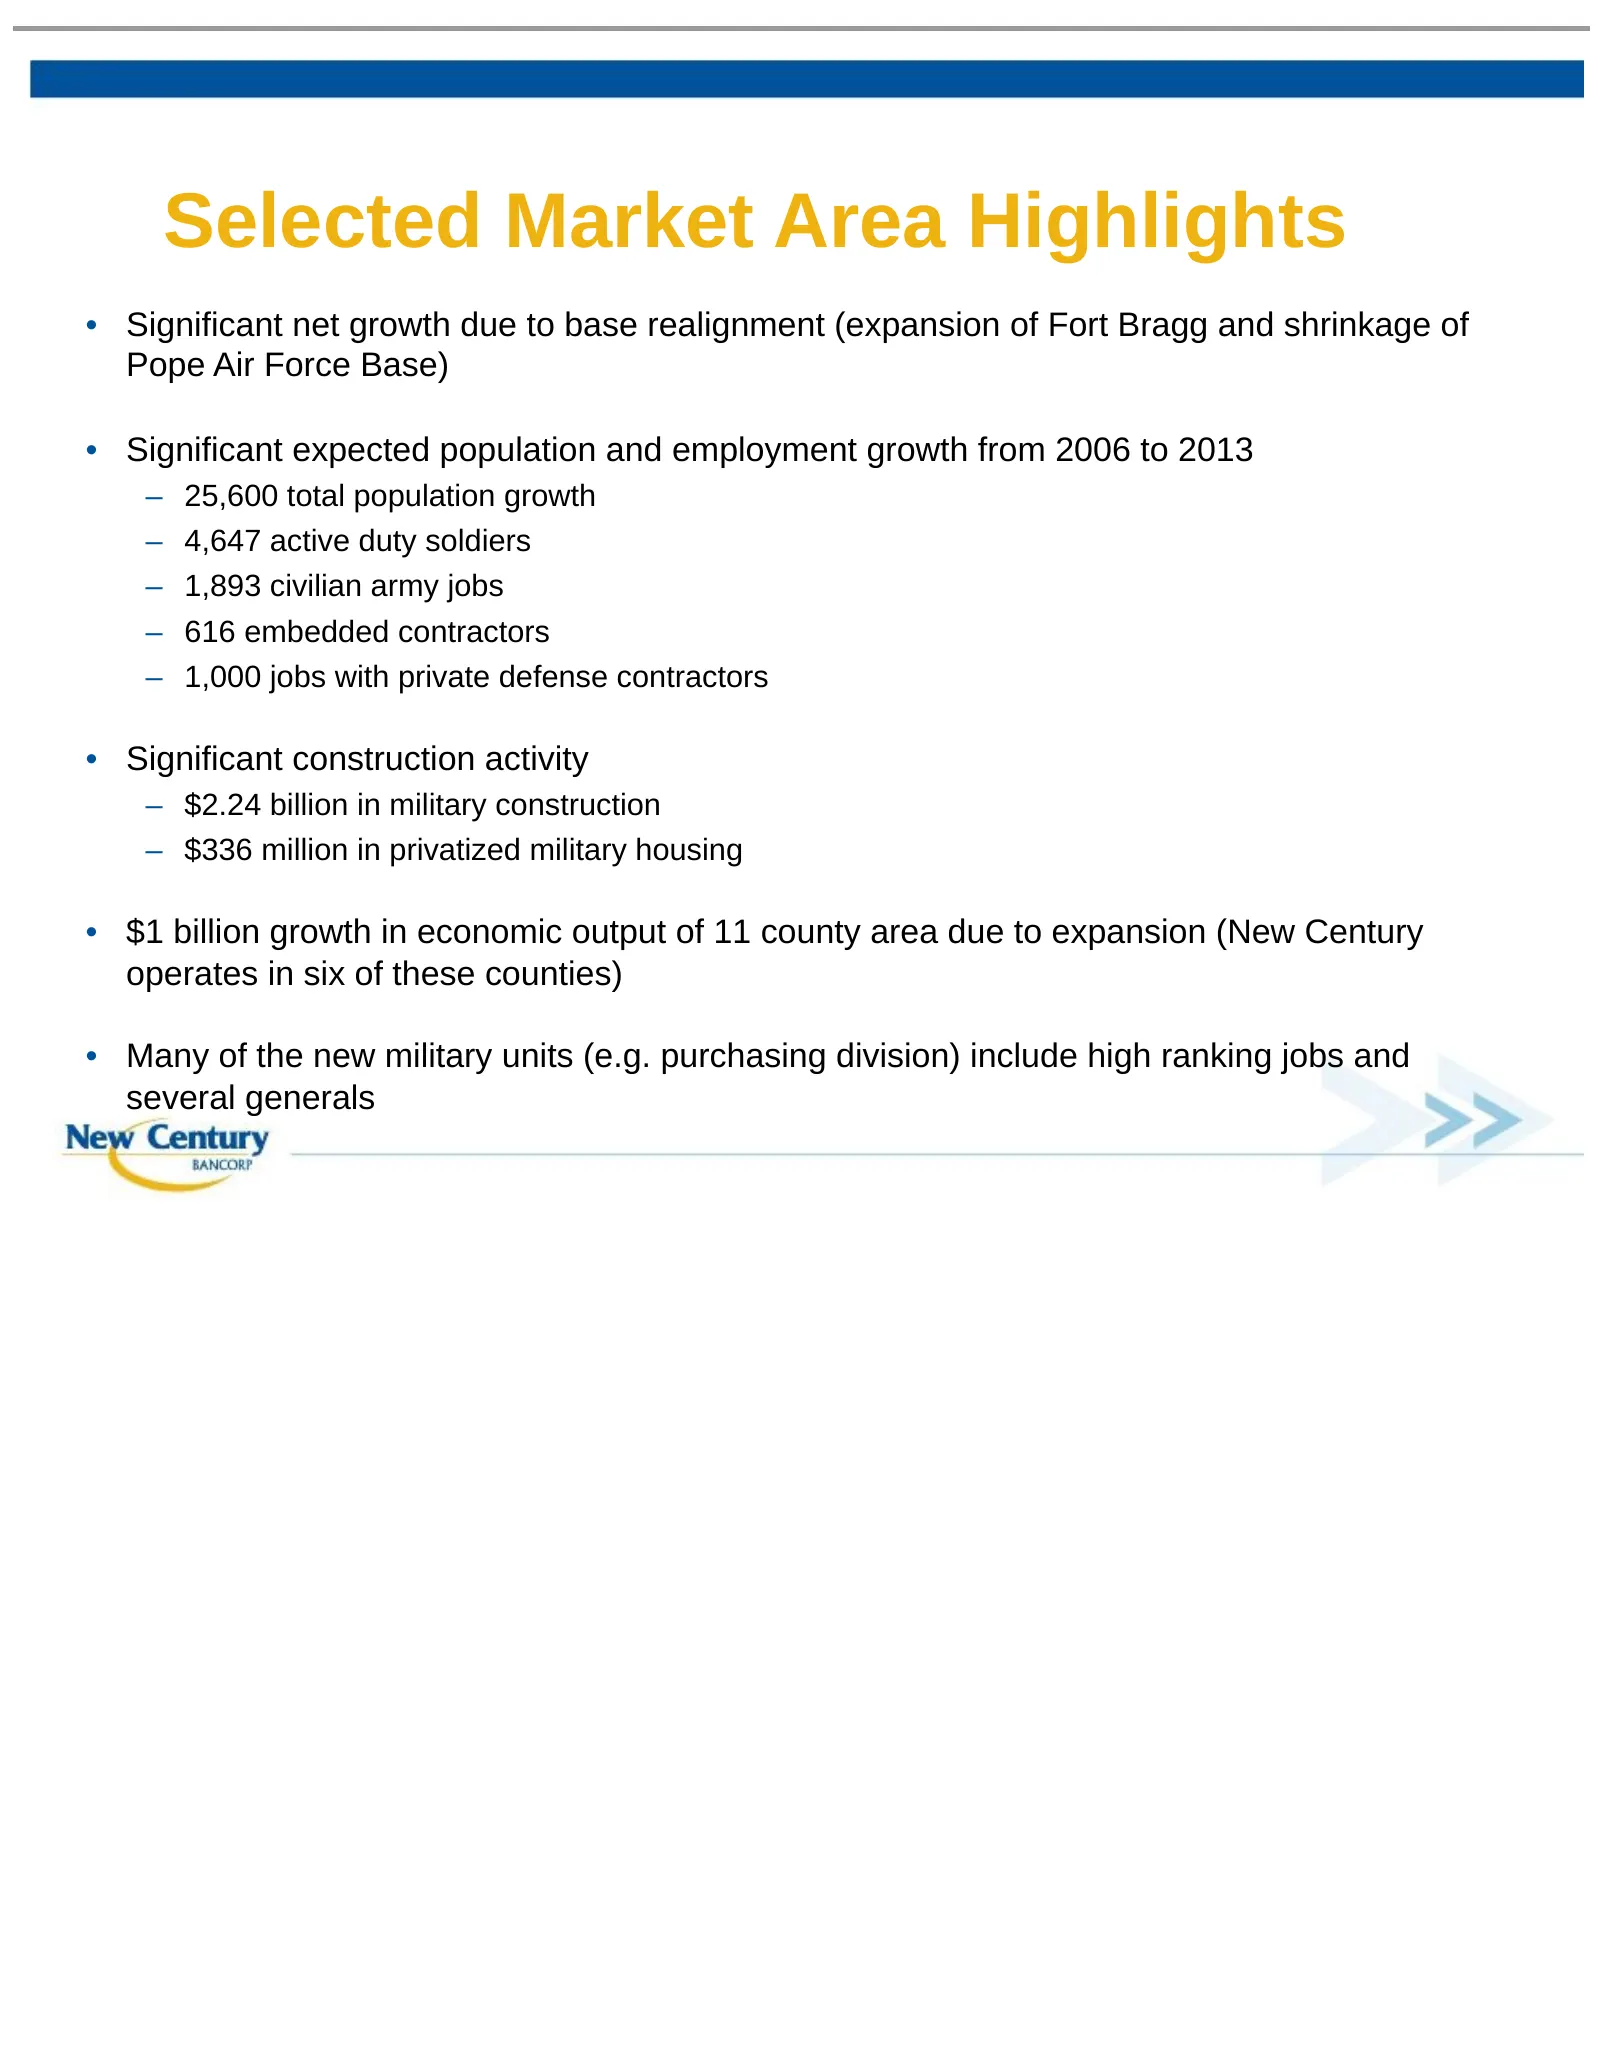
Slide 8: Selected Market Area Highlights
Selected Market Area Highlights • Significant net growth due to base realignment (expansion of Fort Bragg and shrinkage of Pope Air Force Base) • Significant expected population and employment growth from 2006 to 2013 – 25,600 total population growth – 4,647 active duty soldiers – 1,893 civilian arm
Slide 9: Market Share by County
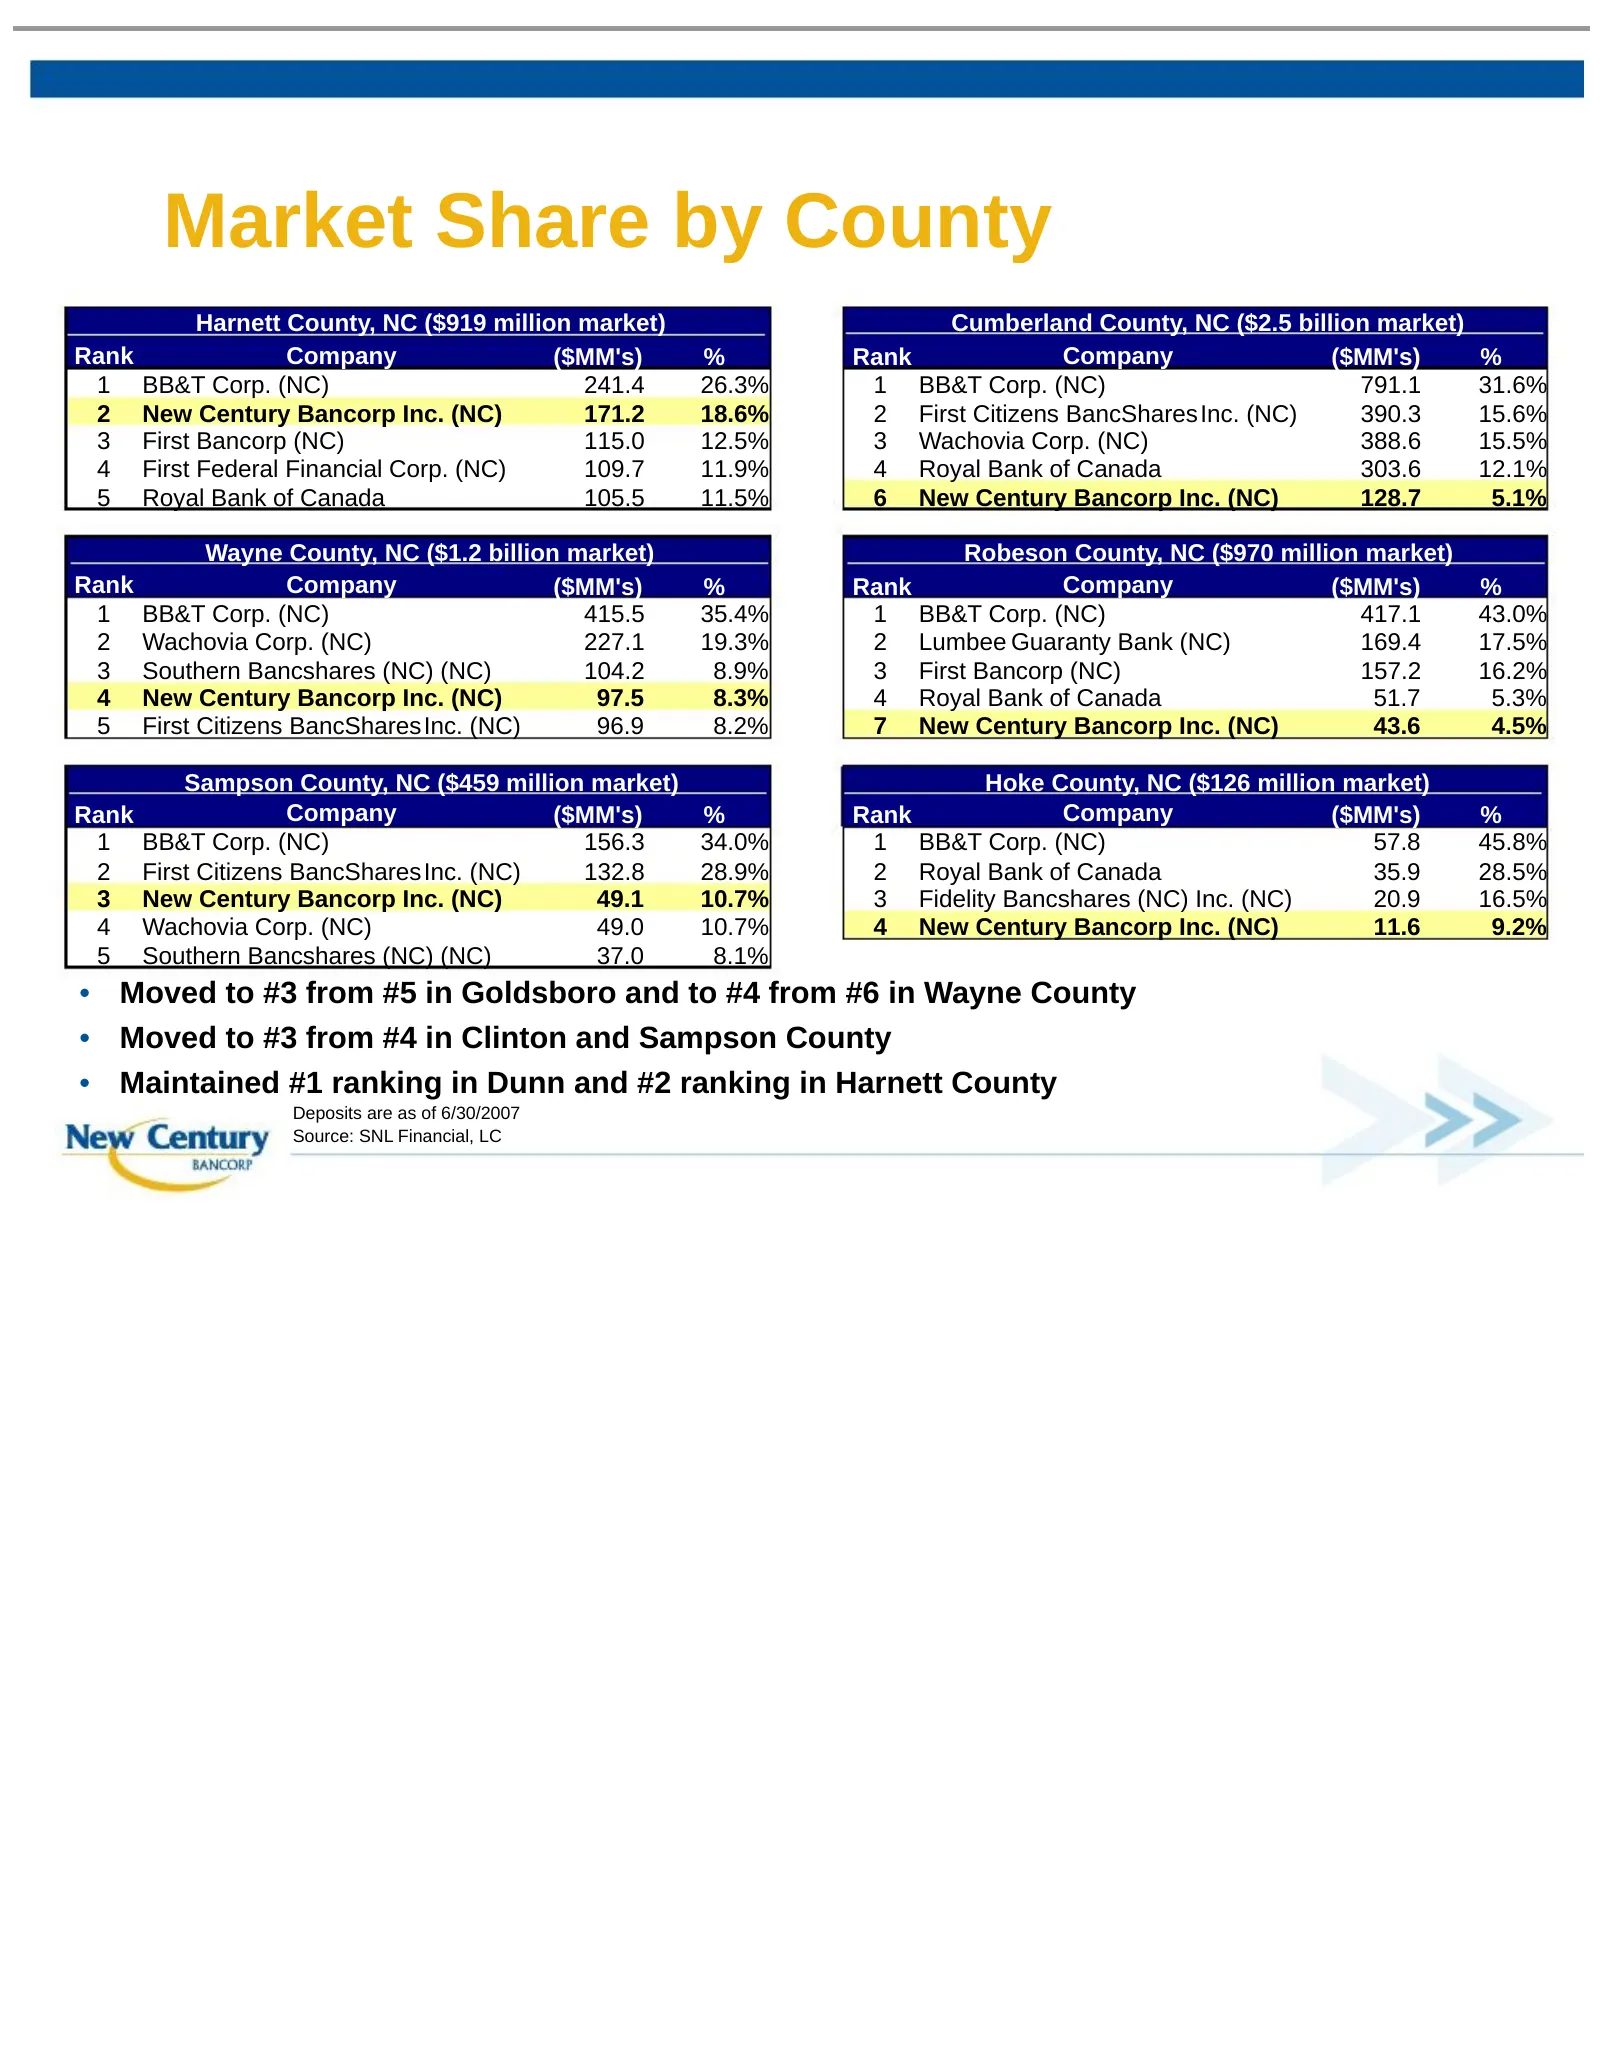
Market Share by County Harnett County, NC ($919 million market) Cumberland County, NC ($2.5 billion market) Rank Company ($MM's) % Rank Company ($MM's) % 1 BB&T Corp. (NC) 241.4 26.3% 1 BB&T Corp. (NC) 791.1 31.6% 2 New Century Bancorp Inc. (NC) 171.2 18.6% 2 First Citizens BancSharesInc. (NC) 390.3
Slide 10: Loan & Deposit Composition 12/31/07
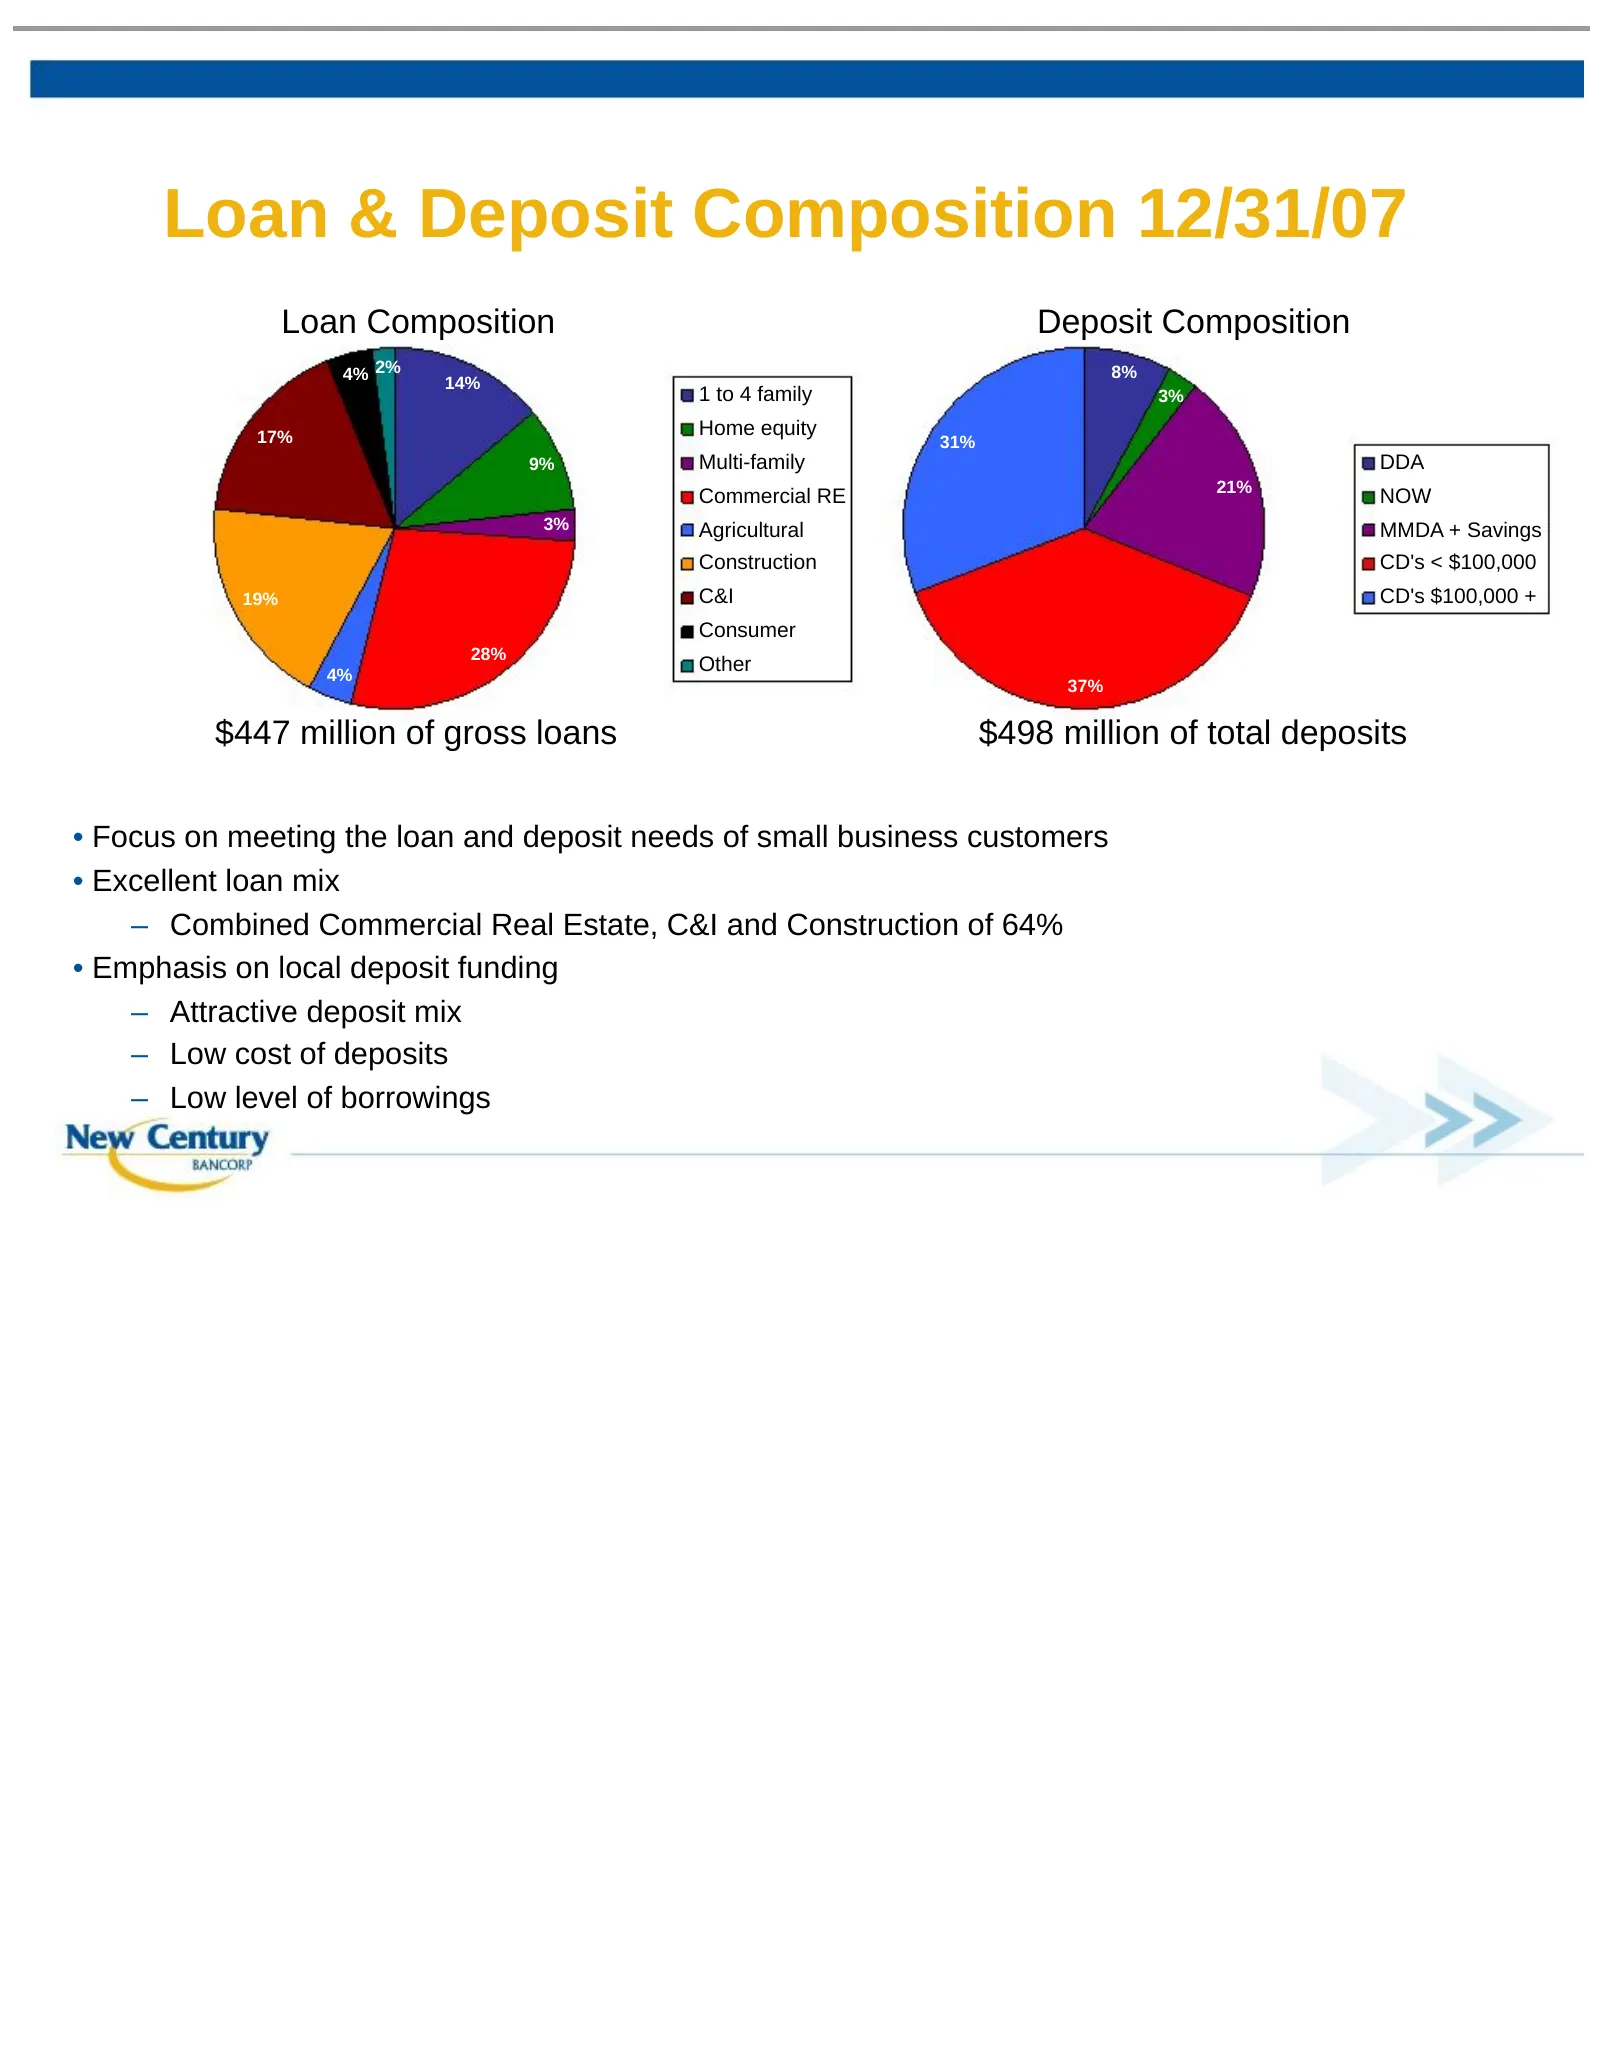
Loan & Deposit Composition 12/31/07 Loan Composition Deposit Composition 4% 2% 8% 14% 1 to 4 family 3% 17% Home equity 31% 9% Multi-family DDA 21% Commercial RE NOW 3% Agricultural MMDA + Savings Construction CD's < $100,000 19% C&I CD's $100,000 + Consumer 28% 4% Other 37% $447 million of gross loa
Slide 11: Recent Challenges
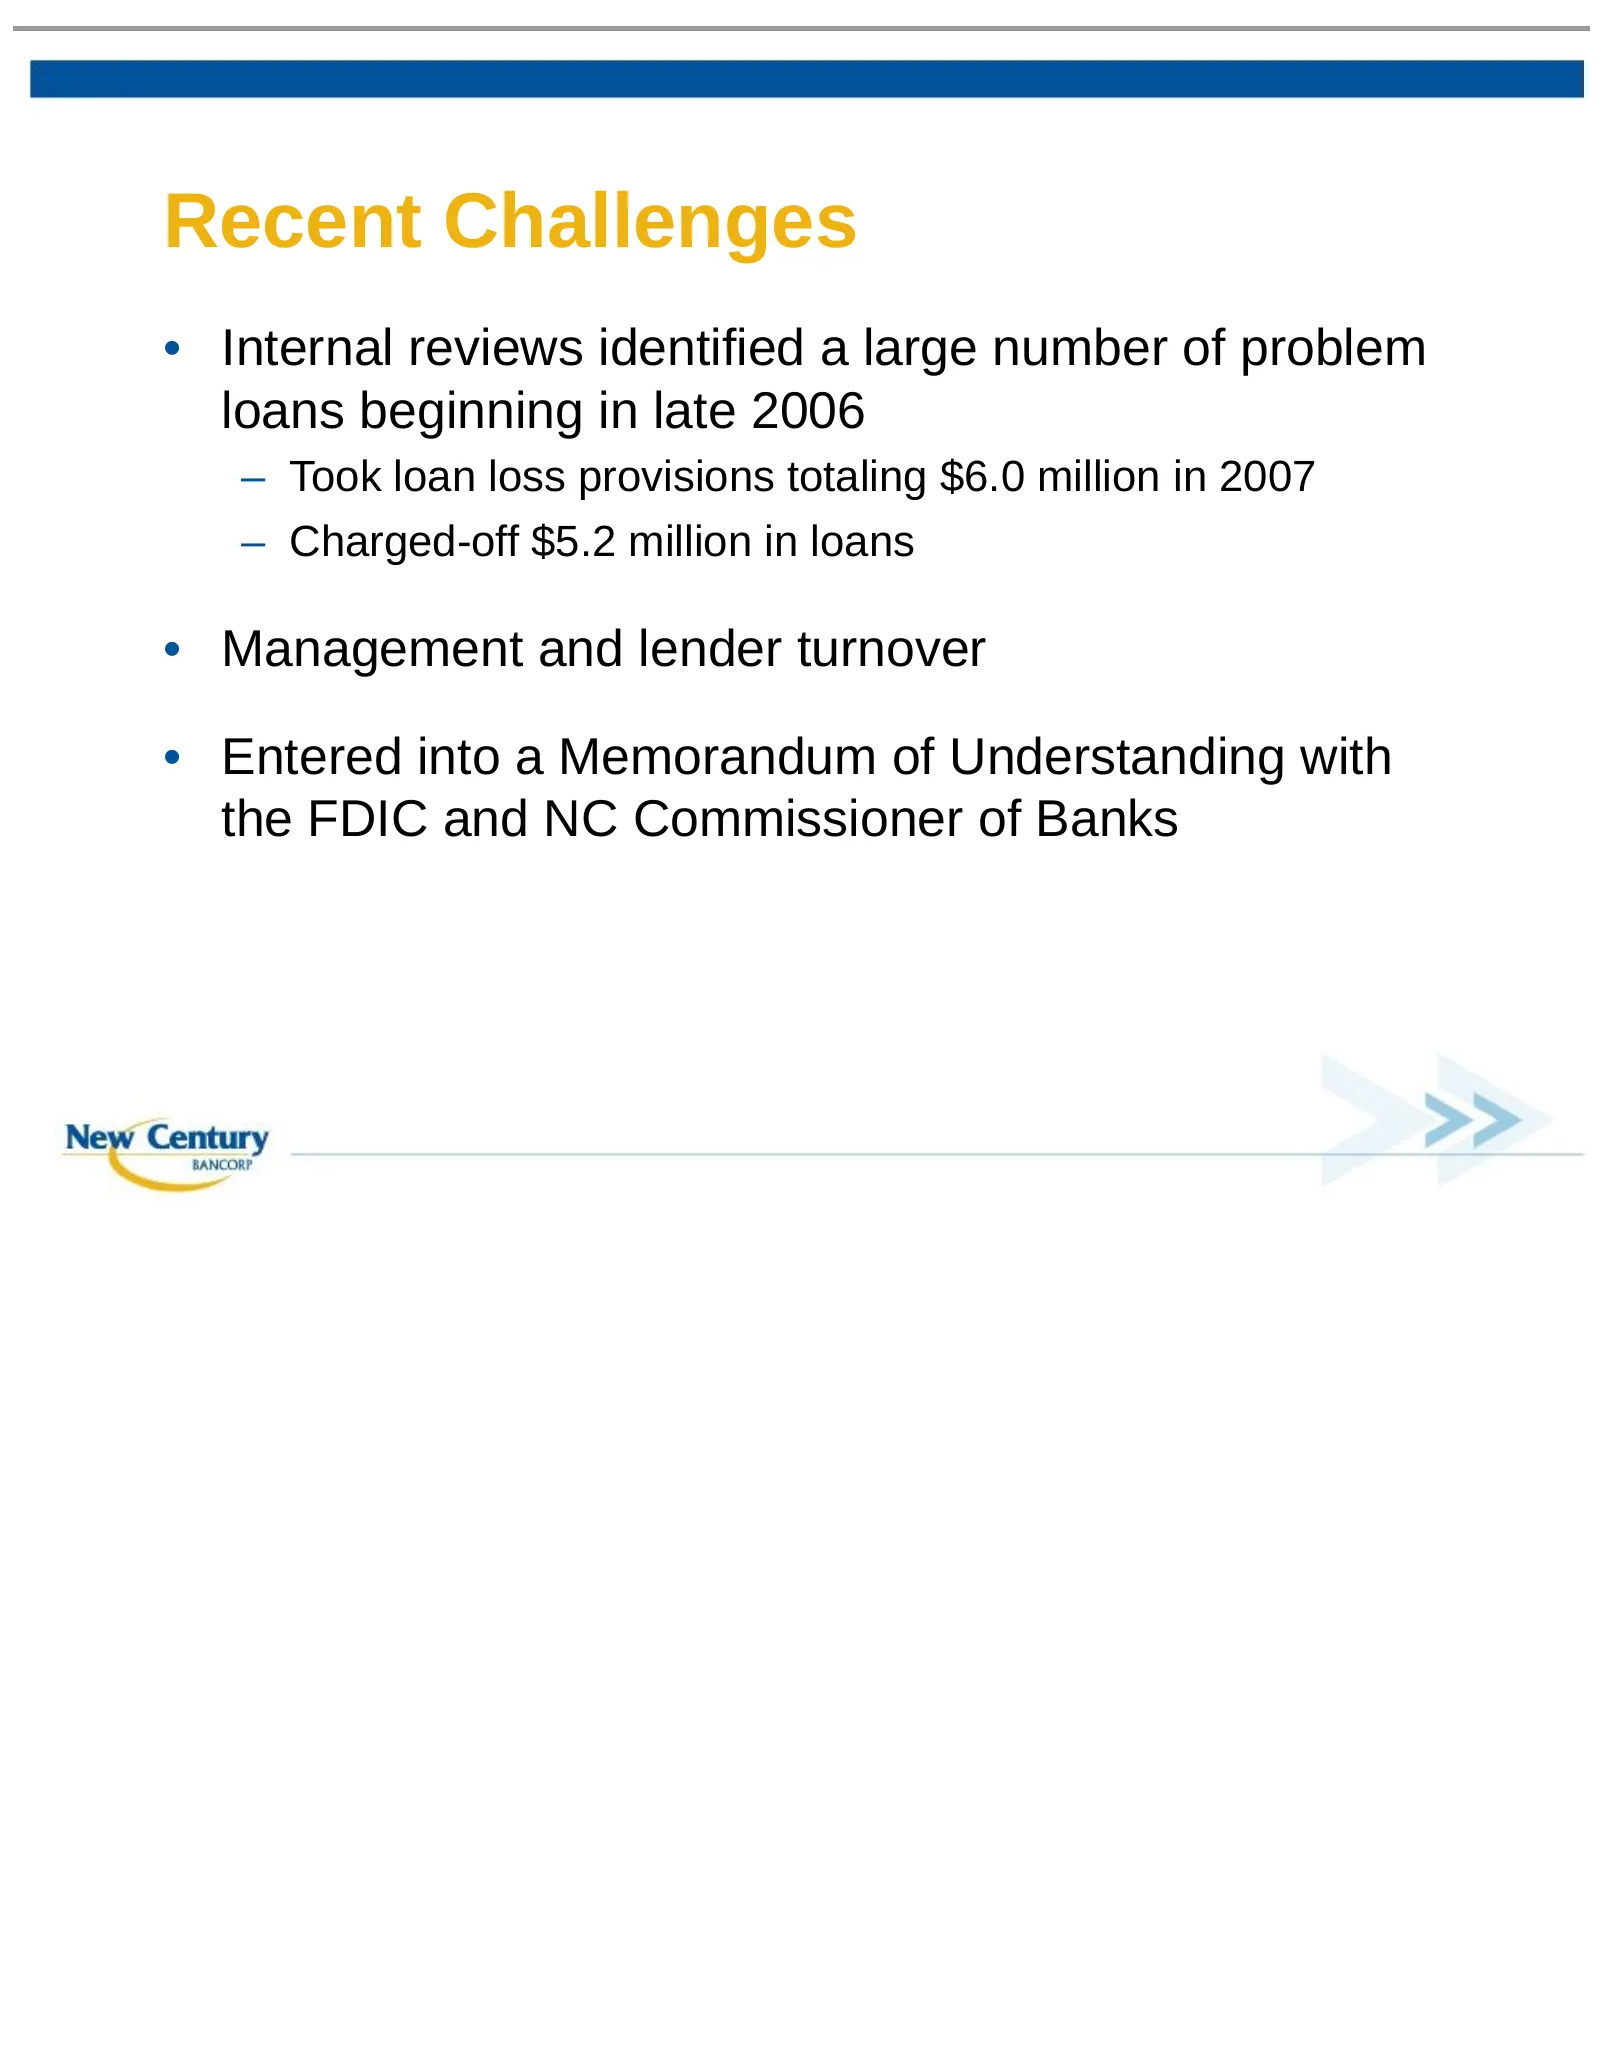
Recent Challenges • Internal reviews identified a large number of problem loans beginning in late 2006 – Took loan loss provisions totaling $6.0 million in 2007 – Charged-off $5.2 million in loans • Management and lender turnover • Entered into a Memorandum of Understanding with the FDIC and NC Comm
Slide 12: Resulting Improvements
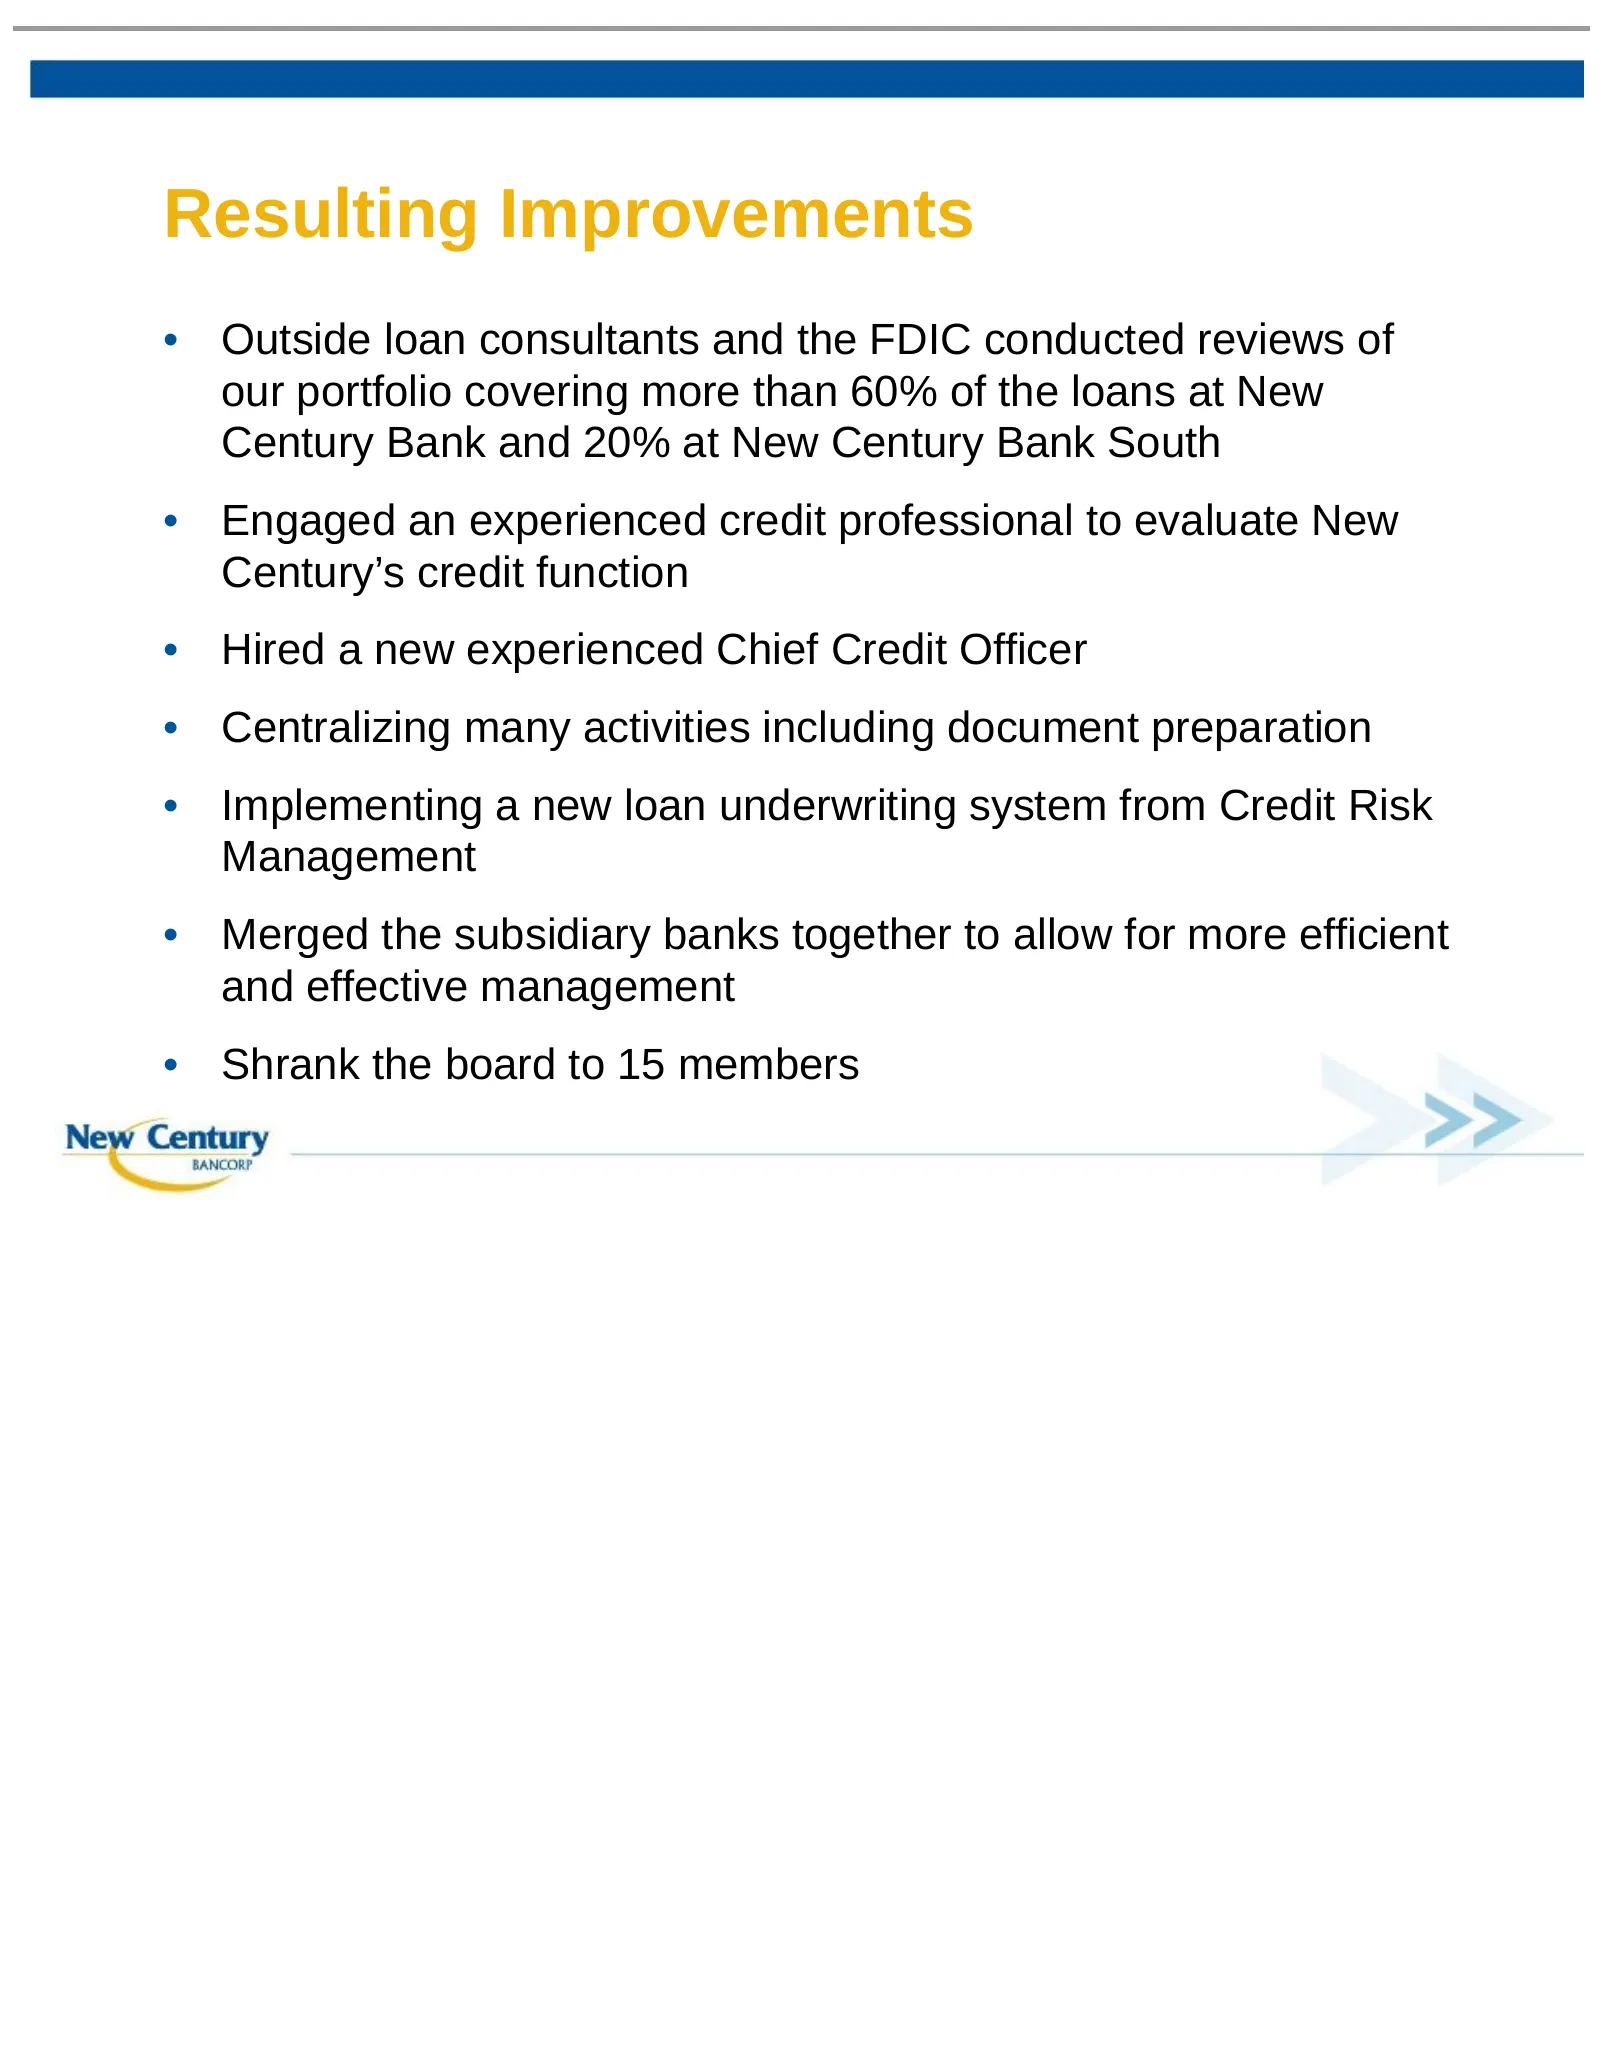
Resulting Improvements • Outside loan consultants and the FDIC conducted reviews of our portfolio covering more than 60% of the loans at New Century Bank and 20% at New Century Bank South • Engaged an experienced credit professional to evaluate New Century’s credit function • Hired a new experienced
Slide 13: Balance Sheet Growth
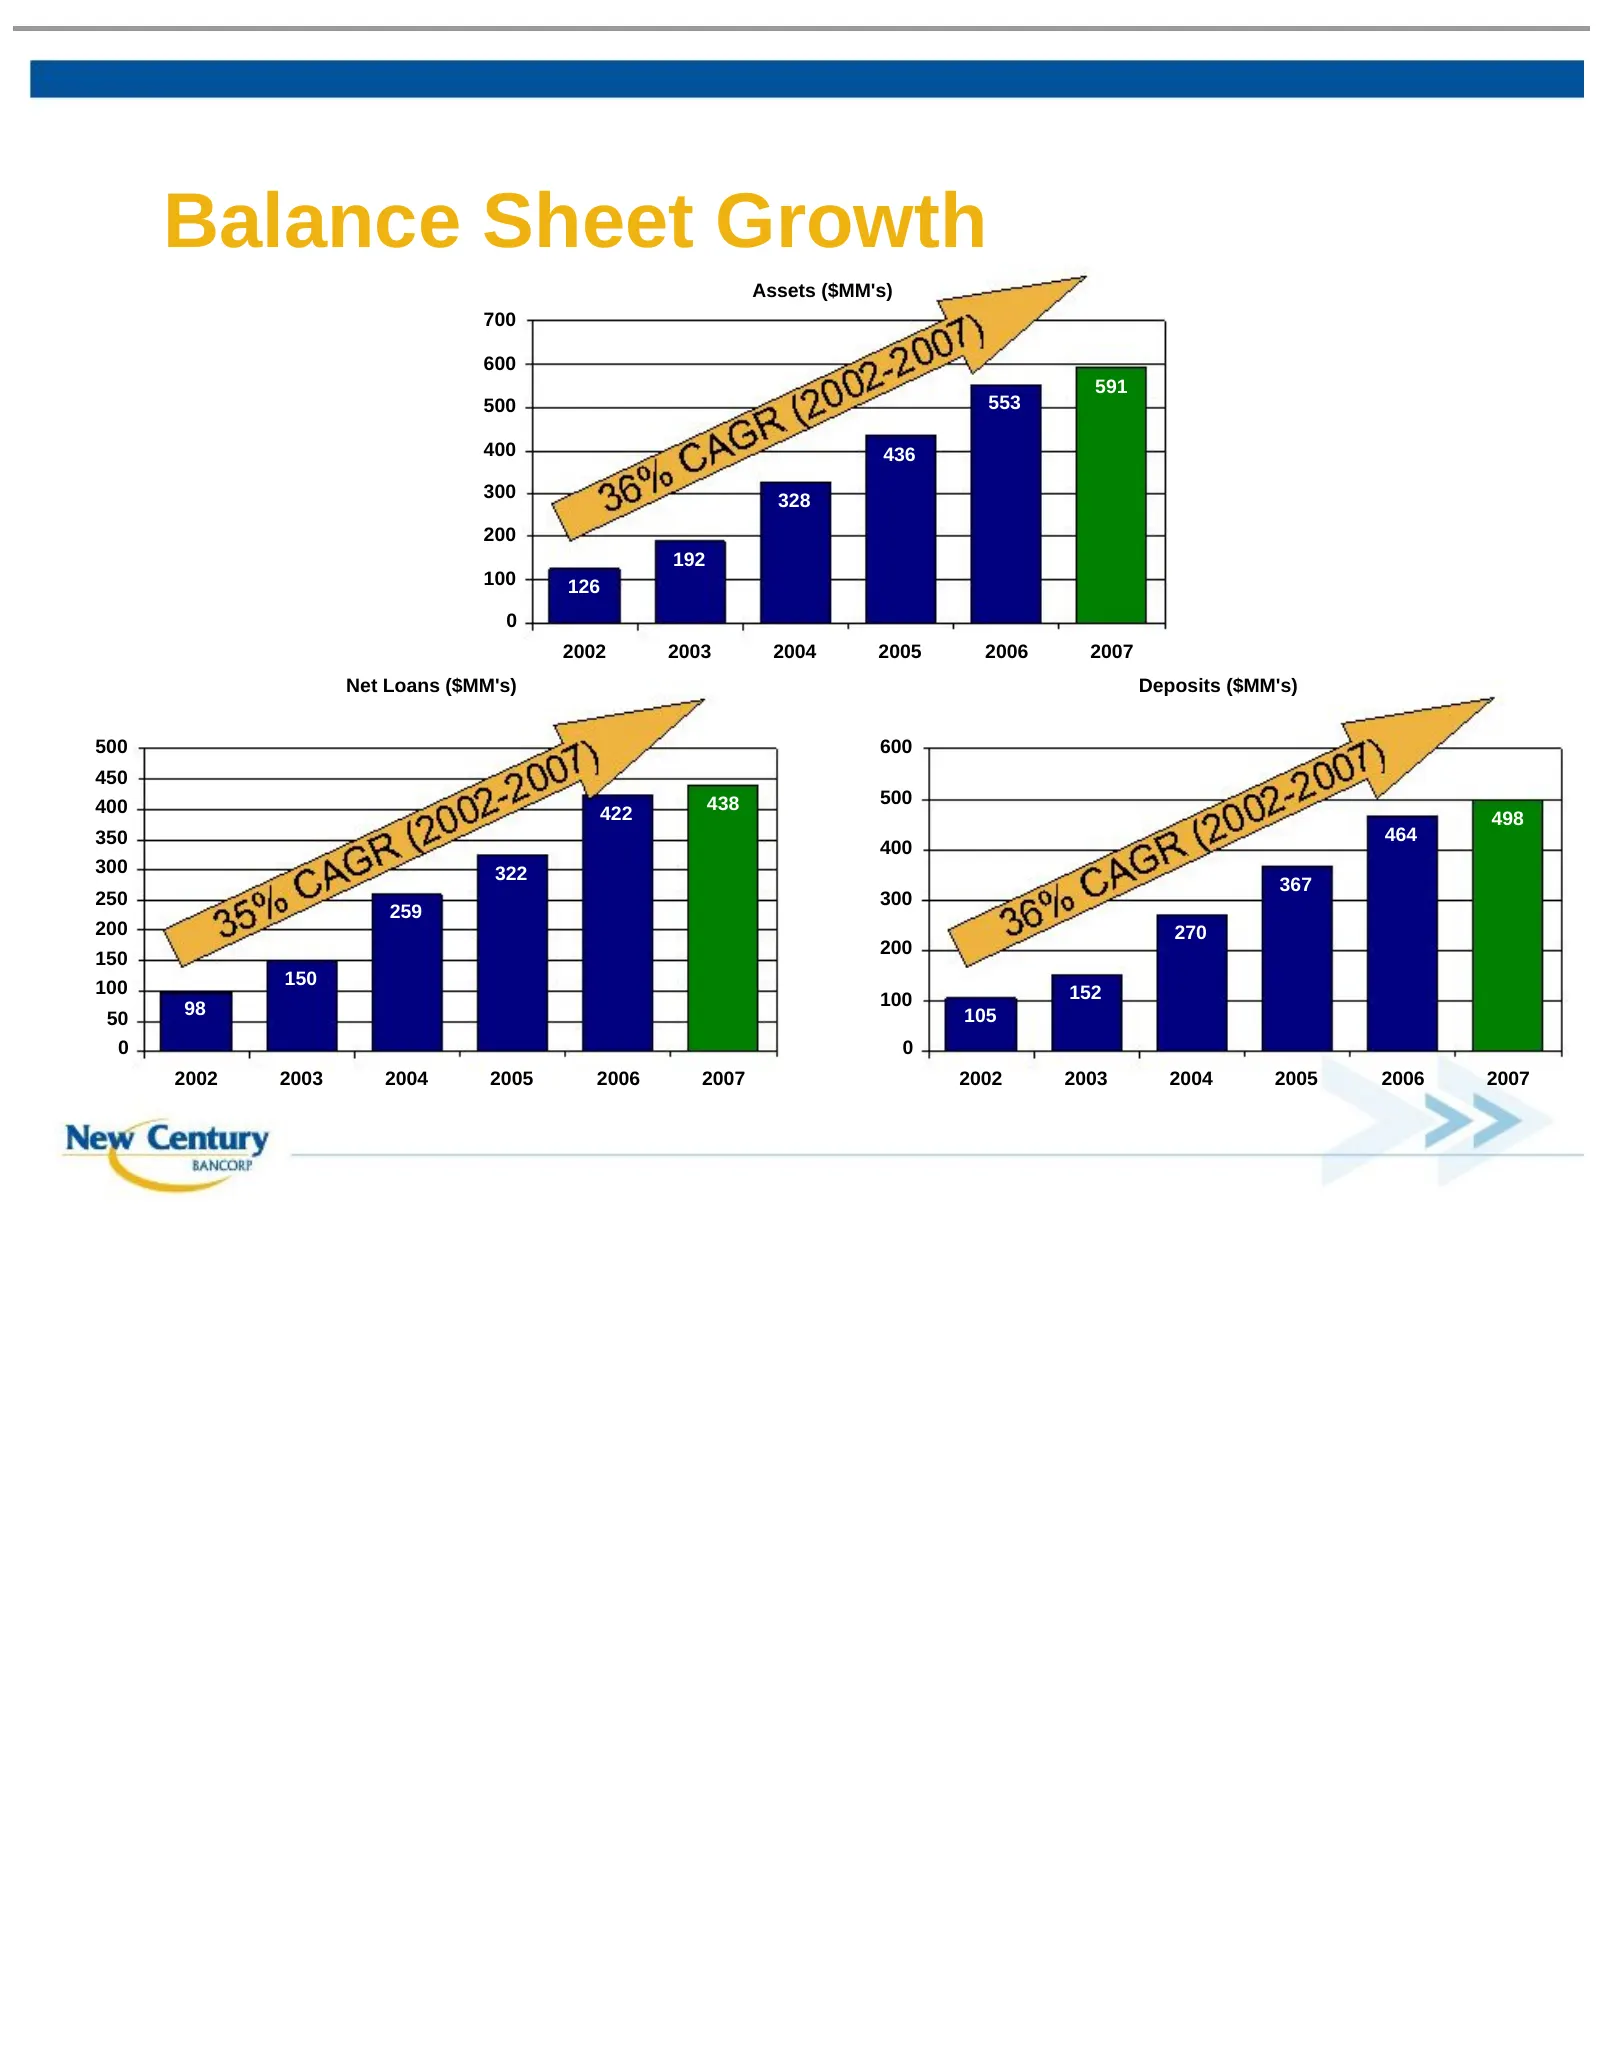
Balance Sheet Growth Assets ($MM's) 700 600 591 500 553 400 436 300 328 200 192 100 126 0 2002 2003 2004 2005 2006 2007 Net Loans ($MM's) Deposits ($MM's) 500 600 450 400 438 500 422 498 350 464 400 300 322 367 250 300 259 200 270 200 150 150 100 152 98 100 50 105 0 0 2002 2003 2004 2005 2006 2007 2
Slide 14: Asset Quality & Reserve Coverage
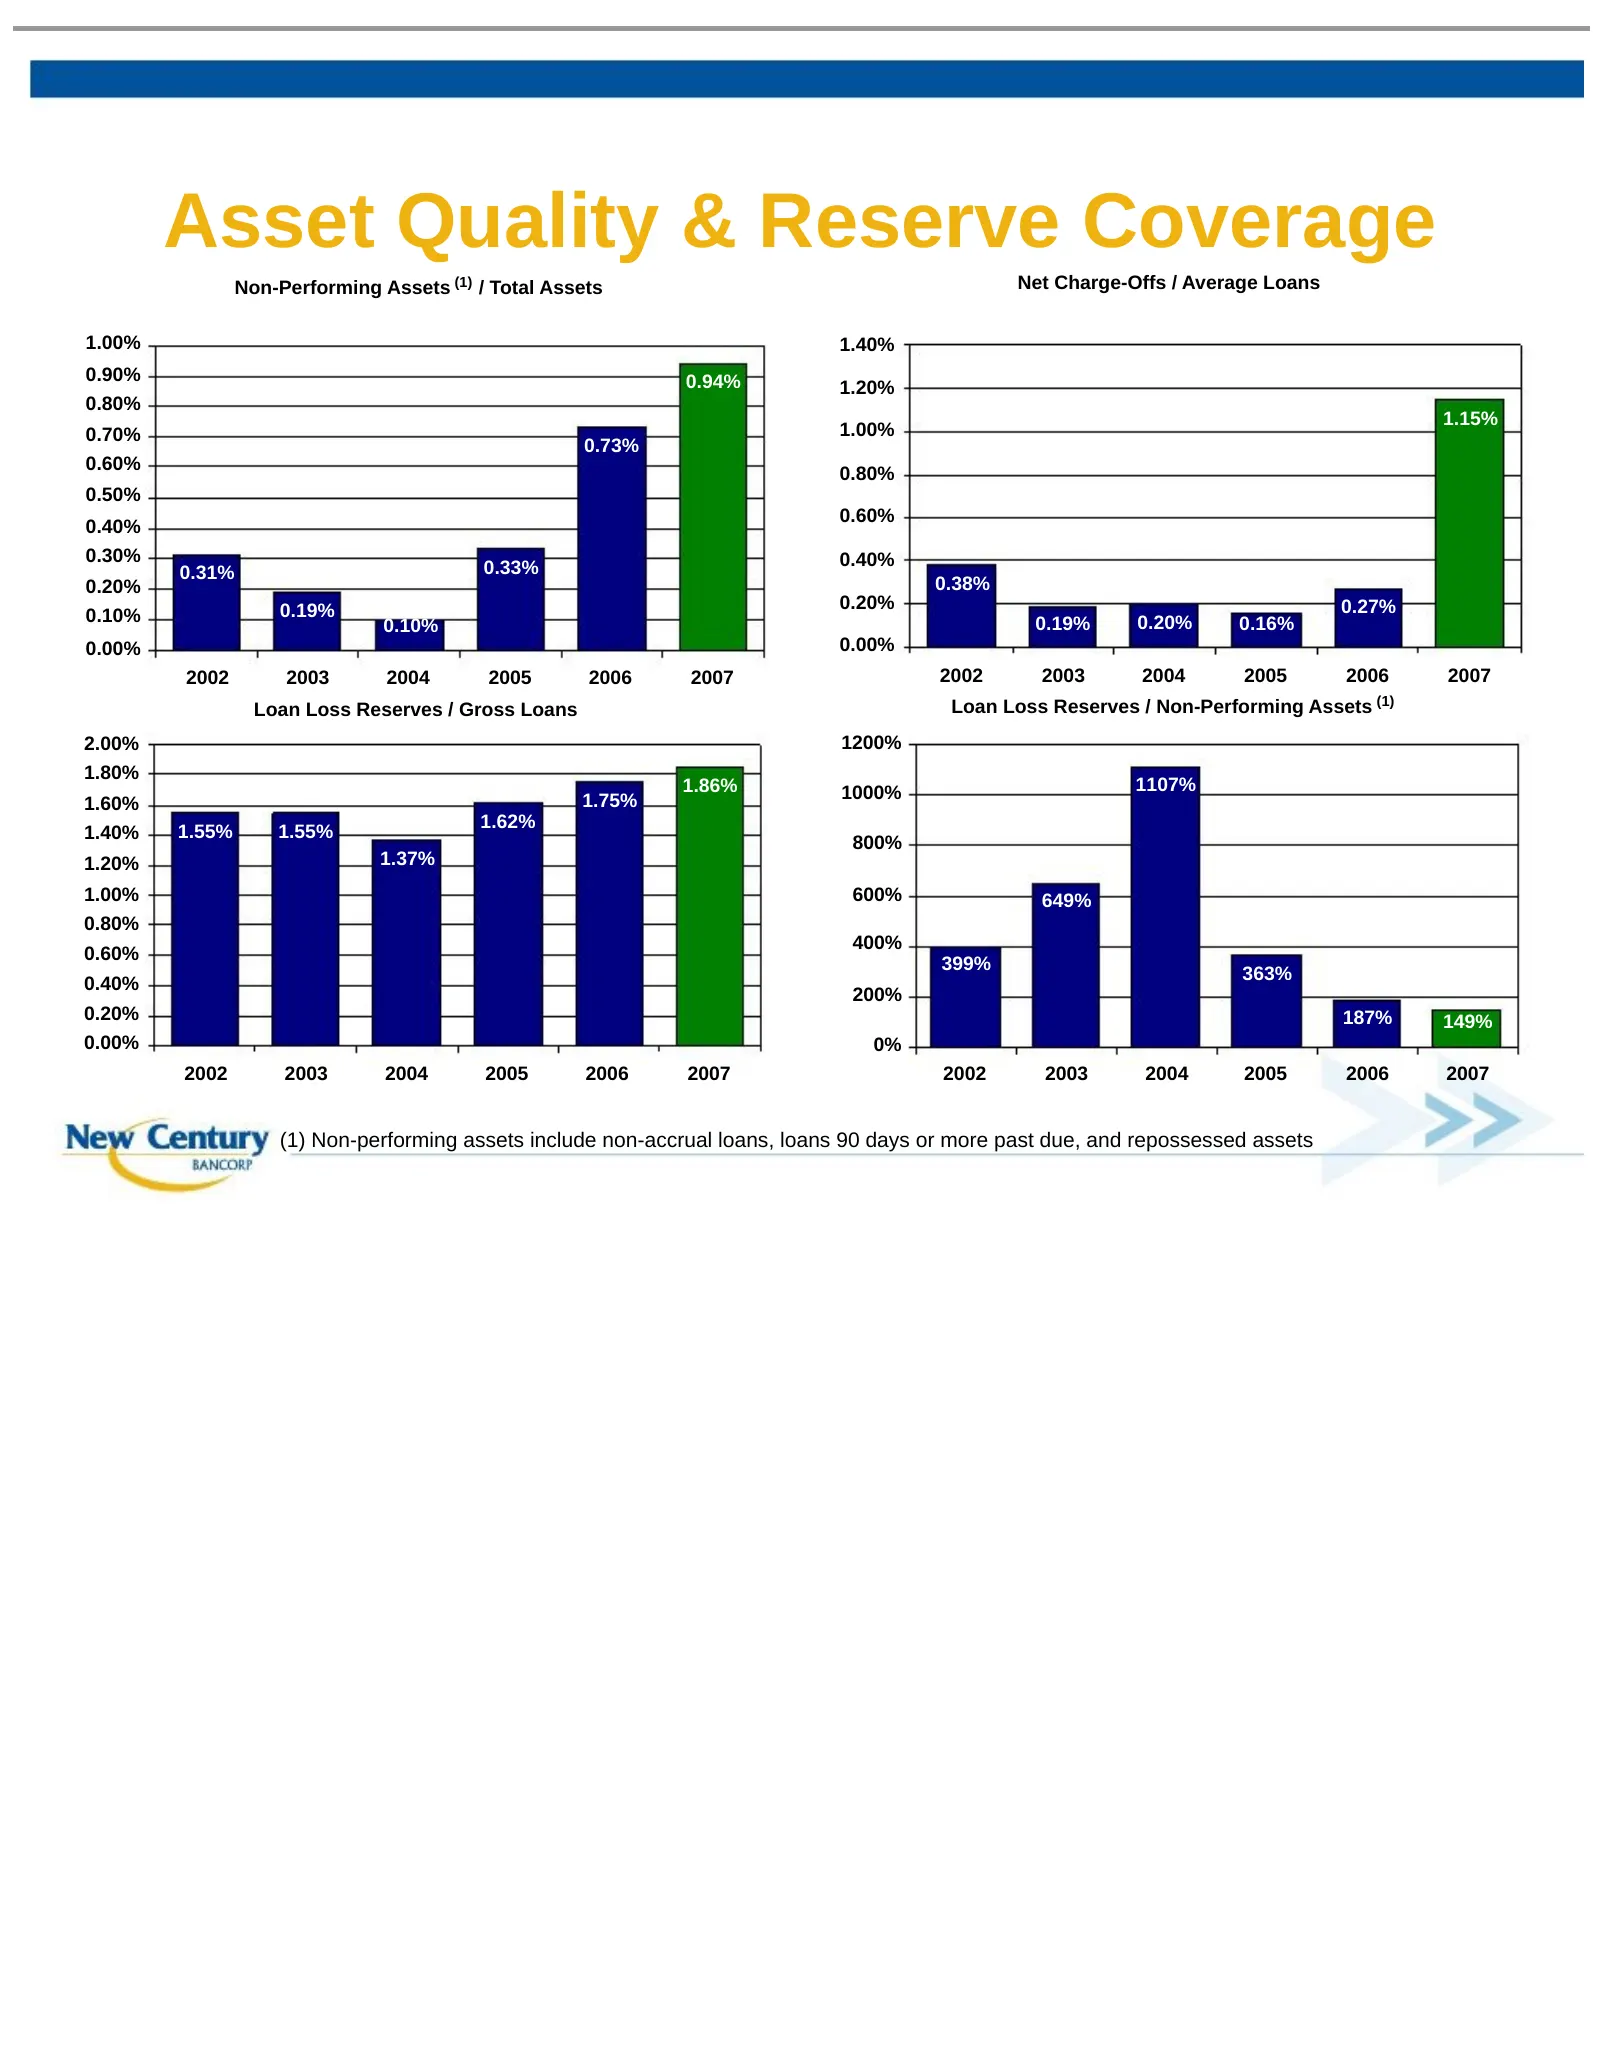
Asset Quality & Reserve Coverage Non-Performing Assets (1) / Total Assets Net Charge-Offs / Average Loans 1.00% 1.40% 0.90% 0.94% 1.20% 0.80% 1.15% 0.70% 1.00% 0.73% 0.60% 0.80% 0.50% 0.60% 0.40% 0.30% 0.40% 0.31% 0.33% 0.20% 0.38% 0.19% 0.20% 0.27% 0.10% 0.10% 0.19% 0.20% 0.16% 0.00% 0.00% 2002 200
Slide 15: Earnings Growth
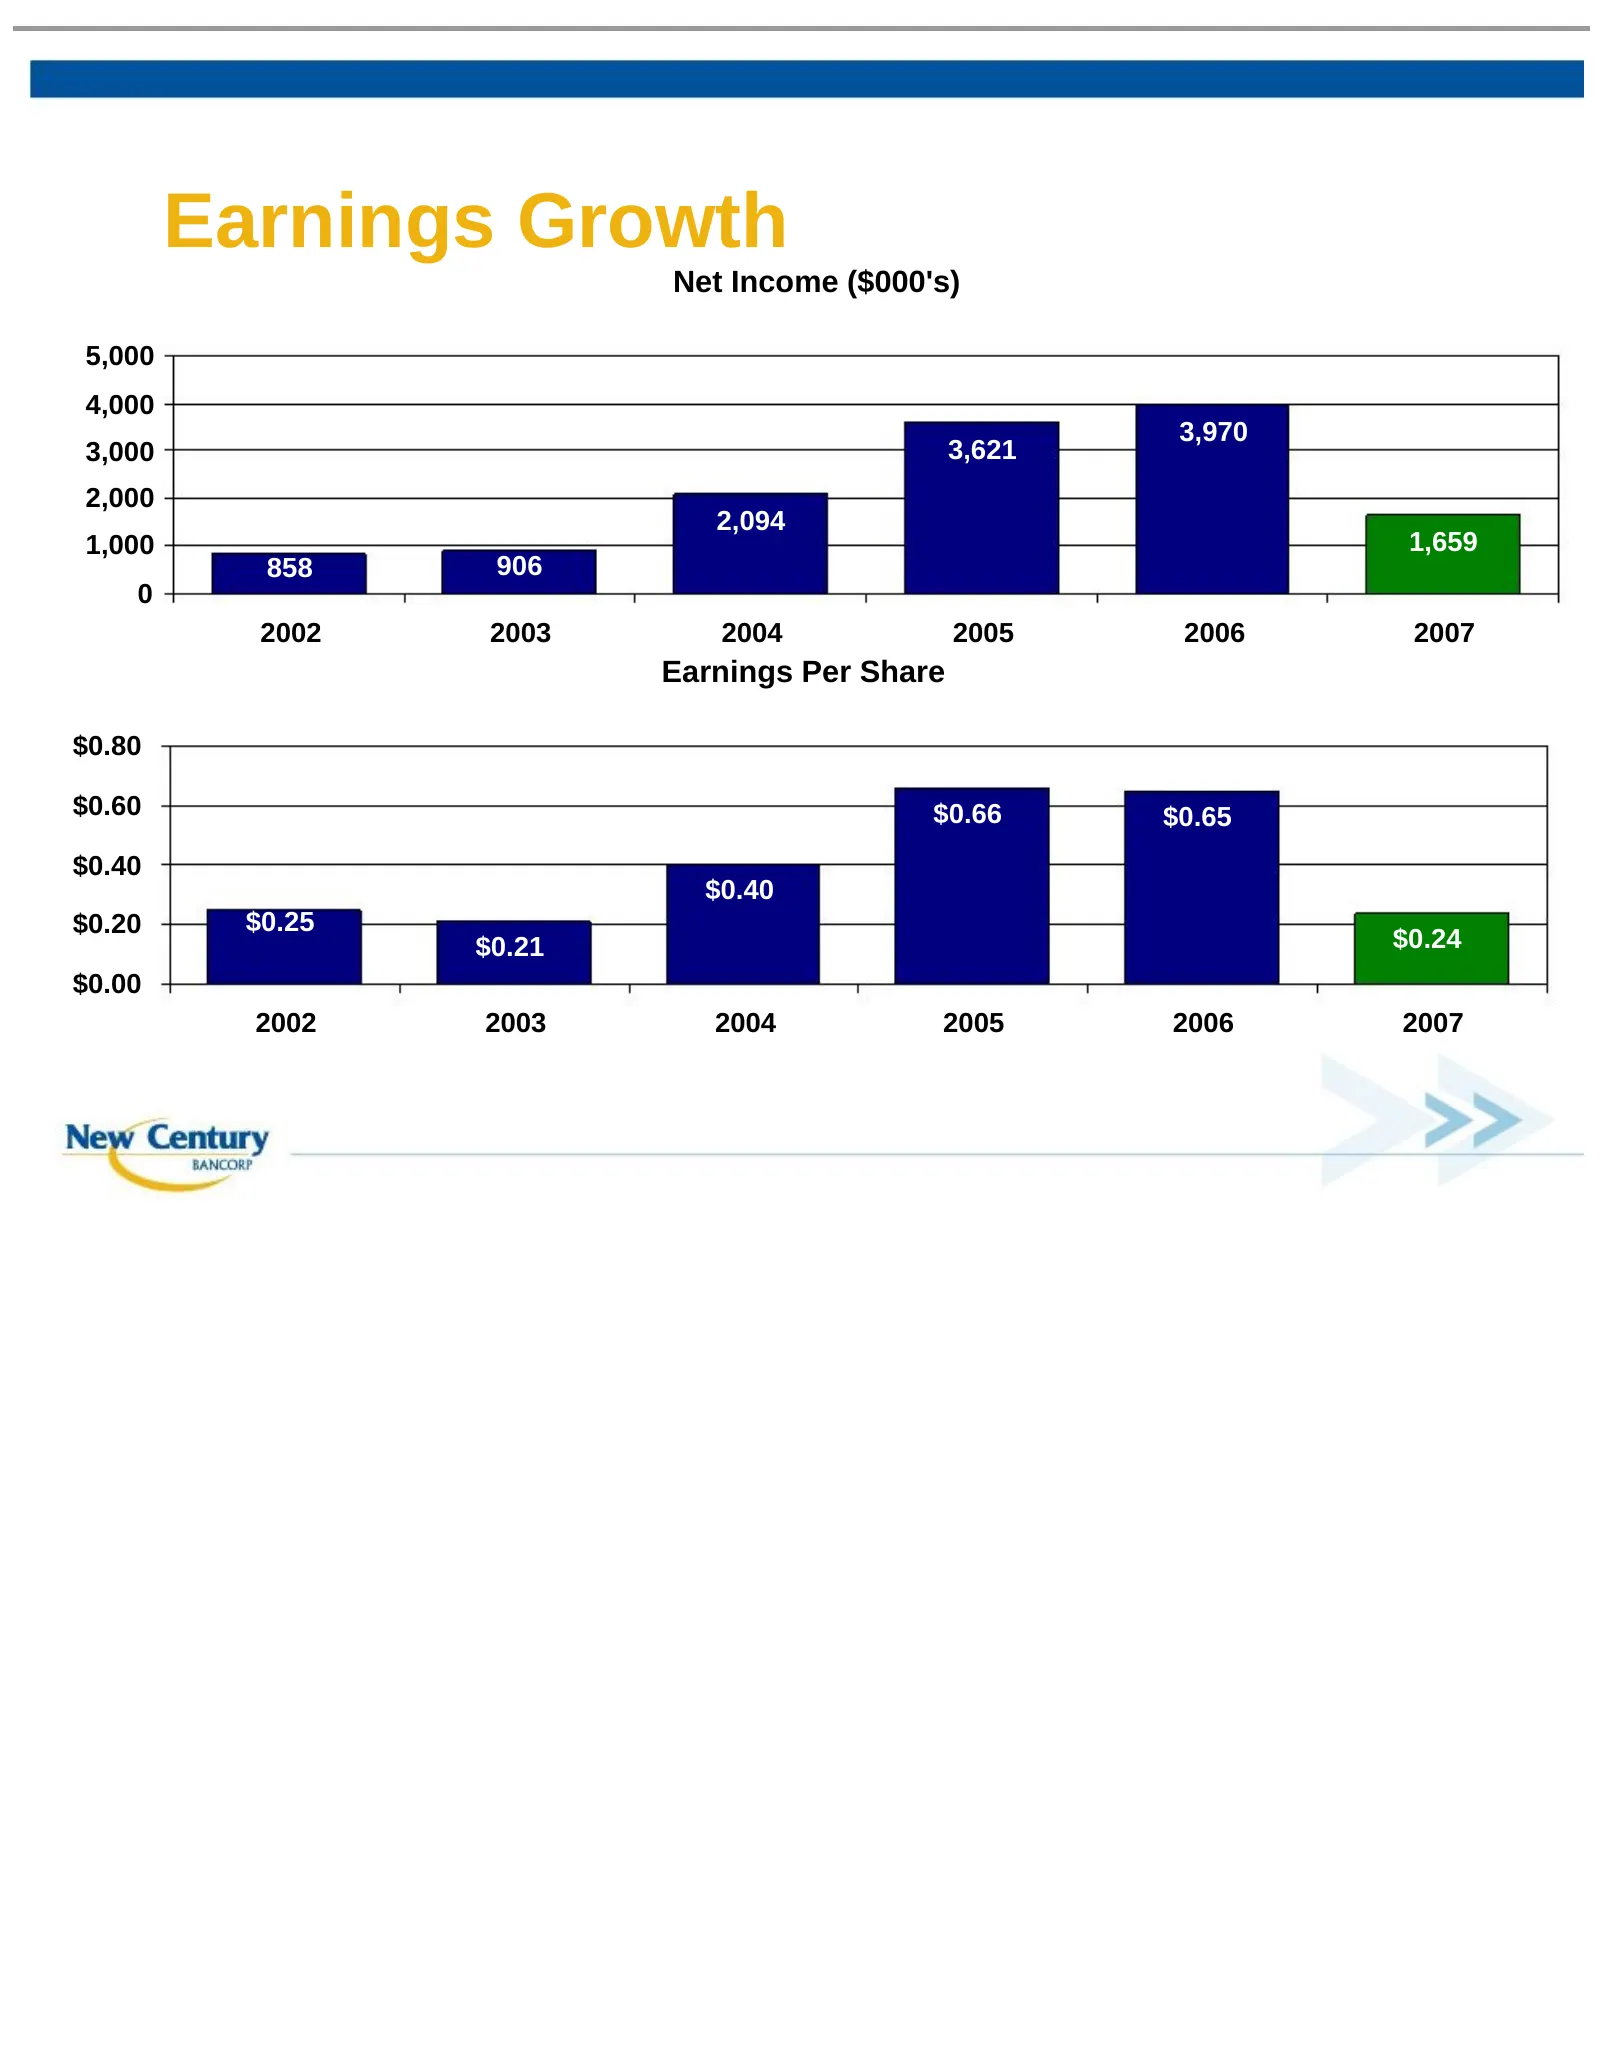
Earnings Growth Net Income ($000's) 5,000 4,000 3,970 3,000 3,621 2,000 2,094 1,000 1,659 858 906 0 2002 2003 2004 2005 2006 2007 Earnings Per Share $0.80 $0.60 $0.66 $0.65 $0.40 $0.40 $0.20 $0.25 $0.21 $0.24 $0.00 2002 2003 2004 2005 2006 2007
Slide 16: Profitability
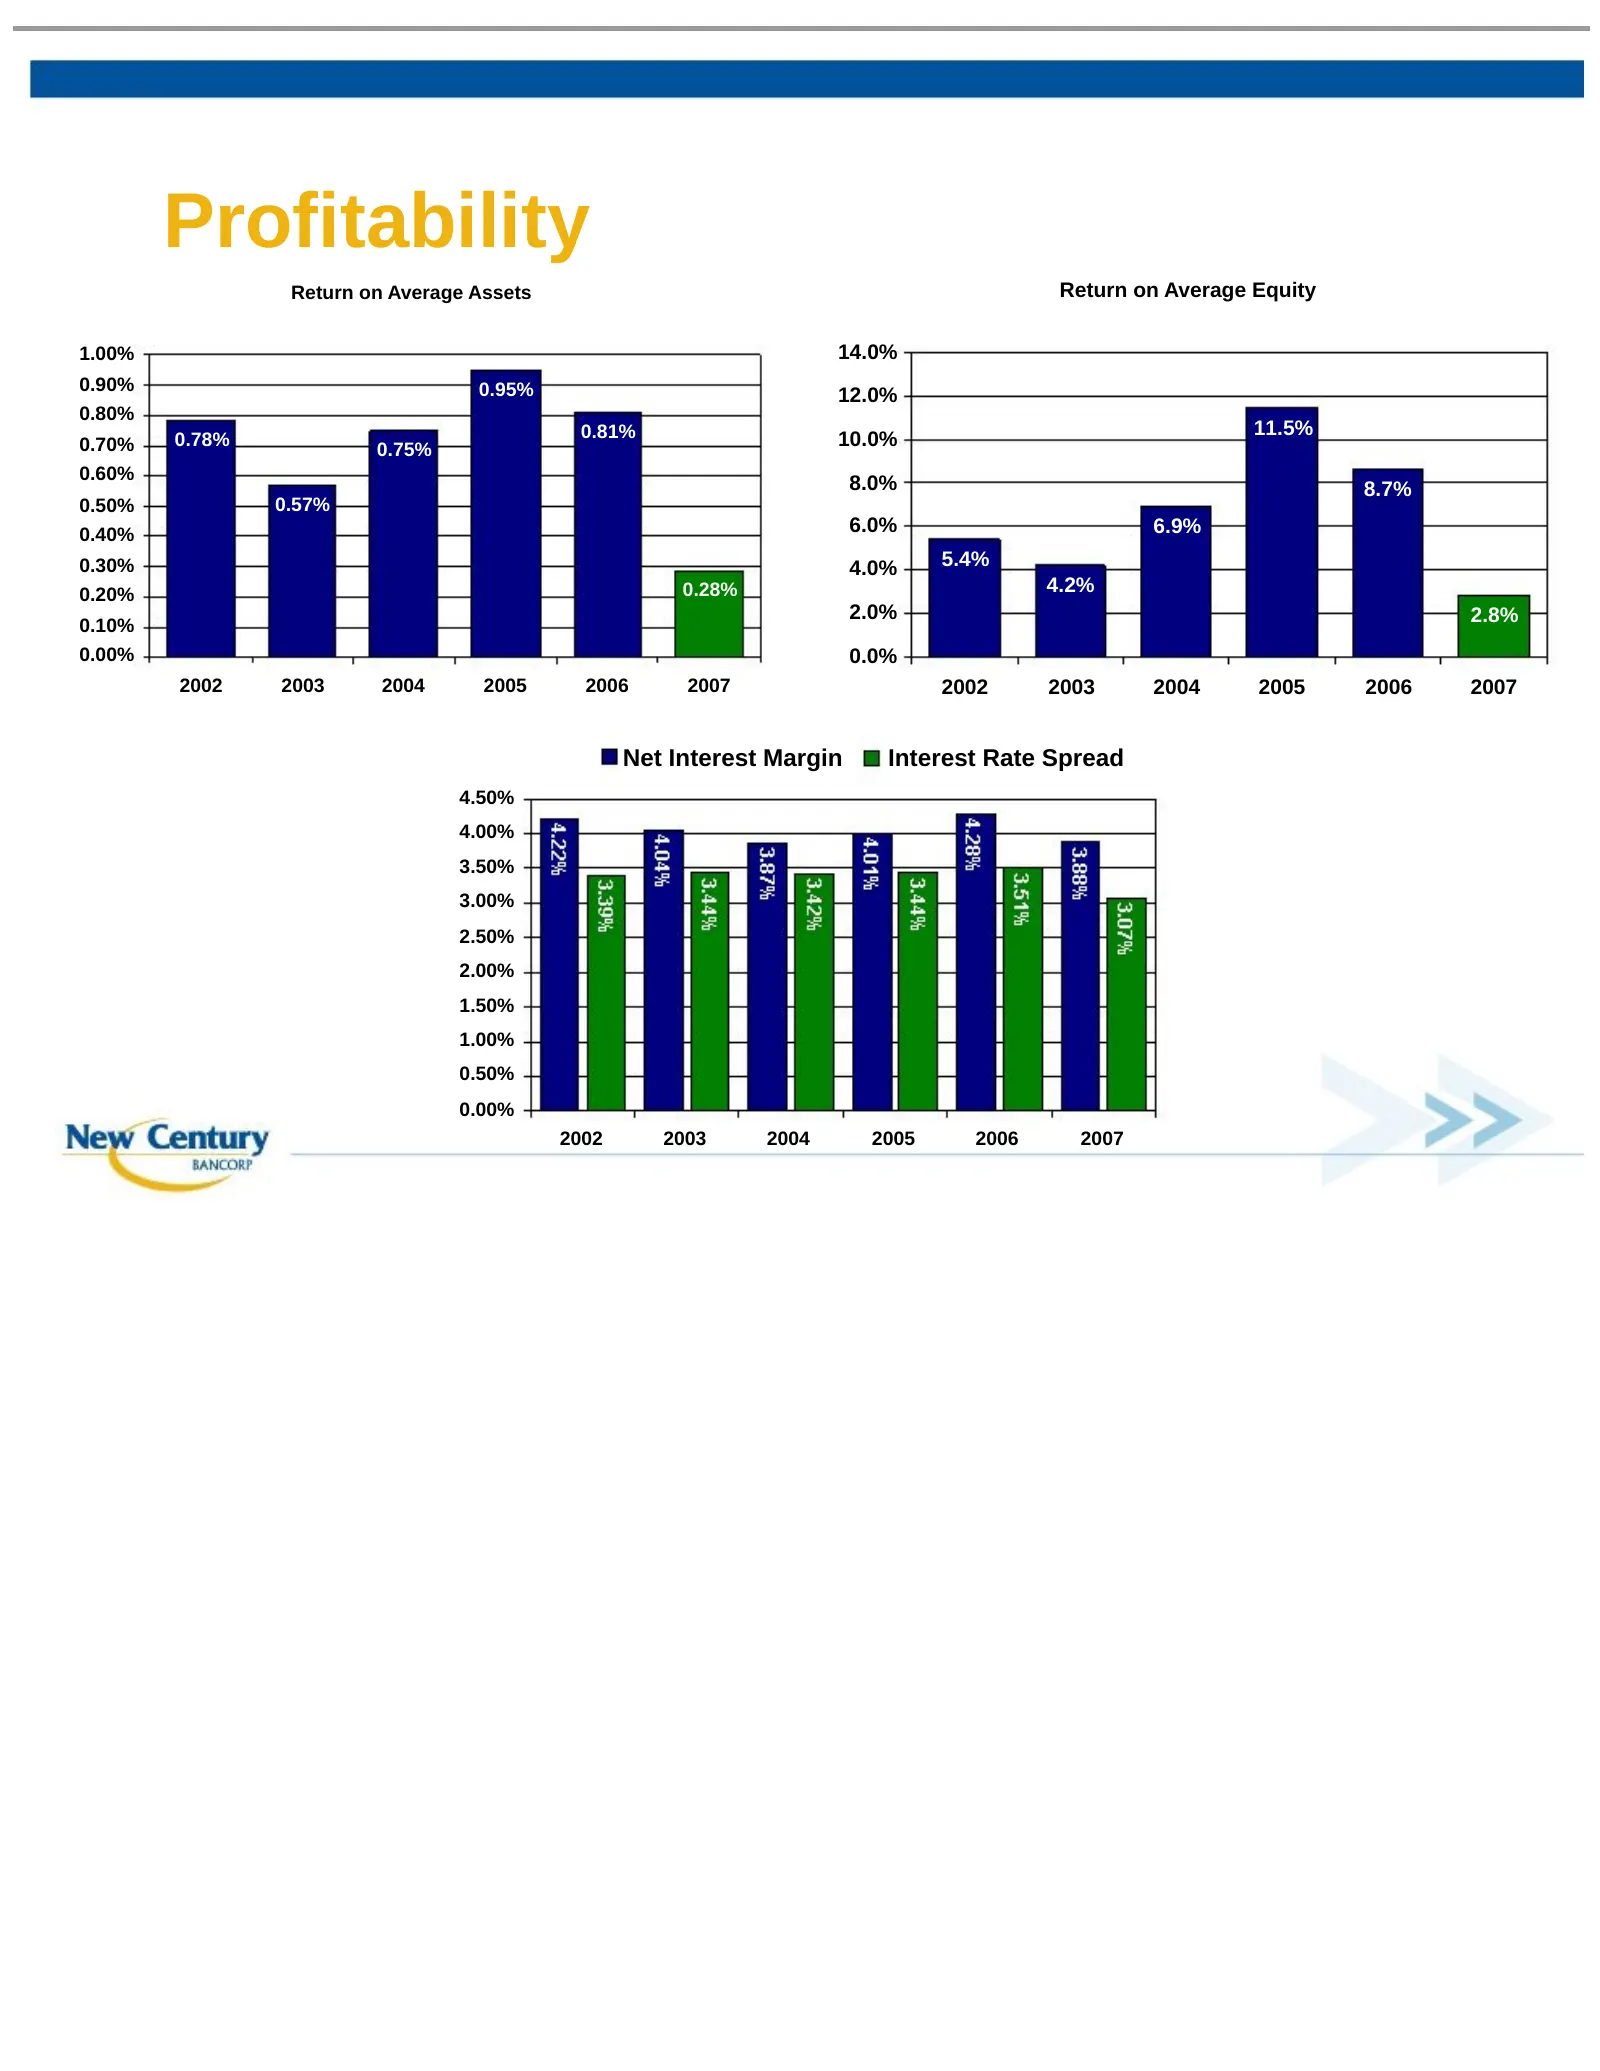
Profitability Return on Average Assets Return on Average Equity 1.00% 14.0% 0.90% 0.95% 12.0% 0.80% 0.81% 11.5% 0.70% 0.78% 0.75% 10.0% 0.60% 8.0% 8.7% 0.50% 0.57% 0.40% 6.0% 6.9% 0.30% 4.0% 5.4% 0.20% 0.28% 4.2% 2.0% 2.8% 0.10% 0.00% 0.0% 2002 2003 2004 2005 2006 2007 2002 2003 2004 2005 2006 2007
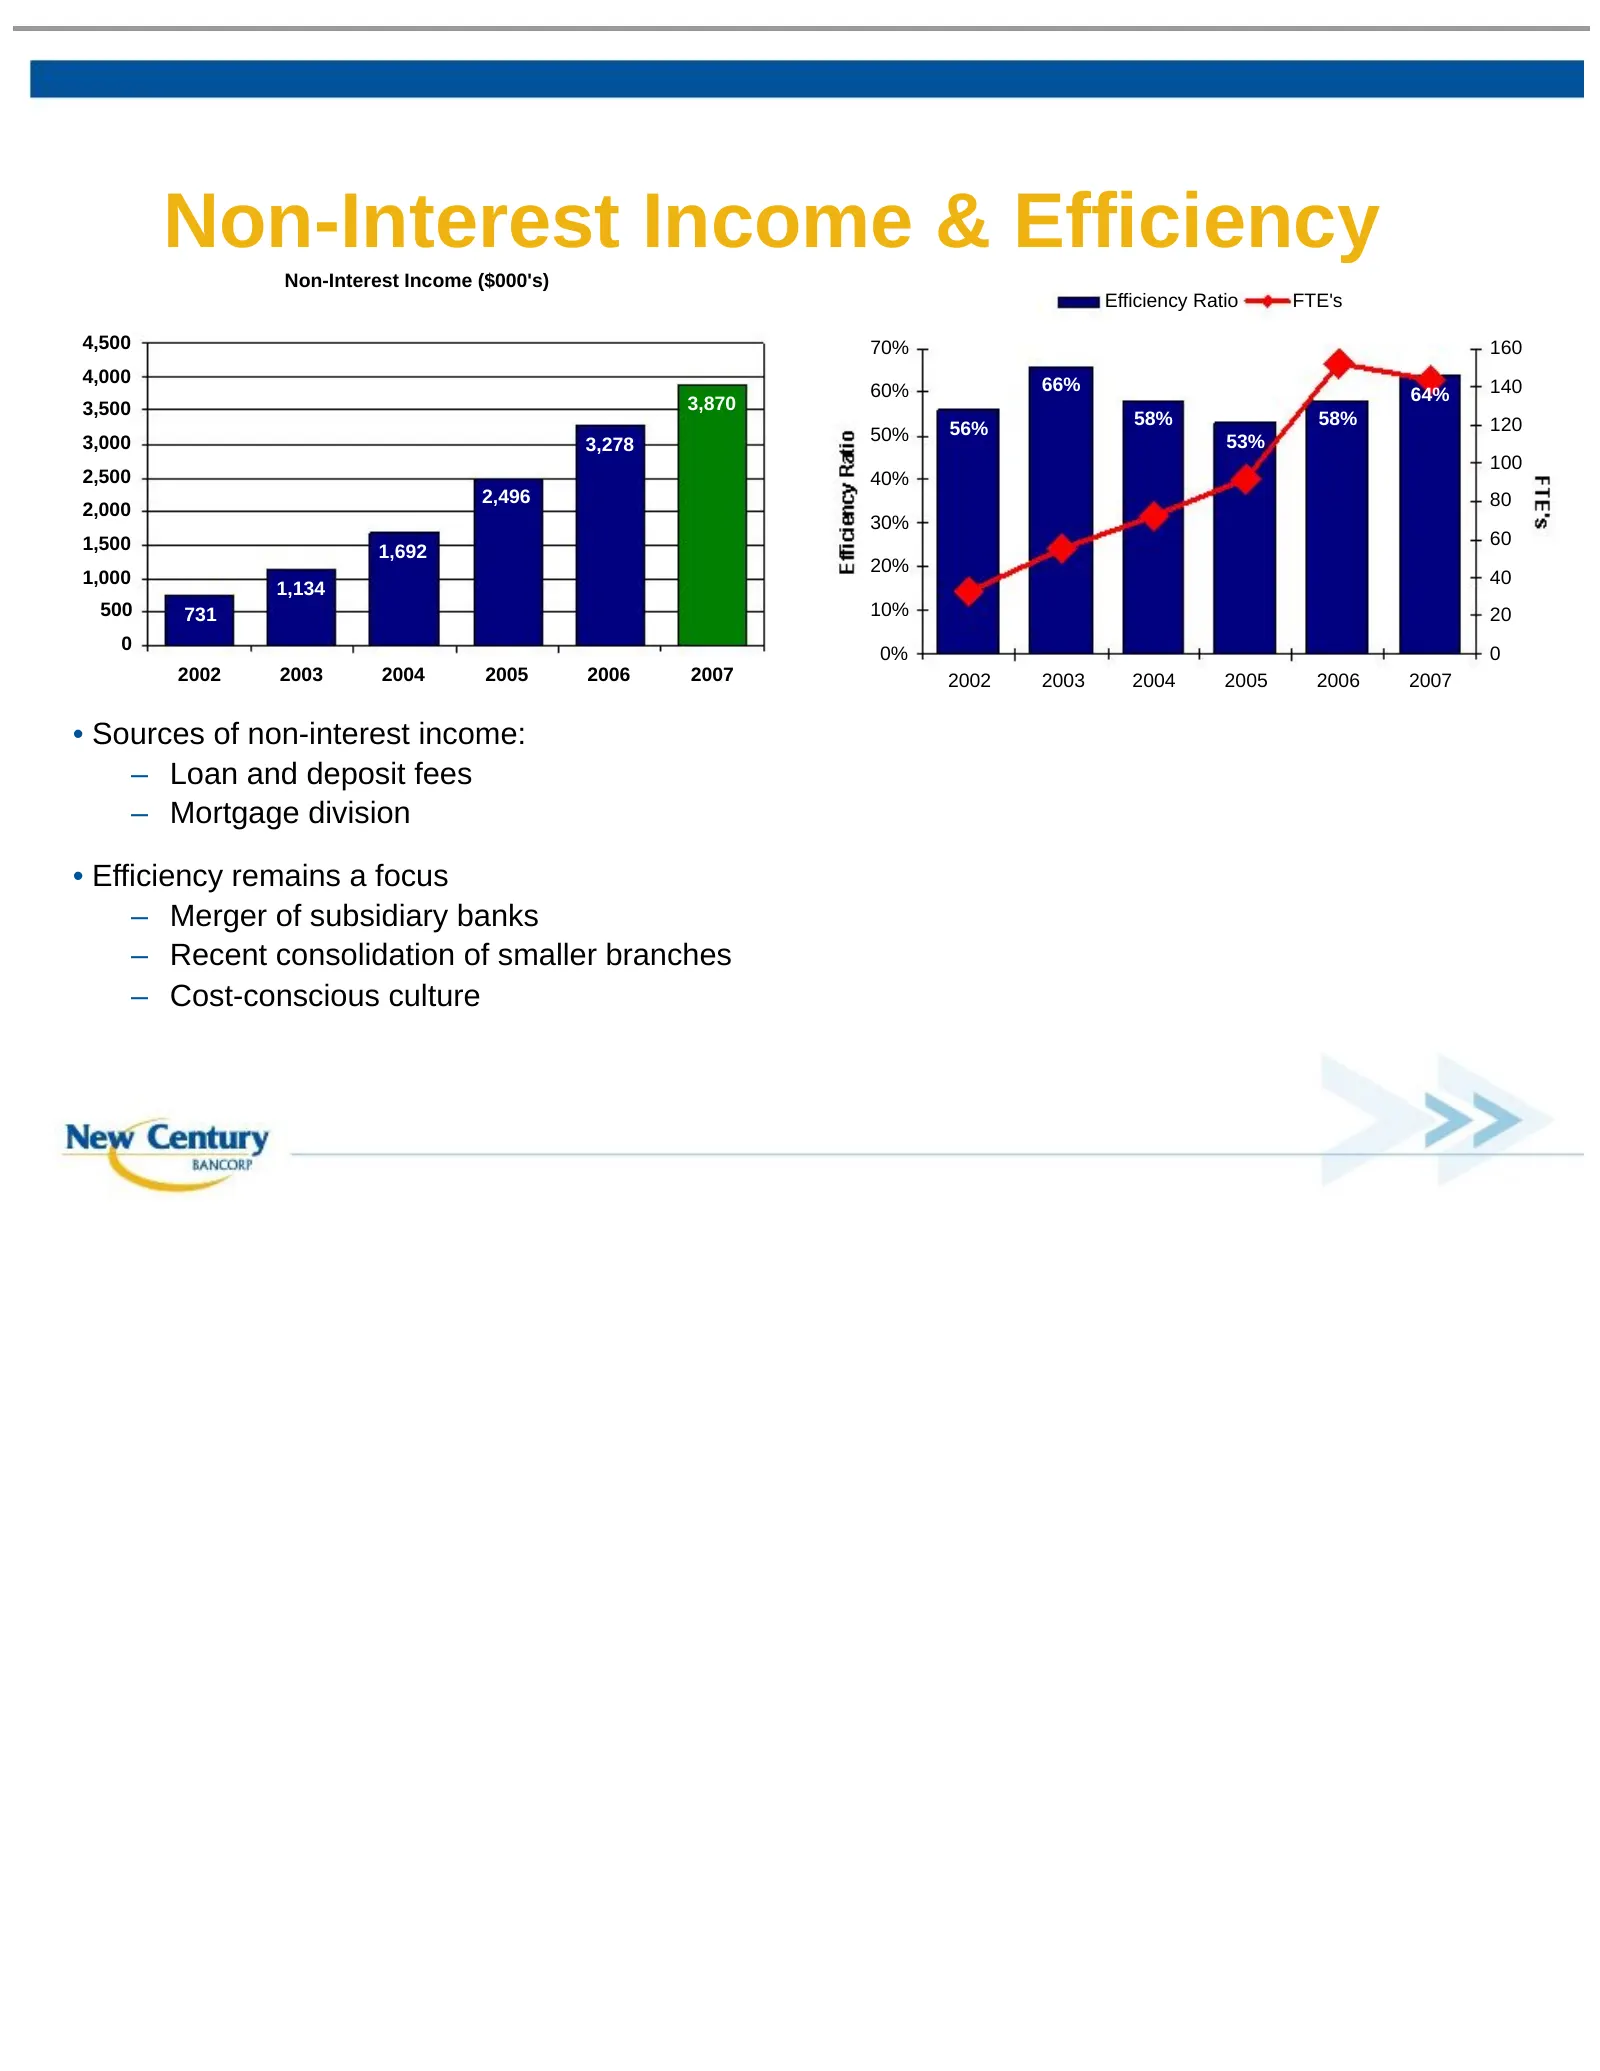
Slide 17: Non-Interest Income & Efficiency
Non-Interest Income & Efficiency Non-Interest Income ($000's) Efficiency Ratio FTE's 4,500 70% 160 4,000 66% 140 60% 64% 3,500 3,870 58% 58% 120 50% 56% 3,000 3,278 53% 100 2,500 40% 2,496 80 2,000 30% 1,500 60 1,692 20% 1,000 40 1,134 500 731 10% 20 0 0% 0 2002 2003 2004 2005 2006 2007 2002 2003 20
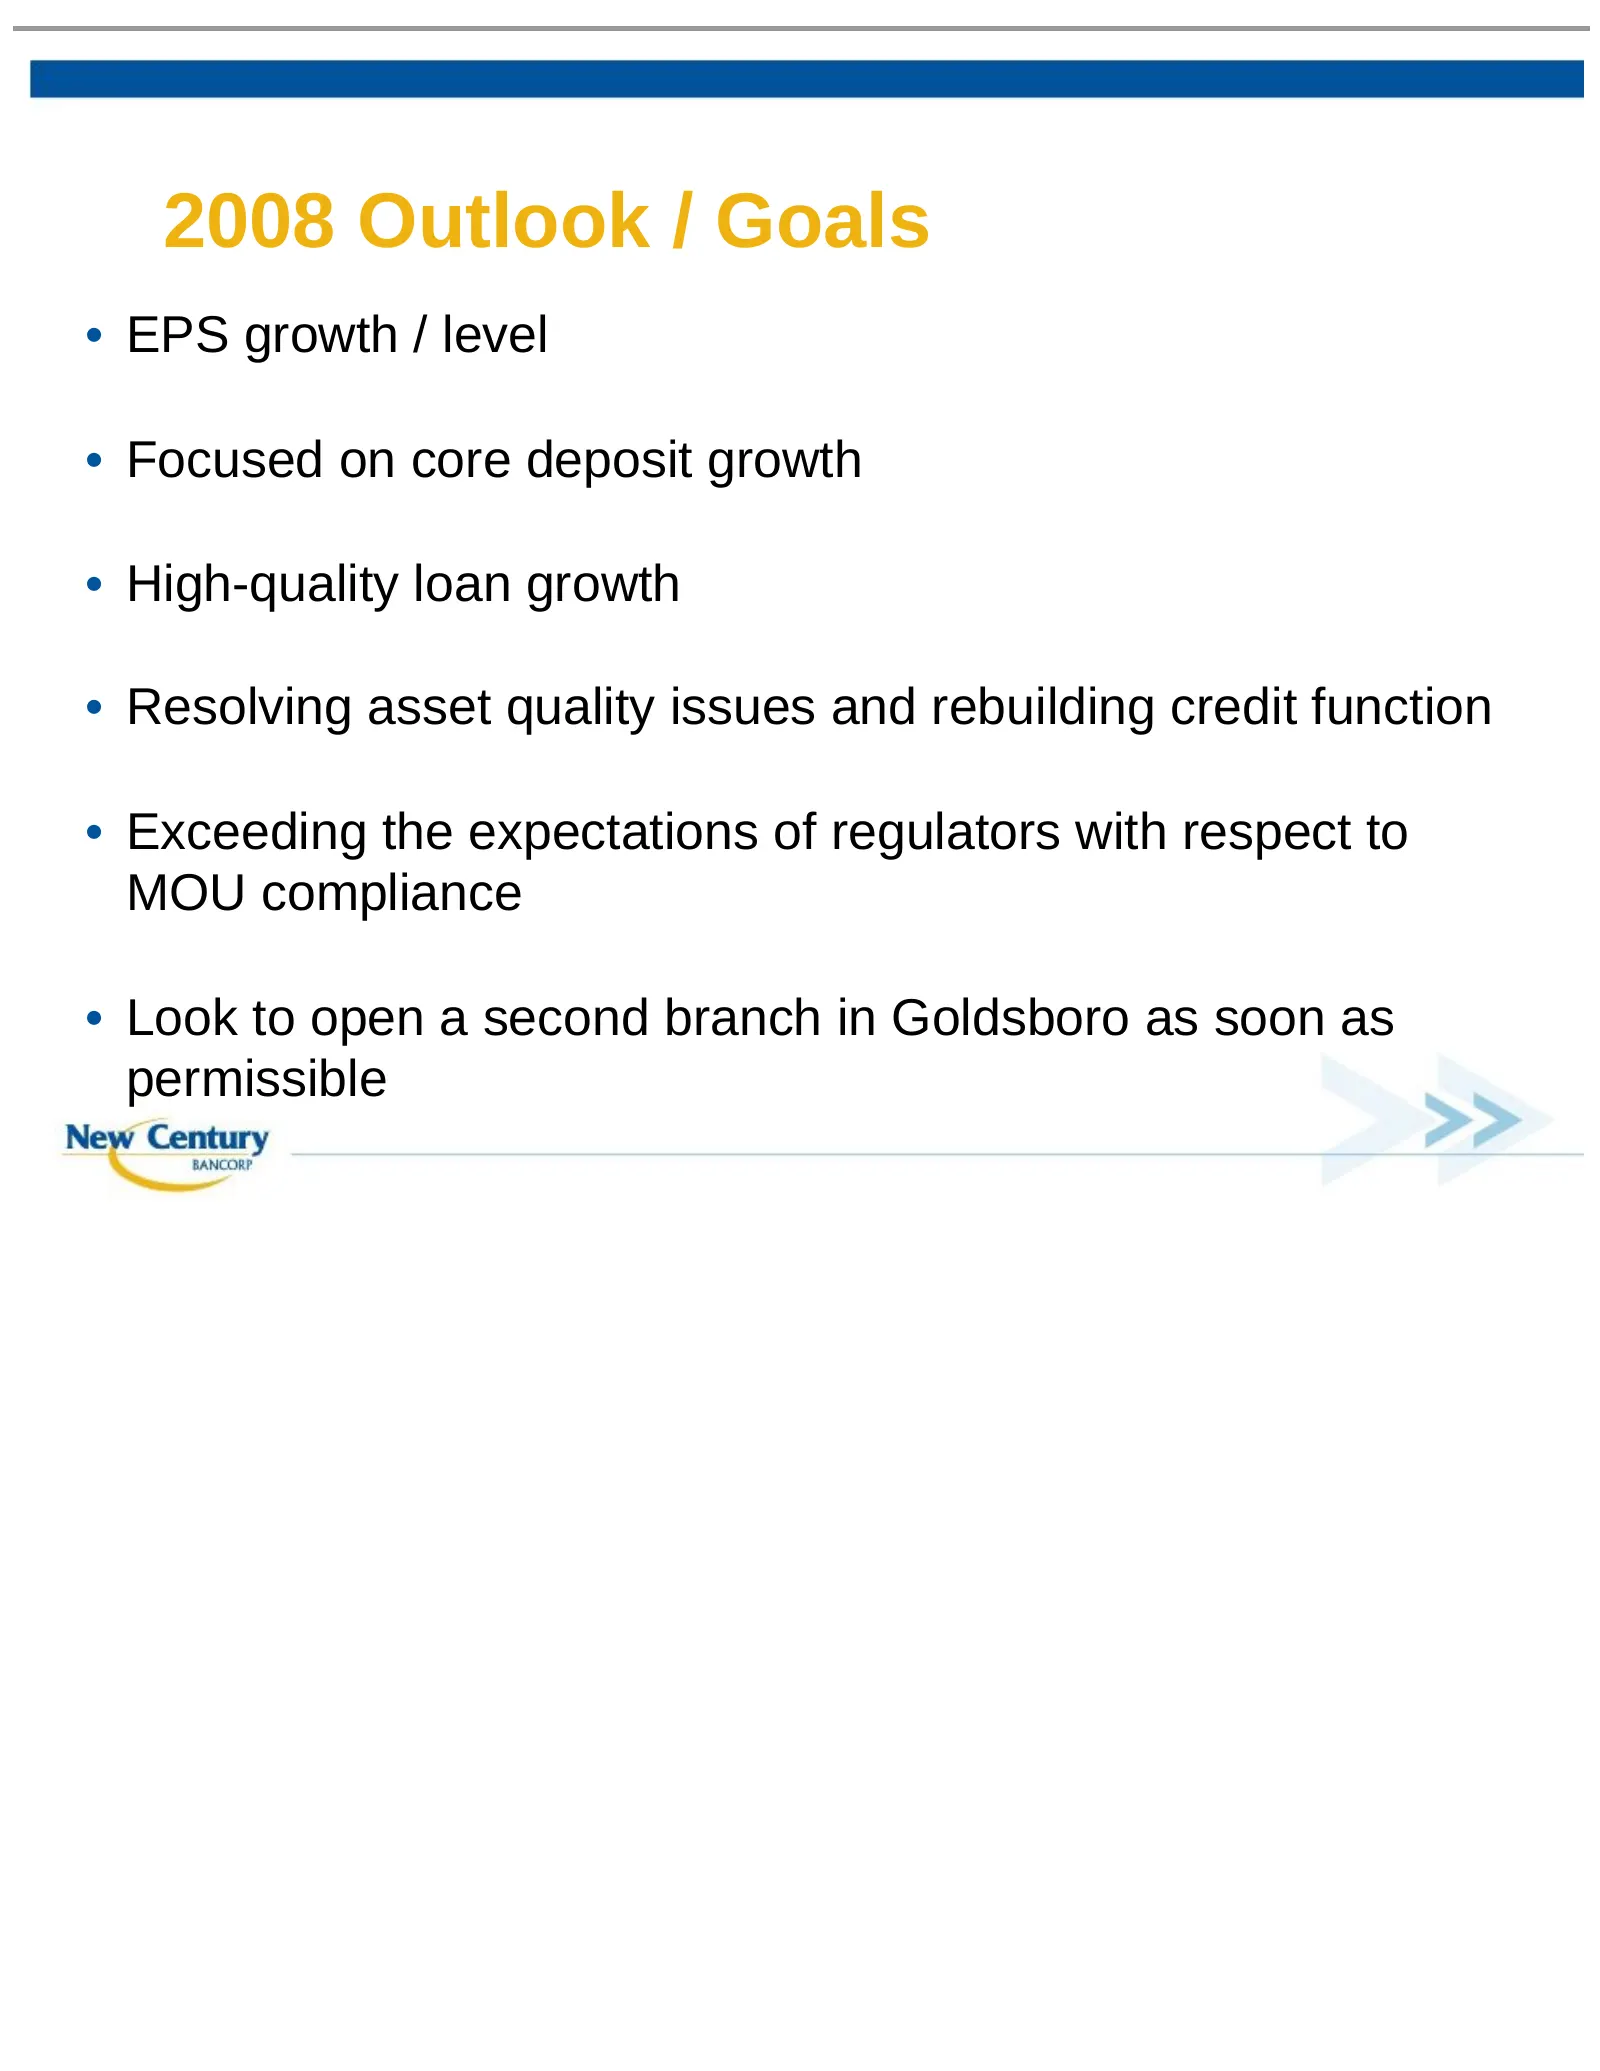
Slide 18: 2008 Outlook / Goals
2008 Outlook / Goals • EPS growth / level • Focused on core deposit growth • High-quality loan growth • Resolving asset quality issues and rebuilding credit function • Exceeding the expectations of regulators with respect to MOU compliance • Look to open a second branch in Goldsboro as soon as permi
Source: SEC EDGAR · 8-K filed Apr 14, 2008
More decks from Select Bancorp Inc
 Merger or Acquisition (June 2021)13 slides · Jun 1, 2021
 Shareholder Meeting (May 2021)17 slides · May 25, 2021
 Investor Presentation (February 2021)23 slides · Feb 3, 2021
 Investor Presentation (November 2020)23 slides · Nov 12, 2020
 Investor Presentation (September 2020)23 slides · Sep 21, 2020
 Shareholder Meeting (May 2020)17 slides · May 19, 2020