NeoGenomics, Inc. · NASDAQ:NEO
NeoGenomics — Investor Presentation (November 2011)
19 slides from NeoGenomics's investor presentation, November 2011
Slide 1: Company Overview Presentation
OTCBB: NGNM Time Matters. Results Count Company Overview Presentation November 2011 1
Slide 2: Forward-looking Statements
Forward-looking Statements This presentation contains statements which constitute forward-looking statements within the meaning of Section 27A of the Securities Act, as amended; Section 21E of the Securities Exchange Act of 1934; and the Private Securities Litigation Reform Act of 1995. The words “m
Slide 3: Investment Highlights
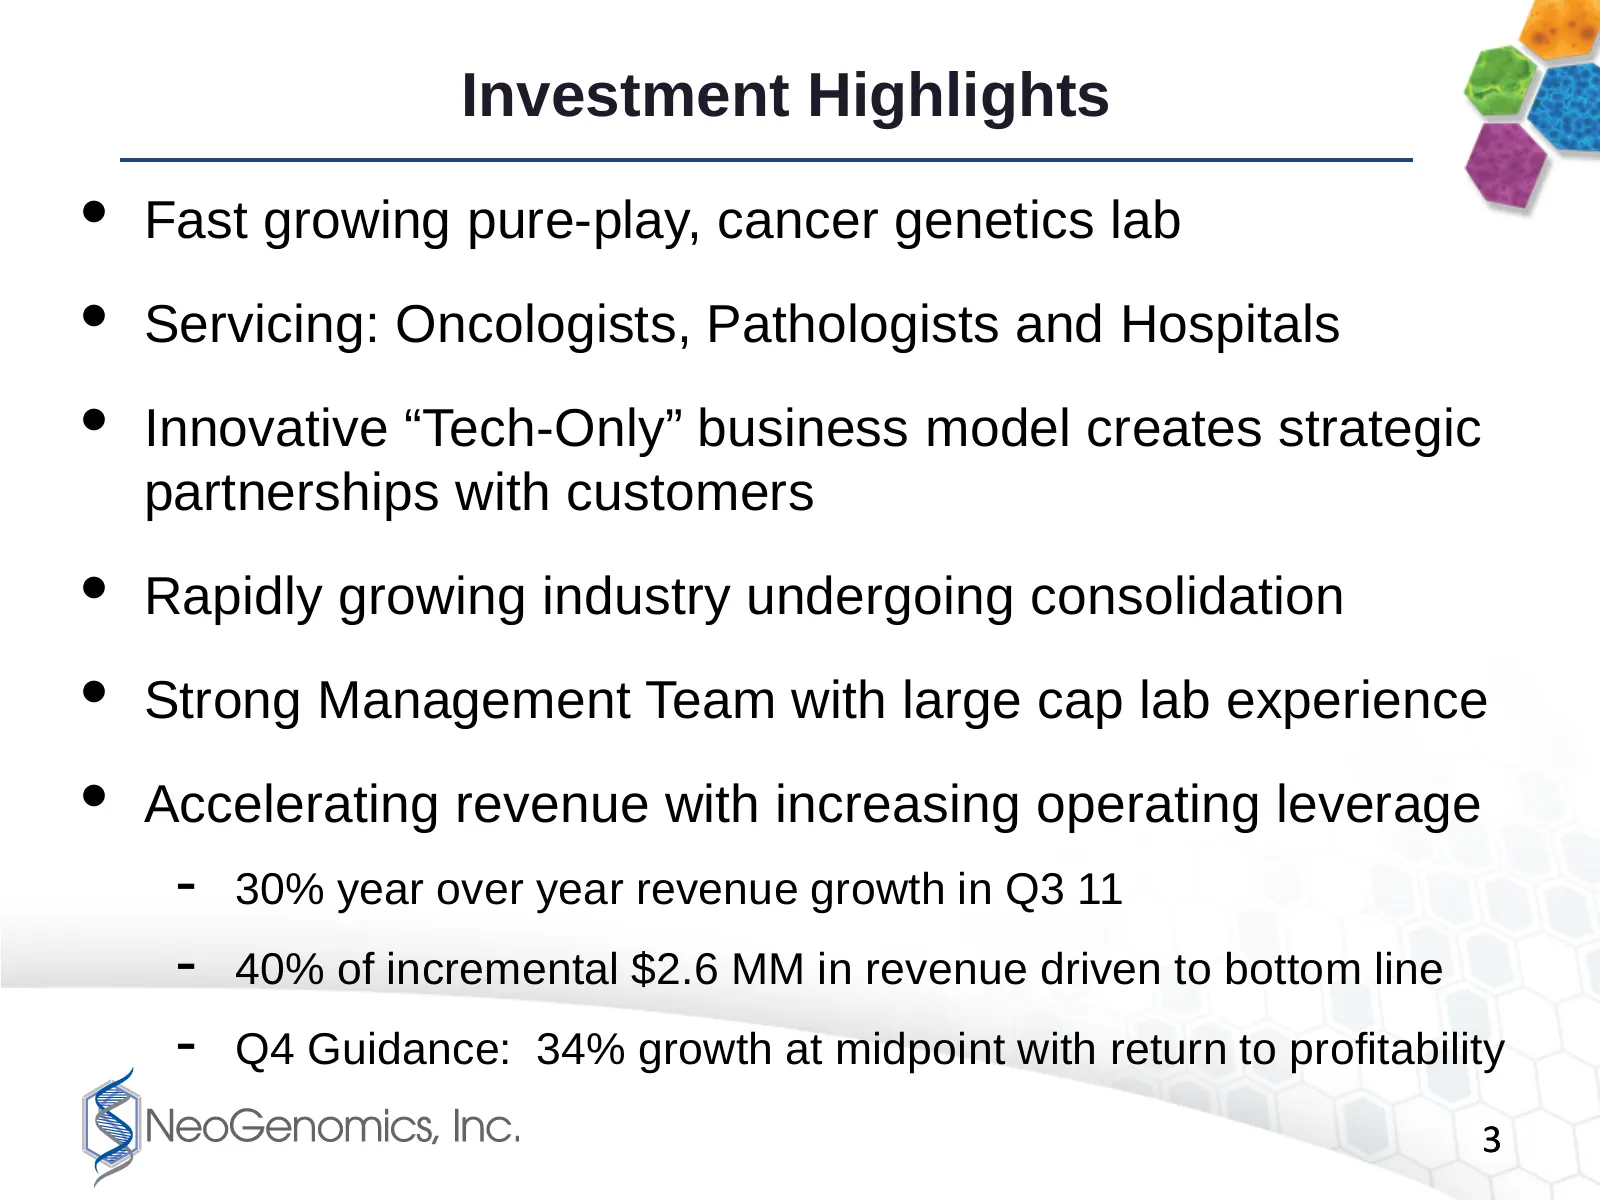
Investment Highlights • Fast growing pure-play, cancer genetics lab • Servicing: Oncologists, Pathologists and Hospitals • Innovative “Tech-Only” business model creates strategic partnerships with customers • Rapidly growing industry undergoing consolidation • Strong Management Team with large cap l
Slide 4: Consistent Historical Growth
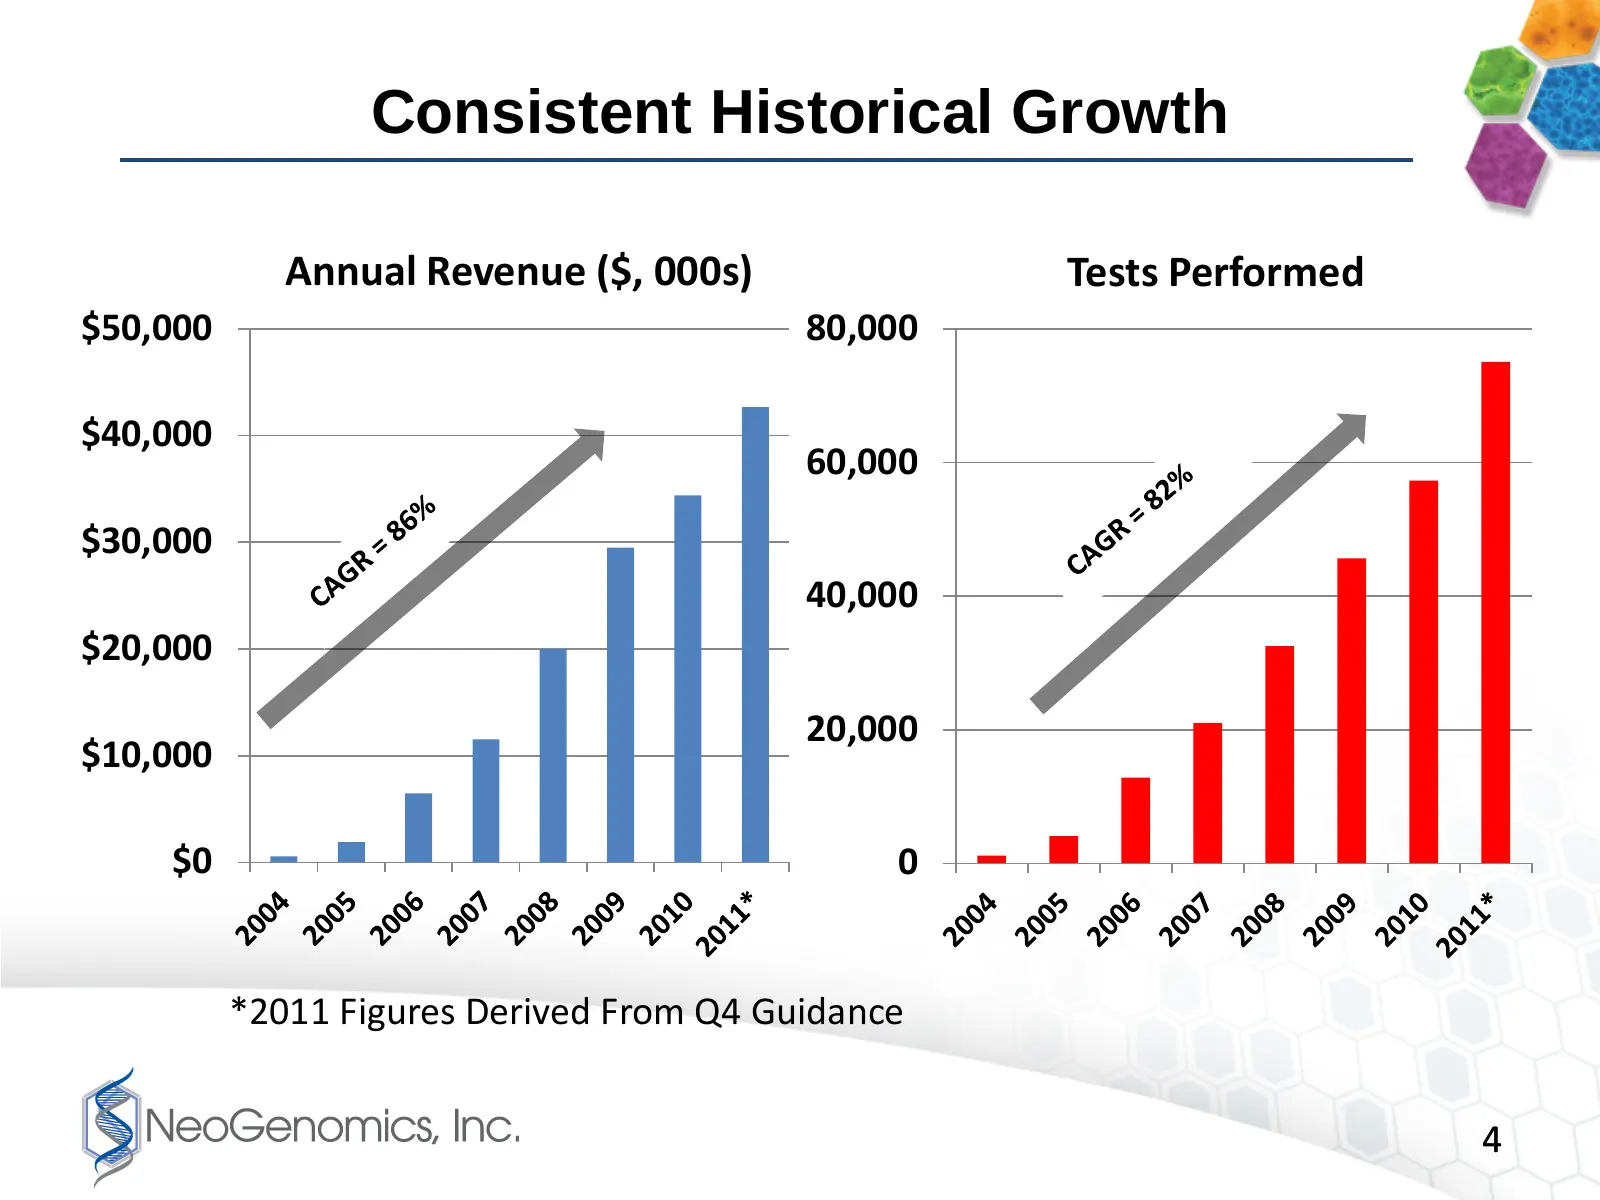
Consistent Historical Growth Annual Revenue ($, 000s) Tests Performed $50,000 80,000 $40,000 60,000 $30,000 40,000 $20,000 20,000 $10,000 $0 0 *2011 Figures Derived From Q4 Guidance 4
Slide 5: Business Model Targets Two Customer Groups
Business Model Targets Two Customer Groups Pathologists and Hospital Path Groups: “Tech only” • Innovative technical component-only services – Flow, FISH, IHC • Enables community pathologists to compete with large labs • Rapid turnaround-time and web-based reporting • Extensive training programs Onc
Slide 6: Key Growth Drivers
Key Growth Drivers • Rapidly increasing sales force productivity • Penetration of increasingly larger customers • Tech-only model facilitates clinician office insourcing • Extensive and highly regarded education programs to train clients in “Genetic Pathology” • Increasing use of custom client inter
Slide 7: Strategic Supply Agreement with Abbott Labs
Strategic Supply Agreement with Abbott Labs • Allows NeoGenomics to develop and launch up to 3 Laboratory Developed Tests (“LDTs”) using Abbott IP • MelanoSITE - FISH-based test targeted at difficult to diagnose Melanoma cases was first - Launched in Q1 2010 - 84% Sensitivity and 98% Specificity - 1
Slide 8: Advanced Molecular Genetics Services
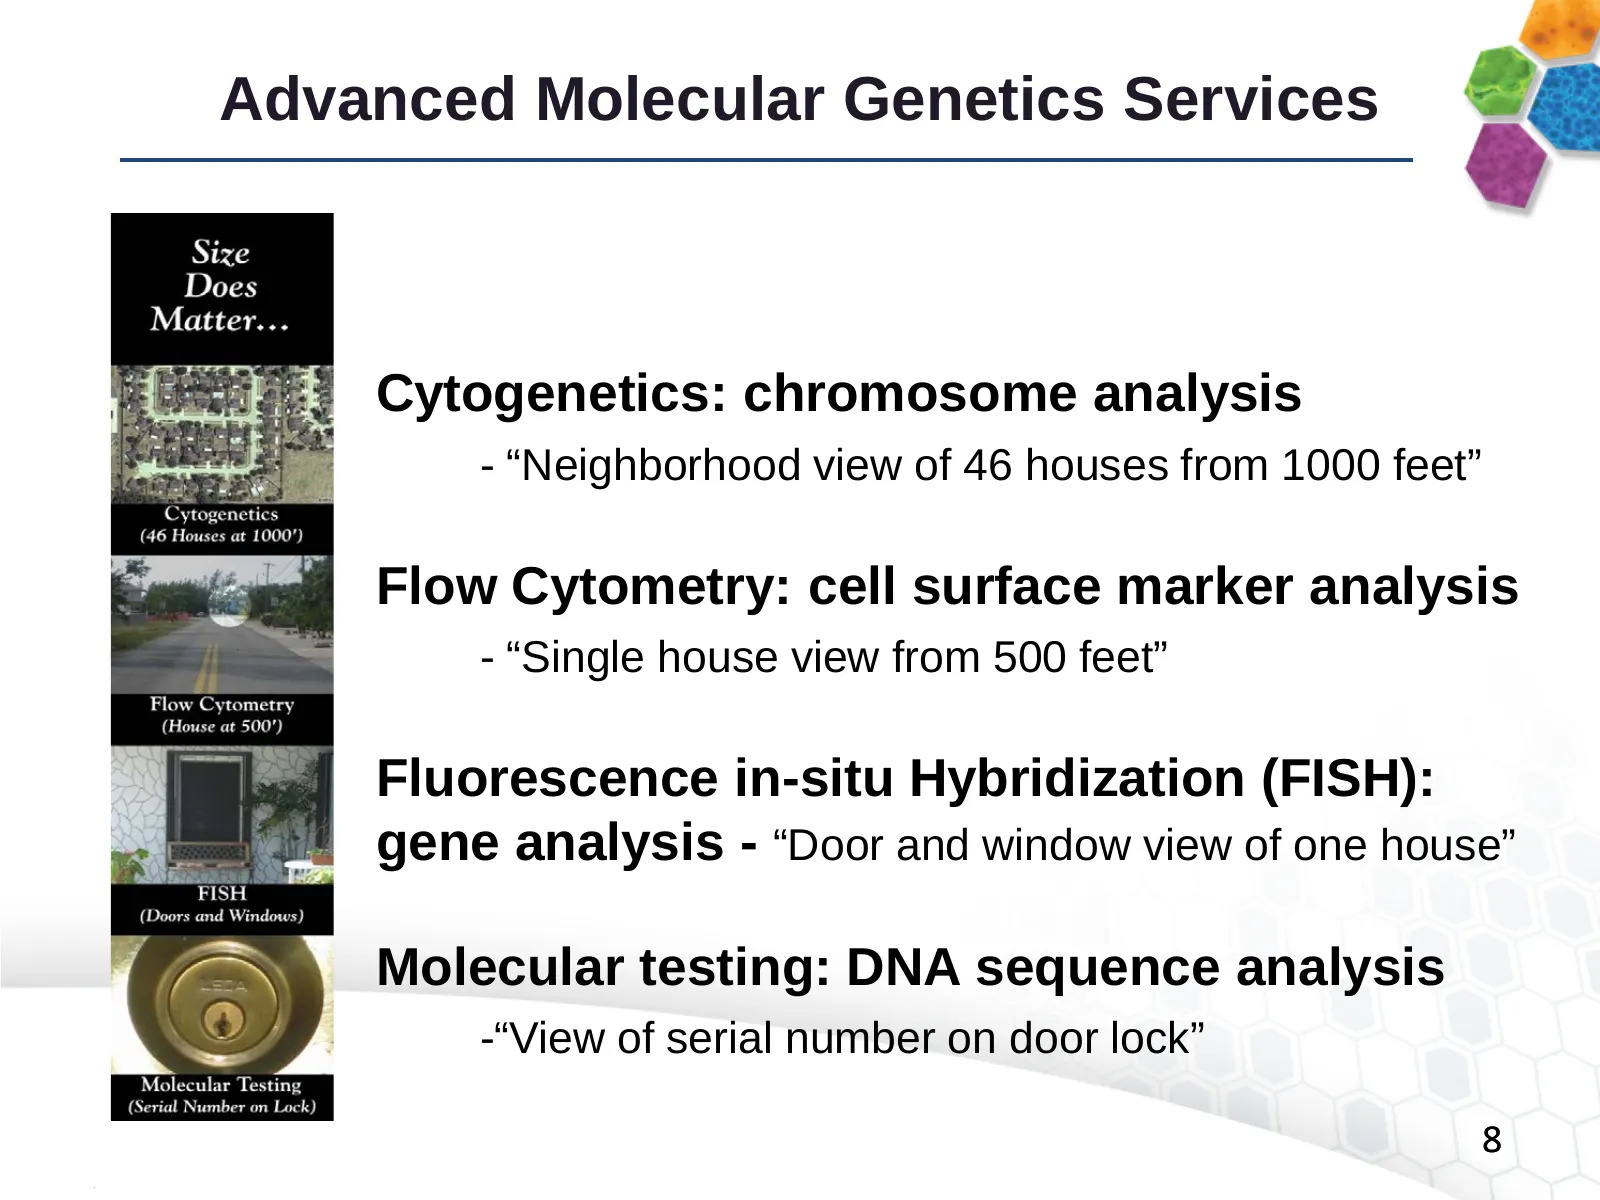
Advanced Molecular Genetics Services Cytogenetics: chromosome analysis - “Neighborhood view of 46 houses from 1000 feet” Flow Cytometry: cell surface marker analysis - “Single house view from 500 feet” Fluorescence in-situ Hybridization (FISH): gene analysis - “Door and window view of one house” Mol
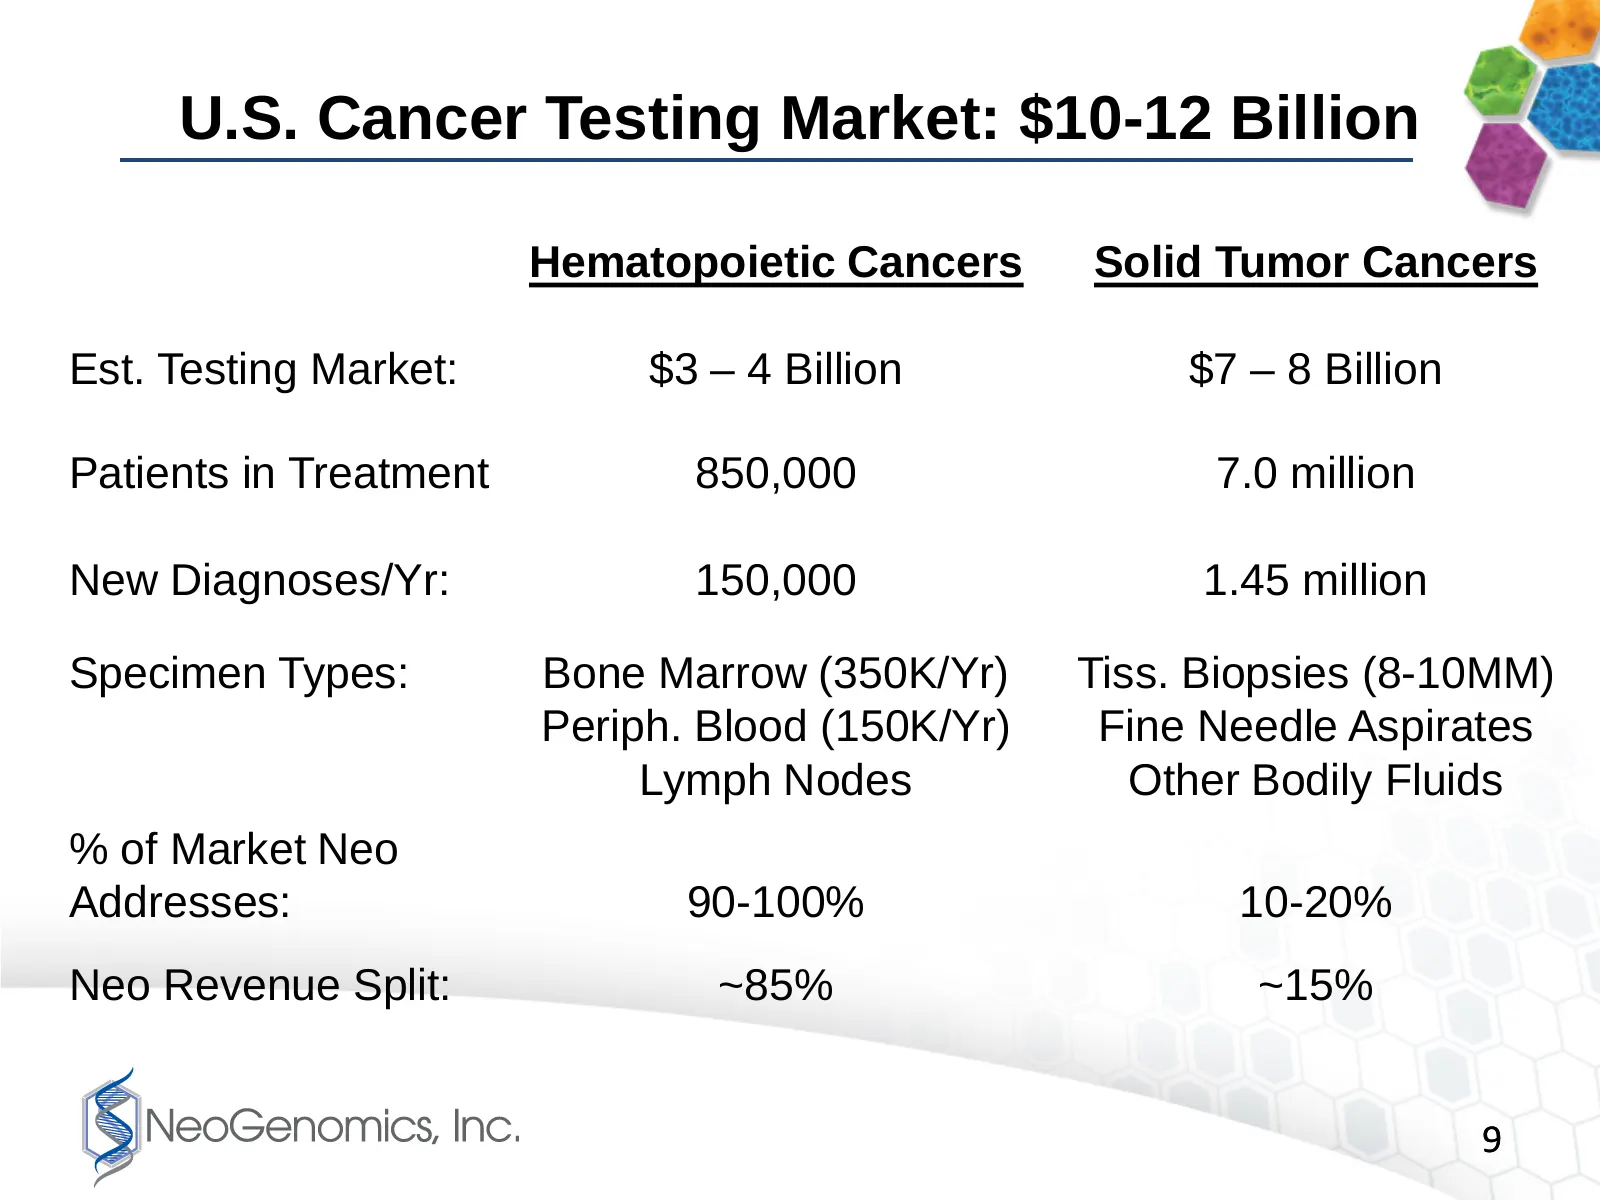
Slide 9: U.S. Cancer Testing Market: $10-12 Billion
U.S. Cancer Testing Market: $10-12 Billion Hematopoietic Cancers Solid Tumor Cancers Est. Testing Market: $3 – 4 Billion $7 – 8 Billion Patients in Treatment 850,000 7.0 million New Diagnoses/Yr: 150,000 1.45 million Specimen Types: Bone Marrow (350K/Yr) Tiss. Biopsies (8-10MM) Periph. Blood (150K/Y
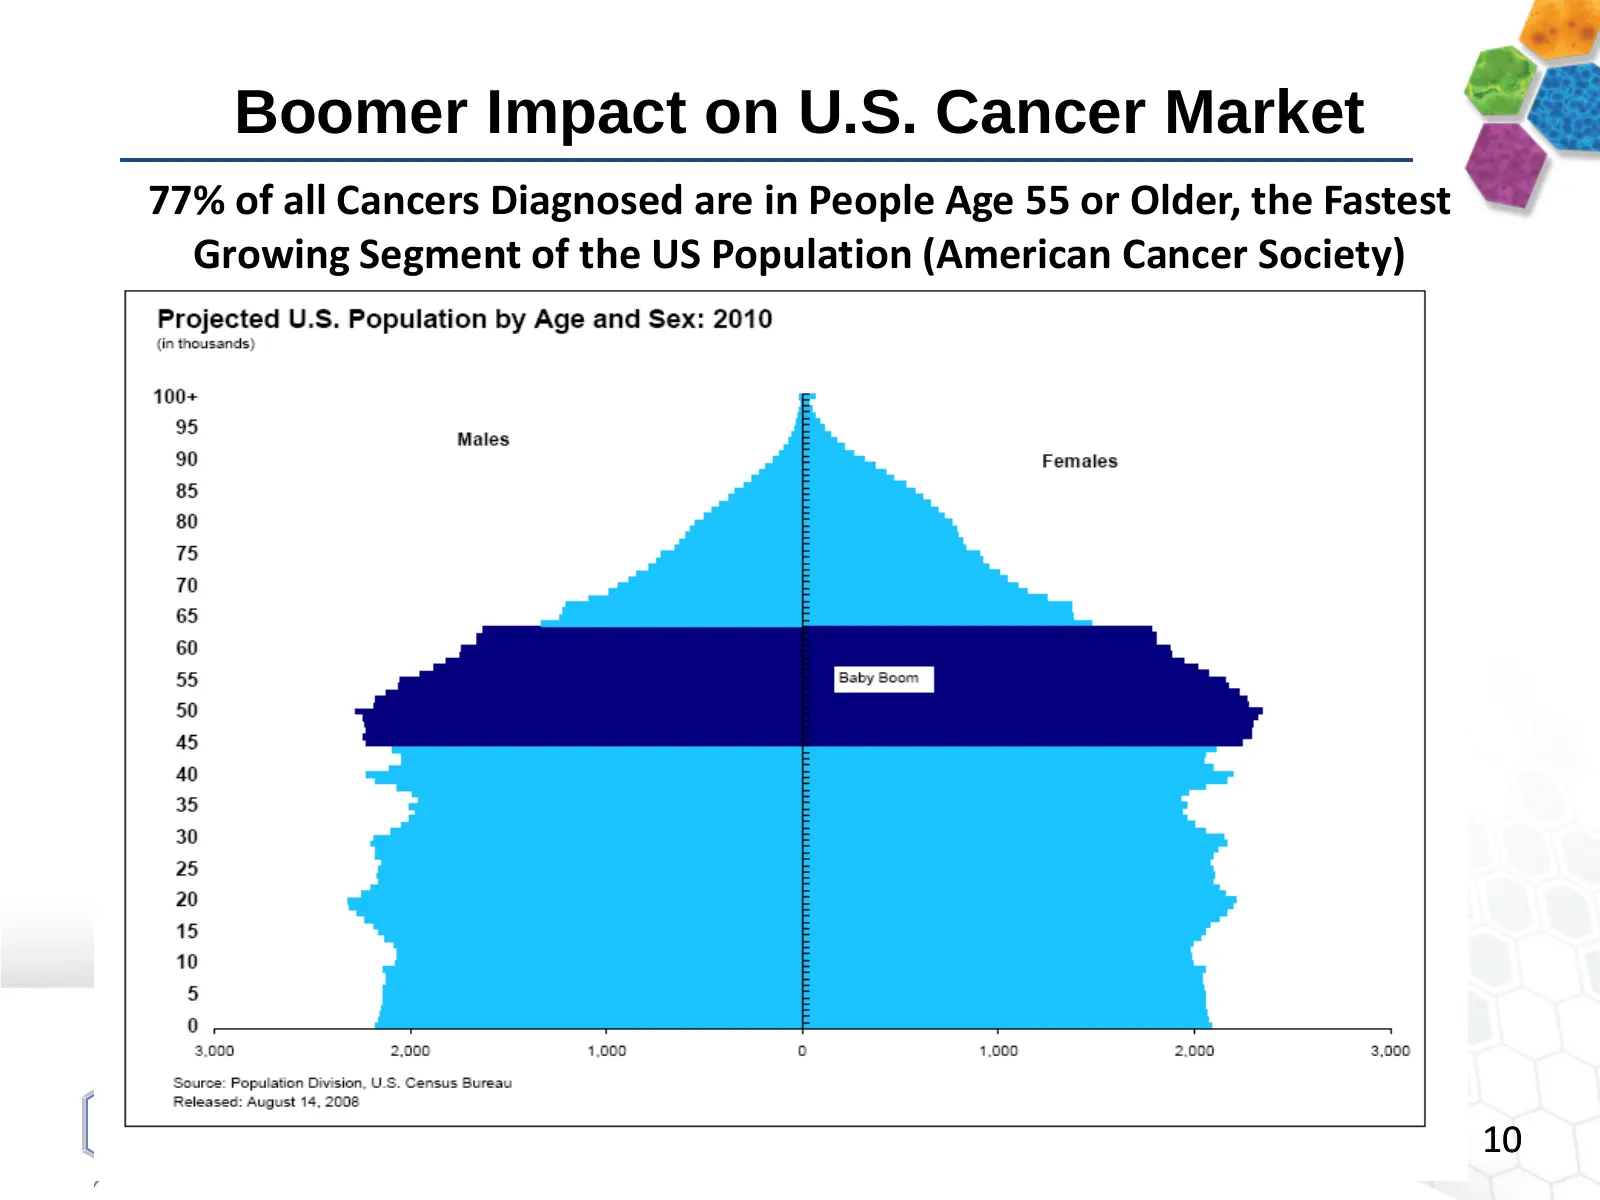
Slide 10: Boomer Impact on U.S. Cancer Market
Boomer Impact on U.S. Cancer Market 77% of all Cancers Diagnosed are in People Age 55 or Older, the Fastest Growing Segment of the US Population (American Cancer Society) 10
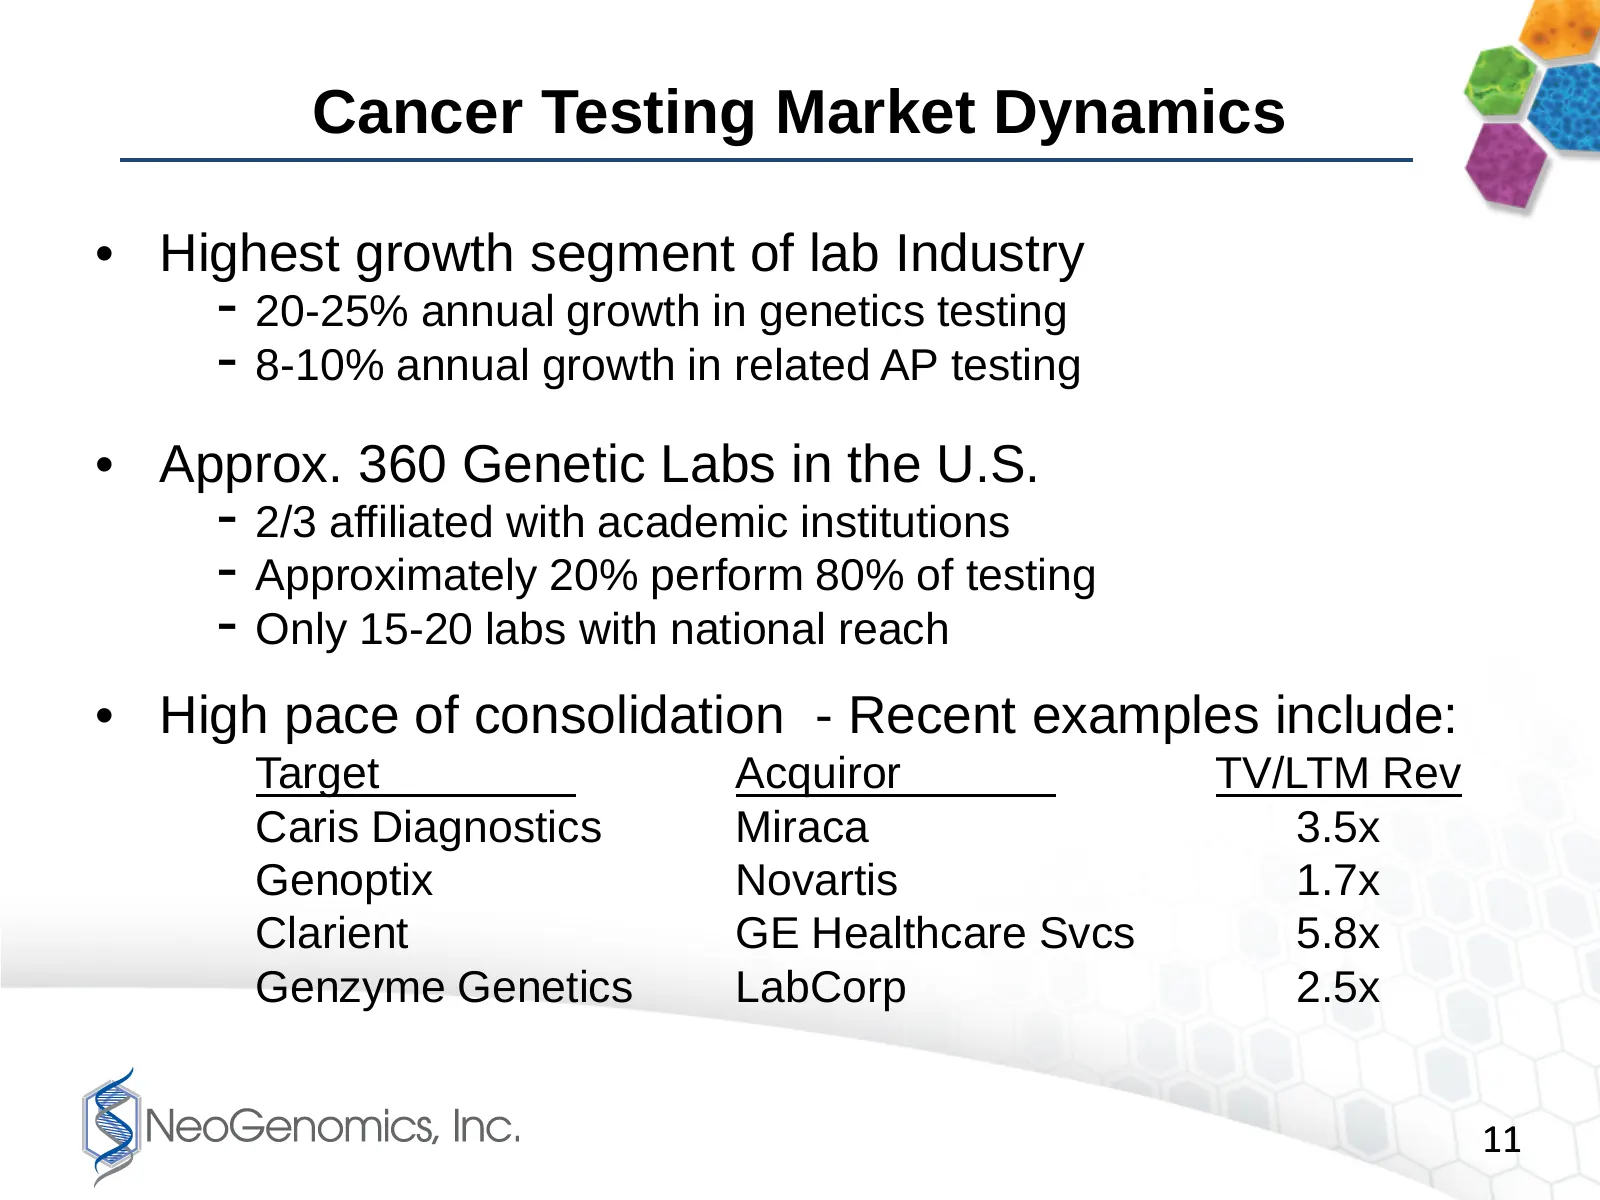
Slide 11: Cancer Testing Market Dynamics
Cancer Testing Market Dynamics • Highest growth segment of lab Industry - 20-25% annual growth in genetics testing - 8-10% annual growth in related AP testing • Approx. 360 Genetic Labs in the U.S. - 2/3 affiliated with academic institutions - Approximately 20% perform 80% of testing - Only 15-20 la
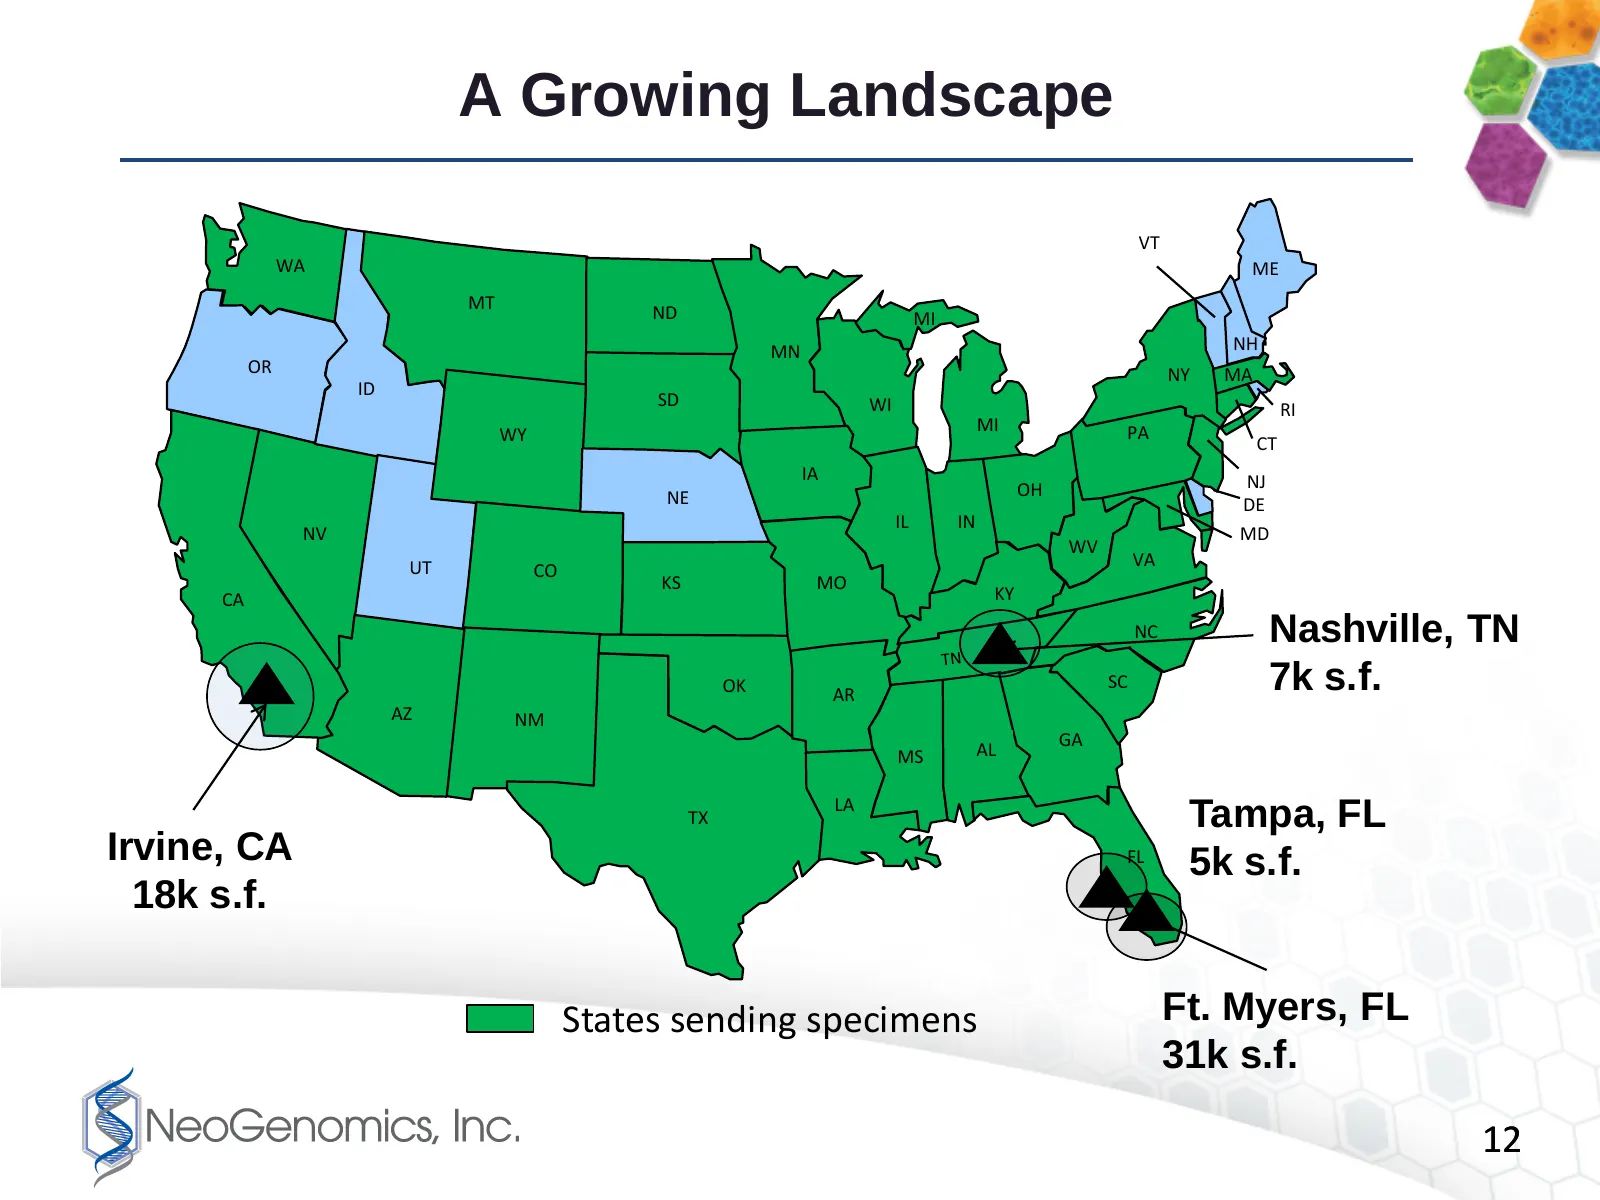
Slide 12: A Growing Landscape
A Growing Landscape VT WA ME MT ND MI MN NH OR NY MA ID SD WI RI WY MI PA CT IA NJ NE OH DE IL IN NV MD WV UT VA CO KS MO CA KY NC Nashville, TN OK AR SC 7k s.f. AZ NM AL GA MS LA TX Tampa, FL Irvine, CA FL 5k s.f. 18k s.f. States sending specimens Ft. Myers, FL 31k s.f. 12
Slide 13: Management Team
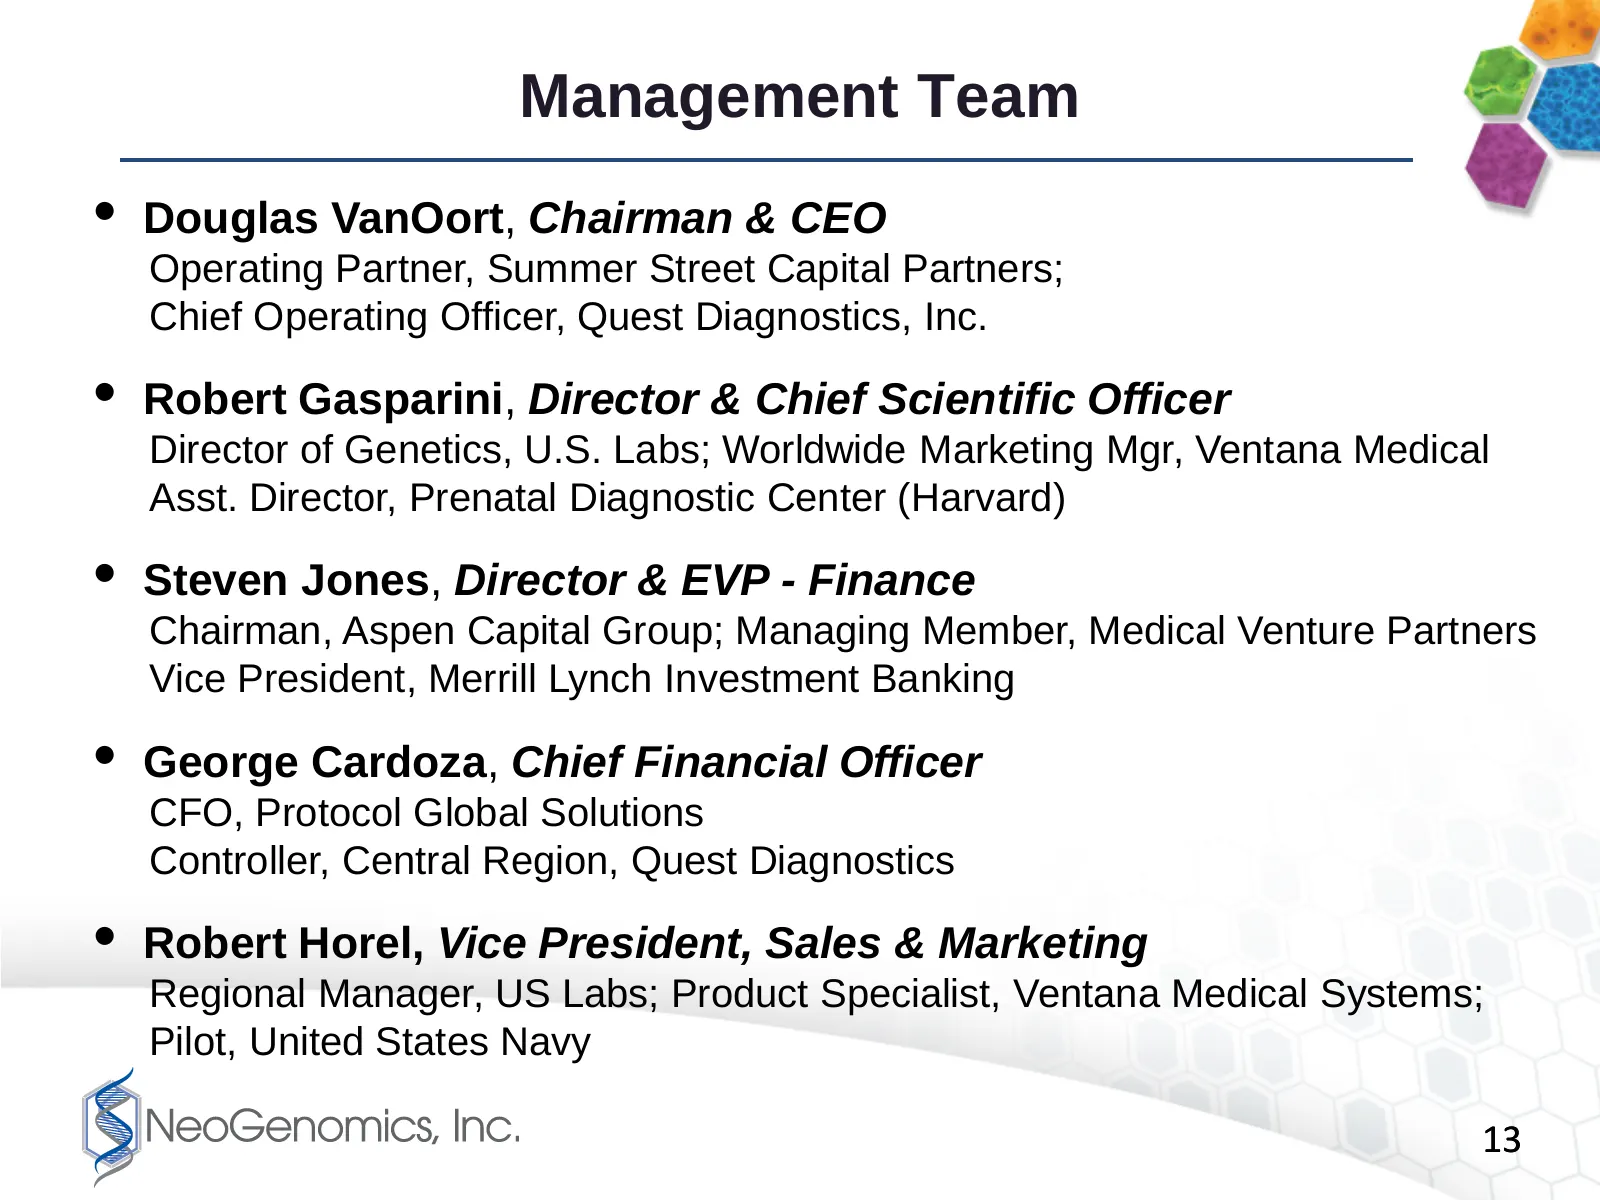
Management Team • Douglas VanOort, Chairman & CEO Operating Partner, Summer Street Capital Partners; Chief Operating Officer, Quest Diagnostics, Inc. • Robert Gasparini, Director & Chief Scientific Officer Director of Genetics, U.S. Labs; Worldwide Marketing Mgr, Ventana Medical Asst. Director, Pren
Slide 14: Volume and Price Growth
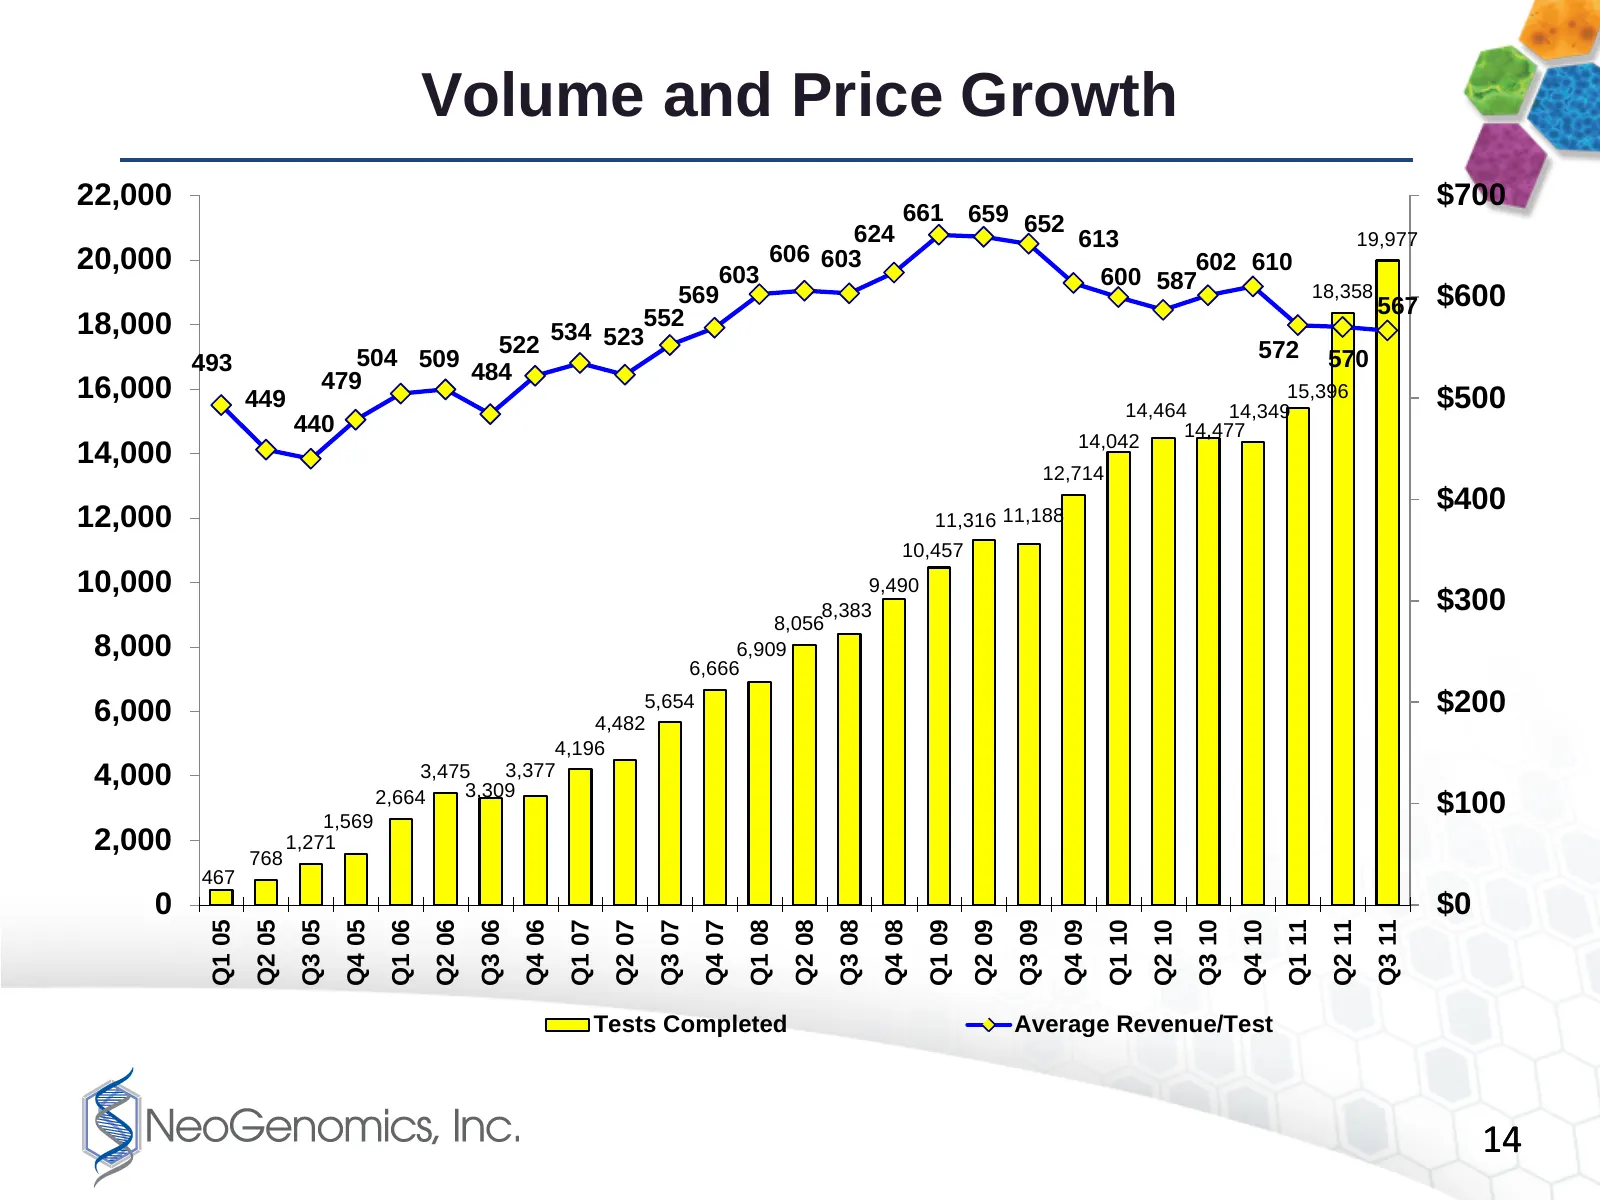
Volume and Price Growth 22,000 $700 661 659 652 624 613 19,977 20,000 606 603 602 610 603 600 587 569 18,358 $600 552 567 18,000 534 523 522 572 570 493 504 509 479 484 16,000 449 15,396 $500 14,464 14,349 440 14,477 14,042 14,000 12,714 $400 12,000 11,316 11,188 10,457 10,000 9,490 8,383 $300 8,056
Slide 15: Quarterly Revenue
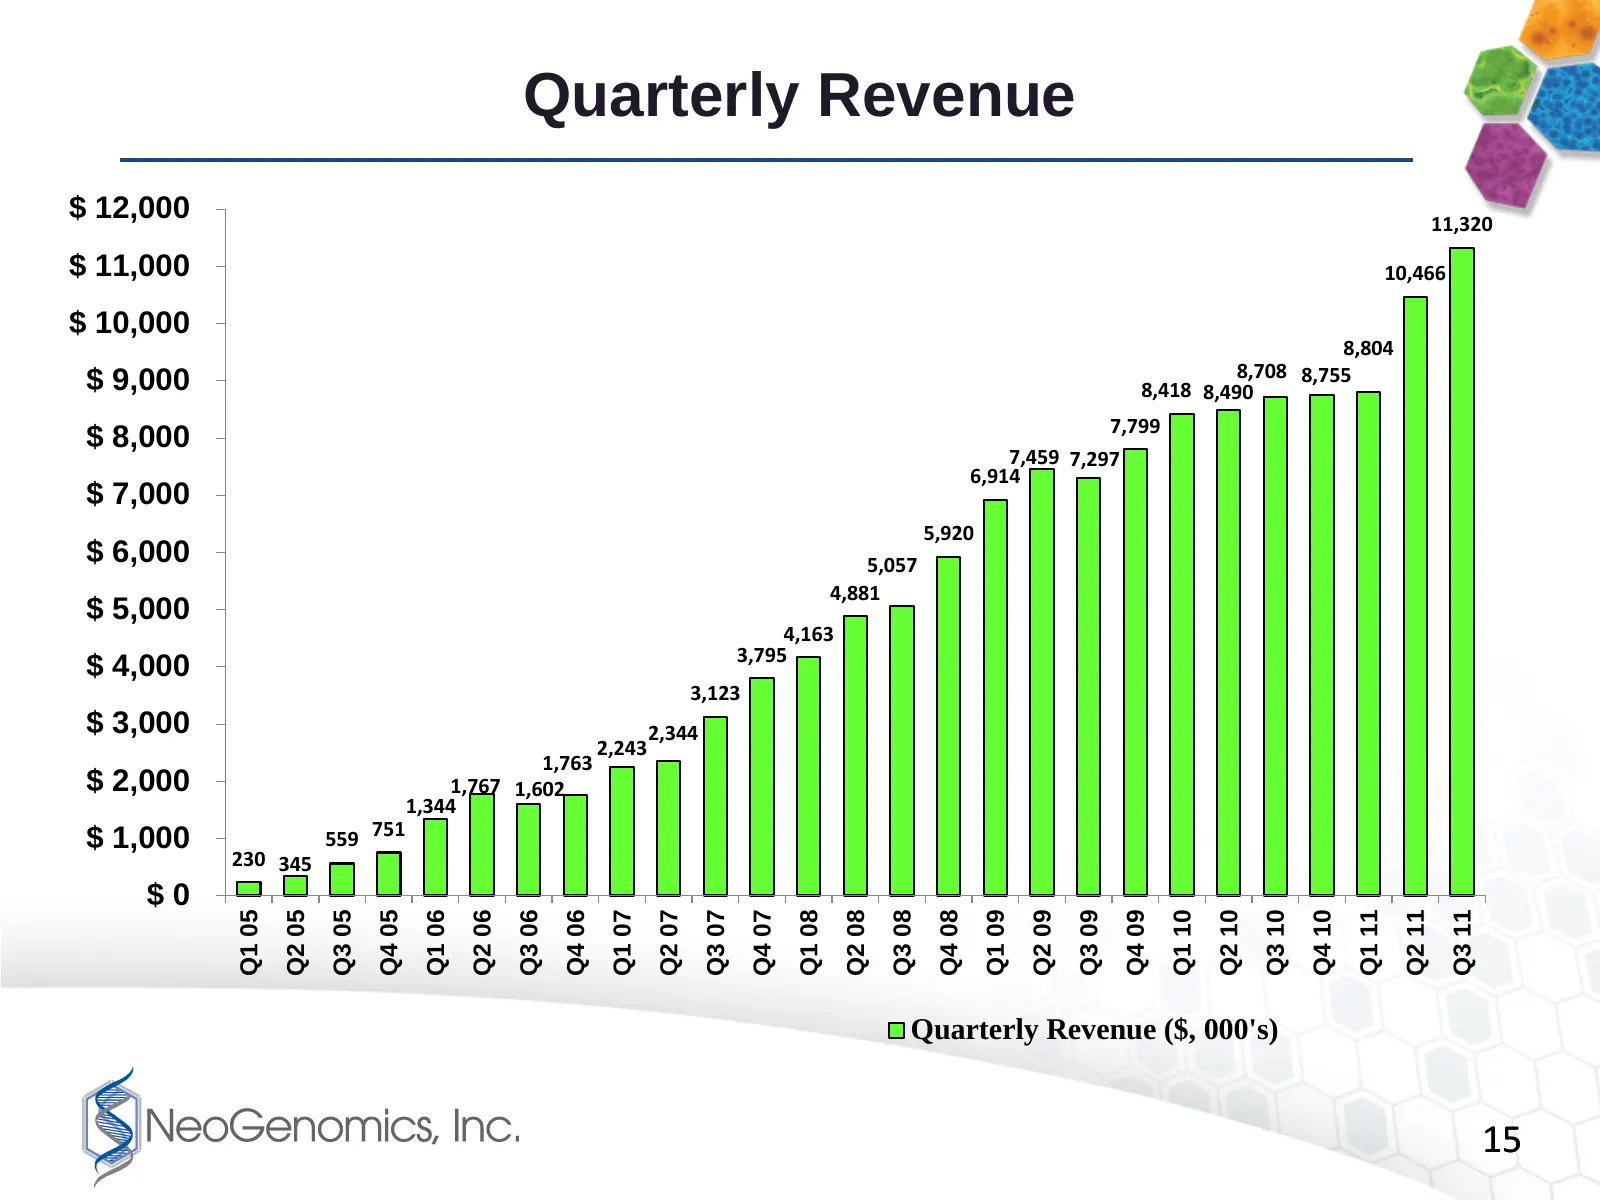
Quarterly Revenue $ 12,000 11,320 $ 11,000 10,466 $ 10,000 8,804 8,708 8,755 $ 9,000 8,418 8,490 7,799 $ 8,000 7,459 7,297 6,914 $ 7,000 5,920 $ 6,000 5,057 4,881 $ 5,000 4,163 3,795 $ 4,000 3,123 $ 3,000 2,344 2,243 1,763 $ 2,000 1,767 1,602 1,344 $ 1,000 559 751 230 345 $0 Q1 05 Q2 05 Q3 05 Q4 05
Slide 16: Historical Financial Information
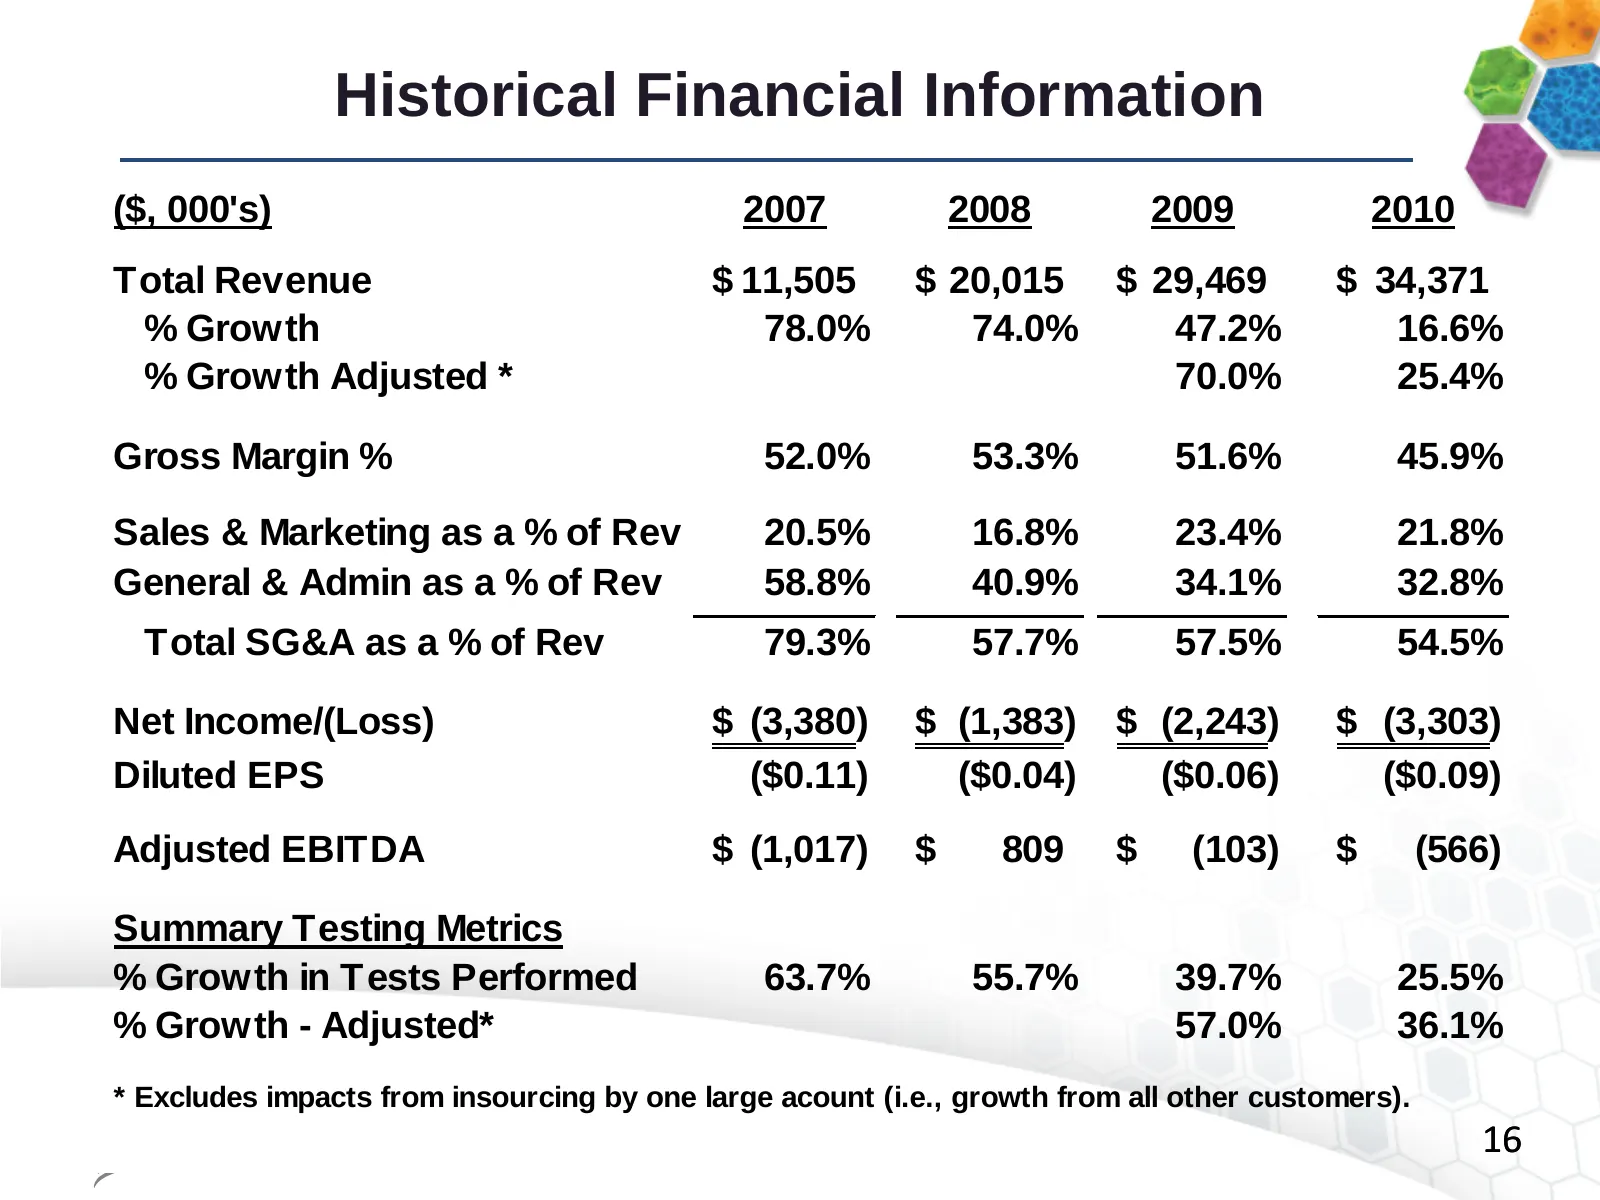
Historical Financial Information ($, 000's) 2007 2008 2009 2010 Total Revenue $ 11,505 $ 20,015 $ 29,469 $ 34,371 % Growth 78.0% 74.0% 47.2% 16.6% % Growth Adjusted * 70.0% 25.4% Gross Margin % 52.0% 53.3% 51.6% 45.9% Sales & Marketing as a % of Rev 20.5% 16.8% 23.4% 21.8% General & Admin as a % of
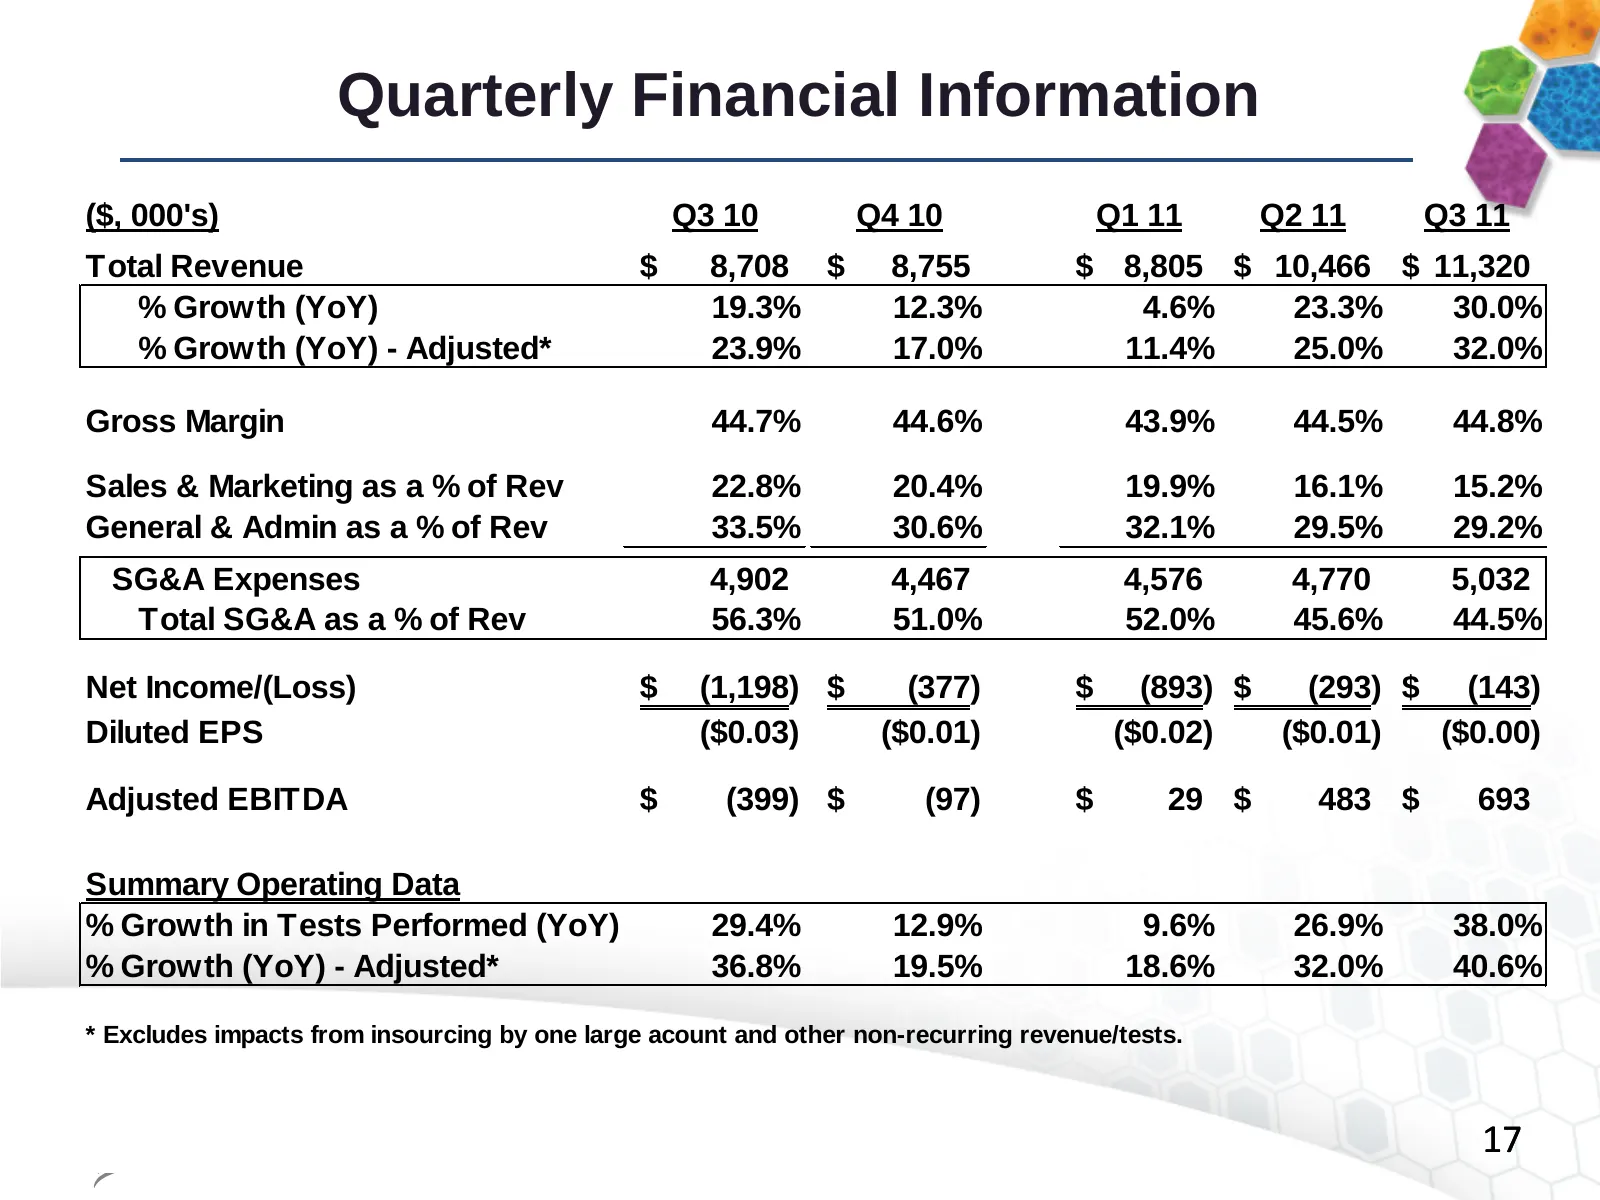
Slide 17: Quarterly Financial Information
Quarterly Financial Information ($, 000's) Q3 10 Q4 10 Q1 11 Q2 11 Q3 11 Total Revenue $ 8,708 $ 8,755 $ 8,805 $ 10,466 $ 11,320 % Growth (YoY) 19.3% 12.3% 4.6% 23.3% 30.0% % Growth (YoY) - Adjusted* 23.9% 17.0% 11.4% 25.0% 32.0% Gross Margin 44.7% 44.6% 43.9% 44.5% 44.8% Sales & Marketing as a % of
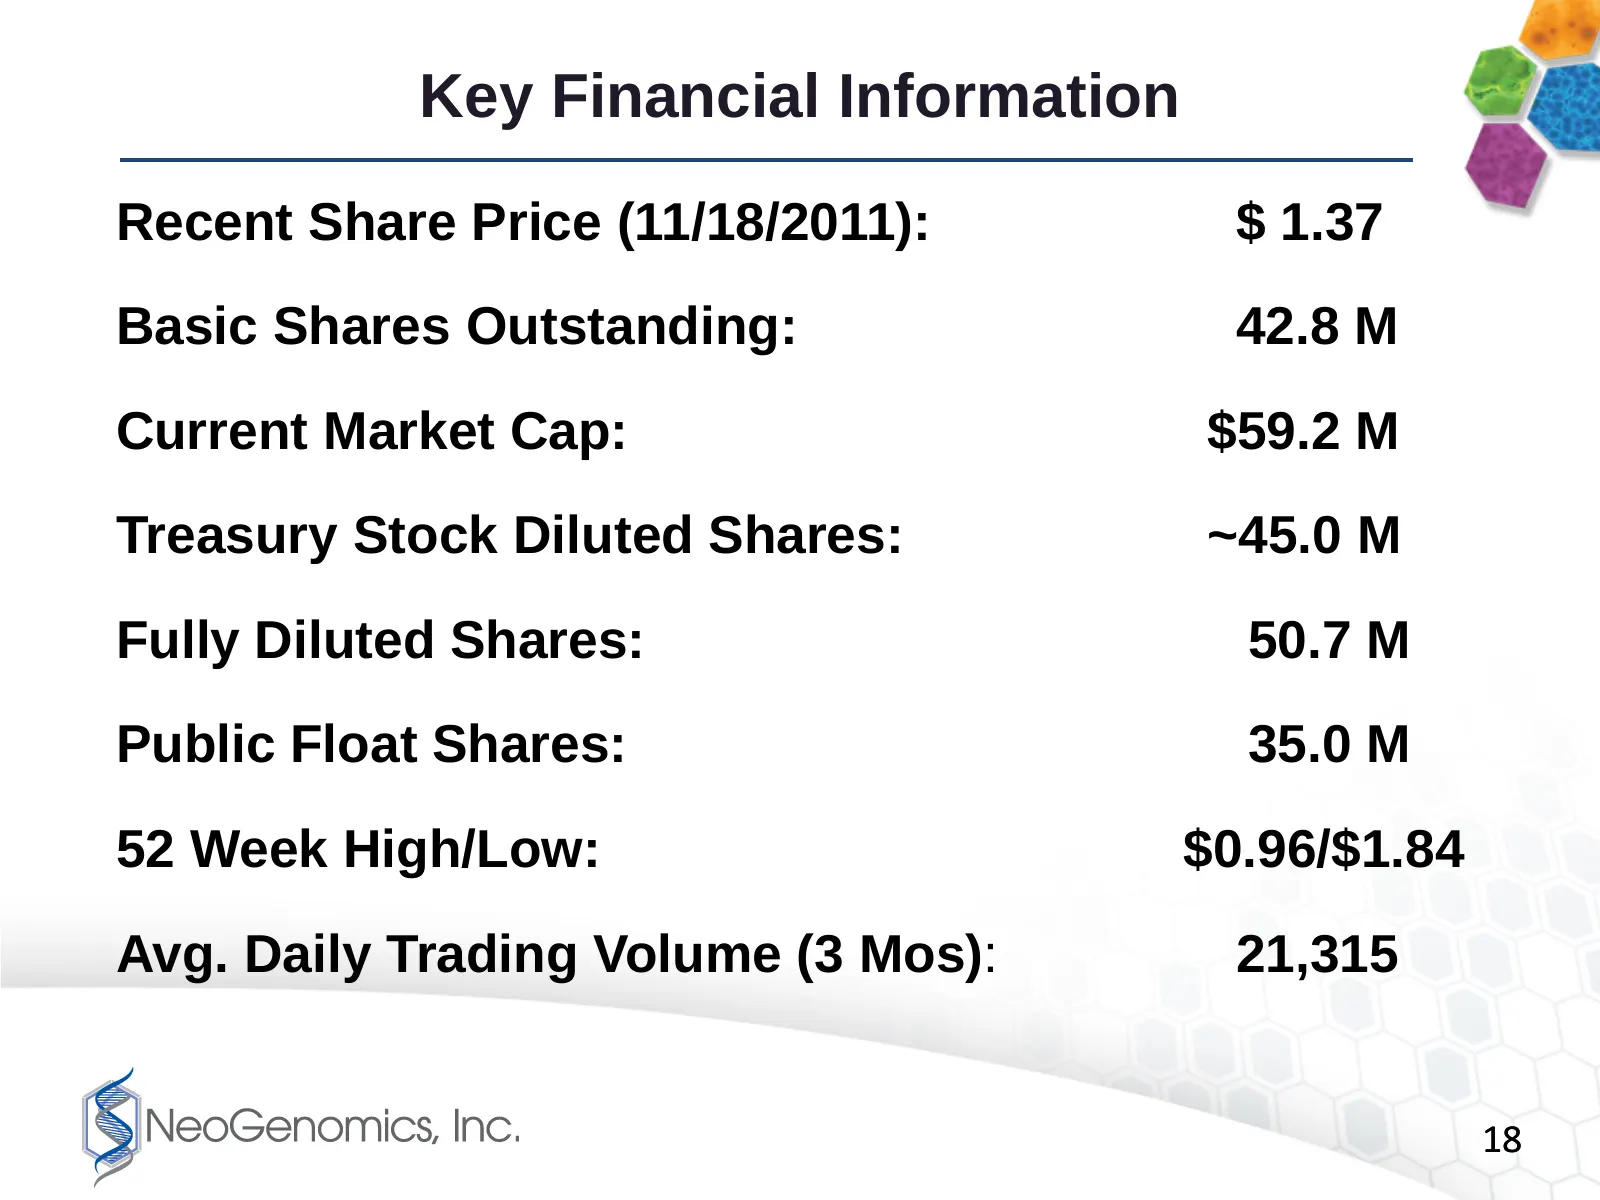
Slide 18: Key Financial Information
Key Financial Information Recent Share Price (11/18/2011): $ 1.37 Basic Shares Outstanding: 42.8 M Current Market Cap: $59.2 M Treasury Stock Diluted Shares: ~45.0 M Fully Diluted Shares: 50.7 M Public Float Shares: 35.0 M 52 Week High/Low: $0.96/$1.84 Avg. Daily Trading Volume (3 Mos): 21,315 18
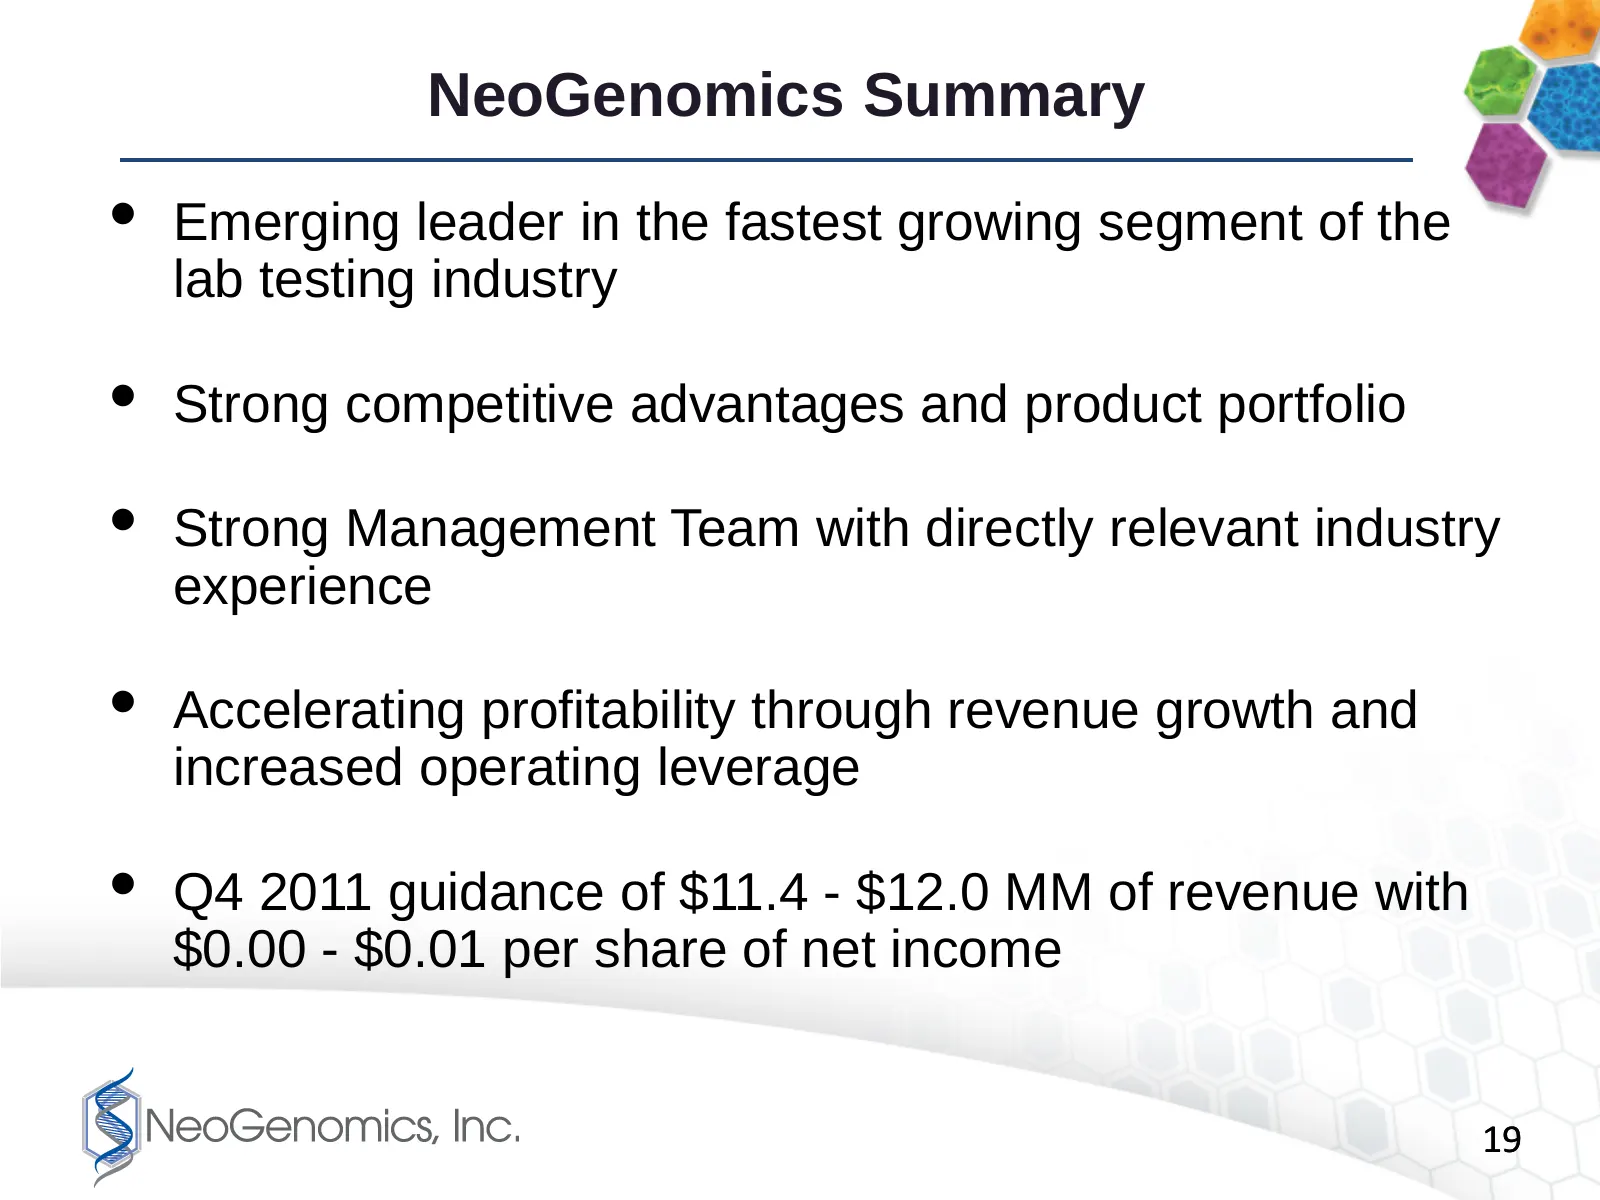
Slide 19: NeoGenomics Summary
NeoGenomics Summary • Emerging leader in the fastest growing segment of the lab testing industry • Strong competitive advantages and product portfolio • Strong Management Team with directly relevant industry experience • Accelerating profitability through revenue growth and increased operating lever
Source: Internet Archive copy of neogenomics.com
More decks from NeoGenomics, Inc.
 Q3 2026 Earnings Presentation26 slides · Oct 28, 2026
 Q2 2026 Earnings Presentation24 slides · Jul 28, 2026
 Q1 2026 Earnings Presentation27 slides · Apr 28, 2026
 Q4 2025 Earnings Presentation15 slides · Feb 17, 2026
 Q3 2025 Earnings Presentation17 slides · Oct 28, 2025
 Q2 2025 Earnings Presentation17 slides · Jul 29, 2025