K.P. Energy Ltd. · NSE:KPEL
K.P. Energy — Q2 FY27 Earnings Presentation
26 slides from K.P. Energy's earnings presentation, Nov 13, 2026
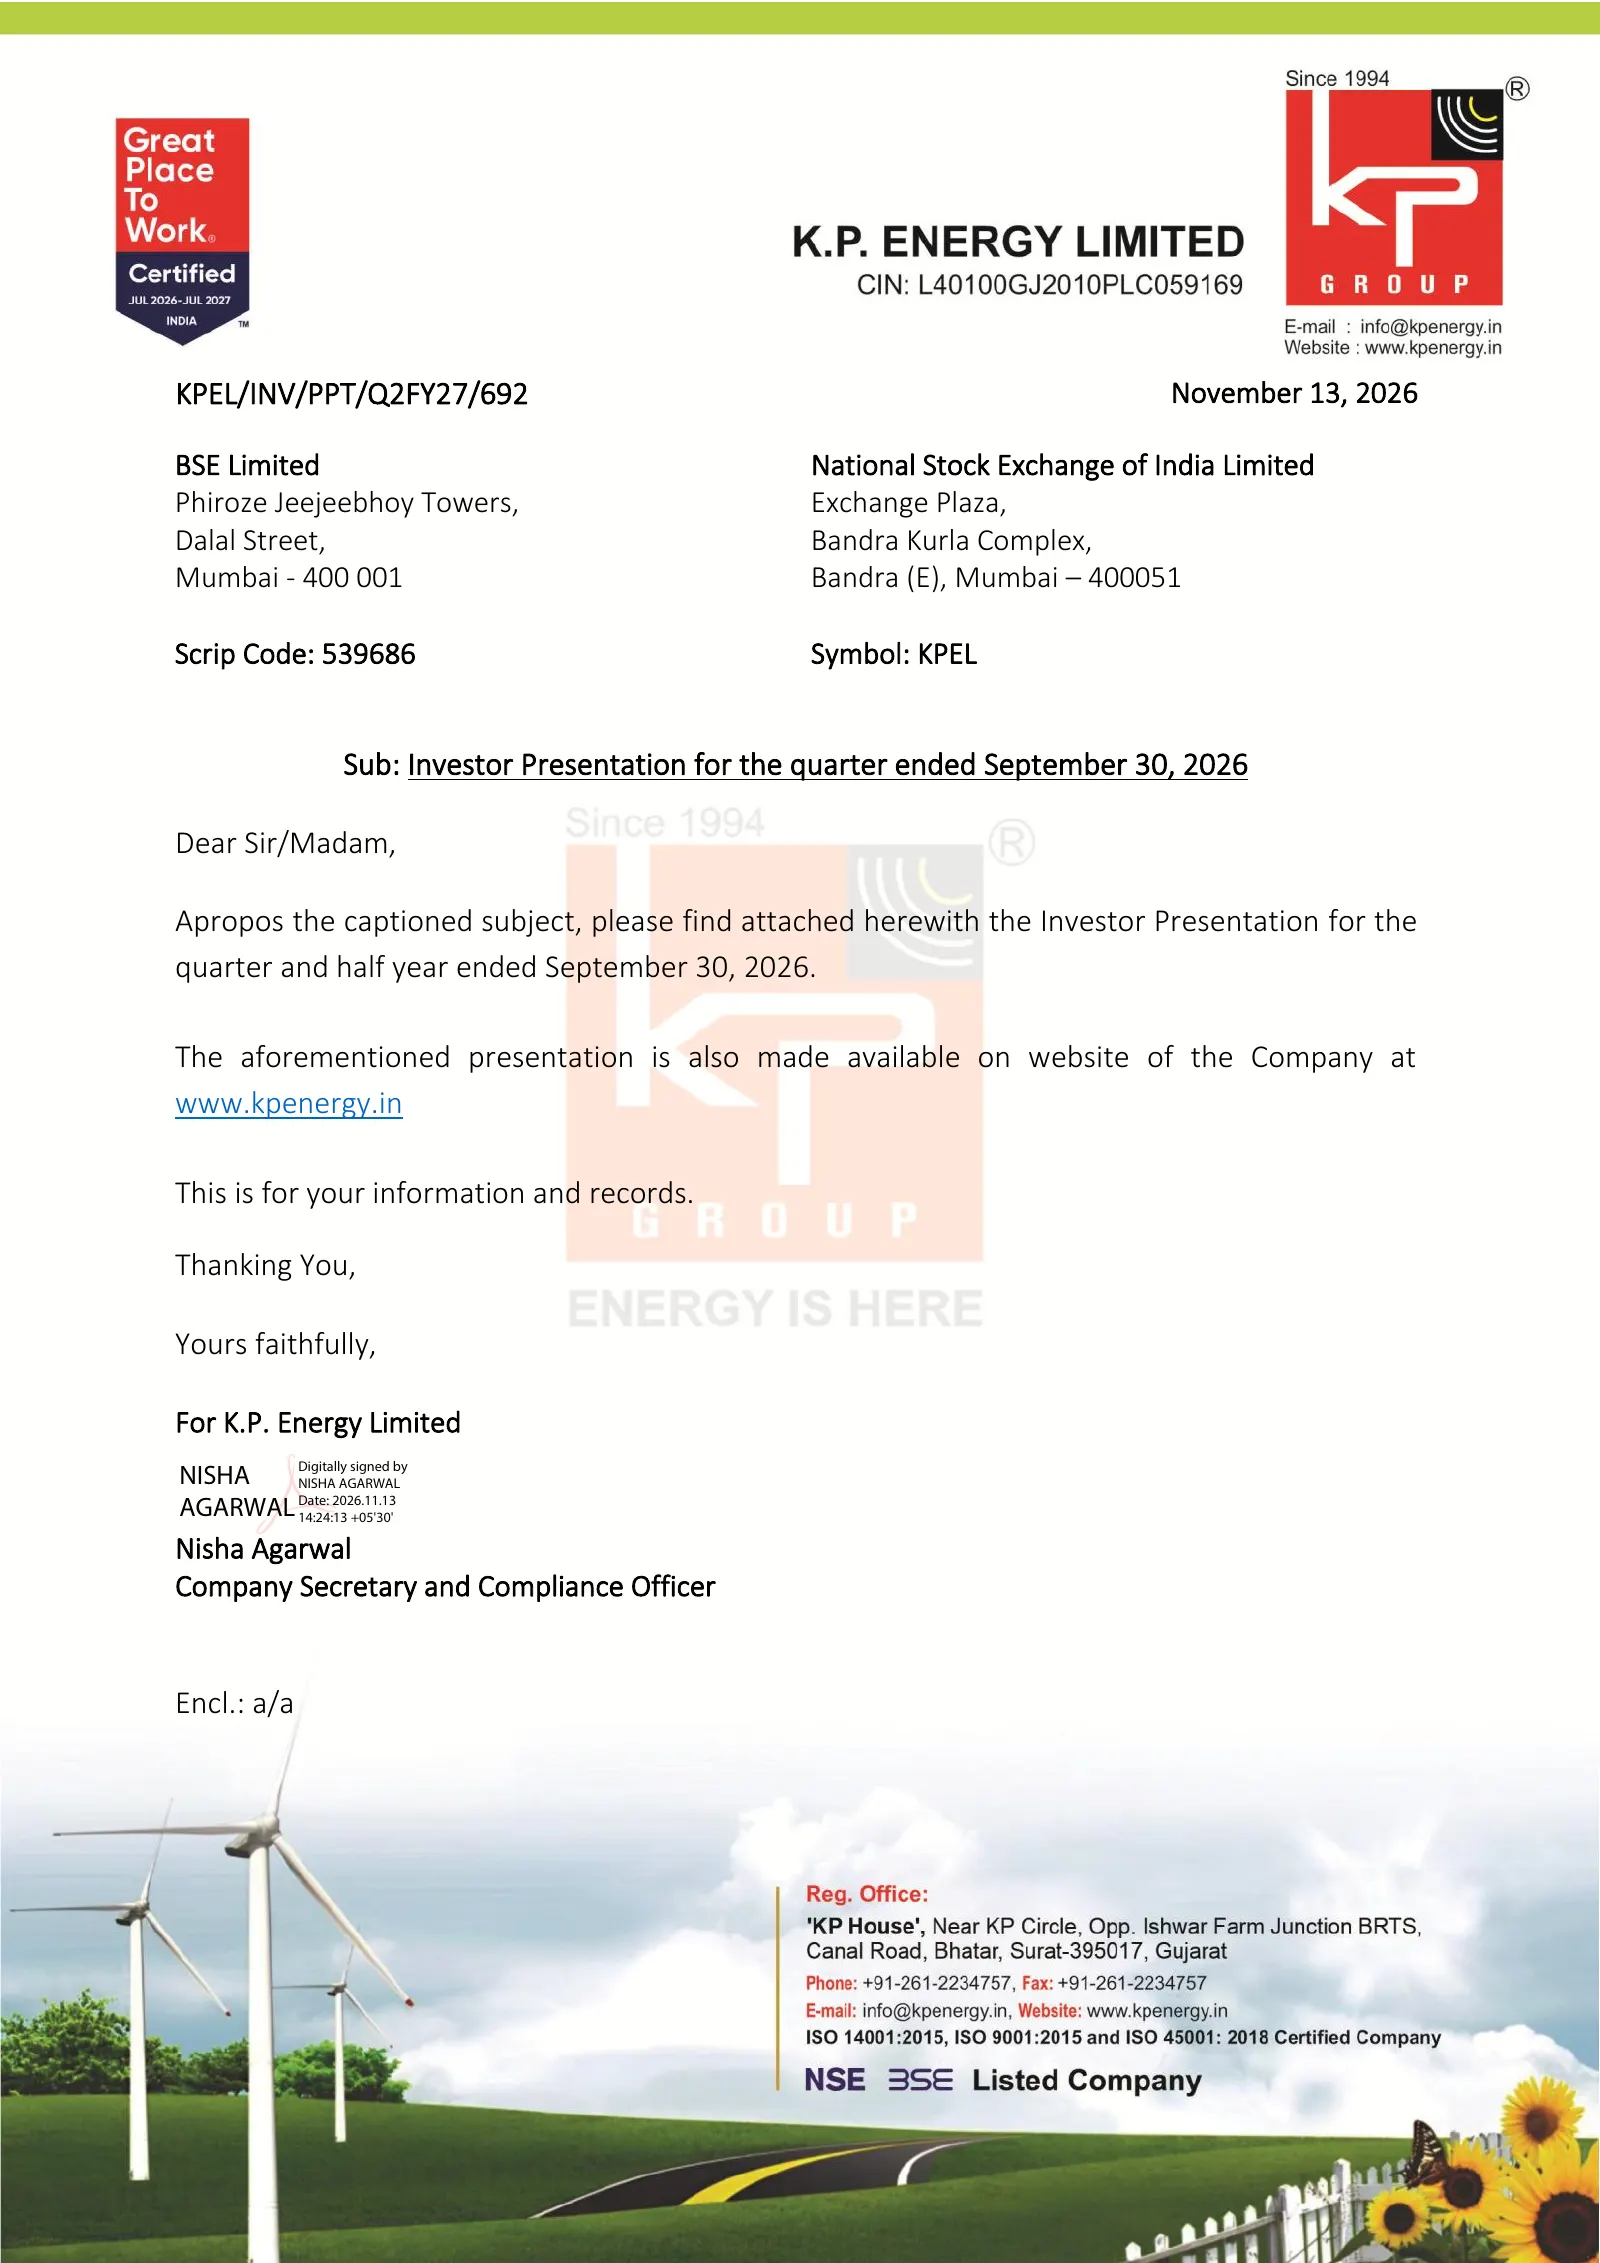
Slide 1: Exchange cover letter for investor presentation
KPEL/INV/PPT/Q2FY27/692 November 13, 2026 BSE Limited National Stock Exchange of India Limited Phiroze Jeejeebhoy Towers, Exchange Plaza, Dalal Street, Bandra Kurla Complex, Mumbai - 400 001 Bandra (E), Mumbai – 400051 Scrip Code: 539686 Symbol: KPEL Sub: Investor Presentation for the quarter ended
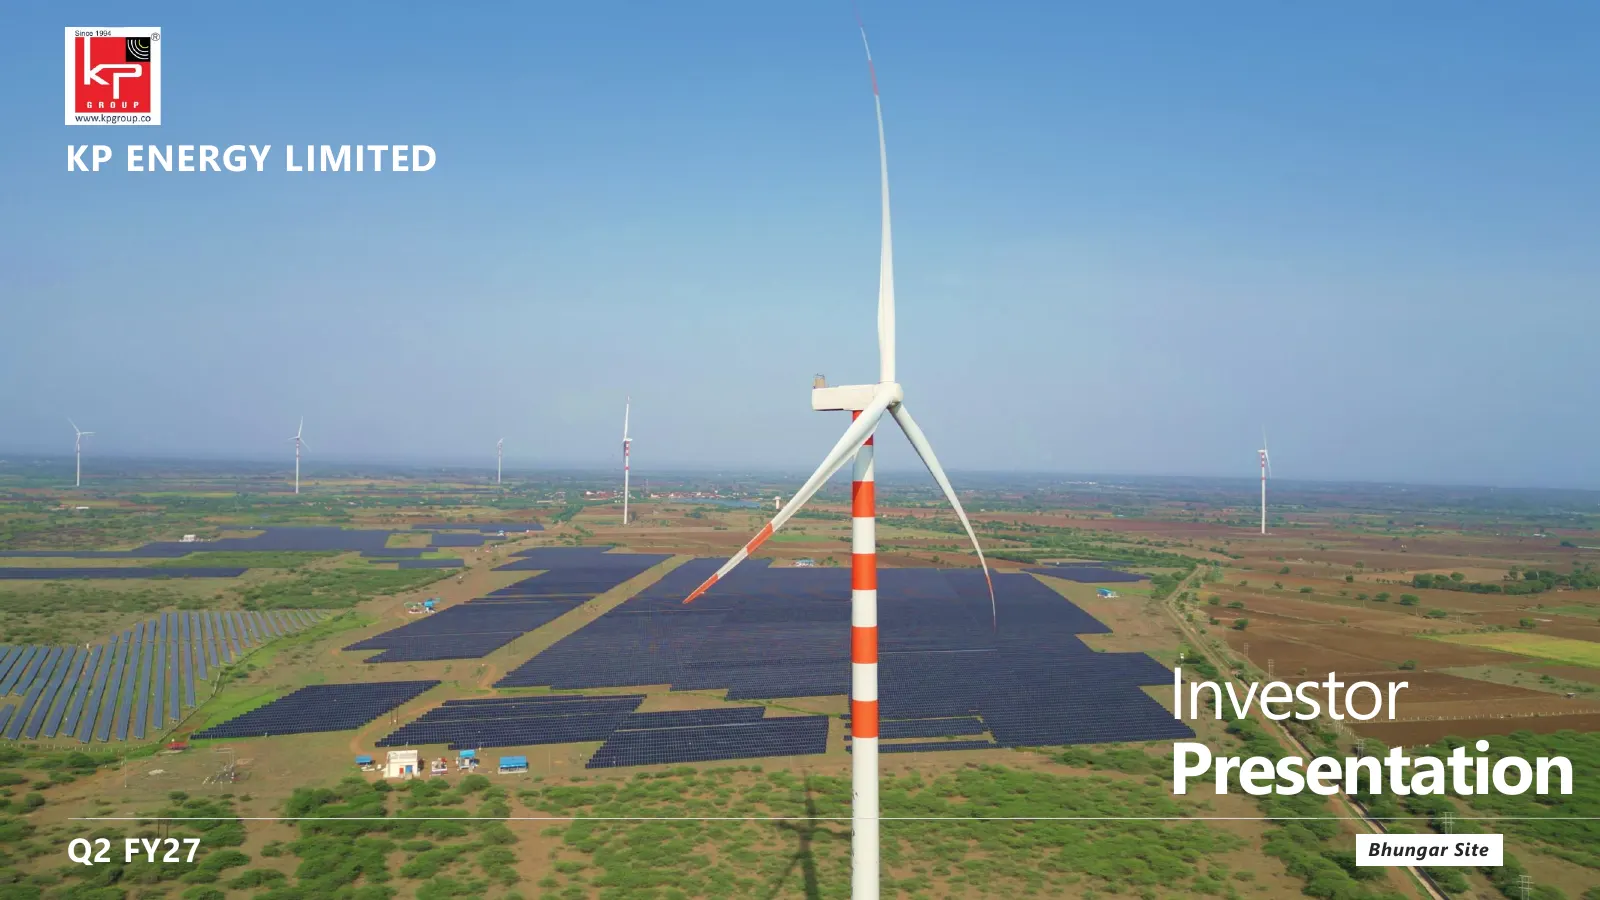
Slide 2: Investor Presentation Q2 FY27
KP ENERGY LIMITED Investor Presentation Q2 FY27 Bhungar Site
Slide 3: Agenda
02 K P E n e rgy L i m i t e d | Q 2 F Y 27 Agenda Industry Overview Industry Overview Company Overview Company Overview Financials Financials About KP Group About KP Group
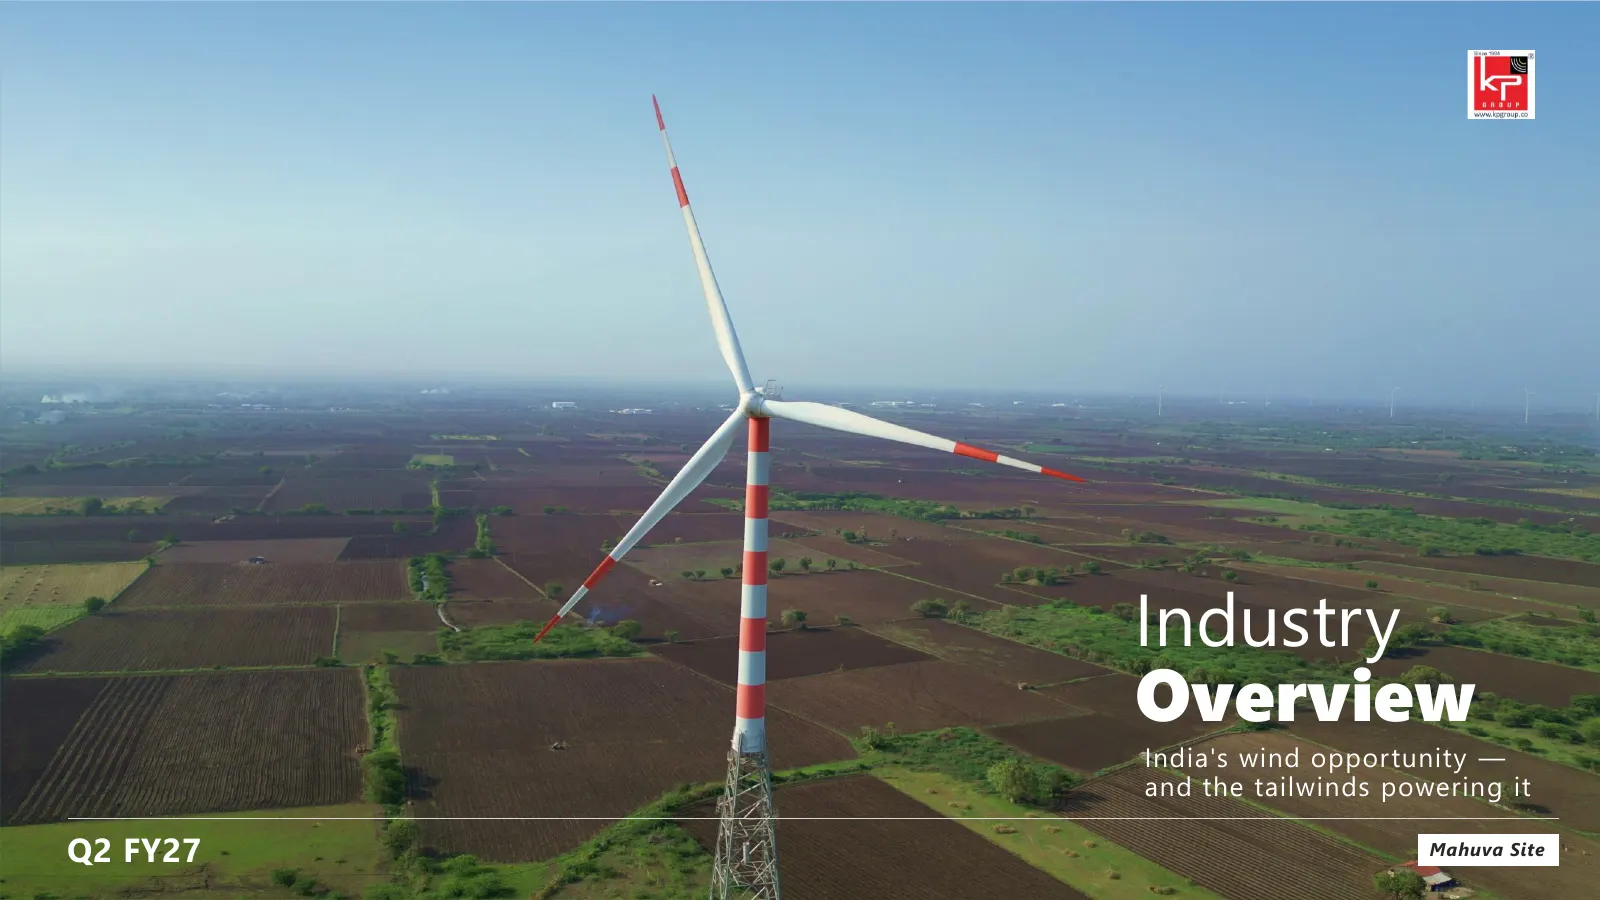
Slide 4: Industry Overview
Industry Overview India's wind opportunity — and the tailwinds powering it Q2 FY27 Mahuva Site
Slide 5: India's Wind Energy Opportunity — Wind is Accelerating
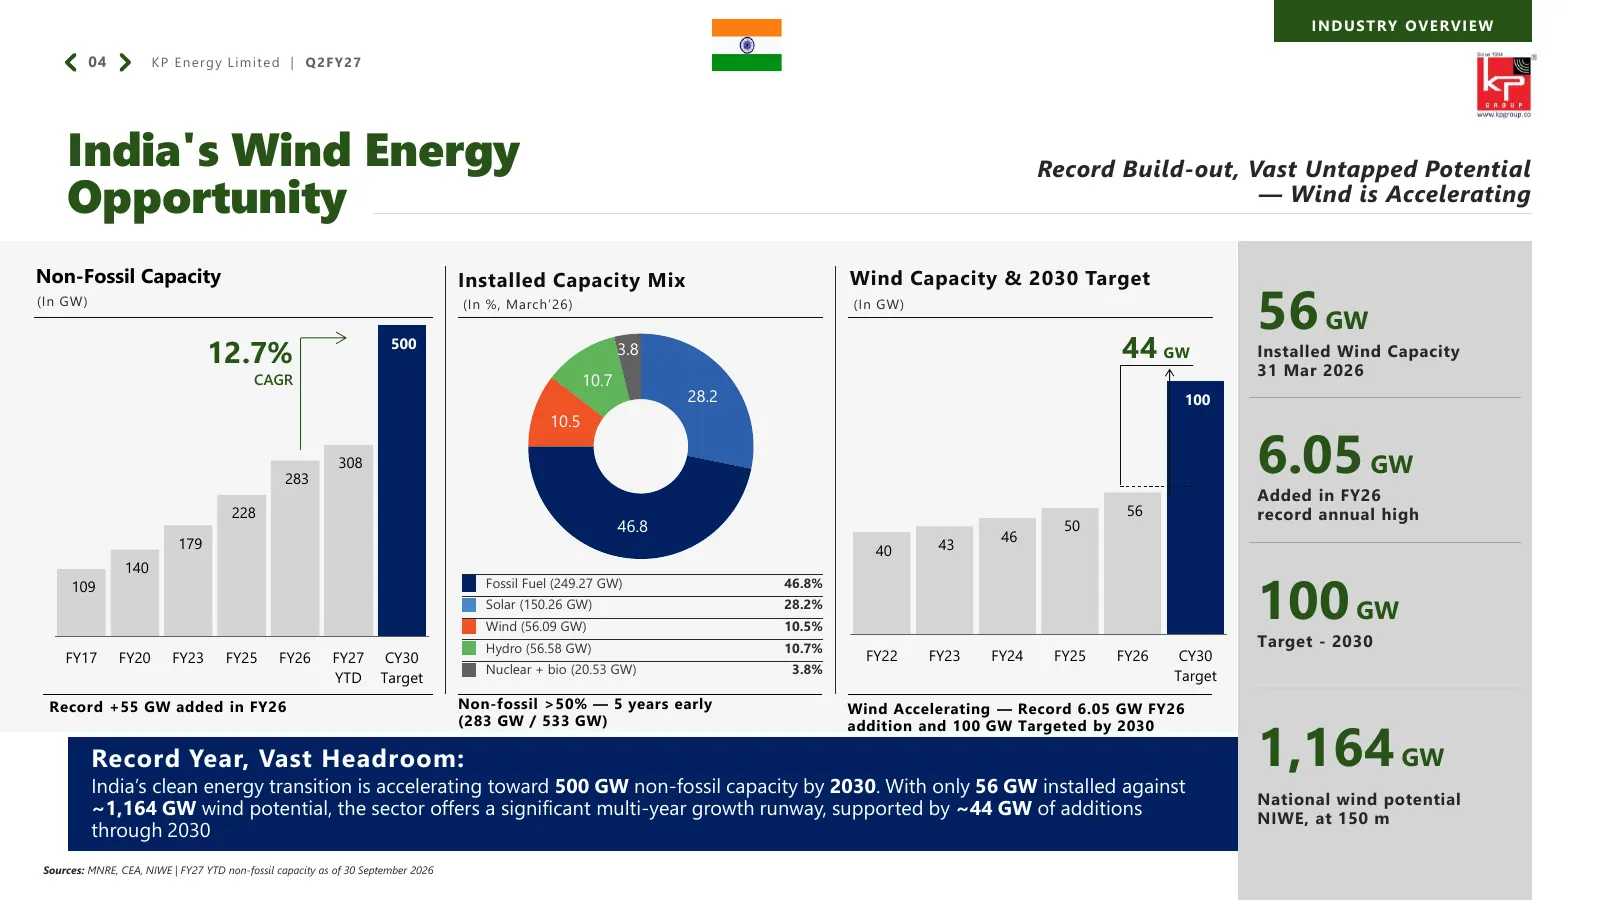
INDUSTRY OVERVIEW 04 K P E n e rgy L i m i t e d | Q 2 F Y 27 India's Wind Energy Record Build-out, Vast Untapped Potential Opportunity — Wind is Accelerating Non-Fossil Capacity Installed Capacity Mix Wind Capacity & 2030 Target (In GW) (In %, March’26) (In GW) 56 GW 12.7% 500 3.8 44 GW Installed W
Slide 6: What's Powering the Wind Upcycle
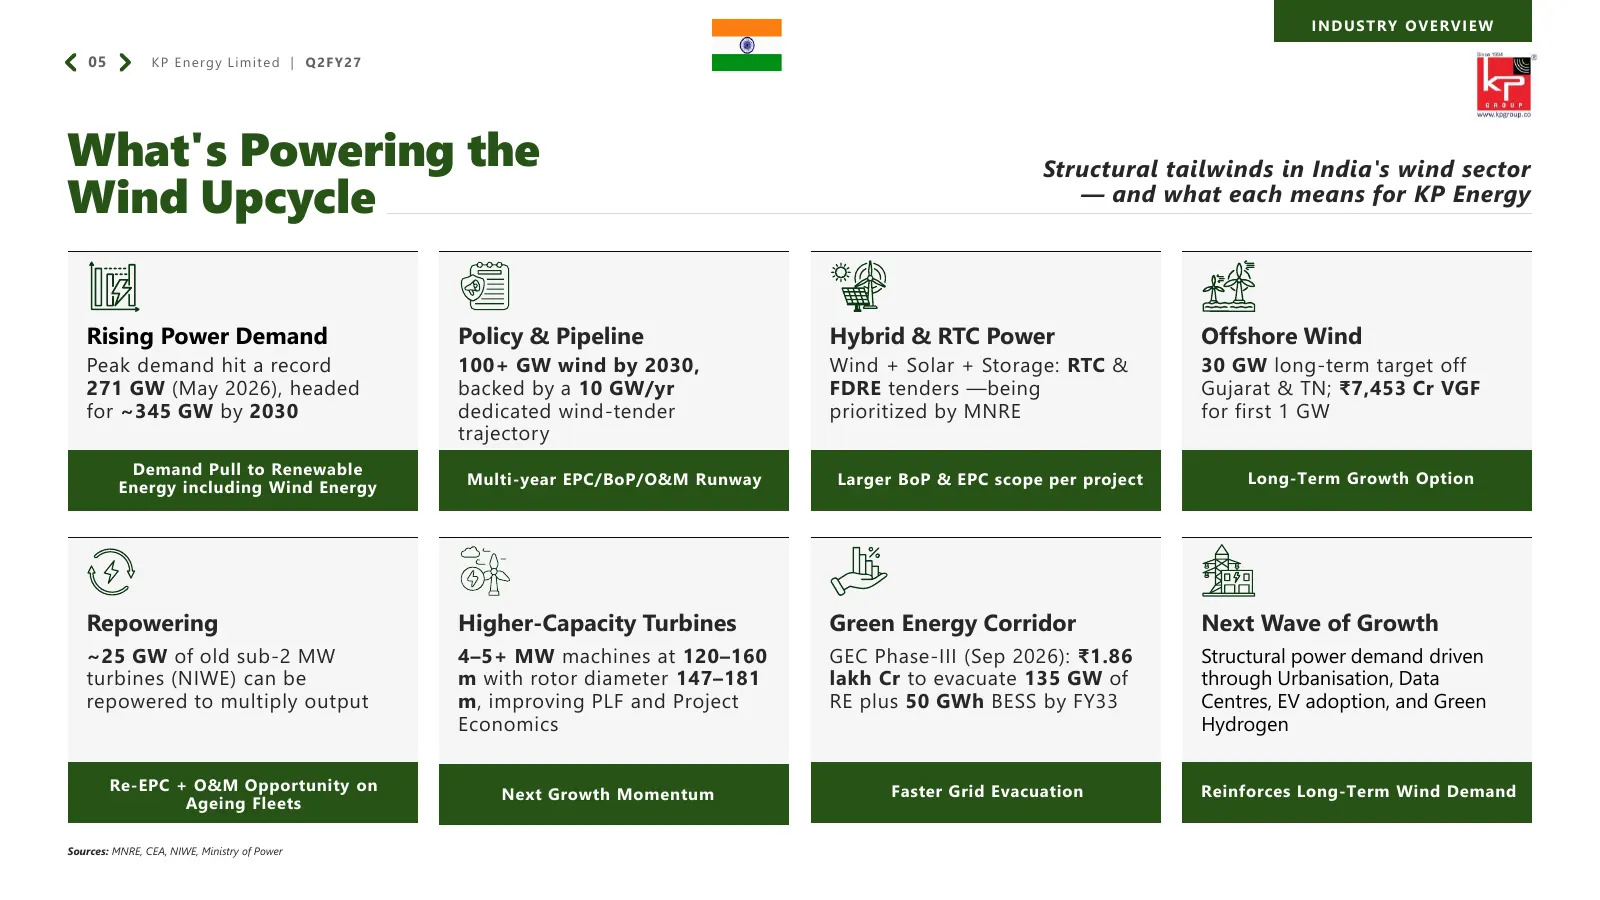
INDUSTRY OVERVIEW 05 K P E n e rgy L i m i t e d | Q 2 F Y 27 What's Powering the Structural tailwinds in India's wind sector Wind Upcycle — and what each means for KP Energy Rising Power Demand Policy & Pipeline Hybrid & RTC Power Offshore Wind Peak demand hit a record 100+ GW wind by 2030, Wind +
Slide 7: Company Overview
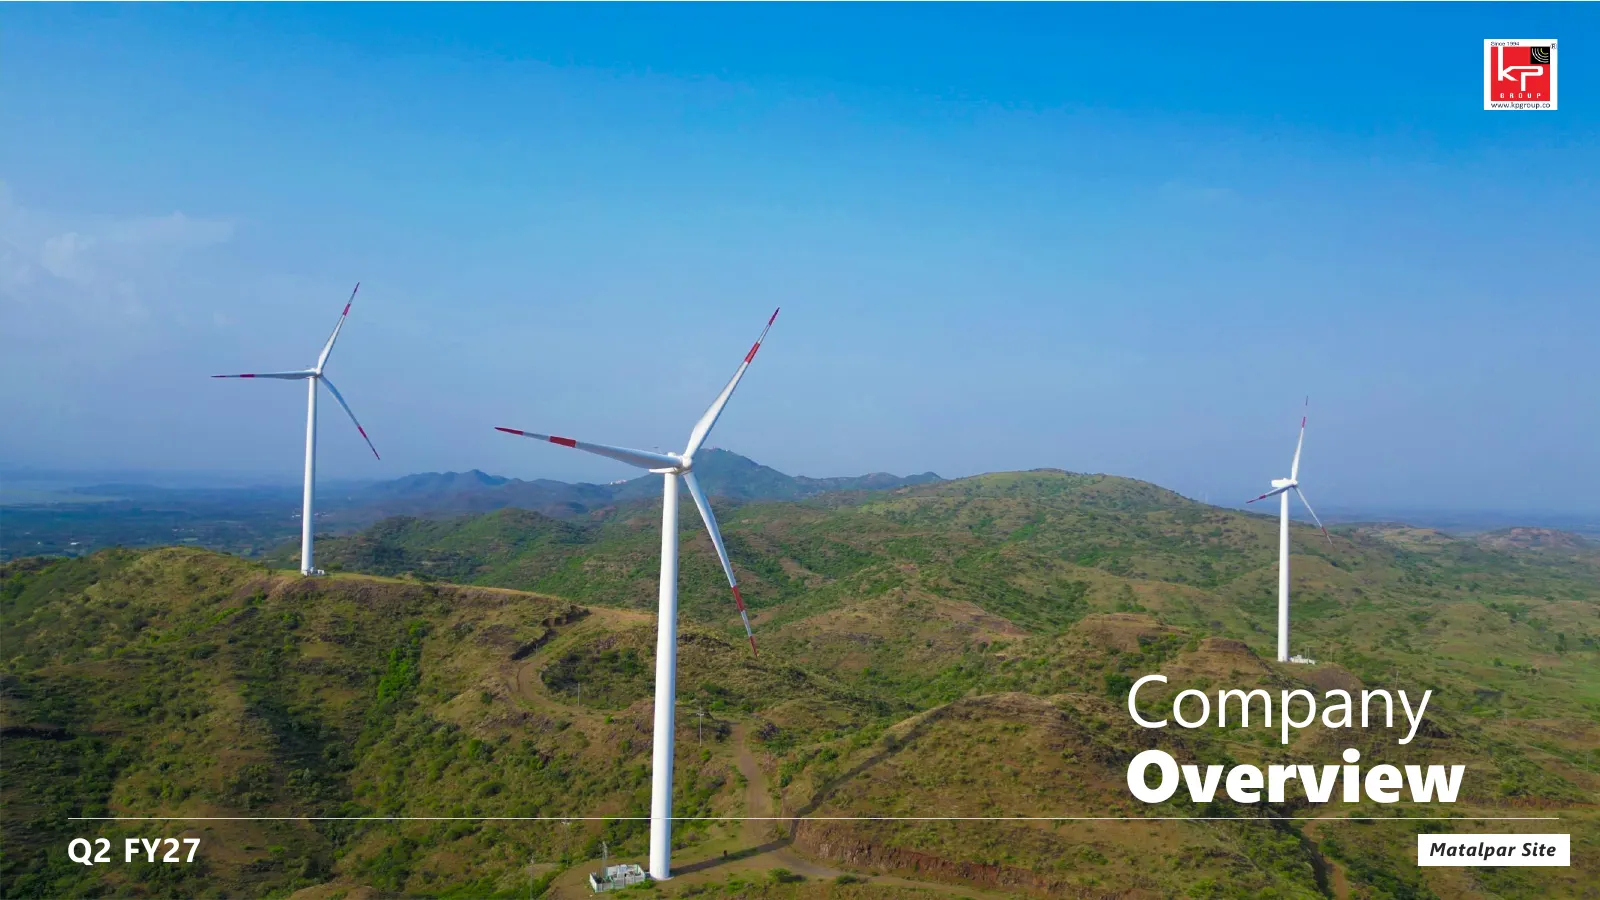
Company Overview Q2 FY27 Matalpar Site
Slide 8: Company Snapshot
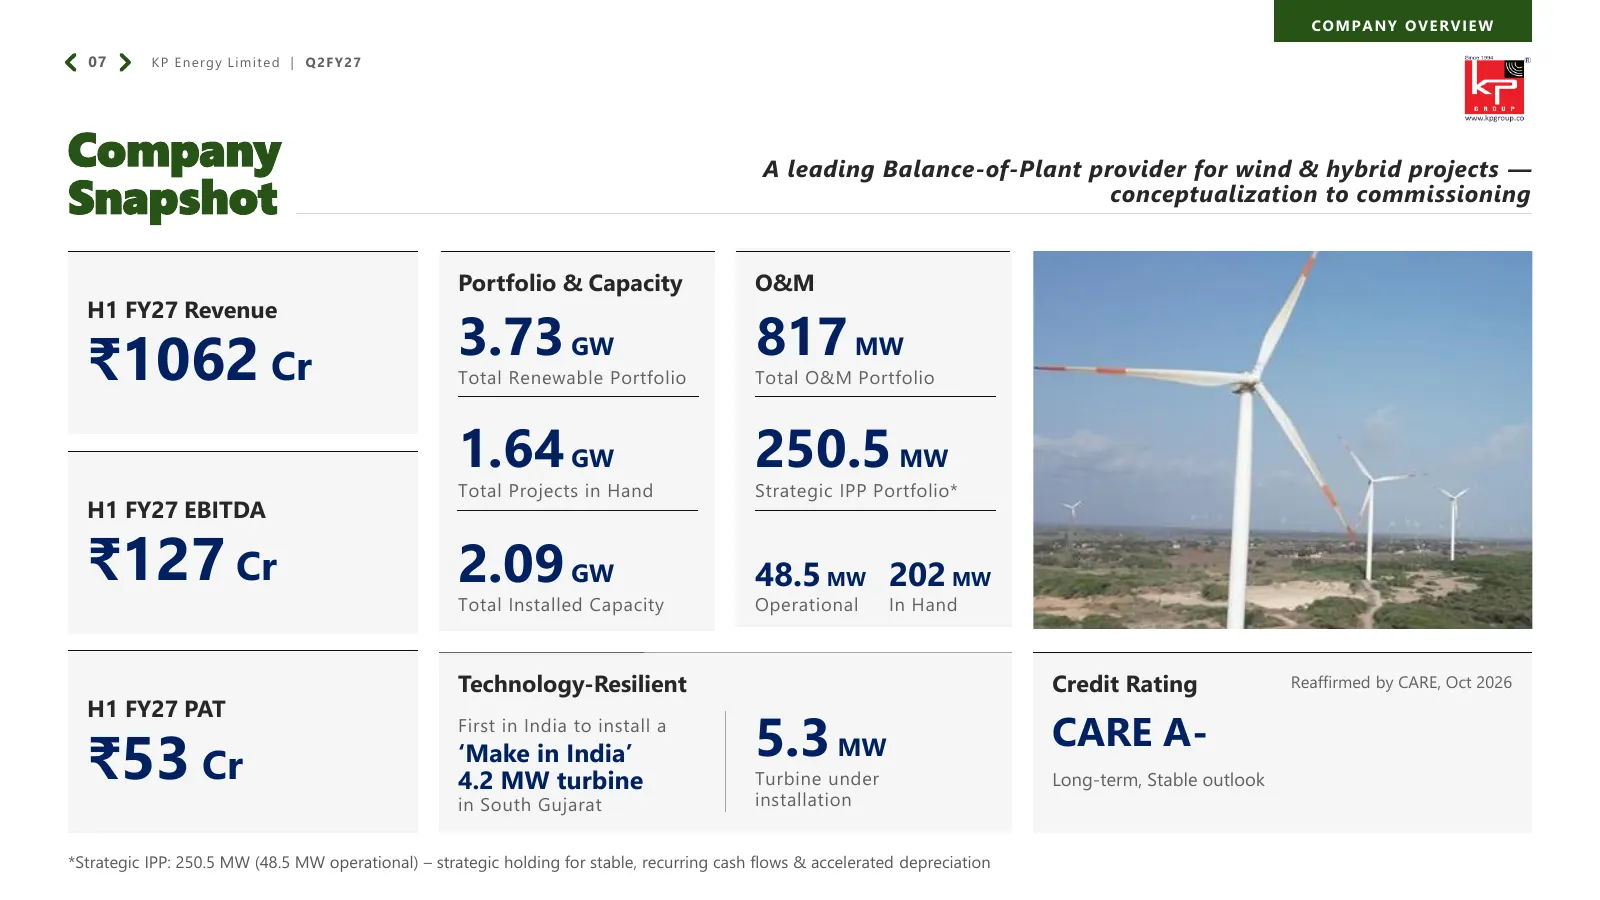
COMPANY OVERVIEW 07 K P E n e rgy L i m i t e d | Q 2 F Y 27 Company A leading Balance-of-Plant provider for wind & hybrid projects — Snapshot conceptualization to commissioning Portfolio & Capacity O&M H1 FY27 Revenue ₹1062 Cr 3.73 GW 817 MW Total Renewable Portfolio Total O&M Portfolio 1.64 GW 250
Slide 9: Business Model
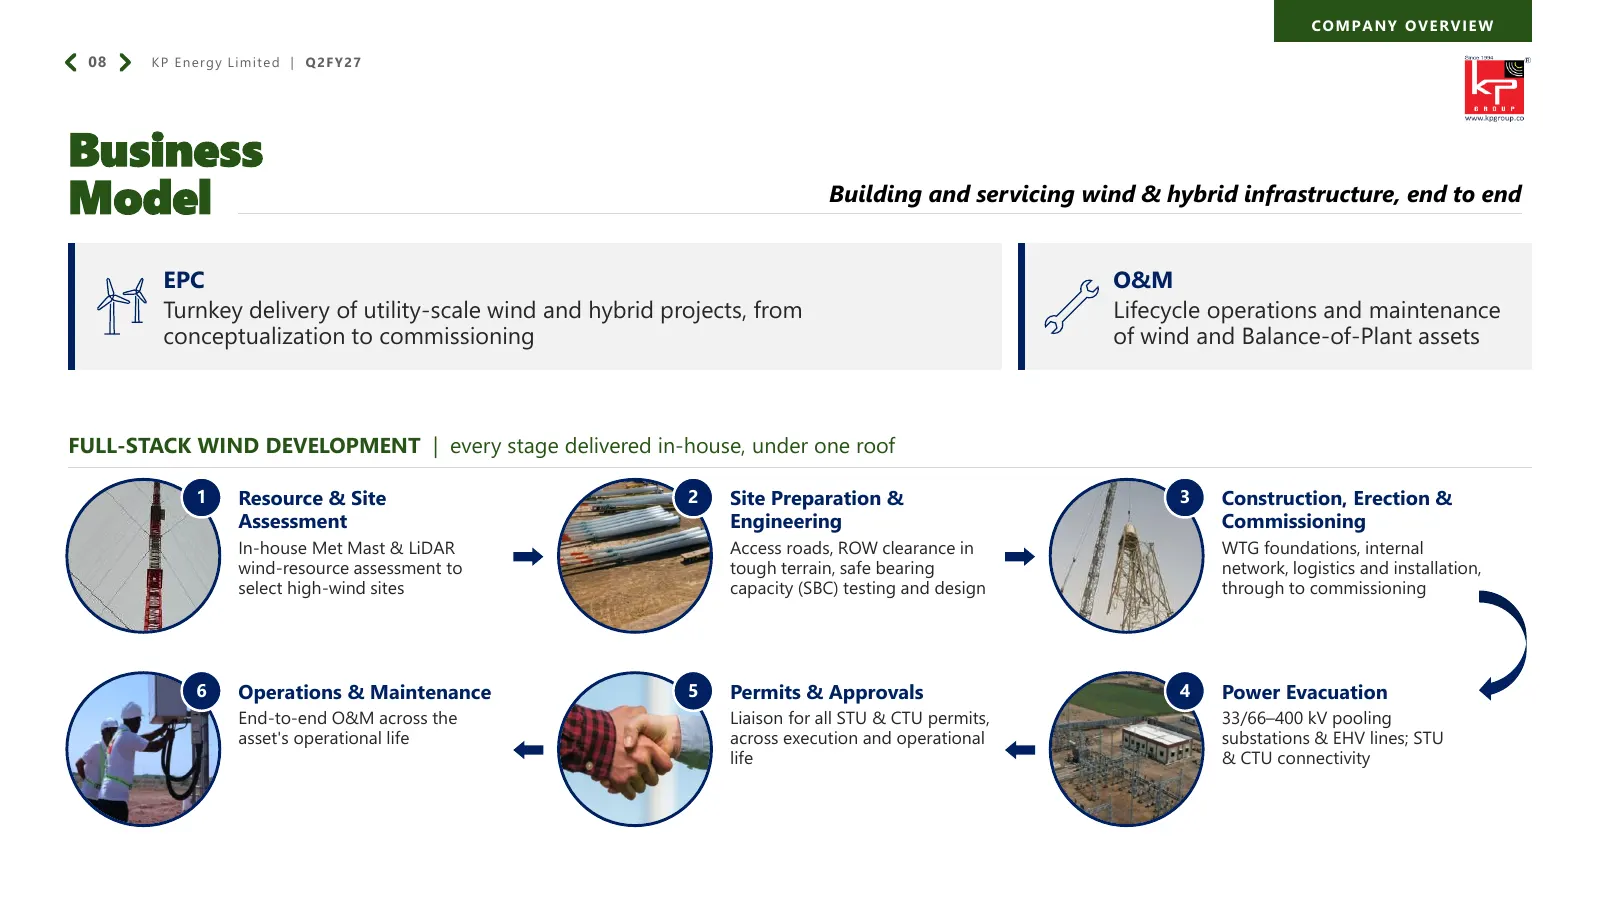
COMPANY OVERVIEW 08 K P E n e rgy L i m i t e d | Q 2 F Y 27 Business Model Building and servicing wind & hybrid infrastructure, end to end EPC O&M Turnkey delivery of utility-scale wind and hybrid projects, from Lifecycle operations and maintenance conceptualization to commissioning of wind and Bal
Slide 10: Strategic Growth Enablers
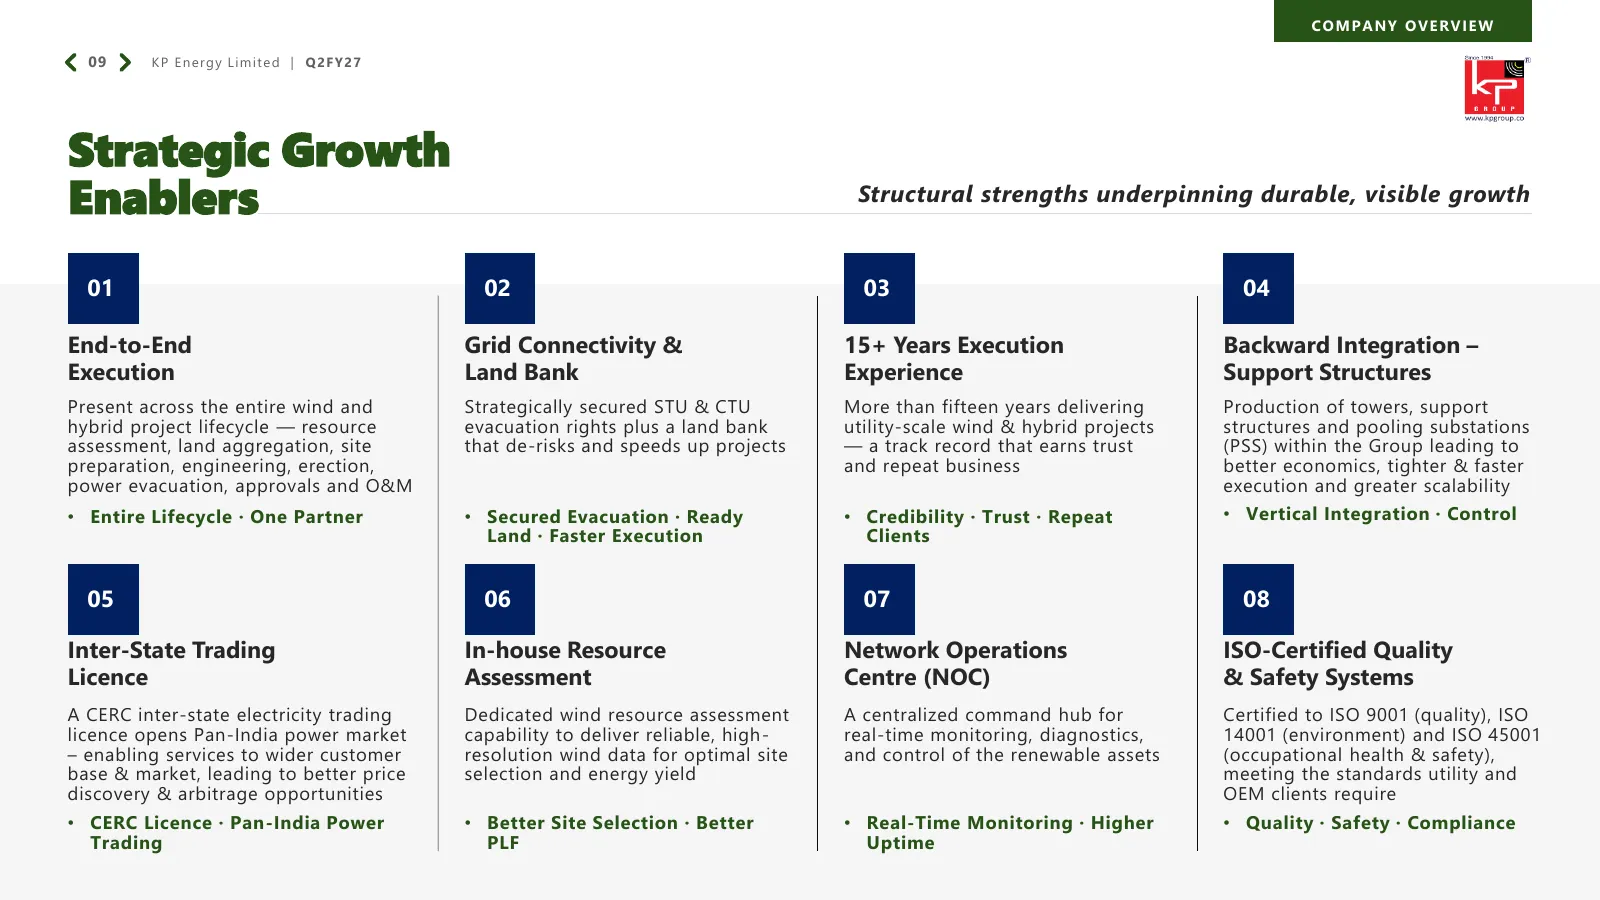
COMPANY OVERVIEW 09 K P E n e rgy L i m i t e d | Q 2 F Y 27 Strategic Growth Enablers Structural strengths underpinning durable, visible growth 01 02 03 04 End-to-End Grid Connectivity & 15+ Years Execution Backward Integration – Execution Land Bank Experience Support Structures Present across the
Slide 11: In-house Wind Resource Assessment Capabilities
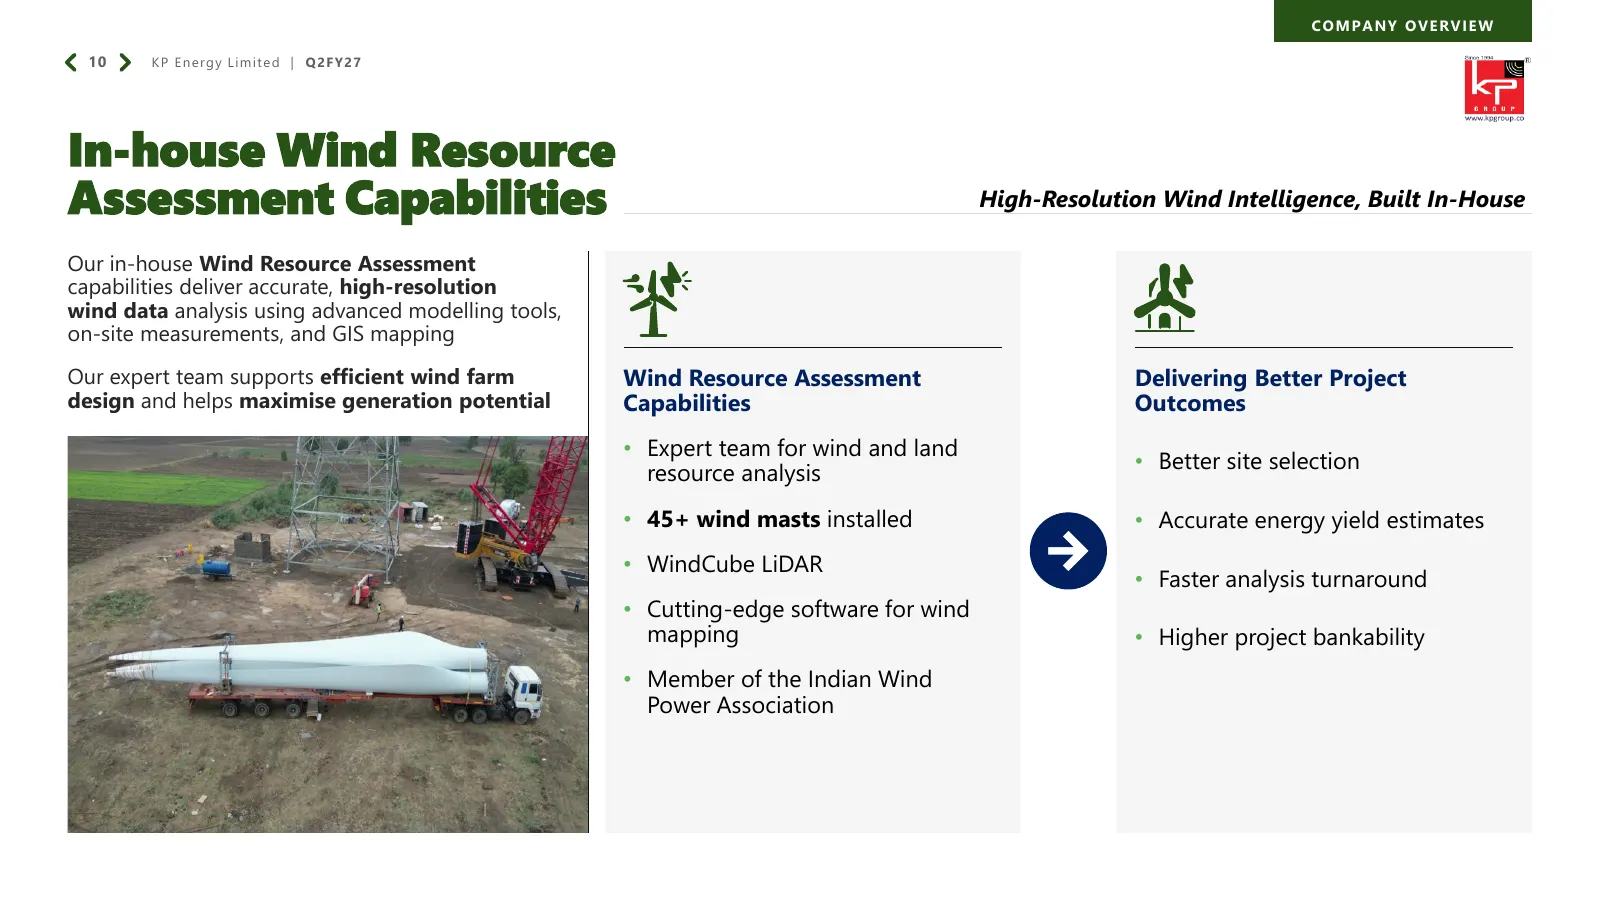
COMPANY OVERVIEW 10 K P E n e rgy L i m i t e d | Q 2 F Y 27 In-house Wind Resource Assessment Capabilities High-Resolution Wind Intelligence, Built In-House Our in-house Wind Resource Assessment capabilities deliver accurate, high-resolution wind data analysis using advanced modelling tools, on-sit
Slide 12: Network Operations Centre
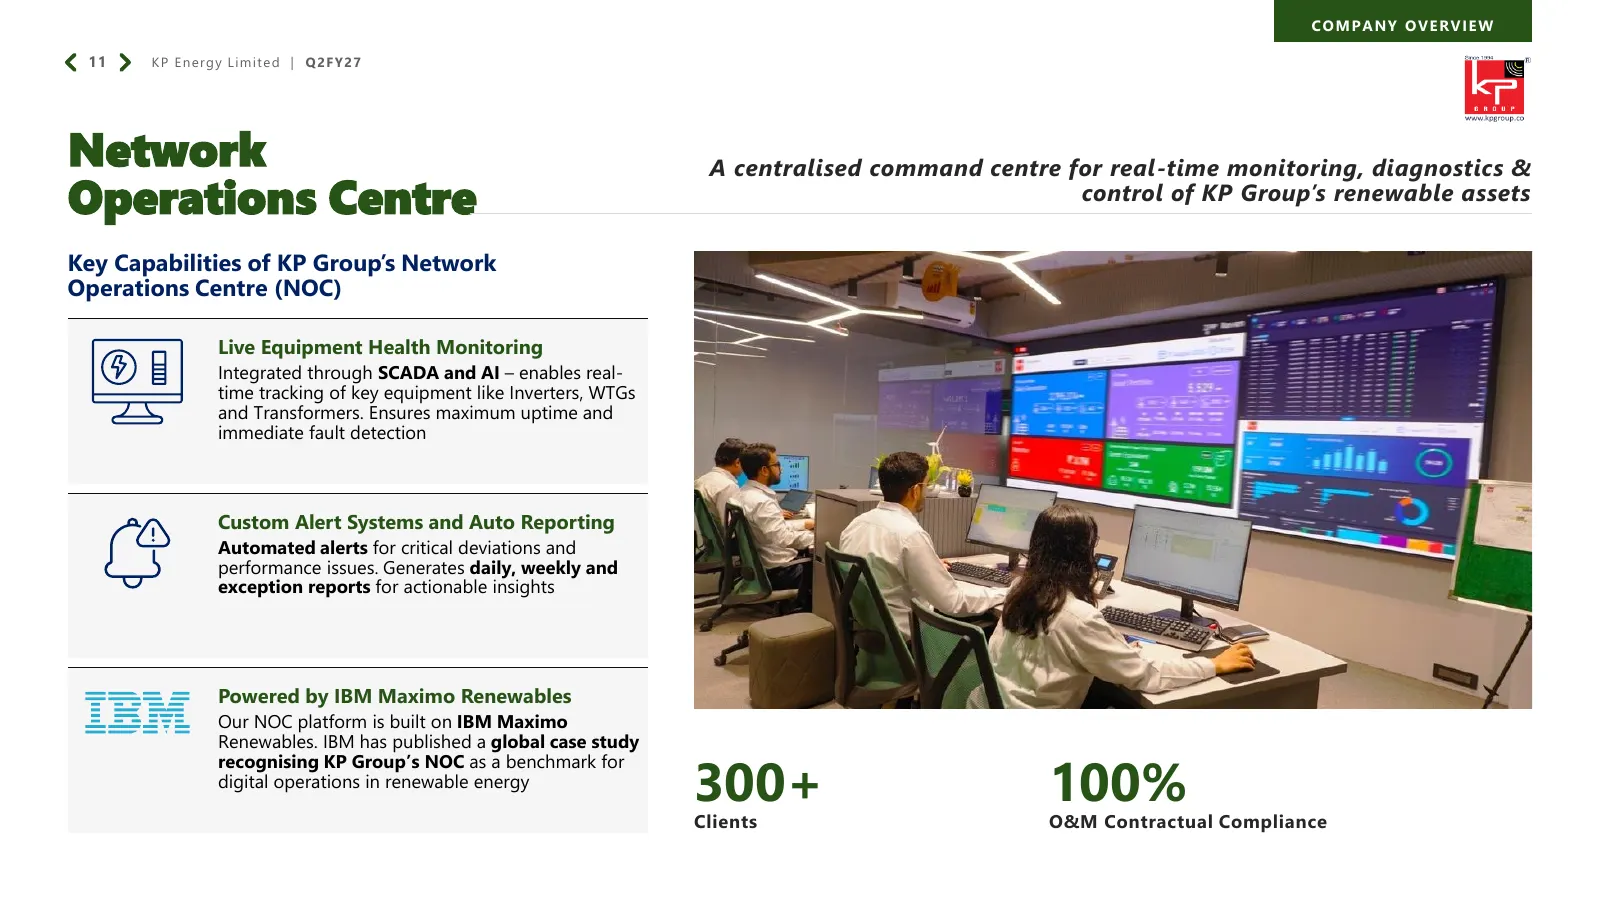
COMPANY OVERVIEW 11 K P E n e rgy L i m i t e d | Q 2 F Y 27 Network A centralised command centre for real-time monitoring, diagnostics & Operations Centre control of KP Group’s renewable assets Key Capabilities of KP Group’s Network Operations Centre (NOC) Live Equipment Health Monitoring Integrate
Slide 13: Board of Directors
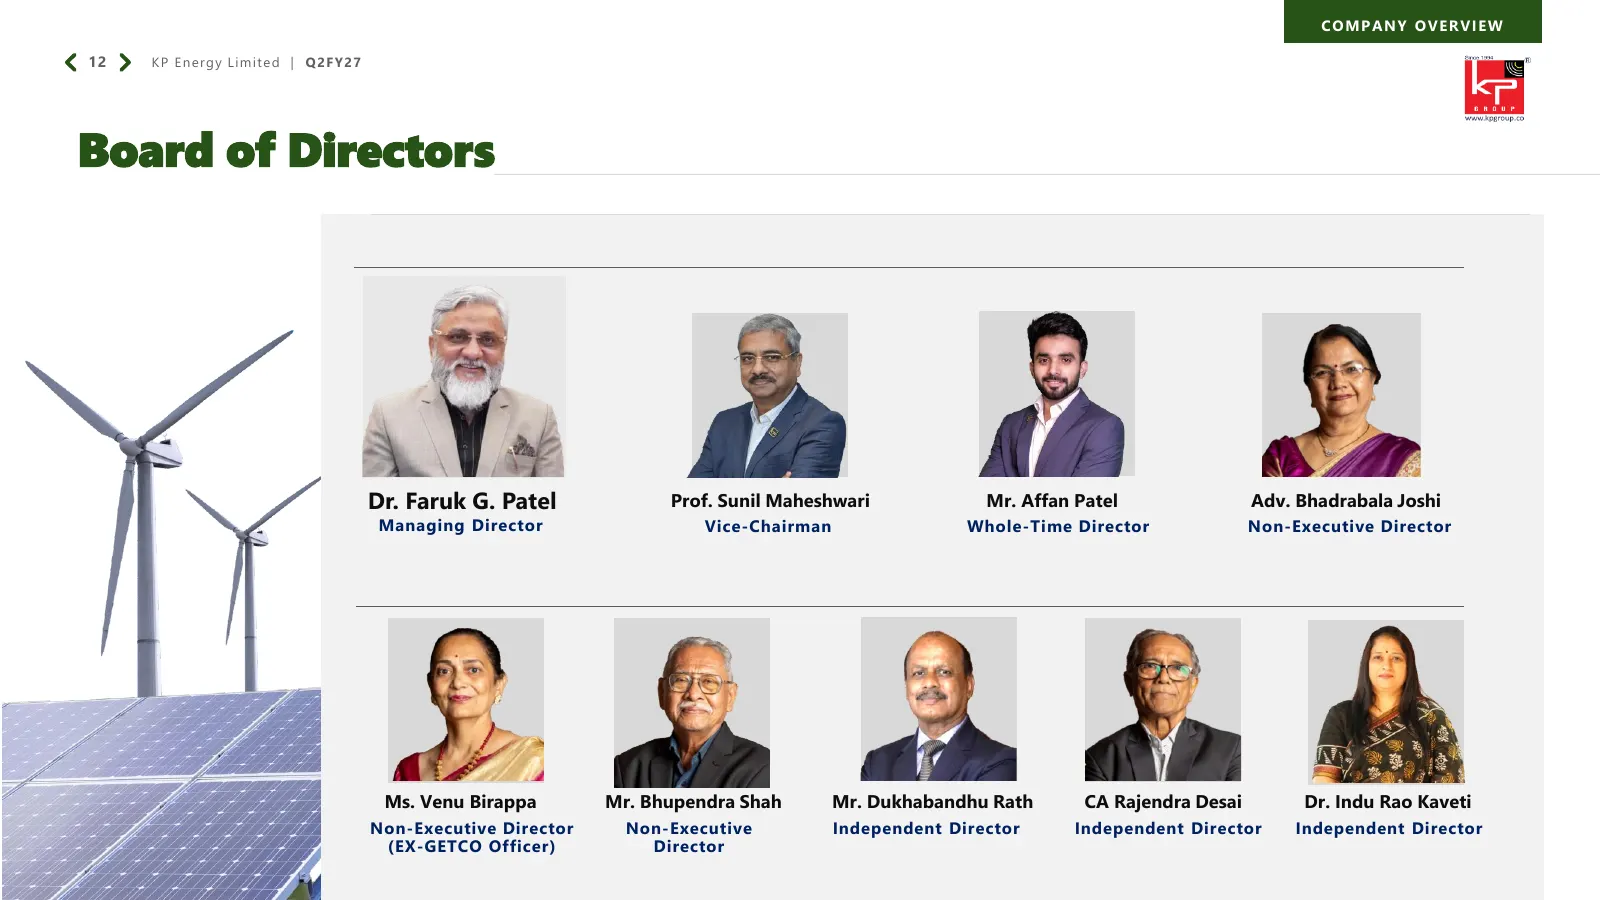
COMPANY OVERVIEW 12 K P E n e rgy L i m i t e d | Q 2 F Y 27 Board of Directors Dr. Faruk G. Patel Prof. Sunil Maheshwari Mr. Affan Patel Adv. Bhadrabala Joshi Managing Director Vice-Chairman Whole-Time Director Non-Executive Director Ms. Venu Birappa Mr. Bhupendra Shah Mr. Dukhabandhu Rath CA Rajen
Slide 14: Financials
Financials Q2 FY27 Ratdi Site
Slide 15: Q2 FY27 Financial Highlights
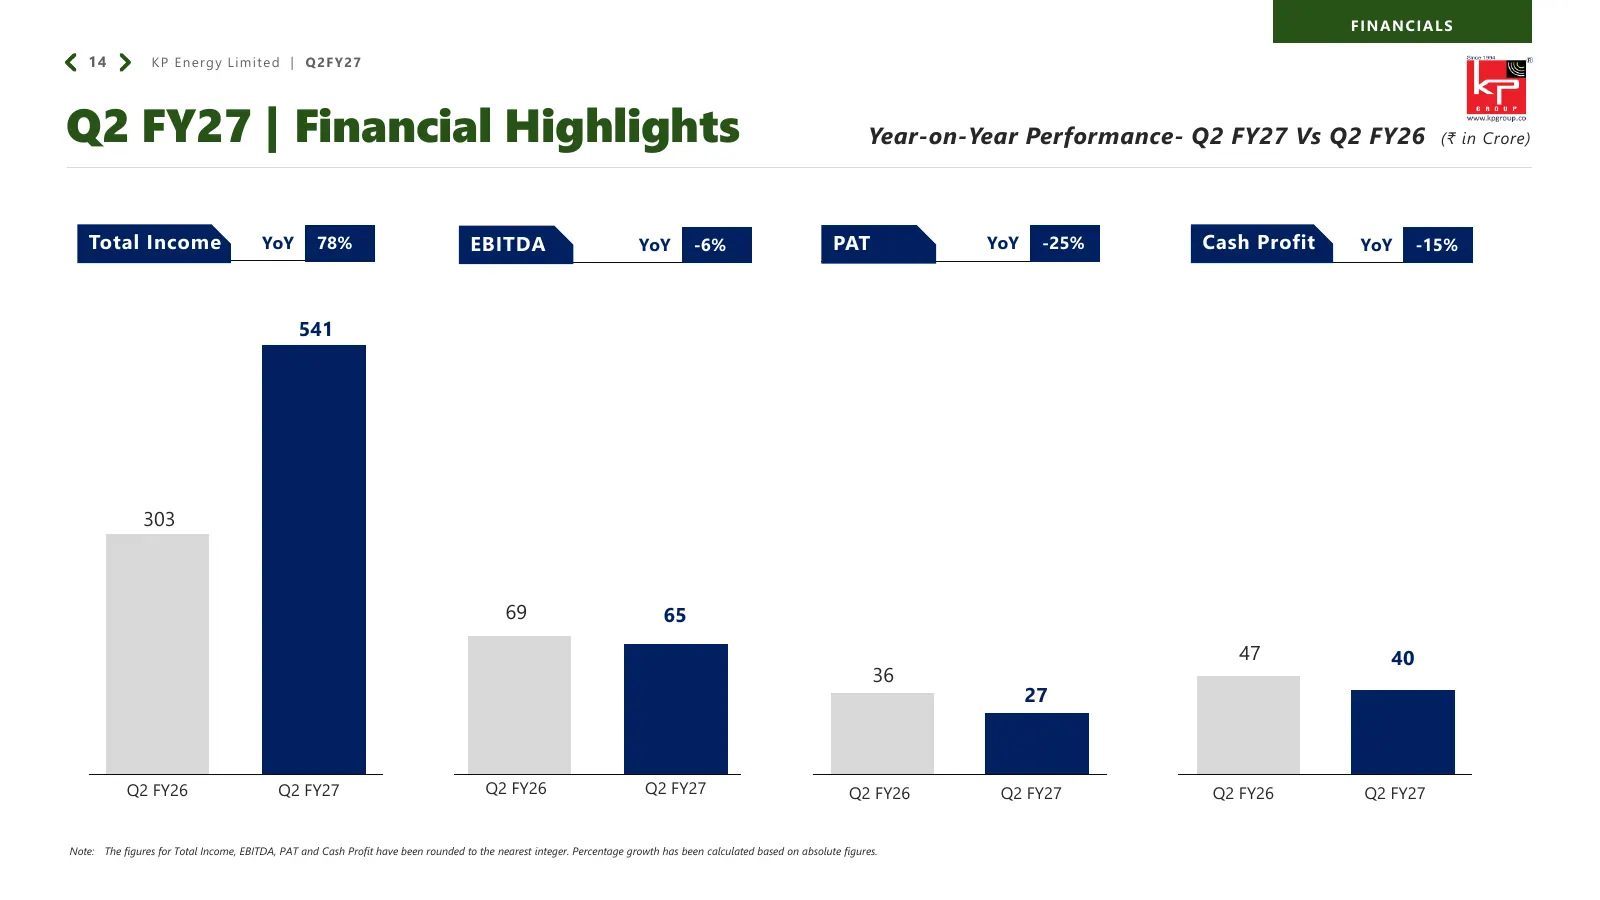
FINANCIALS 14 K P E n e rgy L i m i t e d | Q 2 F Y 27 Q2 FY27 | Financial Highlights Year-on-Year Performance- Q2 FY27 Vs Q2 FY26 (₹ in Crore) Total Income YoY 78% EBITDA YoY -6% PAT YoY -25% Cash Profit YoY -15% 541 303 69 65 47 40 36 27 Q2 FY26 Q2 FY27 Q2 FY26 Q2 FY27 Q2 FY26 Q2 FY27 Q2 FY26 Q2 F
Slide 16: H1 FY27 Balance Sheet Highlights
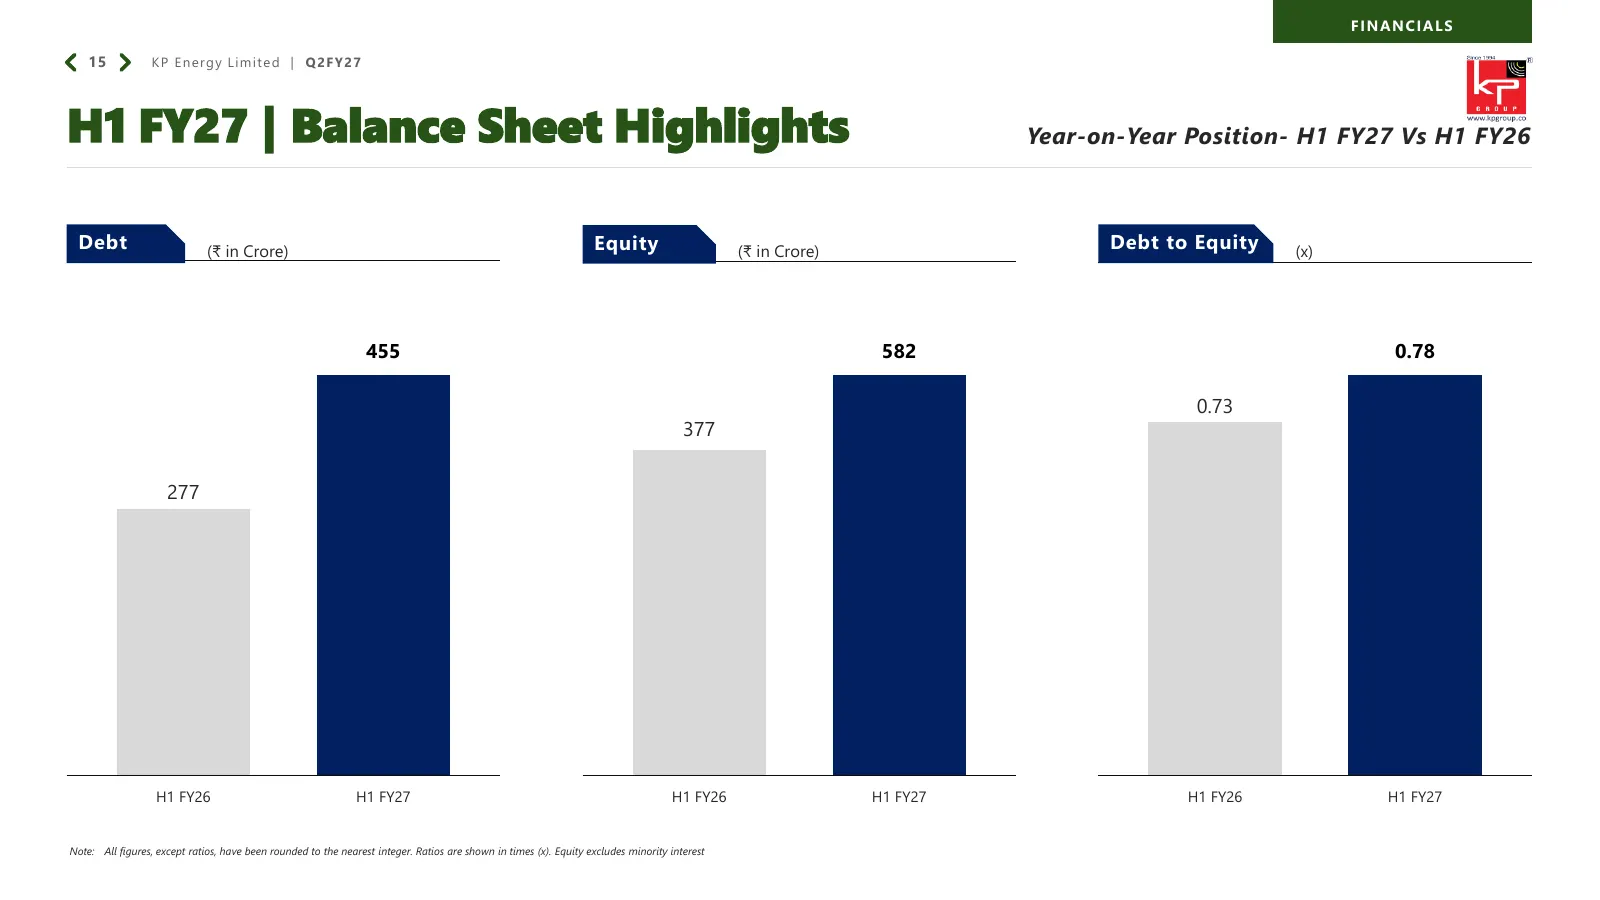
FINANCIALS 15 K P E n e rgy L i m i t e d | Q 2 F Y 27 H1 FY27 | Balance Sheet Highlights Year-on-Year Position- H1 FY27 Vs H1 FY26 Debt (₹ in Crore) Equity (₹ in Crore) Debt to Equity (x) 455 582 0.78 0.73 377 277 H1 FY26 H1 FY27 H1 FY26 H1 FY27 H1 FY26 H1 FY27 Note: All figures, except ratios, hav
Slide 17: Q2 FY27 Income Statement Summary
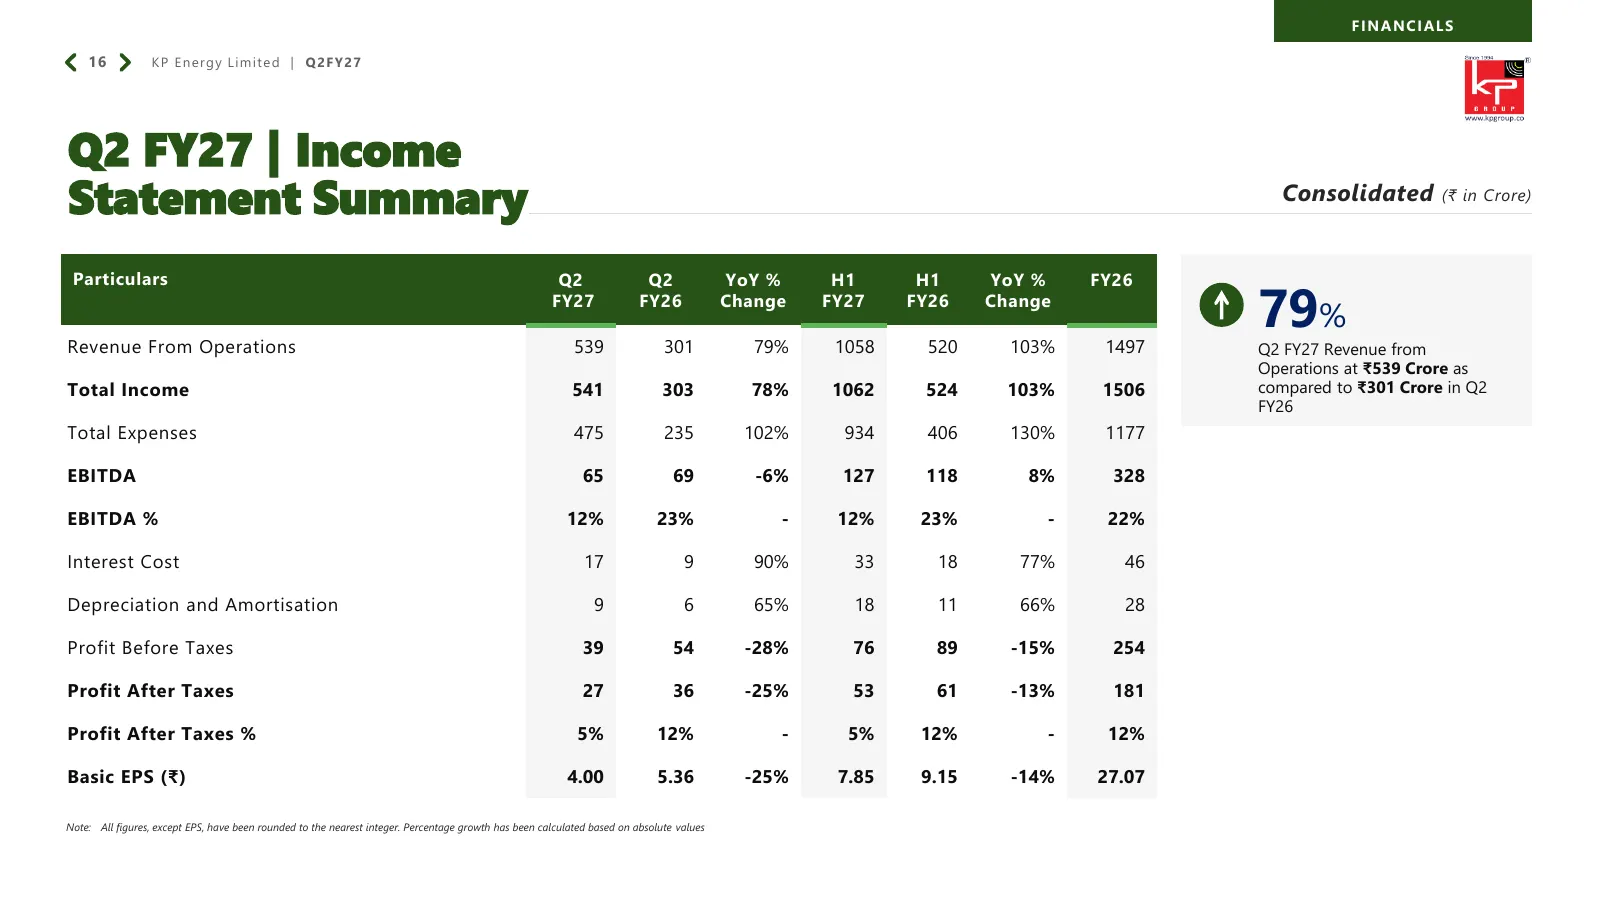
FINANCIALS 16 K P E n e rgy L i m i t e d | Q 2 F Y 27 Q2 FY27 | Income Statement Summary Consolidated (₹ in Crore) Particulars Q2 Q2 YoY % H1 H1 YoY % FY26 Revenue From Operations FY27 539 FY26 301 Change 79% FY27 1058 FY26 520 Change 103% 1497 79% Q2 FY27 Revenue from Operations at ₹539 Crore as T
Slide 18: H1 FY27 Balance Sheet Summary
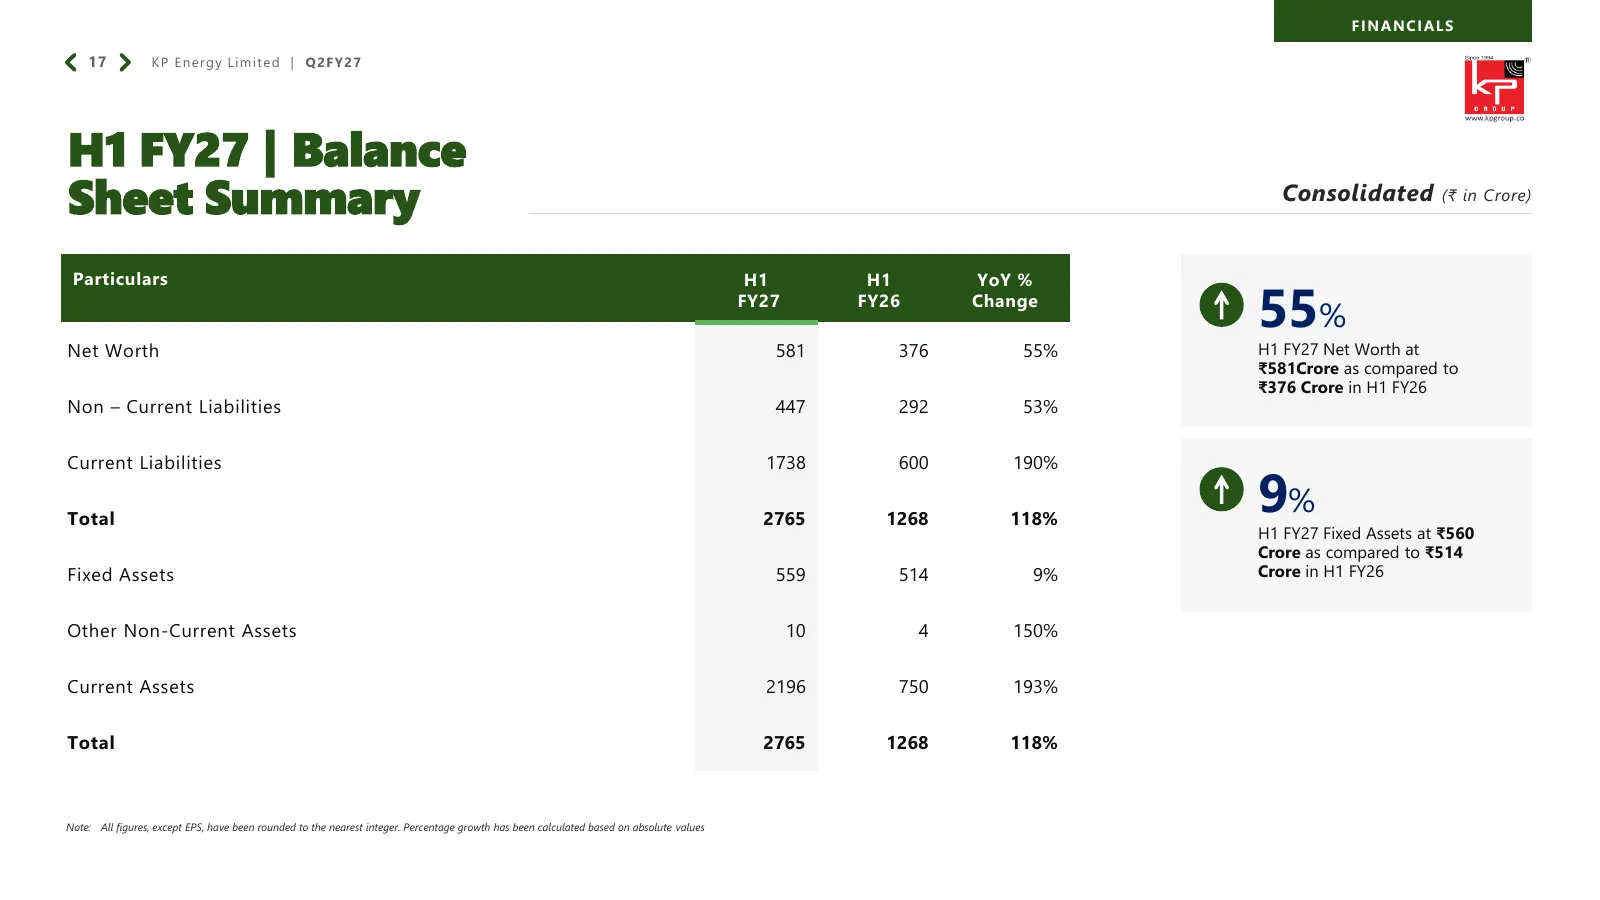
FINANCIALS 17 K P E n e rgy L i m i t e d | Q 2 F Y 27 H1 FY27 | Balance Sheet Summary Consolidated (₹ in Crore) Particulars H1 H1 YoY % FY27 FY26 Change 55% Net Worth 581 376 55% H1 FY27 Net Worth at ₹581Crore as compared to ₹376 Crore in H1 FY26 Non – Current Liabilities 447 292 53% Current Liabil
Slide 19: H1 FY27 Cash Flow Summary
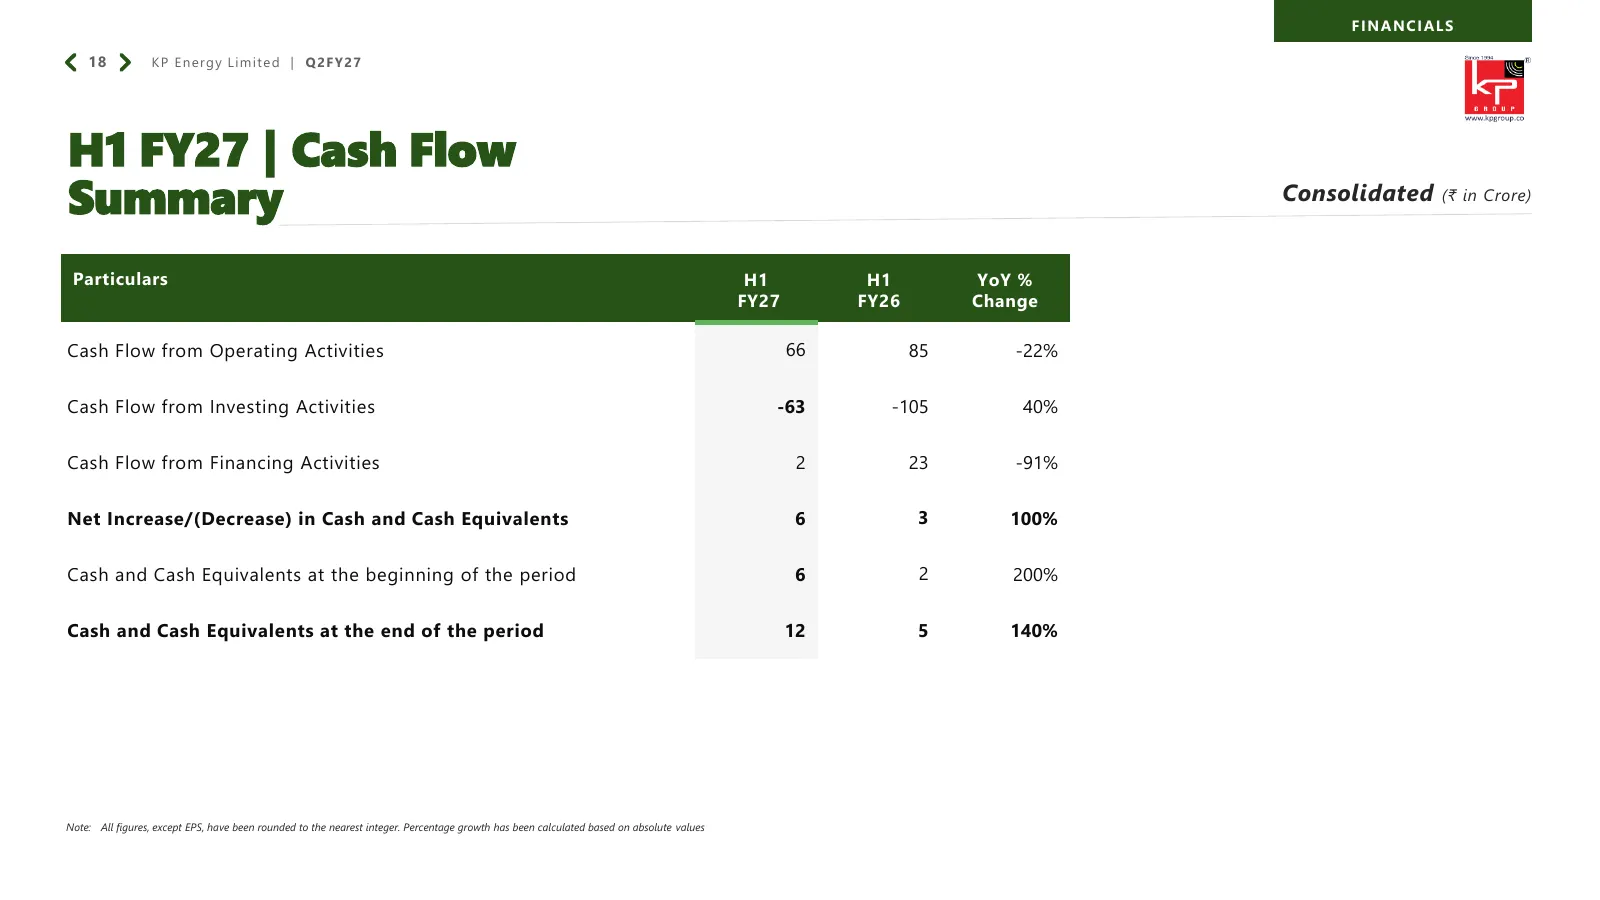
FINANCIALS 18 K P E n e rgy L i m i t e d | Q 2 F Y 27 H1 FY27 | Cash Flow Summary Consolidated (₹ in Crore) Particulars H1 H1 YoY % FY27 FY26 Change Cash Flow from Operating Activities 66 85 -22% Cash Flow from Investing Activities -63 -105 40% Cash Flow from Financing Activities 2 23 -91% Net Incr
Slide 20: About KP Group
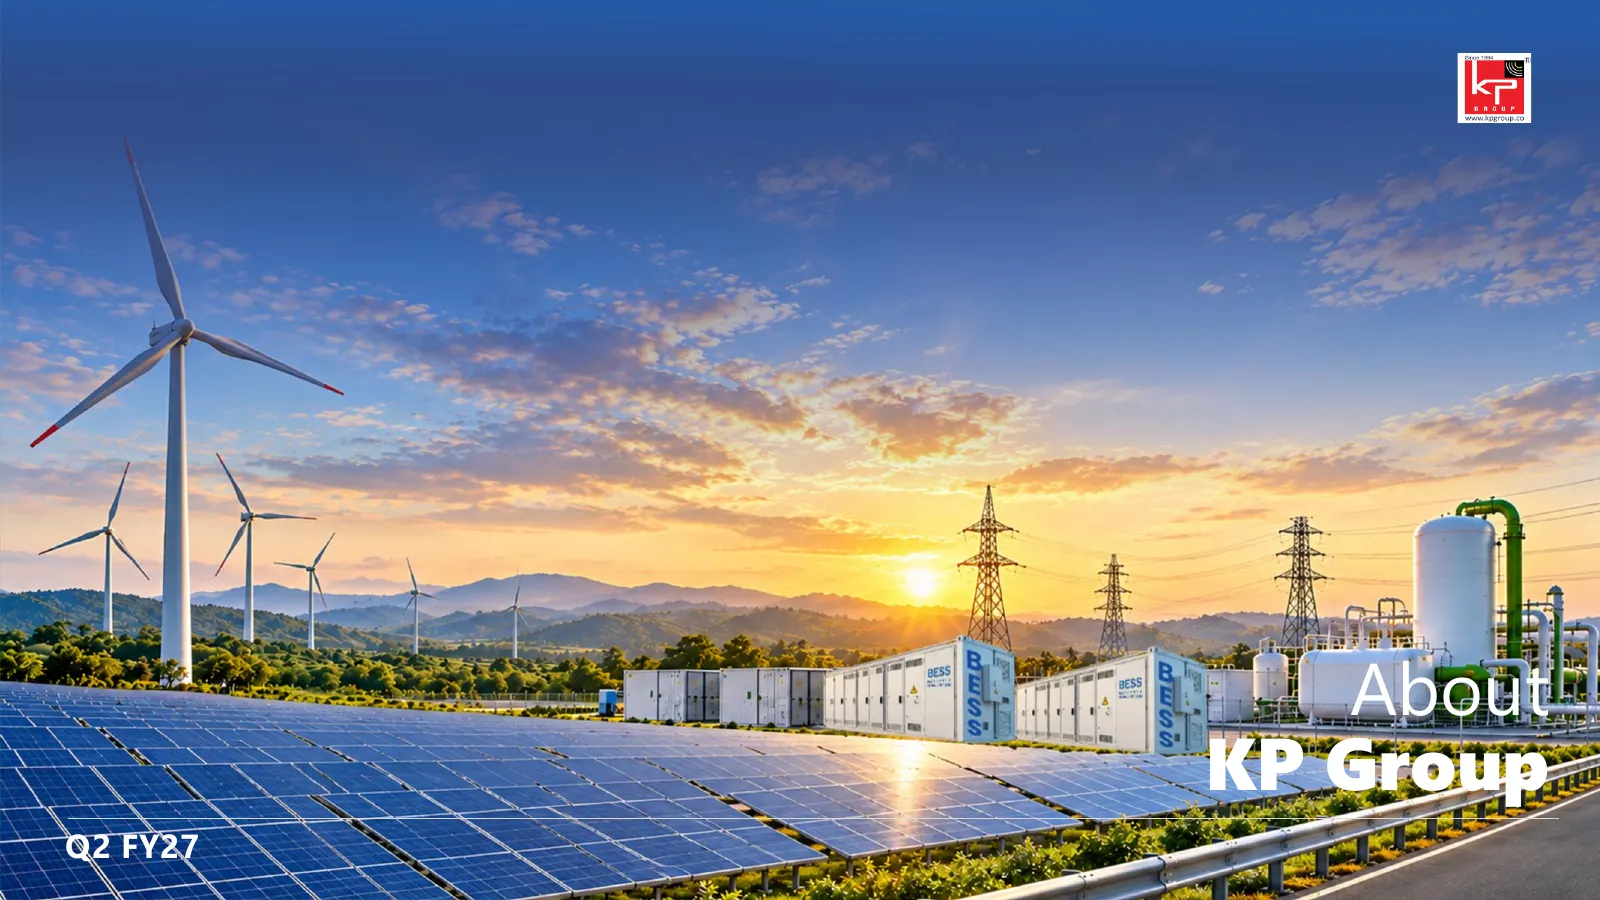
About KP Group Q2 FY27
Slide 21: KP Group
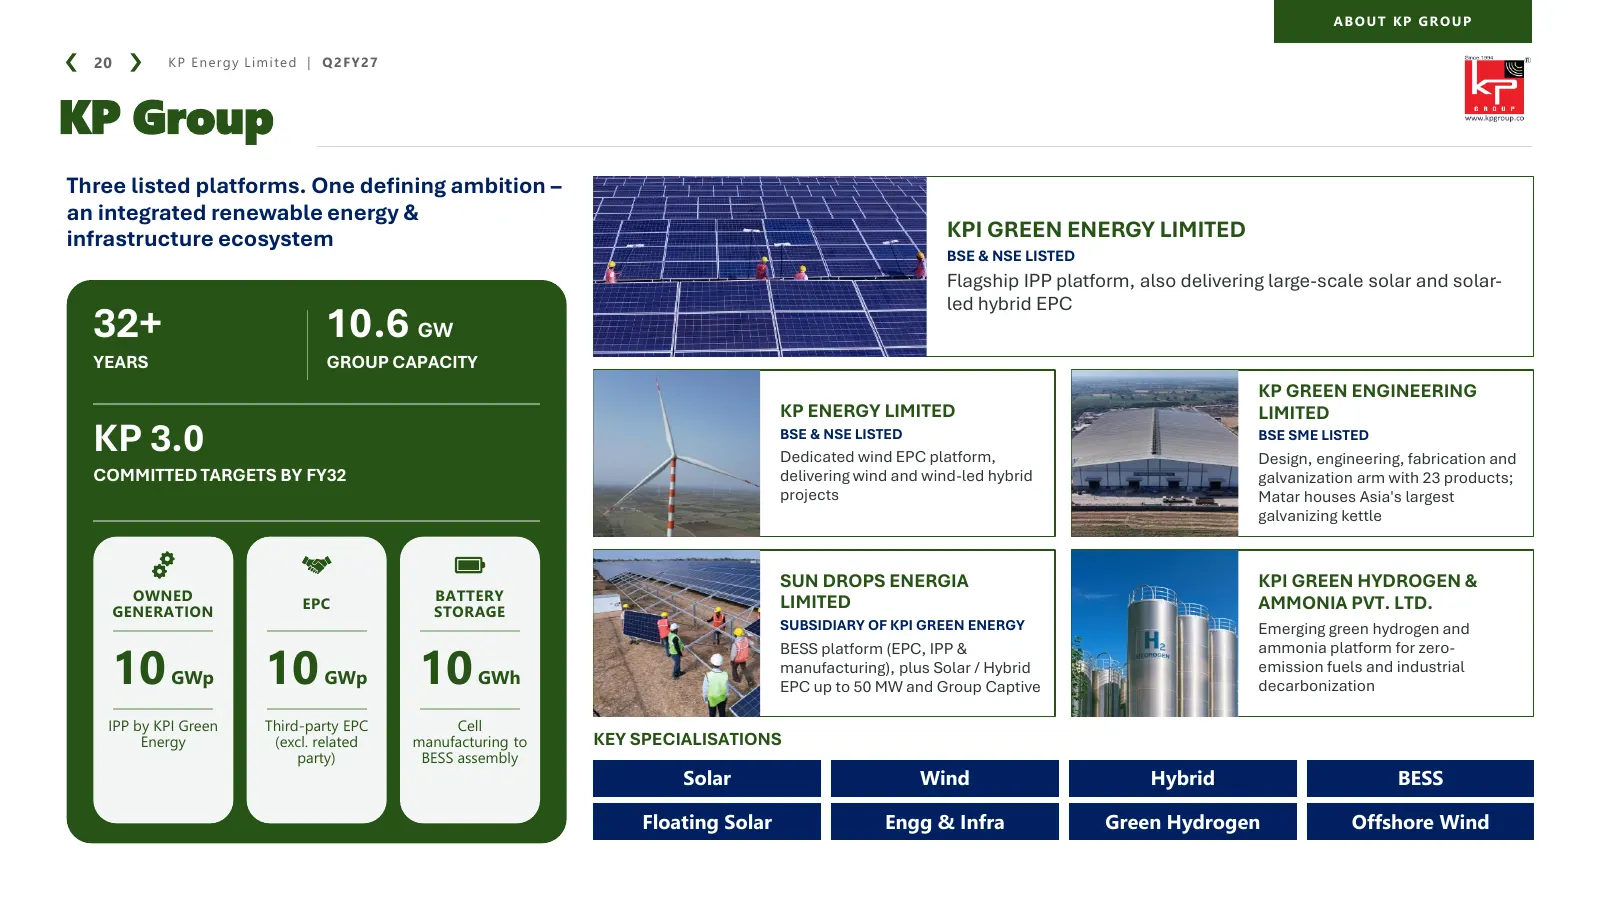
ABOUT KP GROUP 20 K P E n e rgy L i m i t e d | Q 2 F Y 27 KP Group Three listed platforms. One defining ambition – an integrated renewable energy & infrastructure ecosystem KPI GREEN ENERGY LIMITED BSE & NSE LISTED Flagship IPP platform, also delivering large-scale solar and solar- led hybrid EPC 3
Slide 22: Realignment of Business Structure
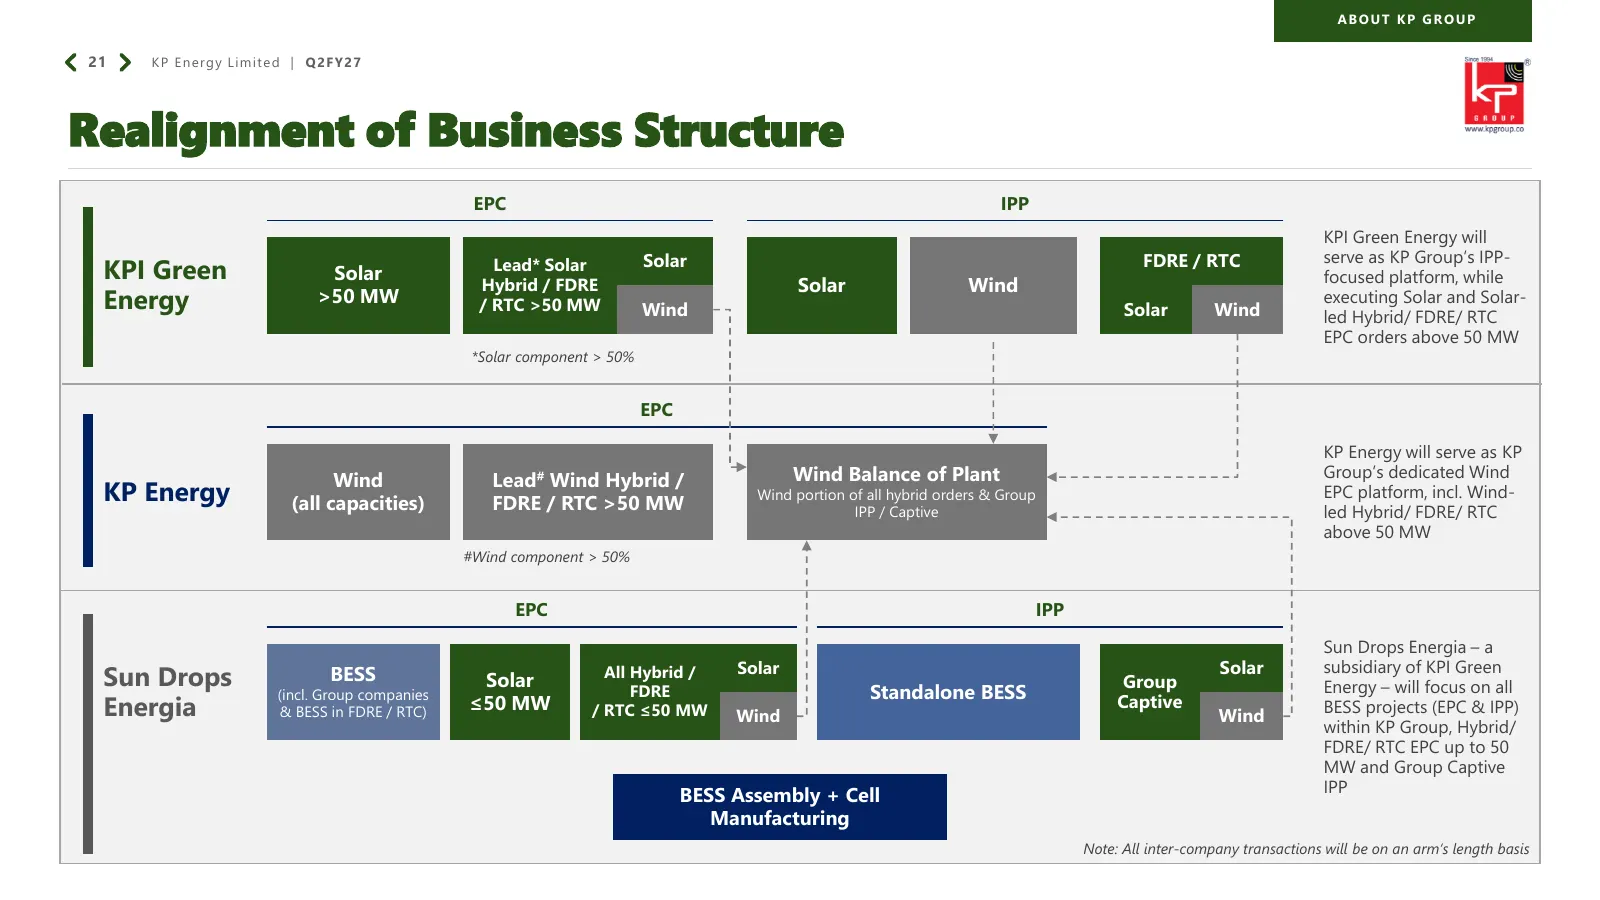
ABOUT KP GROUP 21 K P E n e rgy L i m i t e d | Q 2 F Y 27 Realignment of Business Structure EPC IPP KPI Green Energy will Solar FDRE / RTC serve as KP Group’s IPP- KPI Green Solar Lead* Solar Hybrid / FDRE Solar Wind focused platform, while Energy >50 MW / RTC >50 MW Wind Solar Wind executing Solar
Slide 23: Realignment of Business Structure
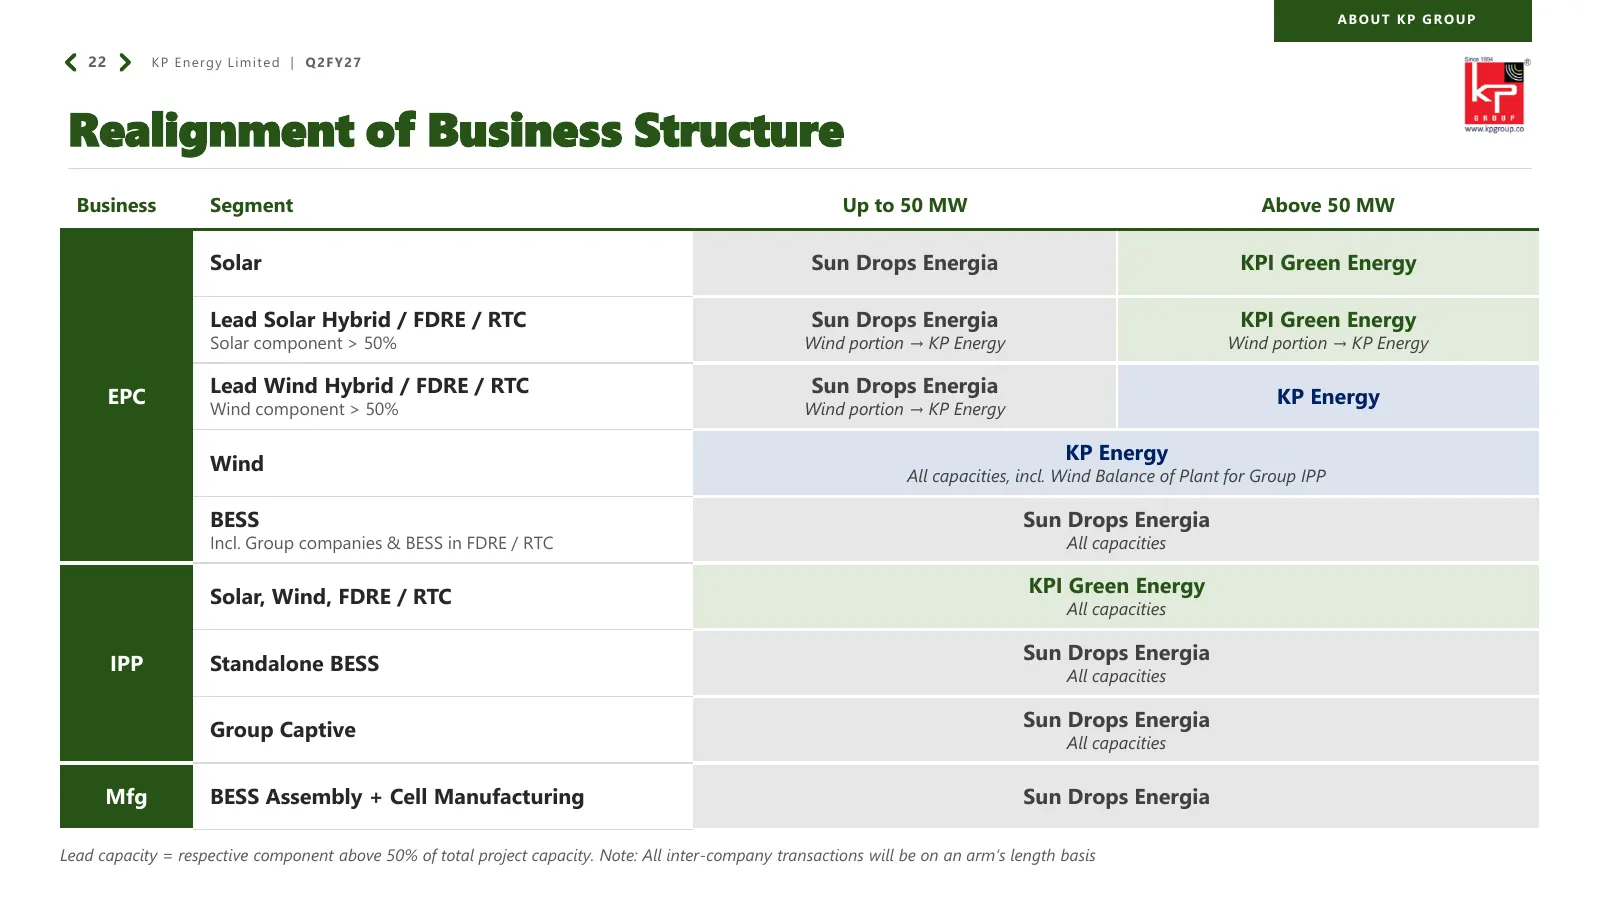
ABOUT KP GROUP 22 K P E n e rgy L i m i t e d | Q 2 F Y 27 Realignment of Business Structure Business Segment Up to 50 MW Above 50 MW Solar Sun Drops Energia KPI Green Energy Lead Solar Hybrid / FDRE / RTC Sun Drops Energia KPI Green Energy Solar component > 50% Wind portion → KP Energy Wind portion

Slide 24: Humanitarian Services Driven by Passion
ABOUT KP GROUP 23 K P E n e rgy L i m i t e d | Q 2 F Y 27 Humanitarian Services Driven by Passion KP Human Development EDUCATION Foundation also HEALTH supports aspiring civil services candidates in their exam preparation, benefiting 15 students and helping them pursue their dreams of serving the n
Slide 25: Contact Us
24 K P E n e rgy L i m i t e d | Q 2 F Y 27 Contact Us KP ENERGY LIMITED OFFICE ADDRESS: ‘KP House’, Near KP Circle, Opp Ishwar Farm Junction BRTS, Canal Road, Bhatar, Surat - 395 017, Gujarat, India +91 261 2234757 www.kpenergy.in INVESTOR ENQUIRIES ir.kpenergy@kpgroup.co / secretarial@kpgroup.co K
Slide 26: Disclaimer
25 K P E n e rgy L i m i t e d | Q 2 F Y 27 Disclaimer No representation or warranty, express or implied, is made as to, and no reliance should be placed on, the fairness, accuracy, completeness or correctness of the information or opinions contained in this presentation. Such information and opinio
Source: NSE filing, Nov 13, 2026
More decks from K.P. Energy Ltd.
 Investor Day (September 2026)65 slides · Sep 30, 2026
 Q1 FY27 Earnings Presentation28 slides · Aug 11, 2026
 FY2026 Earnings Presentation29 slides · May 7, 2026
 Q3 FY2026 Earnings Presentation26 slides · Jan 21, 2026
 H1 FY2026 Earnings Presentation28 slides · Nov 7, 2025
 Q1 FY2026 Earnings Presentation27 slides · Aug 5, 2025