Axelum Resources Corp. · PSE:AXLM
Axelum Resources — Q3 2020 Earnings Presentation
8 slides from Axelum Resources's earnings presentation, Nov 12, 2020

Slide 1: 3rd Quarter 2020 Financial Results
3rd Quarter 2020 Financial Results November 12, 2020
Slide 2: Agenda
01 Key Highlights 02 Financial Summary 03 Revenue Breakdown 04 Current Initiatives 2
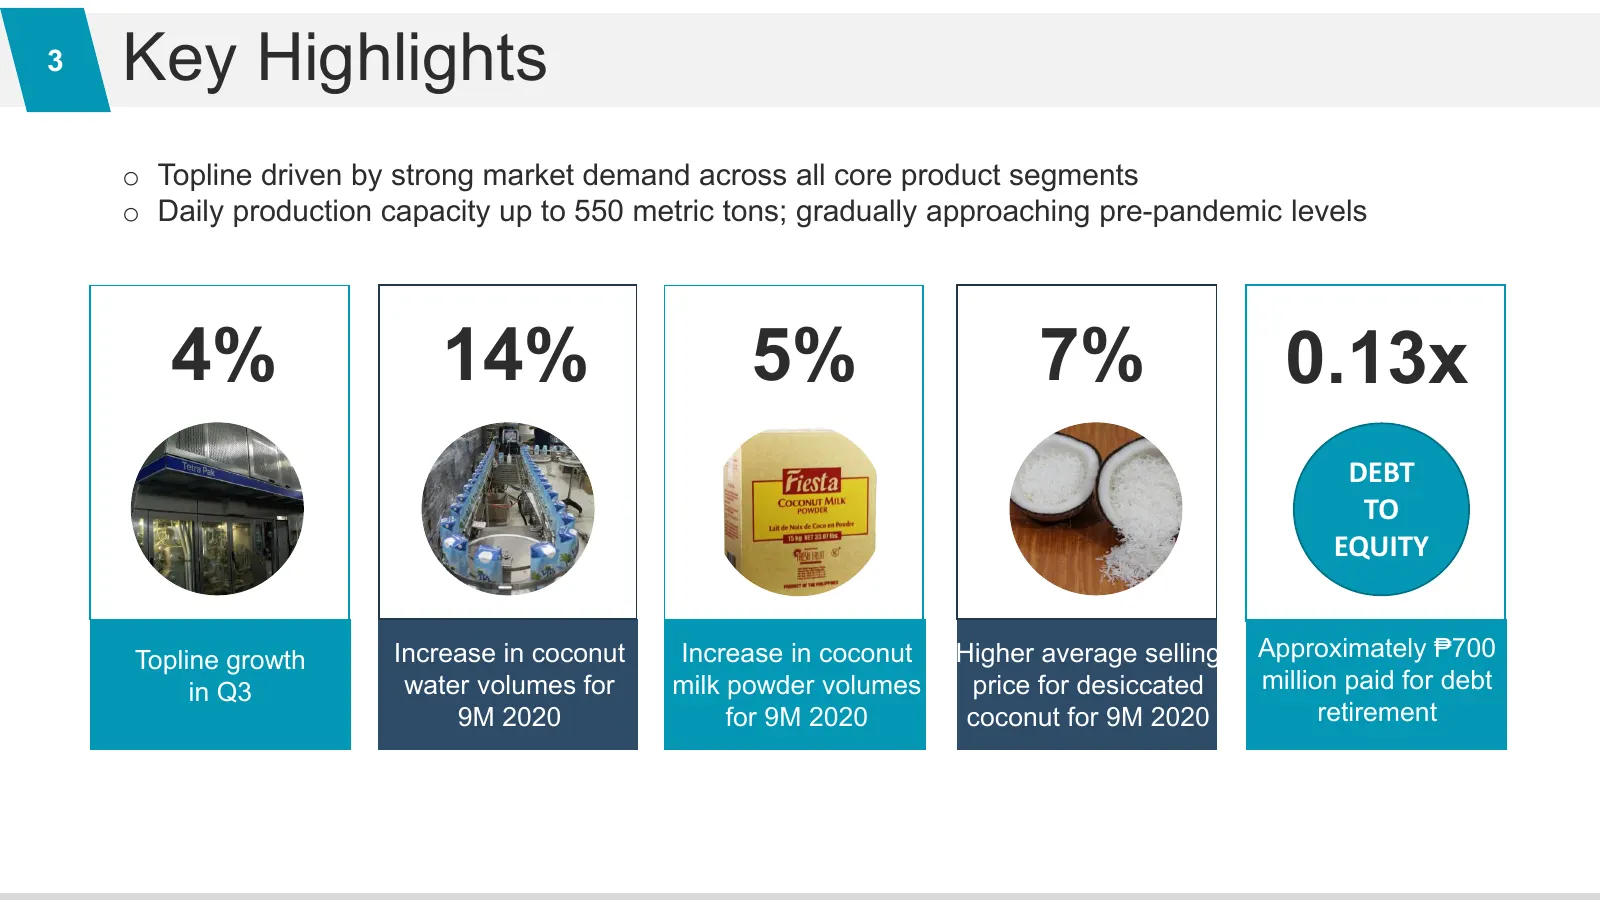
Slide 3: Key Highlights
3 Key Highlights o Topline driven by strong market demand across all core product segments o Daily production capacity up to 550 metric tons; gradually approaching pre-pandemic levels 4% 14% 5% 7% 0.13x DEBT TO EQUITY Topline growth Increase in coconut Increase in coconut Higher average selling Appr
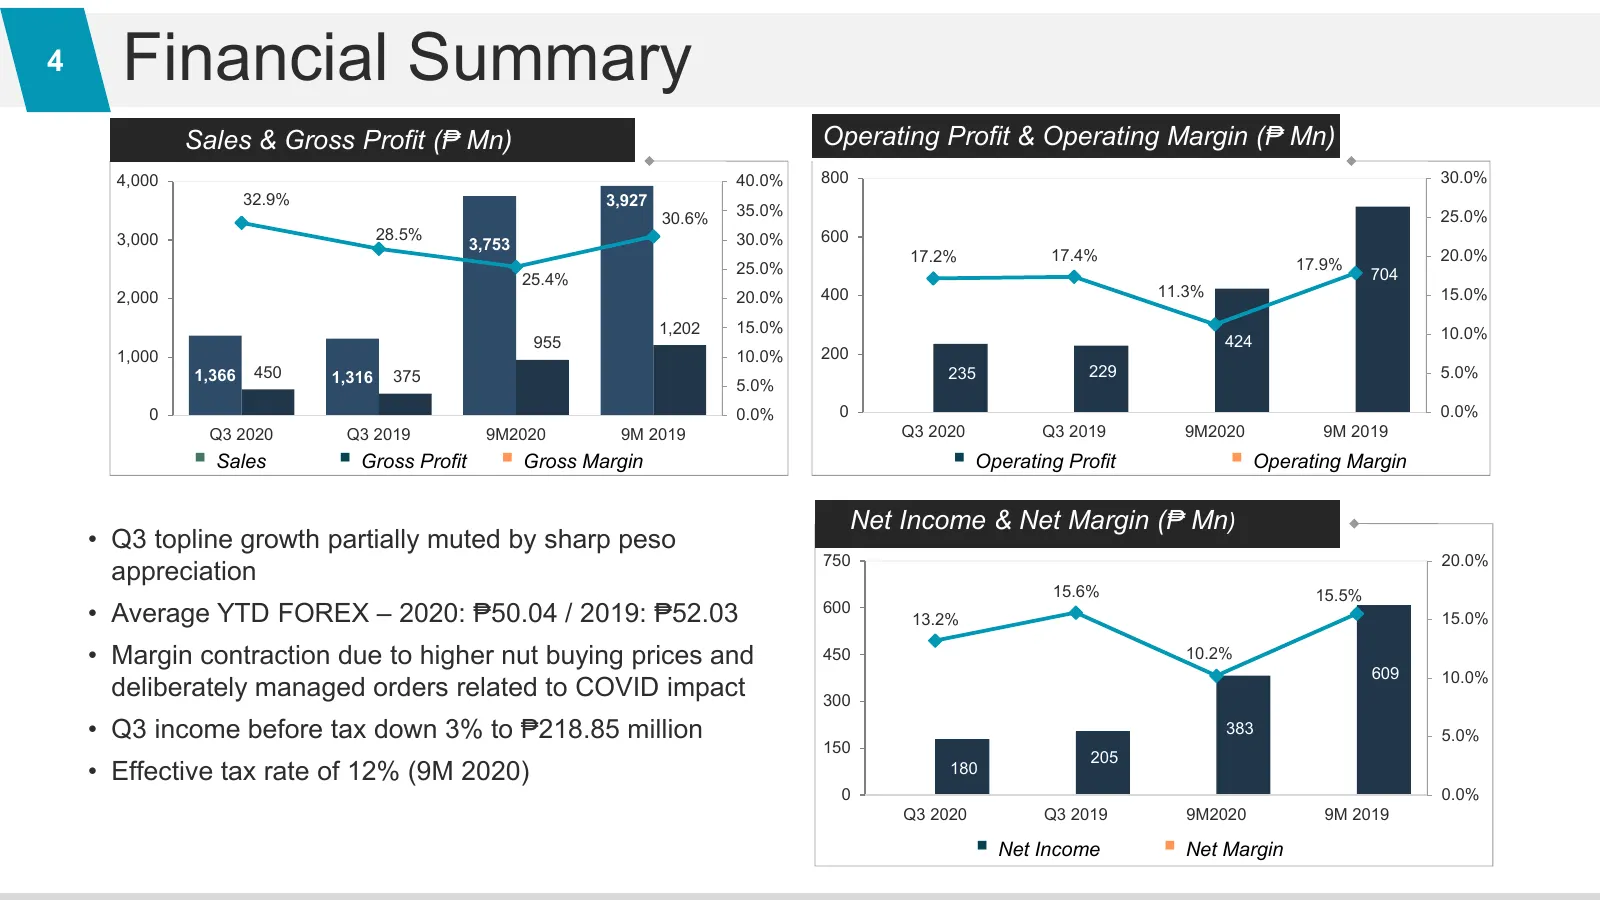
Slide 4: Financial Summary
4 Financial Summary Sales & Gross Profit (₱ Mn) Operating Profit & Operating Margin (₱ Mn) 4,000 40.0% 800 30.0% 32.9% 3,927 30.6% 35.0% 25.0% 3,000 28.5% 30.0% 600 3,753 17.2% 17.4% 20.0% 25.0% 17.9% 25.4% 704 2,000 20.0% 400 11.3% 15.0% 1,202 15.0% 10.0% 955 424 1,000 10.0% 200 1,366 450 1,316 375
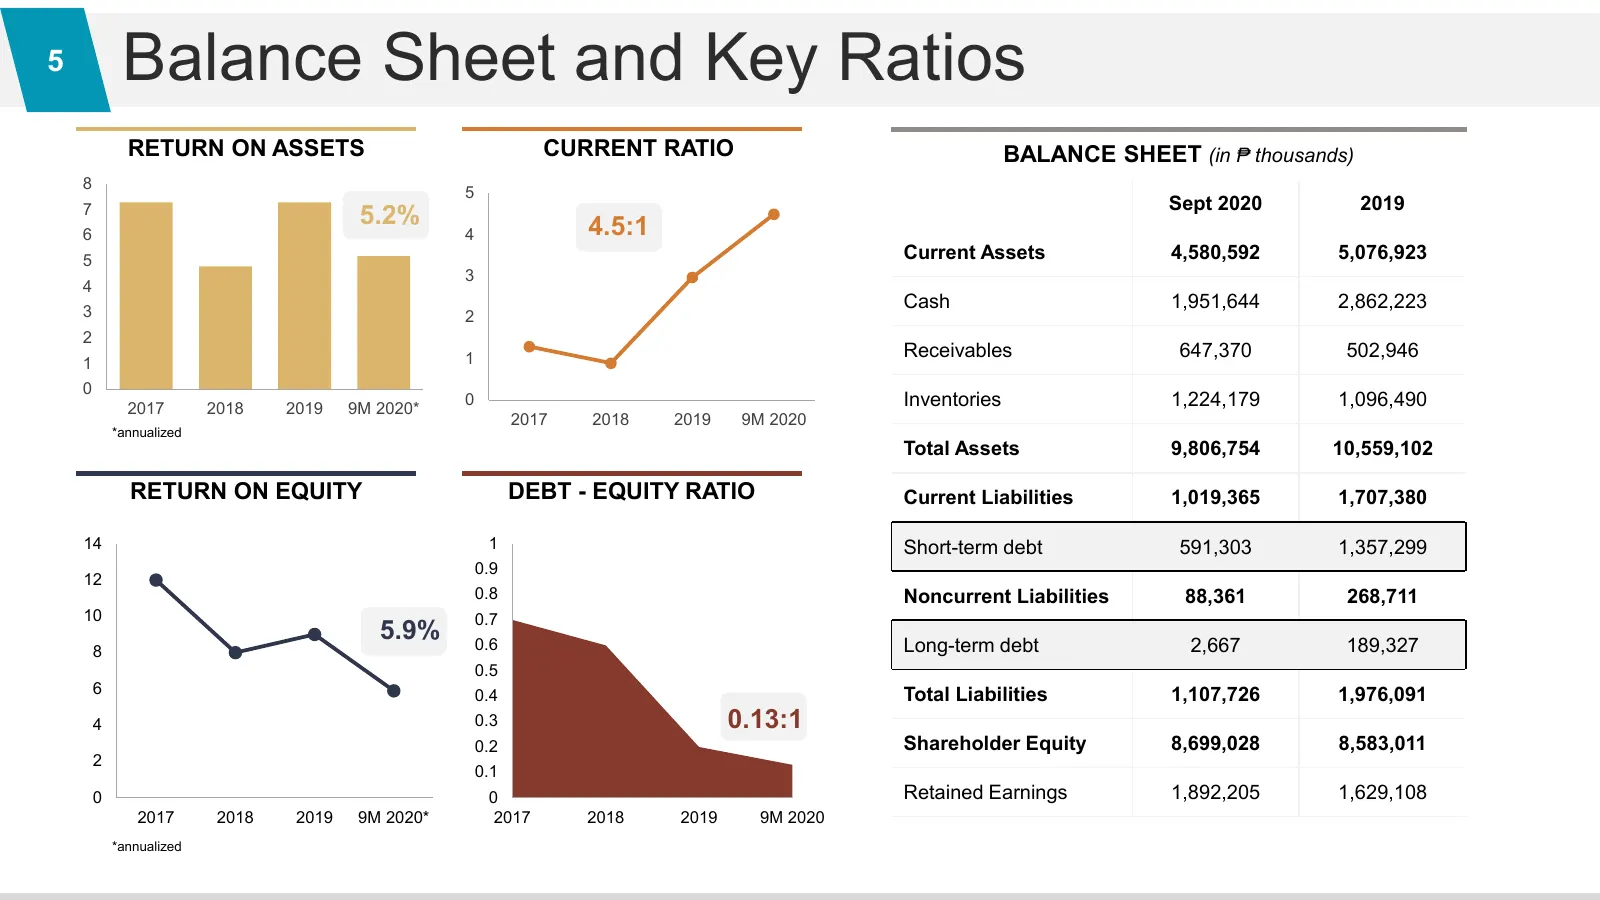
Slide 5: Balance Sheet and Key Ratios
5 Balance Sheet and Key Ratios RETURN ON ASSETS CURRENT RATIO BALANCE SHEET (in ₱ thousands) 8 5 7 Sept 2020 2019 5.2% 4.5:1 6 4 5 Current Assets 4,580,592 5,076,923 3 4 3 Cash 1,951,644 2,862,223 2 2 1 Receivables 647,370 502,946 1 0 2017 2018 2019 9M 2020* 0 Inventories 1,224,179 1,096,490 2017 20
Slide 6: Cash Flow and Stock Performance
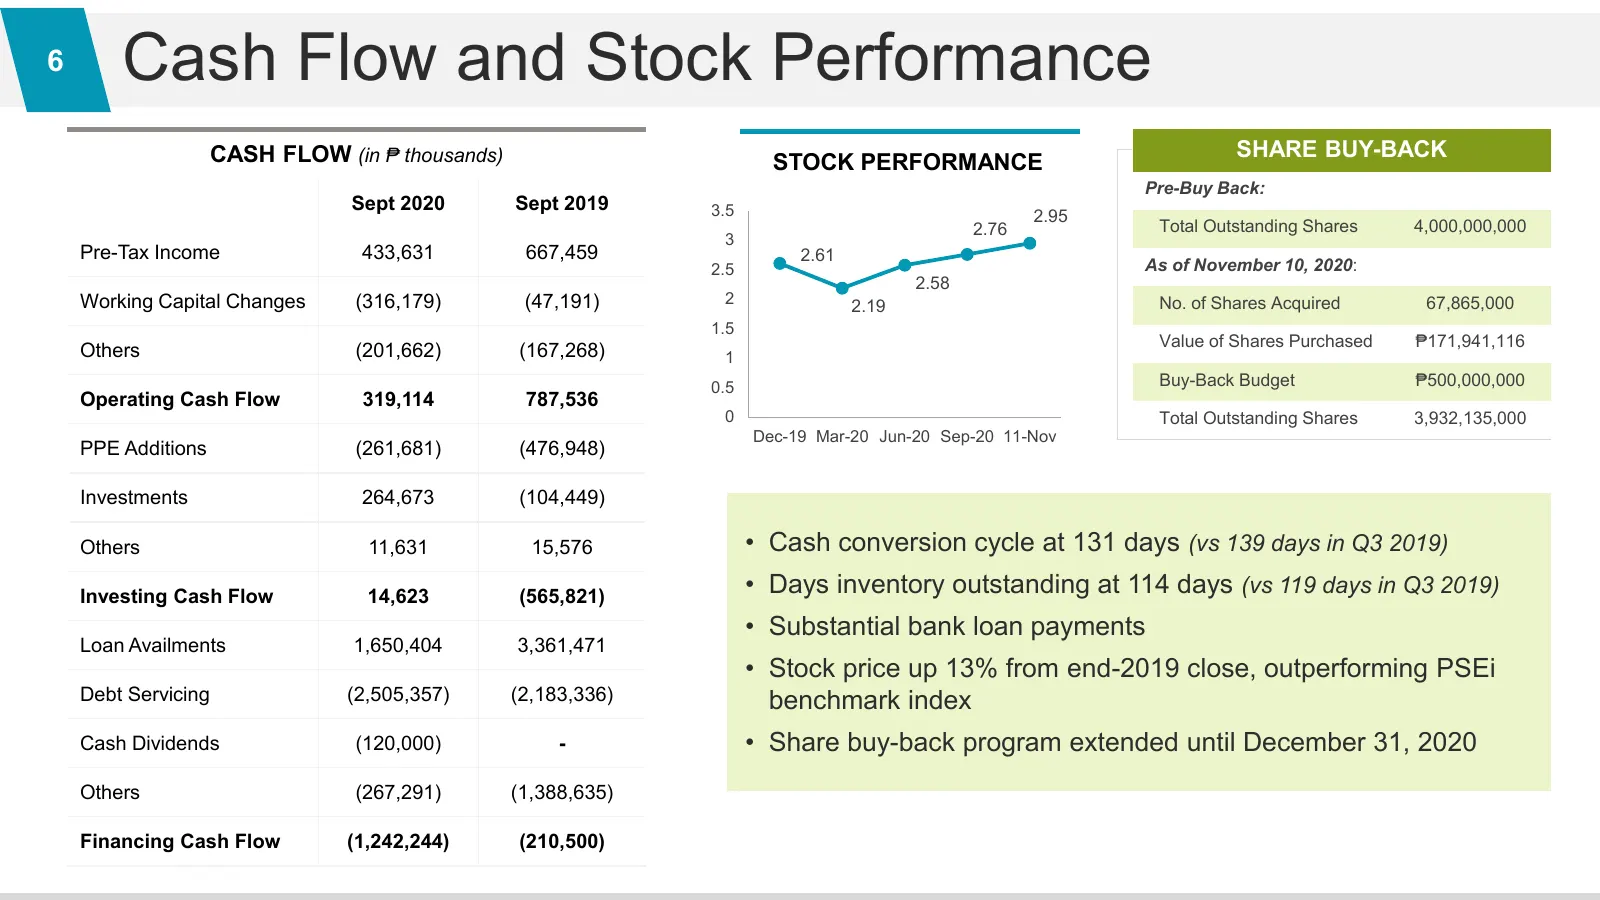
6 Cash Flow and Stock Performance CASH FLOW (in ₱ thousands) SHARE BUY-BACK STOCK PERFORMANCE Pre-Buy Back: Sept 2020 Sept 2019 3.5 2.95 2.76 Total Outstanding Shares 4,000,000,000 3 Pre-Tax Income 433,631 667,459 2.61 2.5 As of November 10, 2020: 2.58 Working Capital Changes (316,179) (47,191) 2 2.
Slide 7: Revenue Breakdown
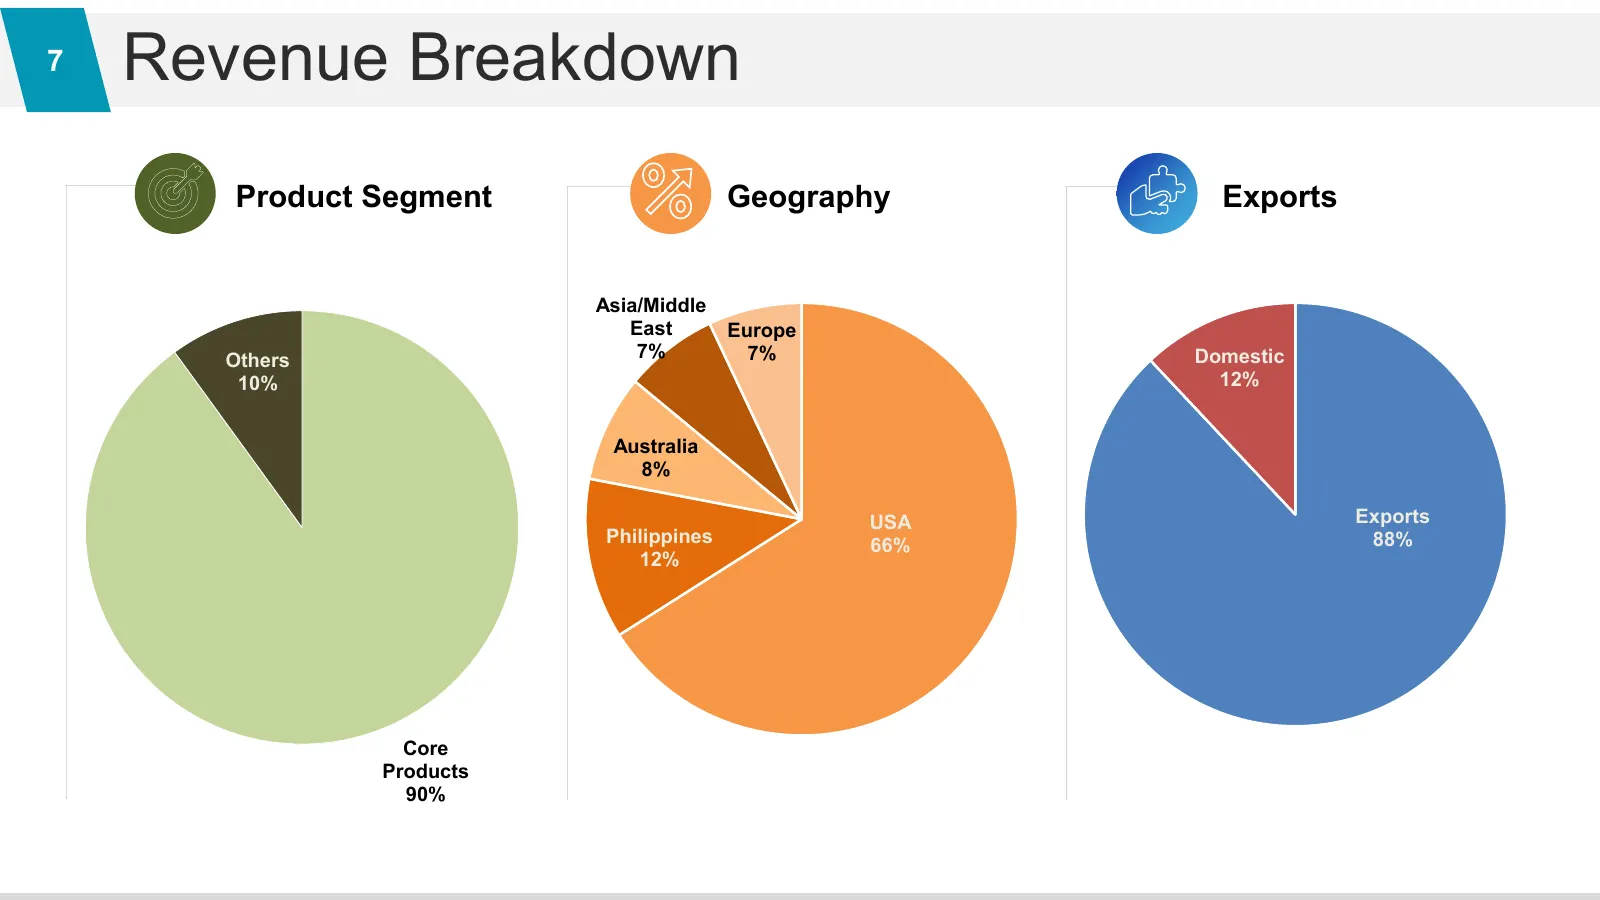
7 Revenue Breakdown Product Segment Geography Exports Asia/Middle East Europe Others 7% 7% Domestic 10% 12% Australia 8% USA Exports Philippines 66% 88% 12% Core Products 90%
Slide 8: Current Initiatives
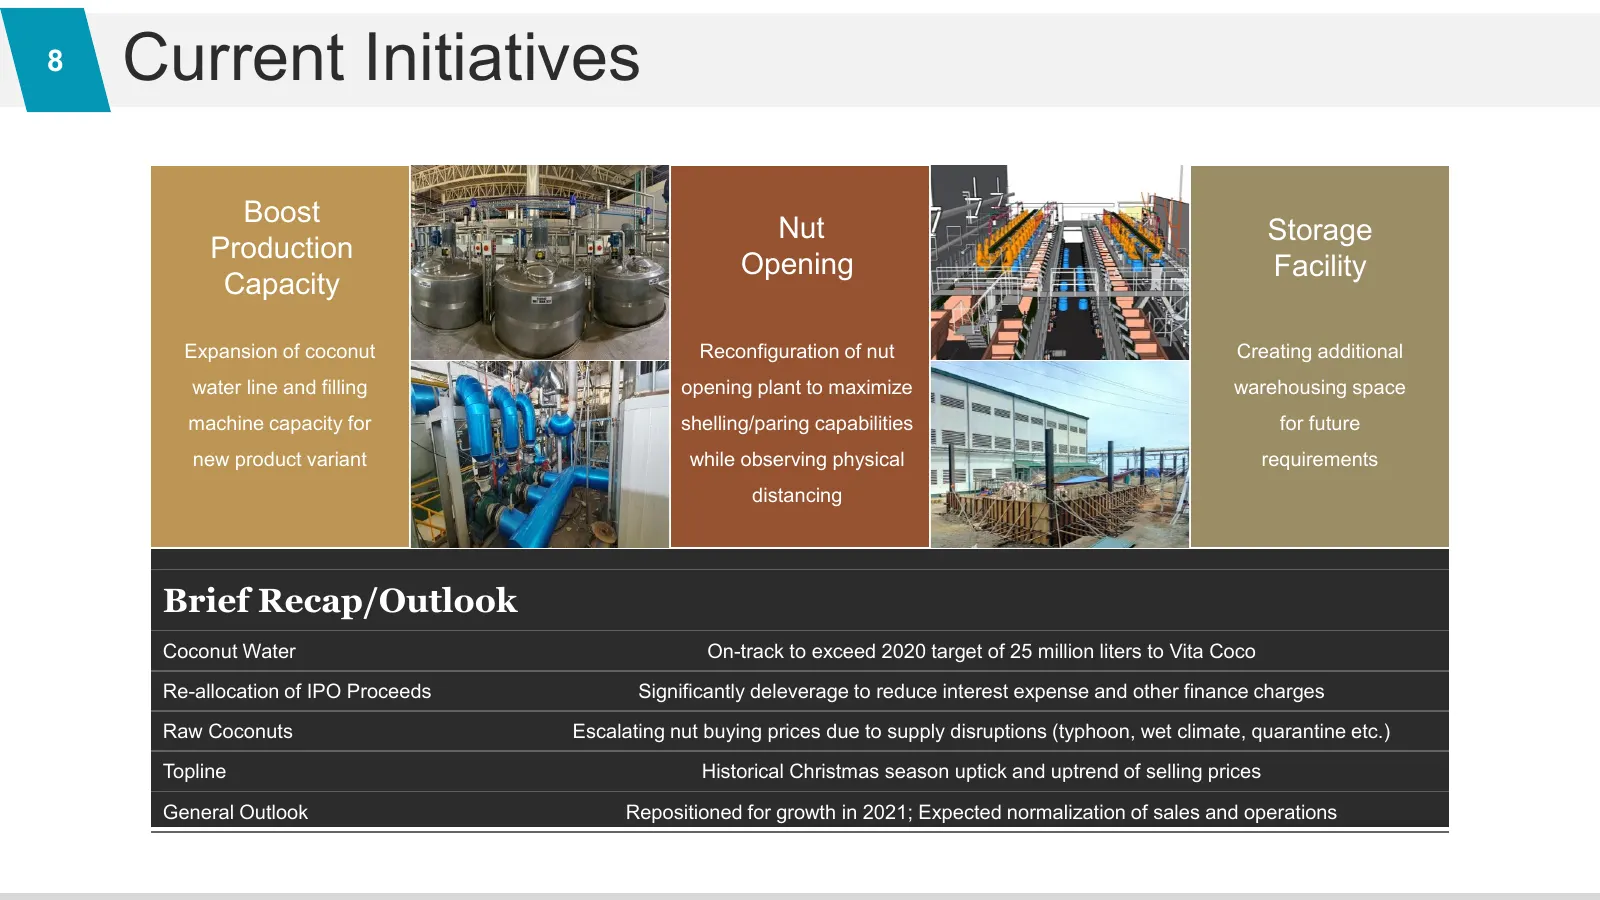
8 Current Initiatives Boost Nut Storage Production Opening Facility Capacity Expansion of coconut Reconfiguration of nut Creating additional water line and filling opening plant to maximize warehousing space machine capacity for shelling/paring capabilities for future new product variant while obser
Source: company website
More decks from Axelum Resources Corp.
 Q1 2026 Earnings Presentation7 slides · Jun 1, 2026
 FY2025 Earnings Presentation7 slides · April 2026
 9M 2025 Earnings Presentation7 slides · November 2025
 H1 2025 Earnings Presentation7 slides · August 2025
 Q1 2025 Earnings Presentation7 slides · May 2025
 FY2024 Earnings Presentation7 slides · April 2025