Flutter Entertainment plc · NYSE:FLUT
Flutter Entertainment — Paddy Power — H1 2008 Earnings Presentation
29 slides from Flutter Entertainment's earnings presentation, Jun 14, 2008
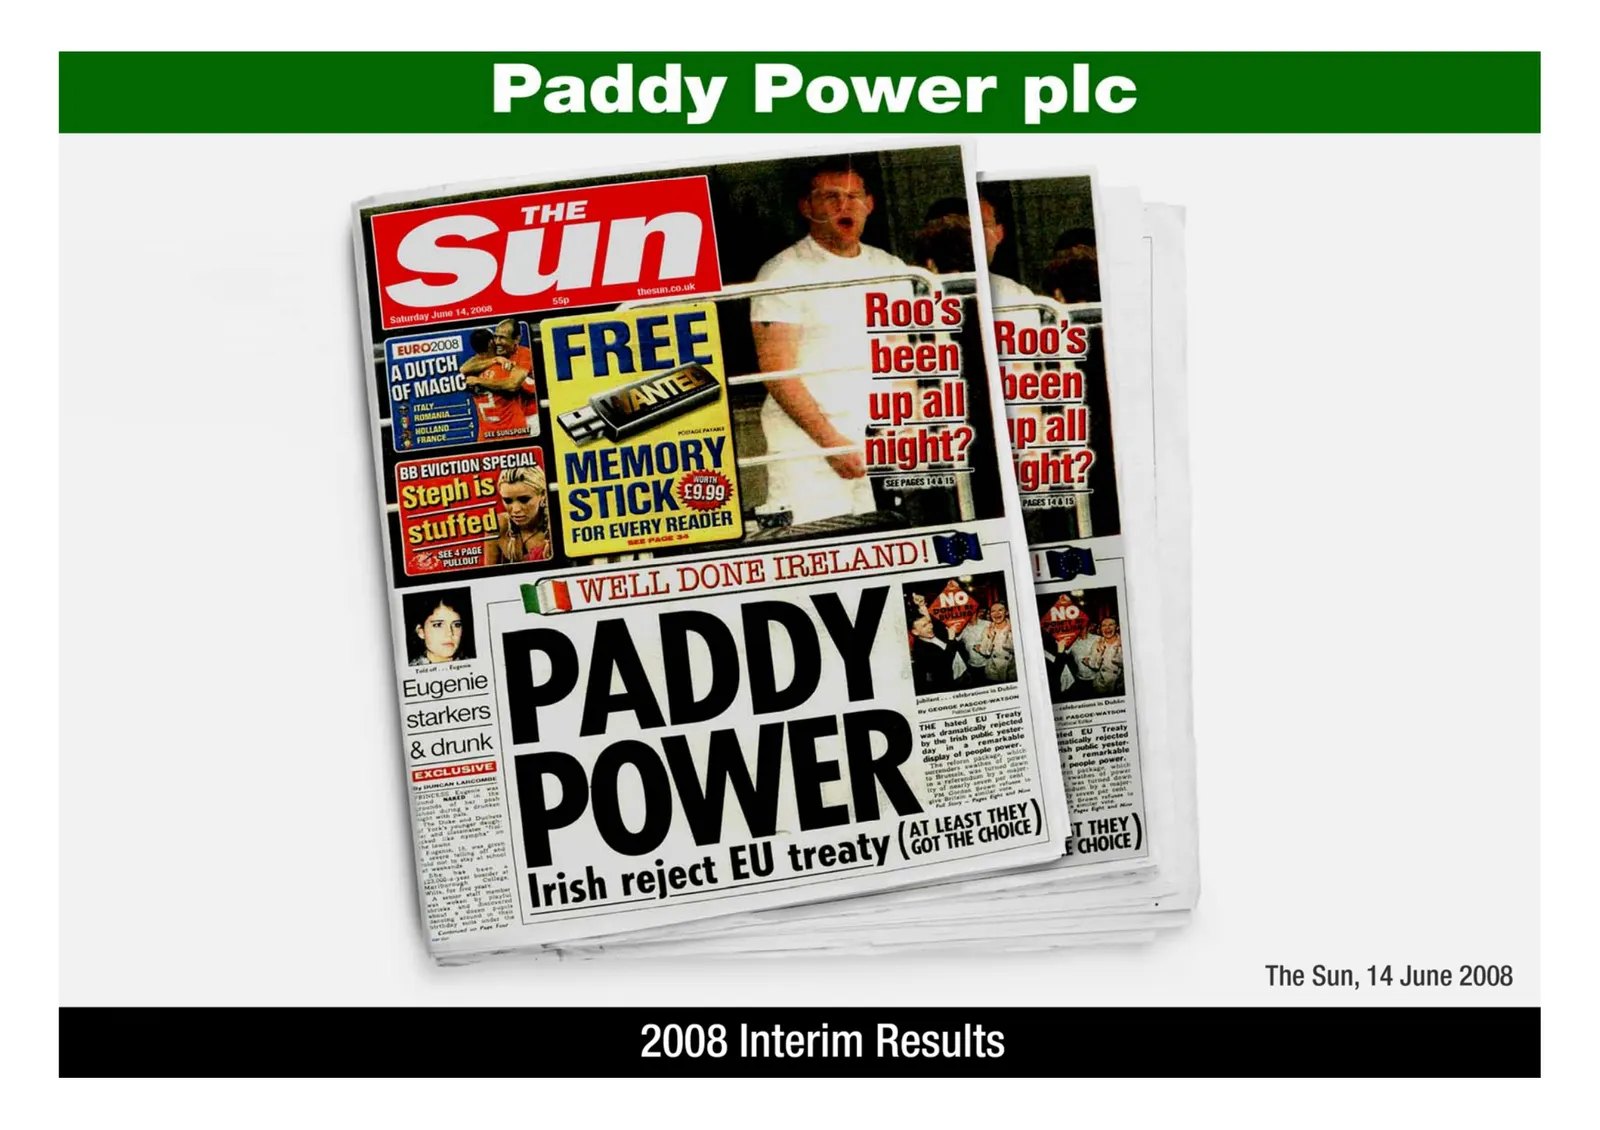
Slide 1: Paddy Power plc 2008 Interim Results
Paddy Power plc The Sun, 14 June 2008 2008 Interim Results
Slide 2: Introduction
Introduction Introduction Financial Performance Operational Review Trading and Outlook Page 1
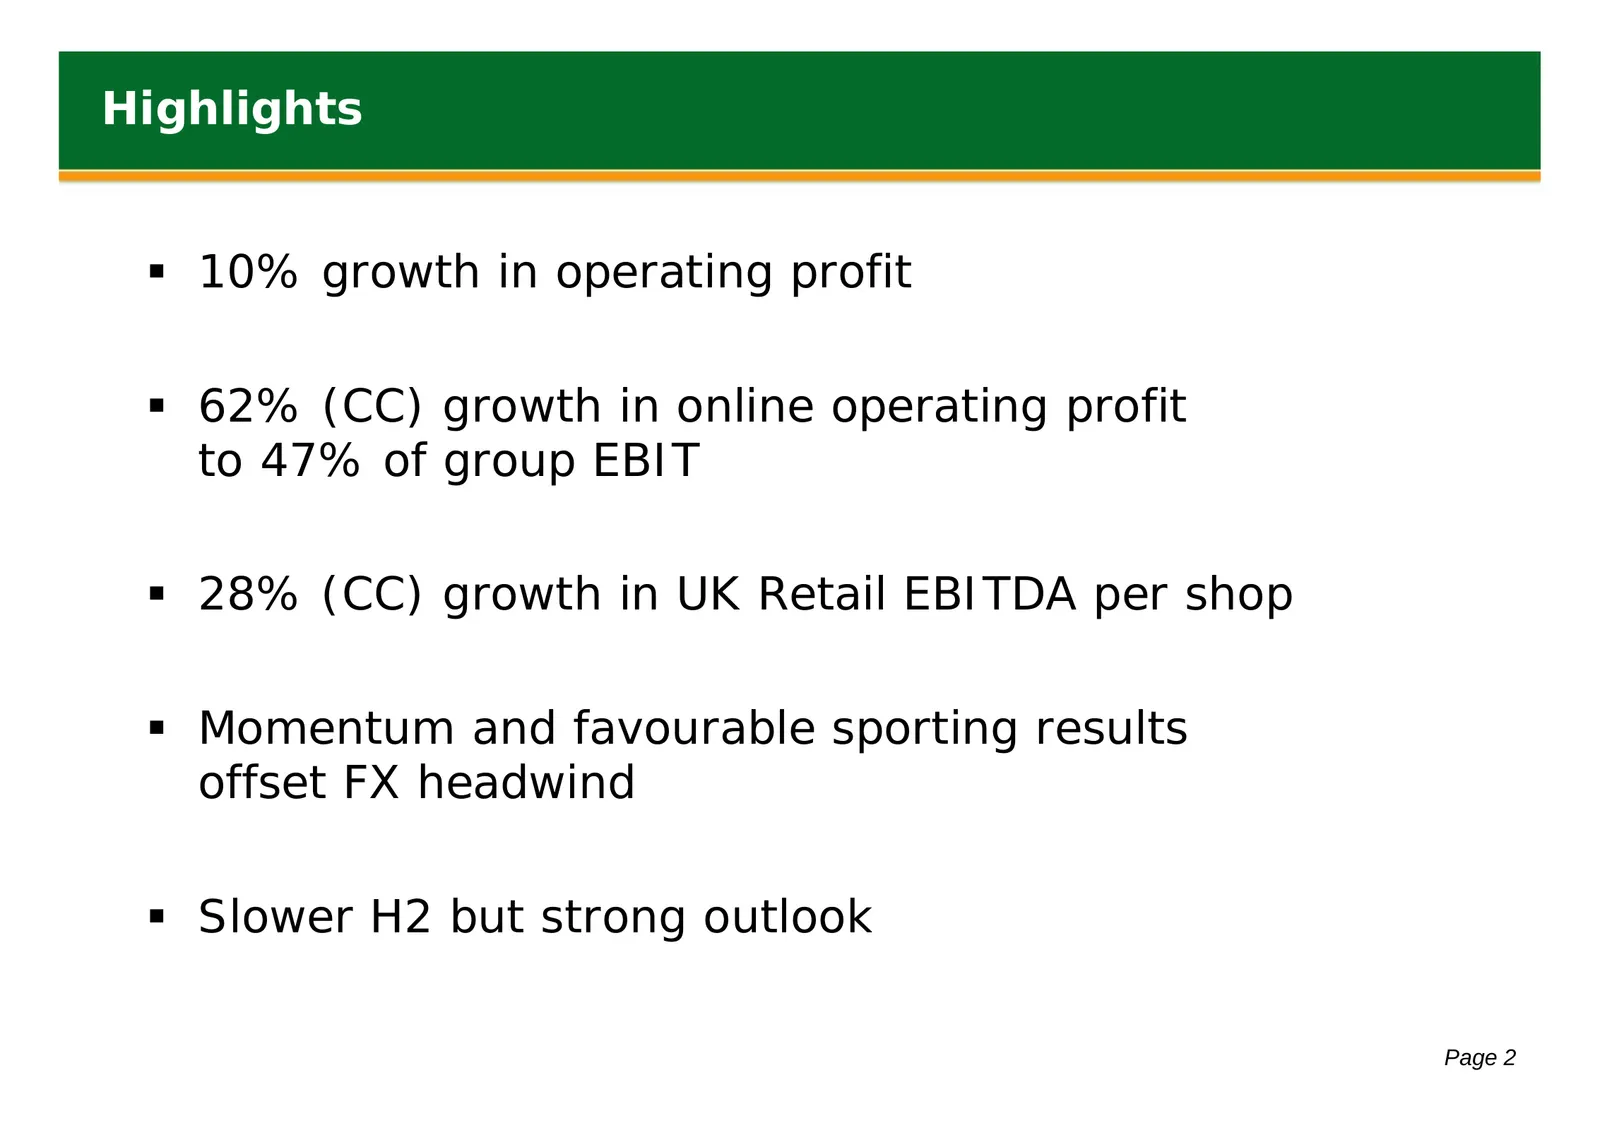
Slide 3: Highlights
Highlights 10% growth in operating profit 62% (CC) growth in online operating profit to 47% of group EBIT 28% (CC) growth in UK Retail EBITDA per shop Momentum and favourable sporting results offset FX headwind Slower H2 but strong outlook Page 2
Slide 4: Financial Performance
Financial Performance Introduction Financial Performance Operational Review Trading and Outlook Page 3
Slide 5: Financial Highlights
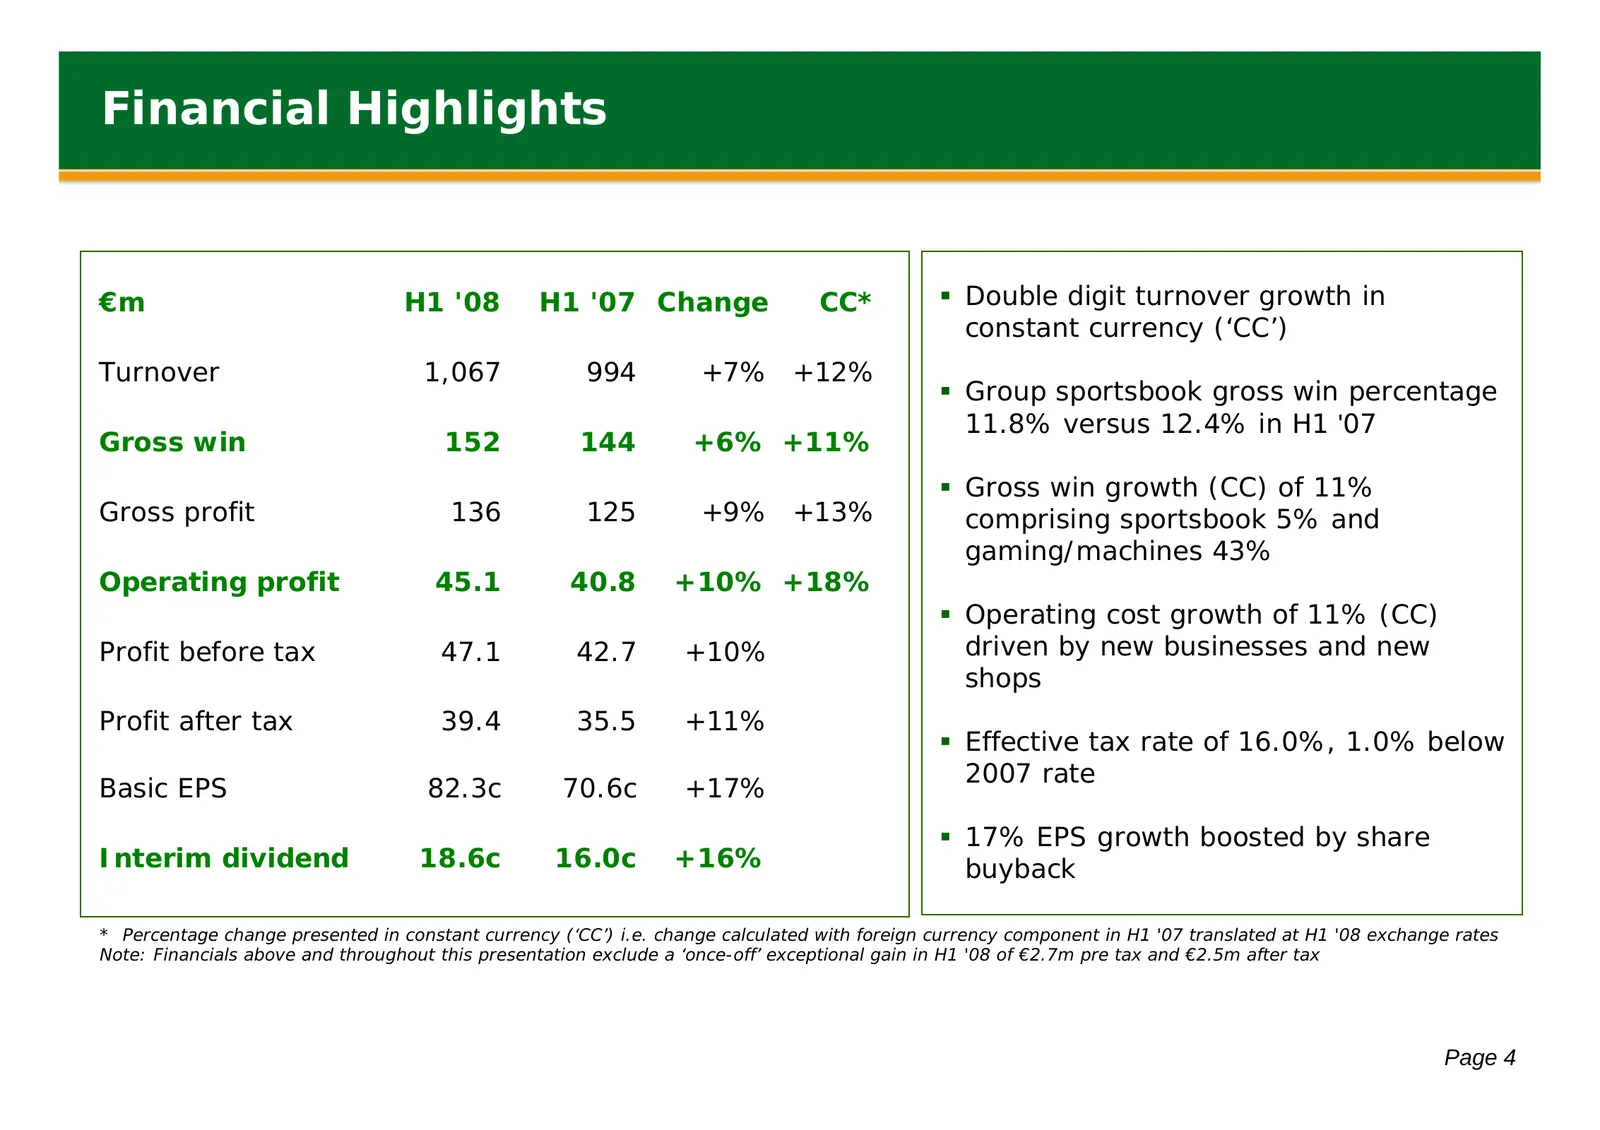
Financial Highlights €m H1 '08 H1 '07 Change CC* Double digit turnover growth in constant currency (‘CC’) Turnover 1,067 994 +7% +12% Group sportsbook gross win percentage 11.8% versus 12.4% in H1 '07 Gross win 152 144 +6% +11% Gross win growth (CC) of 11% Gross profit 136 125 +9% +13% compris
Slide 6: Gross Win to Gross Profit
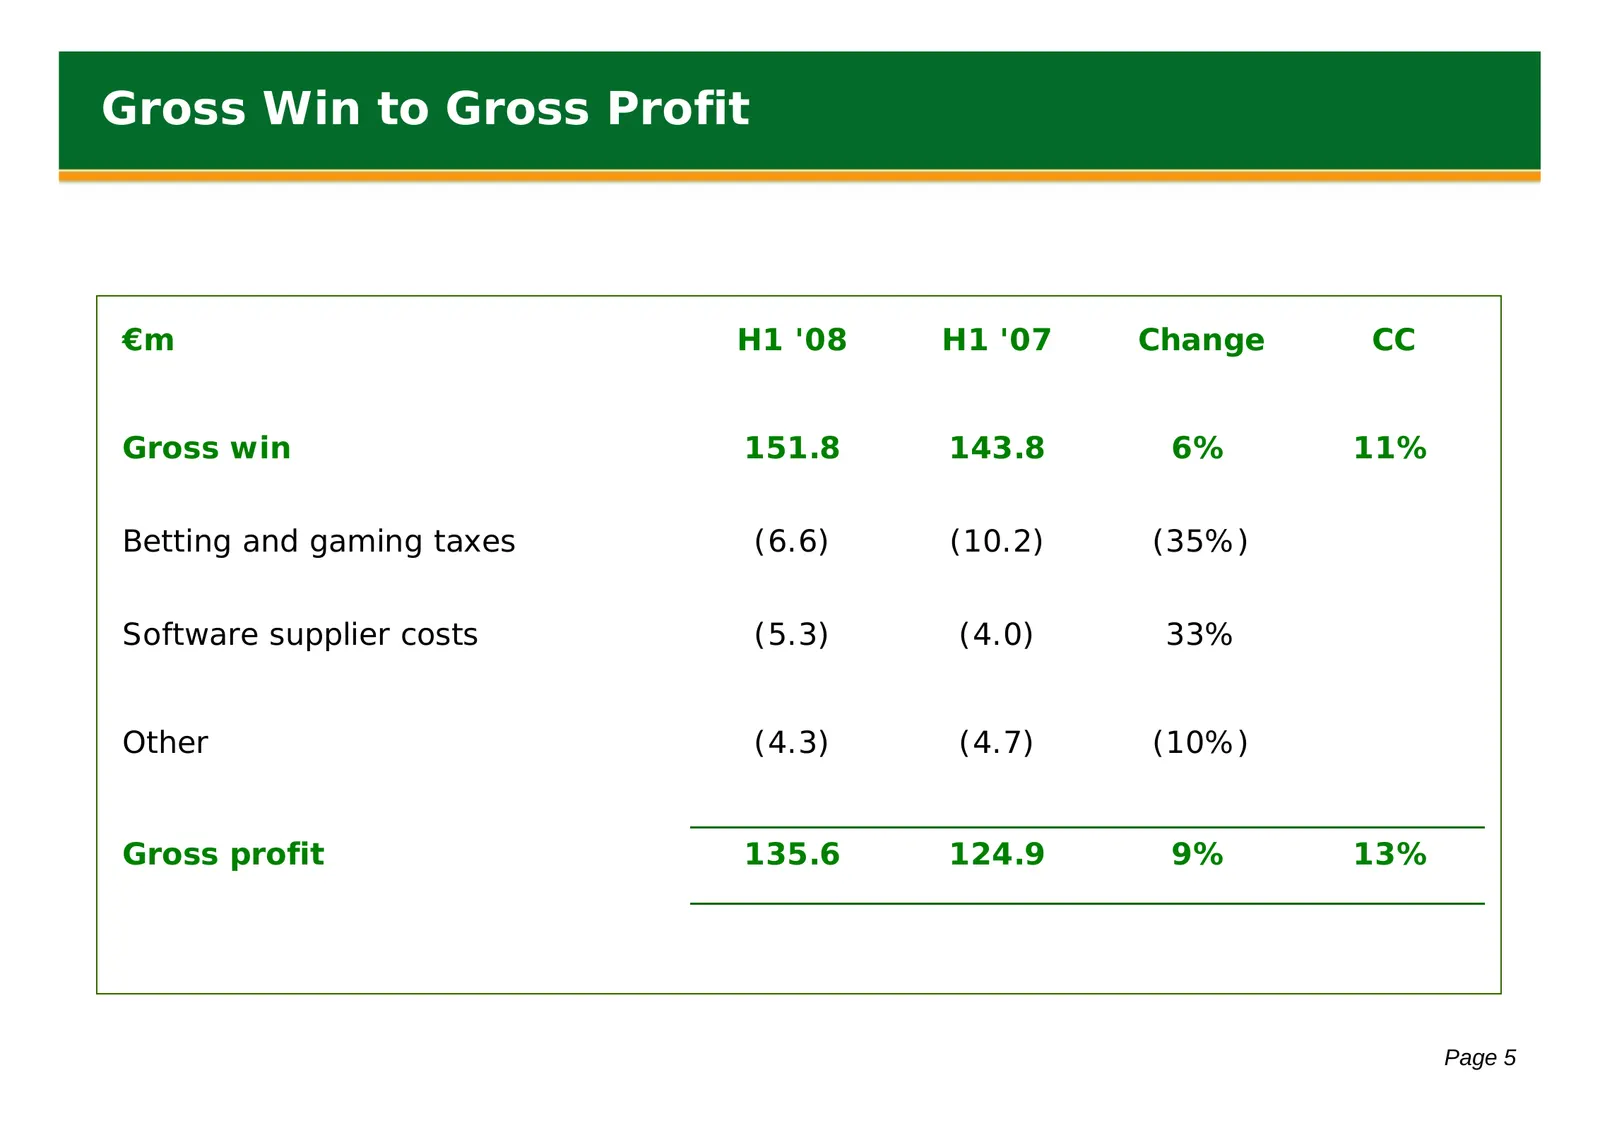
Gross Win to Gross Profit €m H1 '08 H1 '07 Change CC Gross win 151.8 143.8 6% 11% Betting and gaming taxes (6.6) (10.2) (35%) Software supplier costs (5.3) (4.0) 33% Other (4.3) (4.7) (10%) Gross profit 135.6 124.9 9% 13% Page 5
Slide 7: Cash Flow
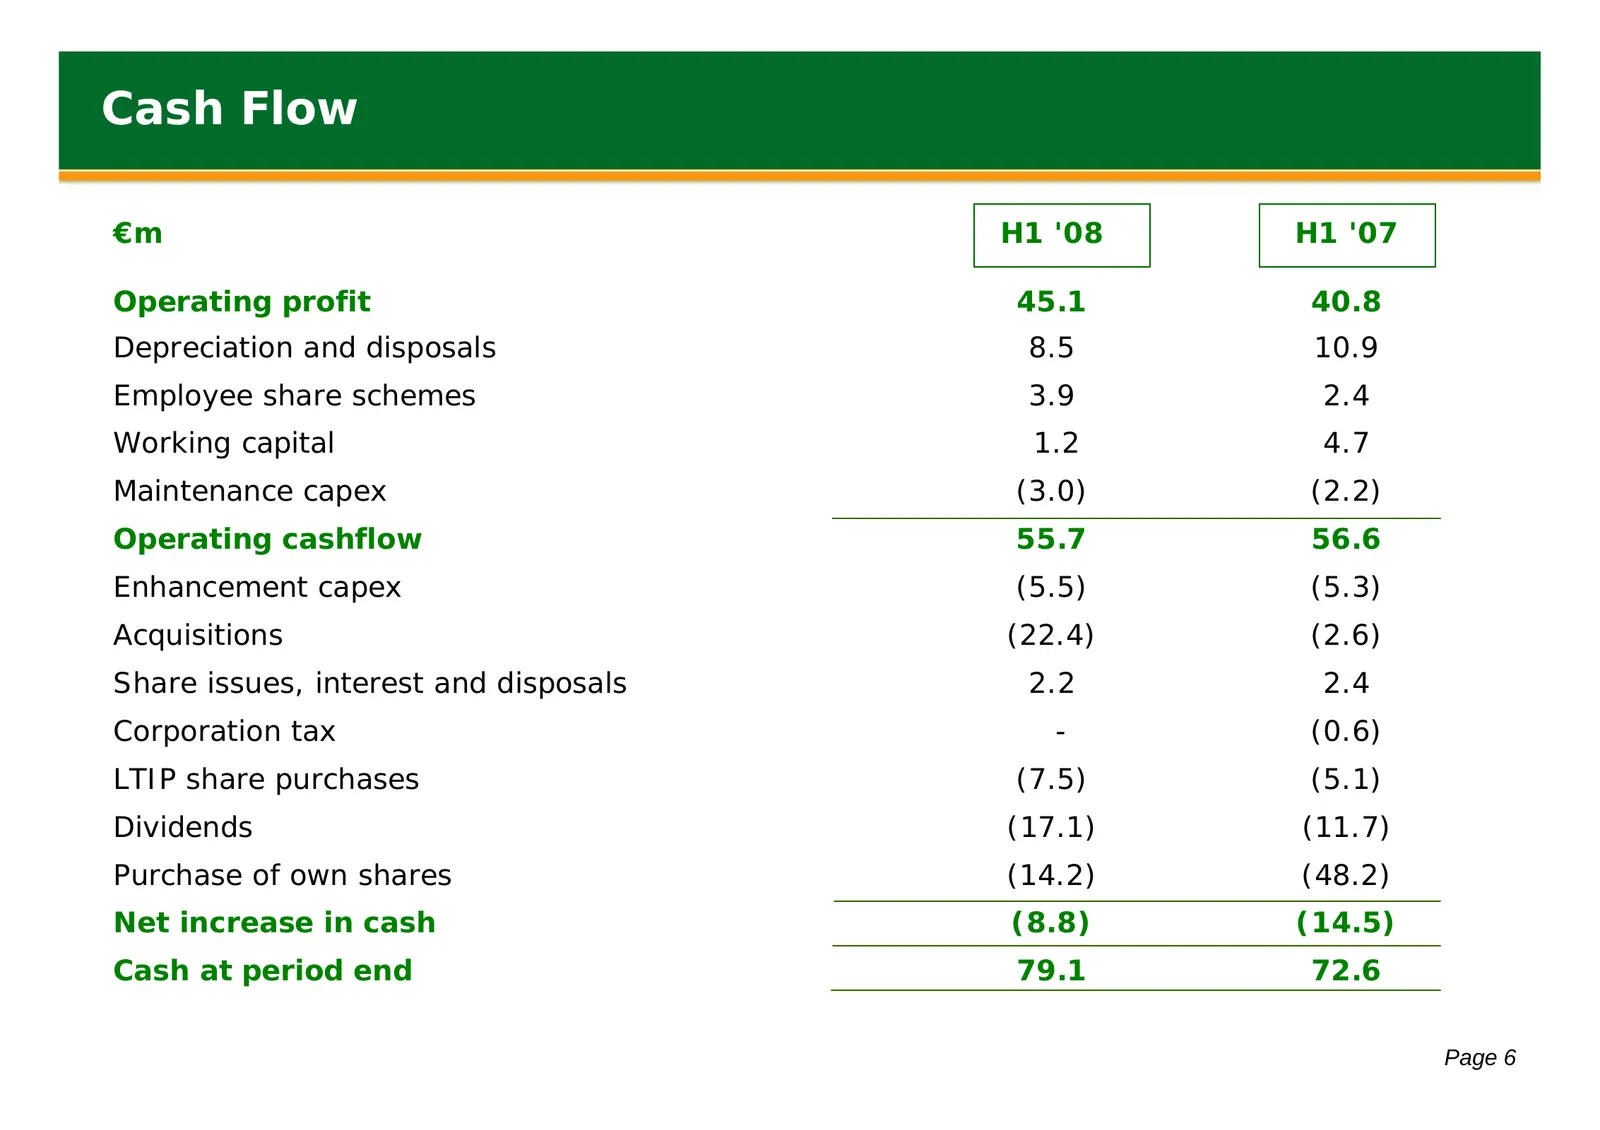
Cash Flow €m H1 '08 H1 '07 Operating profit 45.1 40.8 Depreciation and disposals 8.5 10.9 Employee share schemes 3.9 2.4 Working capital 1.2 4.7 Maintenance capex (3.0) (2.2) Operating cashflow 55.7 56.6 Enhancement capex (5.5) (5.3) Acquisitions (22.4) (2.6) Share issues, interest and disposals 2.2
Slide 8: Capital Expenditure
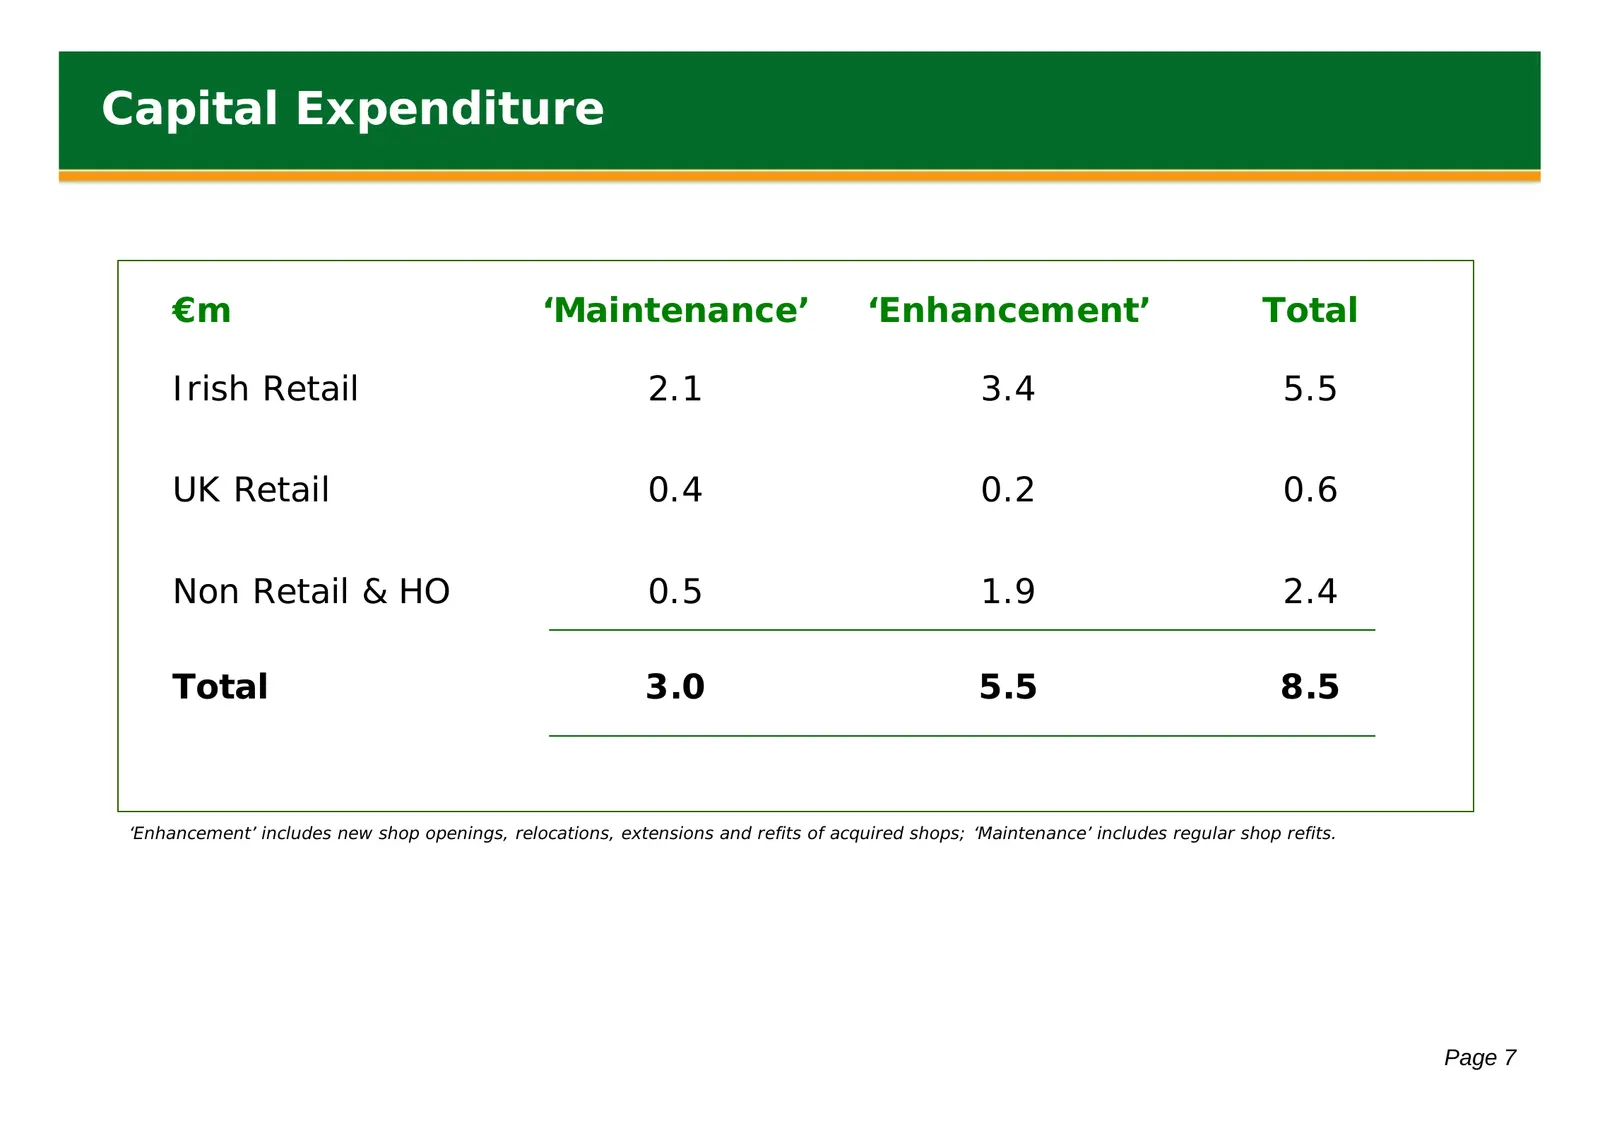
Capital Expenditure €m ‘Maintenance’ ‘Enhancement’ Total Irish Retail 2.1 3.4 5.5 UK Retail 0.4 0.2 0.6 Non Retail & HO 0.5 1.9 2.4 Total 3.0 5.5 8.5 ‘Enhancement’ includes new shop openings, relocations, extensions and refits of acquired shops; ‘Maintenance’ includes regular shop refits. Page 7
Slide 9: Cash Returns to Shareholders
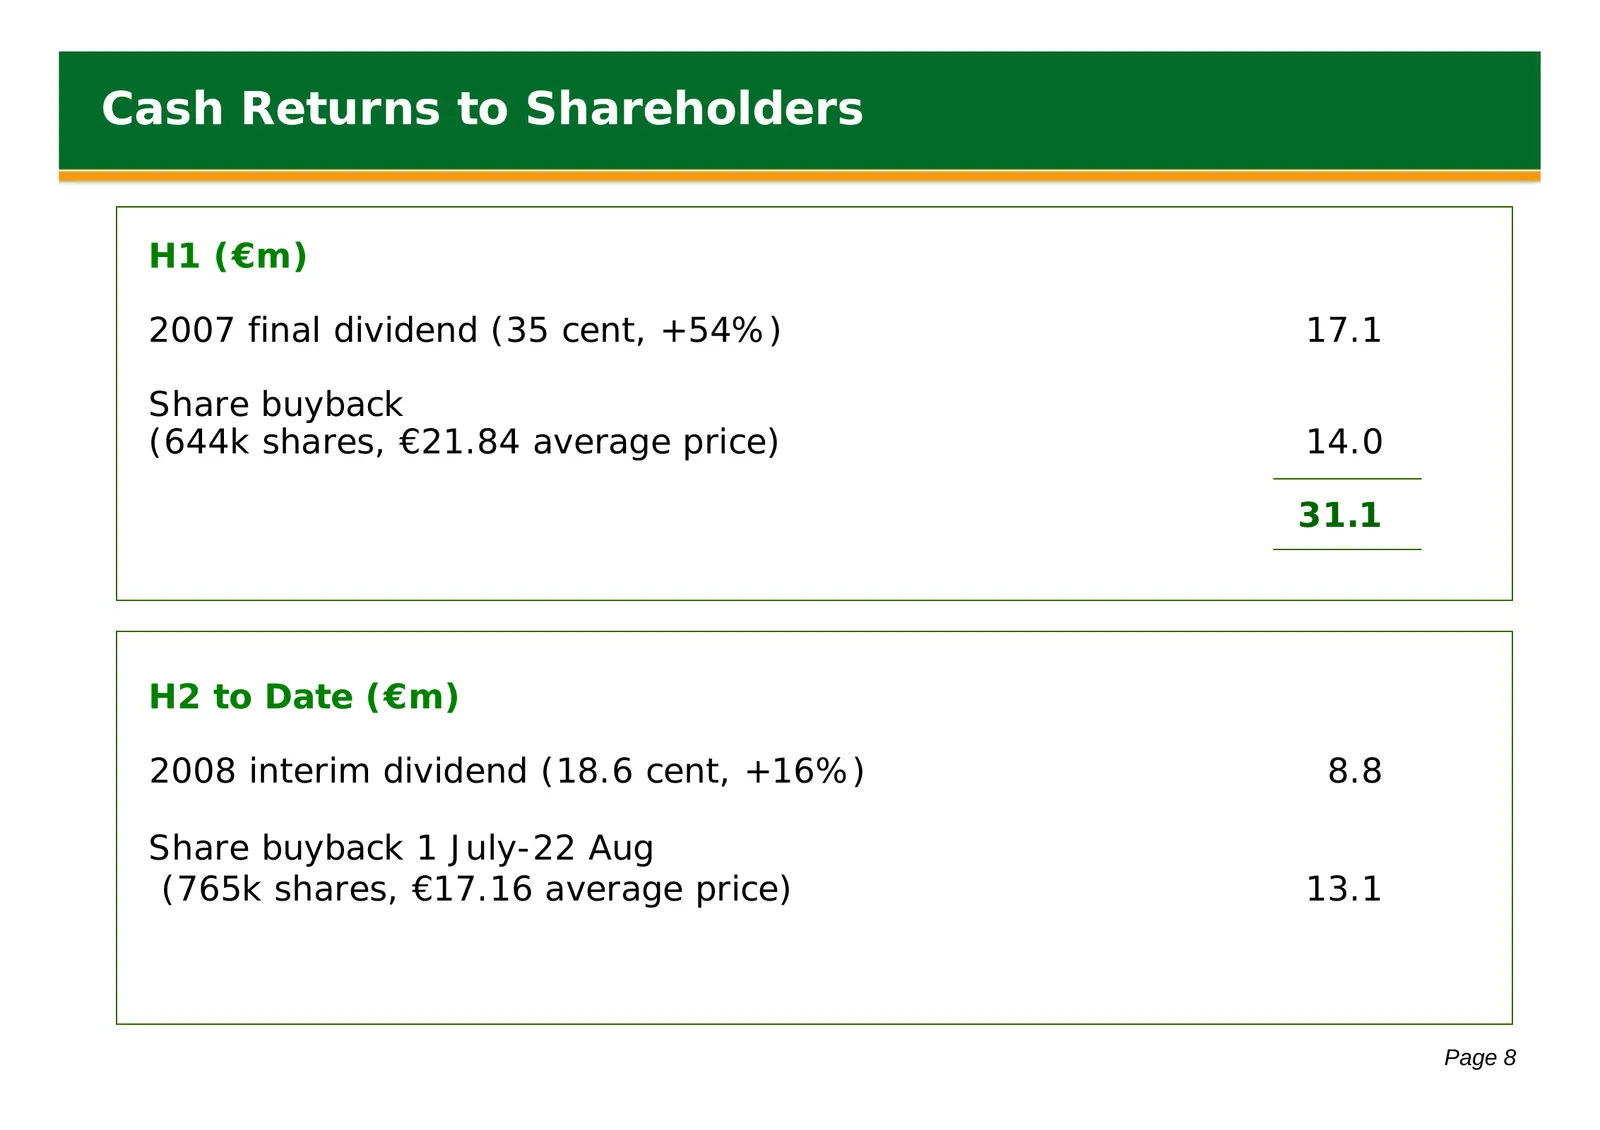
Cash Returns to Shareholders H1 (€m) 2007 final dividend (35 cent, +54%) 17.1 Share buyback (644k shares, €21.84 average price) 14.0 31.1 H2 to Date (€m) 2008 interim dividend (18.6 cent, +16%) 8.8 Share buyback 1 July-22 Aug (765k shares, €17.16 average price) 13.1 Page 8
Slide 10: Operational Review
Operational Review Introduction Financial Performance Operational Review Trading and Outlook Page 9
Slide 11: Divisional Summary
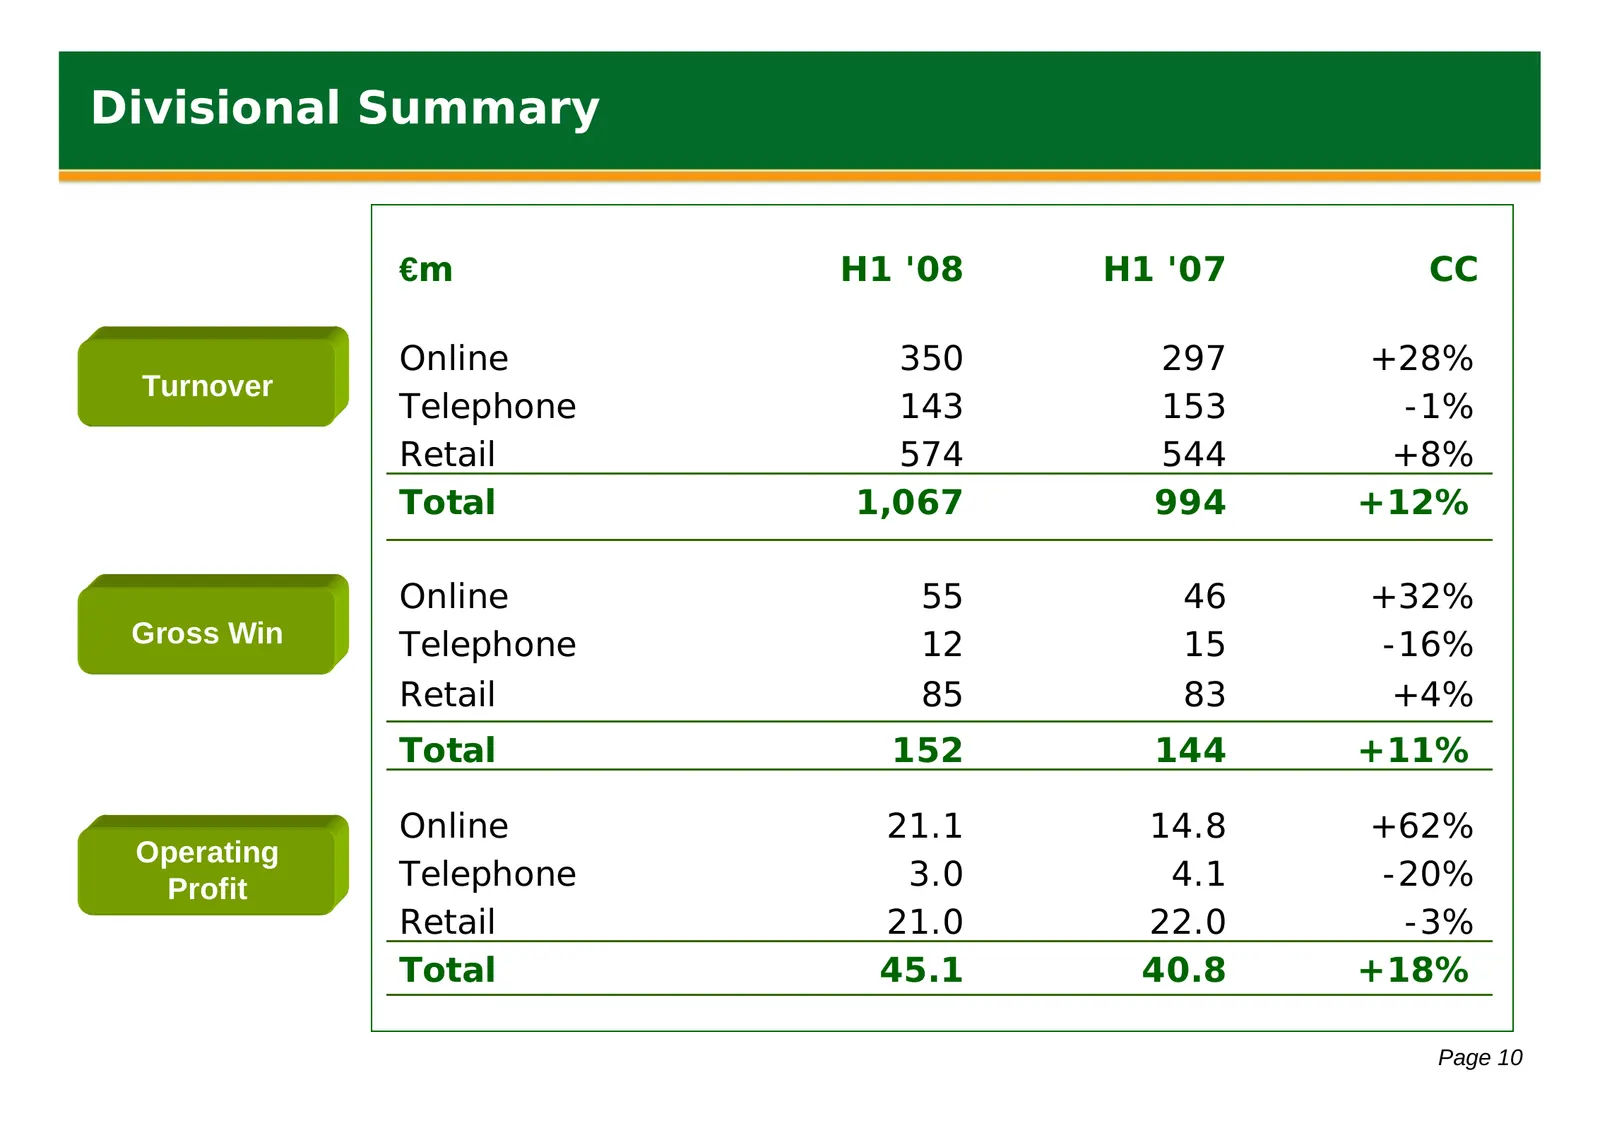
Divisional Summary €m H1 '08 H1 '07 CC Online 350 297 +28% Turnover Telephone 143 153 -1% Retail 574 544 +8% Total 1,067 994 +12% Online 55 46 +32% Gross Win Telephone 12 15 -16% Retail 85 83 +4% Total 152 144 +11% Online 21.1 14.8 +62% Operating Profit Telephone 3.0 4.1 -20% Retail 21.0 22.0 -3% To

Slide 12: Sportsbook Gross Win Percentages
Sportsbook Gross Win Percentages January to April May to June Page 11
Slide 13: Online
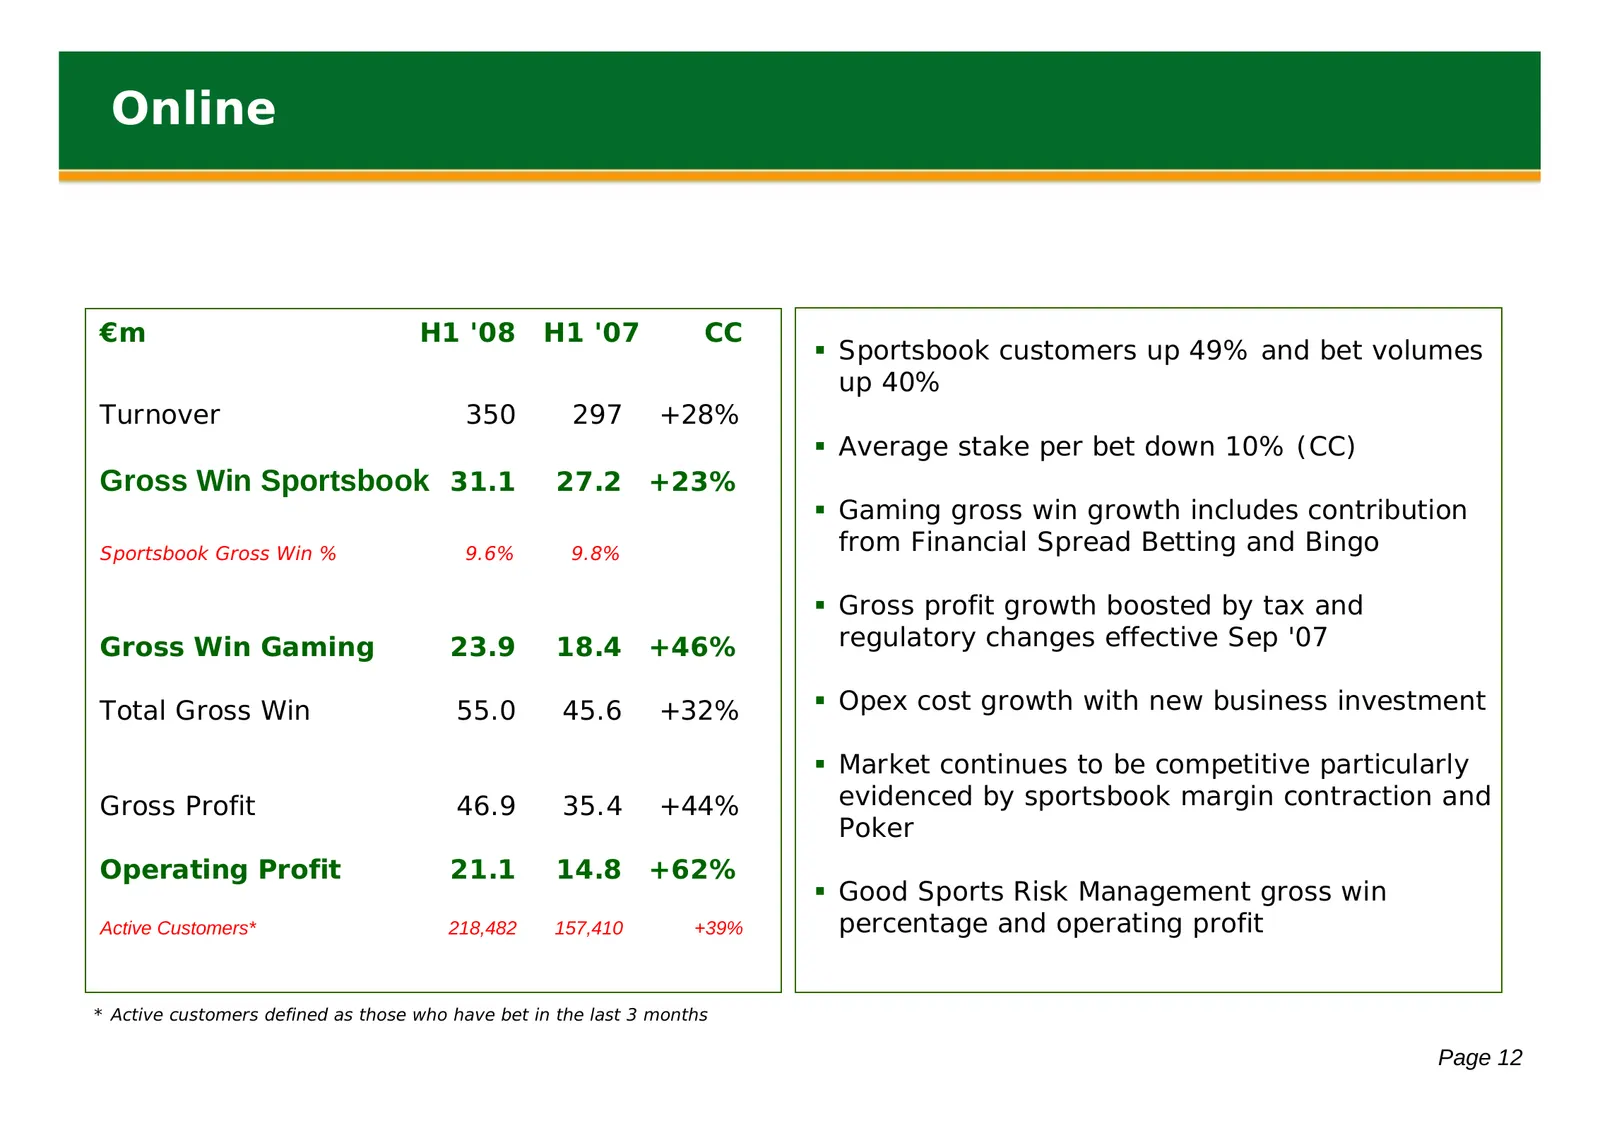
Online €m H1 '08 H1 '07 CC Sportsbook customers up 49% and bet volumes up 40% Turnover 350 297 +28% Average stake per bet down 10% (CC) Gross Win Sportsbook 31.1 27.2 +23% Gaming gross win growth includes contribution Sportsbook Gross Win % 9.6% 9.8% from Financial Spread Betting and Bingo G
Slide 14: Our Online Assets
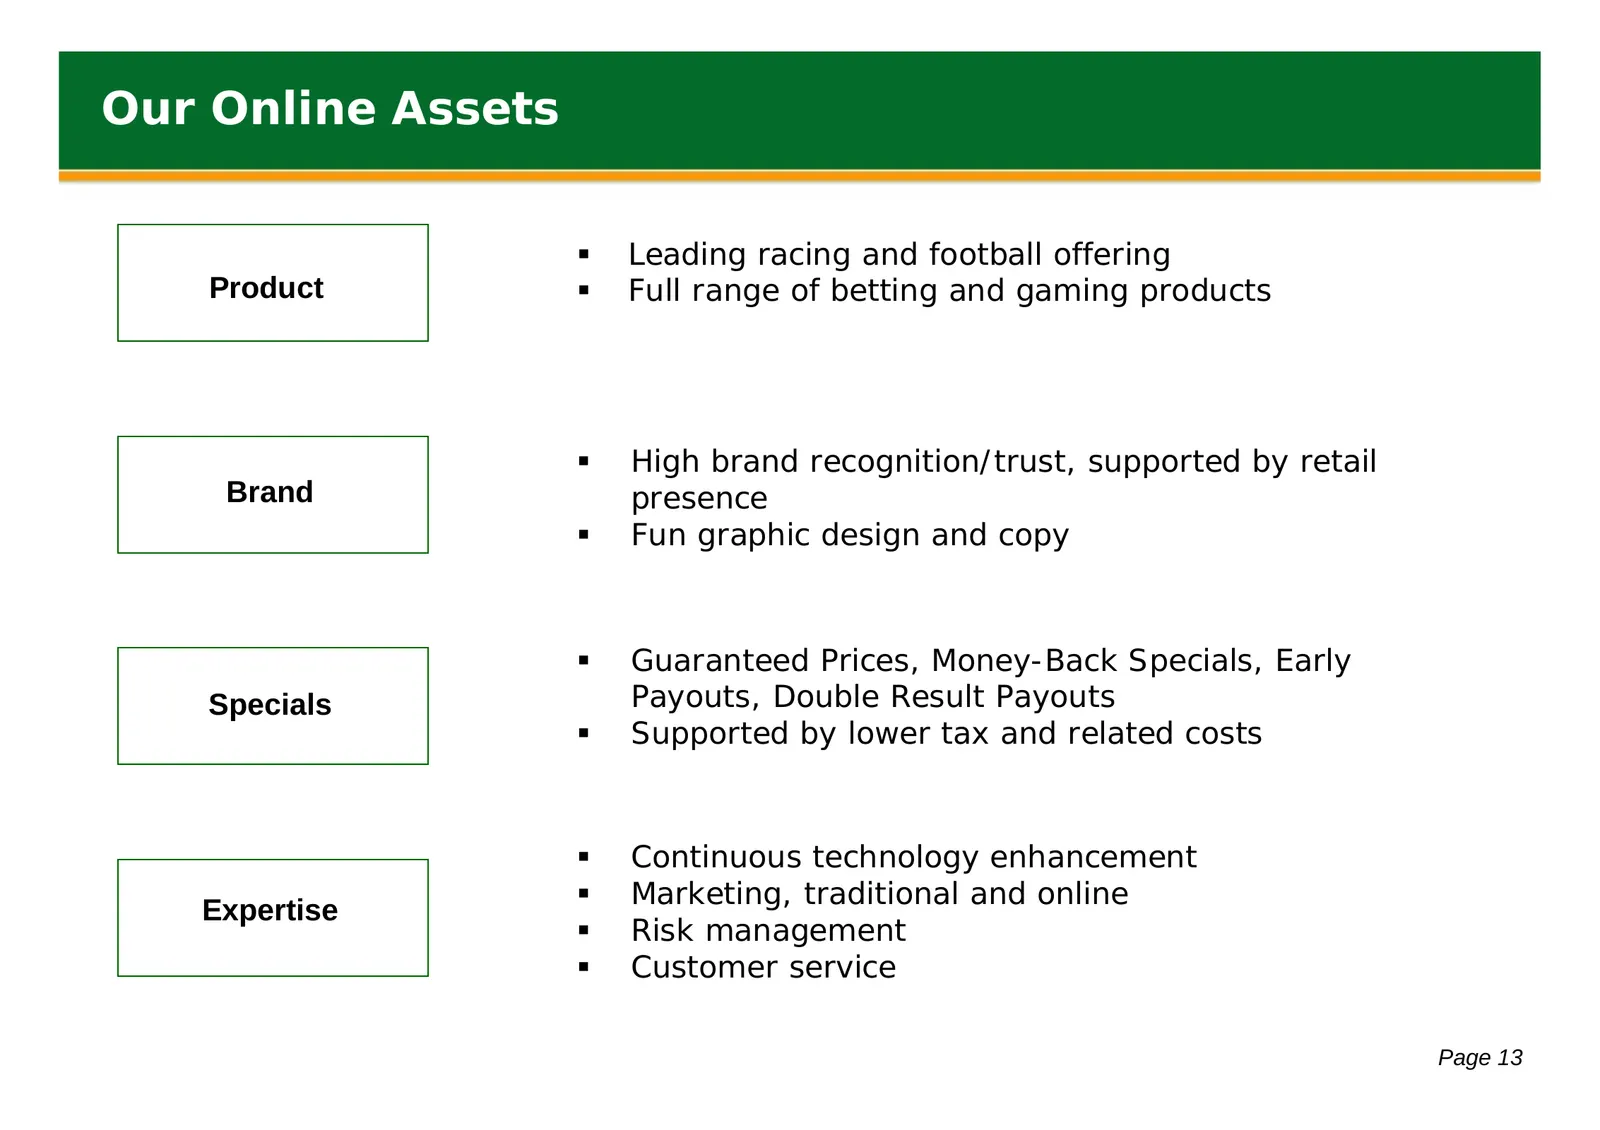
Our Online Assets Leading racing and football offering Product Full range of betting and gaming products Brand High brand recognition/trust, supported by retail Brand presence Fun graphic design and copy Guaranteed Prices, Money-Back Specials, Early Specials Payouts, Double Result Payouts
Slide 15: Online Assets: Examples
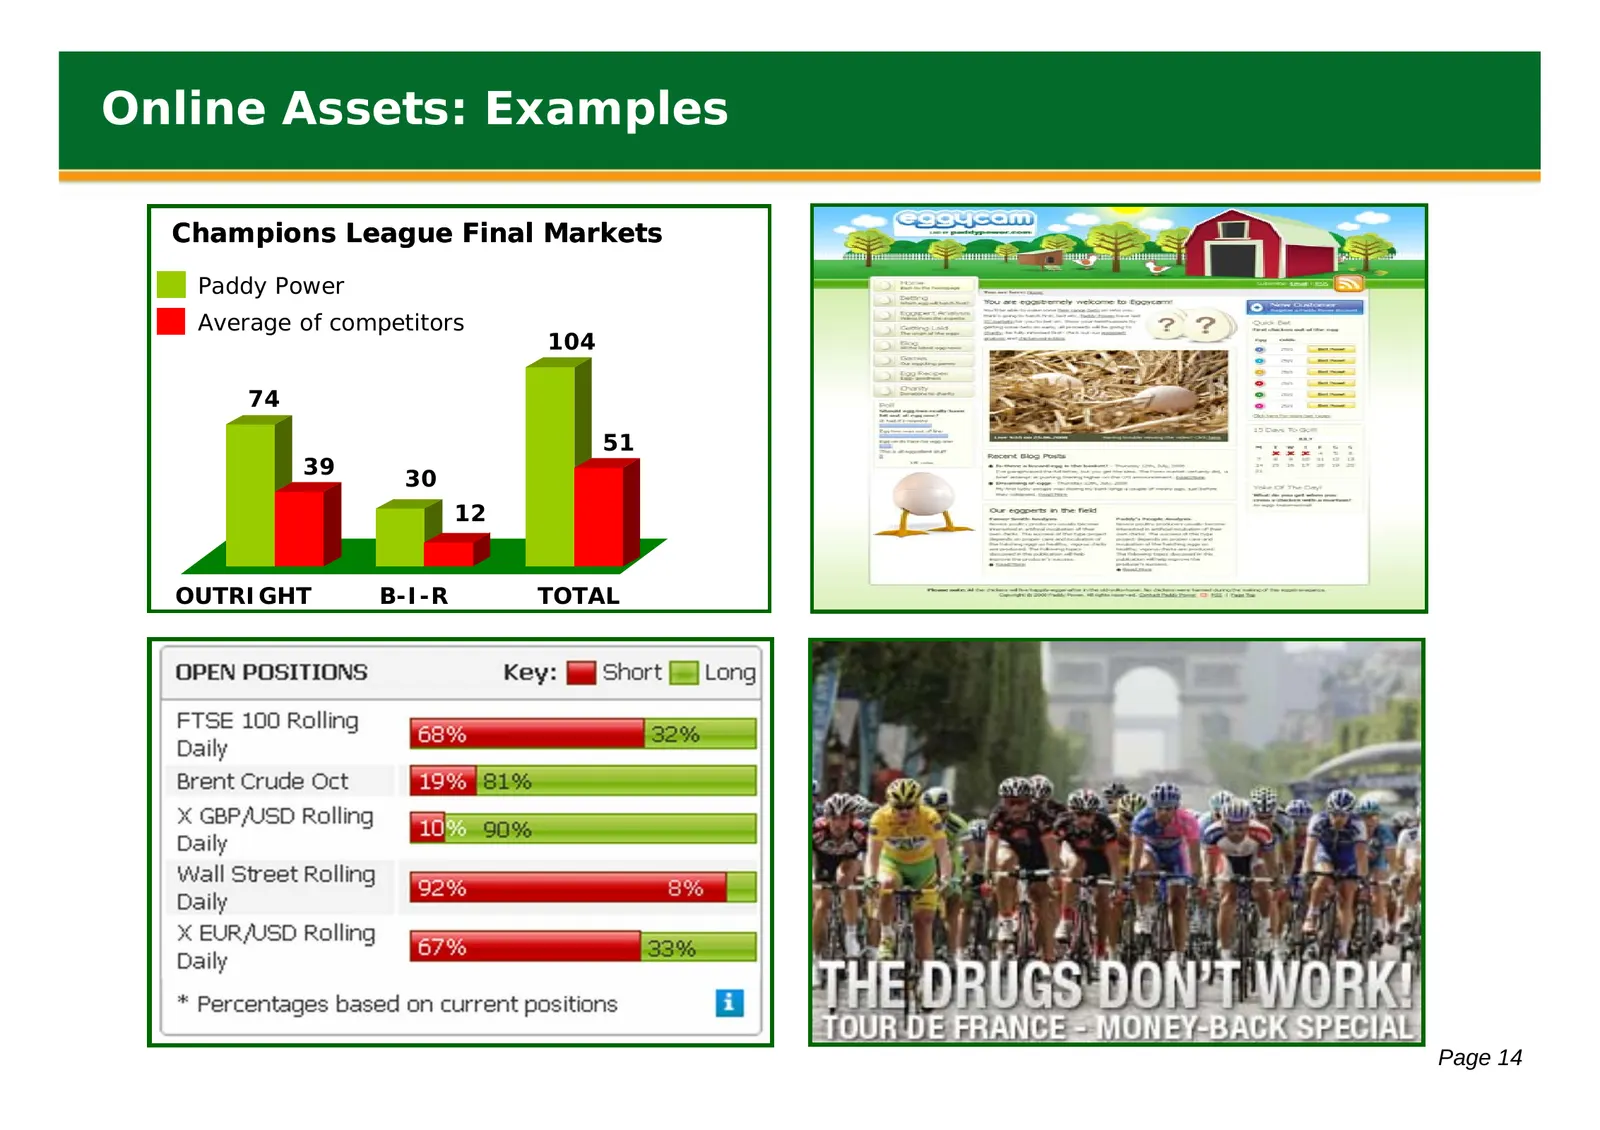
Online Assets: Examples Champions League Final Markets Paddy Power Average of competitors 104 74 51 39 30 12 OUTRIGHT B-I-R TOTAL Page 14
Slide 16: Online Assets: Benefits
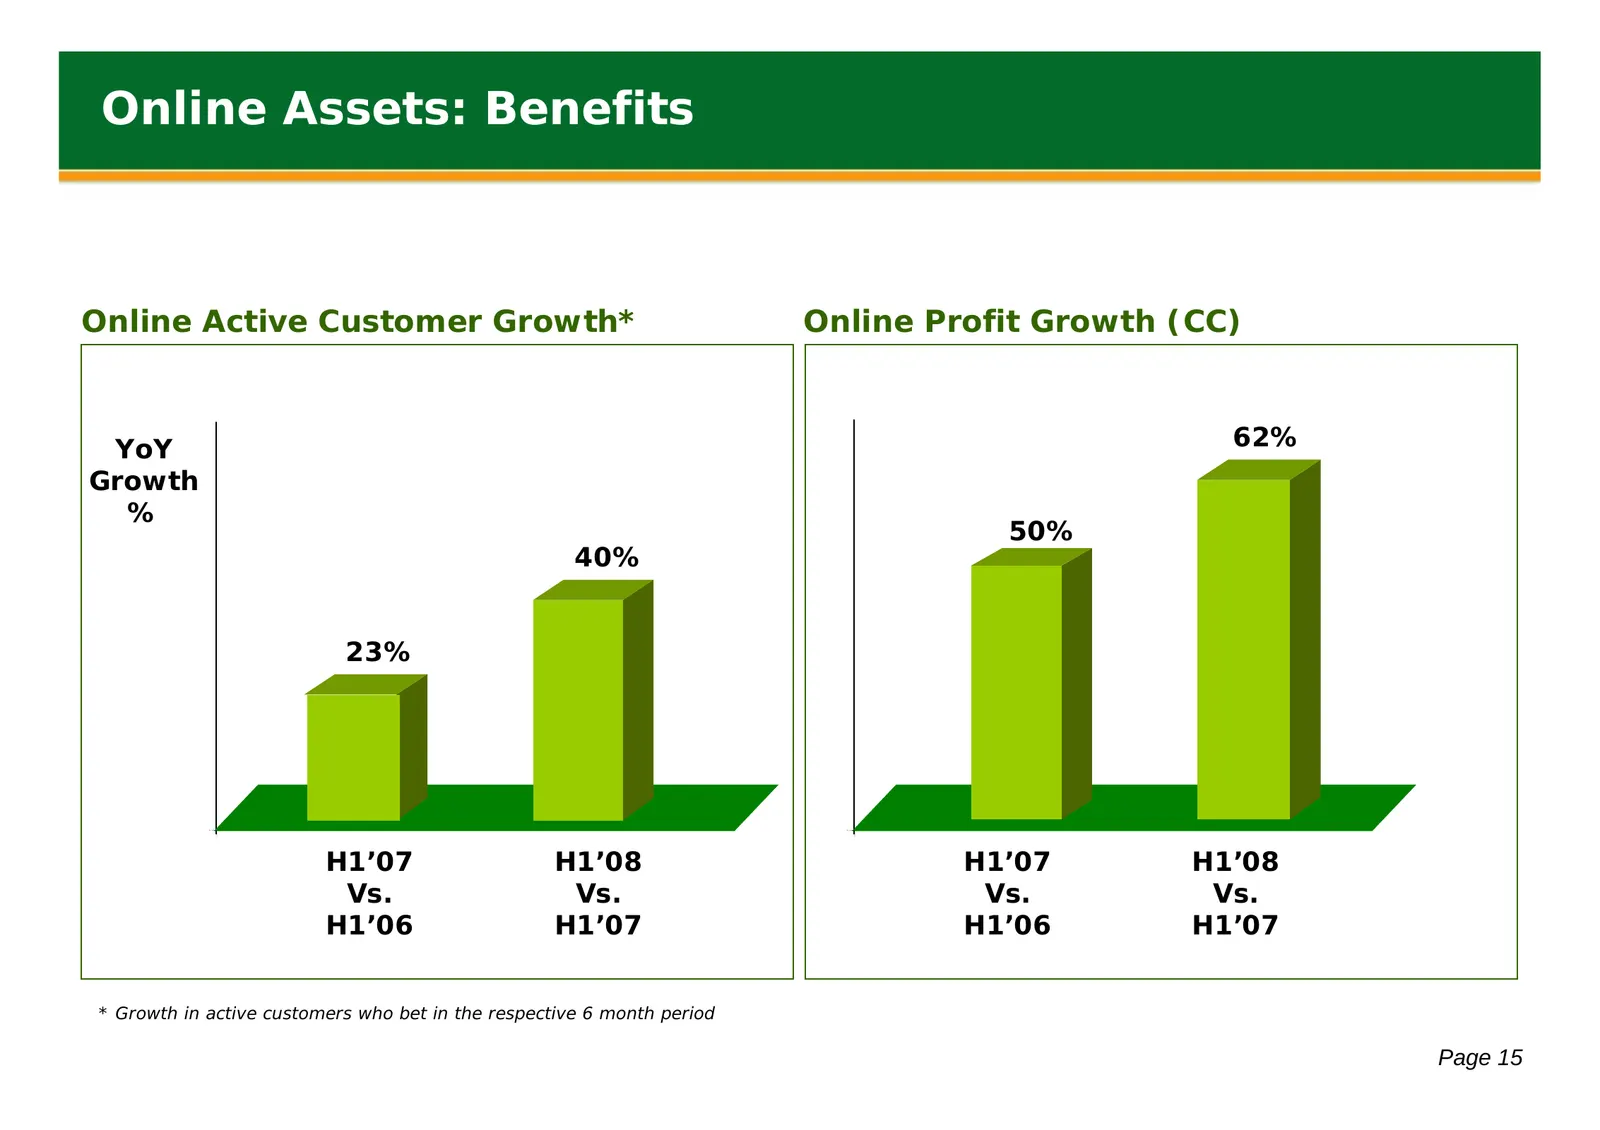
Online Assets: Benefits Online Active Customer Growth* Online Profit Growth (CC) YoY 62% Growth % 50% 40% 23% H1’07 H1’08 H1’07 H1’08 Vs. Vs. Vs. Vs. H1’06 H1’07 H1’06 H1’07 * Growth in active customers who bet in the respective 6 month period Page 15
Slide 17: Telephone
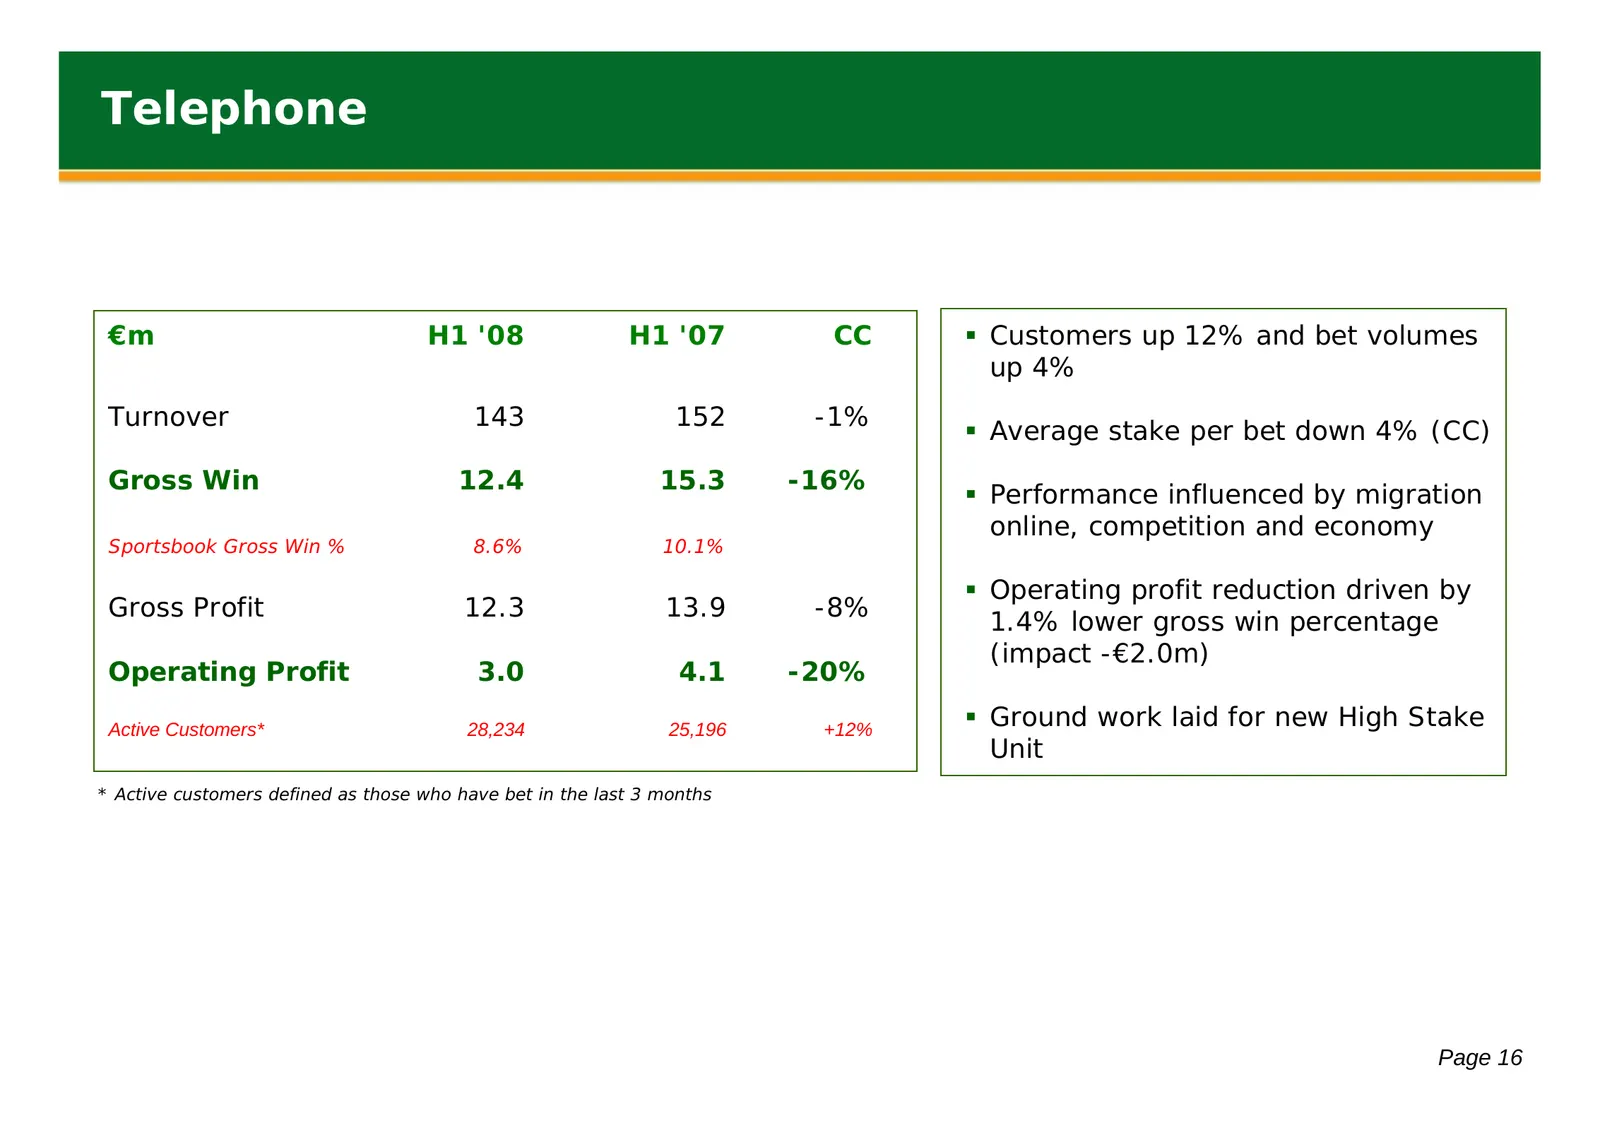
Telephone €m H1 '08 H1 '07 CC Customers up 12% and bet volumes up 4% Turnover 143 152 -1% Average stake per bet down 4% (CC) Gross Win 12.4 15.3 -16% Performance influenced by migration online, competition and economy Sportsbook Gross Win % 8.6% 10.1% Operating profit reduction driven by Gro
Slide 18: Irish Retail
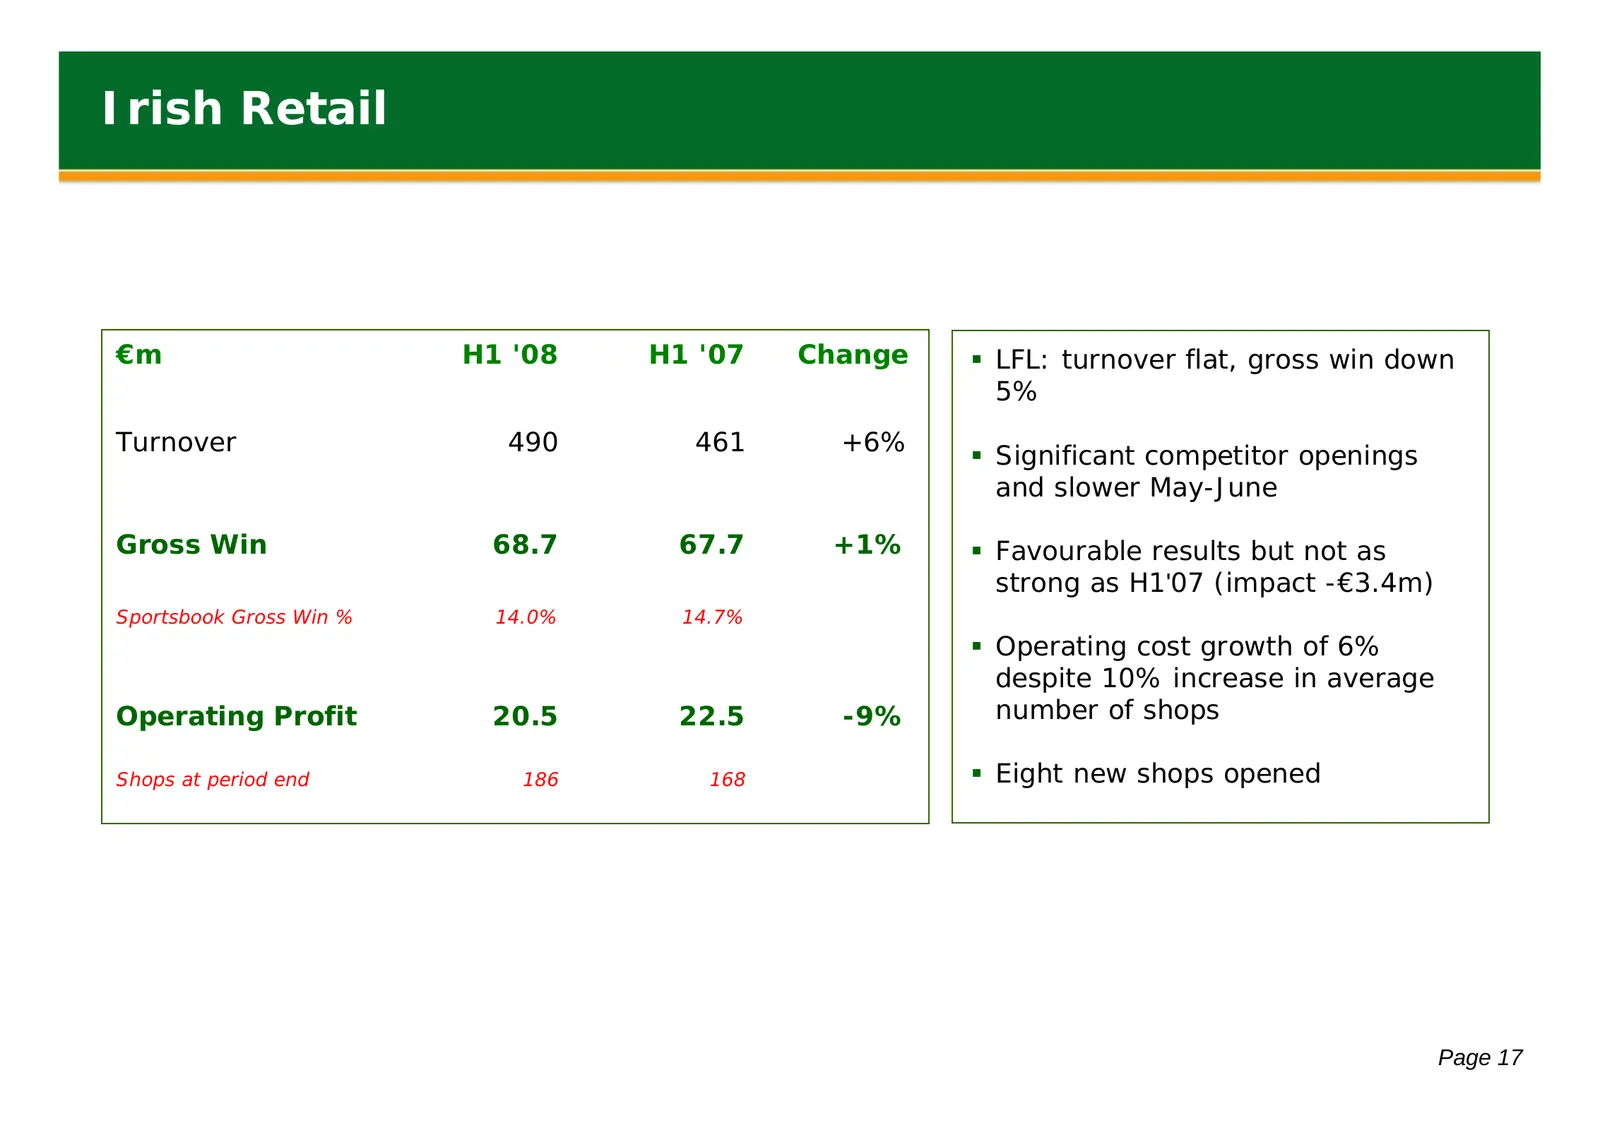
Irish Retail €m H1 '08 H1 '07 Change LFL: turnover flat, gross win down 5% Turnover 490 461 +6% Significant competitor openings and slower May-June Gross Win 68.7 67.7 +1% Favourable results but not as strong as H1'07 (impact -€3.4m) Sportsbook Gross Win % 14.0% 14.7% Operating cost growth o
Slide 19: UK Retail
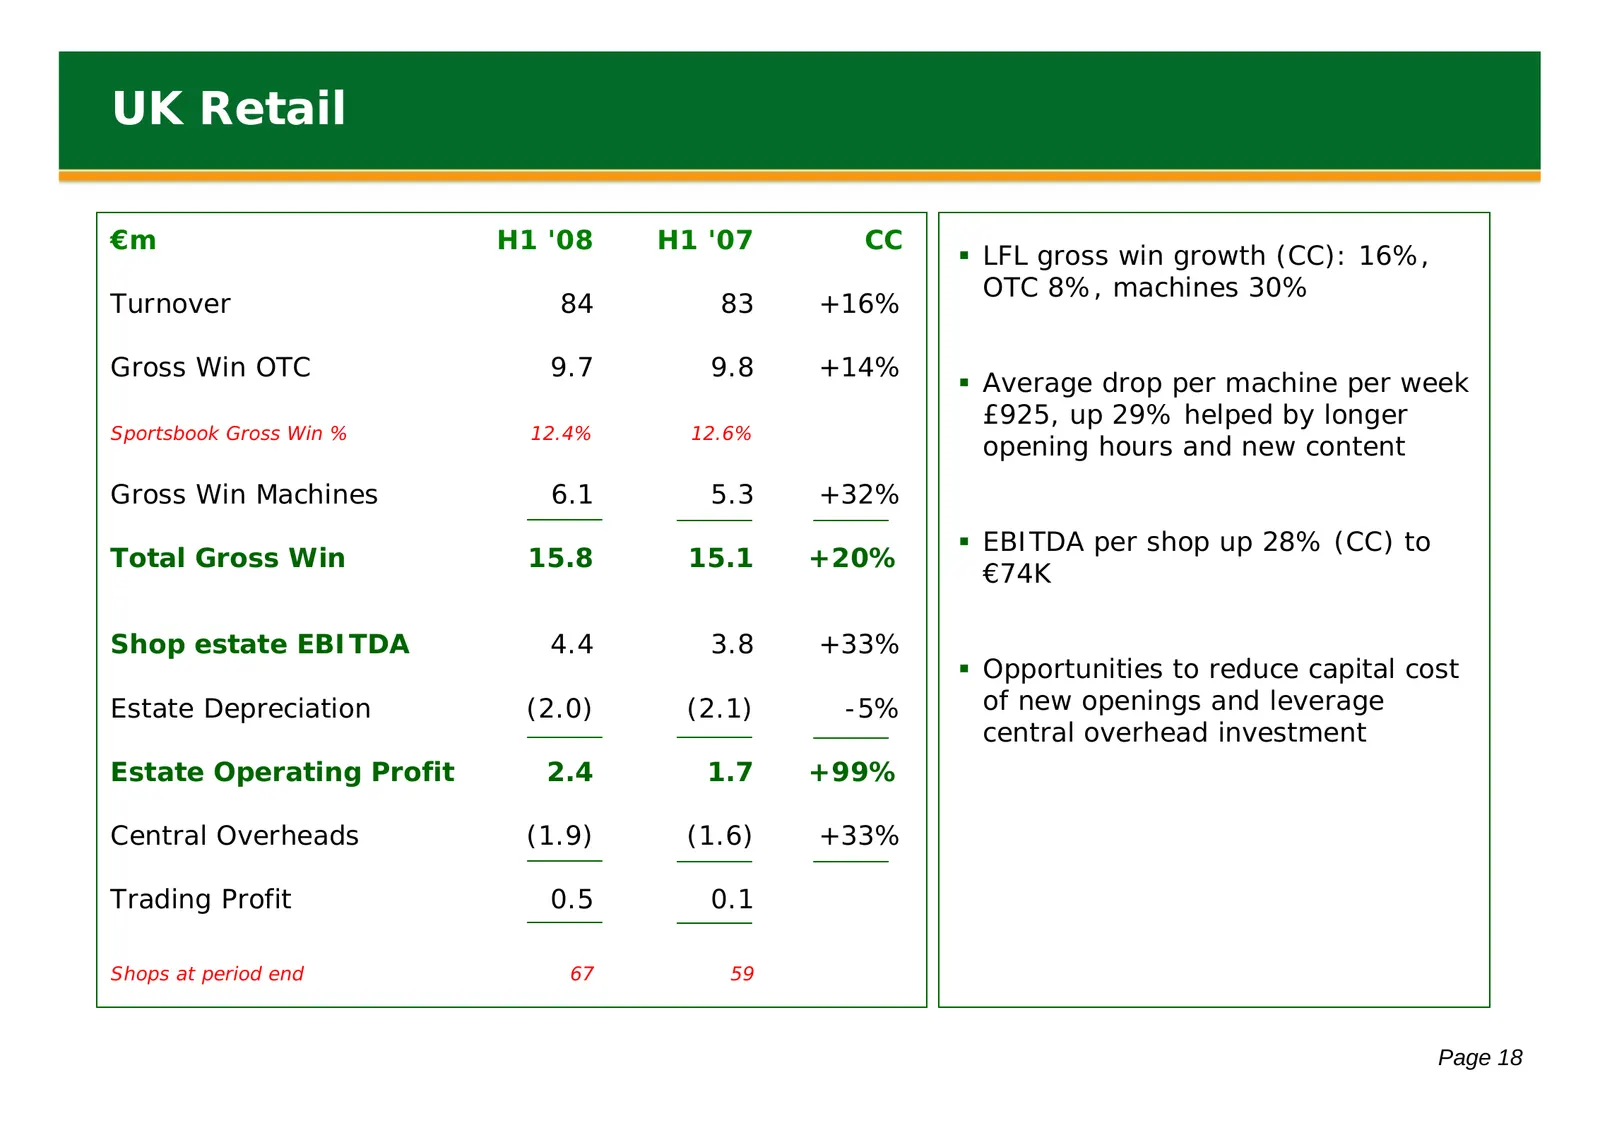
UK Retail €m H1 '08 H1 '07 CC LFL gross win growth (CC): 16%, OTC 8%, machines 30% Turnover 84 83 +16% Gross Win OTC 9.7 9.8 +14% Average drop per machine per week £925, up 29% helped by longer Sportsbook Gross Win % 12.4% 12.6% opening hours and new content Gross Win Machines 6.1 5.3 +32% EBI
Slide 20: UK Retail Expansion
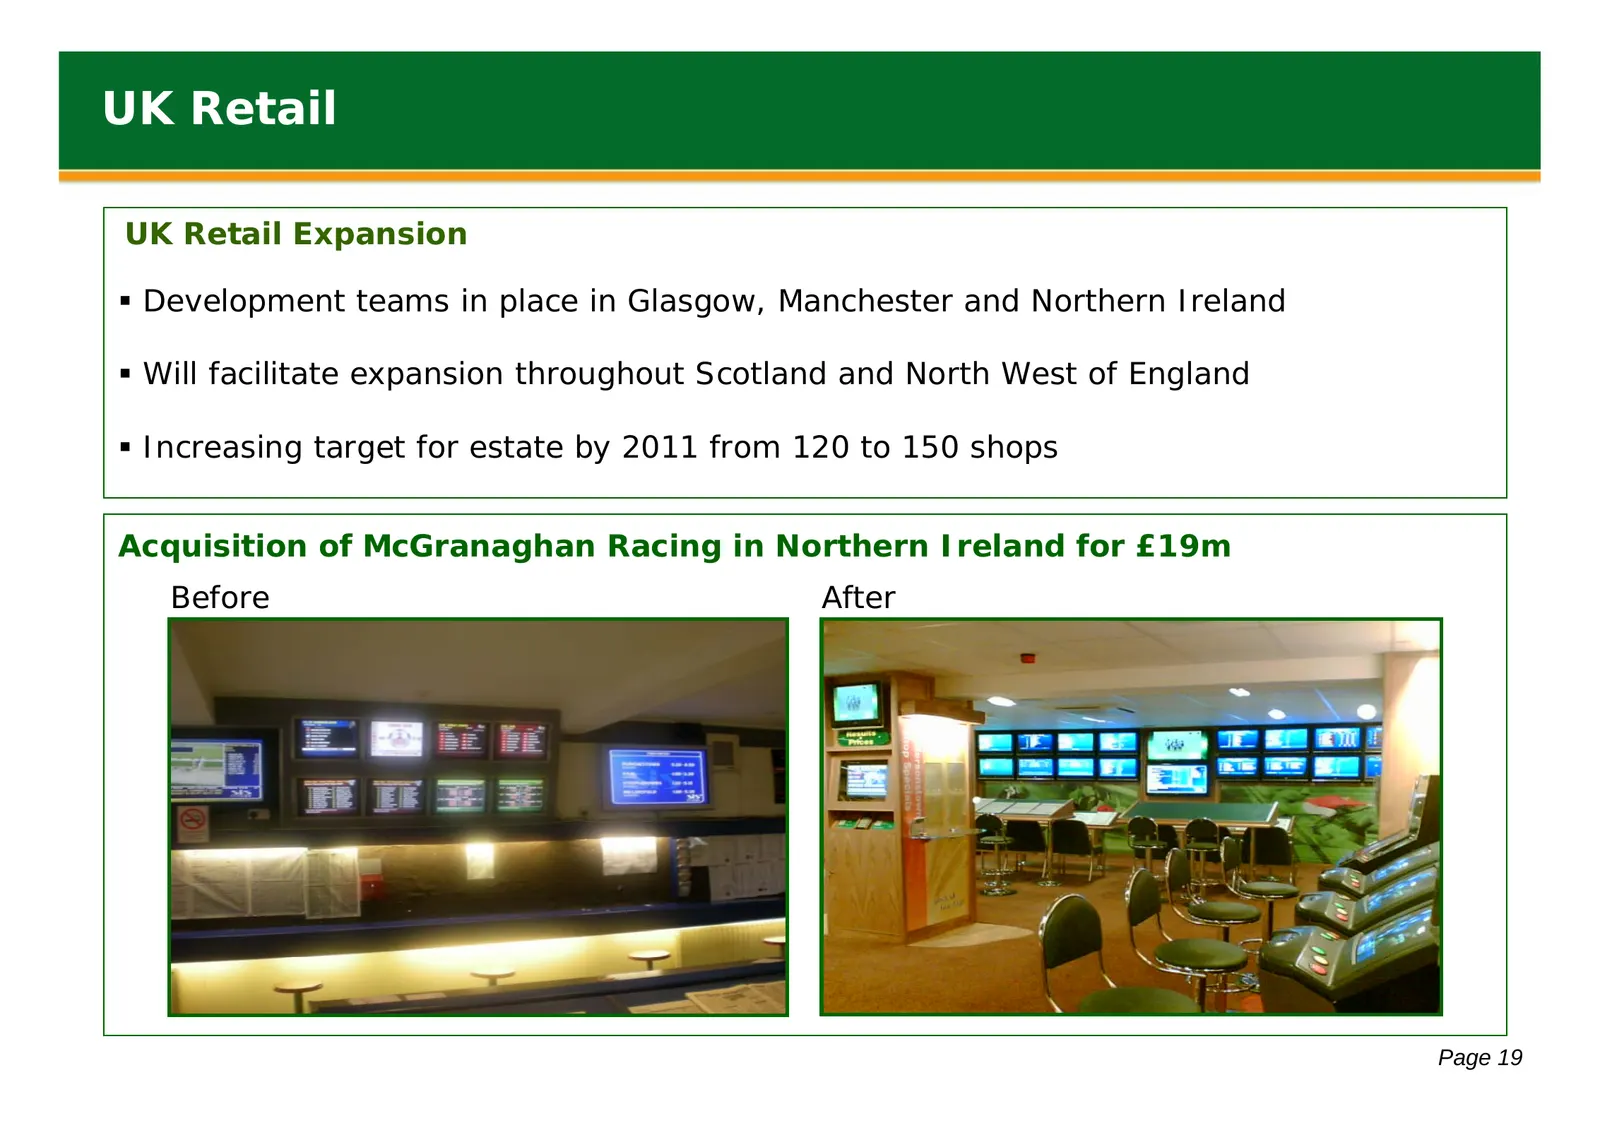
UK Retail UK Retail Expansion Development teams in place in Glasgow, Manchester and Northern Ireland Will facilitate expansion throughout Scotland and North West of England Increasing target for estate by 2011 from 120 to 150 shops Acquisition of McGranaghan Racing in Northern Ireland for £19m
Slide 21: Brand & PR: Gay Rugby World Cup Sponsorship
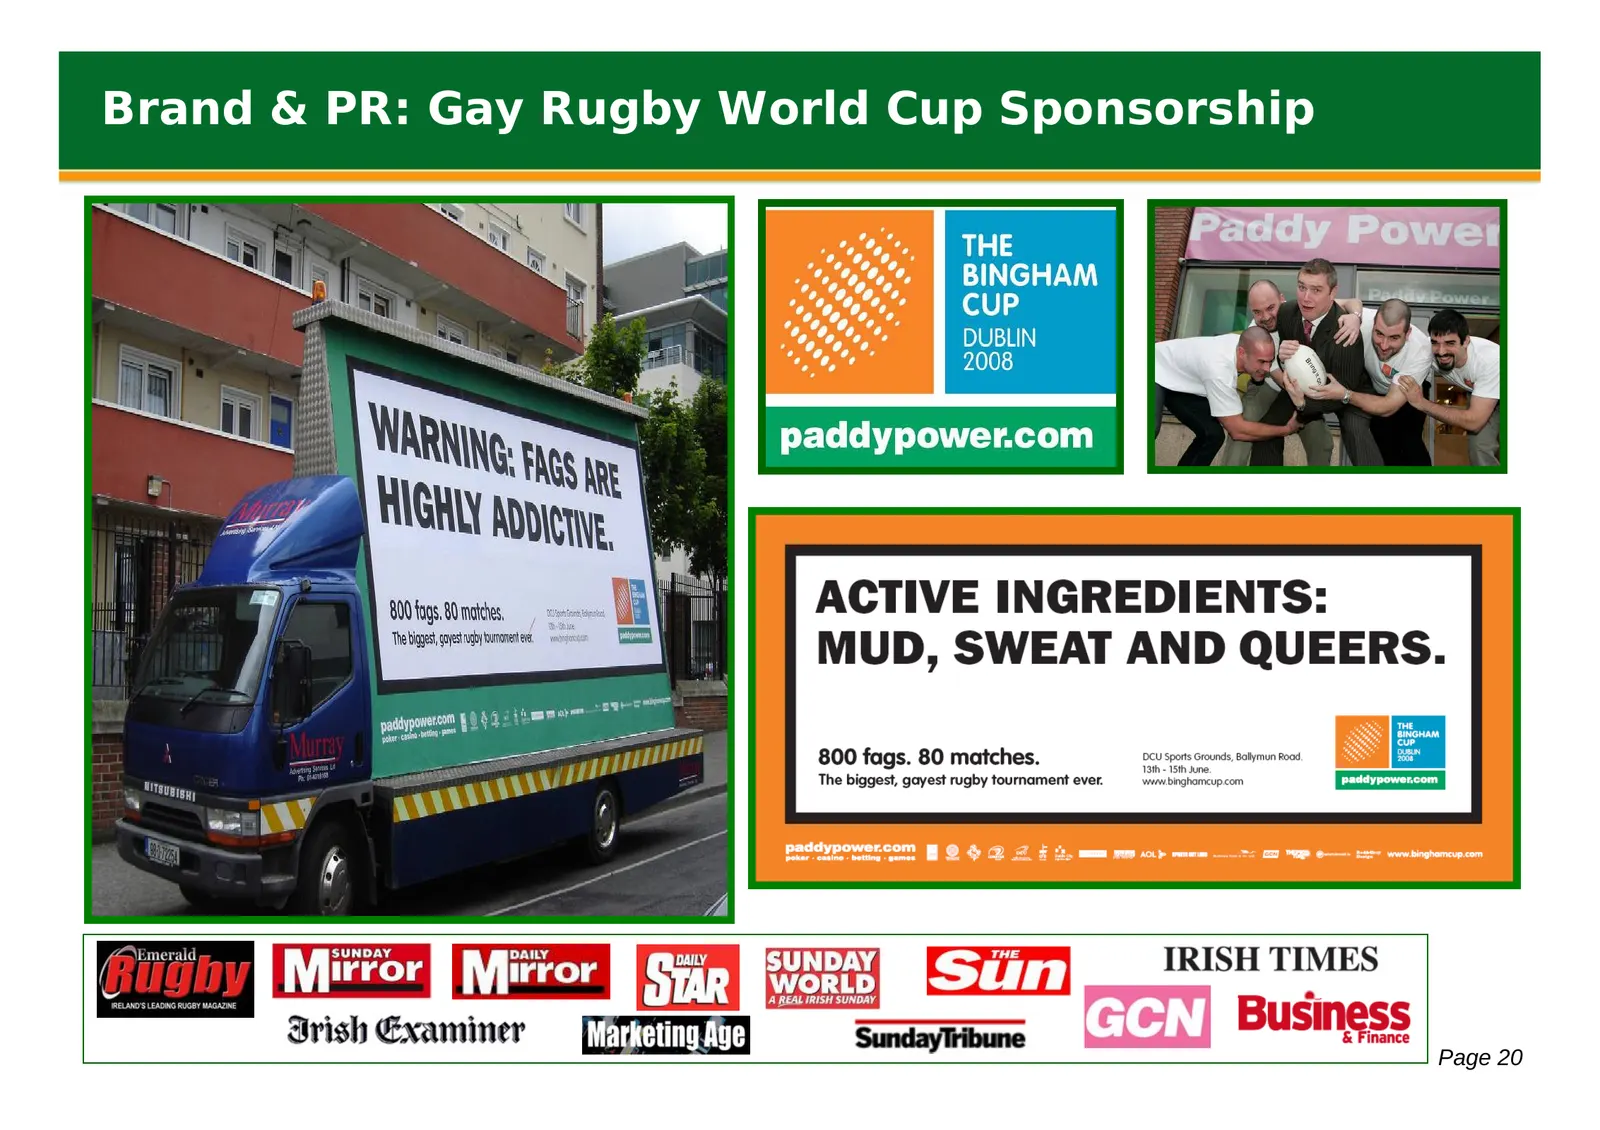
Brand & PR: Gay Rugby World Cup Sponsorship Page 20
Slide 22: Brand & PR: Politics
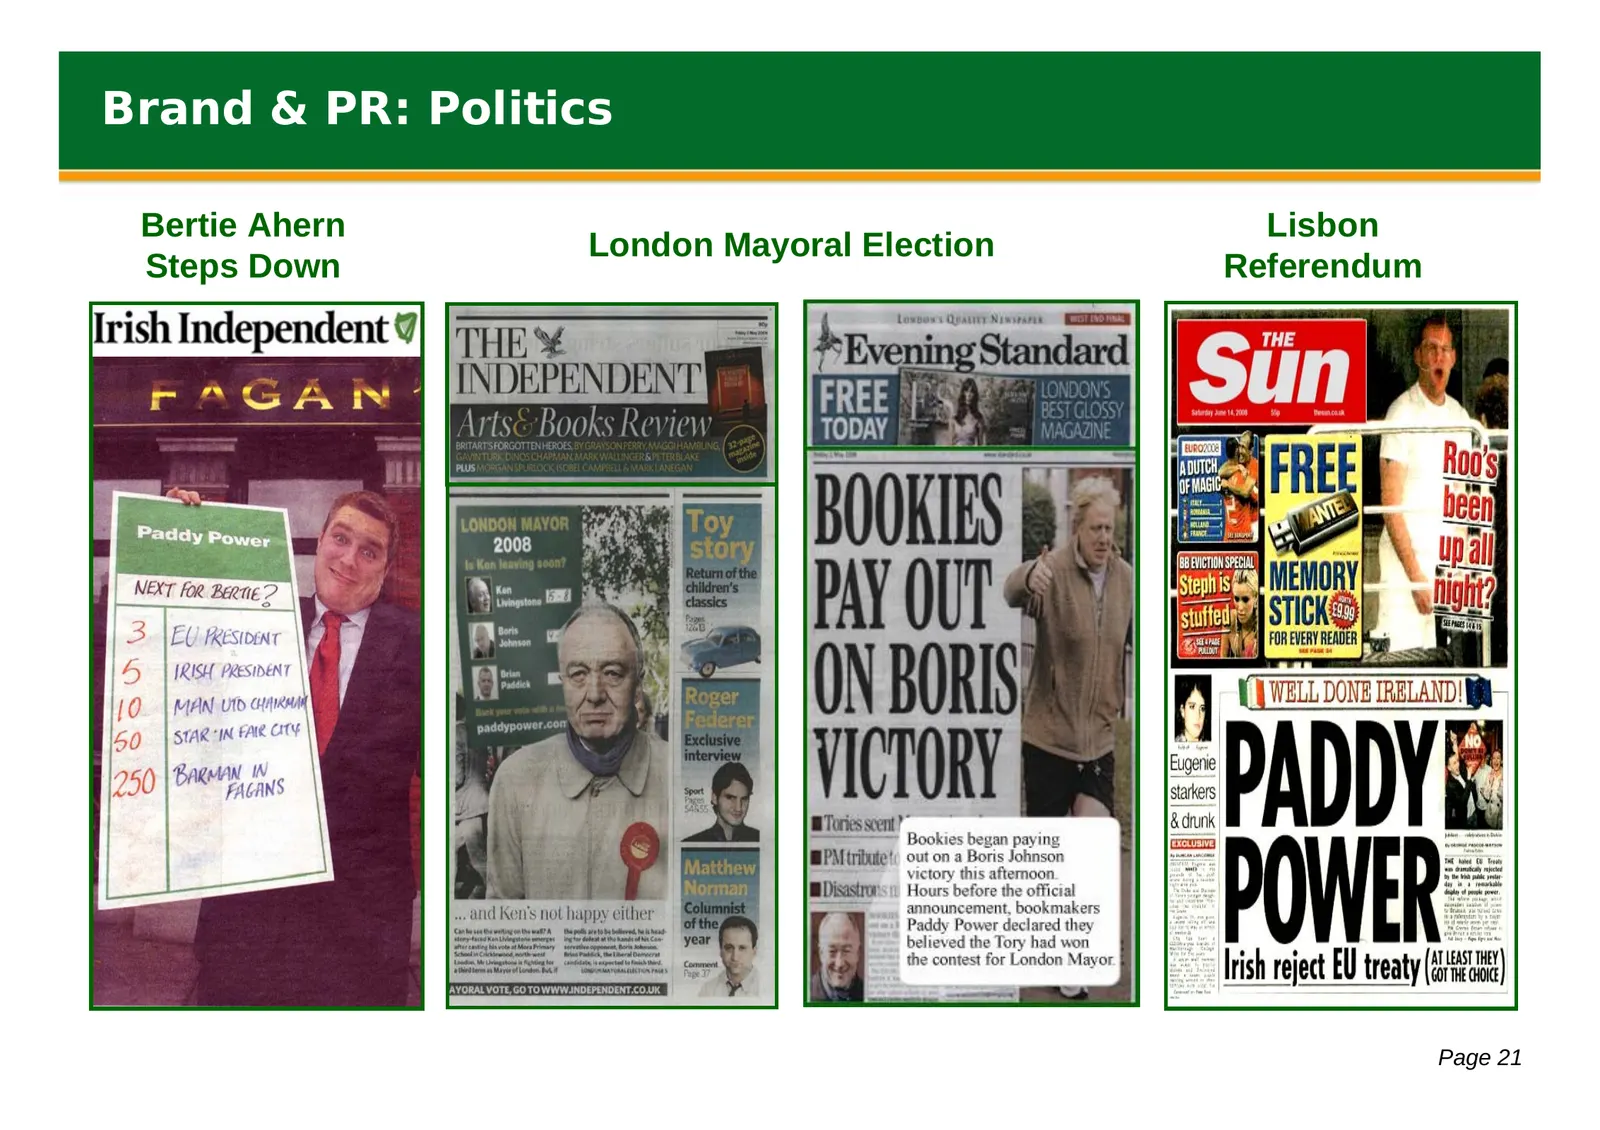
Brand & PR: Politics Bertie Ahern Lisbon London Mayoral Election Steps Down Referendum Page 21
Slide 23: Development and Strategy
Development and Strategy Introduction Financial Performance Operational Review Trading and Outlook Page 22

Slide 24: Sporting Results Update
Sporting Results Update Page 23
Slide 25: Economy
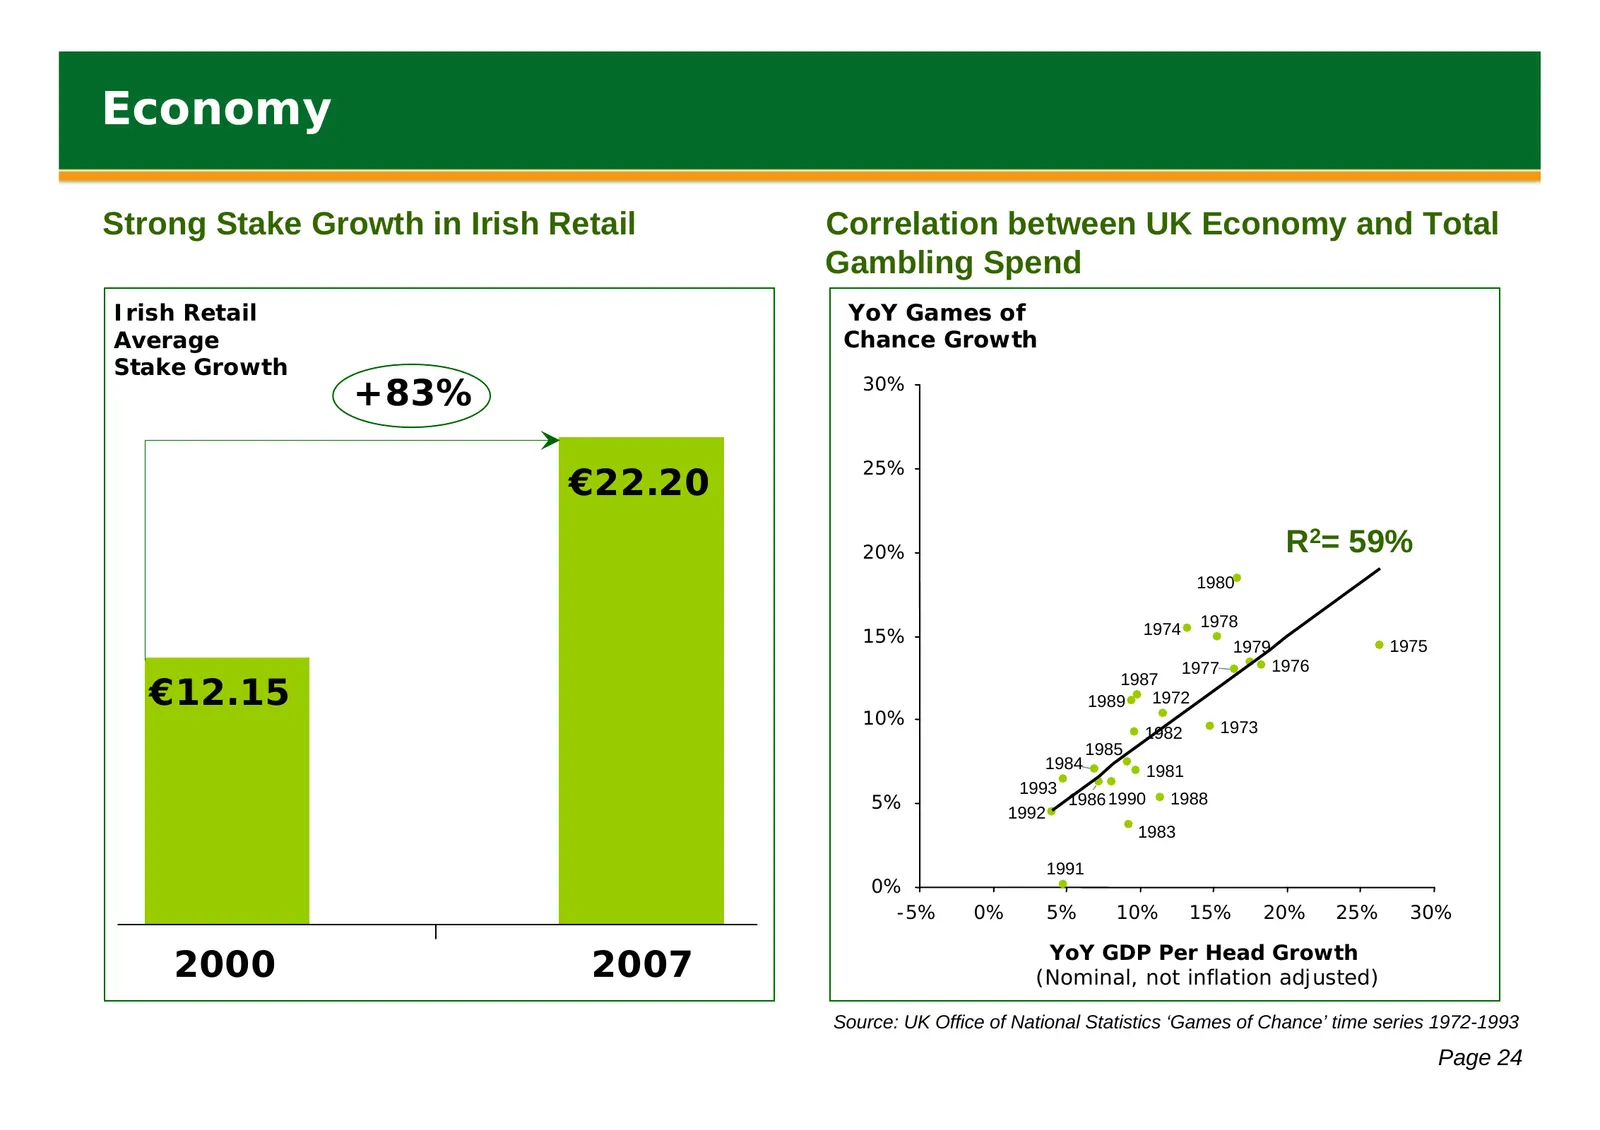
Economy Strong Stake Growth in Irish Retail Correlation between UK Economy and Total Gambling Spend Irish Retail YoY Games of Average Chance Growth Stake Growth +83% 30% 25% €22.20 20% R2= 59% 1980 1974 1978 15% 1975 1979 1977 1976 €12.15 1987 1989 1972 10% 1973 1982 1985 1984 1981 1993 5% 1992 1986
Slide 26: Trading Strategy
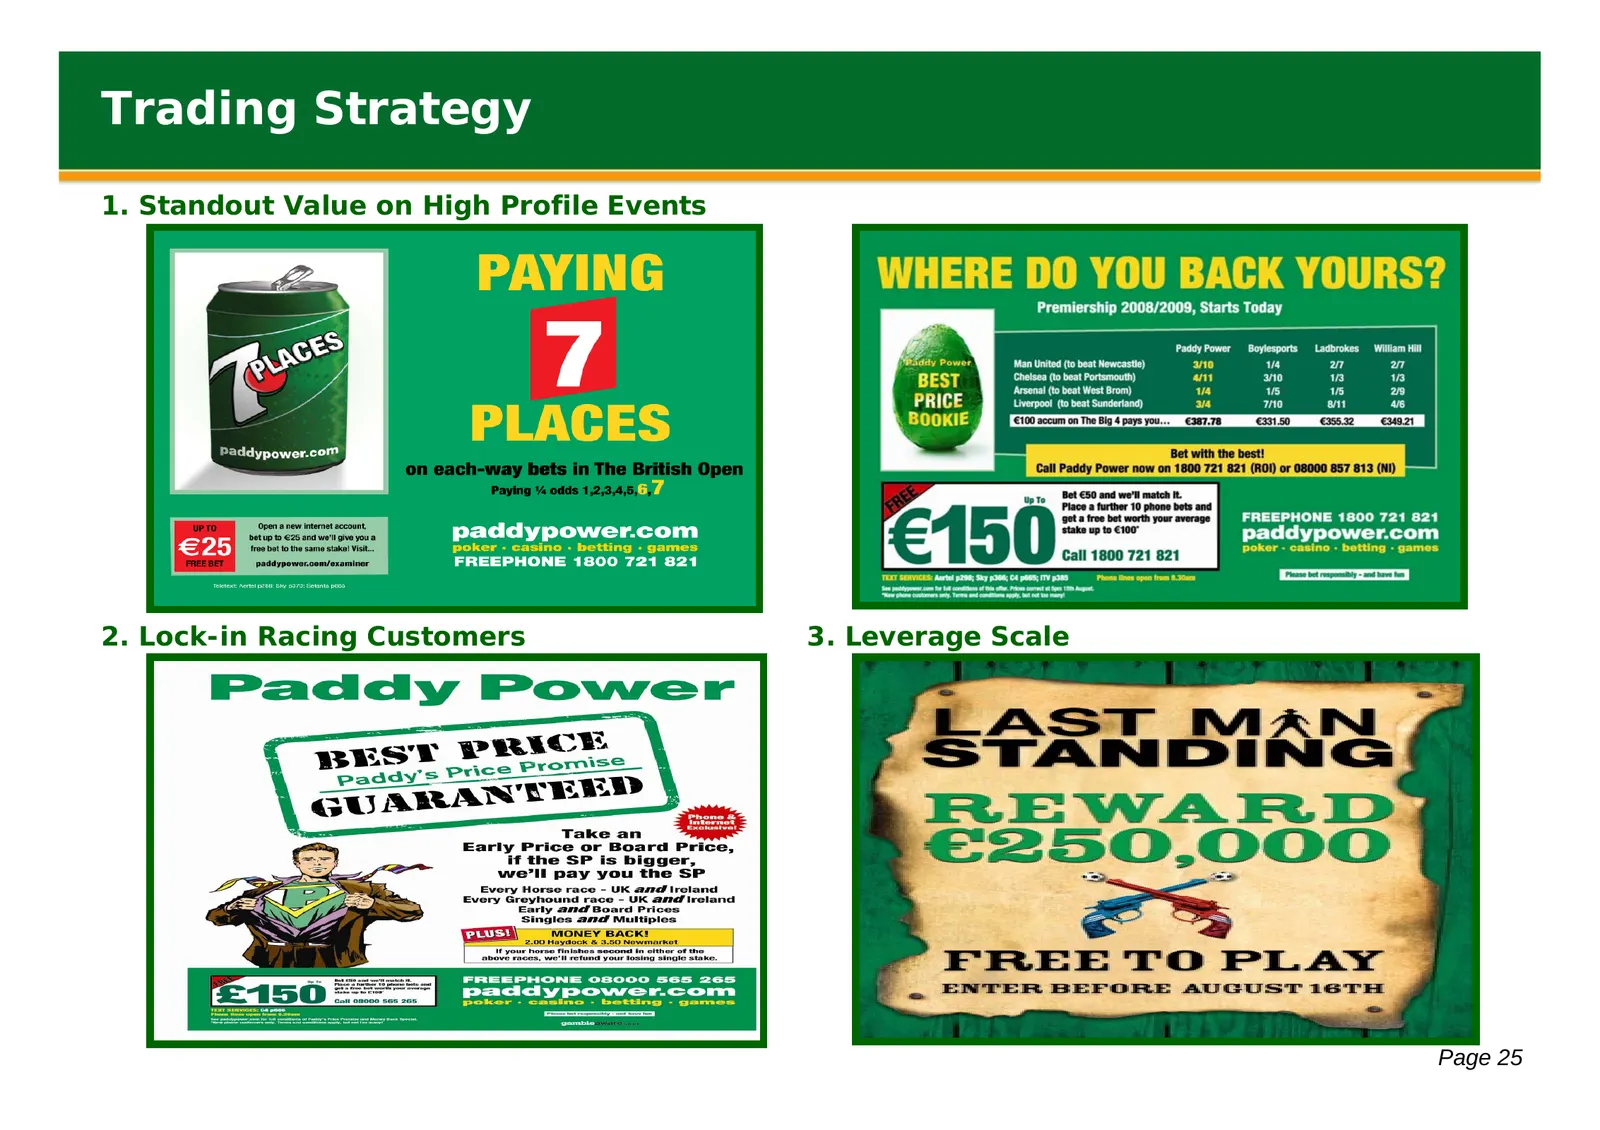
Trading Strategy 1. Standout Value on High Profile Events 2. Lock-in Racing Customers 3. Leverage Scale Page 25
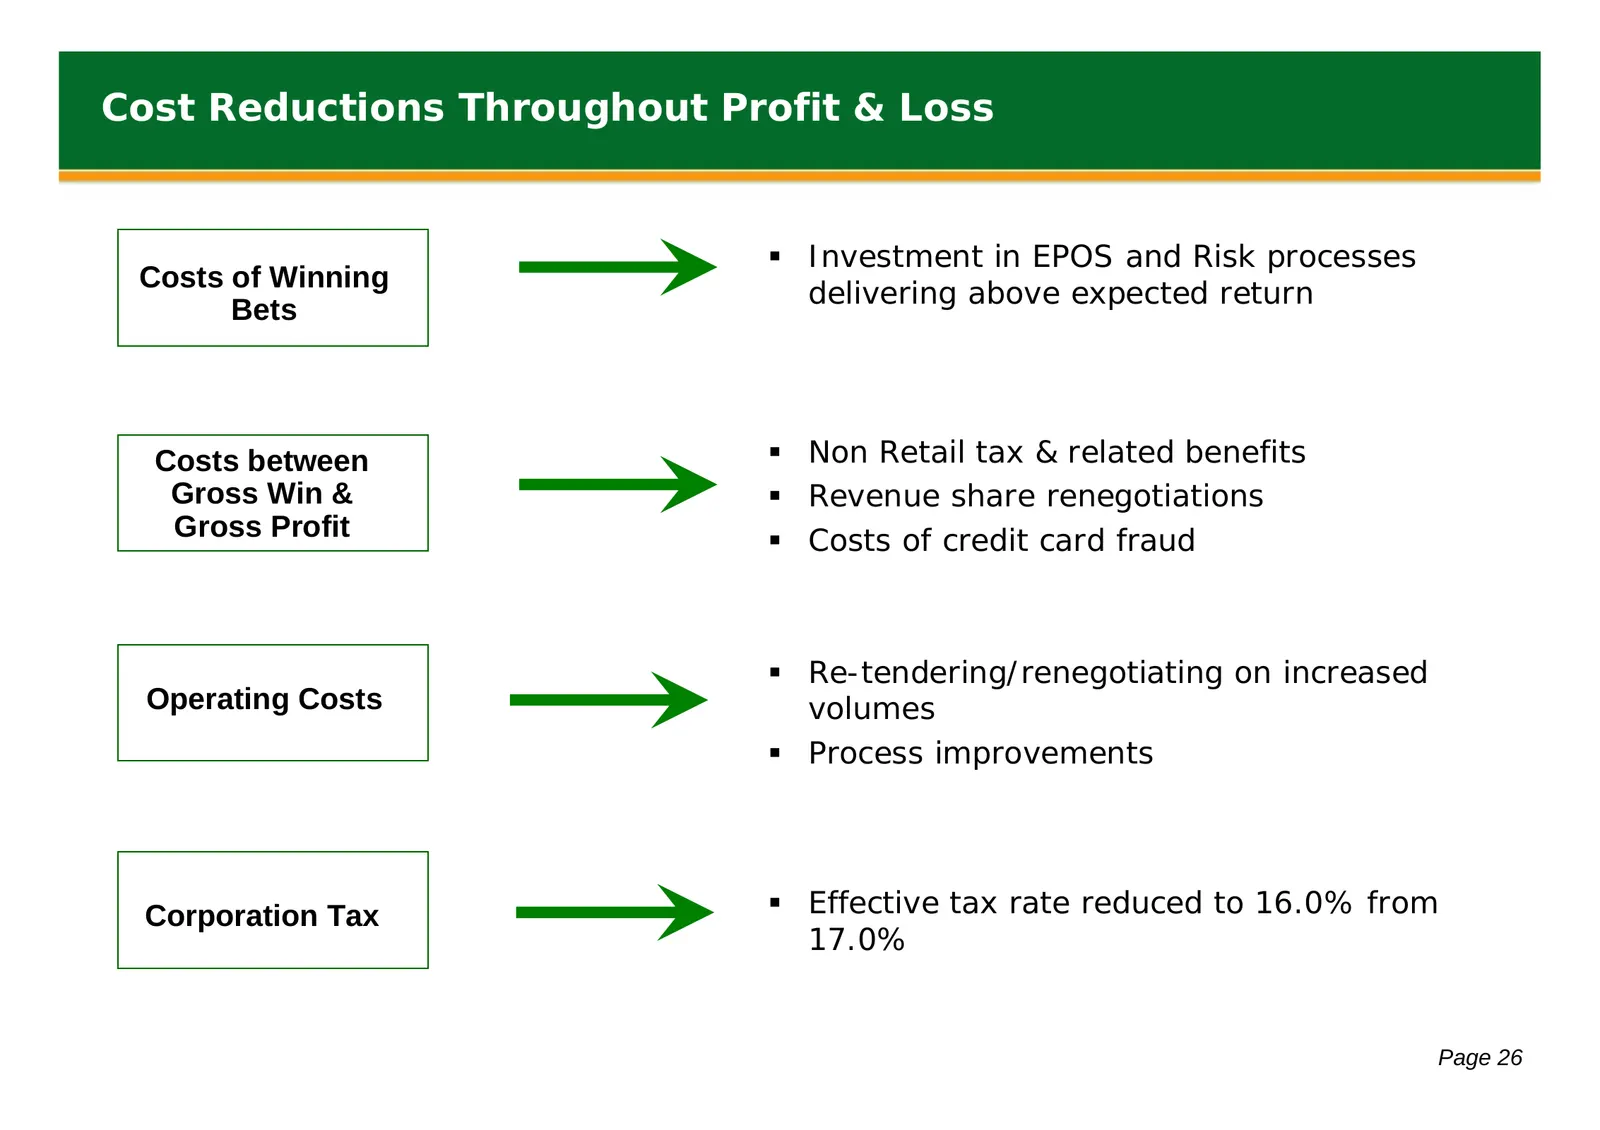
Slide 27: Cost Reductions Throughout Profit & Loss
Cost Reductions Throughout Profit & Loss Investment in EPOS and Risk processes Costs of Winning delivering above expected return Bets Costs between Non Retail tax & related benefits Gross Win & Revenue share renegotiations Gross Profit Costs of credit card fraud Re-tendering/renegotiating
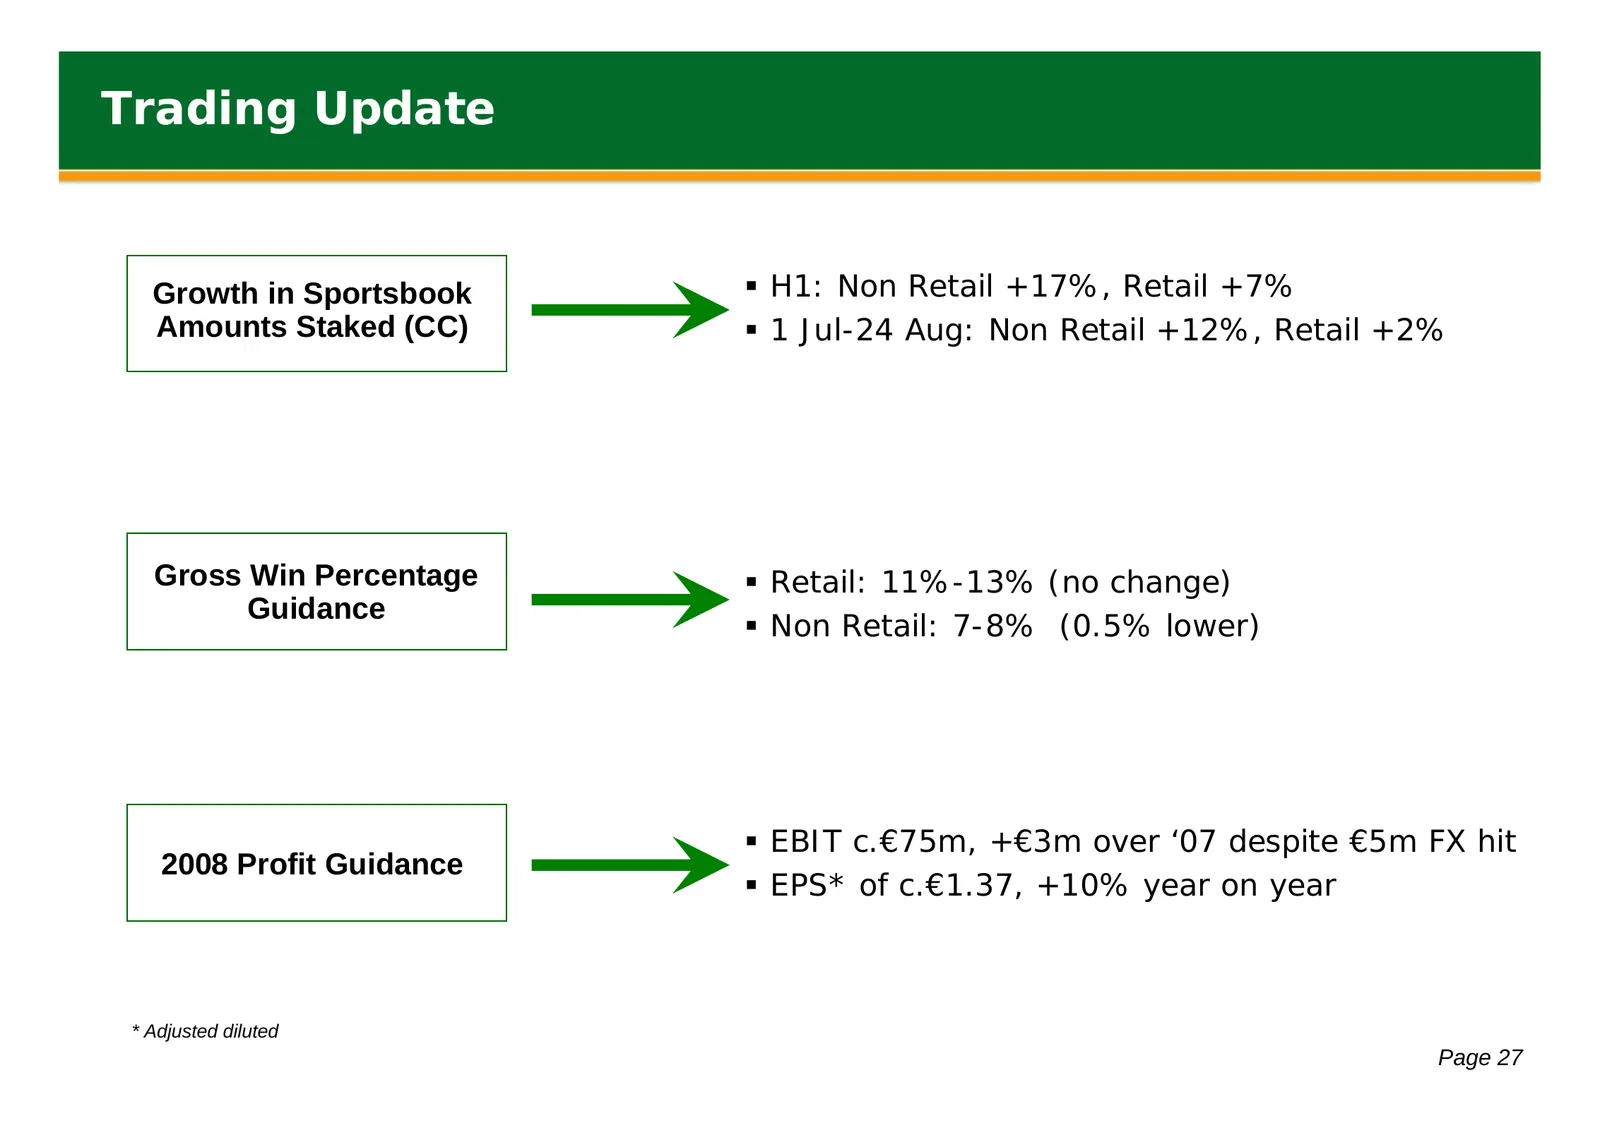
Slide 28: Trading Update
Trading Update Growth in Sportsbook H1: Non Retail +17%, Retail +7% Amounts Staked (CC) 1 Jul-24 Aug: Non Retail +12%, Retail +2% Gross Win Percentage Retail: 11%-13% (no change) Guidance Non Retail: 7-8% (0.5% lower) EBIT c.€75m, +€3m over ‘07 despite €5m FX hit 2008 Profit Guidance EPS
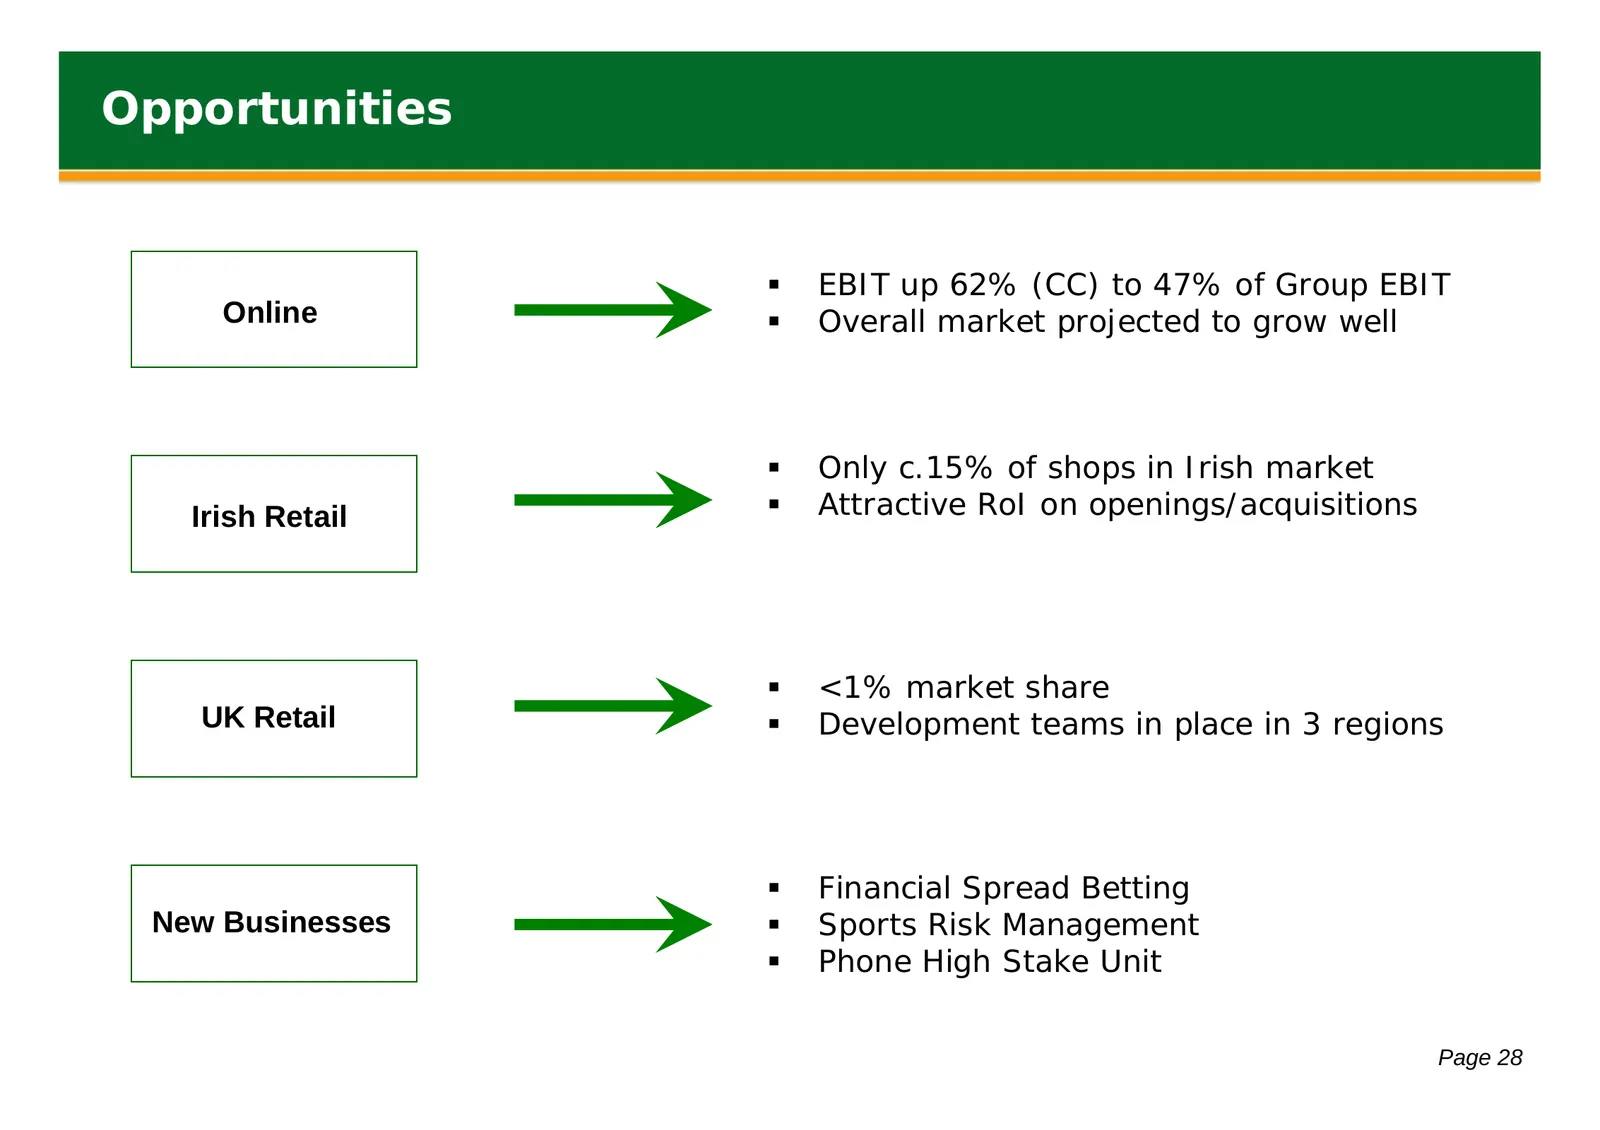
Slide 29: Opportunities
Opportunities EBIT up 62% (CC) to 47% of Group EBIT Online Overall market projected to grow well Only c.15% of shops in Irish market Irish Retail Attractive RoI on openings/acquisitions <1% market share UK Retail Development teams in place in 3 regions Financial Spread Betting New Busi
Source: Internet Archive copy of flutter.com
More decks from Flutter Entertainment plc
 Q3 2026 Earnings Presentation15 slides · Nov 4, 2026
 Q2 2026 Earnings Presentation14 slides · Aug 5, 2026
 Investor Day (September 2024)152 slides · Sep 25, 2024
 Q2 2024 Earnings Presentation20 slides · Aug 13, 2024
 Q1 2024 Earnings Presentation20 slides · May 14, 2024
 FY2023 Earnings Presentation36 slides · Mar 26, 2024