New York REIT — Investor Presentation (October 2015)
15 slides from New York REIT's investor presentation, Oct 9, 2015
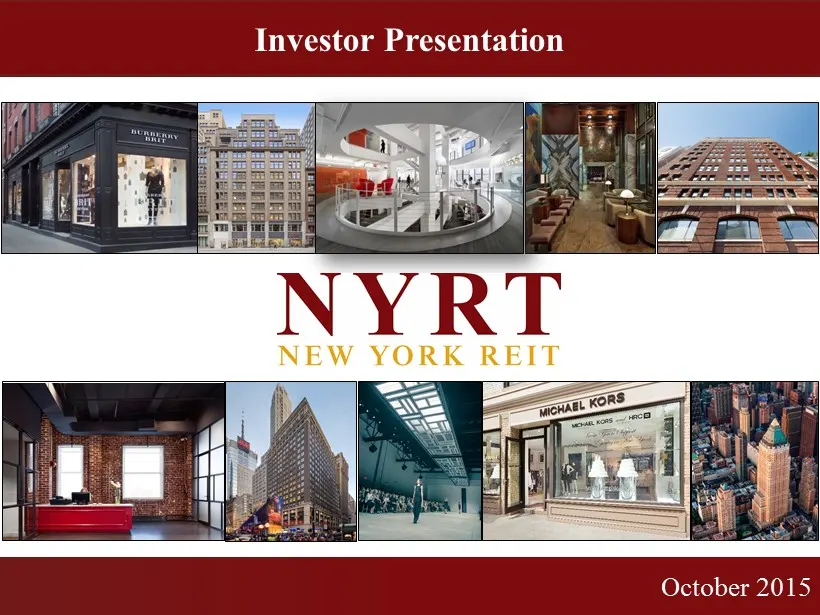
Slide 1: Investor Presentation October 2015
0 February 2014 Investor Presentation October 2015
Slide 2: Forward Looking Statements & Projections
1 Forward Looking Statements & Projections Certain statements included in this presentation are forward - looking statements . Those statements include statements regarding the intent, belief or current expectations of New York REIT, Inc . (the “Company,” “NYRT,” "we," "our" or "us "), Apollo Global
Slide 3: Update on Strategic Initiatives
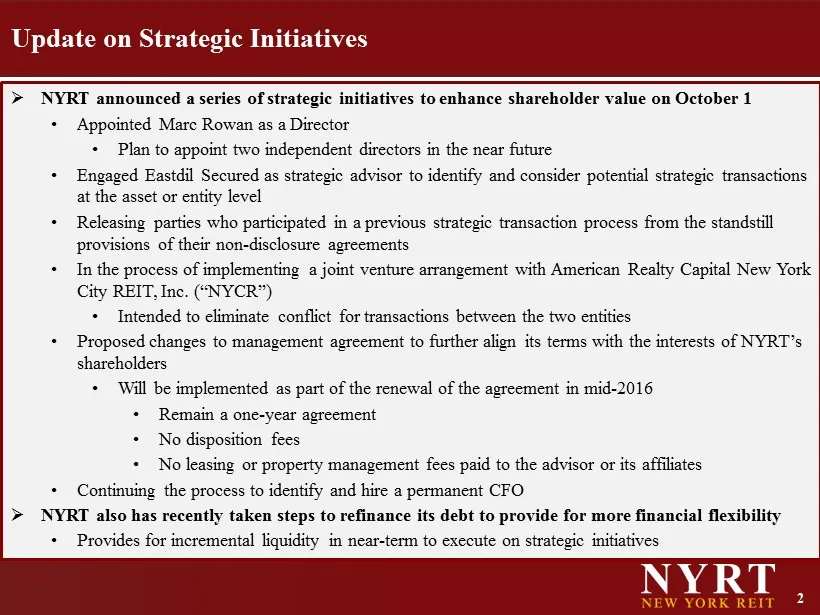
2 » NYRT announced a series of strategic initiatives to enhance shareholder value on October 1 • Appointed Marc Rowan as a Director • Plan to appoint two independent directors in the near future • Engaged Eastdil Secured as strategic advisor to identify and consider potential strategic transactions
Slide 4: Overview of Company
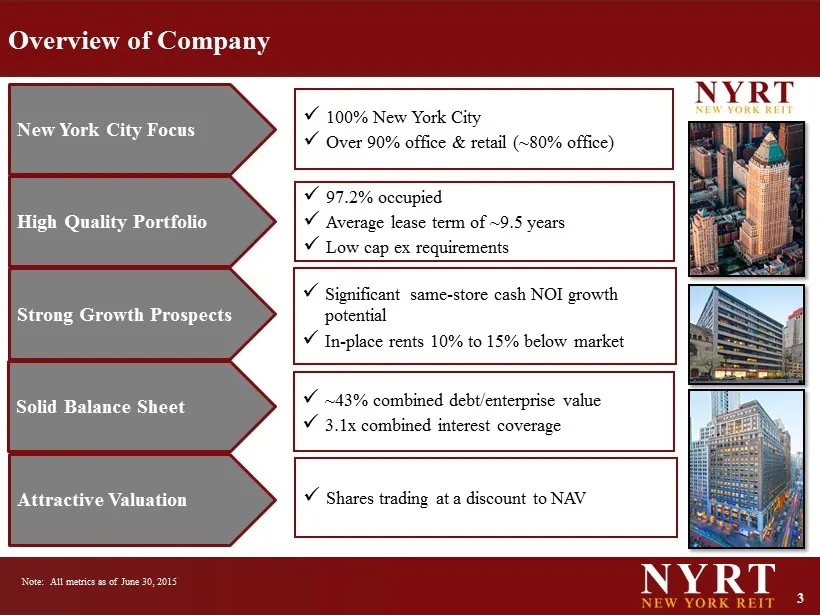
3 Overview of Company x Significant same - store cash NOI growth potential x In - place rents 10% to 15 % below market x 100% New York City x Over 90% office & retail (~80 % office) x 97.2% occupied x Average lease term of ~9.5 years x Low cap ex requirements x ~ 43% combined debt/enterprise value x
Slide 5: Portfolio Snapshot (as of 6/30/15)
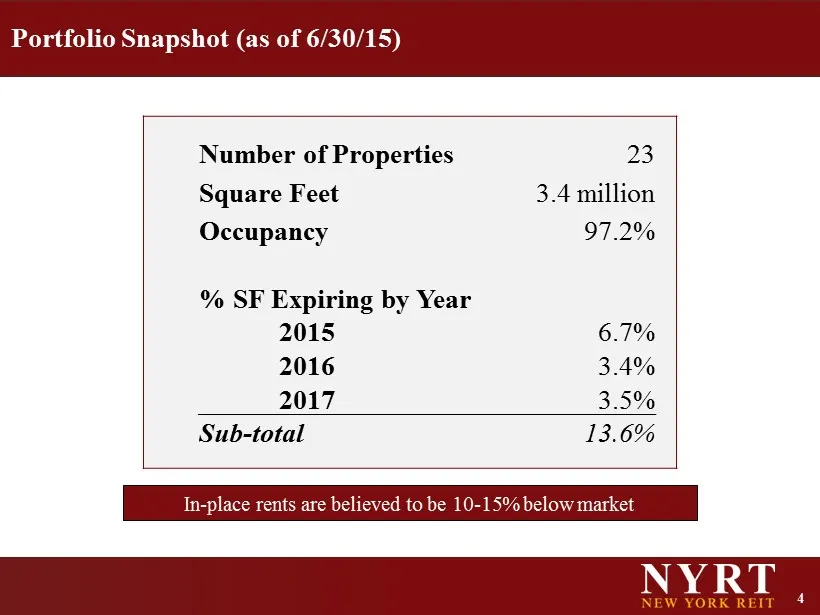
4 Portfolio Snapshot (as of 6/30/15) In - place rents are believed to be 10 - 15% below market Number of Properties 23 Square Feet 3.4 million Occupancy 97.2 % % SF Expiring by Year 2015 6.7% 2016 3.4% 2017 3.5% Sub - total 13.6%
Slide 6: Cash Rent Portfolio Mix
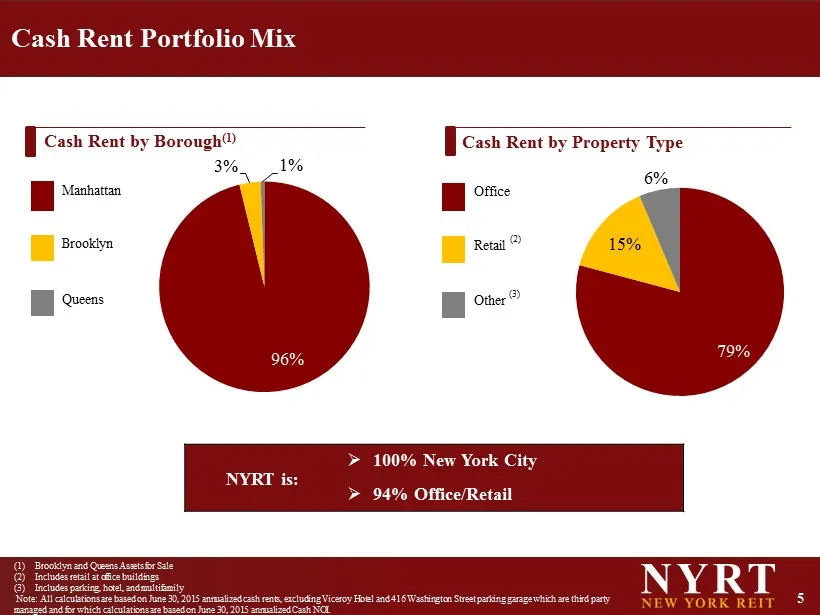
5 79% 15 % 6% 96% 3% 1% Cash Rent Portfolio Mix (1) Brooklyn and Queens Assets for Sale (2) Includes retail at office buildings (3) Includes parking, hotel, and multifamily Note: All calculations are based on June 30, 2015 annualized cash rents, excluding Viceroy Hotel and 416 Washington Street pa r
Slide 7: Major Assets
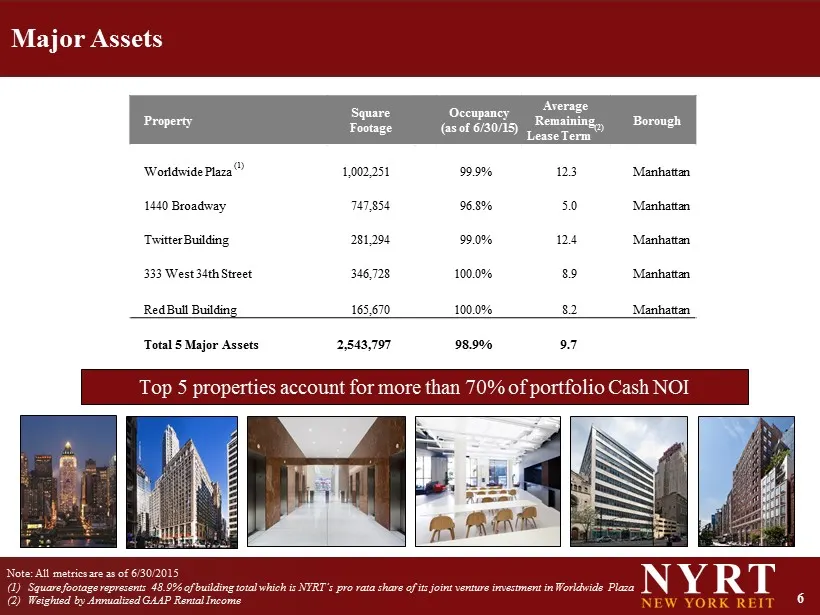
6 Major Assets Note: All metrics are as of 6/30/2015 (1) Square footage represents 48.9 % of building total which is NYRT’s pro rata share of its joint venture investment in Worldwide Plaza (2) Weighted by Annualized GAAP Rental Income Top 5 properties account for more than 70% of portfolio Cash NOI
Slide 8: Highlights for 2Q 2015
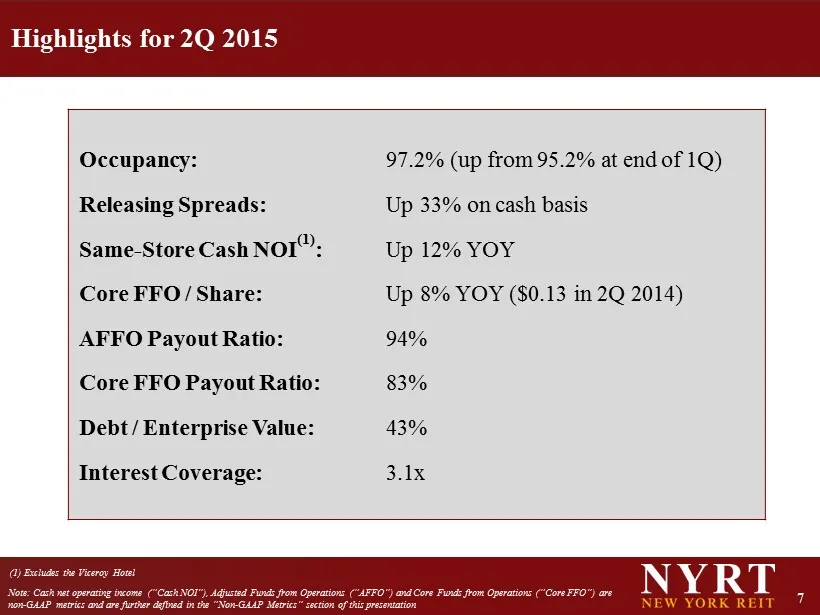
7 Highlights for 2Q 2015 Occupancy: 97.2% (up from 95.2% at end of 1Q) Releasing Spreads: Up 33% on cash basis Same - Store Cash NOI (1) : Up 12% YOY Core FFO / Share: Up 8 % YOY ($ 0.13 in 2Q 2014) AFFO Payout Ratio: 94% Core FFO Payout Ratio: 83% Debt / Enterprise Value: 43% Interest Coverage: 3.1
Slide 9: Non-Core Asset Sales
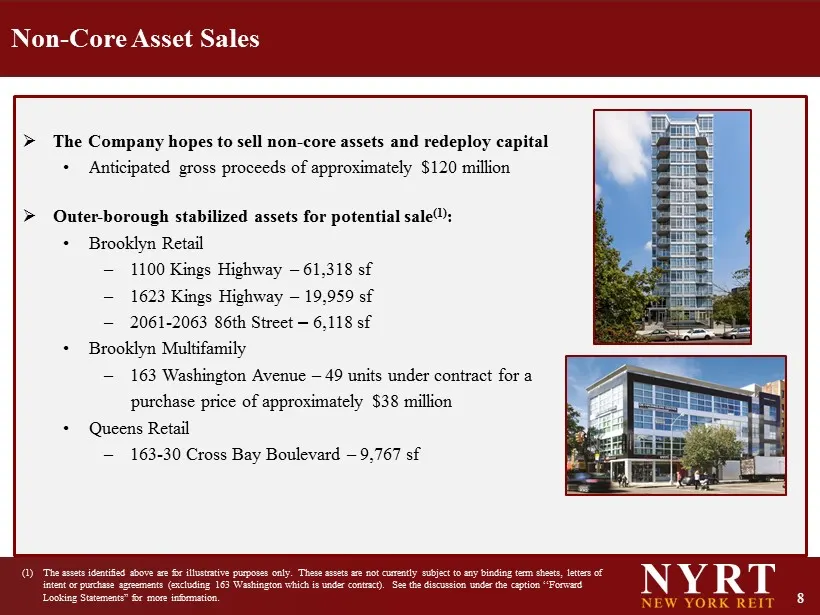
8 » The Company hopes to sell non - core assets and redeploy capital • Anticipated gross proceeds of approximately $120 million » Outer - borough stabilized assets for potential sale (1) : • Brooklyn Retail ‒ 1100 Kings Highway – 61,318 sf ‒ 1623 Kings Highway – 19,959 sf ‒ 2061 - 2063 86th Street –
Slide 10: Apollo announced agreement to acquire 60% of AR Global
9 » In August 2015, Apollo announced the agreement to acquire 60% of AR Global (1) • Apollo agreed to acquire 60% of AR Global, LLC (“AR Global”), a newly formed entity that will own a majority of the ongoing asset management business of AR Capital, LLC (“AR Capital”) • Apollo is committing a wide r
Slide 11: Benefits of External Management
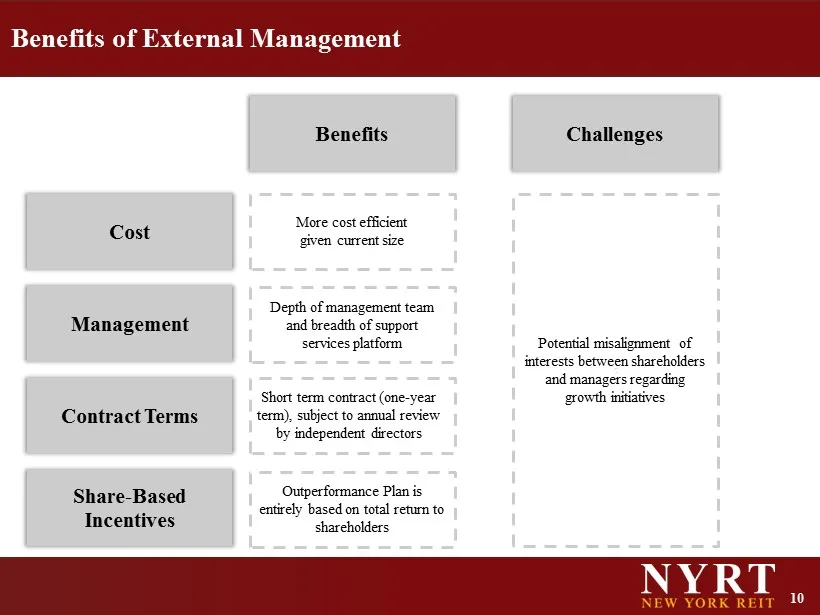
10 Benefits of External Management Cost Management Contract Terms Share - Based Incentives Potential misalignment of interests between shareholders and managers regarding growth initiatives Benefits Challenges More cost efficient given current size Depth of management team and breadth of support ser
Slide 12: Apollo is One of the World's Largest Alternative Asset Managers
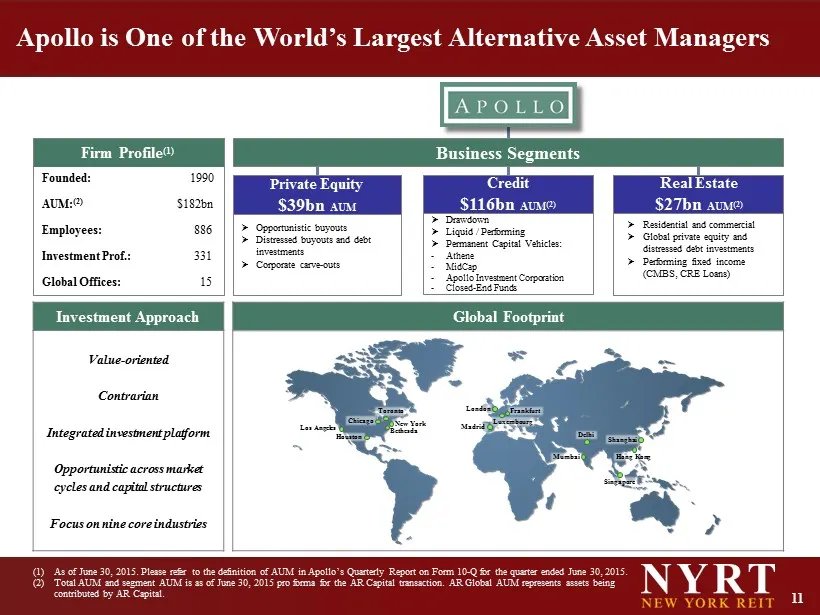
11 Founded: 1990 AUM : (2) $ 182bn Employees: 886 Investment Prof.: 331 Global Offices: 15 Apollo is One of the World’s Largest Alternative Asset Managers (1) As of June 30, 2015. Please refer to the definition of AUM in Apollo’s Q uarterly Report on Form 10 - Q for the quarter ended June 30, 2015.
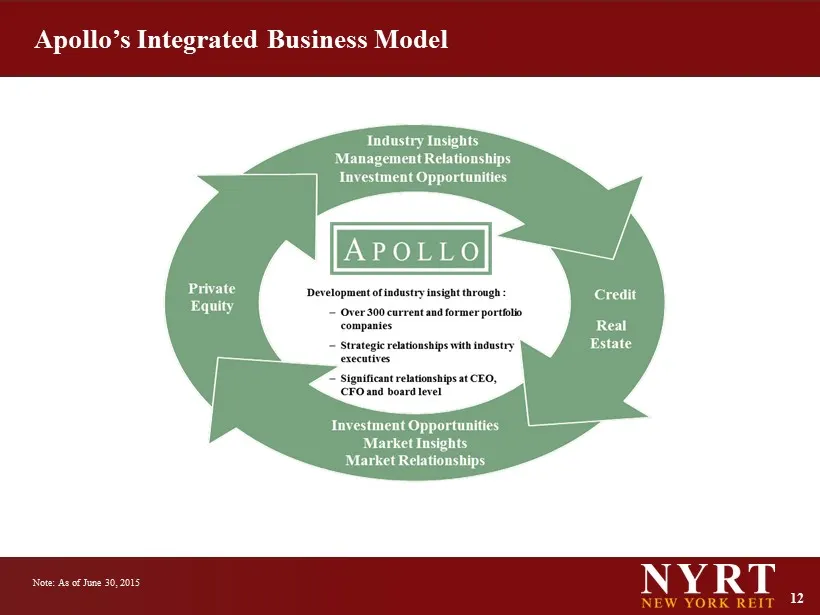
Slide 13: Apollo's Integrated Business Model
12 Apollo’s Integrated Business Model Note: As of June 30, 2015
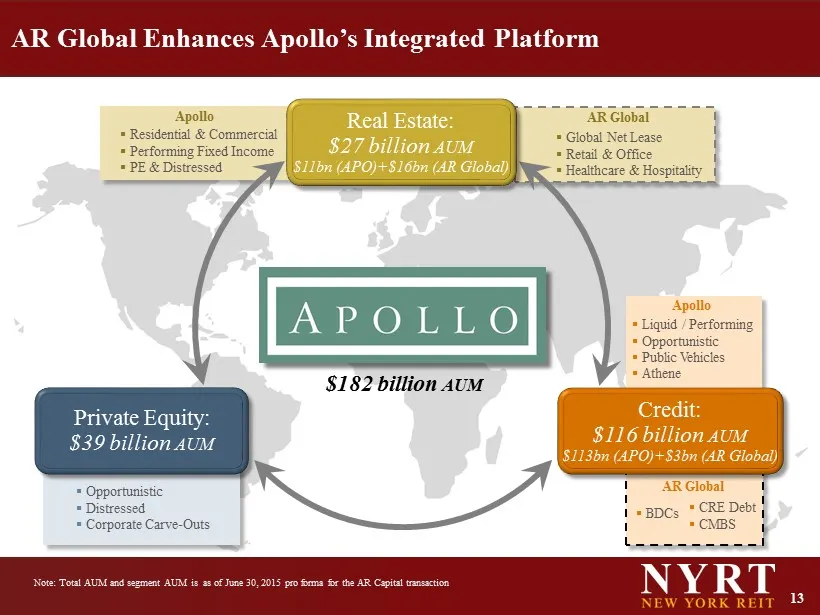
Slide 14: AR Global Enhances Apollo's Integrated Platform
13 AR Global Enhances Apollo’s Integrated Platform ▪ Residential & Commercial ▪ Performing Fixed Income ▪ PE & Distressed ▪ Global Net Lease ▪ Retail & Office ▪ Healthcare & Hospitality ▪ BDCs AR Global ▪ Liquid / Performing ▪ Opportunistic ▪ Public Vehicles ▪ Athene Note: Total AUM and segment AUM
Slide 15: Non-GAAP Metrics
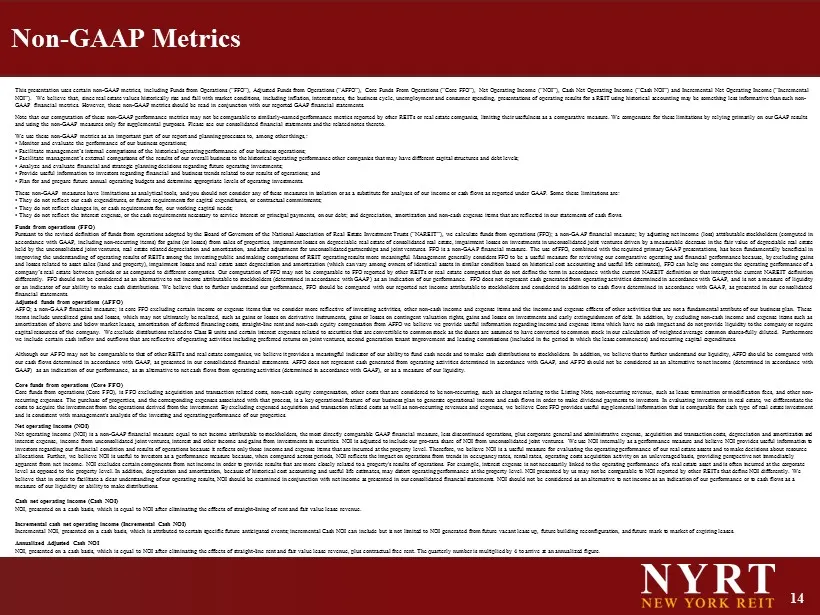
14 Non - GAAP Metrics This presentation uses certain non - GAAP metrics, including Funds from Operations (“FFO”), Adjusted Funds from Operations (“AFFO” ), Core Funds From Operations (“ Core FFO”), Net Operating Income (“NOI”), Cash Net Operating Income (“Cash NOI”) and Incremental Net Operating Inc
Source: SEC EDGAR · 8-K filed Oct 9, 2015
More decks from New York REIT Inc
 Investor Presentation (August 2016)11 slides · Aug 9, 2016
 Proxy Contest (July 2016)18 slides · Jul 26, 2016
 Proxy Contest (June 2016)16 slides · Jun 21, 2016
 Merger or Acquisition (May 2016)52 slides · May 25, 2016
 Investor Presentation (February 2016)14 slides · Feb 26, 2016
 Investor Presentation (November 2015)12 slides · Nov 5, 2015