Allegiance Bancshares — Q3 2019 Earnings Presentation
16 slides from Allegiance Bancshares's earnings presentation, Oct 25, 2019

Slide 1: Third Quarter 2019 Earnings Presentation
Fixed Income Investor Presentation September 2019 Fixed Income Investor Presentation [Month] [Day], 2019 Third Quarter 2019 Earnings Presentation cshares, Inc. Exhibit 99.2
Slide 2: Safe Harbor Statement
“Safe Harbor” Statement under the Private Securities Litigation Reform Act of 1995: This presentation may contain forward-looking statements within the meaning of the securities laws that are based on various facts and derived utilizing important assumptions, present expectations, estimates and proj
Slide 3: Allegiance Bancshares, Inc. Overview
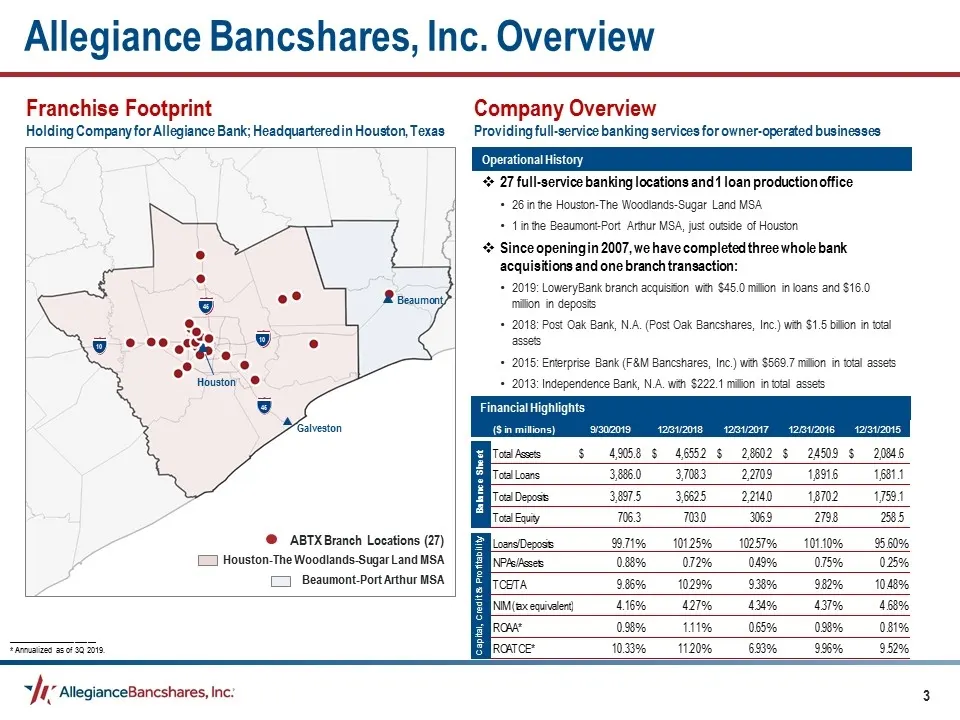
Allegiance Bancshares, Inc. Overview Franchise Footprint Holding Company for Allegiance Bank; Headquartered in Houston, Texas Company Overview Providing full-service banking services for owner-operated businesses Operational History 27 full-service banking locations and 1 loan production office 26 i
Slide 4: Our Super-Community Banking Strategy
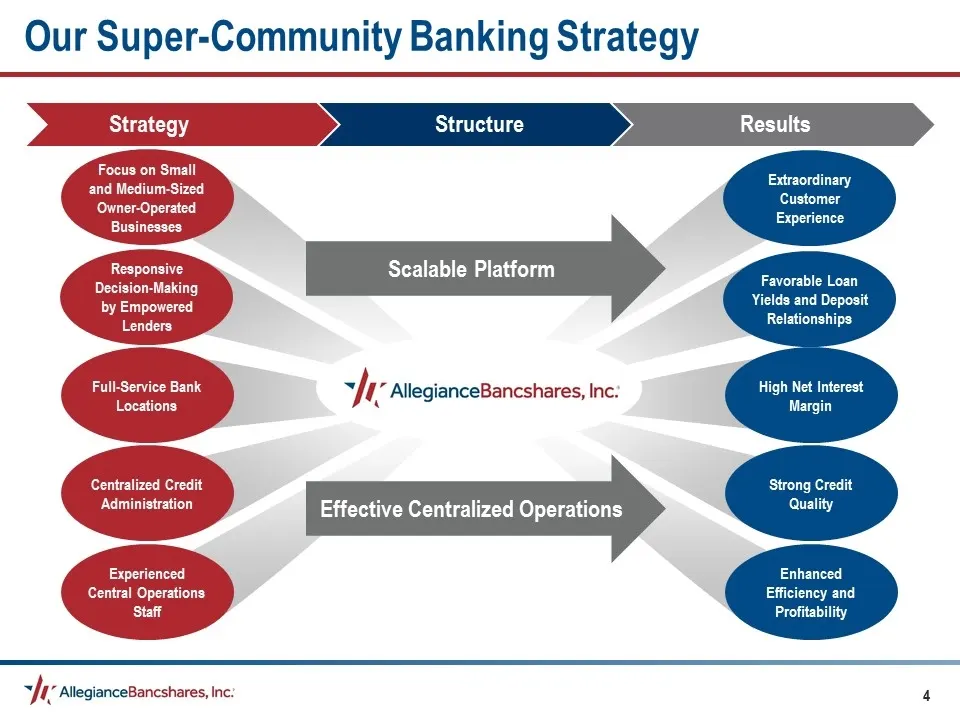
Our Super-Community Banking Strategy High Net Interest Margin Strong Credit Quality Centralized Credit Administration Focus on Small and Medium-Sized Owner-Operated Businesses Full-Service Bank Locations Favorable Loan Yields and Deposit Relationships Effective Centralized Operations Scalable Platfo
Slide 5: Deposit Market Share - Houston-The Woodlands-Sugar Land MSA
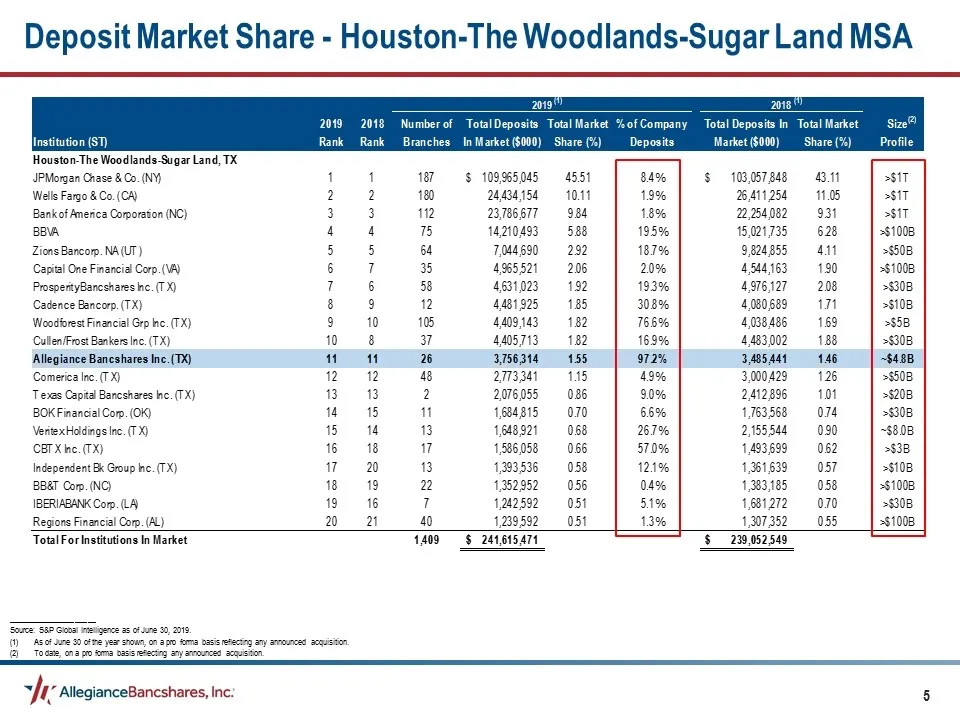
Deposit Market Share - Houston-The Woodlands-Sugar Land MSA _____________________ Source: S&P Global Intelligence as of June 30, 2019. As of June 30 of the year shown, on a pro forma basis reflecting any announced acquisition. To date, on a pro forma basis reflecting any announced acquisition. (1) (
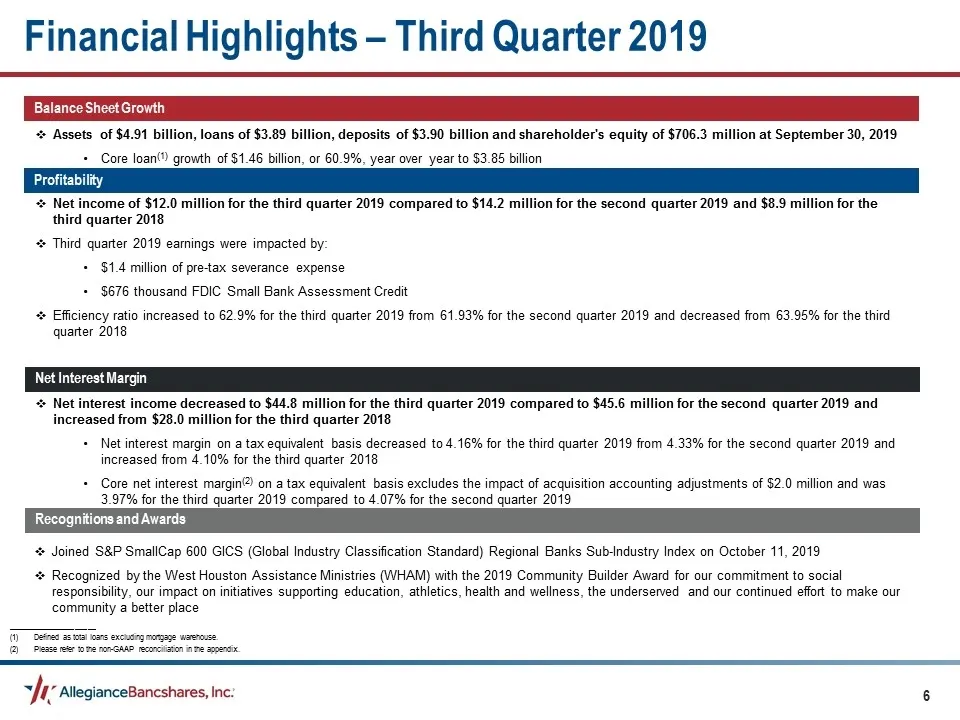
Slide 6: Financial Highlights – Third Quarter 2019
Financial Highlights – Third Quarter 2019 Assets of $4.91 billion, loans of $3.89 billion, deposits of $3.90 billion and shareholder's equity of $706.3 million at September 30, 2019 Core loan(1) growth of $1.46 billion, or 60.9%, year over year to $3.85 billion Balance Sheet Growth Net income of $12
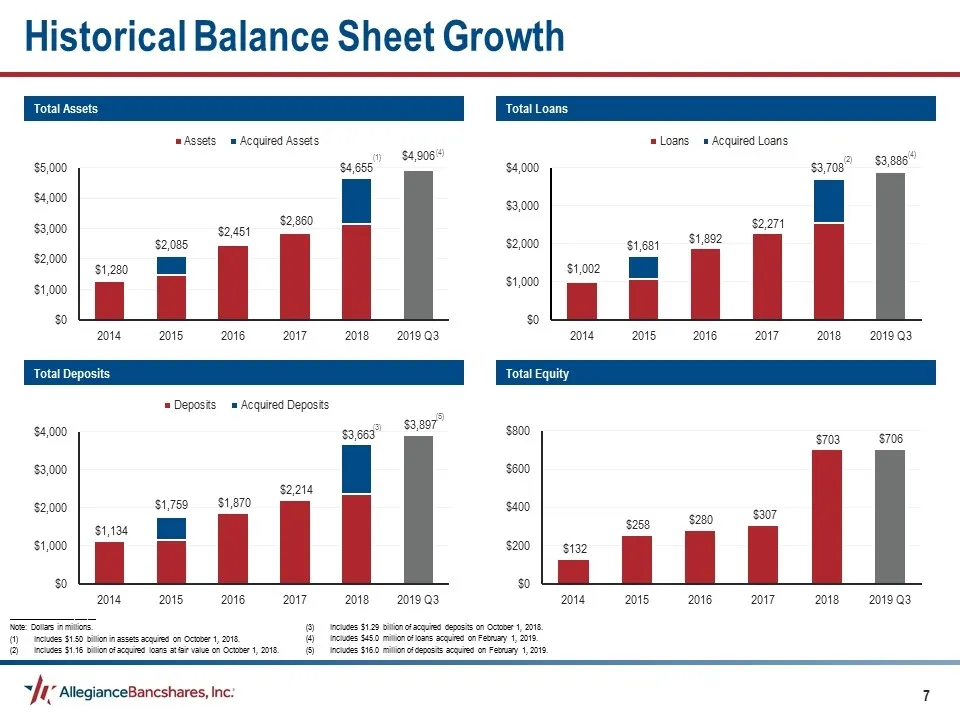
Slide 7: Historical Balance Sheet Growth
Historical Balance Sheet Growth Total Loans Total Assets Total Equity Total Deposits (1) _____________________ Note: Dollars in millions. Includes $1.50 billion in assets acquired on October 1, 2018. Includes $1.16 billion of acquired loans at fair value on October 1, 2018. (4) (2) (4) (3) (5) Inclu
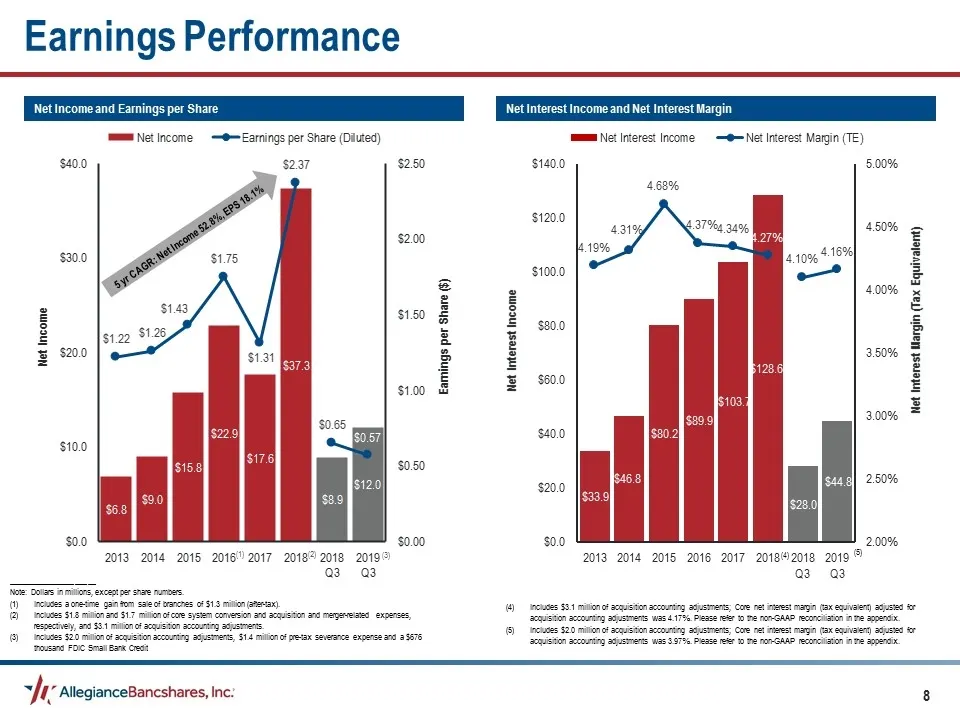
Slide 8: Earnings Performance
Earnings Performance Net Interest Income and Net Interest Margin Net Income and Earnings per Share _____________________ Note: Dollars in millions, except per share numbers. Includes a one-time gain from sale of branches of $1.3 million (after-tax). Includes $1.8 million and $1.7 million of core sys
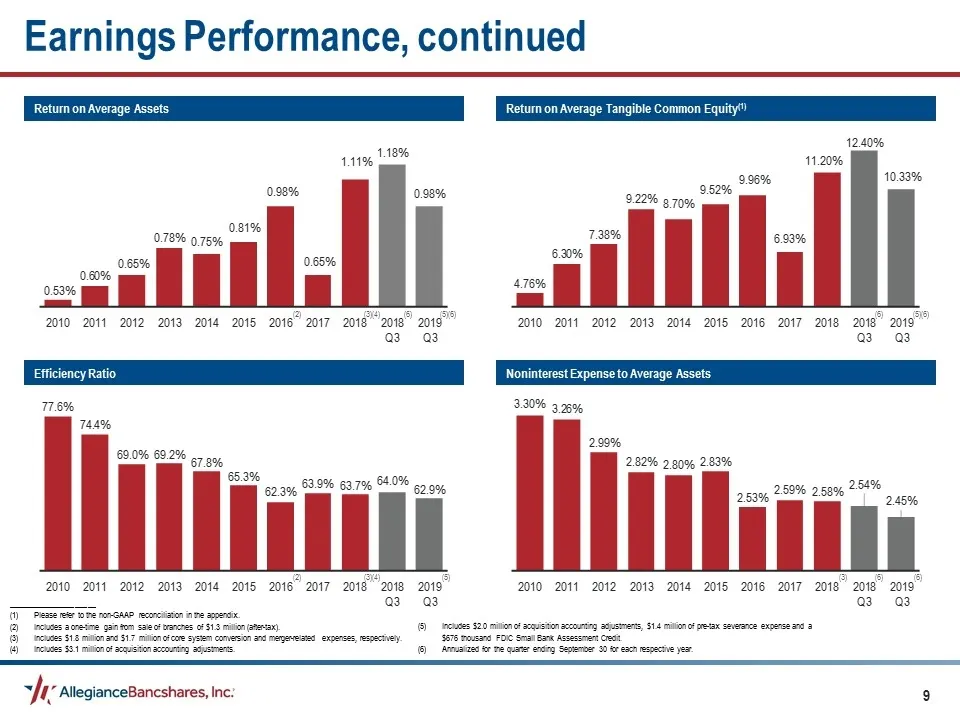
Slide 9: Earnings Performance, continued
Return on Average Tangible Common Equity(1) Return on Average Assets Noninterest Expense to Average Assets Efficiency Ratio _____________________ Please refer to the non-GAAP reconciliation in the appendix. Includes a one-time gain from sale of branches of $1.3 million (after-tax). Includes $1.8 mil
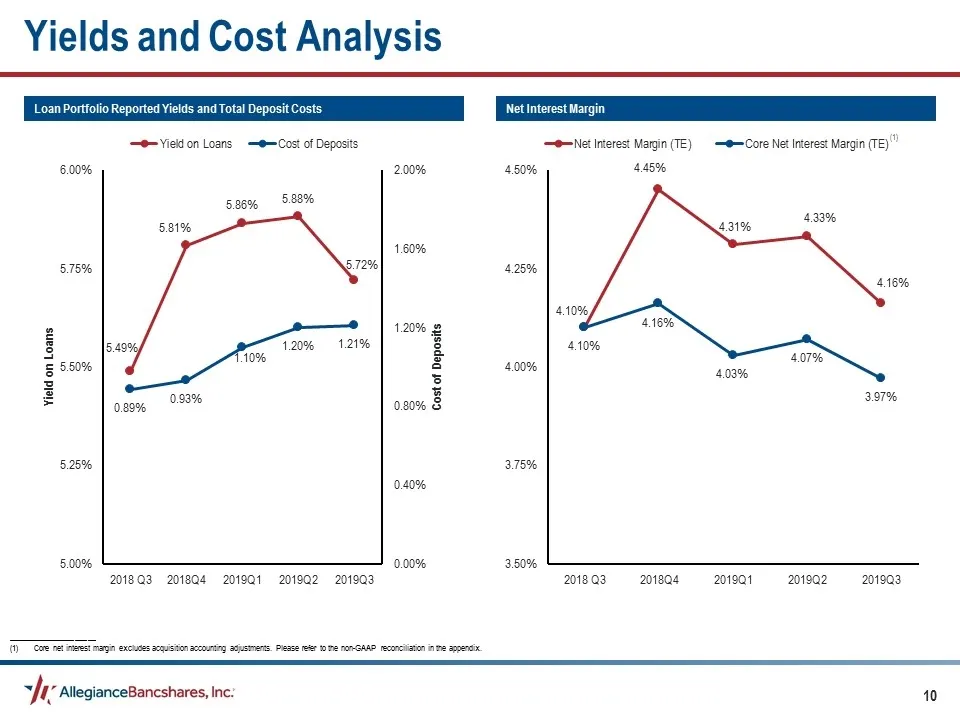
Slide 10: Yields and Cost Analysis
Yields and Cost Analysis Net Interest Margin Loan Portfolio Reported Yields and Total Deposit Costs _____________________ Core net interest margin excludes acquisition accounting adjustments. Please refer to the non-GAAP reconciliation in the appendix. (1)
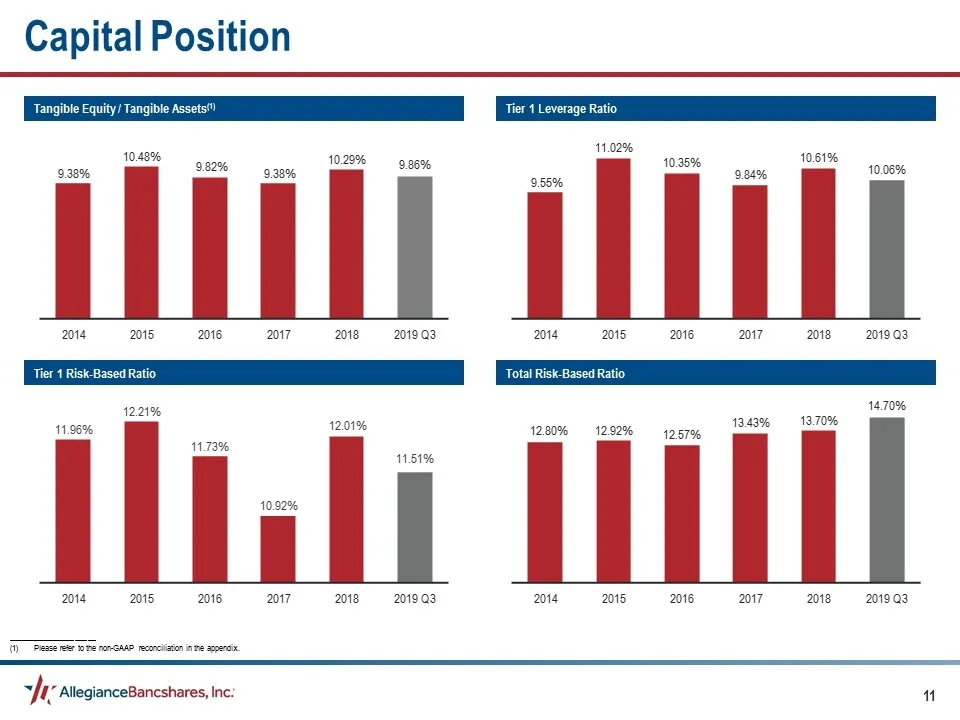
Slide 11: Capital Position
Tier 1 Leverage Ratio Tangible Equity / Tangible Assets(1) Total Risk-Based Ratio Tier 1 Risk-Based Ratio Capital Position _____________________ Please refer to the non-GAAP reconciliation in the appendix.
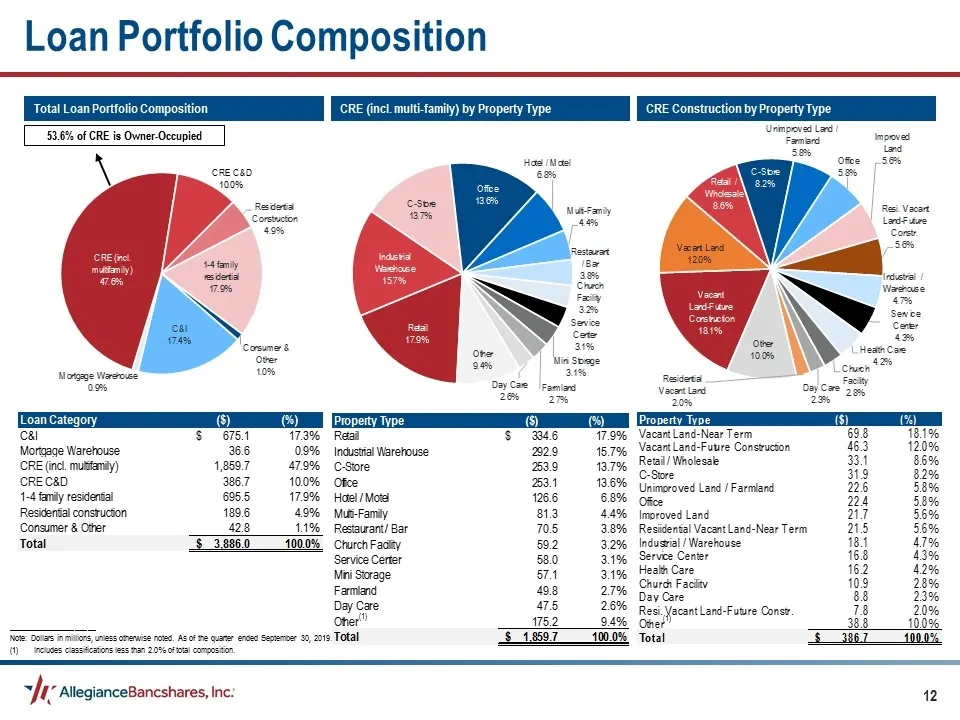
Slide 12: Total Loan Portfolio Composition
Total Loan Portfolio Composition 53.6% of CRE is Owner-Occupied CRE (incl. multi-family) by Property Type CRE Construction by Property Type _____________________ Note: Dollars in millions, unless otherwise noted. As of the quarter ended September 30, 2019. Includes classifications less than 2.0% of
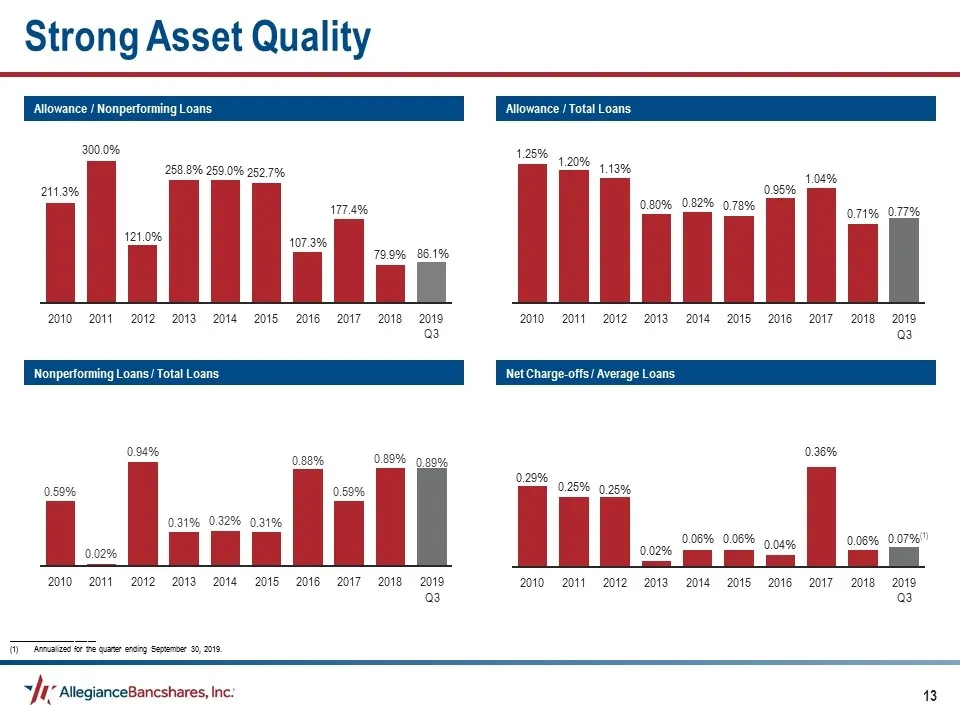
Slide 13: Strong Asset Quality
Allowance / Total Loans Allowance / Nonperforming Loans Net Charge-offs / Average Loans Nonperforming Loans / Total Loans (1) _____________________ Annualized for the quarter ending September 30, 2019. Strong Asset Quality
Slide 14: Deposit Composition and Growth
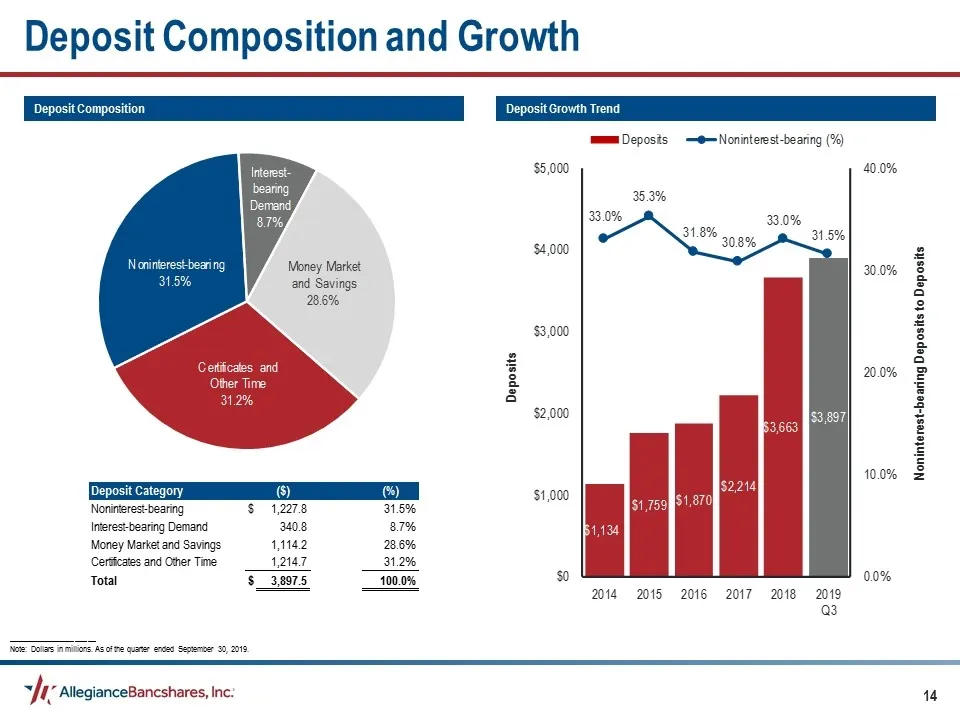
Deposit Composition and Growth Deposit Growth Trend Deposit Composition _____________________ Note: Dollars in millions. As of the quarter ended September 30, 2019.
Slide 15: Non-GAAP Reconciliation
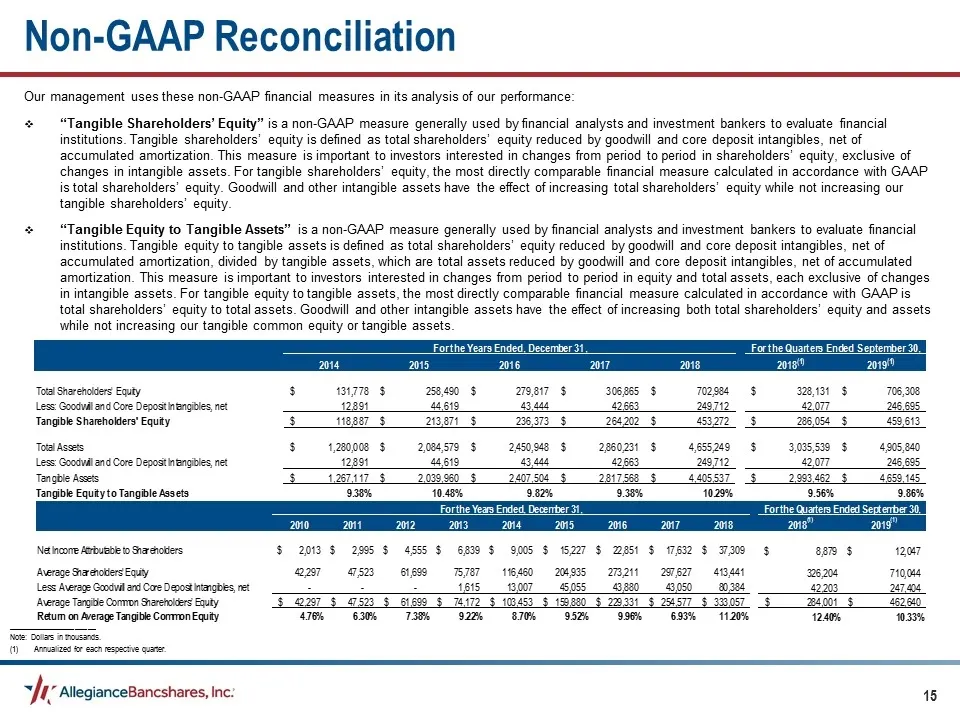
Our management uses these non-GAAP financial measures in its analysis of our performance: “Tangible Shareholders’ Equity” is a non-GAAP measure generally used by financial analysts and investment bankers to evaluate financial institutions. Tangible shareholders’ equity is defined as total shareholde
Slide 16: Non-GAAP Reconciliation, continued
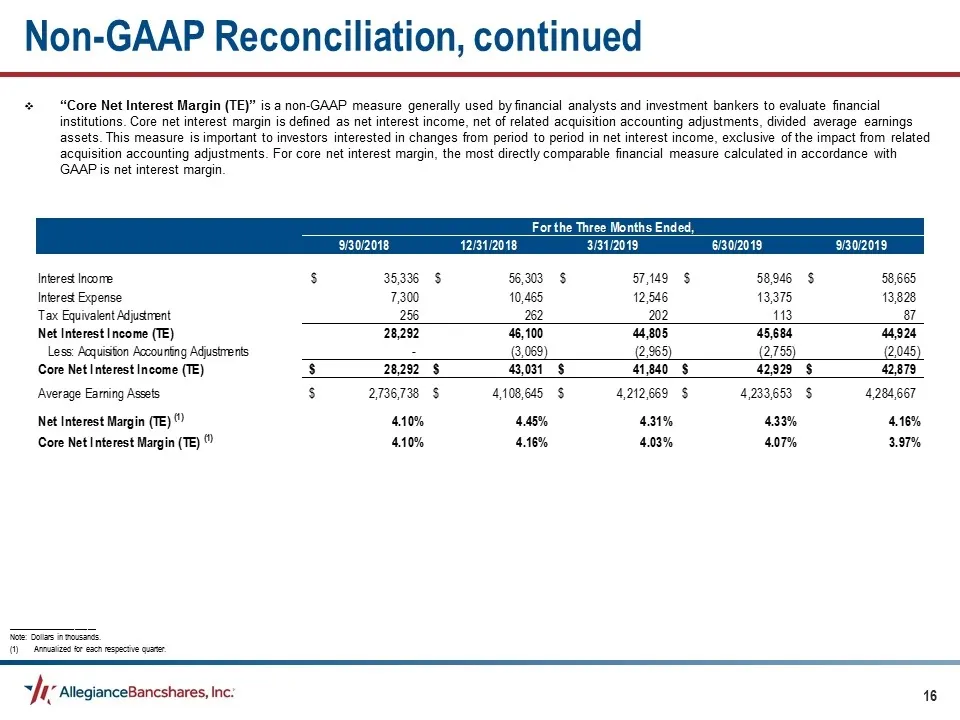
Non-GAAP Reconciliation, continued “Core Net Interest Margin (TE)” is a non-GAAP measure generally used by financial analysts and investment bankers to evaluate financial institutions. Core net interest margin is defined as net interest income, net of related acquisition accounting adjustments, divi
Source: SEC EDGAR · 8-K filed Oct 25, 2019
More decks from Allegiance Bancshares Inc
 Q2 2022 Earnings Presentation16 slides · Jul 29, 2022
 Q1 2022 Earnings Presentation19 slides · Apr 28, 2022
 FY2021 Earnings Presentation18 slides · Jan 28, 2022
 Q4 2021 Earnings Presentation19 slides · Jan 28, 2022
 Merger or Acquisition (November 2021)28 slides · Nov 8, 2021
 Q3 2021 Earnings Presentation17 slides · Oct 28, 2021