Capital Bancorp, Inc. · NASDAQ:CBNK
Capital Bancorp — Investor Presentation (July 2024)
30 slides from Capital Bancorp's investor presentation, Jul 29, 2024
Slide 1: 2Q 2024 Investor Overview
© CAPITAL BANCORP, INC. 2Q 2024 Investor Overview
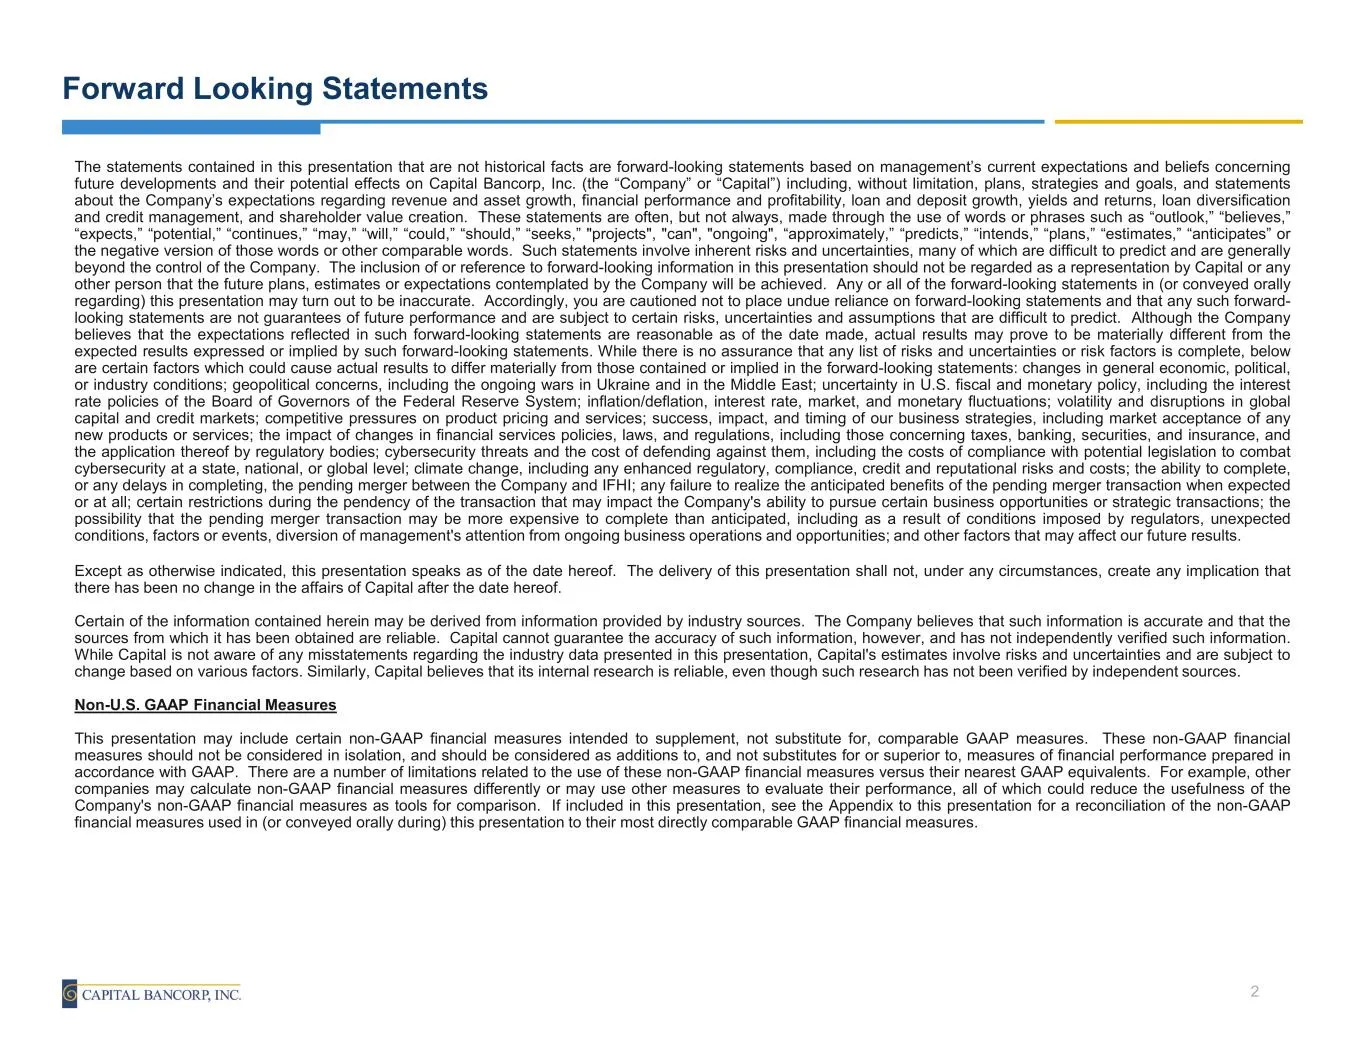
Slide 2: Forward Looking Statements
Forward Looking Statements The statements contained in this presentation that are not historical facts are forward-looking statements based on management’s current expectations and beliefs concerning future developments and their potential effects on Capital Bancorp, Inc. (the “Company” or “Capital”
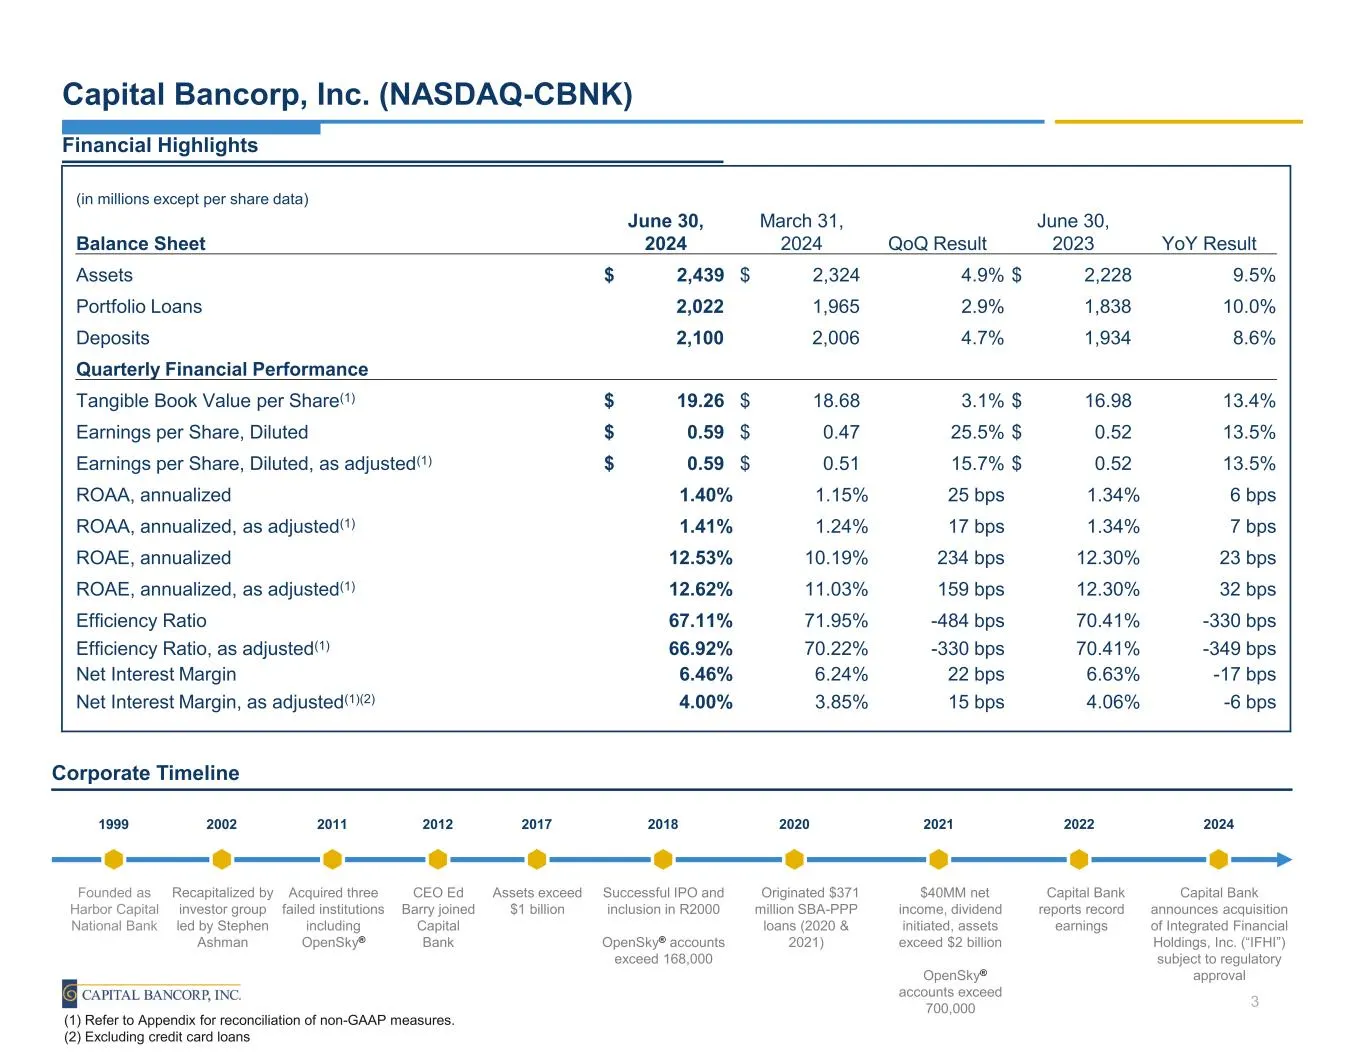
Slide 3: Financial Highlights and Corporate Timeline
Capital Bancorp, Inc. (NASDAQ-CBNK) Financial Highlights Corporate Timeline Founded as Harbor Capital National Bank Recapitalized by investor group led by Stephen Ashman Acquired three failed institutions including OpenSky® CEO Ed Barry joined Capital Bank Assets exceed $1 billion Successful IPO and
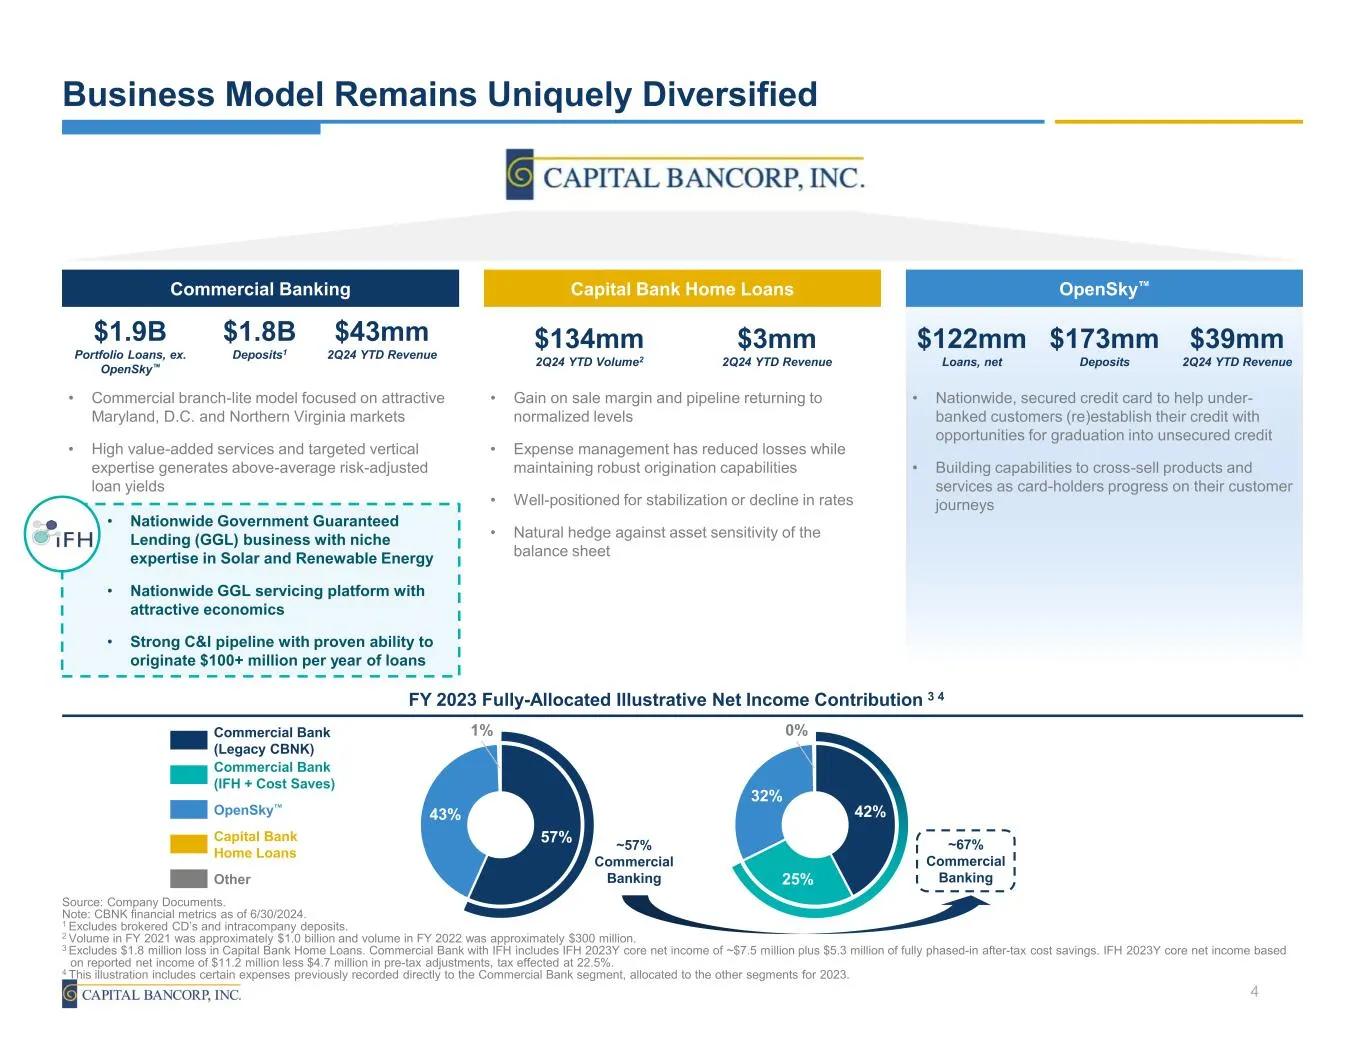
Slide 4: Business Model Remains Uniquely Diversified
Business Model Remains Uniquely Diversified Source: Company Documents. Note: CBNK financial metrics as of 6/30/2024. 1 Excludes brokered CD’s and intracompany deposits. 2 Volume in FY 2021 was approximately $1.0 billion and volume in FY 2022 was approximately $300 million. 3 Excludes $1.8 million lo
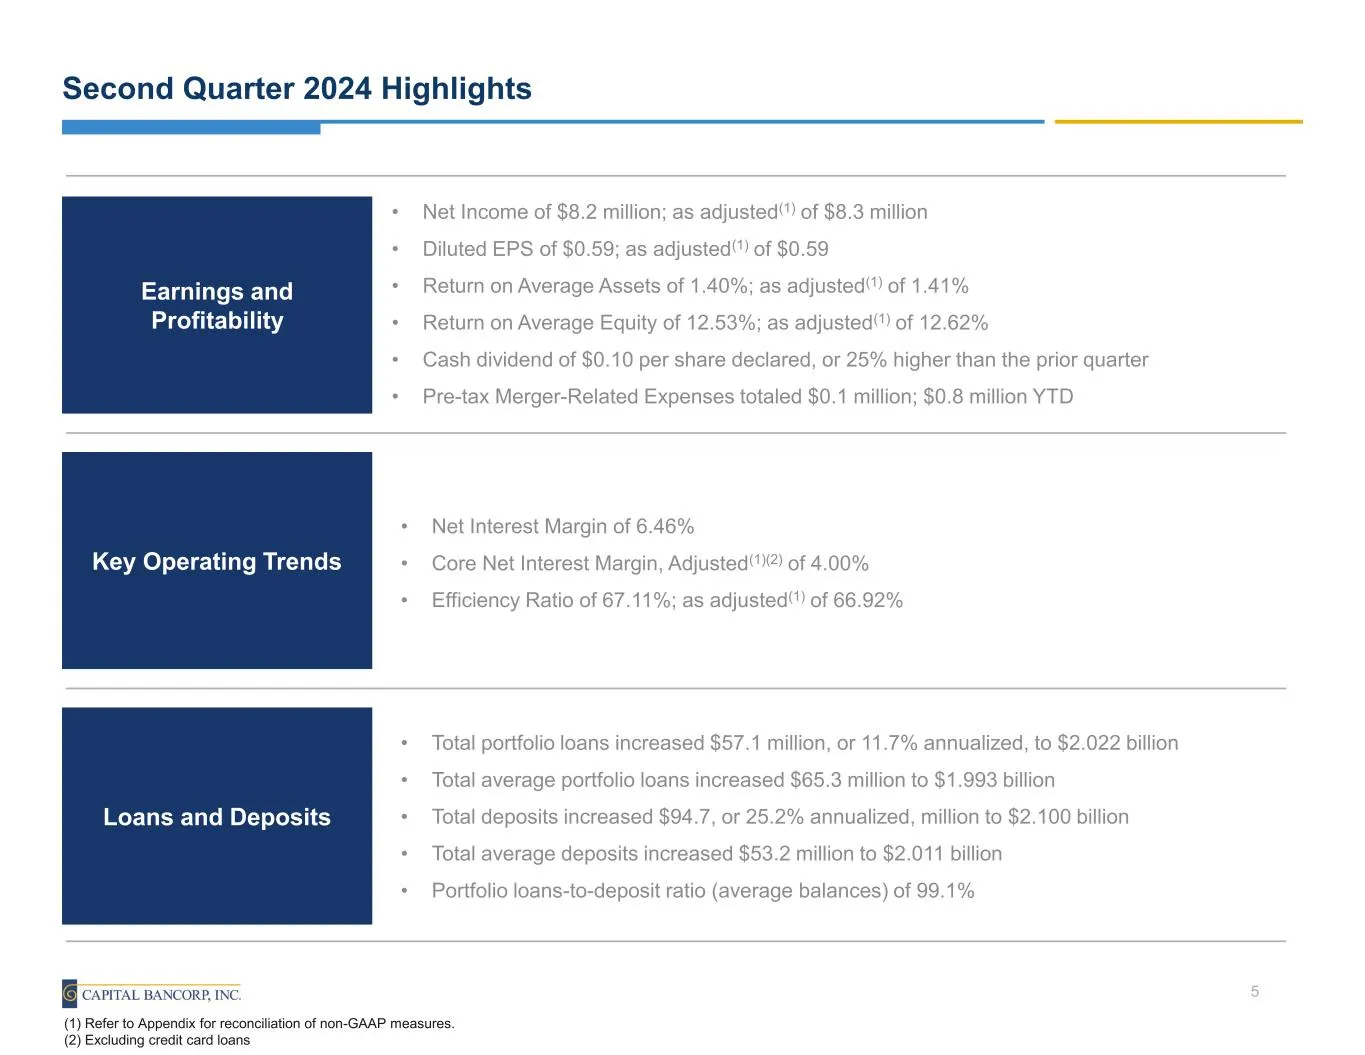
Slide 5: Second Quarter 2024 Highlights
Second Quarter 2024 Highlights 5 (1) Refer to Appendix for reconciliation of non-GAAP measures. (2) Excluding credit card loans Earnings and Profitability • Net Income of $8.2 million; as adjusted(1) of $8.3 million • Diluted EPS of $0.59; as adjusted(1) of $0.59 • Return on Average Assets of 1.40%;

Slide 6: Pending Strategic Acquisition of IFHI
Pending Strategic Acquisition of IFHI
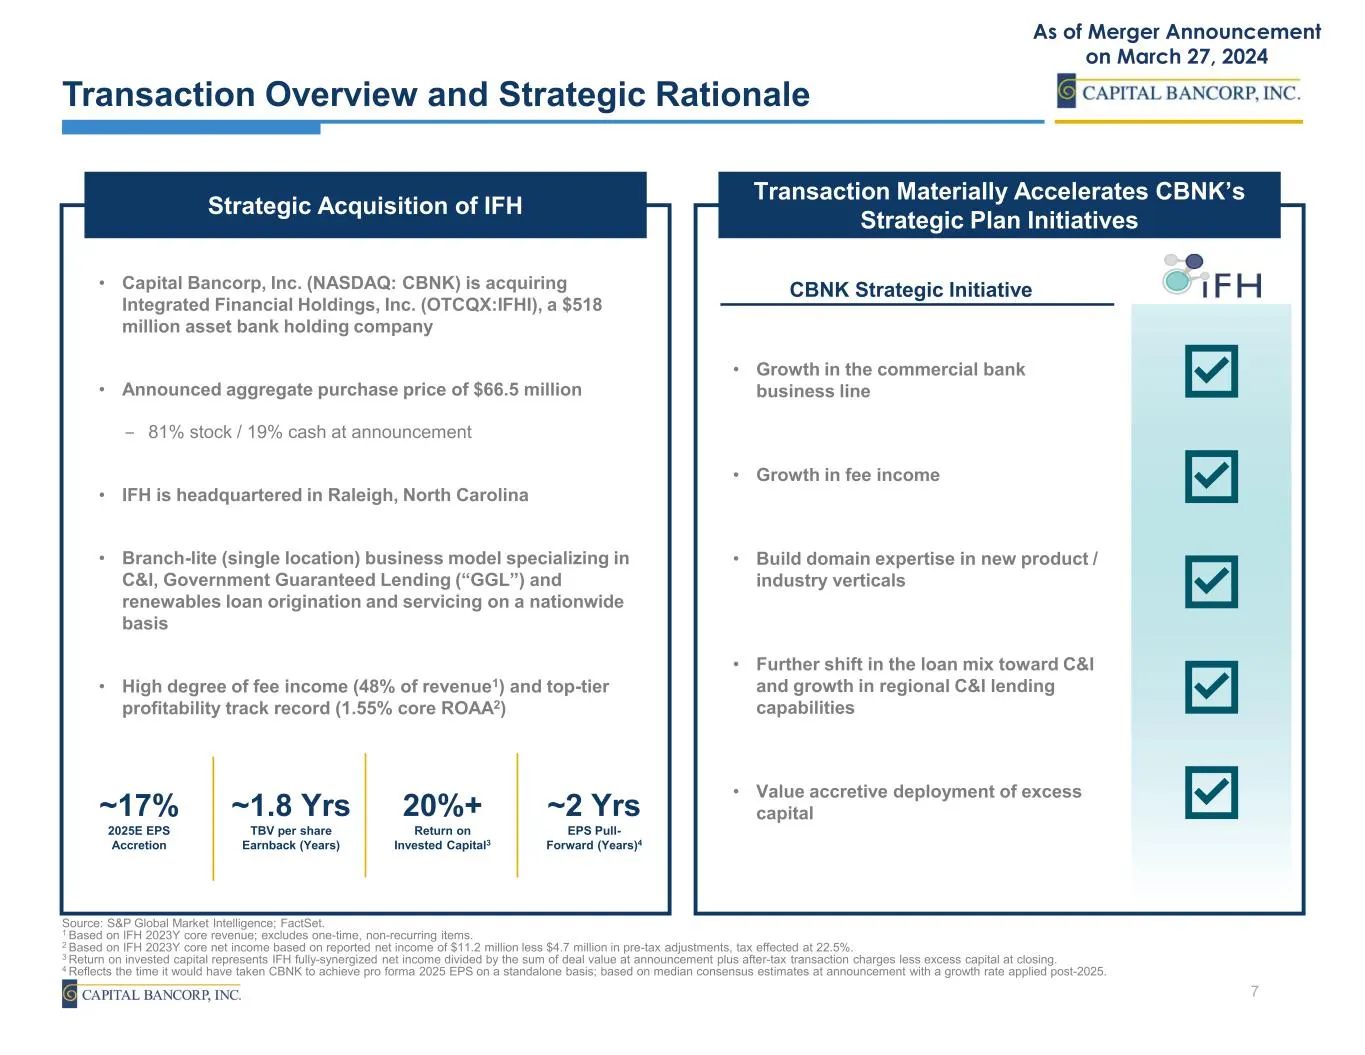
Slide 7: Transaction Overview and Strategic Rationale
Source: S&P Global Market Intelligence; FactSet. 1 Based on IFH 2023Y core revenue; excludes one-time, non-recurring items. 2 Based on IFH 2023Y core net income based on reported net income of $11.2 million less $4.7 million in pre-tax adjustments, tax effected at 22.5%. 3 Return on invested capital
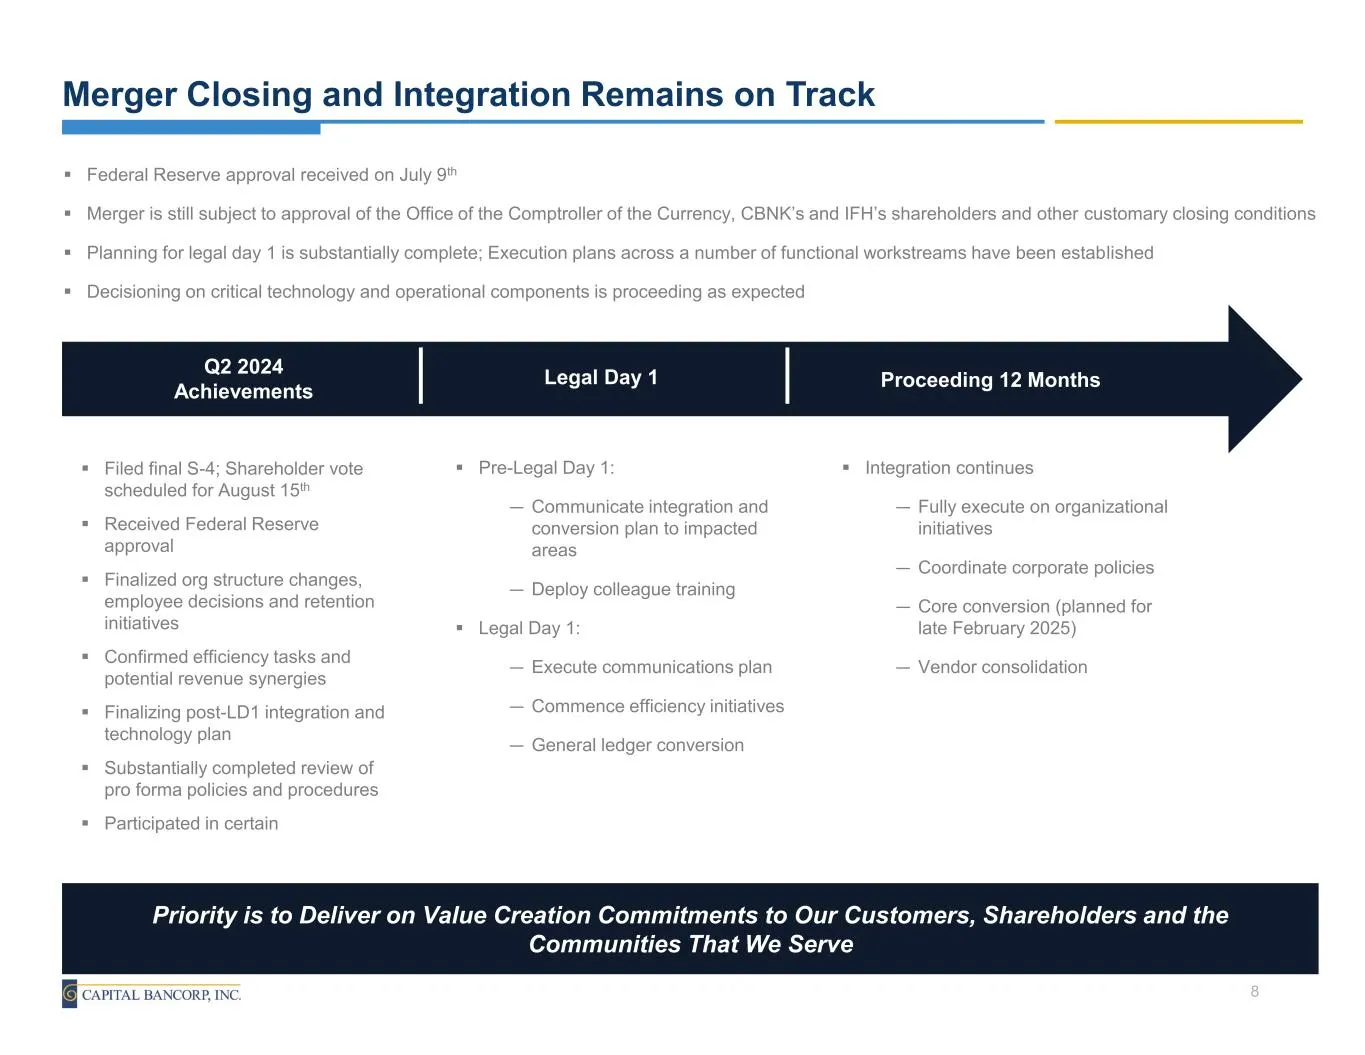
Slide 8: Merger Closing and Integration Remains on Track
Merger Closing and Integration Remains on Track Federal Reserve approval received on July 9th Merger is still subject to approval of the Office of the Comptroller of the Currency, CBNK’s and IFH’s shareholders and other customary closing conditions Planning for legal day 1 is substantially complete;

Slide 9: Financial Information
© CAPITAL BANCORP, INC. Financial Information
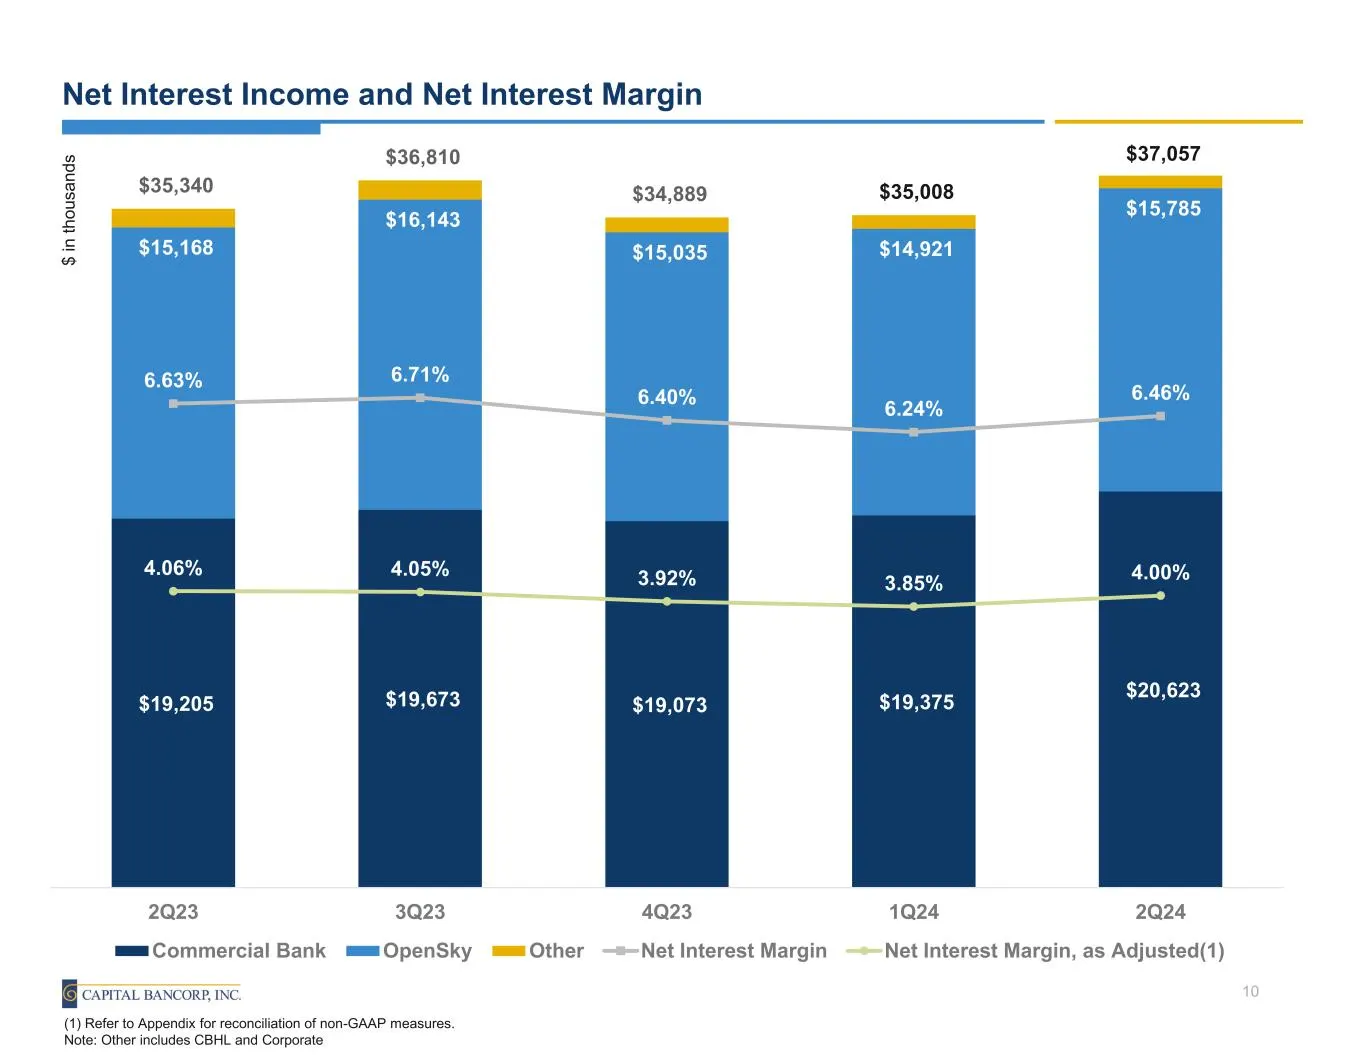
Slide 10: Net Interest Income and Net Interest Margin
Net Interest Income and Net Interest Margin $19,205 $19,673 $19,073 $19,375 $20,623 $15,168 $16,143 $15,035 $14,921 $15,785 $35,340 $36,810 $34,889 $35,008 $37,057 6.63% 6.71% 6.40% 6.24% 6.46% 4.06% 4.05% 3.92% 3.85% 4.00% 2Q23 3Q23 4Q23 1Q24 2Q24 Commercial Bank OpenSky Other Net Interest Margin N
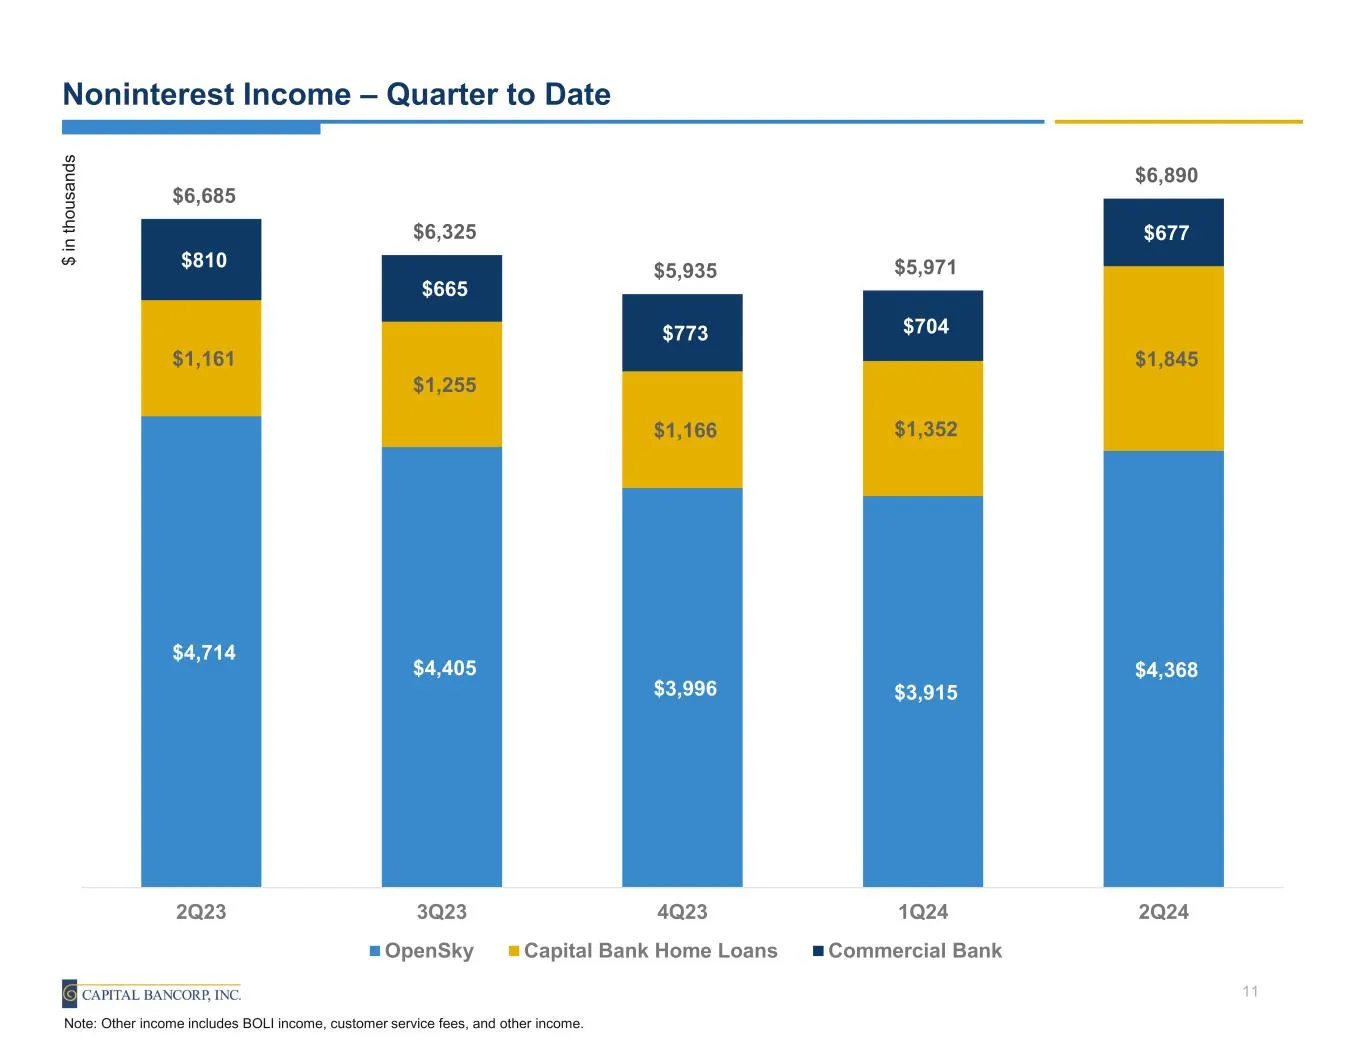
Slide 11: Noninterest Income – Quarter to Date
Noninterest Income – Quarter to Date $4,714 $4,405 $3,996 $3,915 $4,368 $1,161 $1,255 $1,166 $1,352 $1,845 $810 $665 $773 $704 $677 $6,685 $6,325 $5,935 $5,971 $6,890 2Q23 3Q23 4Q23 1Q24 2Q24 OpenSky Capital Bank Home Loans Commercial Bank $ in th ou sa nd s 11 Note: Other income includes BOLI incom
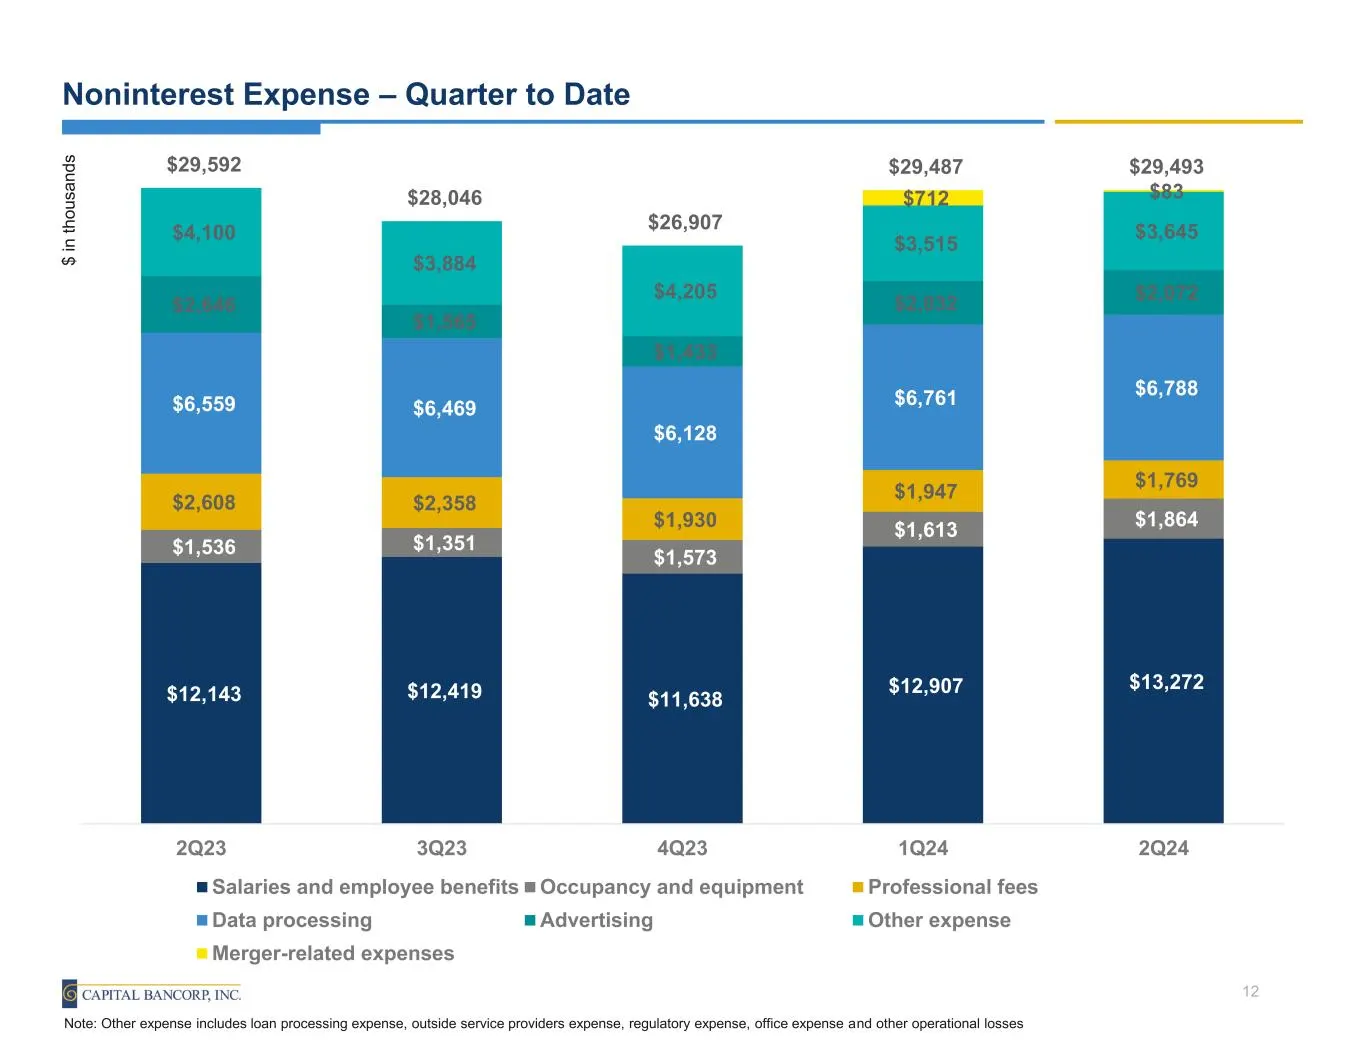
Slide 12: Noninterest Expense – Quarter to Date
Noninterest Expense – Quarter to Date $12,143 $12,419 $11,638 $12,907 $13,272 $1,536 $1,351 $1,573 $1,613 $1,864 $2,608 $2,358 $1,930 $1,947 $1,769 $6,559 $6,469 $6,128 $6,761 $6,788 $2,646 $1,565 $1,433 $2,032 $2,072 $4,100 $3,884 $4,205 $3,515 $3,645 $712 $83 $29,592 $28,046 $26,907 $29,487 $29,49
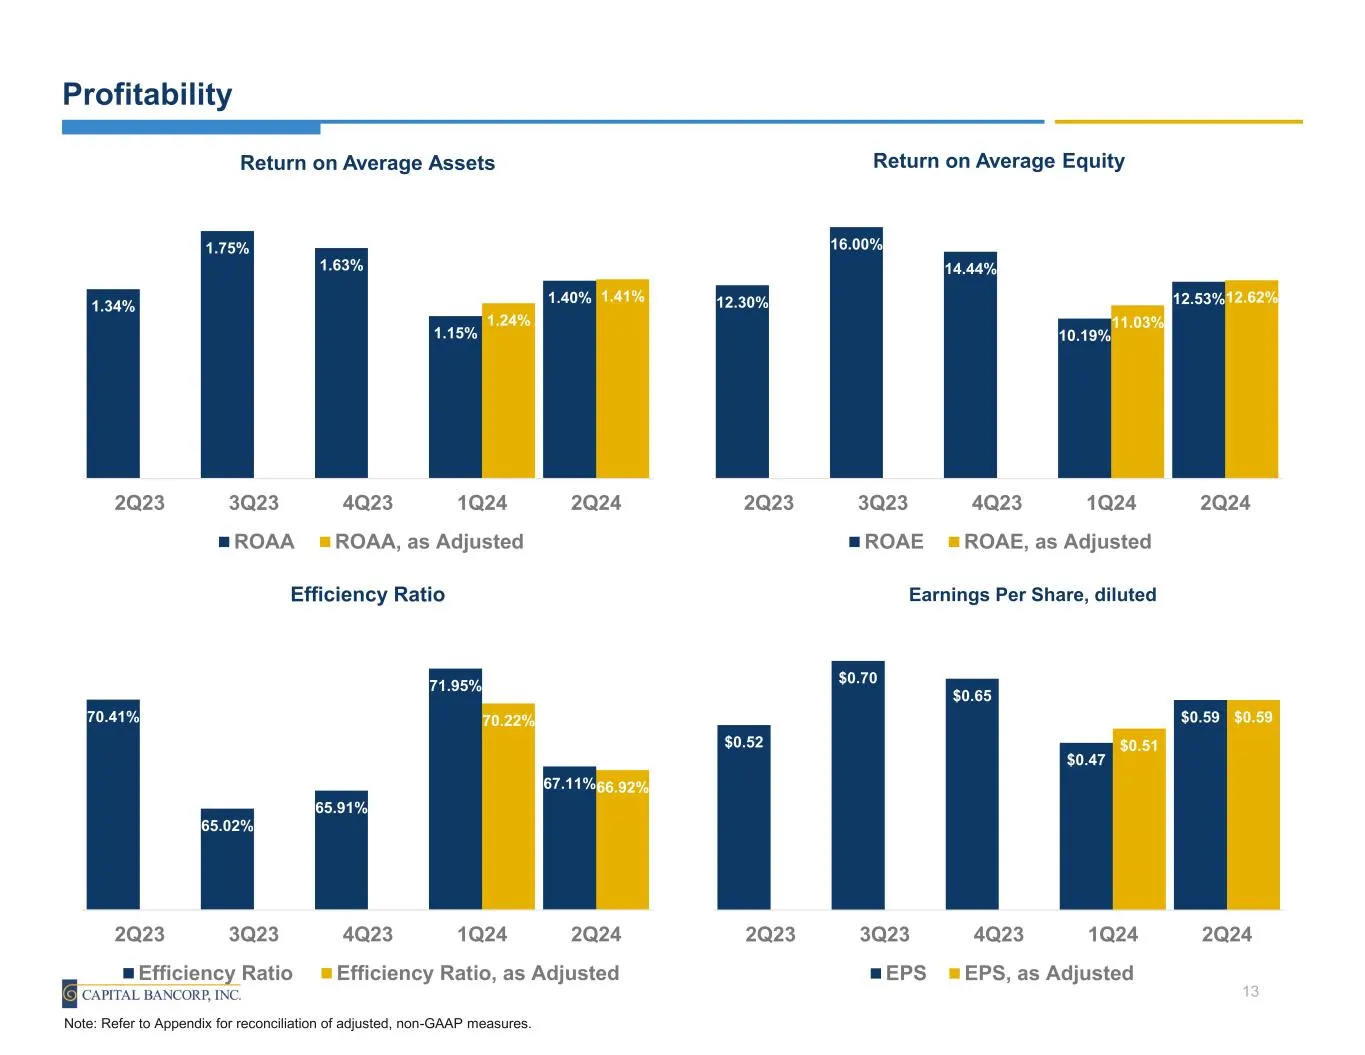
Slide 13: Profitability
Profitability 1.34% 1.75% 1.63% 1.15% 1.40% 1.24% 1.41% 2Q23 3Q23 4Q23 1Q24 2Q24 Return on Average Assets ROAA ROAA, as Adjusted 13 12.30% 16.00% 14.44% 10.19% 12.53% 11.03% 12.62% 2Q23 3Q23 4Q23 1Q24 2Q24 Return on Average Equity ROAE ROAE, as Adjusted 70.41% 65.02% 65.91% 71.95% 67.11% 70.22% 66.9
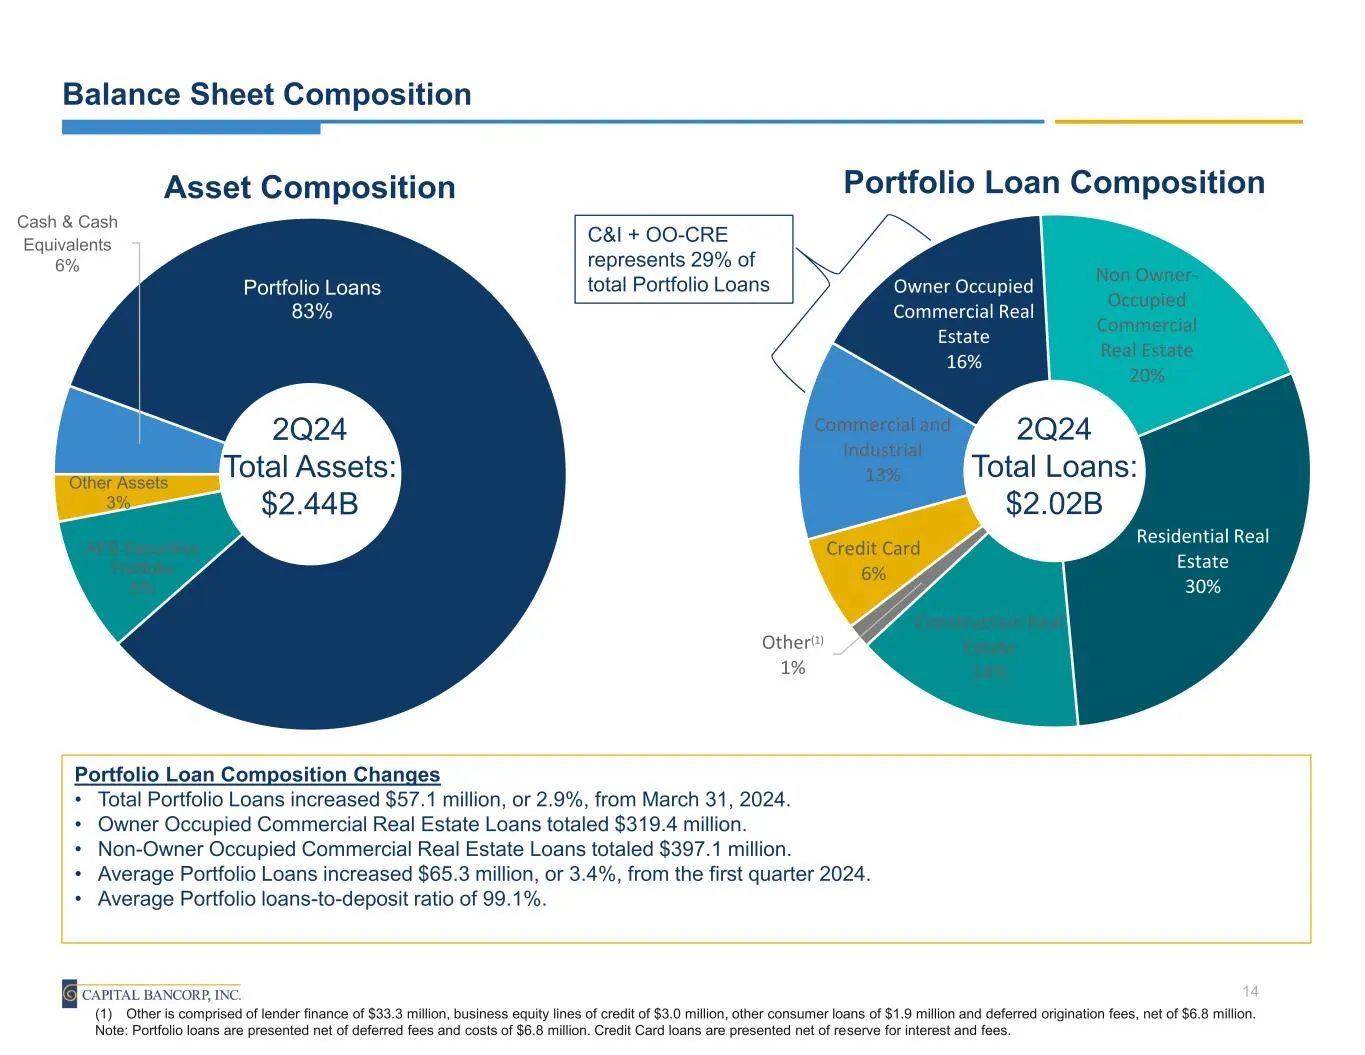
Slide 14: Balance Sheet Composition
Balance Sheet Composition Cash & Cash Equivalents 6% Portfolio Loans 83% AFS Securities Portfolio 8% Other Assets 3% Asset Composition Owner Occupied Commercial Real Estate 16% Non Owner- Occupied Commercial Real Estate 20% Residential Real Estate 30% Construction Real Estate 14% Other(1) 1% Credit
Slide 15: Non-Owner-Occupied Commercial Real Estate
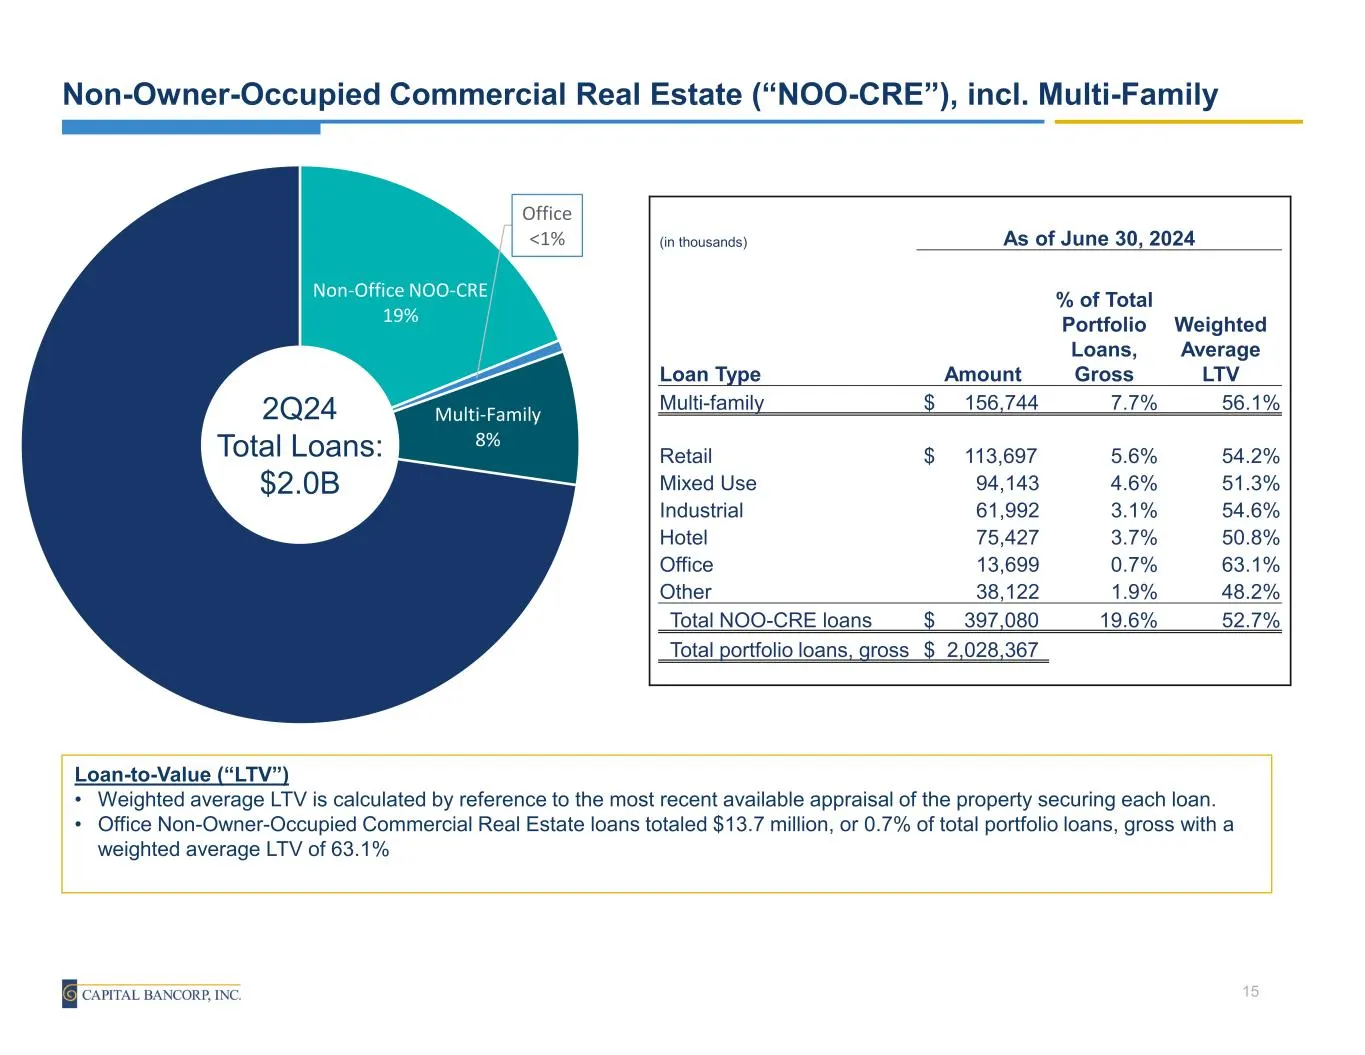
(in thousands) As of June 30, 2024 Loan Type Amount % of Total Portfolio Loans, Gross Weighted Average LTV Multi-family $ 156,744 7.7% 56.1% Retail $ 113,697 5.6% 54.2% Mixed Use 94,143 4.6% 51.3% Industrial 61,992 3.1% 54.6% Hotel 75,427 3.7% 50.8% Office 13,699 0.7% 63.1% Other 38,122 1.9% 48.2% T
Slide 16: Owner-Occupied Commercial Real Estate
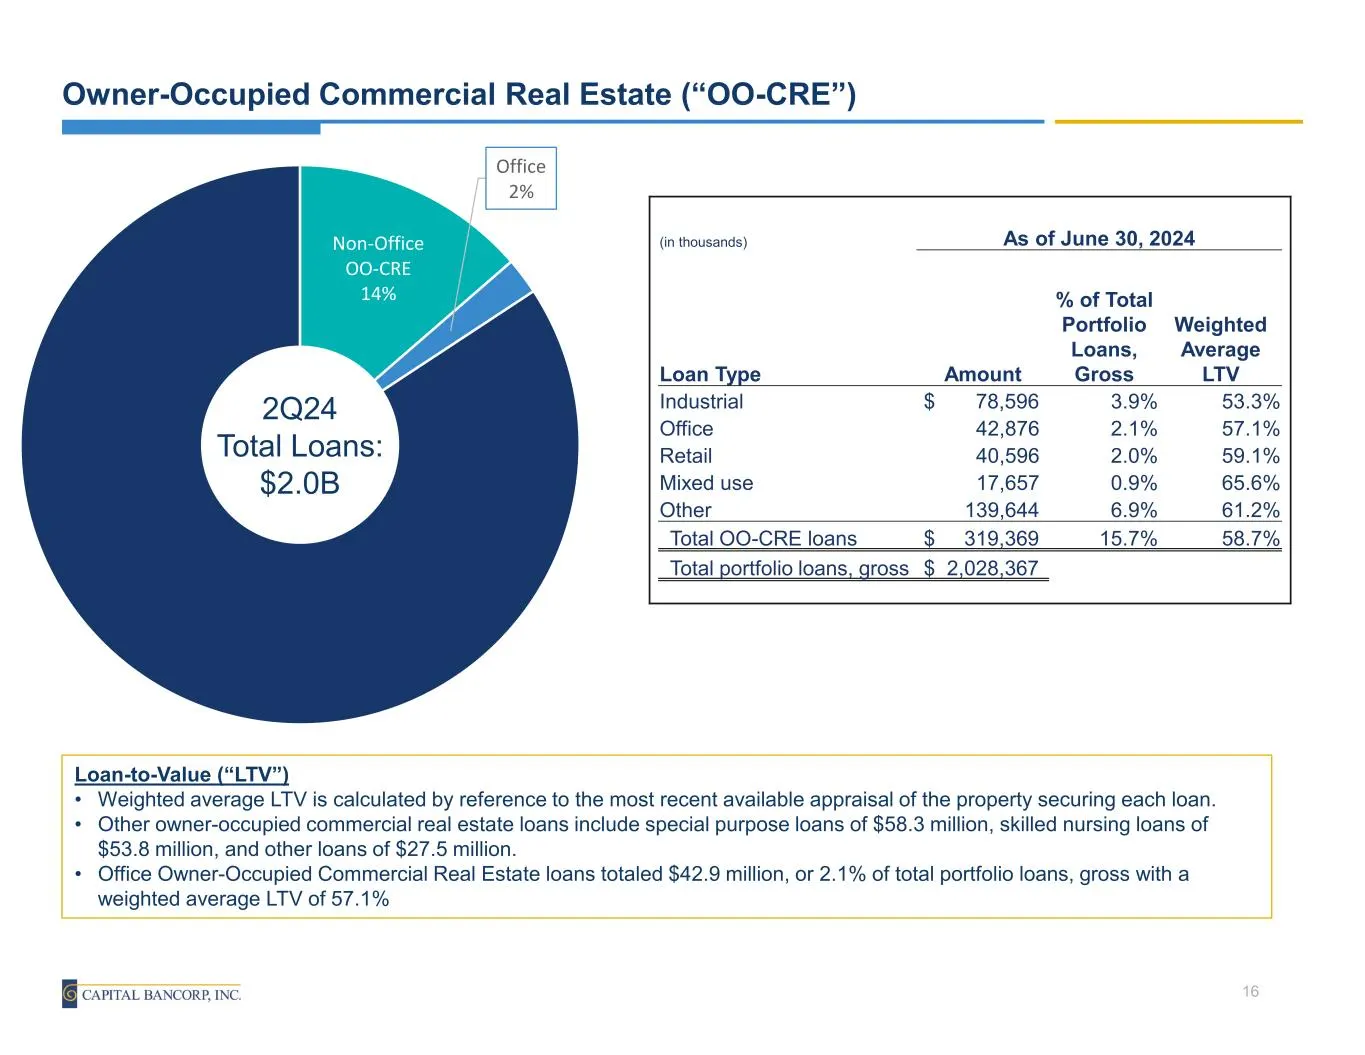
Owner-Occupied Commercial Real Estate (“OO-CRE”) Non-Office OO-CRE 14% Office 2% 2Q24 Total Loans: $2.0B Loan-to-Value (“LTV”) • Weighted average LTV is calculated by reference to the most recent available appraisal of the property securing each loan. • Other owner-occupied commercial real estate lo
Slide 17: High Quality, Low Risk Investment Portfolio
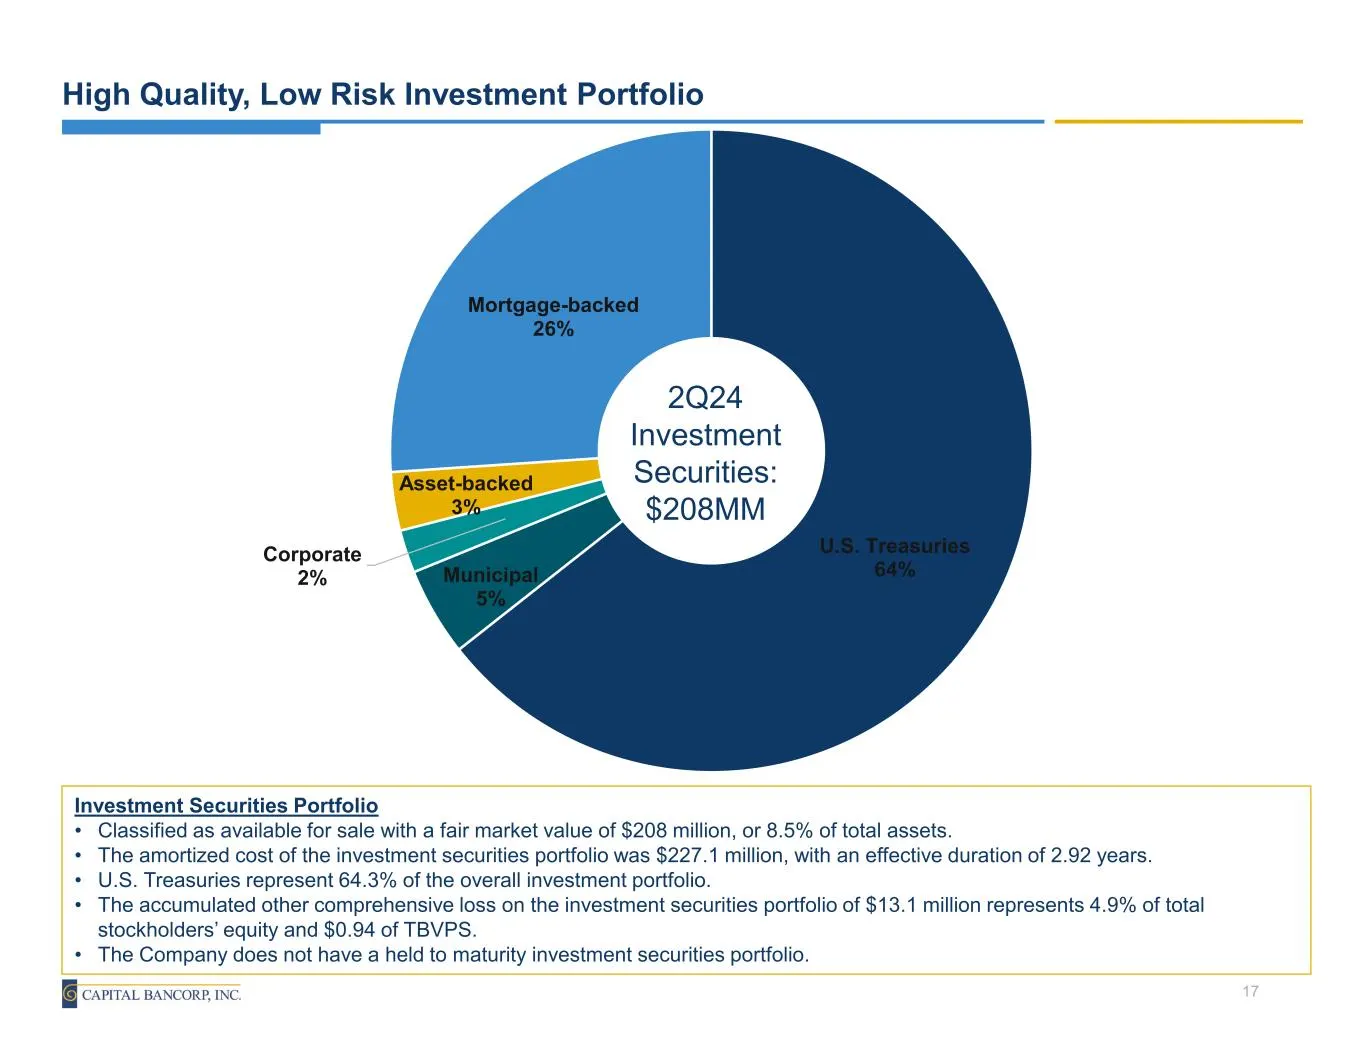
High Quality, Low Risk Investment Portfolio U.S. Treasuries 64%Municipal 5% Corporate 2% Asset-backed 3% Mortgage-backed 26% 2Q24 Investment Securities: $208MM Investment Securities Portfolio • Classified as available for sale with a fair market value of $208 million, or 8.5% of total assets. • The
Slide 18: Liquidity
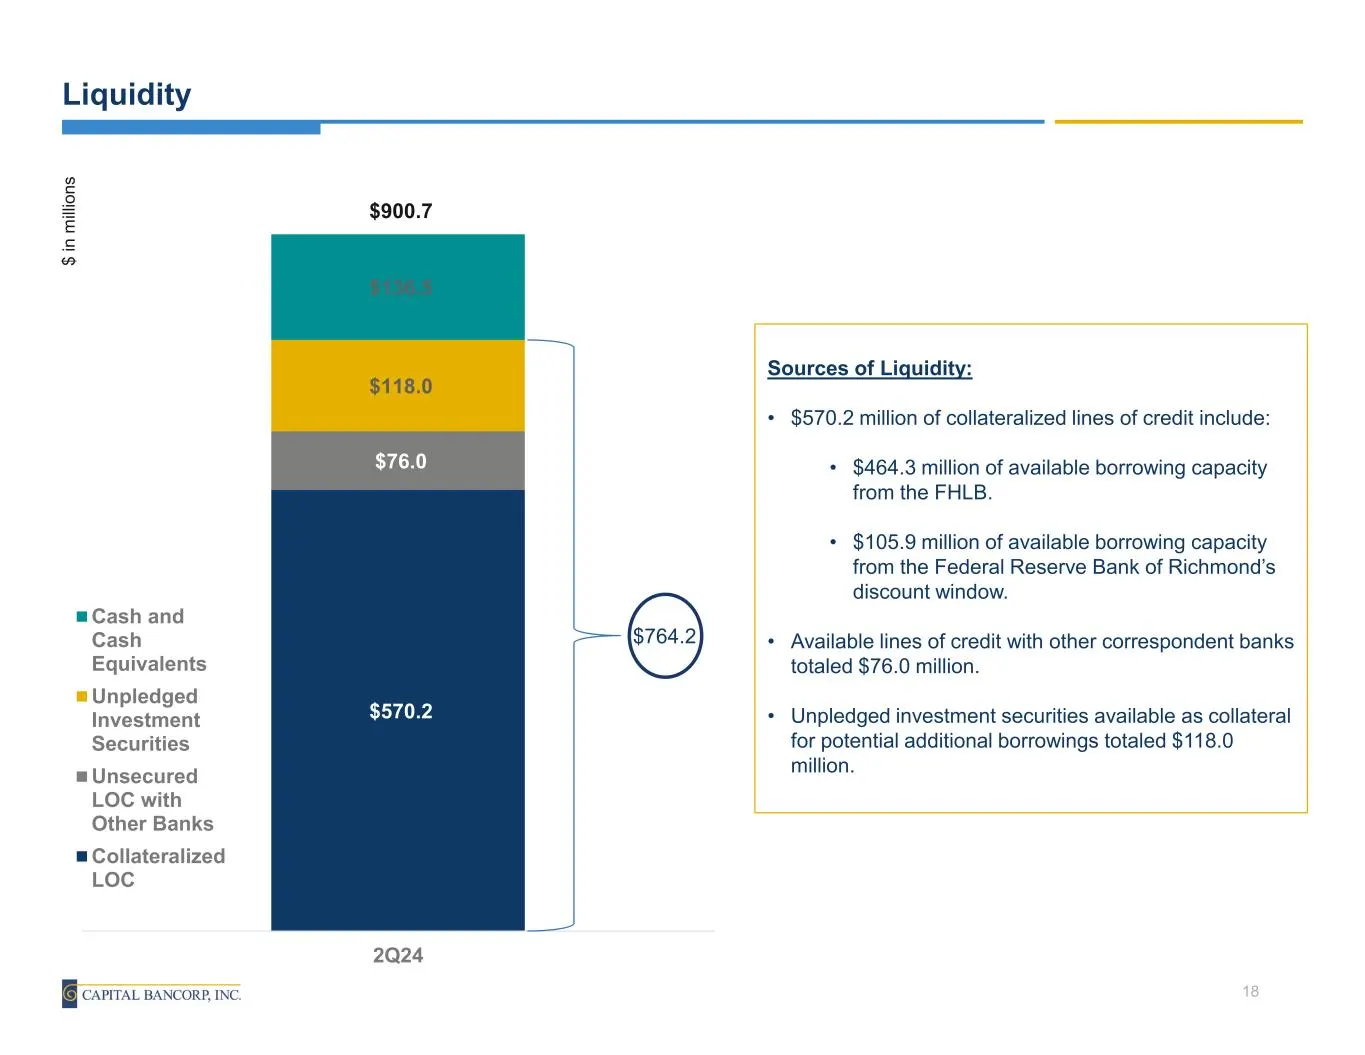
$570.2 $76.0 $118.0 $136.5 $900.7 2Q24 Cash and Cash Equivalents Unpledged Investment Securities Unsecured LOC with Other Banks Collateralized LOC Liquidity $ in m illi on s 18 Sources of Liquidity: • $570.2 million of collateralized lines of credit include: • $464.3 million of available borrowing c
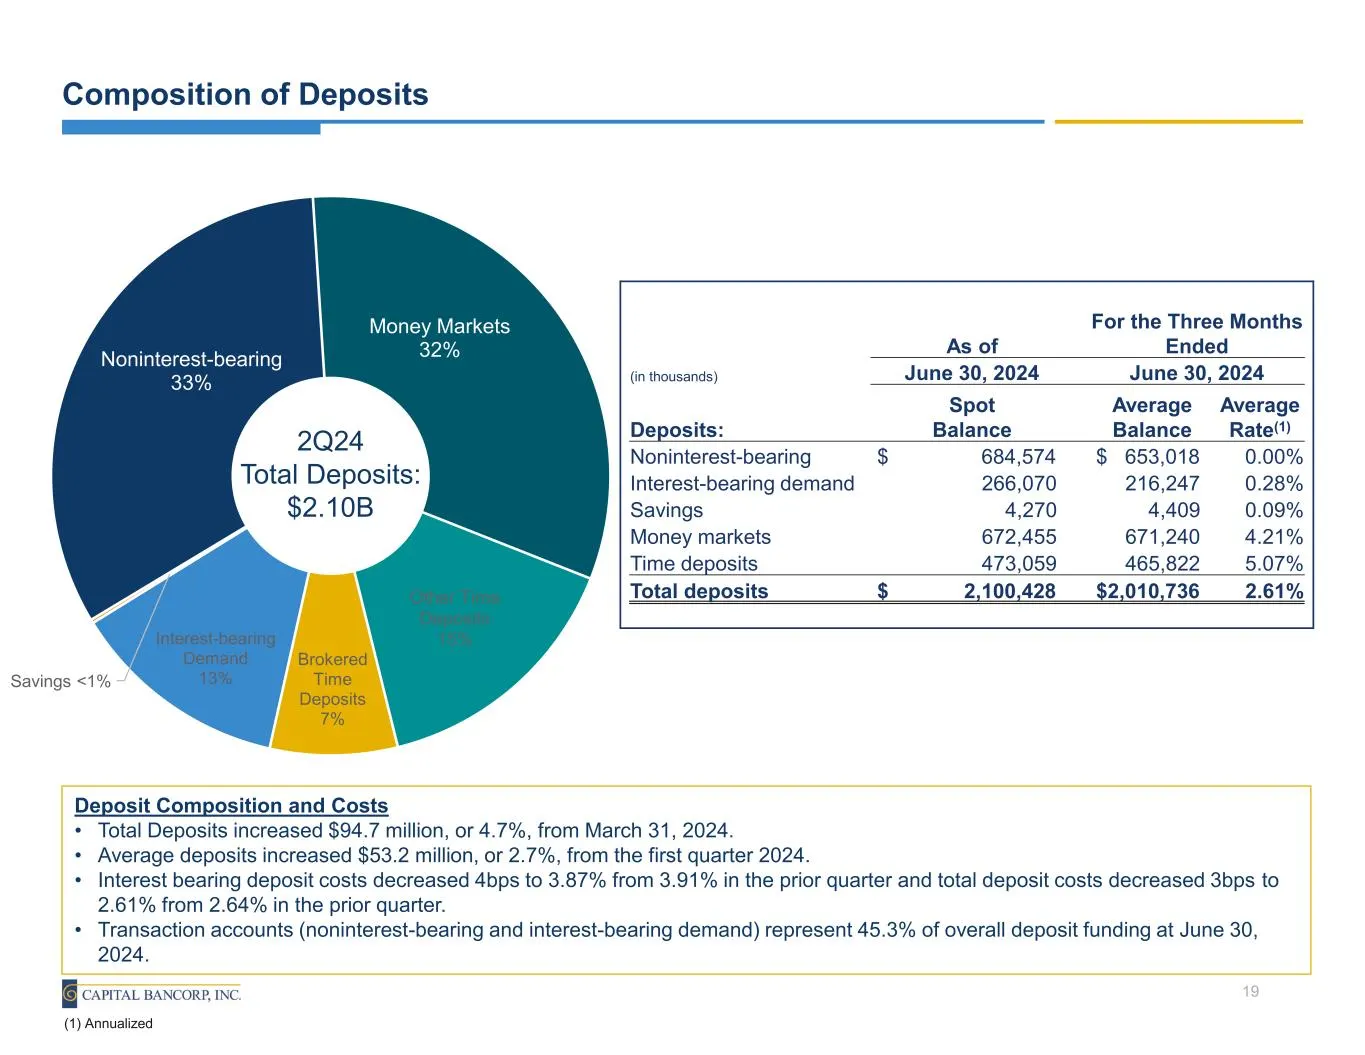
Slide 19: Composition of Deposits
Composition of Deposits Noninterest-bearing 33% Money Markets 32% Other Time Deposits 15% Brokered Time Deposits 7% Interest-bearing Demand 13%Savings <1% 2Q24 Total Deposits: $2.10B Deposit Composition and Costs • Total Deposits increased $94.7 million, or 4.7%, from March 31, 2024. • Average depos
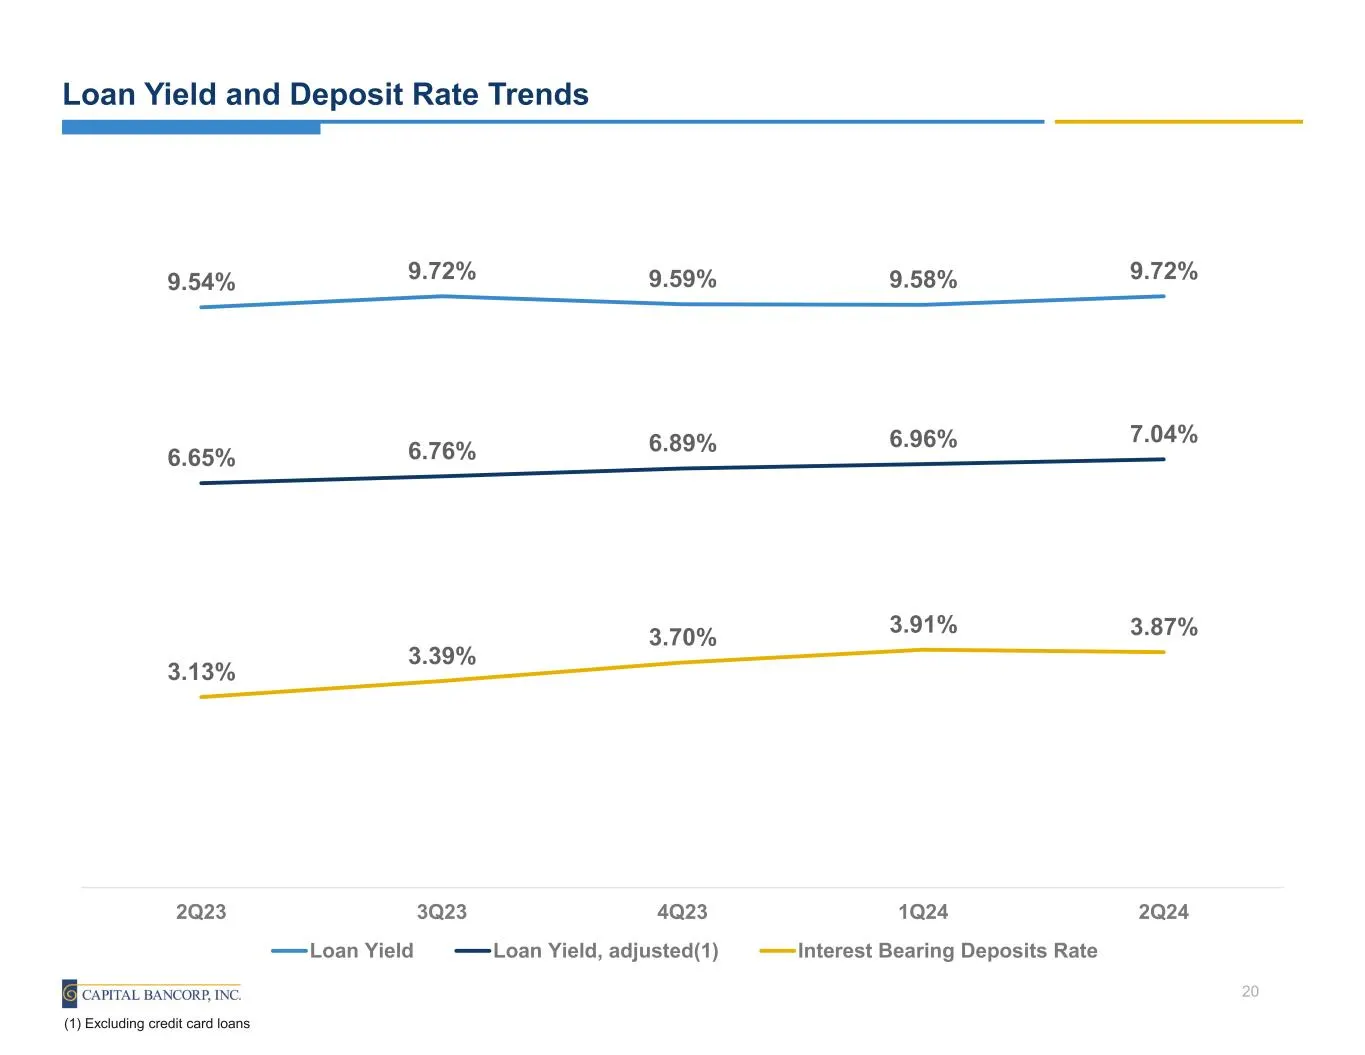
Slide 20: Loan Yield and Deposit Rate Trends
Loan Yield and Deposit Rate Trends 9.54% 9.72% 9.59% 9.58% 9.72% 6.65% 6.76% 6.89% 6.96% 7.04% 3.13% 3.39% 3.70% 3.91% 3.87% 2Q23 3Q23 4Q23 1Q24 2Q24 Loan Yield Loan Yield, adjusted(1) Interest Bearing Deposits Rate 20 (1) Excluding credit card loans
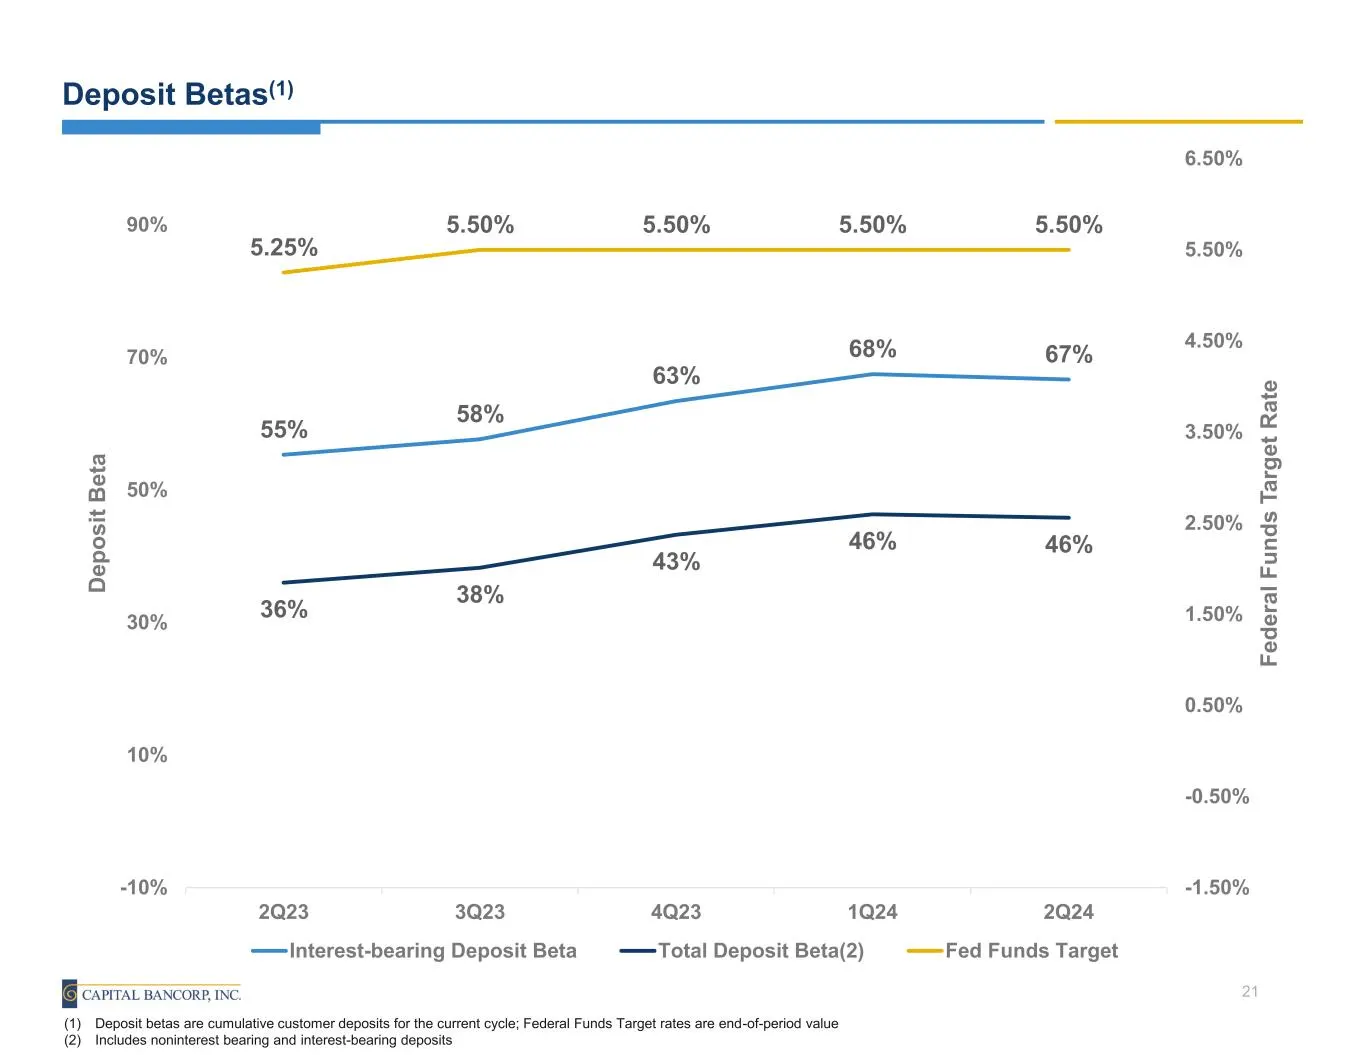
Slide 21: Deposit Betas
Deposit Betas(1) 55% 58% 63% 68% 67% 36% 38% 43% 46% 46% 5.25% 5.50% 5.50% 5.50% 5.50% -1.50% -0.50% 0.50% 1.50% 2.50% 3.50% 4.50% 5.50% 6.50% -10% 10% 30% 50% 70% 90% 2Q23 3Q23 4Q23 1Q24 2Q24 Fe de ra l F un ds T ar ge t R at e D ep os it B et a Interest-bearing Deposit Beta Total Deposit Beta(2) F
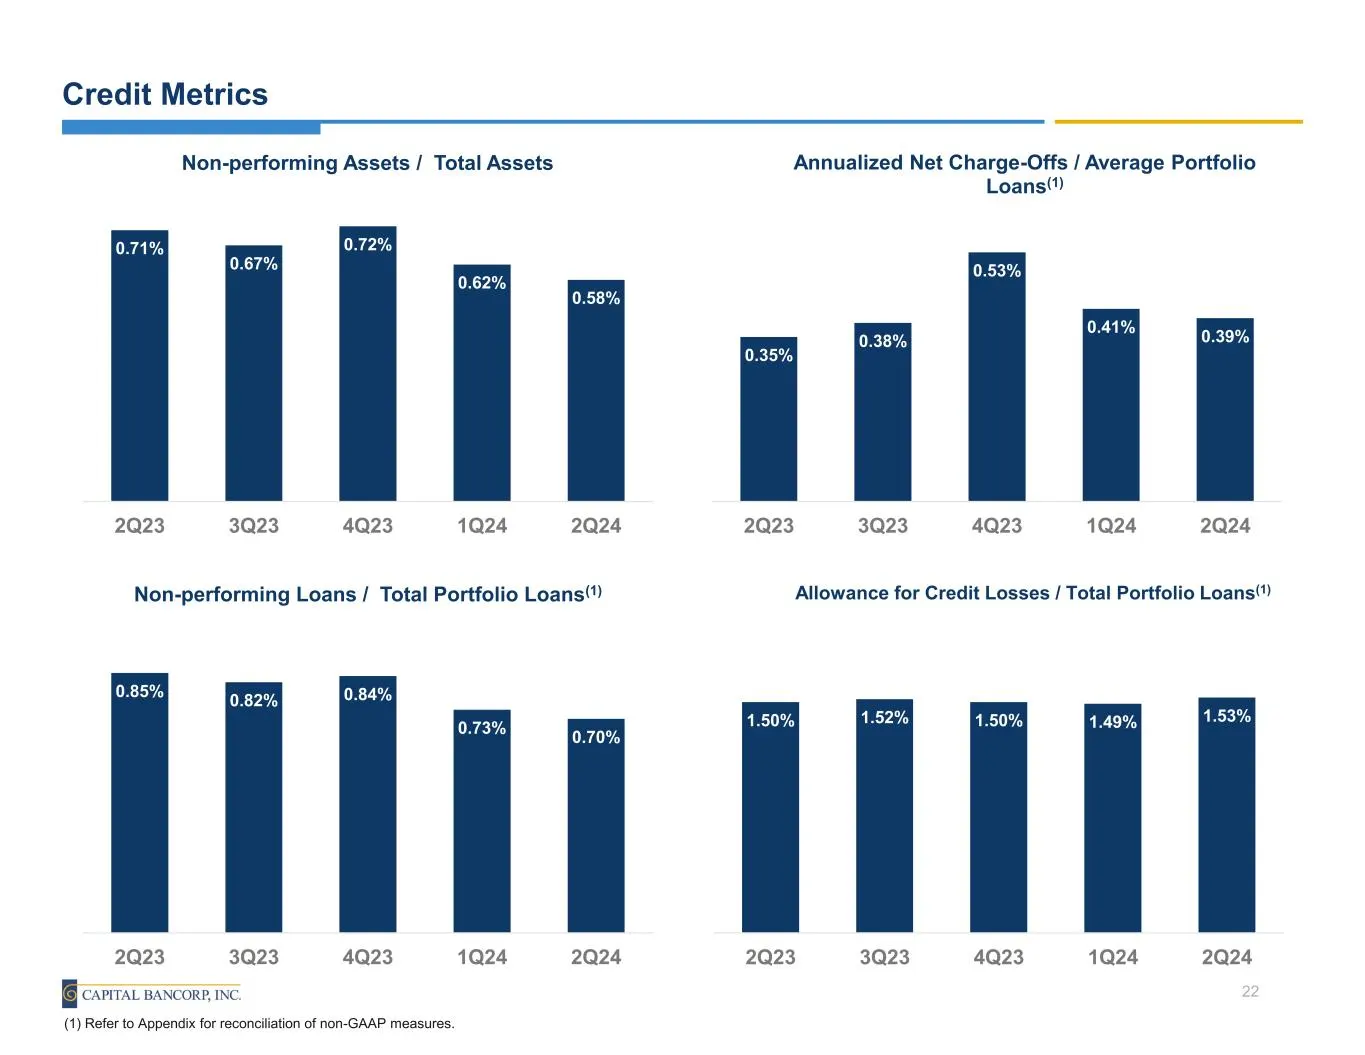
Slide 22: Credit Metrics
Credit Metrics 0.71% 0.67% 0.72% 0.62% 0.58% 2Q23 3Q23 4Q23 1Q24 2Q24 Non-performing Assets / Total Assets 22 0.35% 0.38% 0.53% 0.41% 0.39% 2Q23 3Q23 4Q23 1Q24 2Q24 Annualized Net Charge-Offs / Average Portfolio Loans(1) 0.85% 0.82% 0.84% 0.73% 0.70% 2Q23 3Q23 4Q23 1Q24 2Q24 Non-performing Loans / T
Slide 23: Robust Capital Ratios
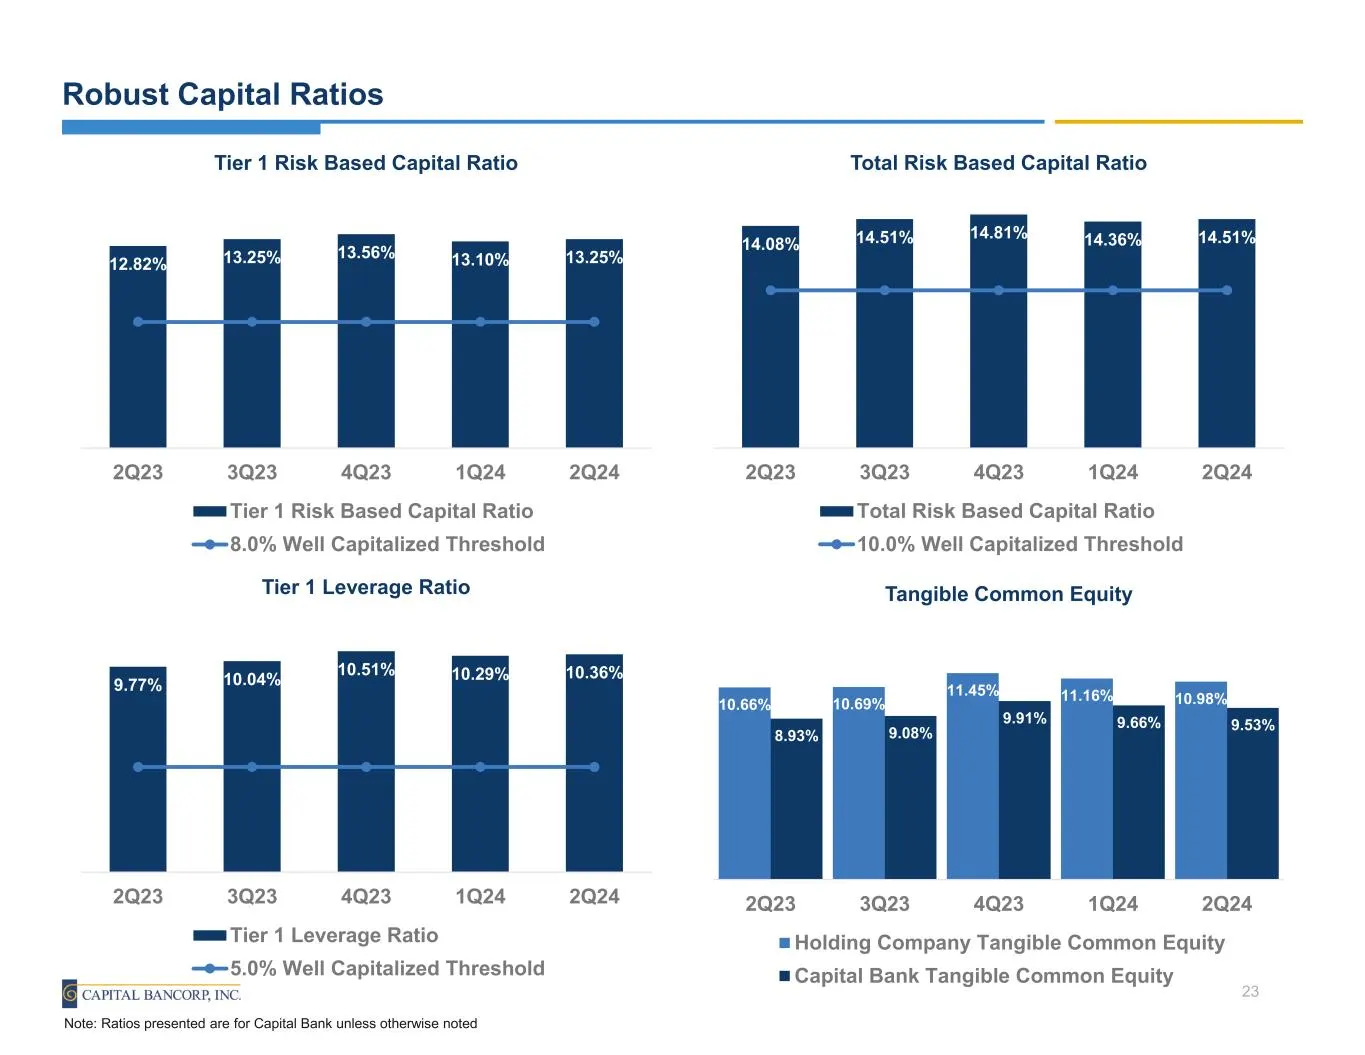
Robust Capital Ratios 12.82% 13.25% 13.56% 13.10% 13.25% 2Q23 3Q23 4Q23 1Q24 2Q24 Tier 1 Risk Based Capital Ratio Tier 1 Risk Based Capital Ratio 8.0% Well Capitalized Threshold 23 10.66% 10.69% 11.45% 11.16% 10.98% 8.93% 9.08% 9.91% 9.66% 9.53% 2Q23 3Q23 4Q23 1Q24 2Q24 Tangible Common Equity Holdin
Slide 24: Share Appreciation Outperforms Industry
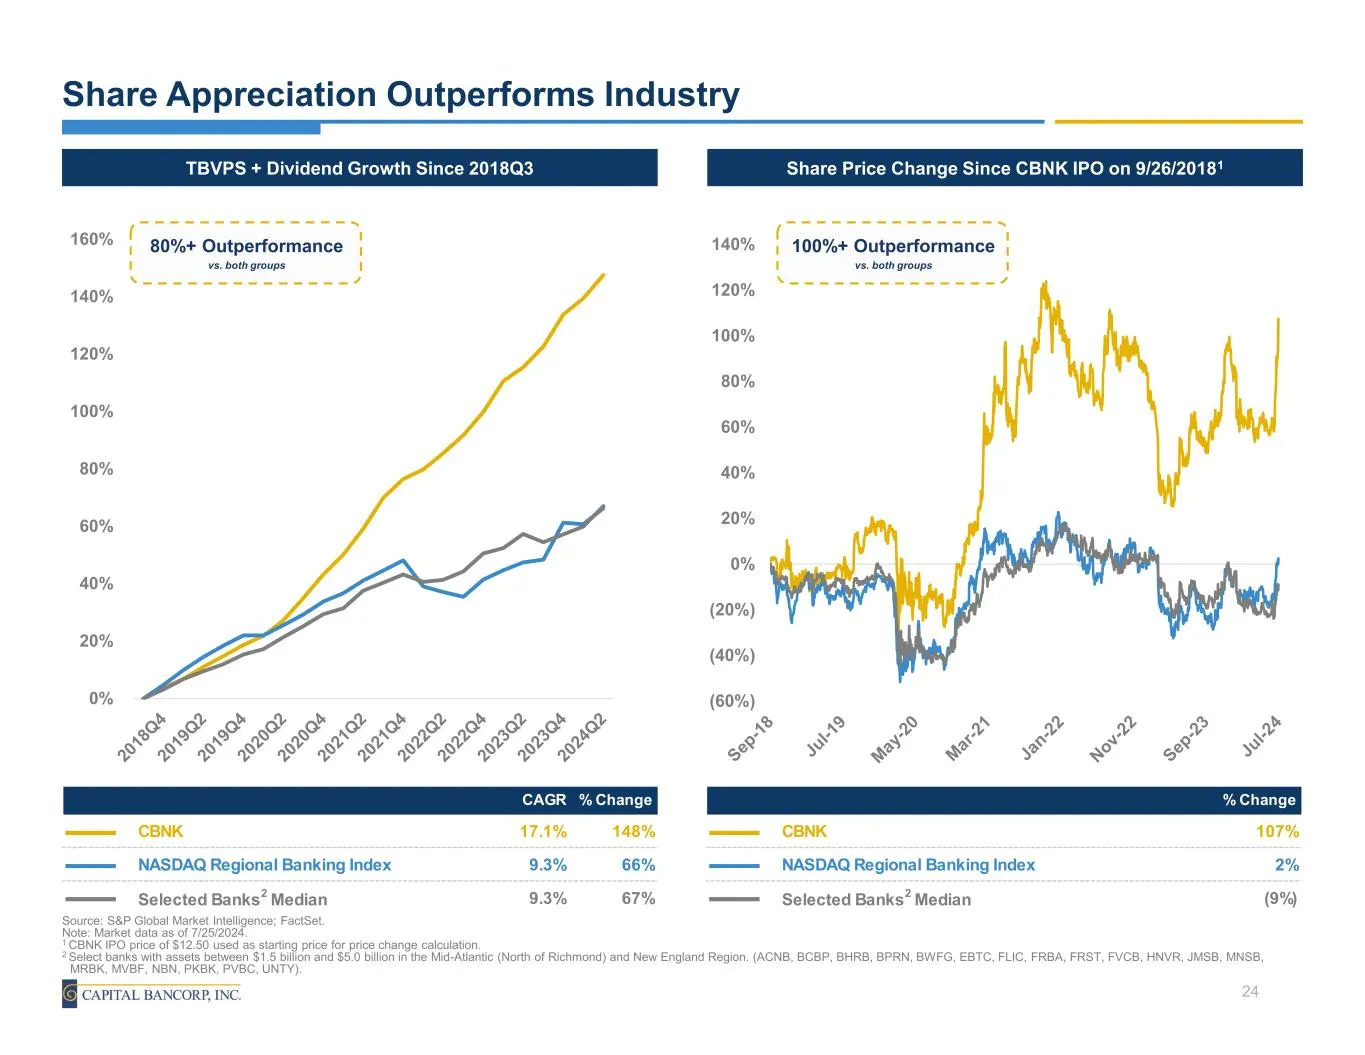
0% 20% 40% 60% 80% 100% 120% 140% 160% 58.48% (60%) (40%) (20%) 0% 20% 40% 60% 80% 100% 120% 140% CAGR % Change CBNK 17.1% 148% NASDAQ Regional Banking Index 9.3% 66% Selected Banks2 Median 9.3% 67% Share Appreciation Outperforms Industry Share Price Change Since CBNK IPO on 9/26/20181TBVPS + Divide
Slide 25: Contacts
Dominic Canuso Chief Financial Officer (301) 468-8848 x1403 Ed Barry Chief Executive Officer (240) 283-1912 NASDAQ: CBNK

Slide 26: Appendix
Appendix
Slide 27: Renewables Business Poised to Grow as Energy Transition Continues
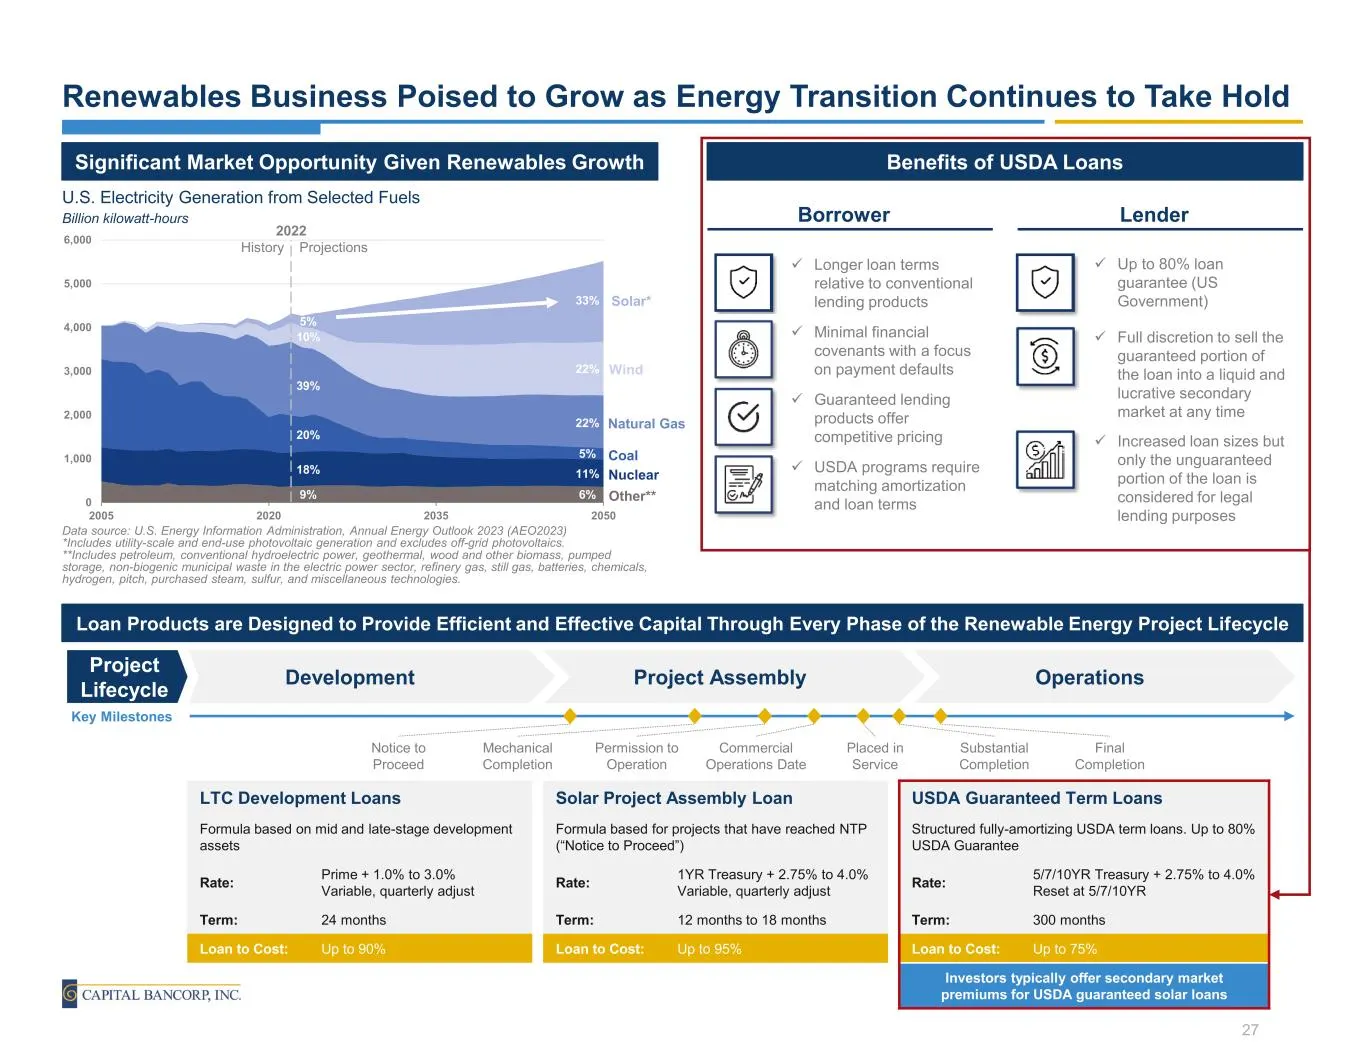
Renewables Business Poised to Grow as Energy Transition Continues to Take Hold OperationsProject AssemblyDevelopmentProject Lifecycle LTC Development Loans Formula based on mid and late-stage development assets Rate: Prime + 1.0% to 3.0% Variable, quarterly adjust Term: 24 months Loan to Cost: Up to
Slide 28: Tangible Book Value Per Share
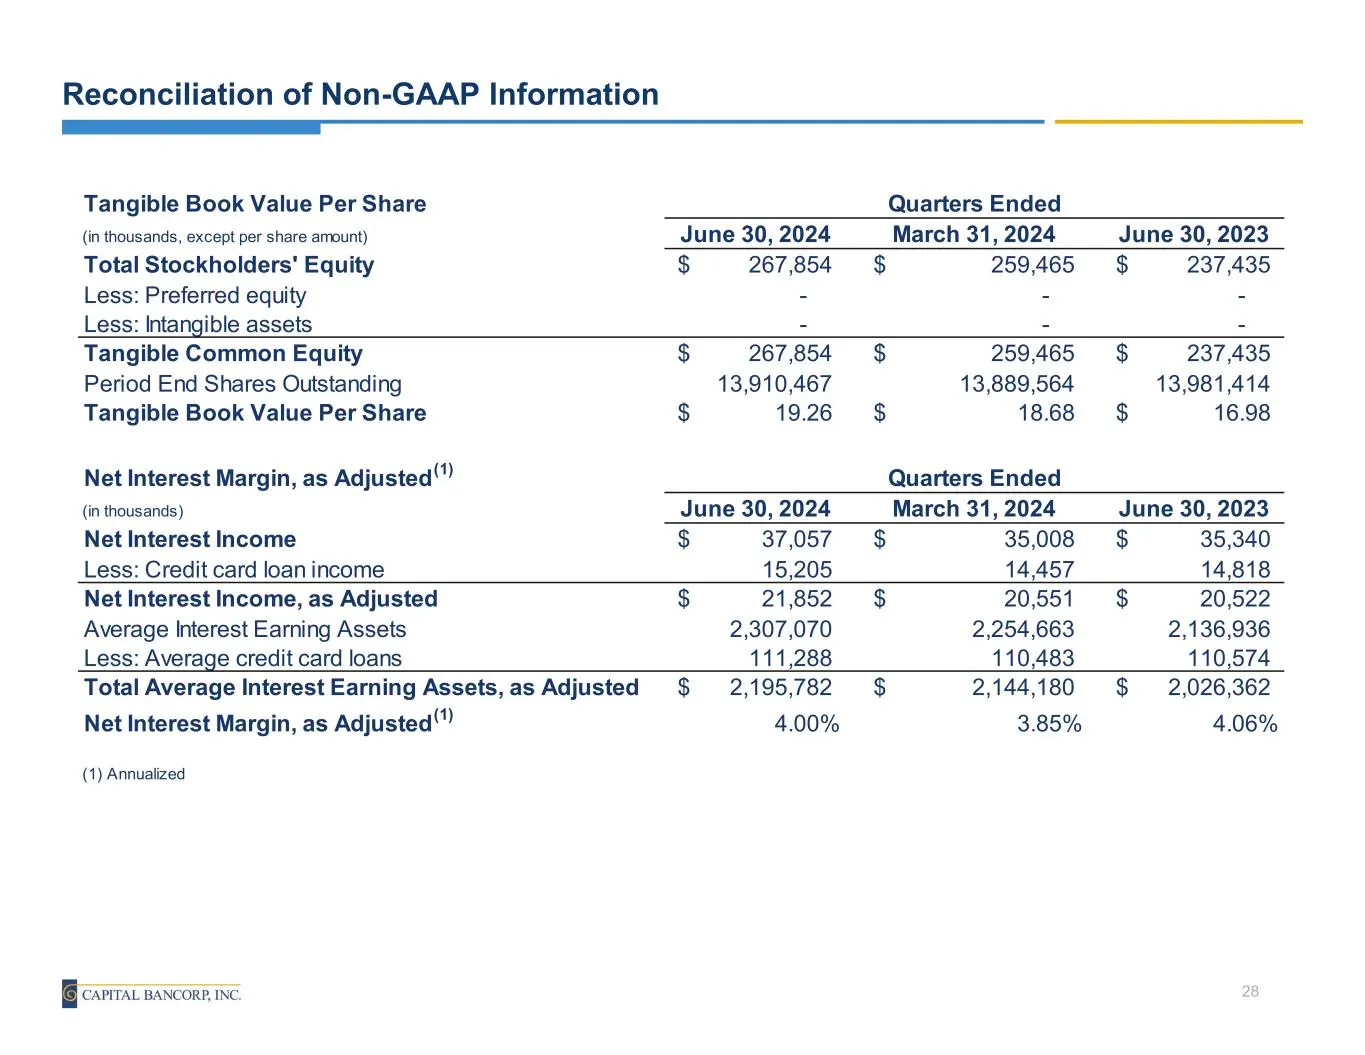
Tangible Book Value Per Share (in thousands, except per share amount) June 30, 2024 March 31, 2024 June 30, 2023 Total Stockholders' Equity 267,854$ 259,465$ 237,435$ Less: Preferred equity - - - Less: Intangible assets - - - Tangible Common Equity 267,854$ 259,465$ 237,435$ Period End Shares Outsta
Slide 29: Net Charge-offs to Average Portfolio Loans
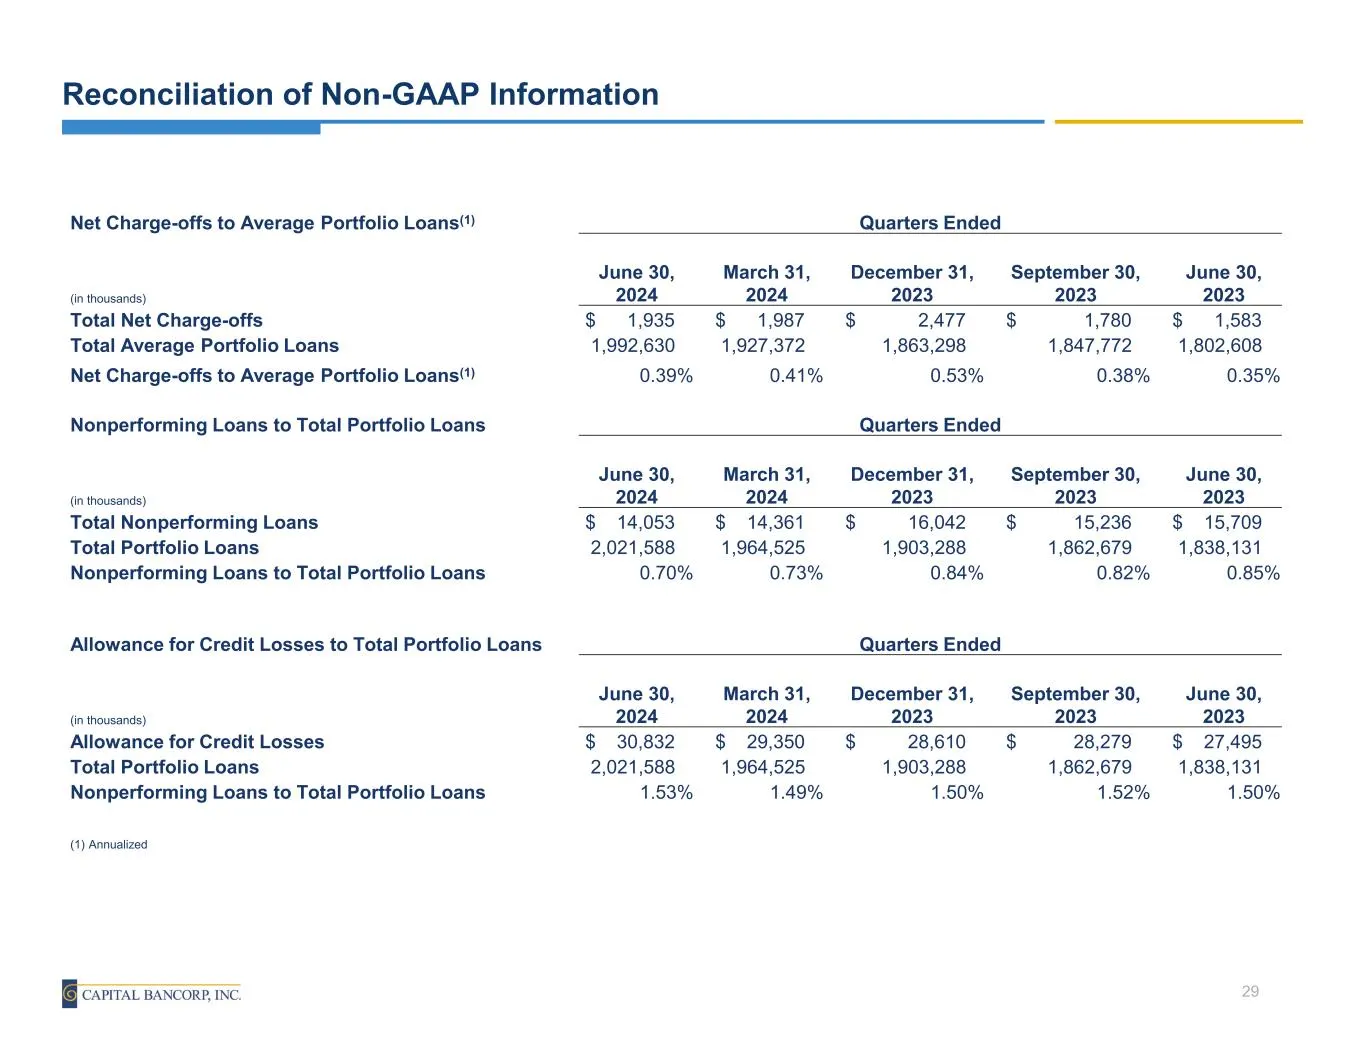
Net Charge-offs to Average Portfolio Loans(1) Quarters Ended (in thousands) June 30, 2024 March 31, 2024 December 31, 2023 September 30, 2023 June 30, 2023 Total Net Charge-offs $ 1,935 $ 1,987 $ 2,477 $ 1,780 $ 1,583 Total Average Portfolio Loans 1,992,630 1,927,372 1,863,298 1,847,772 1,802,608 Ne
Slide 30: Earnings Metrics, as Adjusted
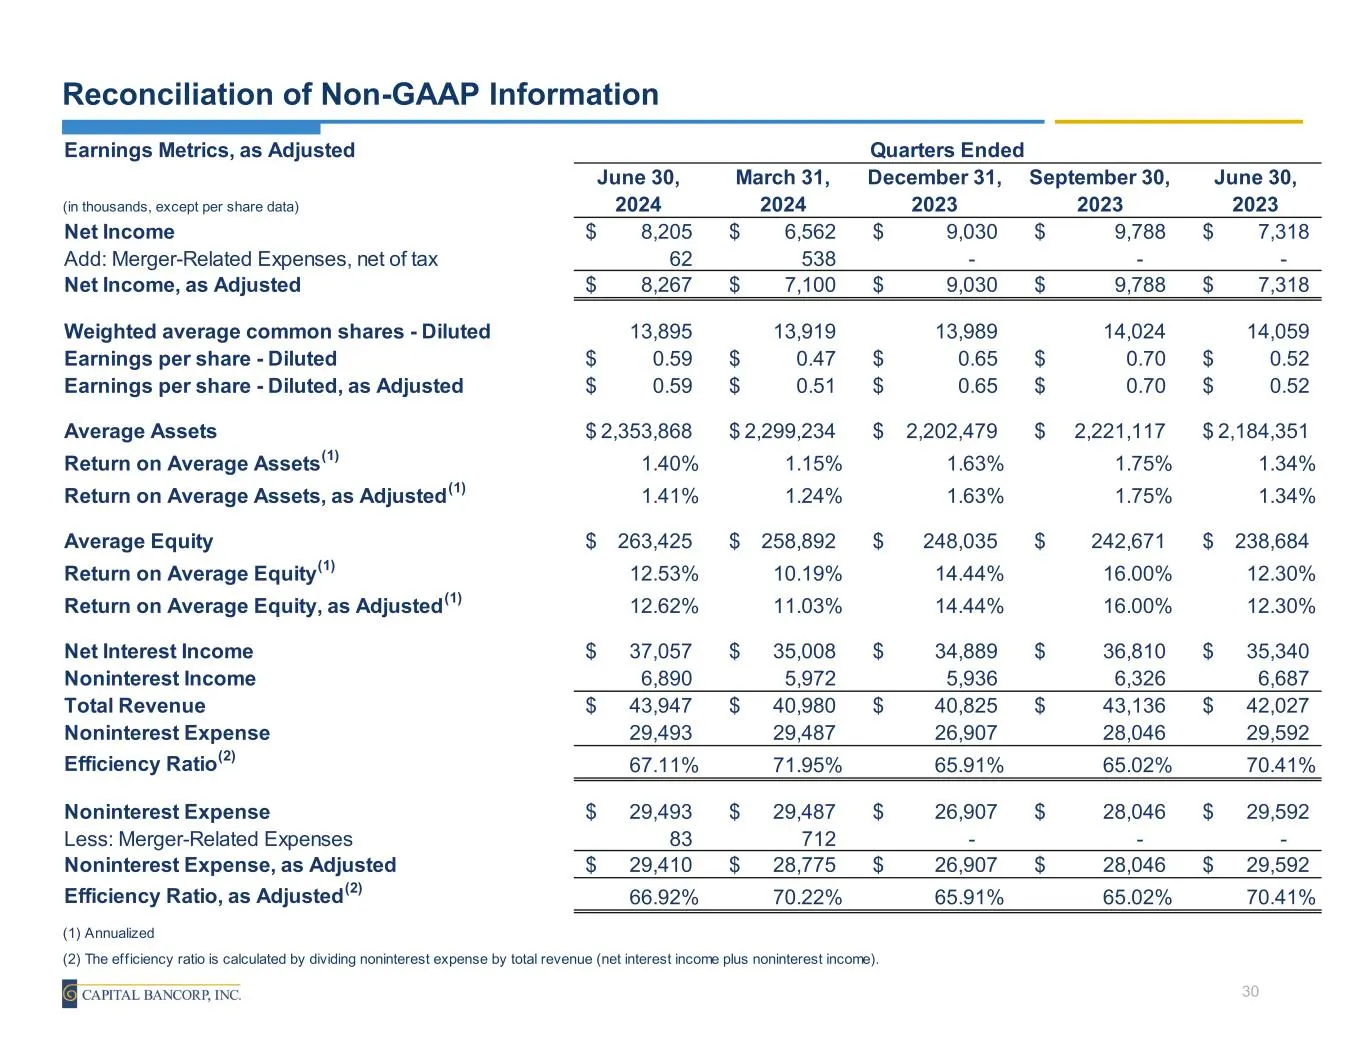
Earnings Metrics, as Adjusted (in thousands, except per share data) June 30, 2024 March 31, 2024 December 31, 2023 September 30, 2023 June 30, 2023 Net Income 8,205$ 6,562$ 9,030$ 9,788$ 7,318$ Add: Merger-Related Expenses, net of tax 62 538 - - - Net Income, as Adjusted 8,267$ 7,100$ 9,030$ 9,788$
Source: SEC EDGAR · 8-K filed Jul 29, 2024
More decks from Capital Bancorp, Inc.
 Q3 2026 Earnings Presentation23 slides · Oct 26, 2026
 Merger or Acquisition (September 2026)22 slides · Sep 30, 2026
 Q2 2026 Earnings Presentation22 slides · Jul 27, 2026
 Q1 2026 Earnings Presentation22 slides · Apr 27, 2026
 Q4 2025 Earnings Presentation22 slides · 2026
 Q2 2026 Earnings Presentation22 slides · 2026