HCC Insurance — Investor Presentation (April 2006)
40 slides from HCC Insurance's investor presentation, Apr 4, 2006

Slide 1
Slide 2: Notice About This Presentation About Forward Looking Statements
NOTICE ABOUT THIS PRESENTATION ABOUT FORWARD LOOKING STATEMENTS: This presentation contains certain "forward looking statements" within the meaning of Section 27A of the Securities Act of 1933, and Section 21E of the Securities Exchange Act of 1934, which are intended to be covered by the safe harbo

Slide 3: Overview
OVERVIEW
Slide 4: Corporate Profile
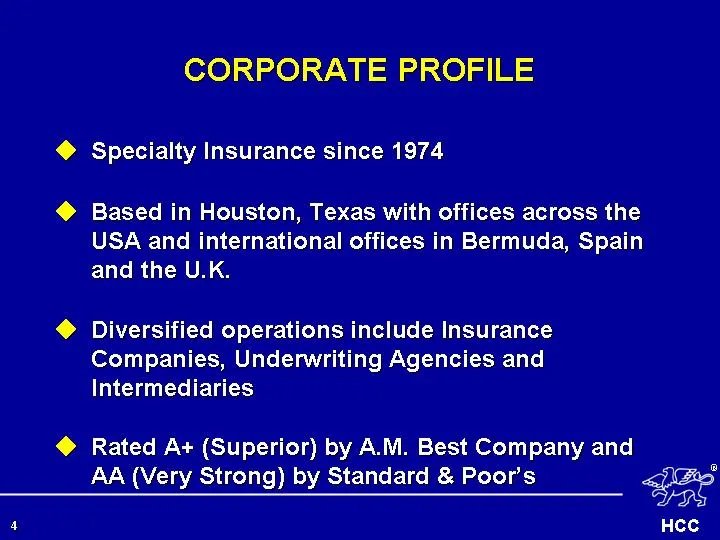
CORPORATE PROFILE Specialty Insurance since 1974 Based in Houston, Texas with offices across the USA and international offices in Bermuda, Spain and the U.K. Diversified operations include Insurance Companies, Underwriting Agencies and Intermediaries Rated A+ (Superior) by A.M. Best Company and AA (
Slide 5: Corporate Philosophy
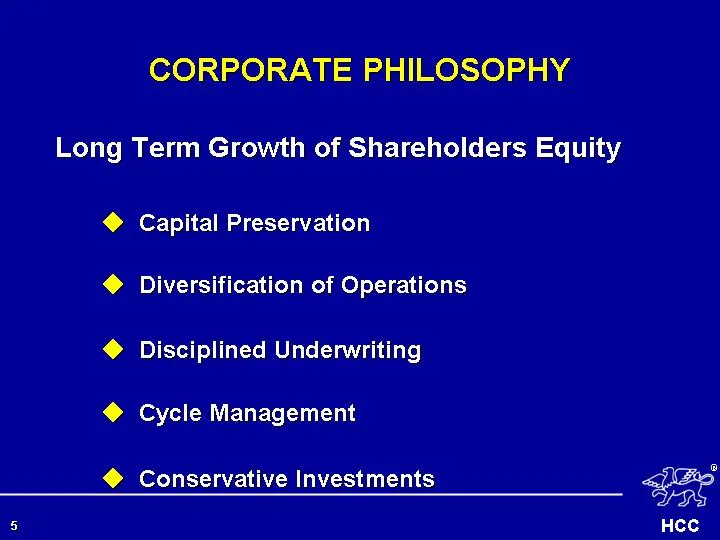
CORPORATE PHILOSOPHY Long Term Growth of Shareholders Equity Capital Preservation Diversification of Operations Disciplined Underwriting Cycle Management Conservative Investments
Slide 6: Shareholders Equity
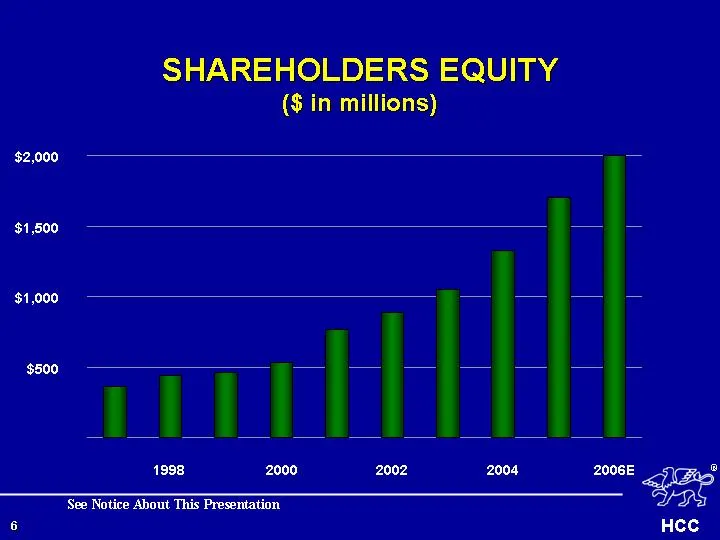
SHAREHOLDERS EQUITY ($ in millions) $1,500 $1,000 $500 1998 2000 2002 2004 2006E $2,000 See Notice About This Presentation
Slide 7: Shareholders Equity
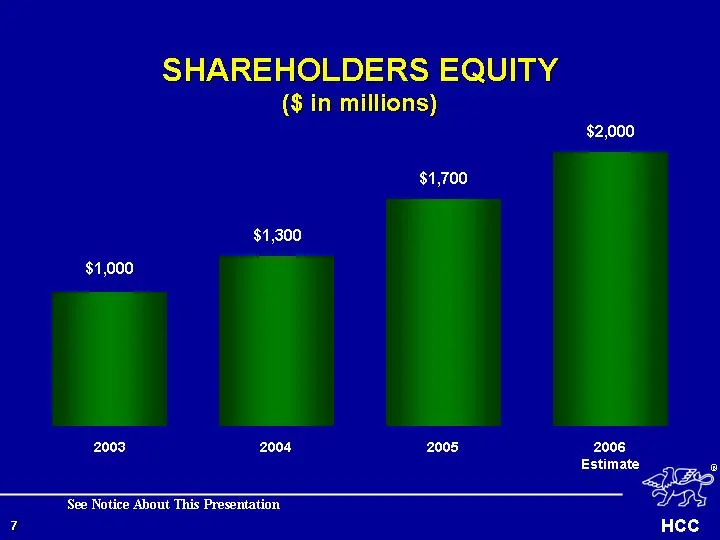
SHAREHOLDERS EQUITY ($ in millions) 2003 $1,000 2004 $1,300 $1,700 2006 Estimate $2,000 2005 See Notice About This Presentation
Slide 8: Return on Equity
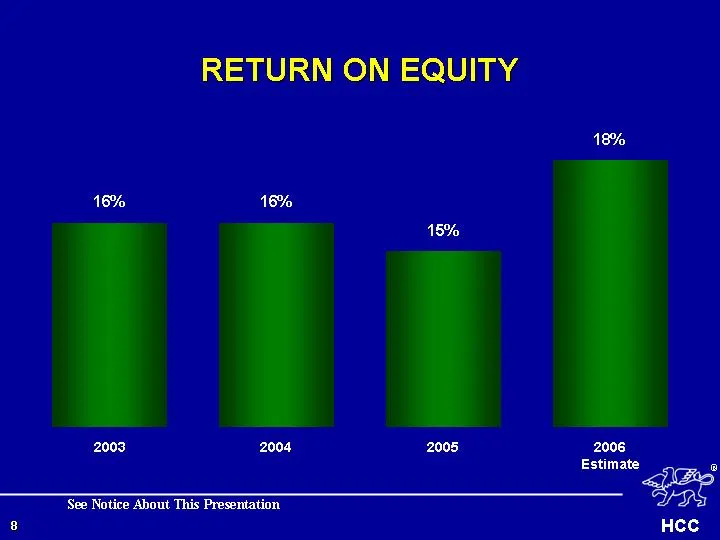
RETURN ON EQUITY 2003 16% 2004 16% 15% 2006 Estimate 18% 2005 See Notice About This Presentation
Slide 9: Growth in Book Value
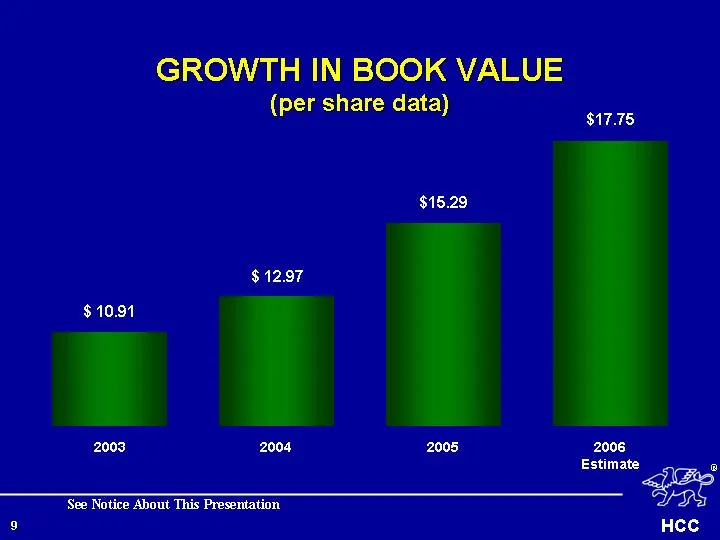
GROWTH IN BOOK VALUE (per share data) 2003 $ 10.91 2004 $ 12.97 $15.29 2005 2006 Estimate $17.75 See Notice About This Presentation
Slide 10: Operations
OPERATIONS
Slide 11: Executive Management
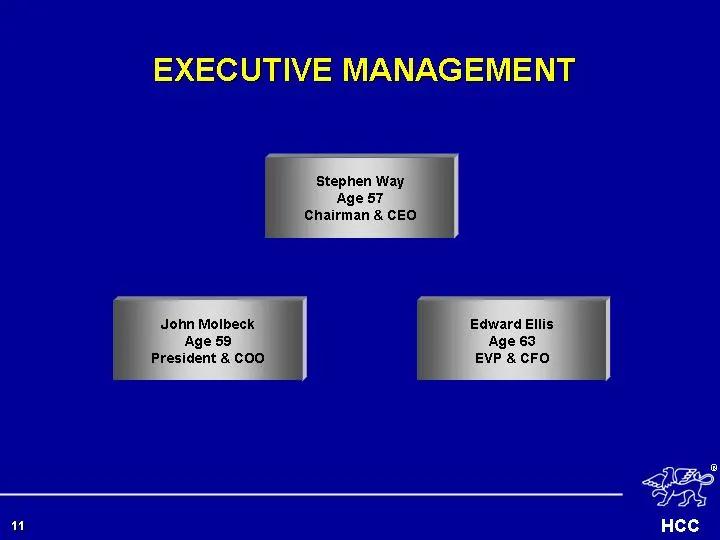
EXECUTIVE MANAGEMENT Stephen Way Age 57 Chairman & CEO Edward Ellis Age 63 EVP & CFO
Slide 12: Senior Management
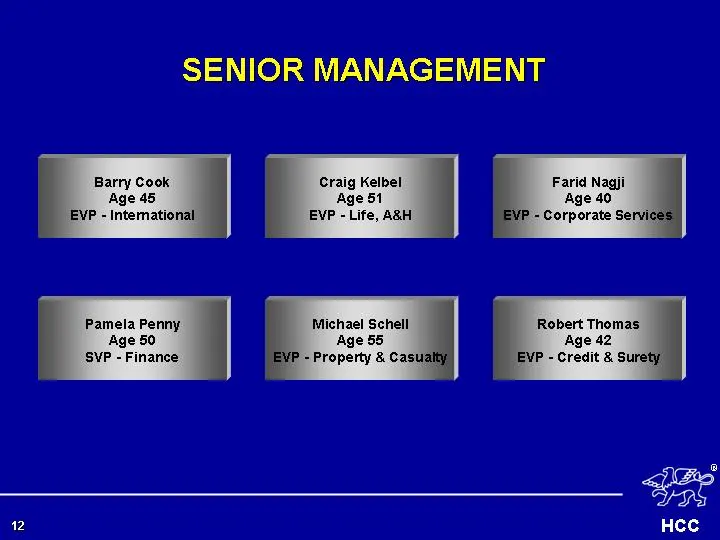
SENIOR MANAGEMENT Robert Thomas Age 42 EVP - Credit & Surety Pamela Penny Age 50 SVP - Finance Craig Kelbel Age 51 EVP - Life, A&H Barry Cook Age 45 EVP - International
Slide 13: Operations (Subsidiaries / Divisions)
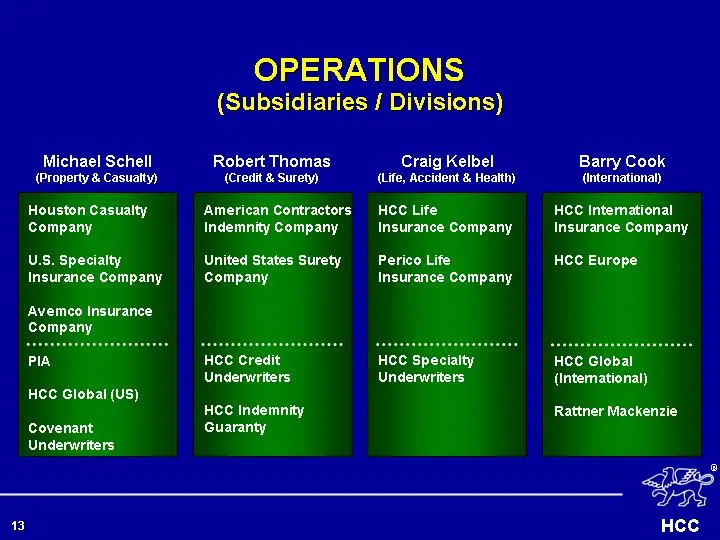
OPERATIONS (Subsidiaries / Divisions) Michael Schell (Property & Casualty) Houston Casualty Company U.S. Specialty Insurance Company Avemco Insurance Company PIA HCC Global (US) Covenant Underwriters Robert Thomas (Credit & Surety) American Contractors Indemnity Company United States Surety Company
Slide 14: Operations Management (U.S.)
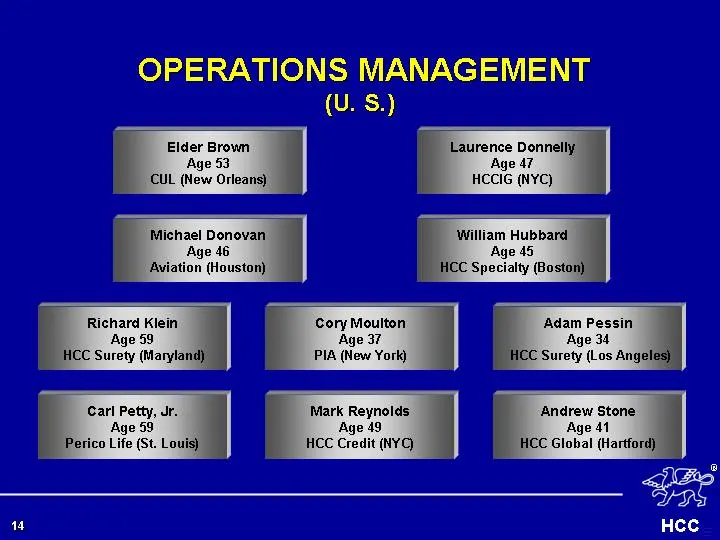
OPERATIONS MANAGEMENT (U. S.) Andrew Stone Age 41 HCC Global (Hartford) Carl Petty, Jr. Age 59 Perico Life (St. Louis) Richard Klein Age 59 HCC Surety (Maryland) Adam Pessin Age 34 HCC Surety (Los Angeles) Elder Brown Age 53 CUL (New Orleans) Laurence Donnelly Age 47 HCCIG (NYC) William Hubbard Age
Slide 15: Operations Management (International)
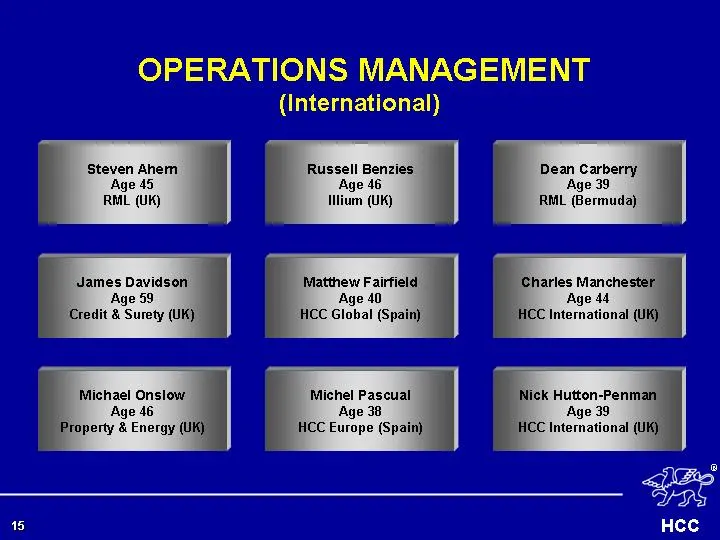
OPERATIONS MANAGEMENT (International) Nick Hutton-Penman Age 39 HCC International (UK) Michael Onslow Age 46 Property & Energy (UK) Charles Manchester Age 44 HCC International (UK) Matthew Fairfield Age 40 HCC Global (Spain) James Davidson Age 59 Credit & Surety (UK) Dean Carberry Age 39 RML (Bermud
Slide 16: Operations (Lines of Business)
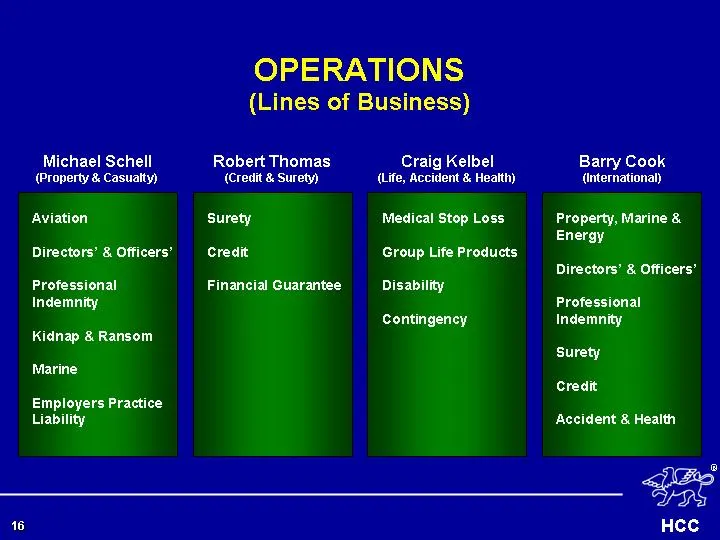
OPERATIONS (Lines of Business) Michael Schell (Property & Casualty) Aviation Directors' & Officers' Professional Indemnity Kidnap & Ransom Marine Employers Practice Liability Craig Kelbel (Life, Accident & Health) Medical Stop Loss Group Life Products Disability Contingency Robert Thomas (Credit & S
Slide 17: Net Written Premium
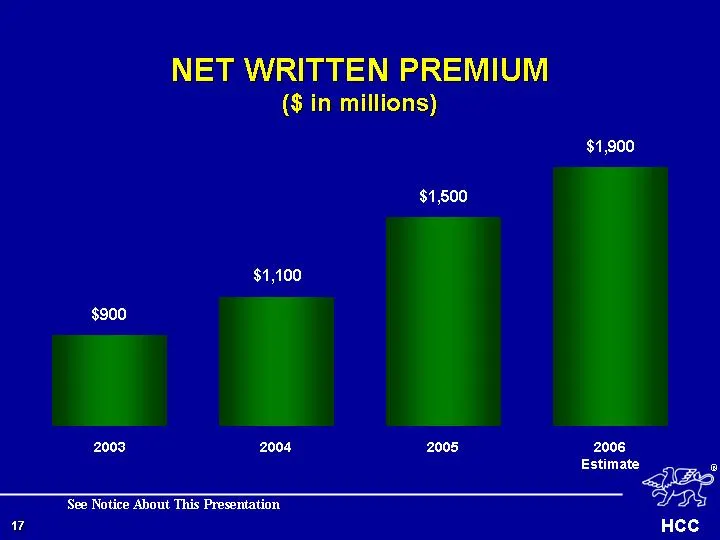
NET WRITTEN PREMIUM ($ in millions) 2003 $900 2004 $1,100 $1,500 2005 2006 Estimate $1,900 See Notice About This Presentation
Slide 18: GAAP Combined Ratio
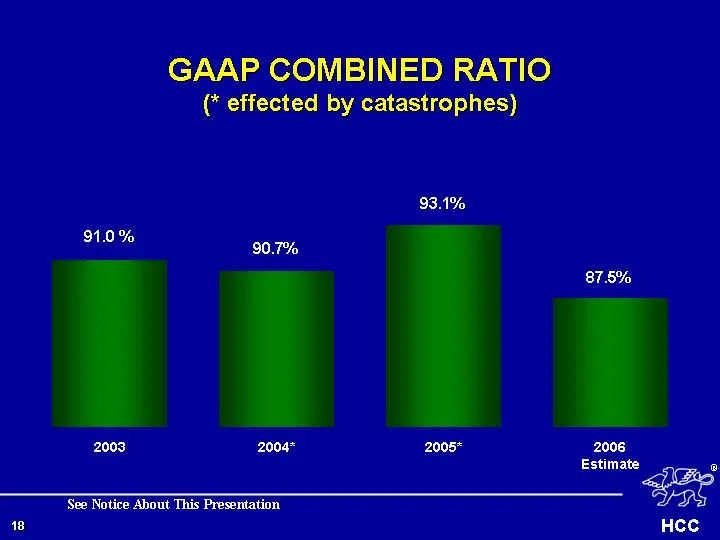
GAAP COMBINED RATIO (* effected by catastrophes) 2003 91.0 % 2004* 90.7% 93.1% 2006 Estimate 87.5% 2005* See Notice About This Presentation
Slide 19: Financials
FINANCIALS
Slide 20: Balance Sheet
BALANCE SHEET
Slide 21: Strong Balance Sheet
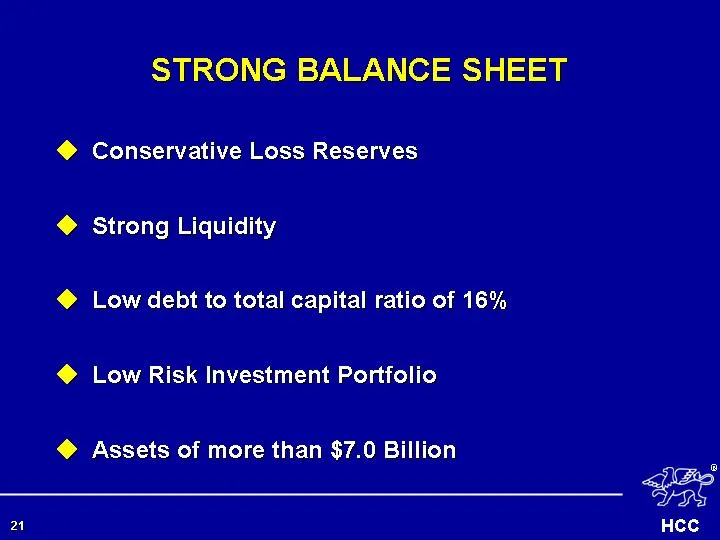
STRONG BALANCE SHEET Conservative Loss Reserves Strong Liquidity Low debt to total capital ratio of 16% Low Risk Investment Portfolio Assets of more than $7.0 Billion
Slide 22: Net Loss Reserves
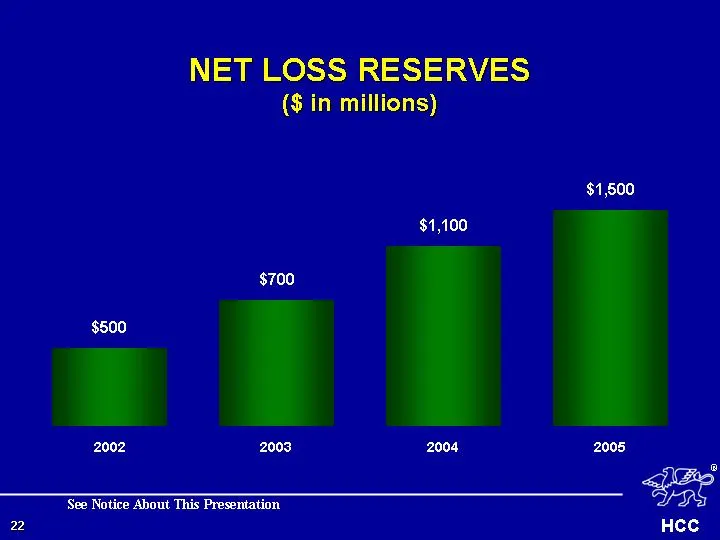
NET LOSS RESERVES ($ in millions) 2002 $500 2003 $700 $1,100 2004 2005 $1,500 See Notice About This Presentation
Slide 23: Cash Flow
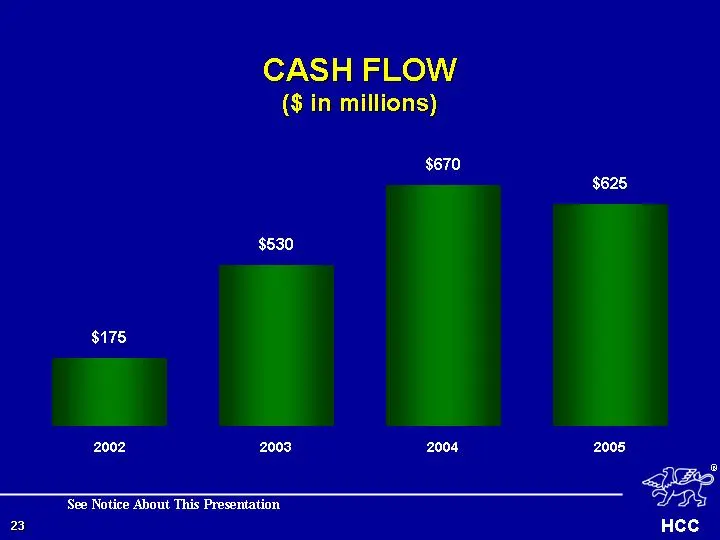
CASH FLOW ($ in millions) 2002 $175 2003 $530 $670 2004 2005 $625 See Notice About This Presentation
Slide 24: Investment Assets
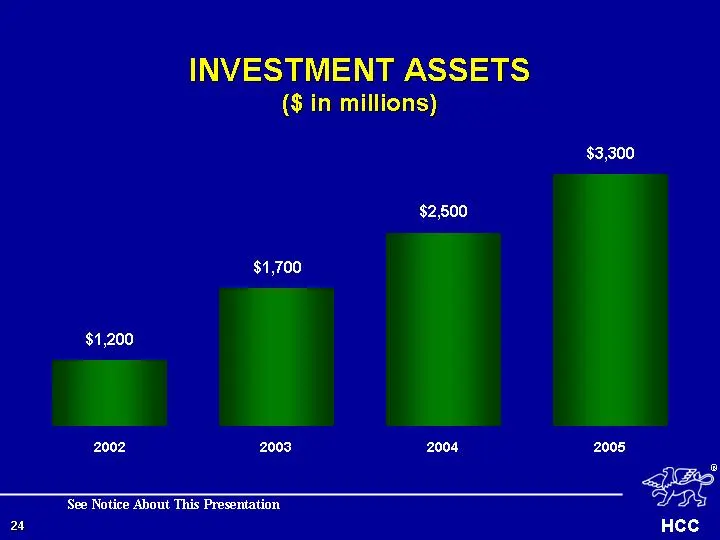
INVESTMENT ASSETS ($ in millions) 2002 $1,200 2003 $1,700 $2,500 2004 2005 $3,300 See Notice About This Presentation
Slide 25: Conservative Investment Portfolio
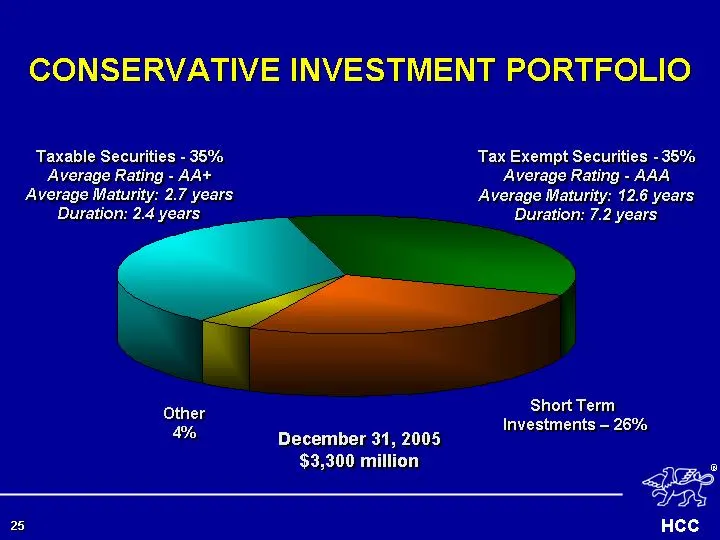
1st Qtr Tax Exempt Securities 35 Short Term Investments 26 Other 4 Taxable Securities 35 Taxable Securities - 35% Average Rating - AA+ Average Maturity: 2.7 years Duration: 2.4 years Tax Exempt Securities - 35% Average Rating - AAA Average Maturity: 12.6 years Duration: 7.2 years Other 4% December 3
Slide 26: Total Assets
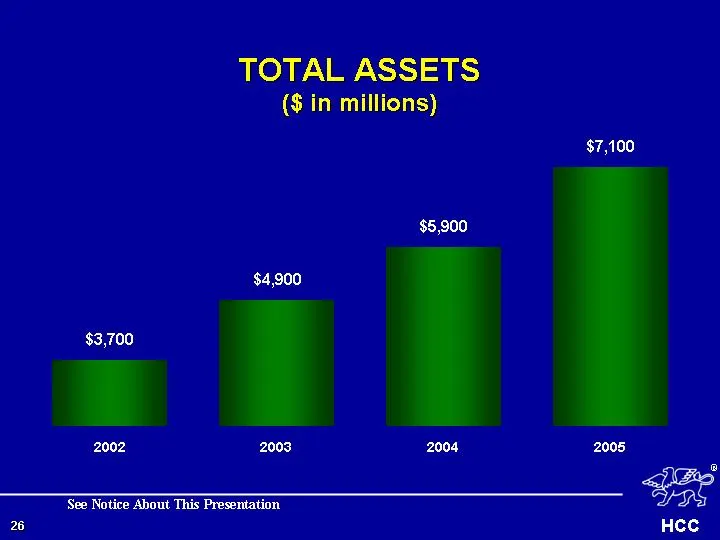
TOTAL ASSETS ($ in millions) 2002 $3,700 2003 $4,900 $5,900 2004 2005 $7,100 See Notice About This Presentation
Slide 27: Income Statement
INCOME STATEMENT
Slide 28: Revenue: Net Earned Premium
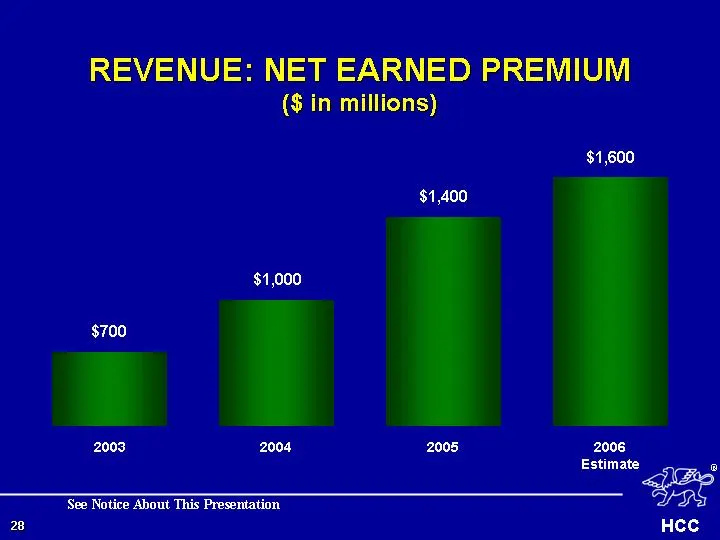
REVENUE: NET EARNED PREMIUM ($ in millions) 2003 $700 2004 $1,000 $1,400 2005 2006 Estimate $1,600 See Notice About This Presentation
Slide 29: Revenue: Fee & Commission Income
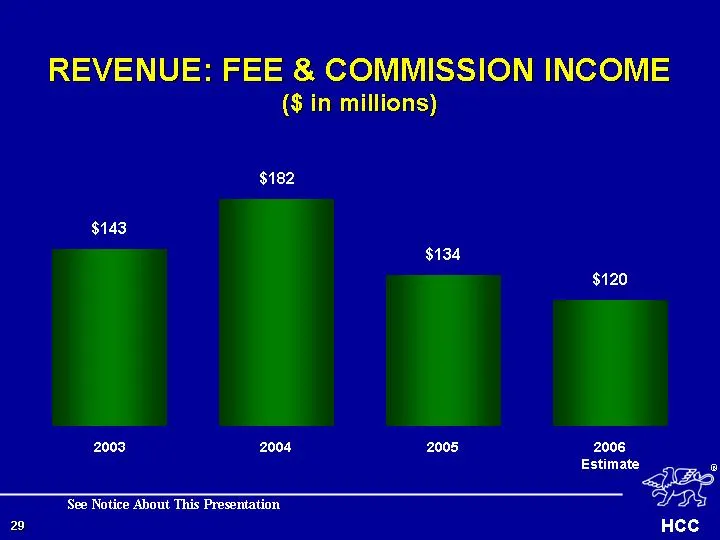
REVENUE: FEE & COMMISSION INCOME ($ in millions) 2003 $143 2004 $182 $134 2005 2006 Estimate $120 See Notice About This Presentation
Slide 30: Revenue: Investment Income
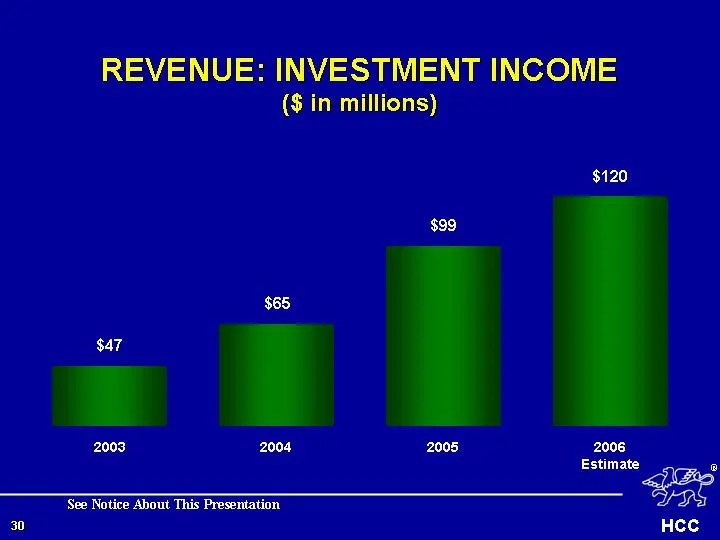
REVENUE: INVESTMENT INCOME ($ in millions) 2003 $47 2004 $65 $99 2005 2006 Estimate $120 See Notice About This Presentation
Slide 31: Total Revenue
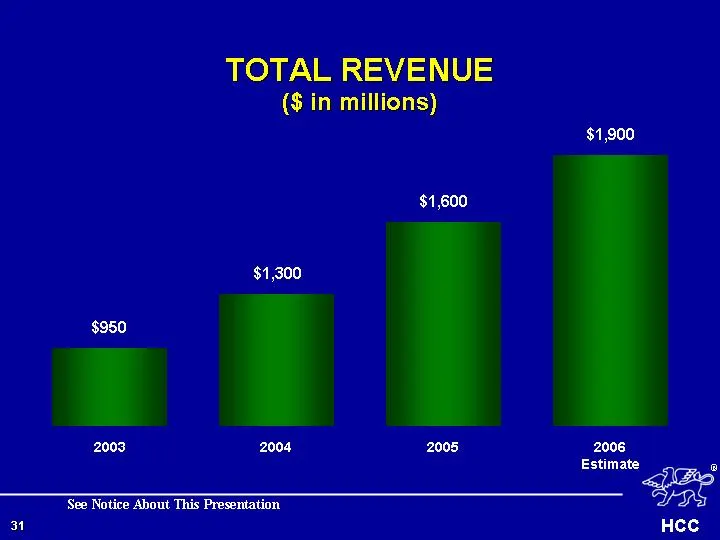
TOTAL REVENUE ($ in millions) 2003 $950 2004 $1,300 $1,600 2005 2006 Estimate $1,900 See Notice About This Presentation
Slide 32: Net Earnings
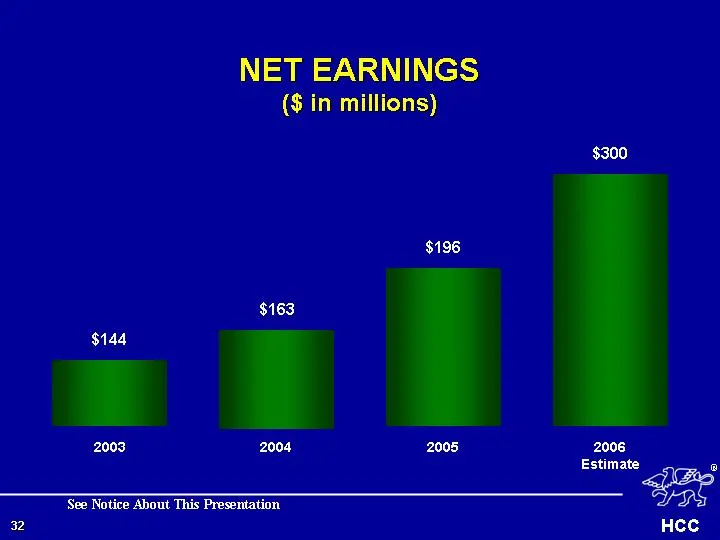
NET EARNINGS ($ in millions) 2003 $144 2004 $163 $196 2005 2006 Estimate $300 See Notice About This Presentation
Slide 33: Net Earnings Per Share
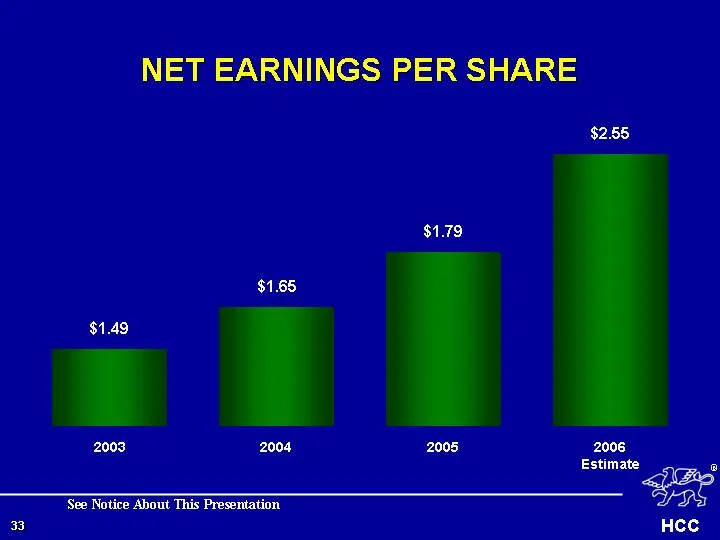
NET EARNINGS PER SHARE 2003 $1.49 2004 $1.65 $1.79 2005 2006 Estimate $2.55 See Notice About This Presentation
Slide 34: Key Strengths
KEY STRENGTHS
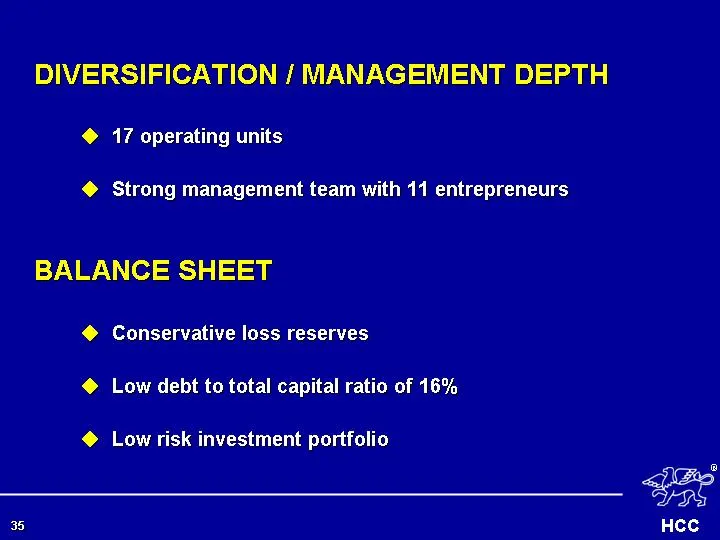
Slide 35: Diversification / Management Depth; Balance Sheet
DIVERSIFICATION / MANAGEMENT DEPTH 17 operating units Strong management team with 11 entrepreneurs BALANCE SHEET Conservative loss reserves Low debt to total capital ratio of 16% Low risk investment portfolio
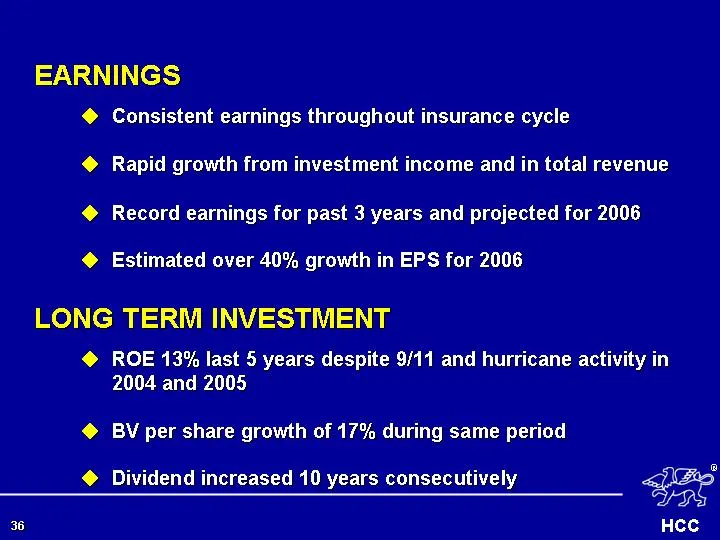
Slide 36: Earnings; Long Term Investment
EARNINGS Consistent earnings throughout insurance cycle Rapid growth from investment income and in total revenue Record earnings for past 3 years and projected for 2006 Estimated over 40% growth in EPS for 2006 LONG TERM INVESTMENT ROE 13% last 5 years despite 9/11 and hurricane activity in 2004 and
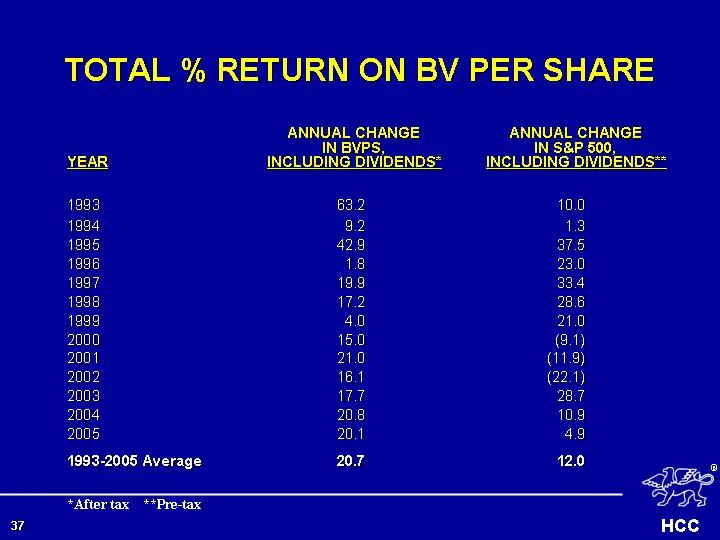
Slide 37: Total % Return on BV Per Share
TOTAL % RETURN ON BV PER SHARE 1993 1994 1995 1996 1997 1998 1999 2000 2001 2002 2003 2004 2005 1993-2005 Average ANNUAL CHANGE IN BVPS, INCLUDING DIVIDENDS* 63.2 9.2 42.9 1.8 19.9 17.2 4.0 15.0 21.0 16.1 17.7 20.8 20.1 20.7 10.0 1.3 37.5 23.0 33.4 28.6 21.0 (9.1) (11.9) (22.1) 28.7 10.9 4.9 12.0 AN
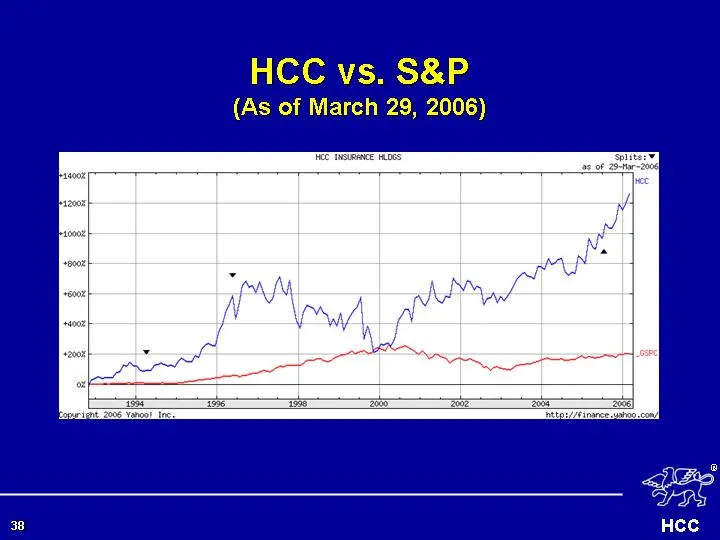
Slide 38: HCC vs. S&P
HCC vs. S&P (As of March 29, 2006)
Slide 39: Notice About This Presentation About Forward Looking Statements
NOTICE ABOUT THIS PRESENTATION ABOUT FORWARD LOOKING STATEMENTS: This presentation contains certain "forward looking statements" within the meaning of Section 27A of the Securities Act of 1933, and Section 21E of the Securities Exchange Act of 1934, which are intended to be covered by the safe harbo

Slide 40
Source: SEC EDGAR · 8-K filed Apr 4, 2006
More decks from HCC Insurance Holdings Inc
 Q2 2015 Earnings Presentation31 slides · Aug 14, 2015
 Merger or Acquisition (June 2015)22 slides · Jun 23, 2015
 Merger or Acquisition (June 2015)10 slides · Jun 10, 2015
 Merger or Acquisition (June 2015)30 slides · Jun 10, 2015
 Q1 2015 Earnings Presentation35 slides · May 21, 2015
 36th Annual Raymond James Institutional Investors Conference (February 2015)36 slides · Feb 27, 2015