Southcross Energy Partners L.P
Southcross Energy Partners L.P — Investor Presentation (April 2014)
26 slides from Southcross Energy Partners L.P's investor presentation, Apr 2, 2014
Slide 1: Investor Presentation April 2014
0 Investor Presentation April 2014
Slide 2: Cautionary Statements
1 Cautionary Statements This presentation contains forward-looking statements and information. Forward-looking statements include, without limitation, any statement that may project, indicate or imply future results, events, performance or achievements, and may contain the words “expect,” “intend,”
Slide 3: Southcross Overview
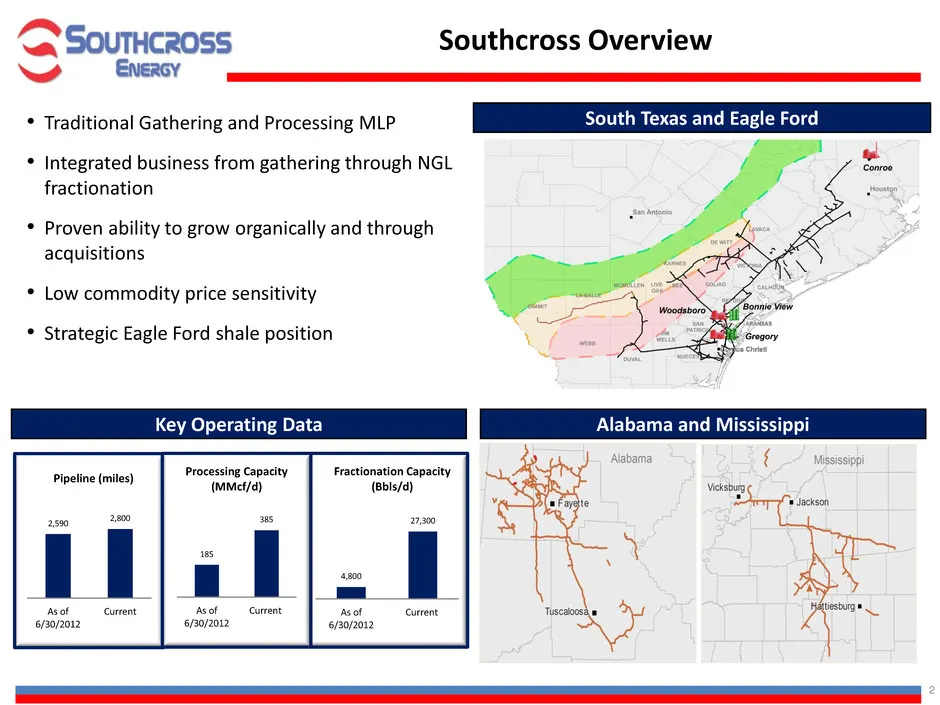
2 Southcross Overview Alabama and Mississippi • Traditional Gathering and Processing MLP • Integrated business from gathering through NGL fractionation • Proven ability to grow organically and through acquisitions • Low commodity price sensitivity • Strategic Eagle Ford shale position Key Operating
Slide 4: Southcross History
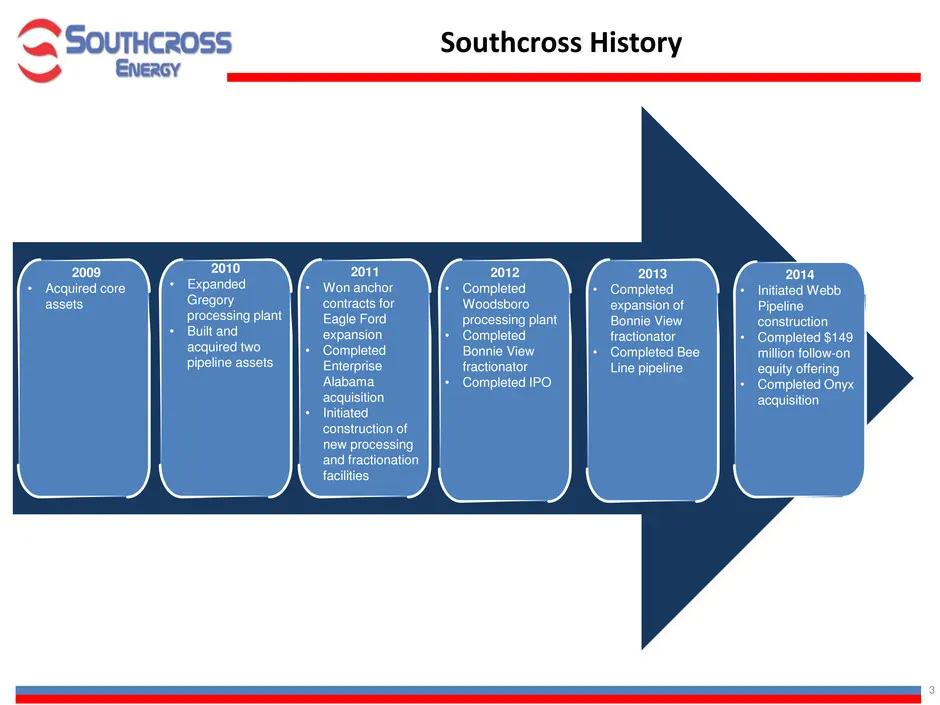
3 Southcross History 2009 • Acquired core assets 2010 • Expanded Gregory processing plant • Built and acquired two pipeline assets 2011 • Won anchor contracts for Eagle Ford expansion • Completed Enterprise Alabama acquisition • Initiated construction of new processing and fractionation facilities 2
Slide 5: Investment Highlights
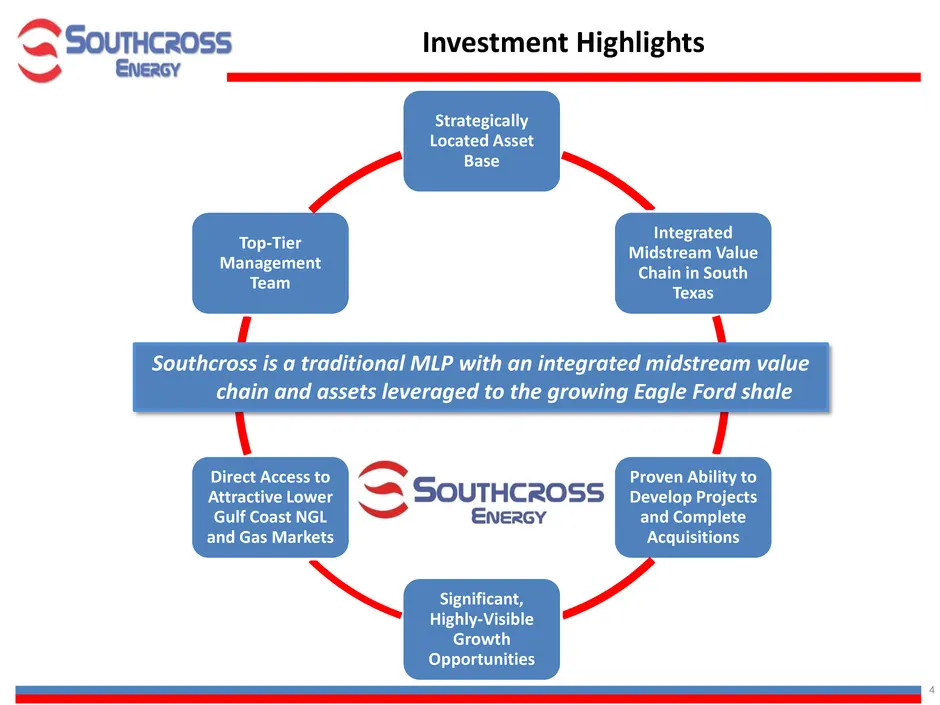
4 Strategically Located Asset Base Integrated Midstream Value Chain in South Texas Proven Ability to Develop Projects and Complete Acquisitions Significant, Highly-Visible Growth Opportunities Direct Access to Attractive Lower Gulf Coast NGL and Gas Markets Top-Tier Management Team Southcross is a t
Slide 6: Strategically Located Asset Base
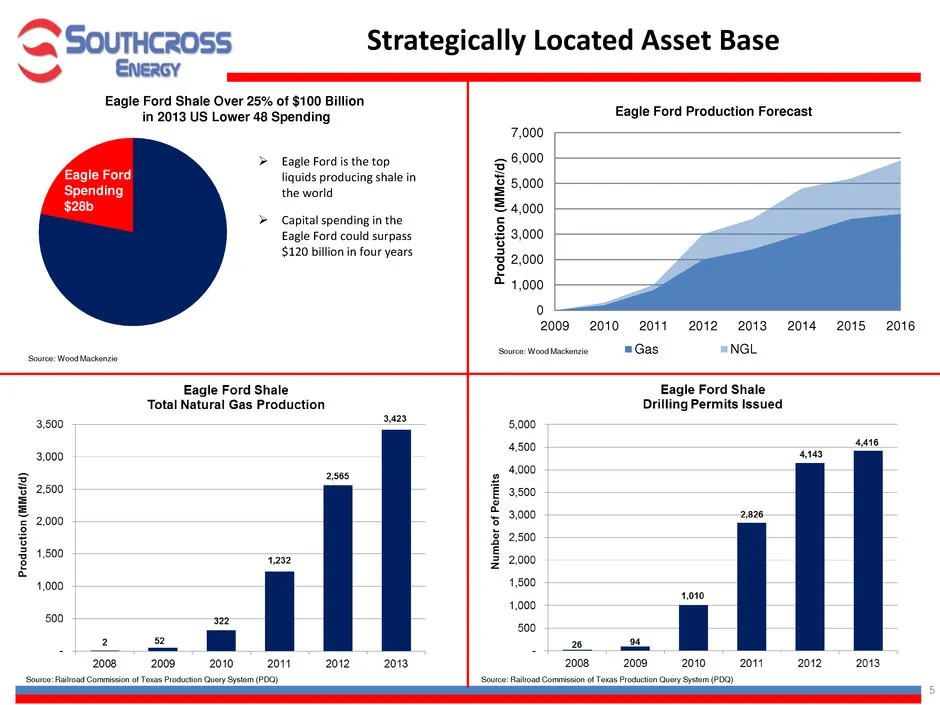
5 Strategically Located Asset Base Eagle Ford is the top liquids producing shale in the world Capital spending in the Eagle Ford could surpass $120 billion in four years Source: Wood Mackenzie Eagle Ford Shale Over 25% of $100 Billion in 2013 US Lower 48 Spending Eagle Ford Production Forecast 0
Slide 7: Integrated Midstream Value Chain
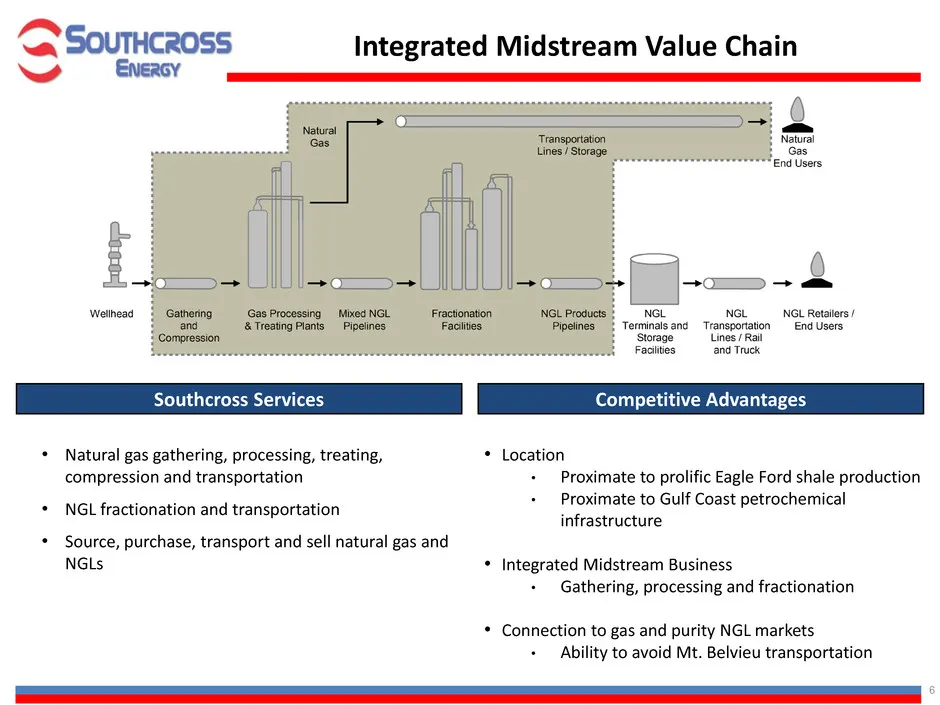
6 Integrated Midstream Value Chain Competitive Advantages Southcross Services • Natural gas gathering, processing, treating, compression and transportation • NGL fractionation and transportation • Source, purchase, transport and sell natural gas and NGLs • Location • Proximate to prolific Eagle Ford
Slide 8: Track Record of Growth
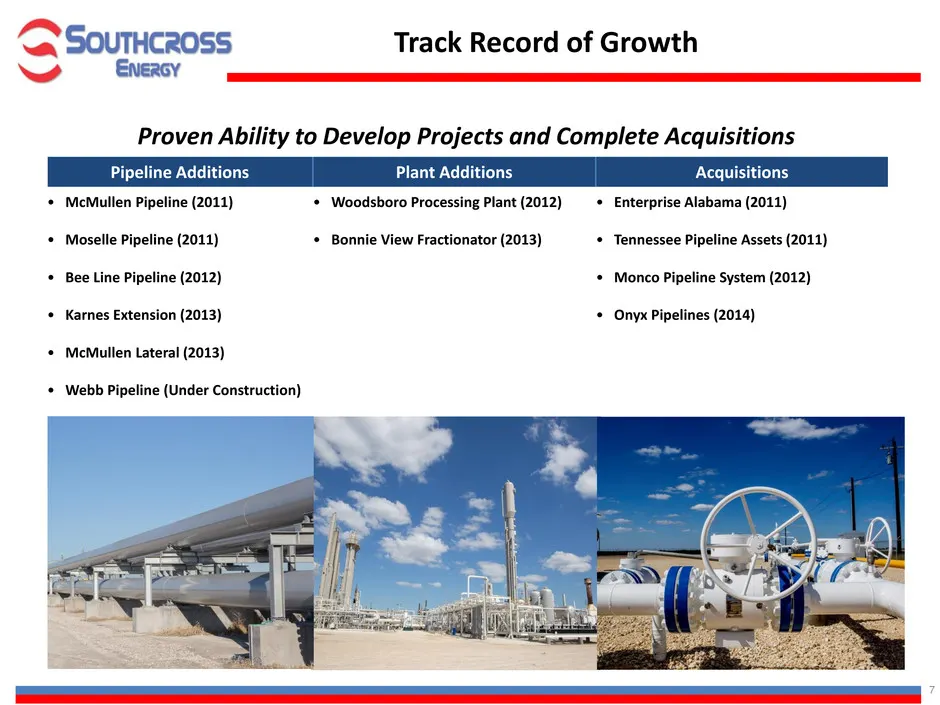
7 Track Record of Growth Pipeline Additions Plant Additions Acquisitions • McMullen Pipeline (2011) • Moselle Pipeline (2011) • Bee Line Pipeline (2012) • Karnes Extension (2013) • McMullen Lateral (2013) • Webb Pipeline (Under Construction) • Woodsboro Processing Plant (2012) • Bonnie View Fraction
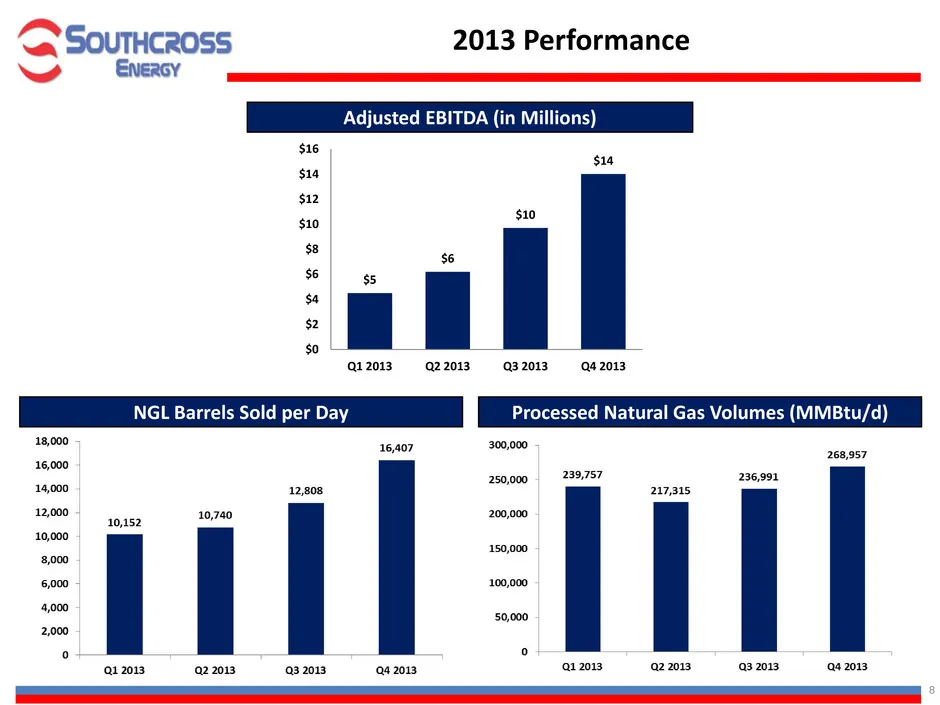
Slide 9: 2013 Performance
8 2013 Performance NGL Barrels Sold per Day Processed Natural Gas Volumes (MMBtu/d) Adjusted EBITDA (in Millions) $5 $6 $10 $14 $0 $2 $4 $6 $8 $10 $12 $14 $16 Q1 2013 Q2 2013 Q3 2013 Q4 2013
Slide 10: 2014 Accomplishments
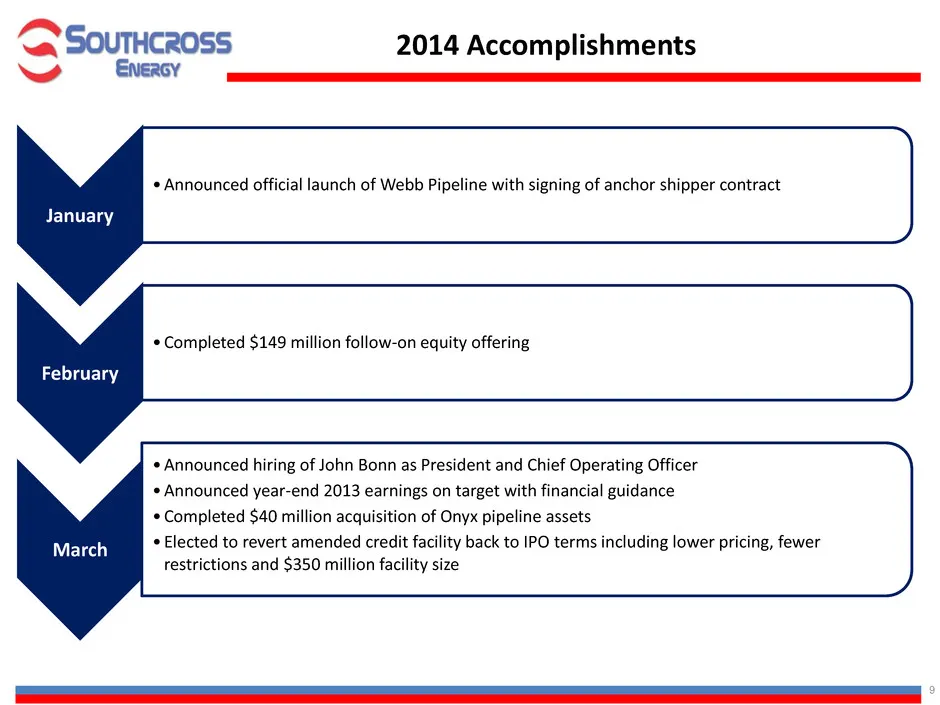
9 2014 Accomplishments January •Announced official launch of Webb Pipeline with signing of anchor shipper contract February •Completed $149 million follow-on equity offering March •Announced hiring of John Bonn as President and Chief Operating Officer •Announced year-end 2013 earnings on target with
Slide 11: Onyx Pipeline Acquisition
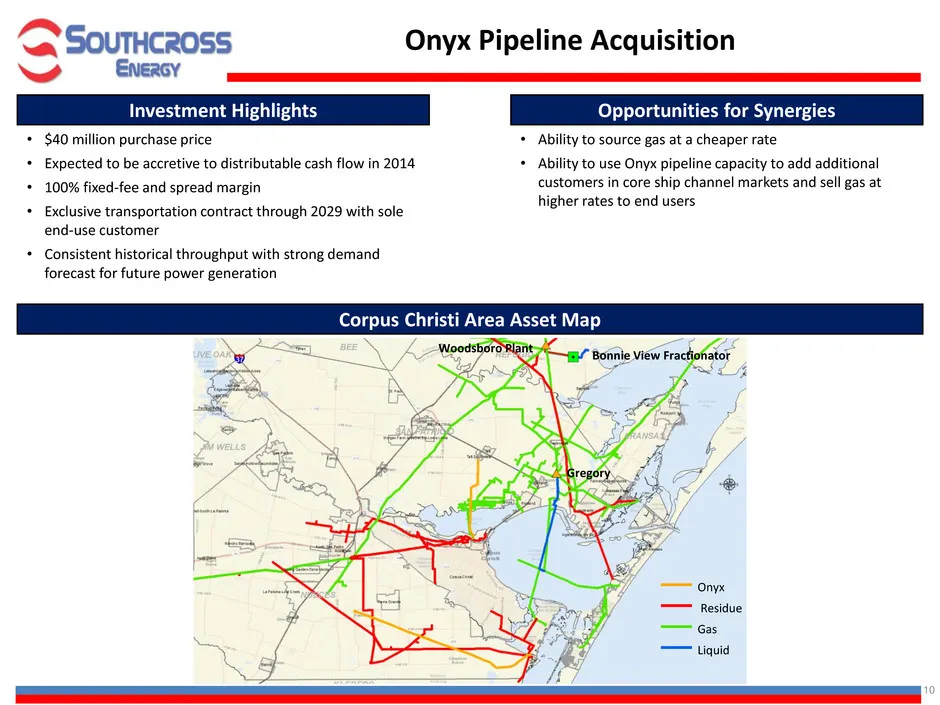
10 Onyx Pipeline Acquisition Corpus Christi Area Asset Map Investment Highlights Opportunities for Synergies • $40 million purchase price • Expected to be accretive to distributable cash flow in 2014 • 100% fixed-fee and spread margin • Exclusive transportation contract through 2029 with sole end-us
Slide 12: Growth Focus
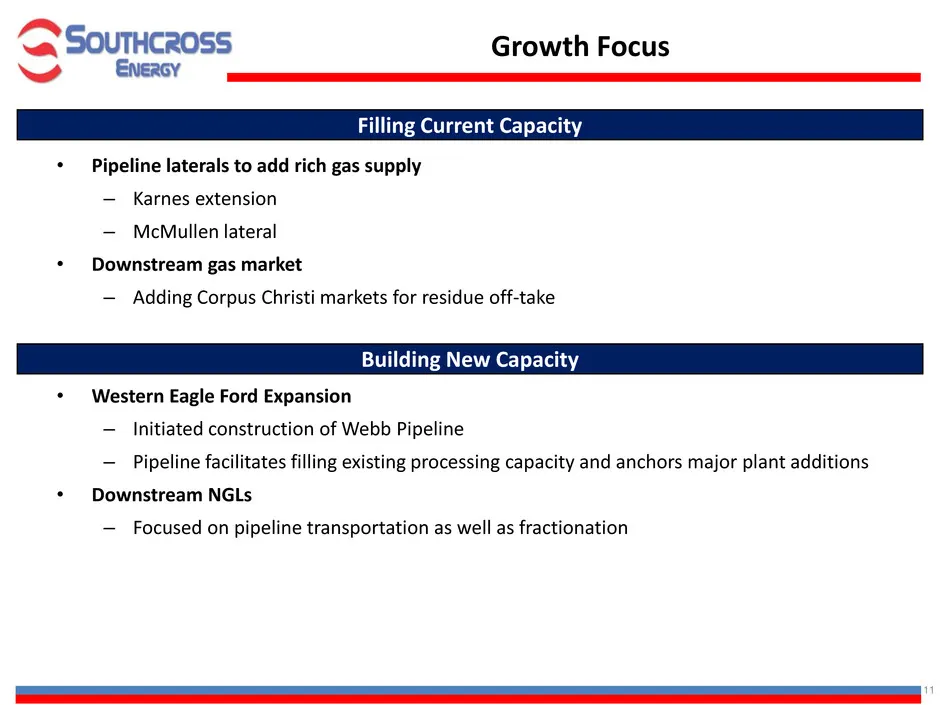
11 Growth Focus • Pipeline laterals to add rich gas supply – Karnes extension – McMullen lateral • Downstream gas market – Adding Corpus Christi markets for residue off-take • Western Eagle Ford Expansion – Initiated construction of Webb Pipeline – Pipeline facilitates filling existing processing ca
Slide 13: Western Eagle Ford Expansion
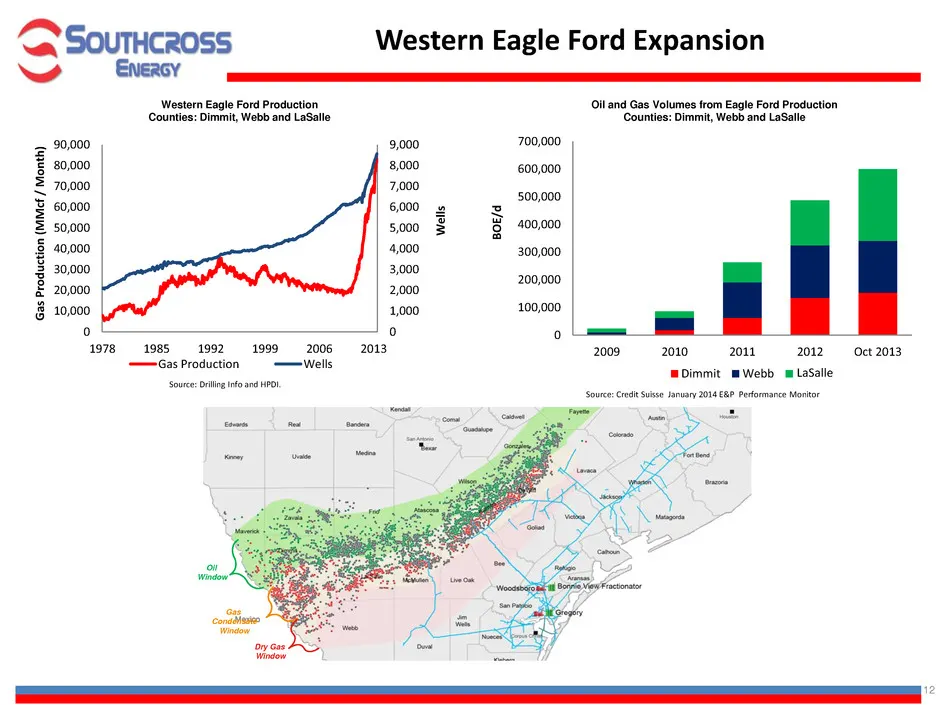
12 0 1,000 2,000 3,000 4,000 5,000 6,000 7,000 8,000 9,000 0 10,000 20,000 30,000 40,000 50,000 60,000 70,000 80,000 90,000 1978 1985 1992 1999 2006 2013 Gas Production Wells B O E/ d Source: Drilling Info and HPDI. We lls Gas P ro d u ctio n ( M M cf / M o n th ) Western Eagle Ford Expansion Oil an
Slide 14: Expansion of Southcross Eagle Ford Footprint
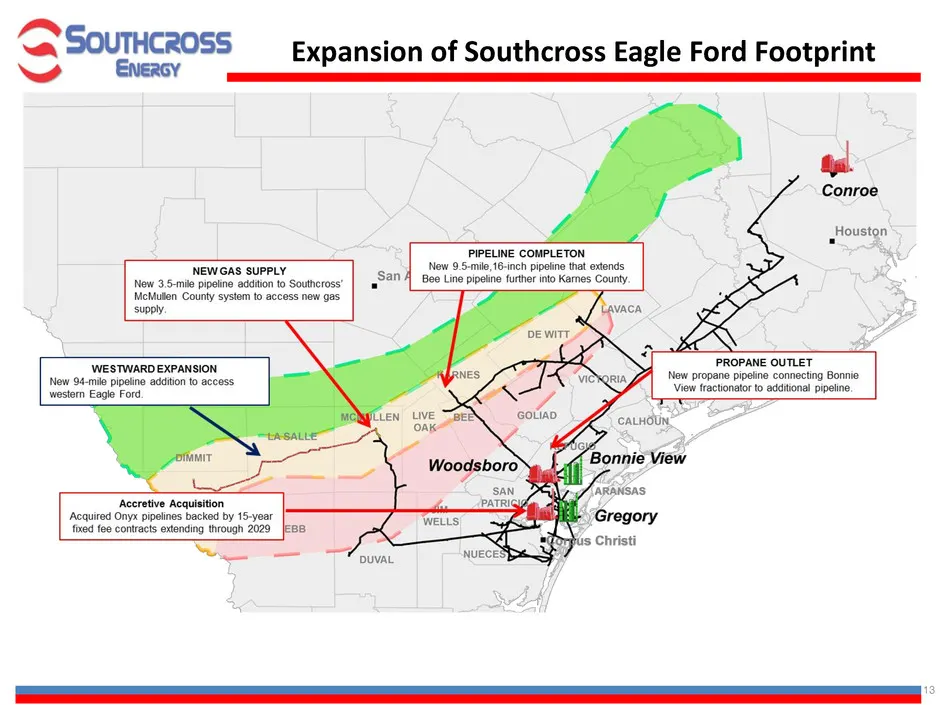
13 Expansion of Southcross Eagle Ford Footprint
Slide 15: Attractive Residue and Dry Gas Downstream
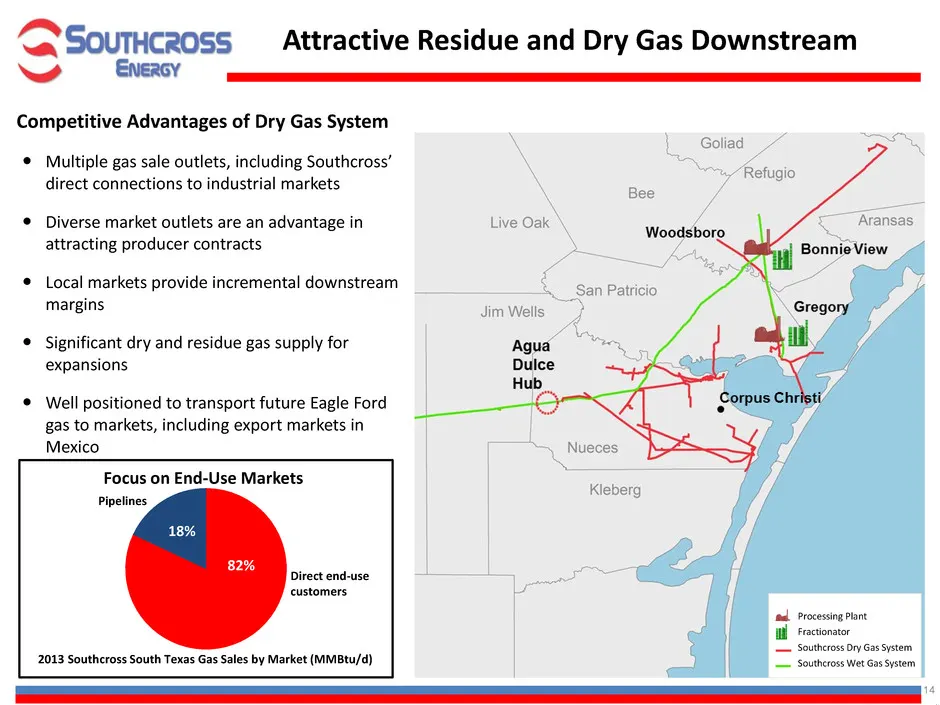
14 Multiple gas sale outlets, including Southcross’ direct connections to industrial markets Diverse market outlets are an advantage in attracting producer contracts Local markets provide incremental downstream margins Significant dry and residue gas supply for expansions Well positioned t
Slide 16: Direct Access to Attractive NGL Markets
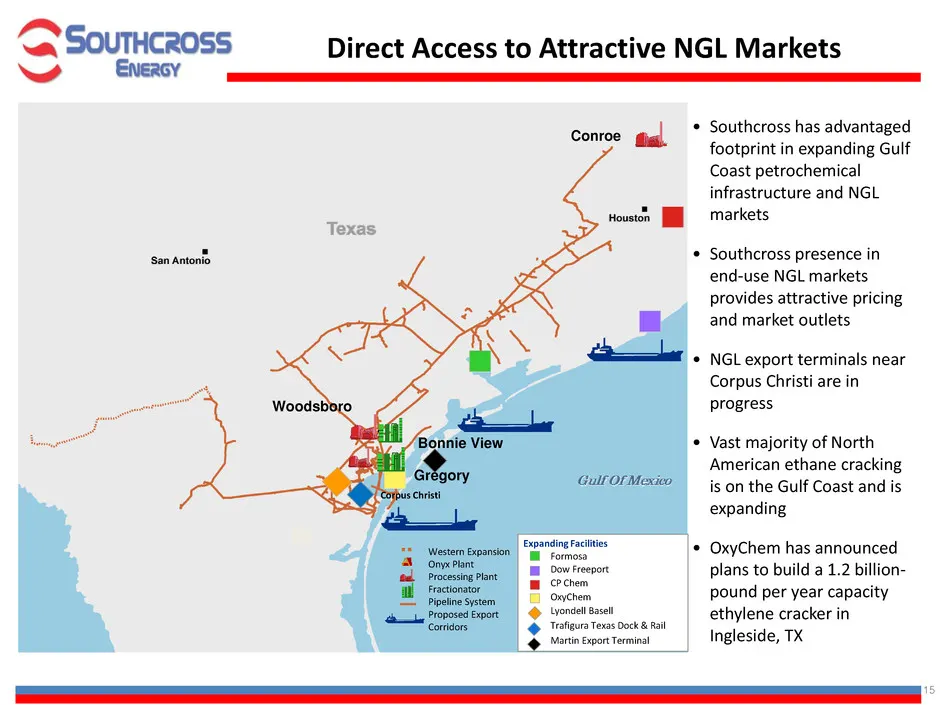
15 Western Expansion Onyx Plant Processing Plant Fractionator Pipeline System Proposed Export Corridors Woodsboro Bonnie View Gregory Corpus Christi Expanding Facilities Formosa Dow Freeport CP Chem OxyChem Lyondell Basell Trafigura Texas Dock & Rail Martin Export Terminal • Southcross has advantage
Slide 17: Growing NGL Markets in US and for Export
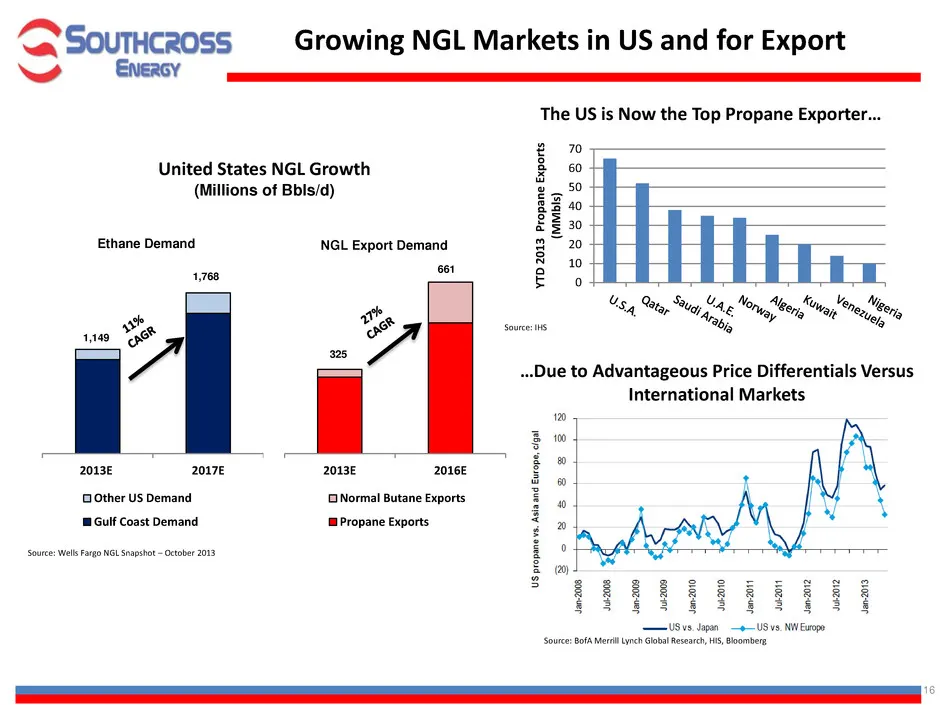
16 2013E 2016E Normal Butane Exports Propane Exports 2013E 2017E Other US Demand Gulf Coast Demand Growing NGL Markets in US and for Export United States NGL Growth (Millions of Bbls/d) Source: Wells Fargo NGL Snapshot – October 2013 The US is Now the Top Propane Exporter… Source: IHS Ethane Demand
Slide 18: Comparative Yield
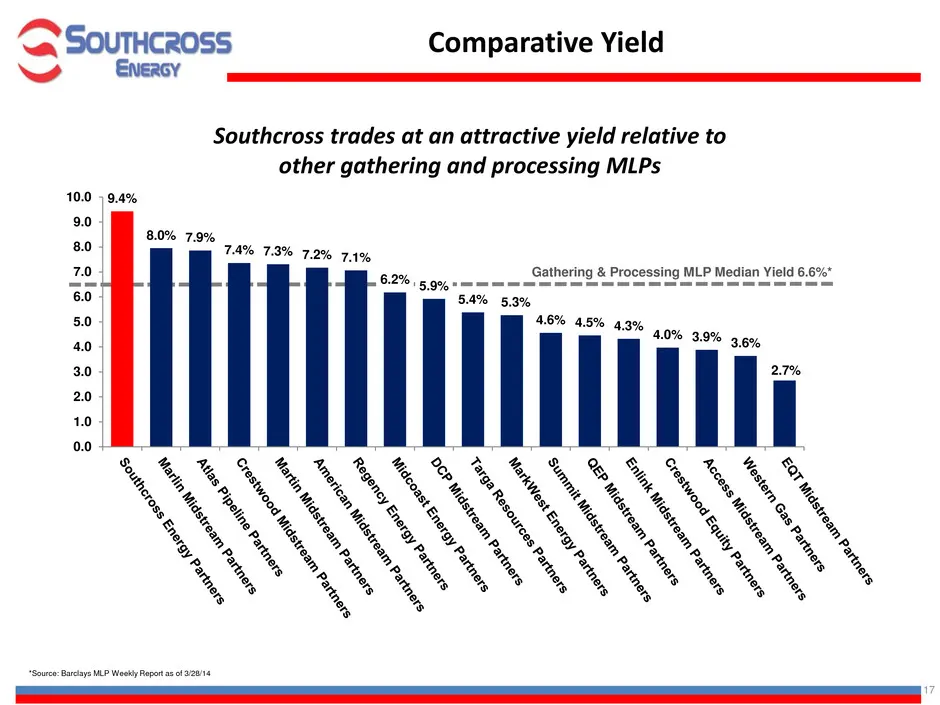
17 Comparative Yield Southcross trades at an attractive yield relative to other gathering and processing MLPs Gathering & Processing MLP Median Yield 6.6%* *Source: Barclays MLP Weekly Report as of 3/28/14 9.4% 8.0% 7.9% 7.4% 7.3% 7.2% 7.1% 6.2% 5.9% 5.4% 5.3% 4.6% 4.5% 4.3% 4.0% 3.9% 3.6% 2.7% 0.0
Slide 19: Southcross Investment Summary
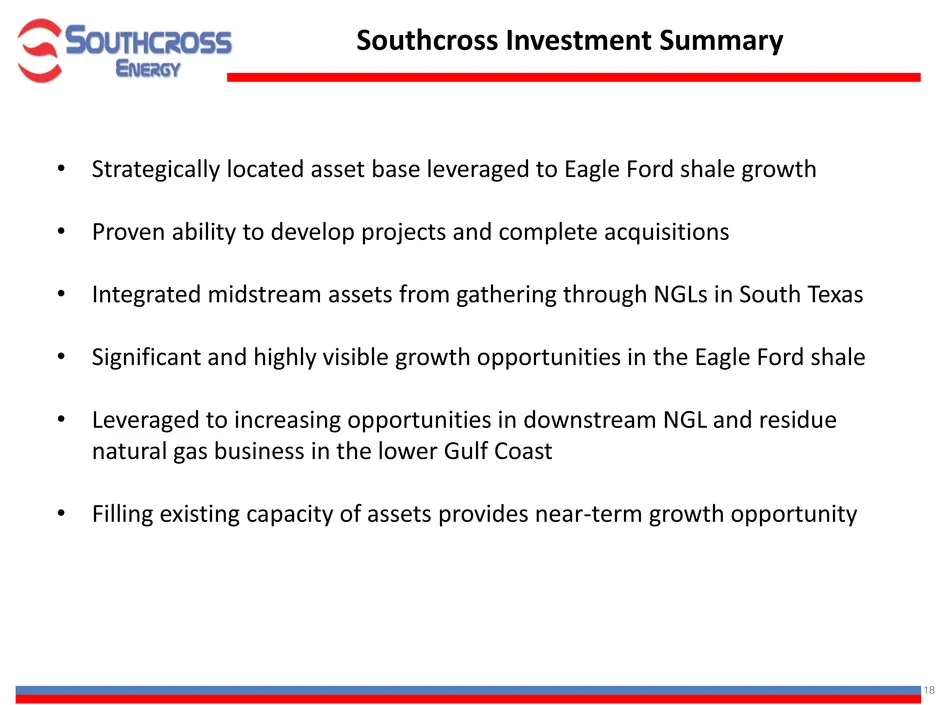
18 Southcross Investment Summary • Strategically located asset base leveraged to Eagle Ford shale growth • Proven ability to develop projects and complete acquisitions • Integrated midstream assets from gathering through NGLs in South Texas • Significant and highly visible growth opportunities in th
Slide 20: Southcross' Fact Sheet
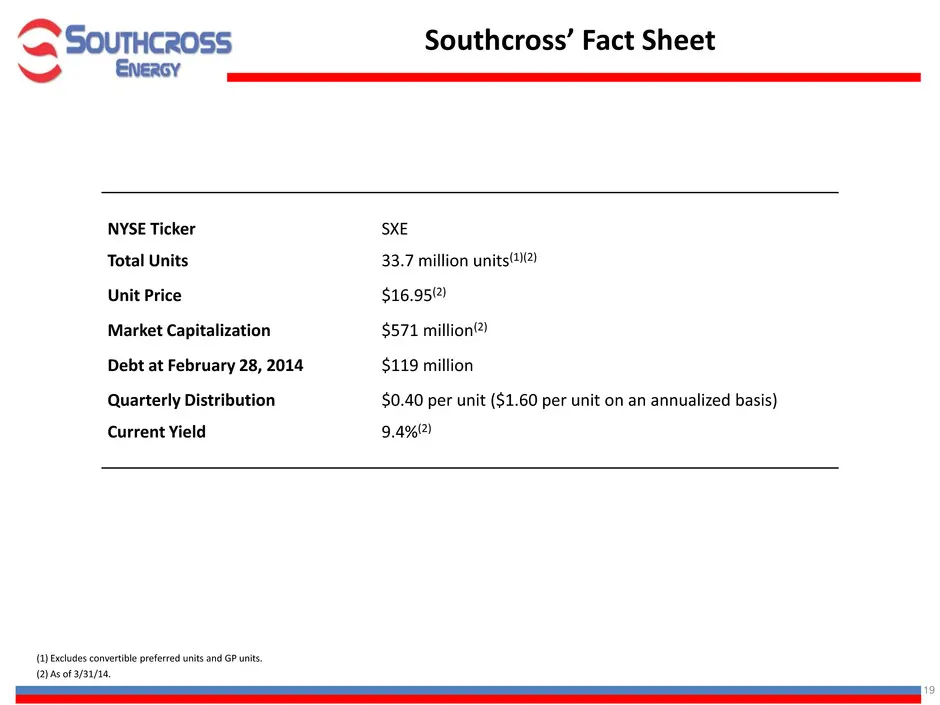
19 Southcross’ Fact Sheet NYSE Ticker SXE Total Units 33.7 million units(1)(2) Unit Price $16.95(2) Market Capitalization $571 million(2) Debt at February 28, 2014 $119 million Quarterly Distribution $0.40 per unit ($1.60 per unit on an annualized basis) Current Yield 9.4%(2) (2) As of 3/31/14. (1)
Slide 21: Appendix
> Soutuceross ww Enercy Appendix
Slide 22: Alabama & Mississippi
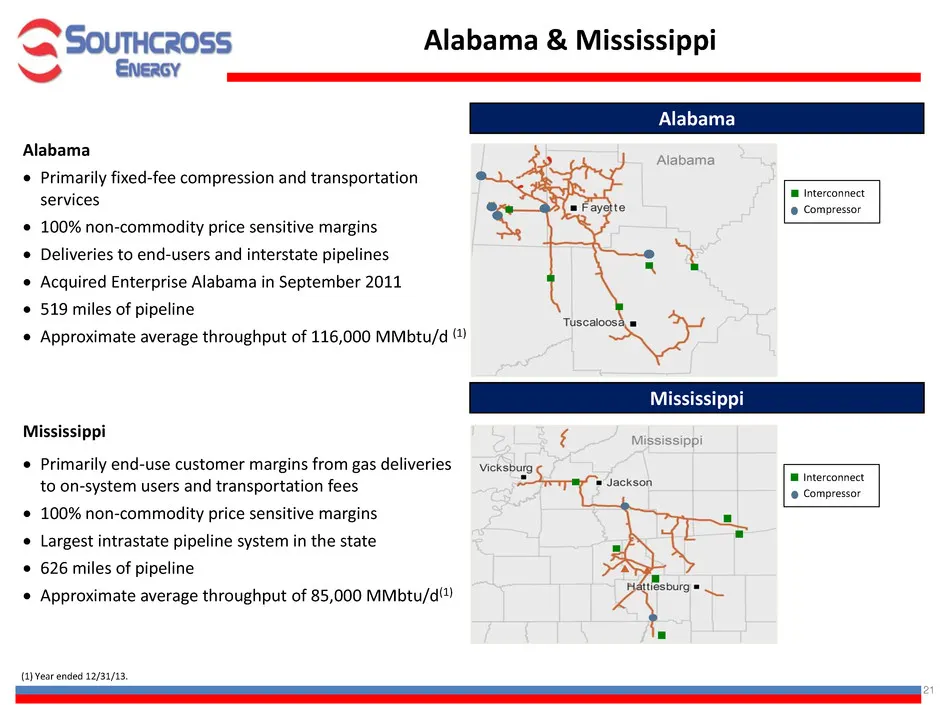
21 Alabama Primarily fixed-fee compression and transportation services 100% non-commodity price sensitive margins Deliveries to end-users and interstate pipelines Acquired Enterprise Alabama in September 2011 519 miles of pipeline Approximate average throughput of 116,000 MMbtu/d (1) Ala
Slide 23: Typical Southcross Gas Supply Contract
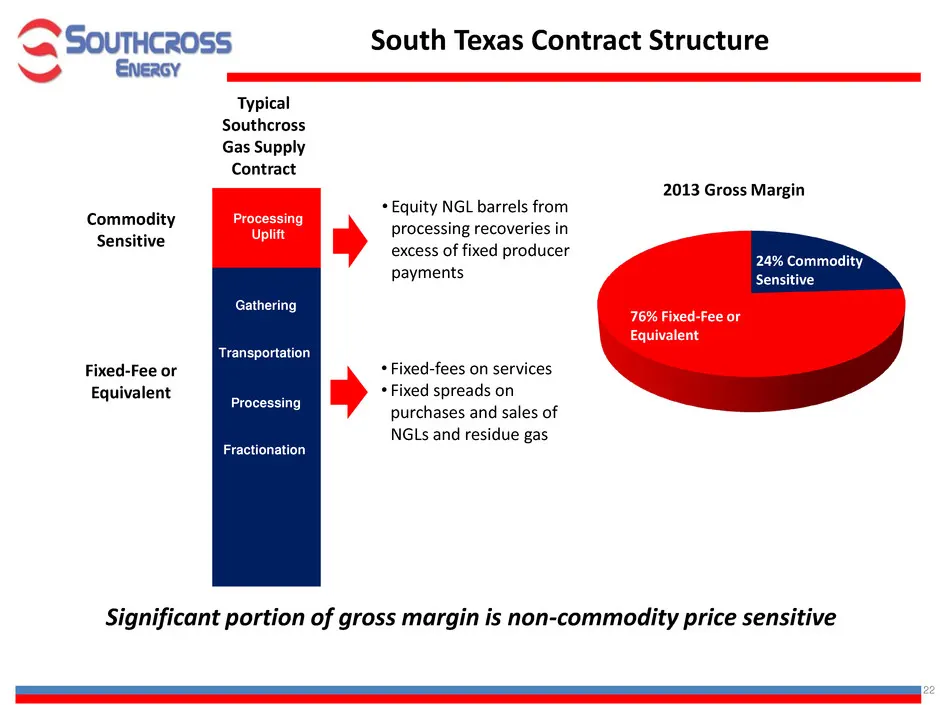
22 Commodity Sensitive Typical Southcross Gas Supply Contract Significant portion of gross margin is non-commodity price sensitive Processing Uplift Gathering Transportation Processing Fractionation Fixed-Fee or Equivalent South Texas Contract Structure 2013 Gross Margin 76% Fixed-Fee or Equivalent
Slide 24: Attractive Contract Structure and Customer Base
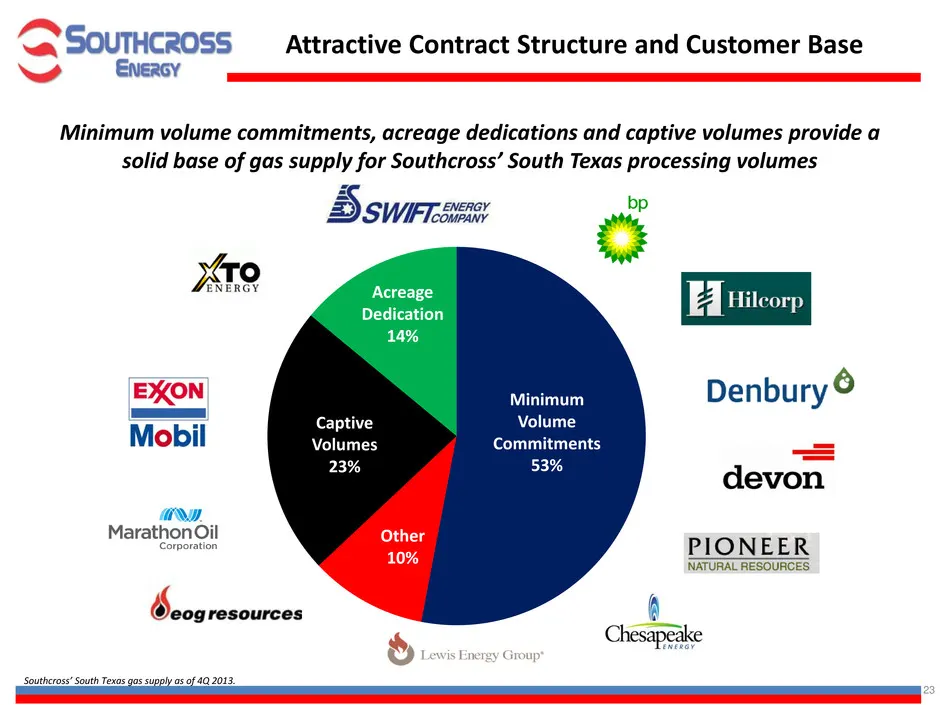
23 Southcross’ South Texas gas supply as of 4Q 2013. Attractive Contract Structure and Customer Base Captive Volumes 23% Minimum volume commitments, acreage dedications and captive volumes provide a solid base of gas supply for Southcross’ South Texas processing volumes Other 10% Acreage Dedication
Slide 25: Non-GAAP Measures
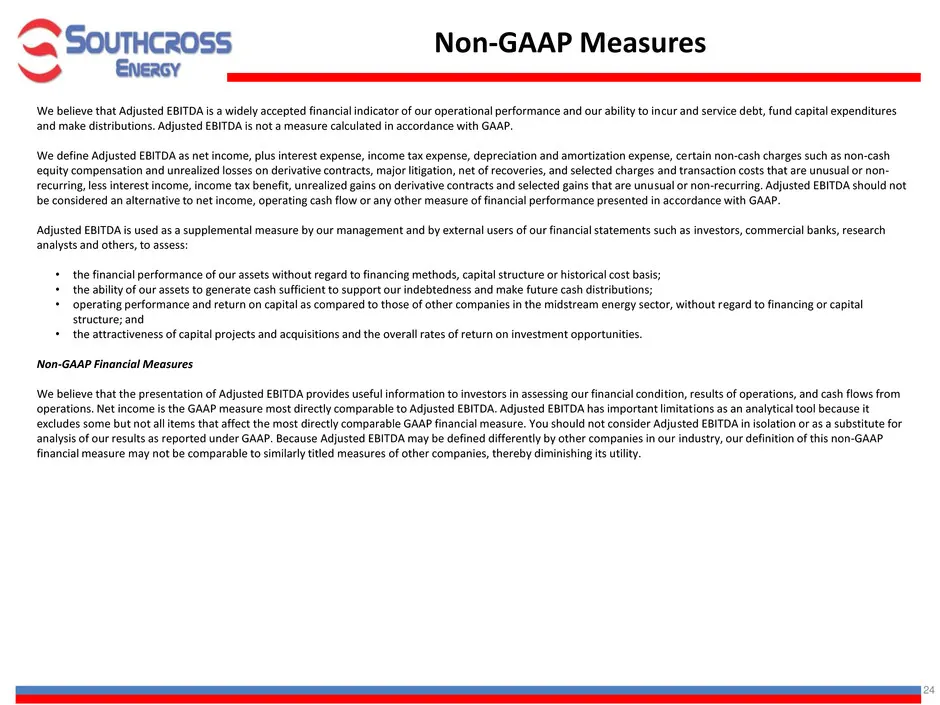
24 Non-GAAP Measures We believe that Adjusted EBITDA is a widely accepted financial indicator of our operational performance and our ability to incur and service debt, fund capital expenditures and make distributions. Adjusted EBITDA is not a measure calculated in accordance with GAAP. We define Adj
Slide 26: Reconciliation to Adjusted EBITDA
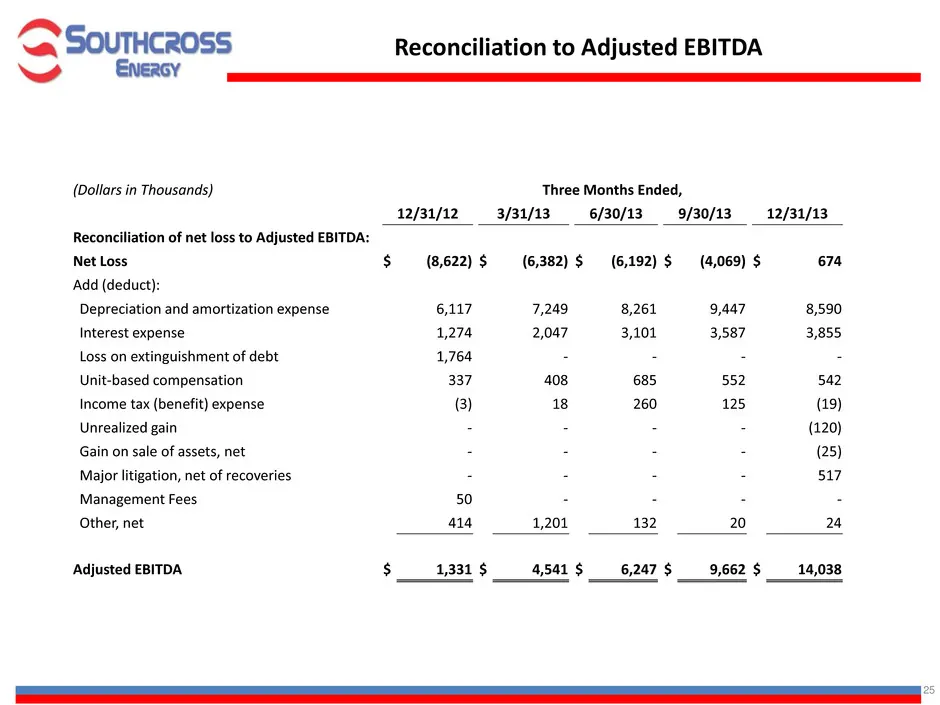
25 Reconciliation to Adjusted EBITDA (Dollars in Thousands) Three Months Ended, 12/31/12 3/31/13 6/30/13 9/30/13 12/31/13 Reconciliation of net loss to Adjusted EBITDA: Net Loss $ (8,622) $ (6,382) $ (6,192) $ (4,069) $ 674 Add (deduct): Depreciation and amortization expense 6,117 7,249 8,261 9,447
Source: SEC EDGAR · 8-K filed Apr 2, 2014
More decks from Southcross Energy Partners L.P
 Merger or Acquisition (February 2018)10 slides · Feb 5, 2018
 Merger or Acquisition (November 2017)17 slides · Nov 2, 2017
 RBC Dallas Investor Meeting July 201526 slides · Jul 16, 2015
 NAPTP 2015 MLP Investor Conference27 slides · May 20, 2015
 Investor Presentation (April 2015)20 slides · Apr 21, 2015
 2014 Wells Fargo Energy Symposium23 slides · Dec 9, 2014