Avaya — Q3 FY2020 Earnings Presentation
28 slides from Avaya's earnings presentation, Aug 10, 2020

Slide 1: Investor Presentation 3Q FY20
Investor Presentation 3Q FY20 August 10, 2020 © 2020 Avaya Inc. All rights reserved Exhibit 99.2

Slide 2: Cautionary Note Regarding Forward-Looking Statements
TEXT 0 – 0 – 0 204-0-0 127-127-127 17-114-210 80-200-74 86-183-242 247-150-70 Cautionary Note Regarding Forward-Looking Statements This release contains certain “forward-looking statements.” All statements other than statements of historical fact are “forward-looking” statements for purposes of the
Slide 3: Use of non-GAAP (Adjusted) Financial Measures
TEXT 0 – 0 – 0 204-0-0 127-127-127 17-114-210 80-200-74 86-183-242 247-150-70 Use of non-GAAP (Adjusted) Financial Measures The information furnished in this presentation includes non-GAAP financial measures that differ from measures calculated in accordance with generally accepted accounting princi
Slide 4: Avaya at a Glance
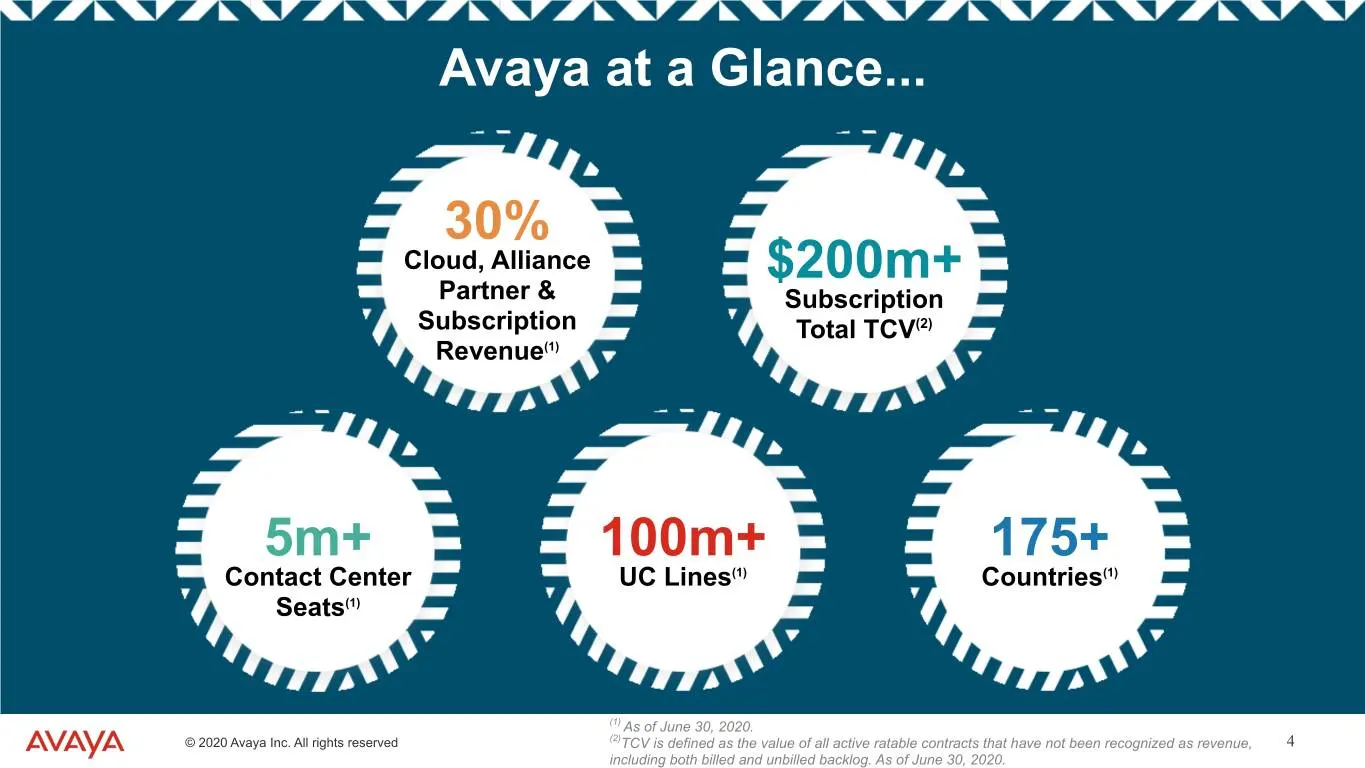
TEXT 0 – 0 – 0 204-0-0 127-127-127 17-114-210 80-200-74 86-183-242 247-150-70 Avaya at a Glance... 30% Cloud, Alliance $200m+ Partner & Subscription Subscription Total TCV(2) Revenue(1) 5m+ 100m+ 175+ Contact Center UC Lines(1) Countries(1) Seats(1) (1) As of June 30, 2020. © 2020 Avaya Inc. All rig
Slide 5: Avaya's Four Strategic Pillars
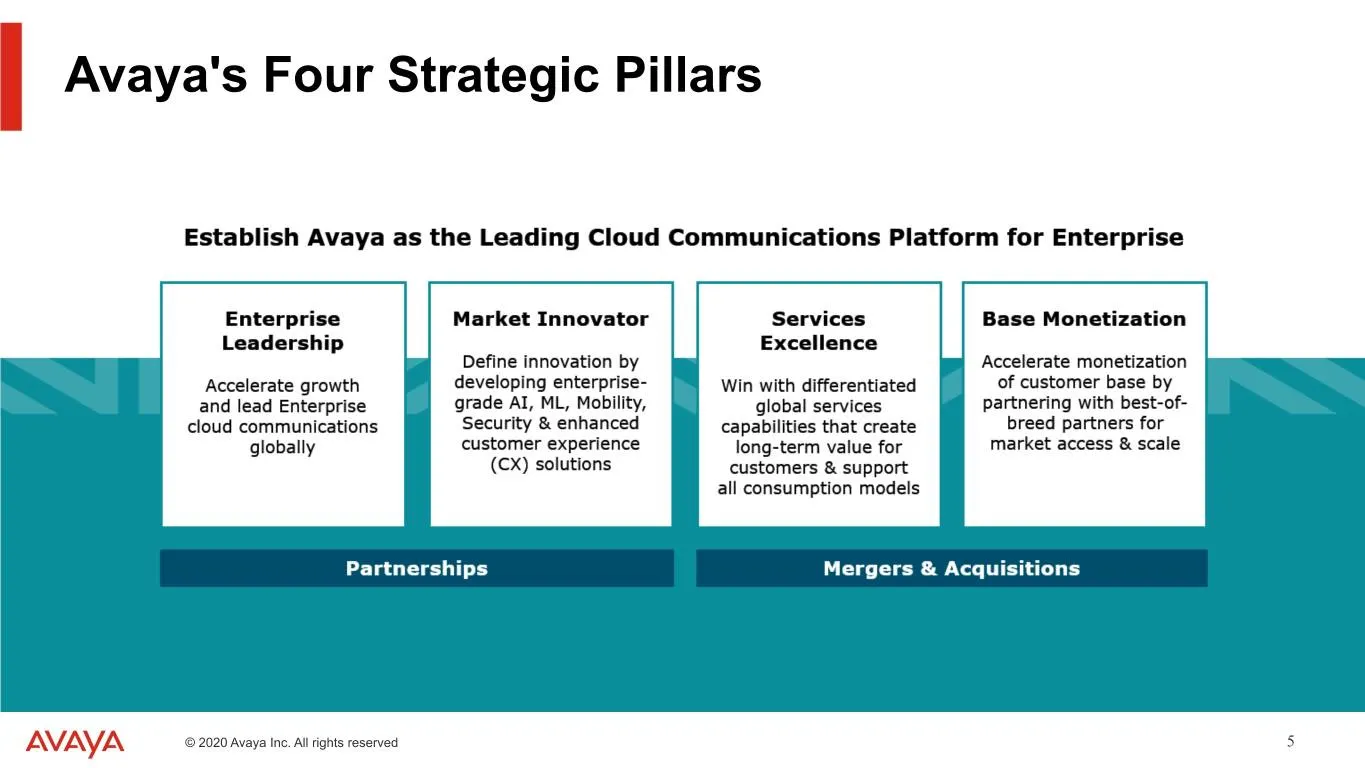
TEXT 0 – 0 – 0 204-0-0 127-127-127 17-114-210 80-200-74 86-183-242 247-150-70 Avaya's Four Strategic Pillars © 2020 Avaya Inc. All rights reserved 5
Slide 6: 17-114-210 80-200-74 86-183-242 247-150-70
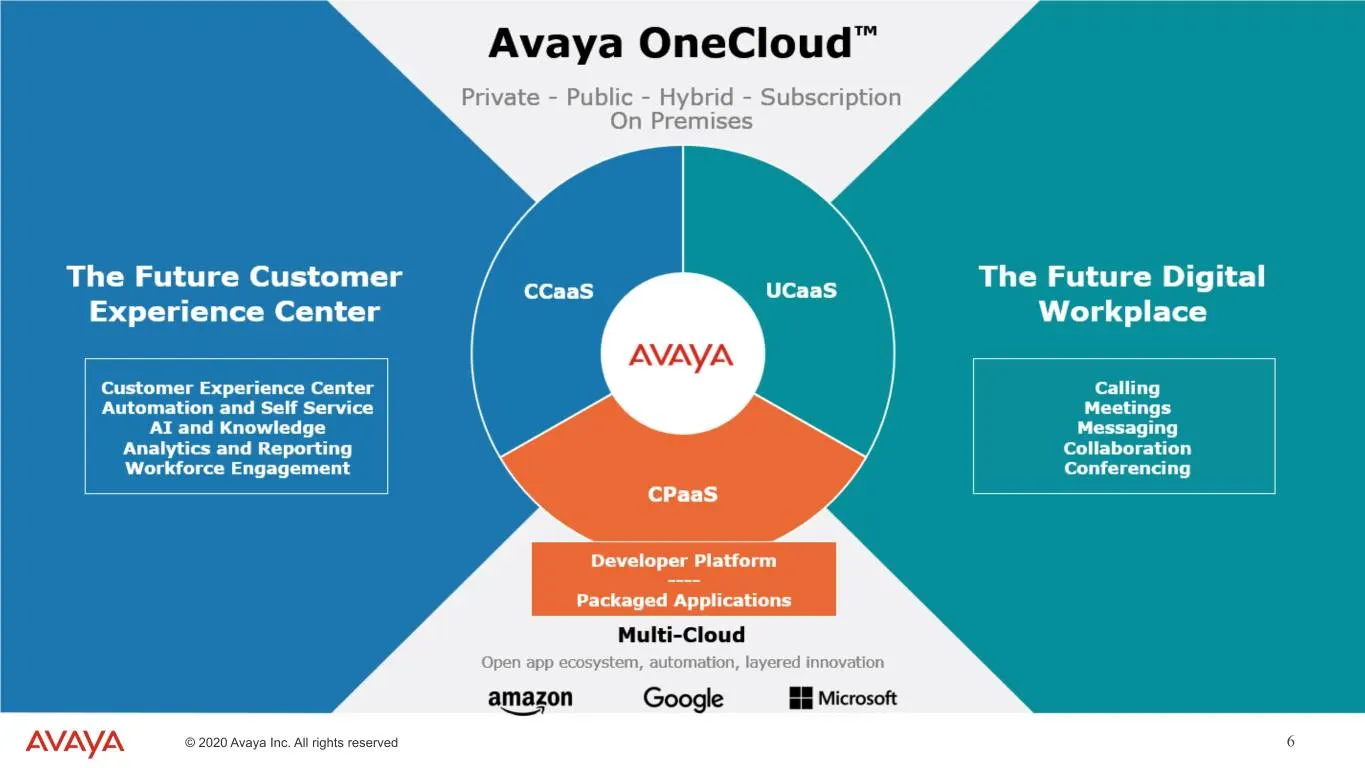
TEXT 0 – 0 – 0 204-0-0 127-127-127 17-114-210 80-200-74 86-183-242 247-150-70 © 2020 Avaya Inc. All rights reserved 6
Slide 7: Avaya Cloud Office Differentiation
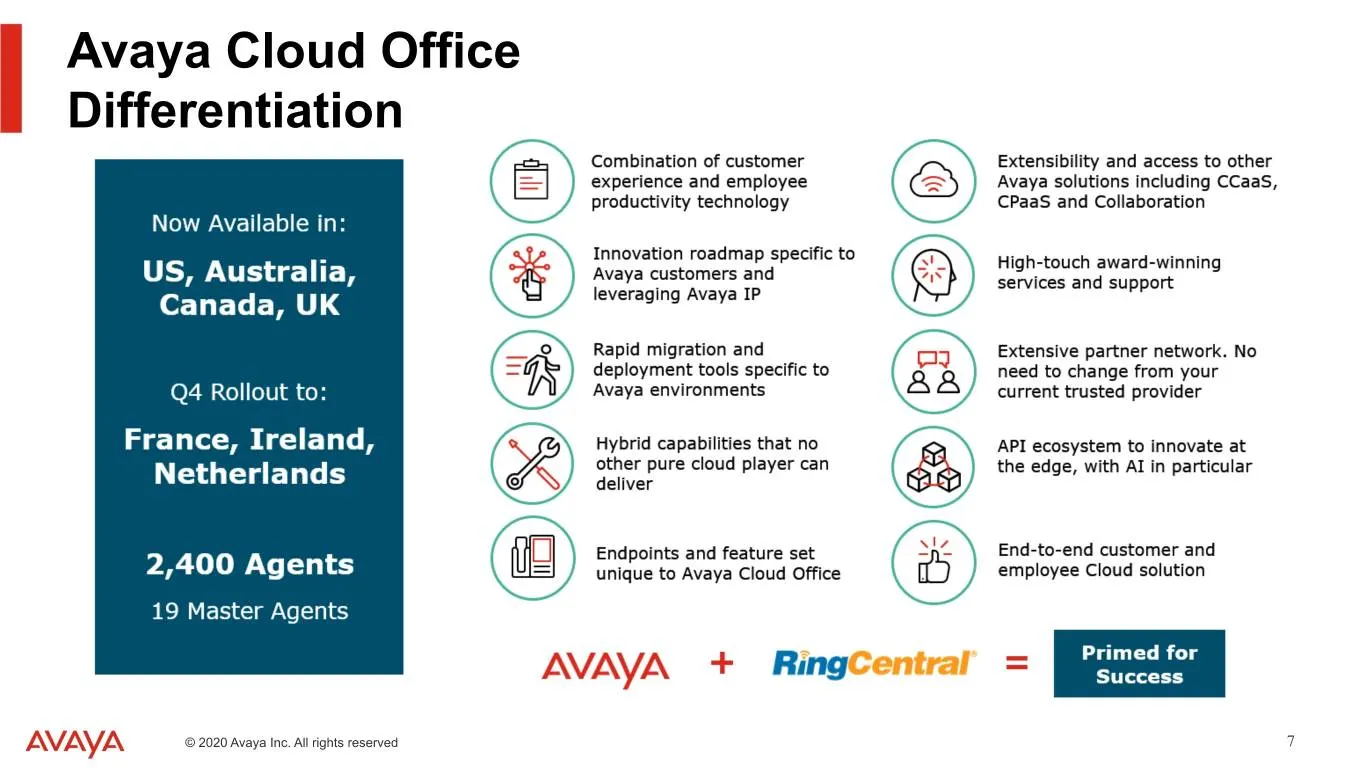
TEXT 0 – 0 – 0 204-0-0 127-127-127 17-114-210 80-200-74 86-183-242 247-150-70 Avaya Cloud Office Differentiation © 2020 Avaya Inc. All rights reserved 7

Slide 8: Why Avaya Wins
TEXT 0 – 0 – 0 204-0-0 127-127-127 17-114-210 80-200-74 86-183-242 247-150-70 Why Avaya Wins ▪ Deep and wide ecosystem ▪ Trusted and scalable ▪ Global service – reliable, secure and compliant ▪ Single, integrated multi-cloud platform ▪ UCaaS – CCaaS – CPaaS ▪ Flexibility through cloud & consumption

Slide 9: Financial Overview 3Q FY20
TEXT 0 – 0 – 0 204-0-0 127-127-127 17-114-210 80-200-74 86-183-242 247-150-70 Financial Overview 3Q FY20 © 2020 Avaya Inc. All rights reserved 9
Slide 10: 3Q FY20 Financial Highlights
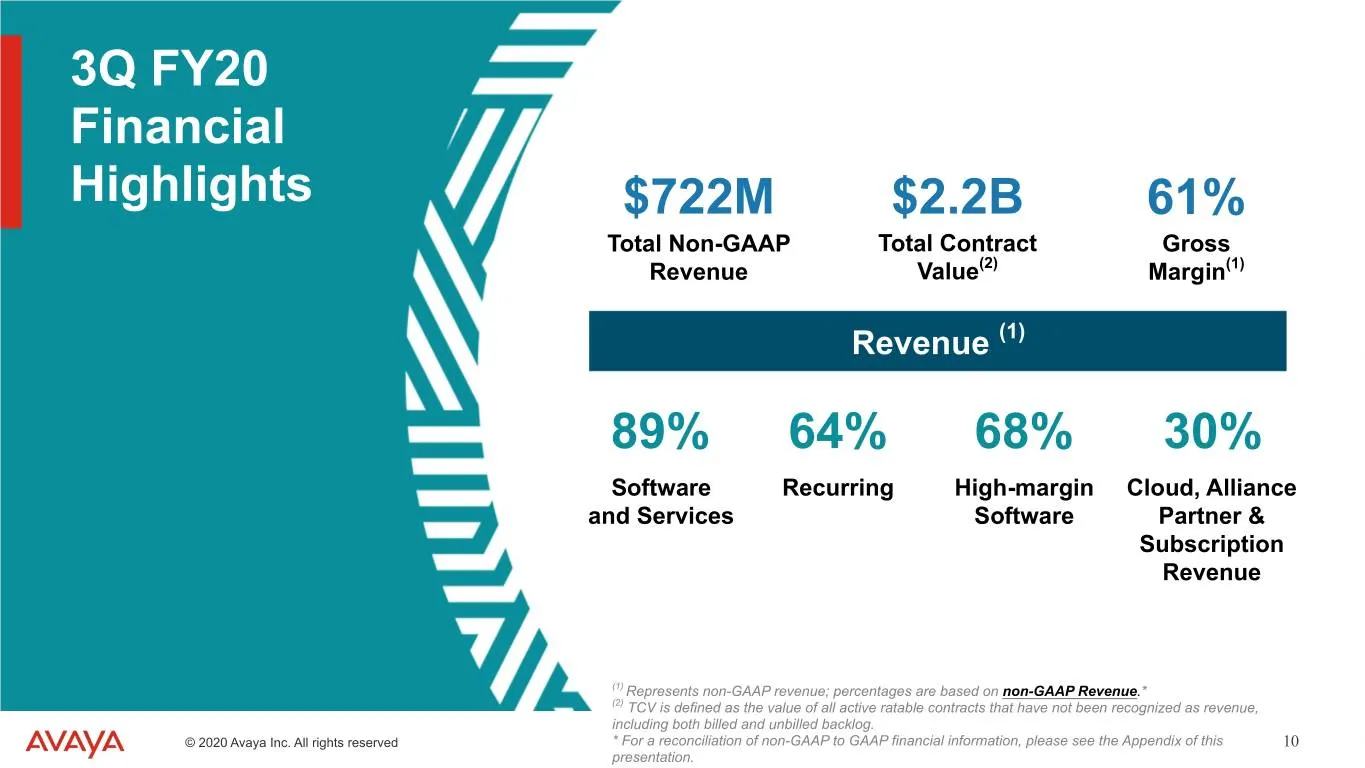
TEXT 0 – 0 – 0 204-0-0 127-127-127 17-114-210 80-200-74 86-183-242 247-150-70 3Q FY20 Financial Highlights $722M $2.2B 61% Total Non-GAAP Total Contract Gross Revenue Value(2) Margin(1) Revenue (1) 89% 64% 68% 30% Software Recurring High-margin Cloud, Alliance and Services Software Partner & Subscri
Slide 11: Financial Strength & Flexibility
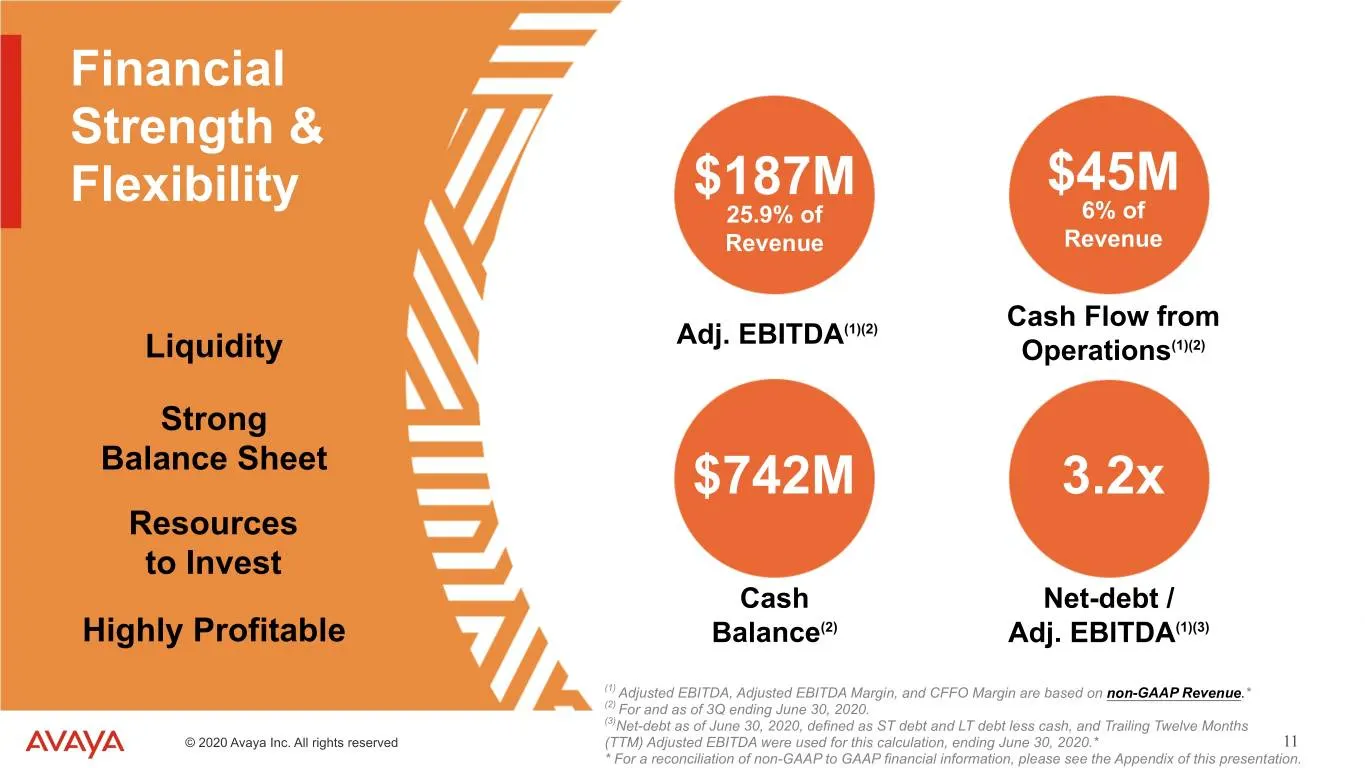
TEXT 0 – 0 – 0 204-0-0 127-127-127 17-114-210 80-200-74 86-183-242 247-150-70 Financial Strength & Flexibility $187M $45M 25.9% of 6% of Revenue Revenue Cash Flow from Adj. EBITDA(1)(2) Liquidity Operations(1)(2) Strong Balance Sheet $742M 3.2x Resources to Invest Cash Net-debt / Highly Profitable B
Slide 12: Capital Allocation
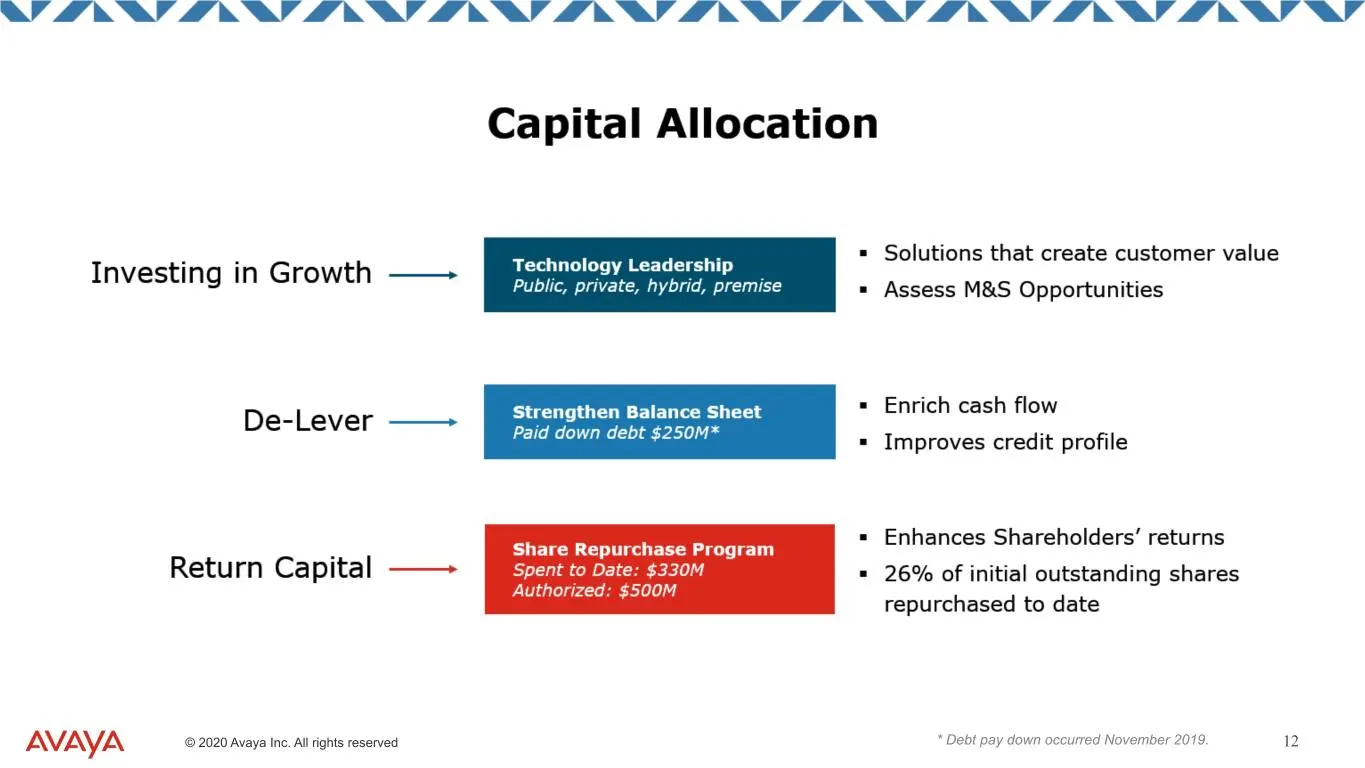
TEXT 0 – 0 – 0 204-0-0 127-127-127 17-114-210 80-200-74 86-183-242 247-150-70 Capital Allocation © 2020 Avaya Inc. All rights reserved * Debt pay down occurred November 2019. 12
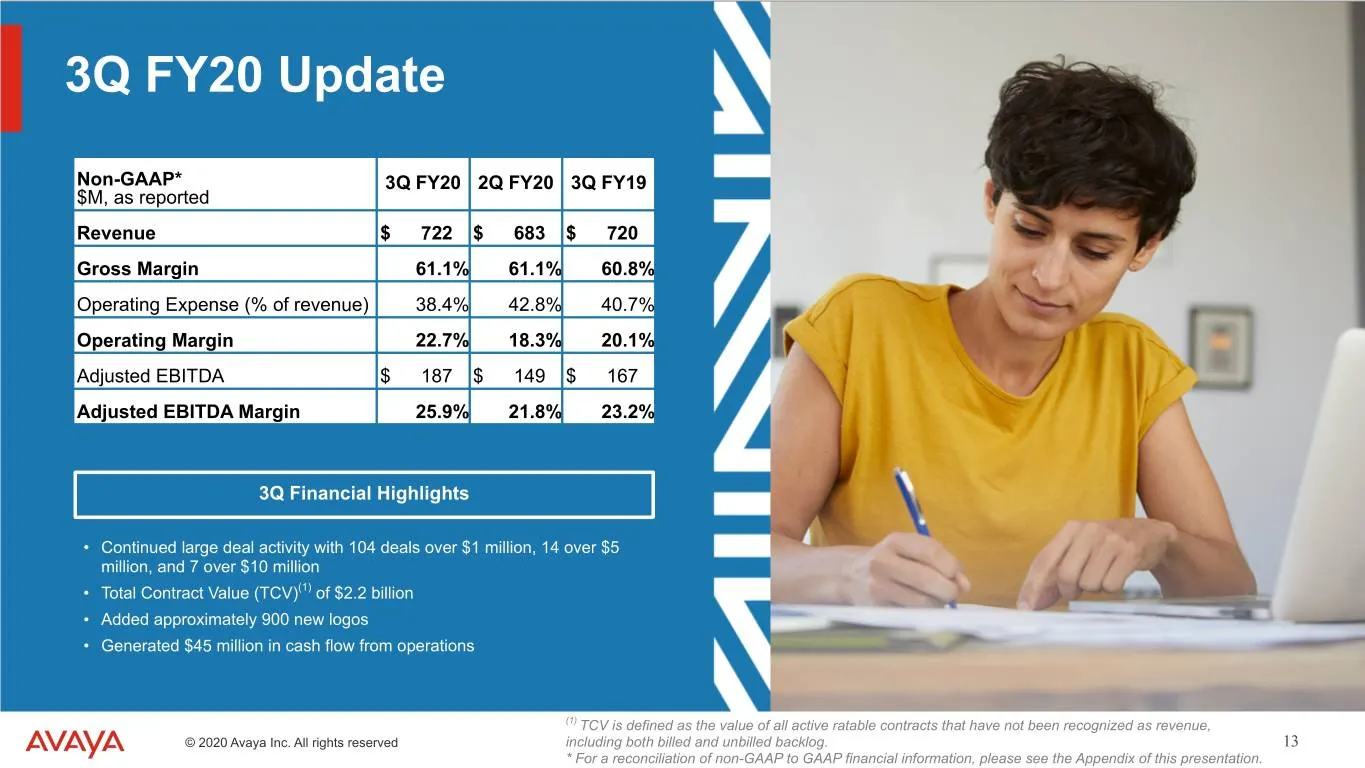
Slide 13: 3Q FY20 Update
TEXT 0 – 0 – 0 204-0-0 127-127-127 17-114-210 80-200-74 86-183-242 247-150-70 3Q FY20 Update Non-GAAP* 3Q FY20 2Q FY20 3Q FY19 $M, as reported Revenue $ 722 $ 683 $ 720 Gross Margin 61.1% 61.1% 60.8% Operating Expense (% of revenue) 38.4% 42.8% 40.7% Operating Margin 22.7% 18.3% 20.1% Adjusted EBITD
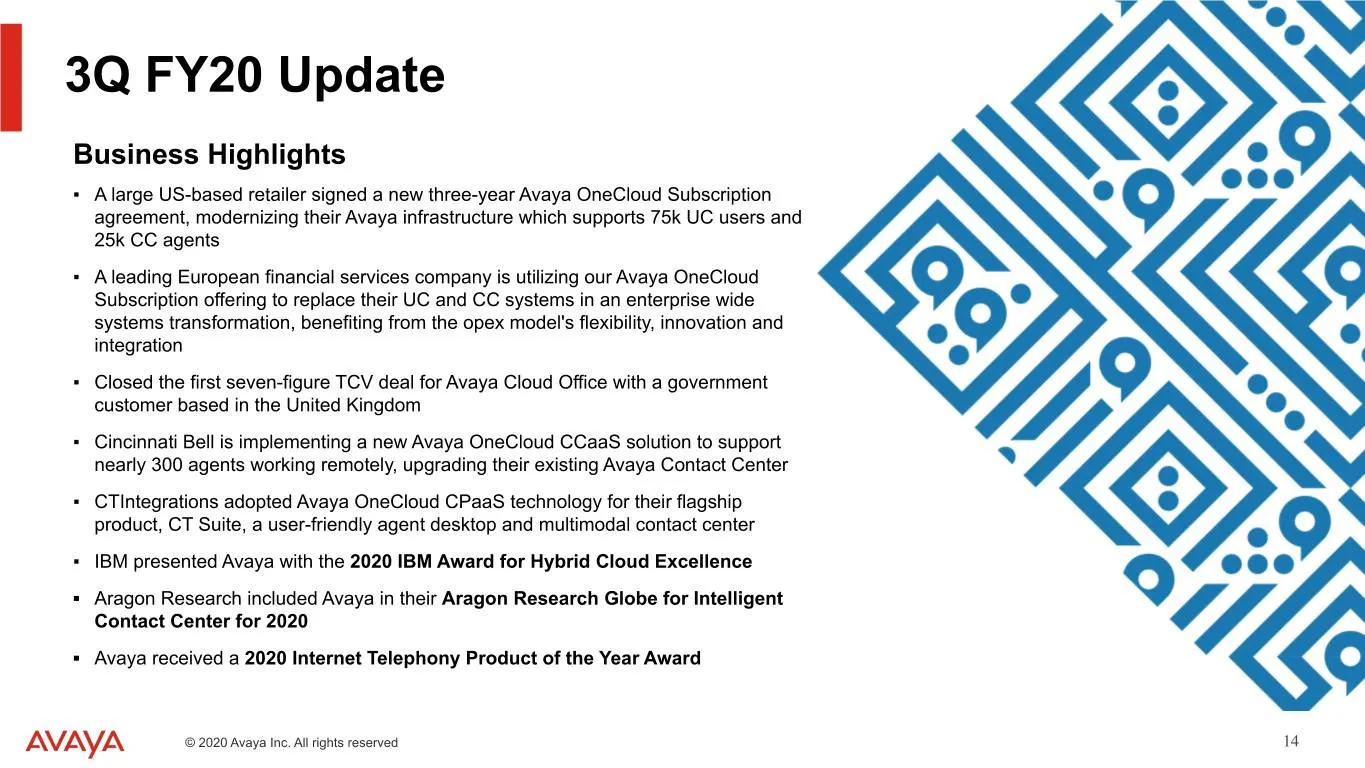
Slide 14: 3Q FY20 Update Business Highlights
TEXT 0 – 0 – 0 204-0-0 127-127-127 17-114-210 80-200-74 86-183-242 247-150-70 3Q FY20 Update Business Highlights ▪ A large US-based retailer signed a new three-year Avaya OneCloud Subscription agreement, modernizing their Avaya infrastructure which supports 75k UC users and 25k CC agents ▪ A leading
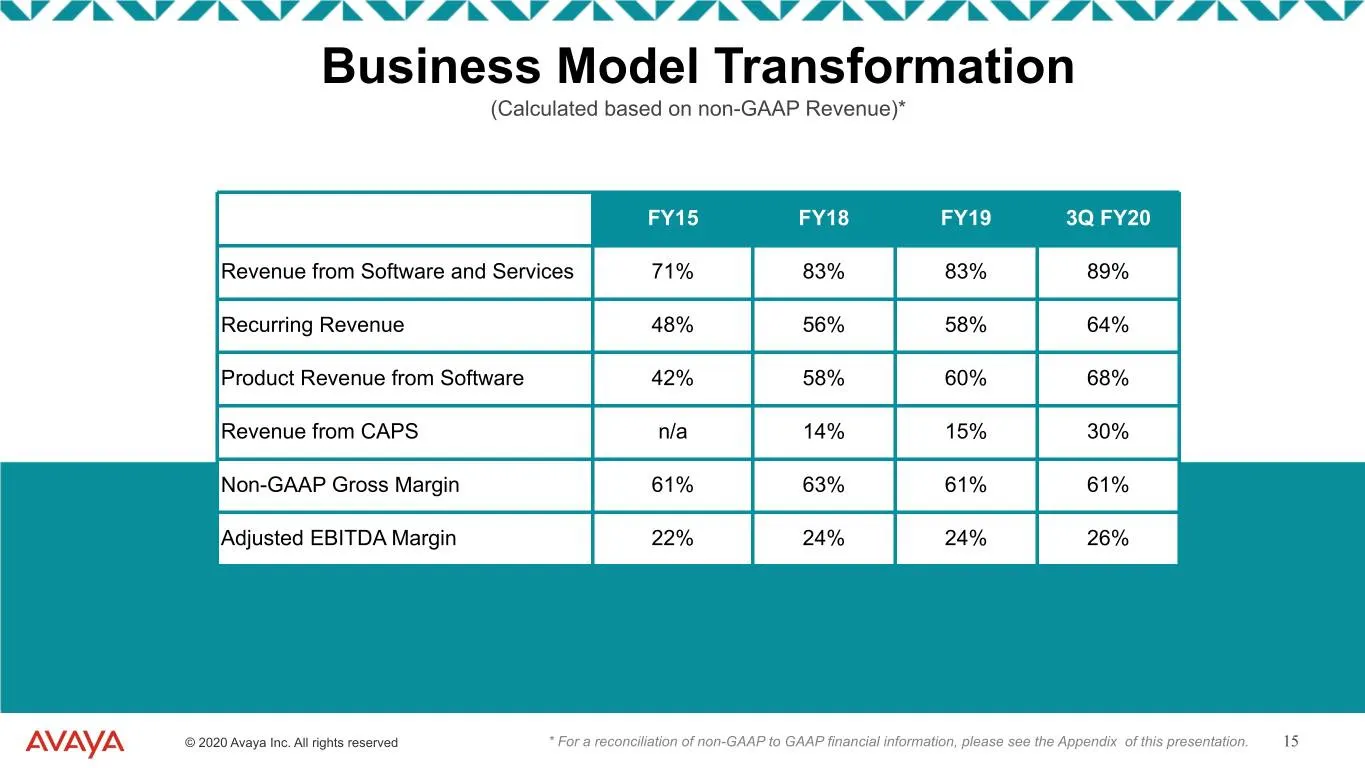
Slide 15: Business Model Transformation
TEXT 0 – 0 – 0 204-0-0 127-127-127 17-114-210 80-200-74 86-183-242 247-150-70 Business Model Transformation (Calculated based on non-GAAP Revenue)* FY15 FY18 FY19 3Q FY20 Revenue from Software and Services 71% 83% 83% 89% Recurring Revenue 48% 56% 58% 64% Product Revenue from Software 42% 58% 60% 68
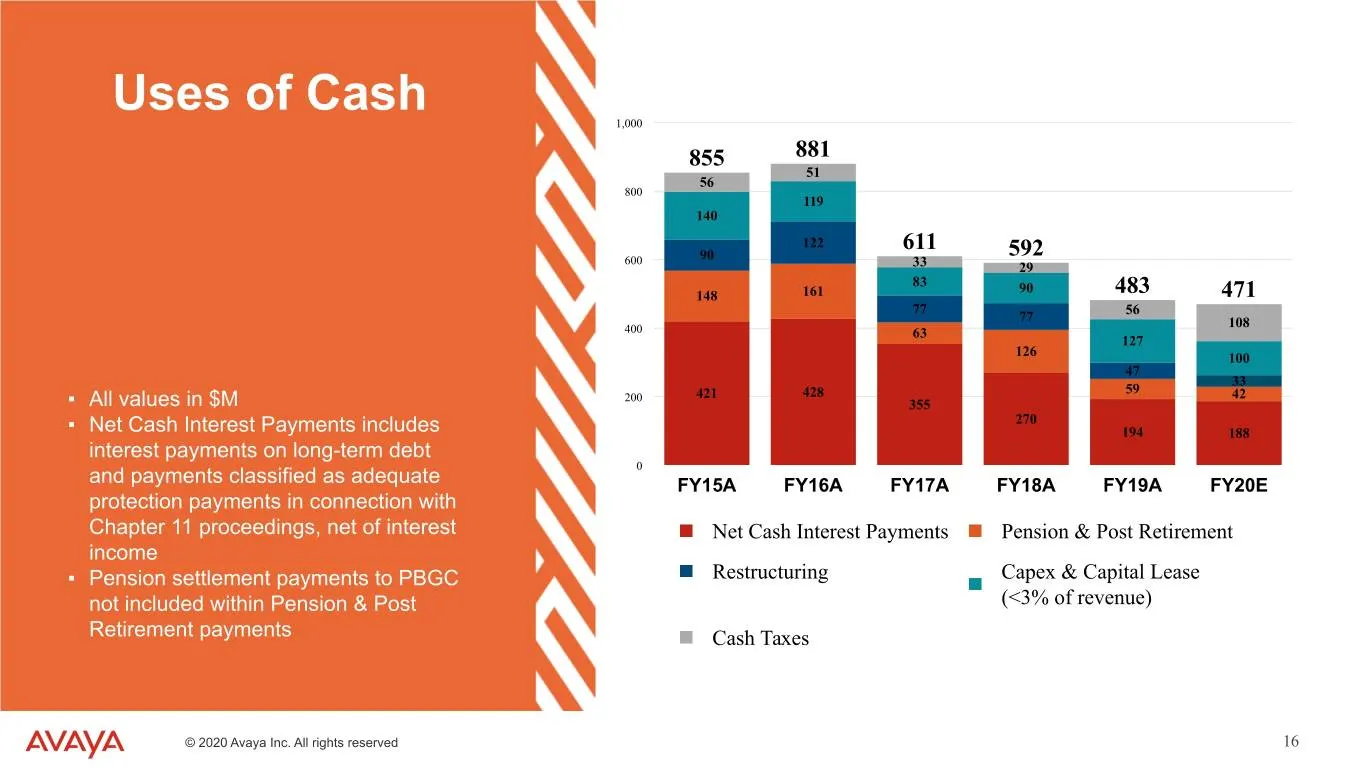
Slide 16: Uses of Cash
TEXT 0 – 0 – 0 204-0-0 127-127-127 17-114-210 80-200-74 86-183-242 247-150-70 Uses of Cash 1,000 855 881 51 56 800 119 140 122 611 592 600 90 33 29 83 90 148 161 483 471 77 56 77 108 400 63 127 126 100 47 33 59 200 421 428 42 ▪ All values in $M 355 270 ▪ Net Cash Interest Payments includes 194 188 i
Slide 17: Quarterly Income Statement
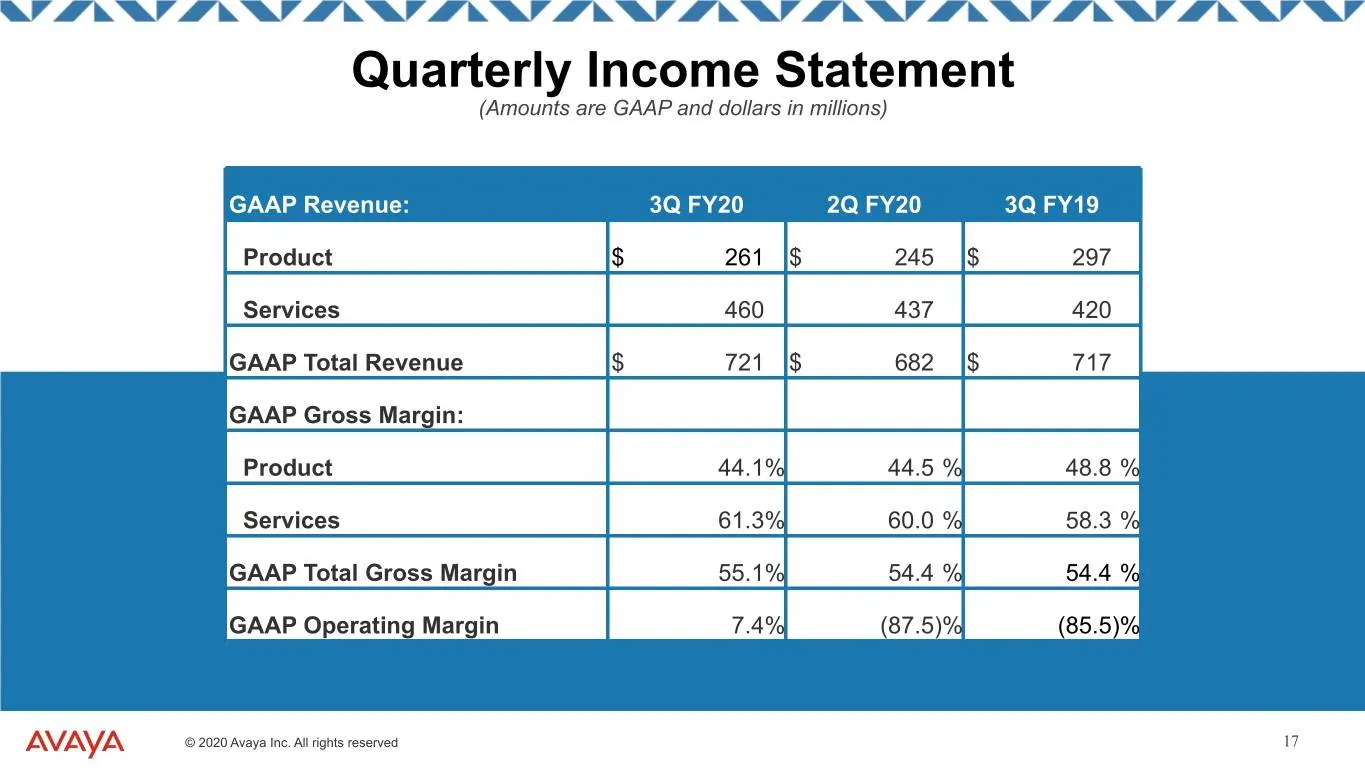
TEXT 0 – 0 – 0 204-0-0 127-127-127 17-114-210 80-200-74 86-183-242 247-150-70 Quarterly Income Statement (Amounts are GAAP and dollars in millions) GAAP Revenue: 3Q FY20 2Q FY20 3Q FY19 Product $ 261 $ 245 $ 297 Services 460 437 420 GAAP Total Revenue $ 721 $ 682 $ 717 GAAP Gross Margin: Product 44.
Slide 18: Quarterly Non-GAAP Income Statement Information
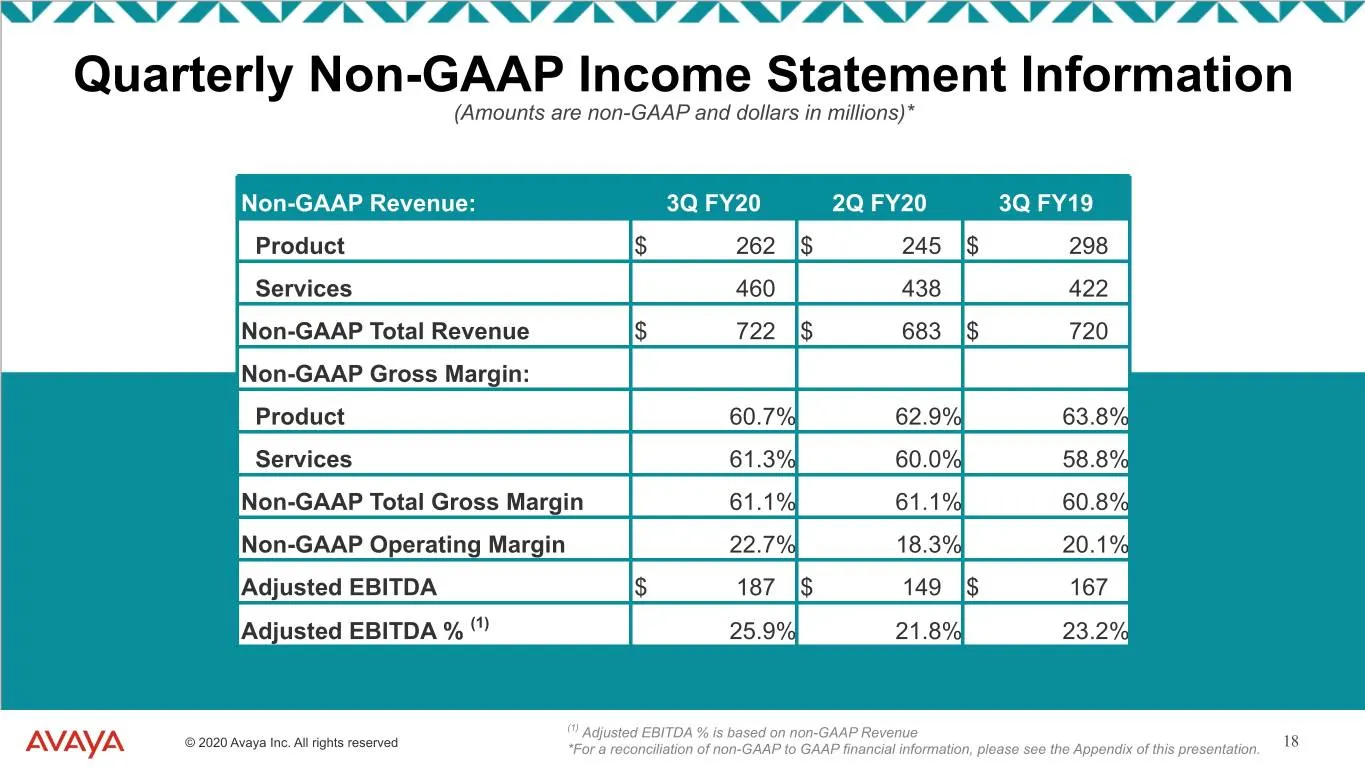
TEXT 0 – 0 – 0 204-0-0 127-127-127 17-114-210 80-200-74 86-183-242 247-150-70 Quarterly Non-GAAP Income Statement Information (Amounts are non-GAAP and dollars in millions)* Non-GAAP Revenue: 3Q FY20 2Q FY20 3Q FY19 Product $ 262 $ 245 $ 298 Services 460 438 422 Non-GAAP Total Revenue $ 722 $ 683 $
Slide 19: Quarterly Non-GAAP Revenue by Region
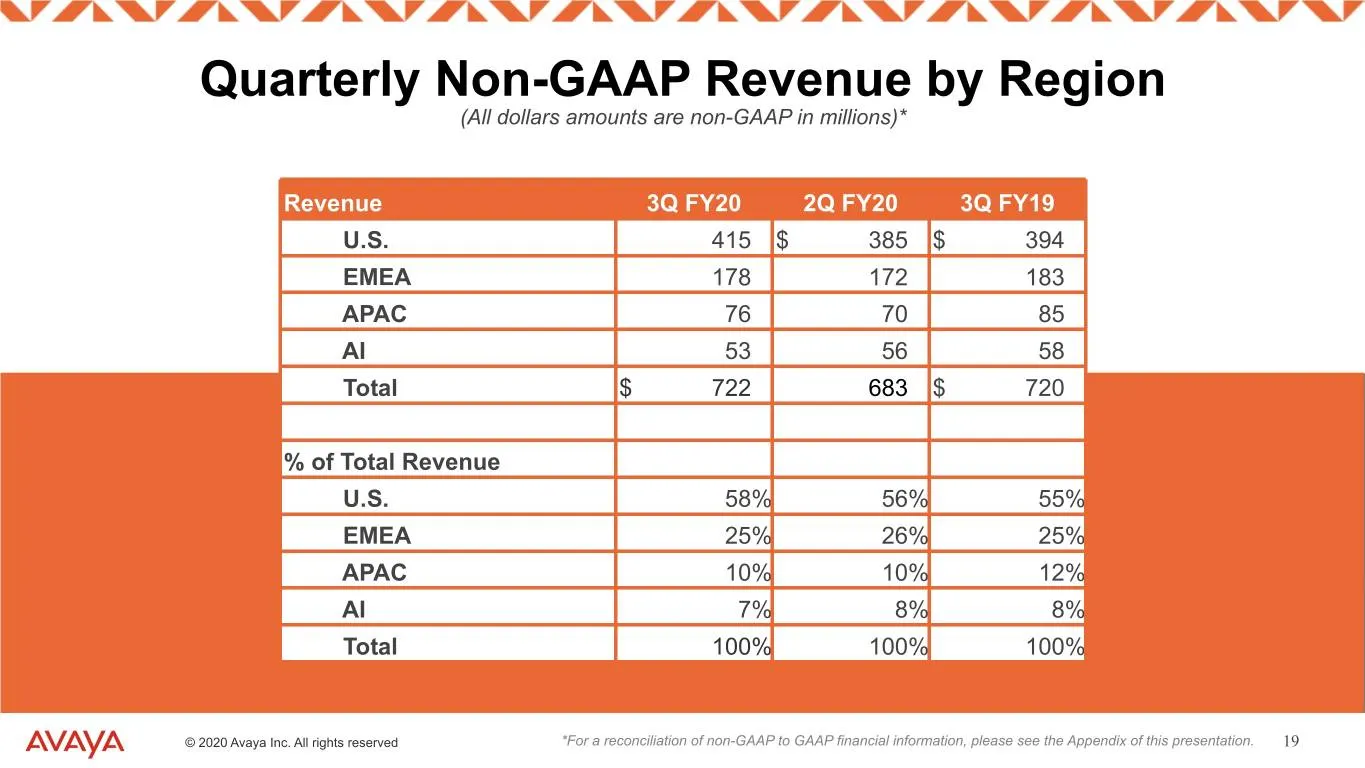
TEXT 0 – 0 – 0 204-0-0 127-127-127 17-114-210 80-200-74 86-183-242 247-150-70 Quarterly Non-GAAP Revenue by Region (All dollars amounts are non-GAAP in millions)* Revenue 3Q FY20 2Q FY20 3Q FY19 U.S. 415 $ 385 $ 394 EMEA 178 172 183 APAC 76 70 85 AI 53 56 58 Total $ 722 683 $ 720 % of Total Revenue
Slide 20: Balance Sheet and Operating Metrics
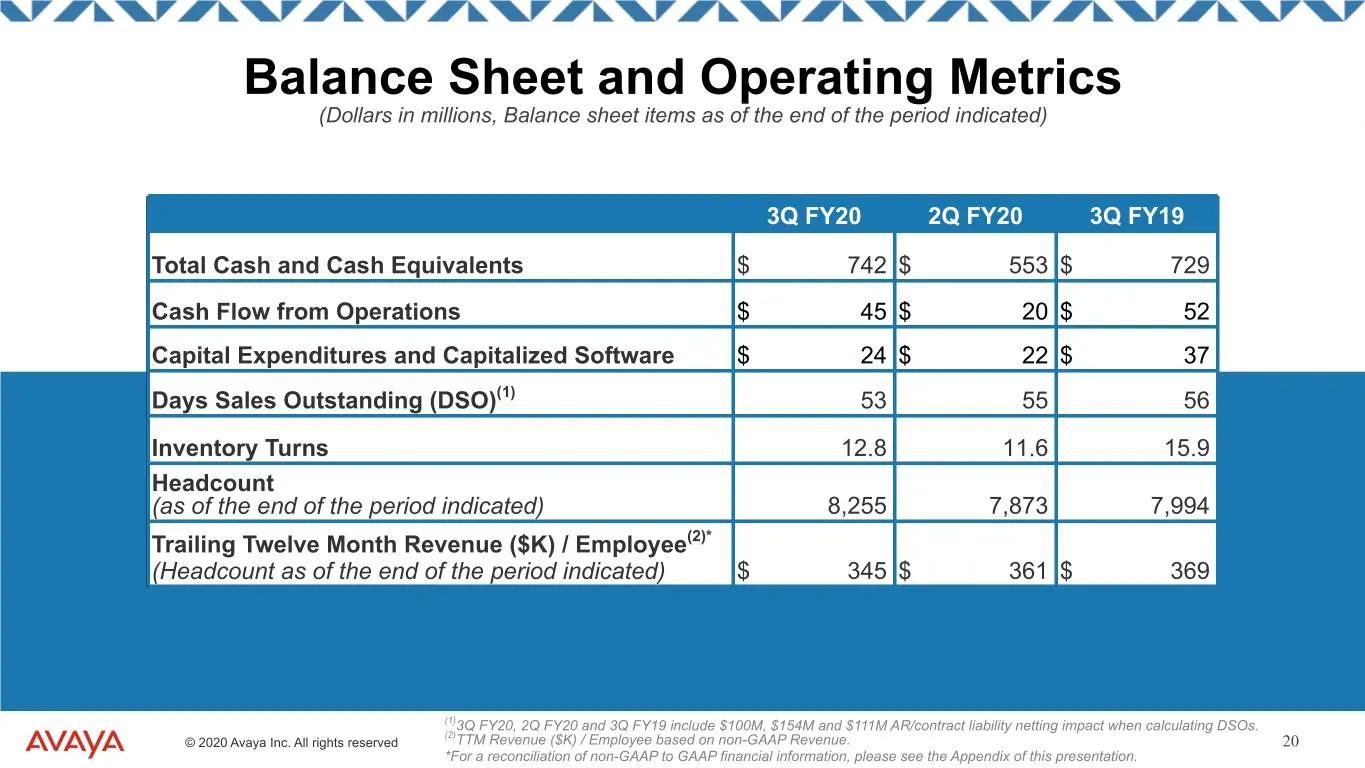
TEXT 0 – 0 – 0 204-0-0 127-127-127 17-114-210 80-200-74 86-183-242 247-150-70 Balance Sheet and Operating Metrics (Dollars in millions, Balance sheet items as of the end of the period indicated) 3Q FY20 2Q FY20 3Q FY19 Total Cash and Cash Equivalents $ 742 $ 553 $ 729 Cash Flow from Operations $ 45

Slide 21: Appendix
TEXT 0 – 0 – 0 204-0-0 127-127-127 17-114-210 80-200-74 86-183-242 247-150-70 Appendix © 2020 Avaya Inc. All rights reserved 21
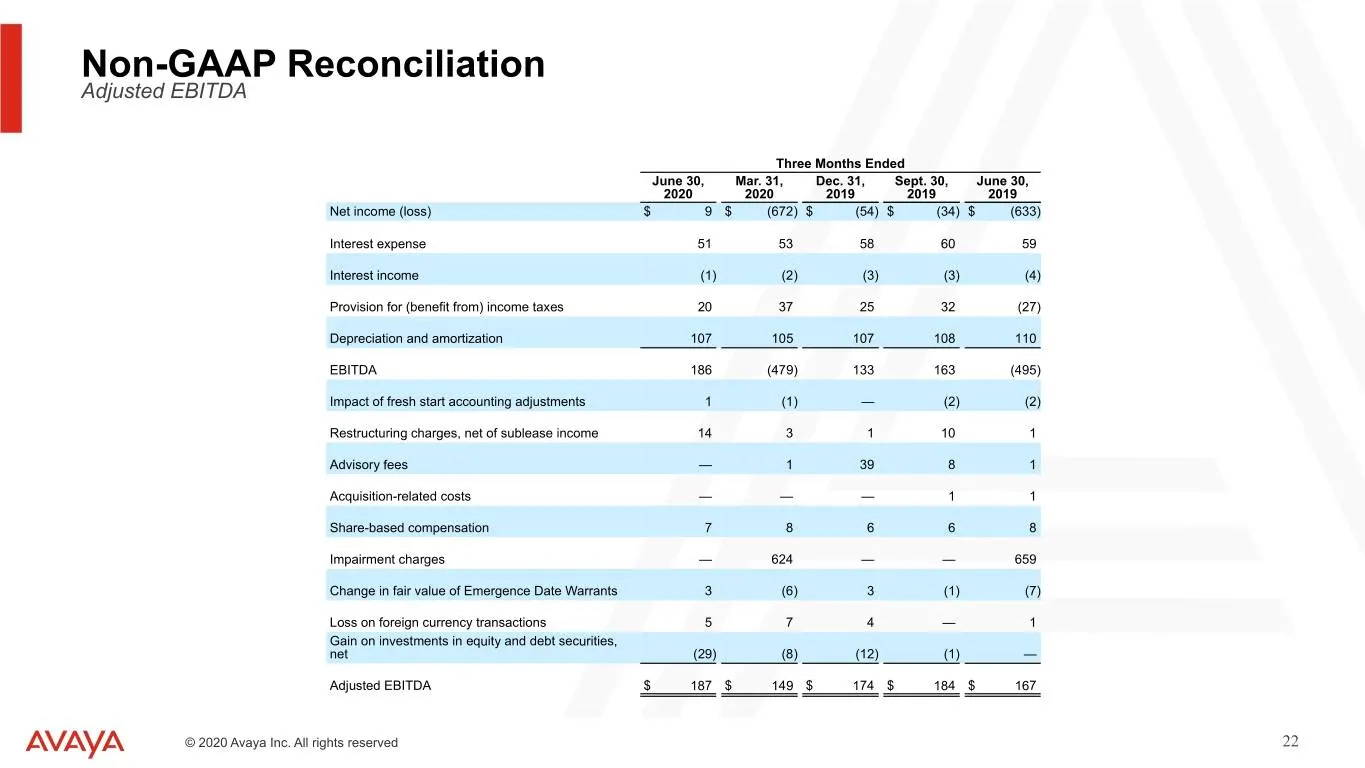
Slide 22: Non-GAAP Reconciliation Adjusted EBITDA
TEXT 0 – 0 – 0 204-0-0 127-127-127 17-114-210 80-200-74 86-183-242 247-150-70 Non-GAAP Reconciliation Adjusted EBITDA Three Months Ended June 30, Mar. 31, Dec. 31, Sept. 30, June 30, 2020 2020 2019 2019 2019 Net income (loss) $ 9 $ (672) $ (54) $ (34) $ (633) Interest expense 51 53 58 60 59 Interest
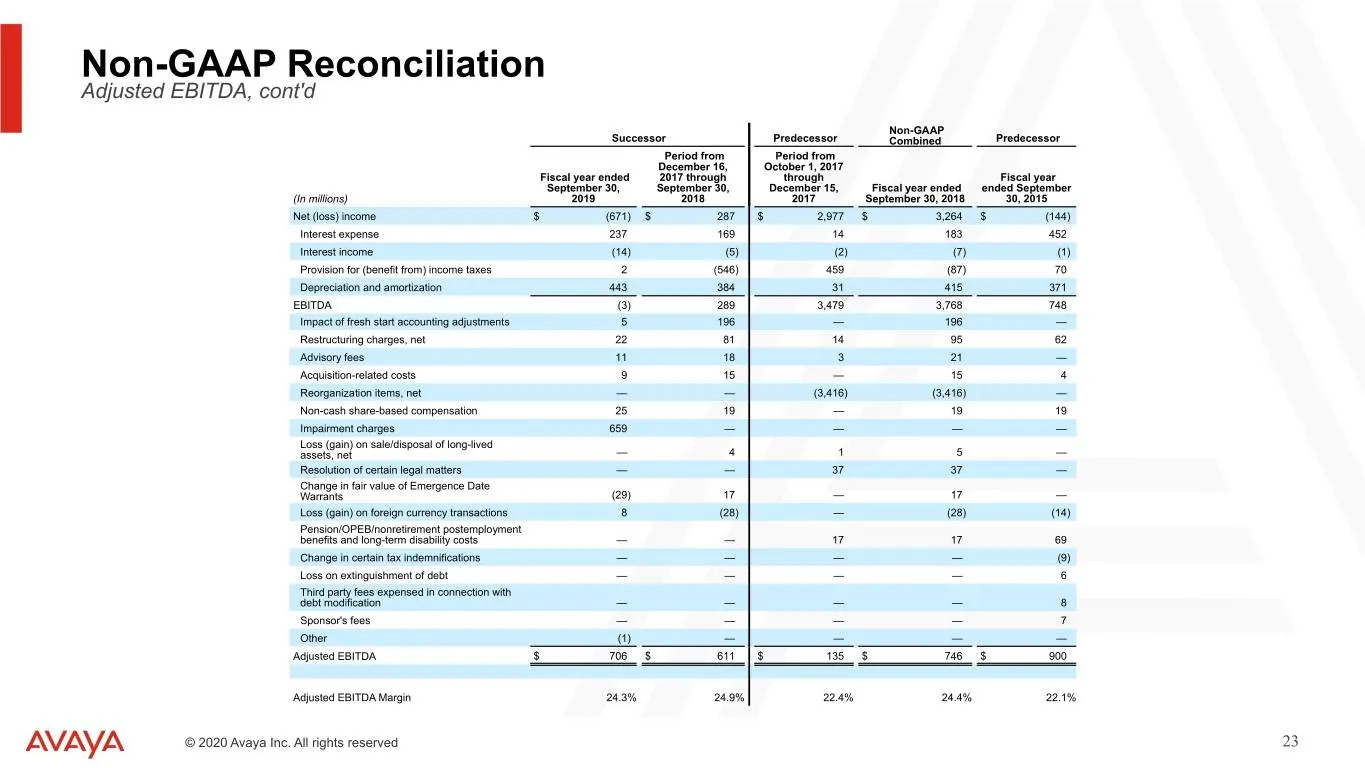
Slide 23: Non-GAAP Reconciliation Adjusted EBITDA, cont'd
TEXT 0 – 0 – 0 204-0-0 127-127-127 17-114-210 80-200-74 86-183-242 247-150-70 Non-GAAP Reconciliation Adjusted EBITDA, cont'd Non-GAAP Successor Predecessor Combined Predecessor Period from Period from December 16, October 1, 2017 Fiscal year ended 2017 through through Fiscal year September 30, Sept
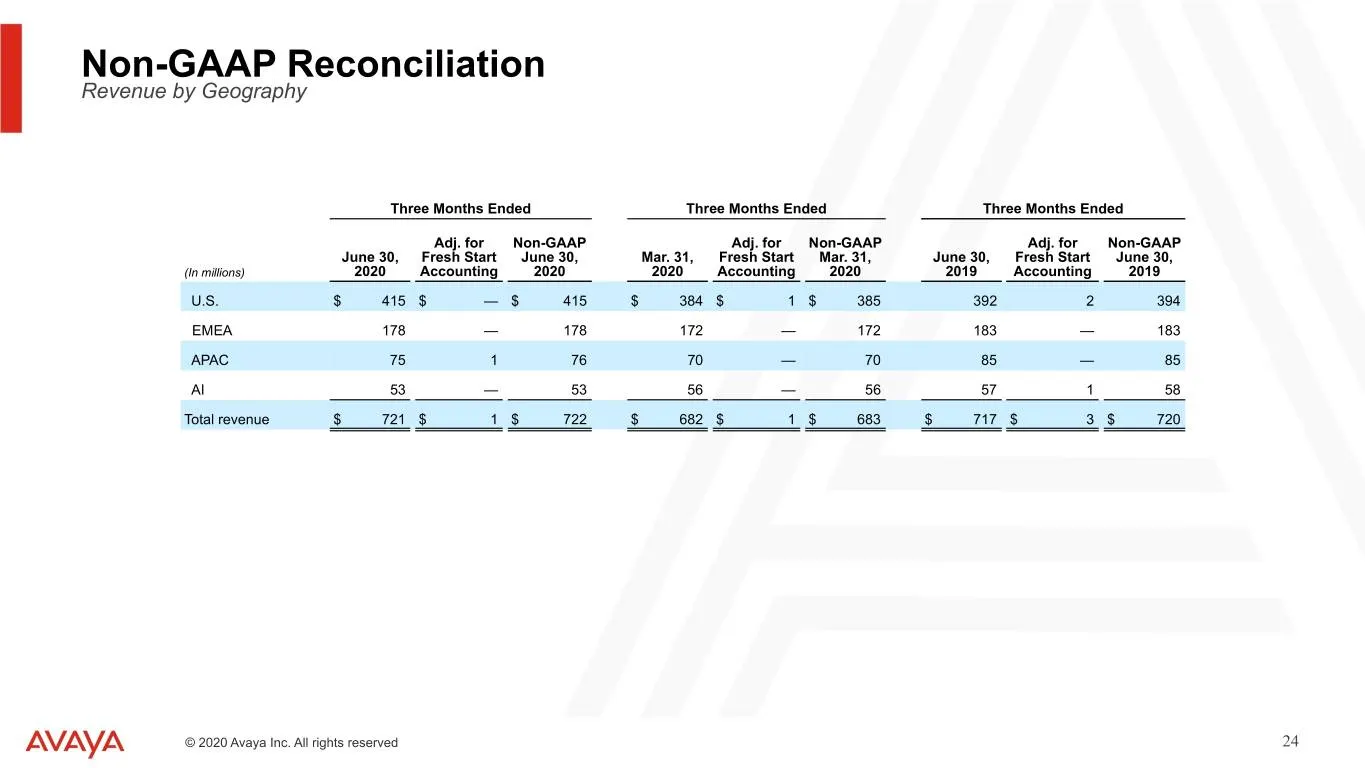
Slide 24: Non-GAAP Reconciliation Revenue by Geography
TEXT 0 – 0 – 0 204-0-0 127-127-127 17-114-210 80-200-74 86-183-242 247-150-70 Non-GAAP Reconciliation Revenue by Geography Three Months Ended Three Months Ended Three Months Ended Adj. for Non-GAAP Adj. for Non-GAAP Adj. for Non-GAAP June 30, Fresh Start June 30, Mar. 31, Fresh Start Mar. 31, June 3
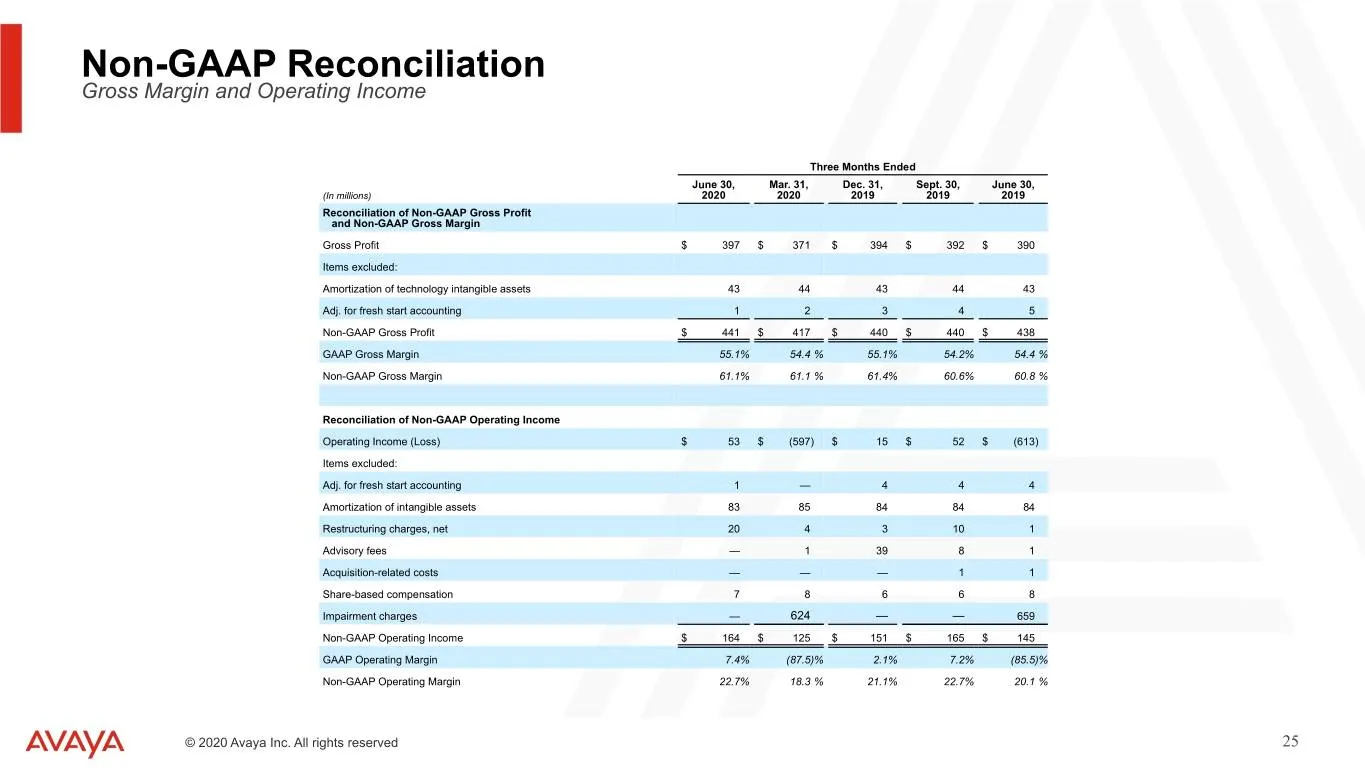
Slide 25: Non-GAAP Reconciliation Gross Margin and Operating Income
TEXT 0 – 0 – 0 204-0-0 127-127-127 17-114-210 80-200-74 86-183-242 247-150-70 Non-GAAP Reconciliation Gross Margin and Operating Income Three Months Ended June 30, Mar. 31, Dec. 31, Sept. 30, June 30, (In millions) 2020 2020 2019 2019 2019 Reconciliation of Non-GAAP Gross Profit and Non-GAAP Gross M
Slide 26: Non-GAAP Reconciliation Revenue and Gross Margin
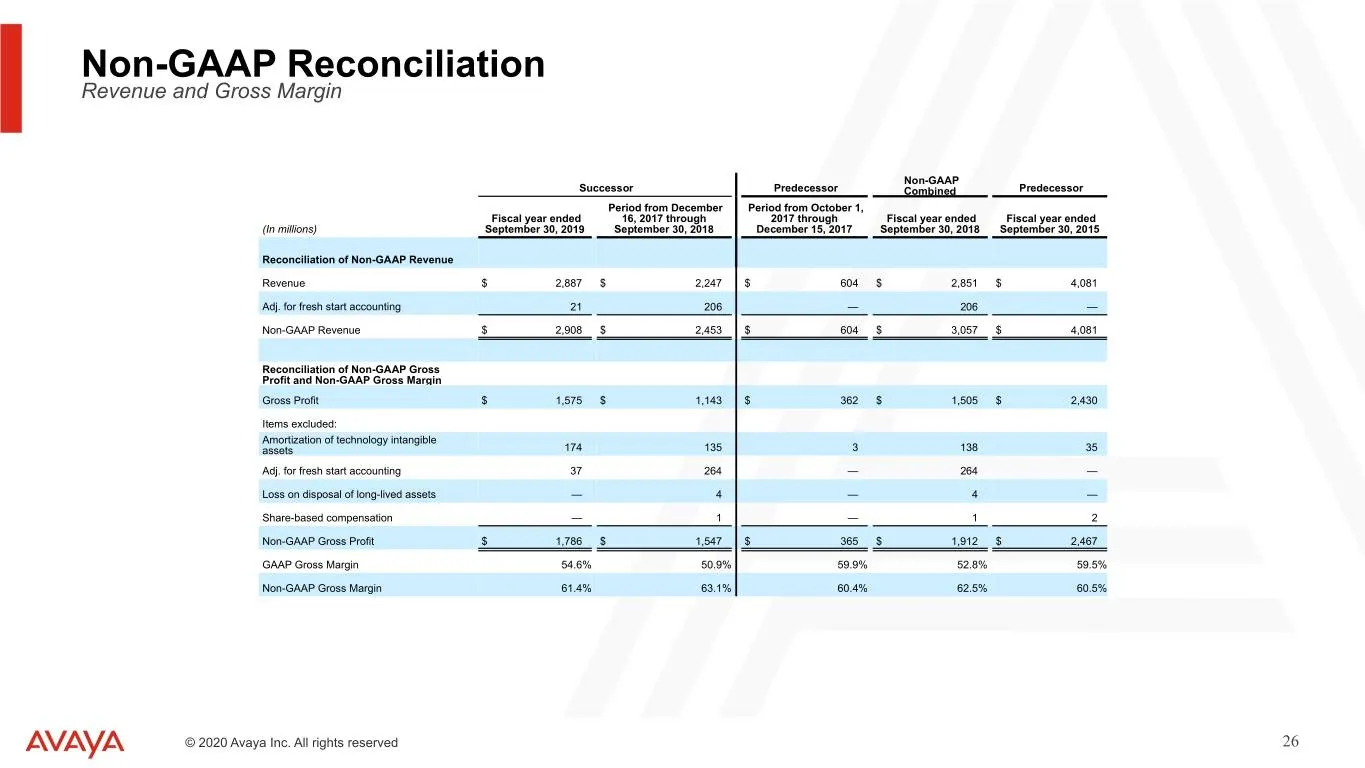
TEXT 0 – 0 – 0 204-0-0 127-127-127 17-114-210 80-200-74 86-183-242 247-150-70 Non-GAAP Reconciliation Revenue and Gross Margin Non-GAAP Successor Predecessor Combined Predecessor Period from December Period from October 1, Fiscal year ended 16, 2017 through 2017 through Fiscal year ended Fiscal year
Slide 27: Non-GAAP Reconciliation Product and Services Gross Margins
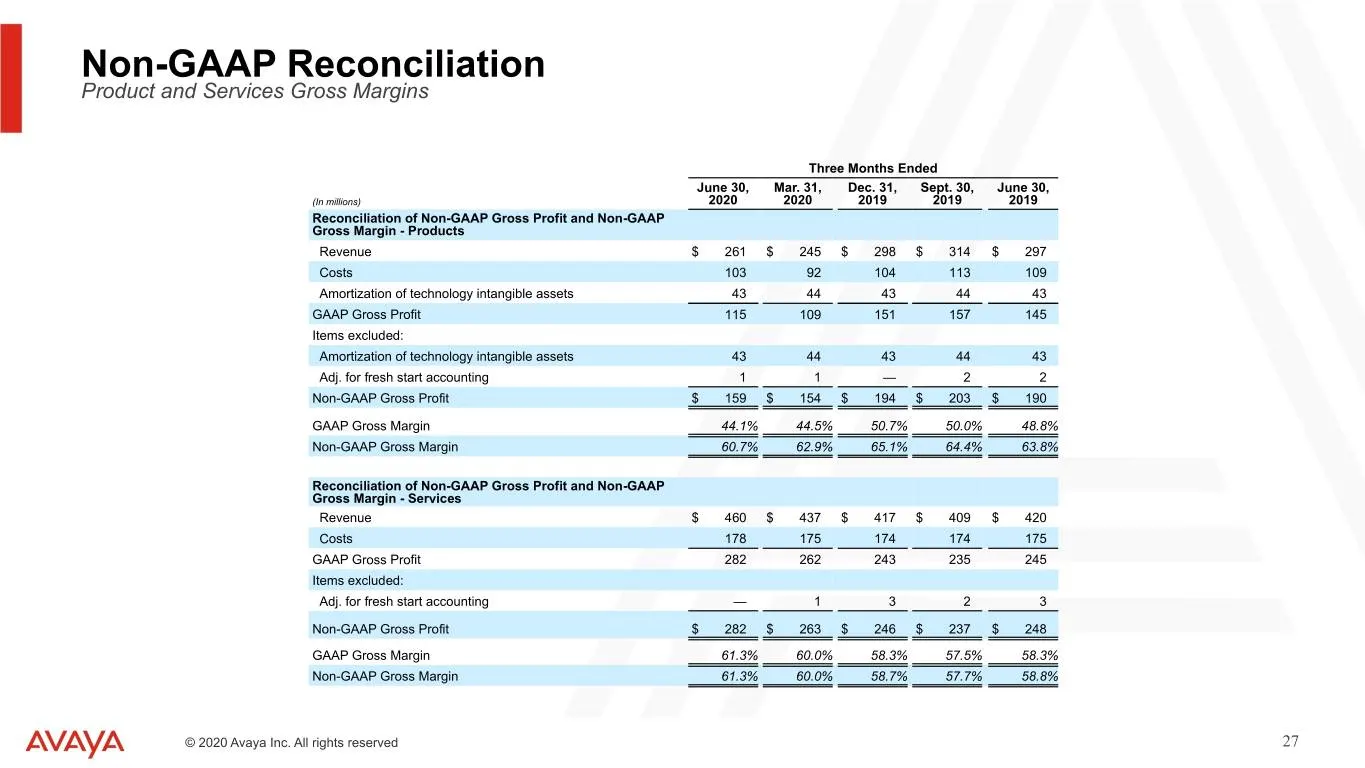
TEXT 0 – 0 – 0 204-0-0 127-127-127 17-114-210 80-200-74 86-183-242 247-150-70 Non-GAAP Reconciliation Product and Services Gross Margins Three Months Ended June 30, Mar. 31, Dec. 31, Sept. 30, June 30, (In millions) 2020 2020 2019 2019 2019 Reconciliation of Non-GAAP Gross Profit and Non-GAAP Gross
Slide 28: Non-GAAP Reconciliation Supplemental Schedules
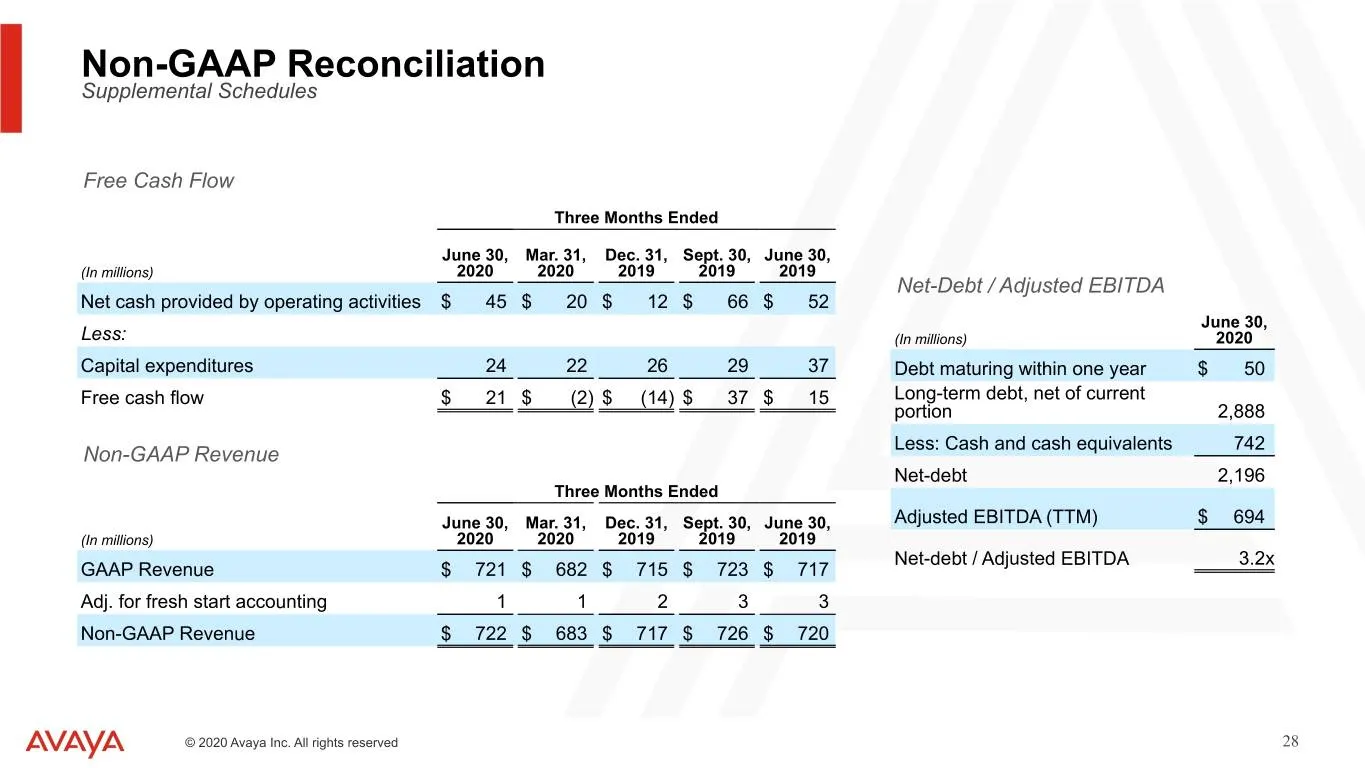
TEXT 0 – 0 – 0 204-0-0 127-127-127 17-114-210 80-200-74 86-183-242 247-150-70 Non-GAAP Reconciliation Supplemental Schedules Free Cash Flow Three Months Ended June 30, Mar. 31, Dec. 31, Sept. 30, June 30, (In millions) 2020 2020 2019 2019 2019 Net-Debt / Adjusted EBITDA Net cash provided by operatin
Source: SEC EDGAR · 8-K filed Aug 10, 2020
More decks from Avaya Inc
 Corporate Update (February 2023)11 slides · Feb 14, 2023
 Q3 FY2022 Earnings Presentation26 slides · Aug 9, 2022
 Q2 FY2022 Earnings Presentation36 slides · May 10, 2022
 Q1 FY2022 Earnings Presentation36 slides · Feb 9, 2022
 Investor Day (December 2021)103 slides · December 2021
 Q4 2021 Earnings Presentation38 slides · Nov 22, 2021