National Grid plc · LSE:NG.
National Grid — Investor Day (September 2017)
91 slides from National Grid's investor day presentation, September 2017

Slide 1: New York Teach-In
NEW YOR TEACH- K IN \V, nationalgrid
Slide 2: Cautionary statement
nationalgrid Cautionary statement This presentation contains certain statements that are neither reported financial results nor other historical information. These statements are forward-looking statements within the meaning of Section 27 of the Securities Act of 1933, as amended, and Section 21E of
Slide 3: Agenda
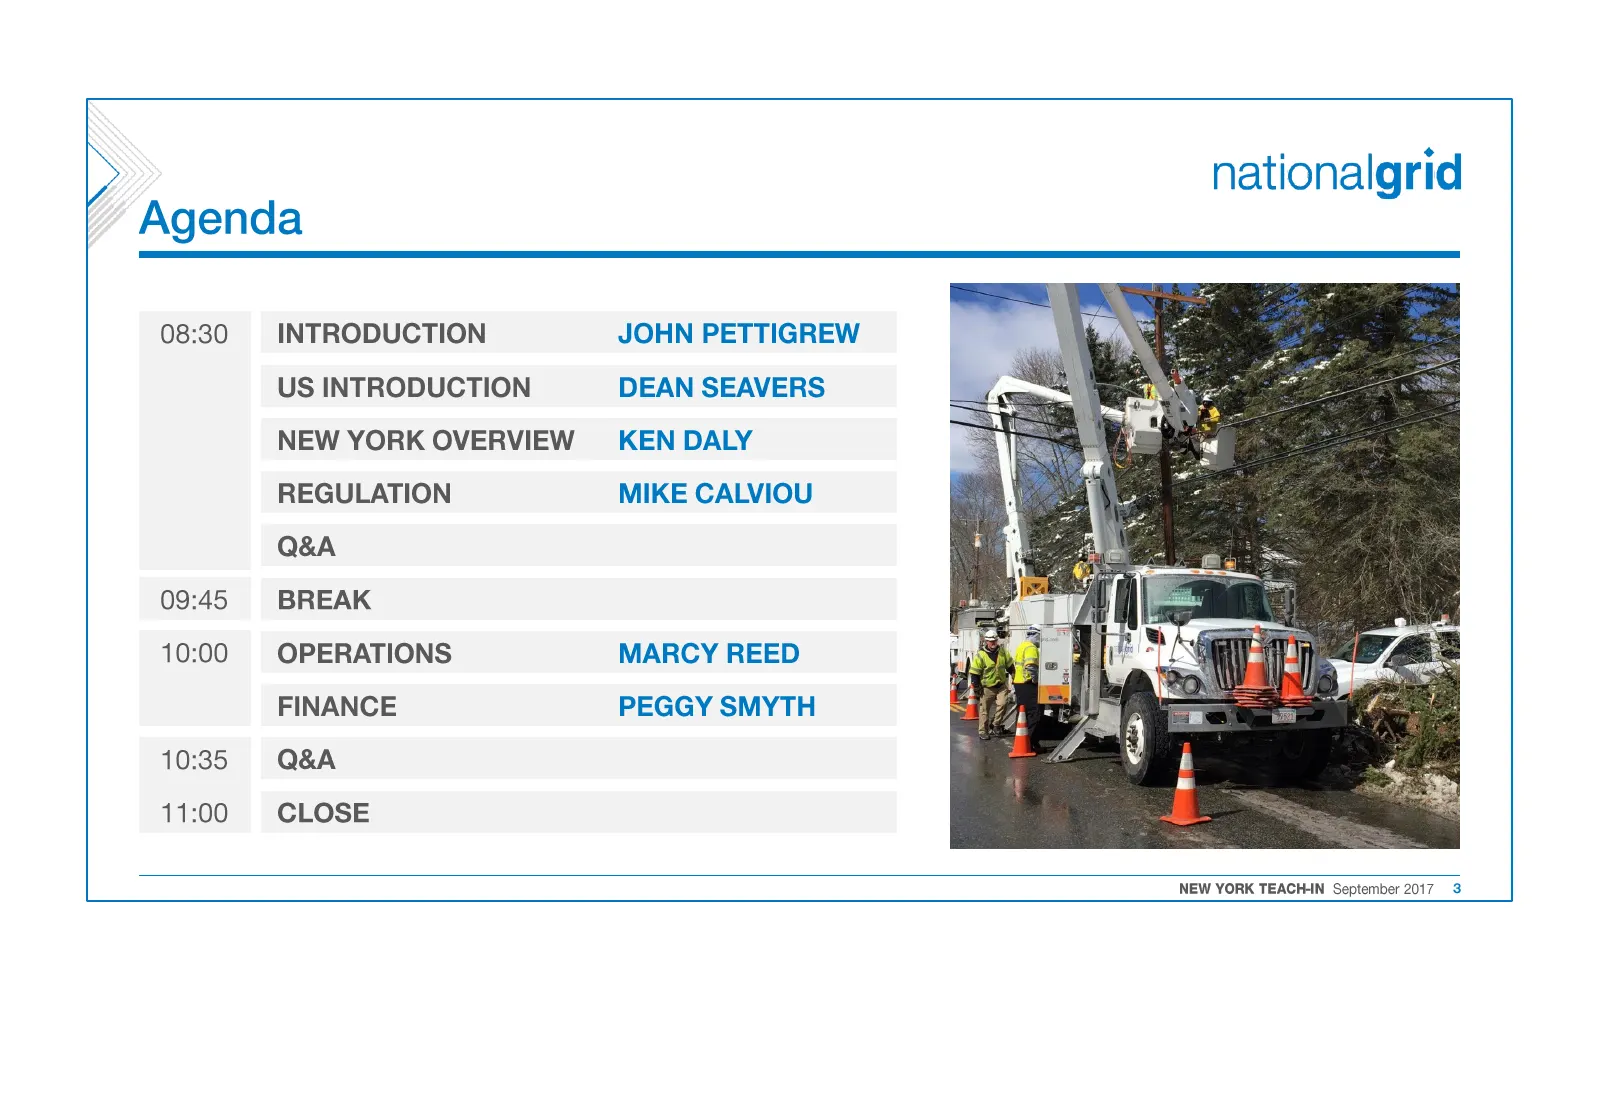
nationalgrid Agenda 08:30 INTRODUCTION JOHN PETTIGREW US INTRODUCTION DEAN SEAVERS NEW YORK OVERVIEW KEN DALY REGULATION MIKE CALVIOU Q&A 09:45 BREAK 10:00 OPERATIONS MARCY REED FINANCE PEGGY SMYTH 10:35 Q&A 11:00 CLOSE NEW YORK TEACH-N September 2017 3

Slide 4: Deliberately left blank
Deliberately left blank
Slide 5: Introduction
nationalgrid INTRODUCTION JOHN PETTIGREW CHIEF EXECUTIVE INTRODUCTION
Slide 6: US track record of growth and a strong outlook
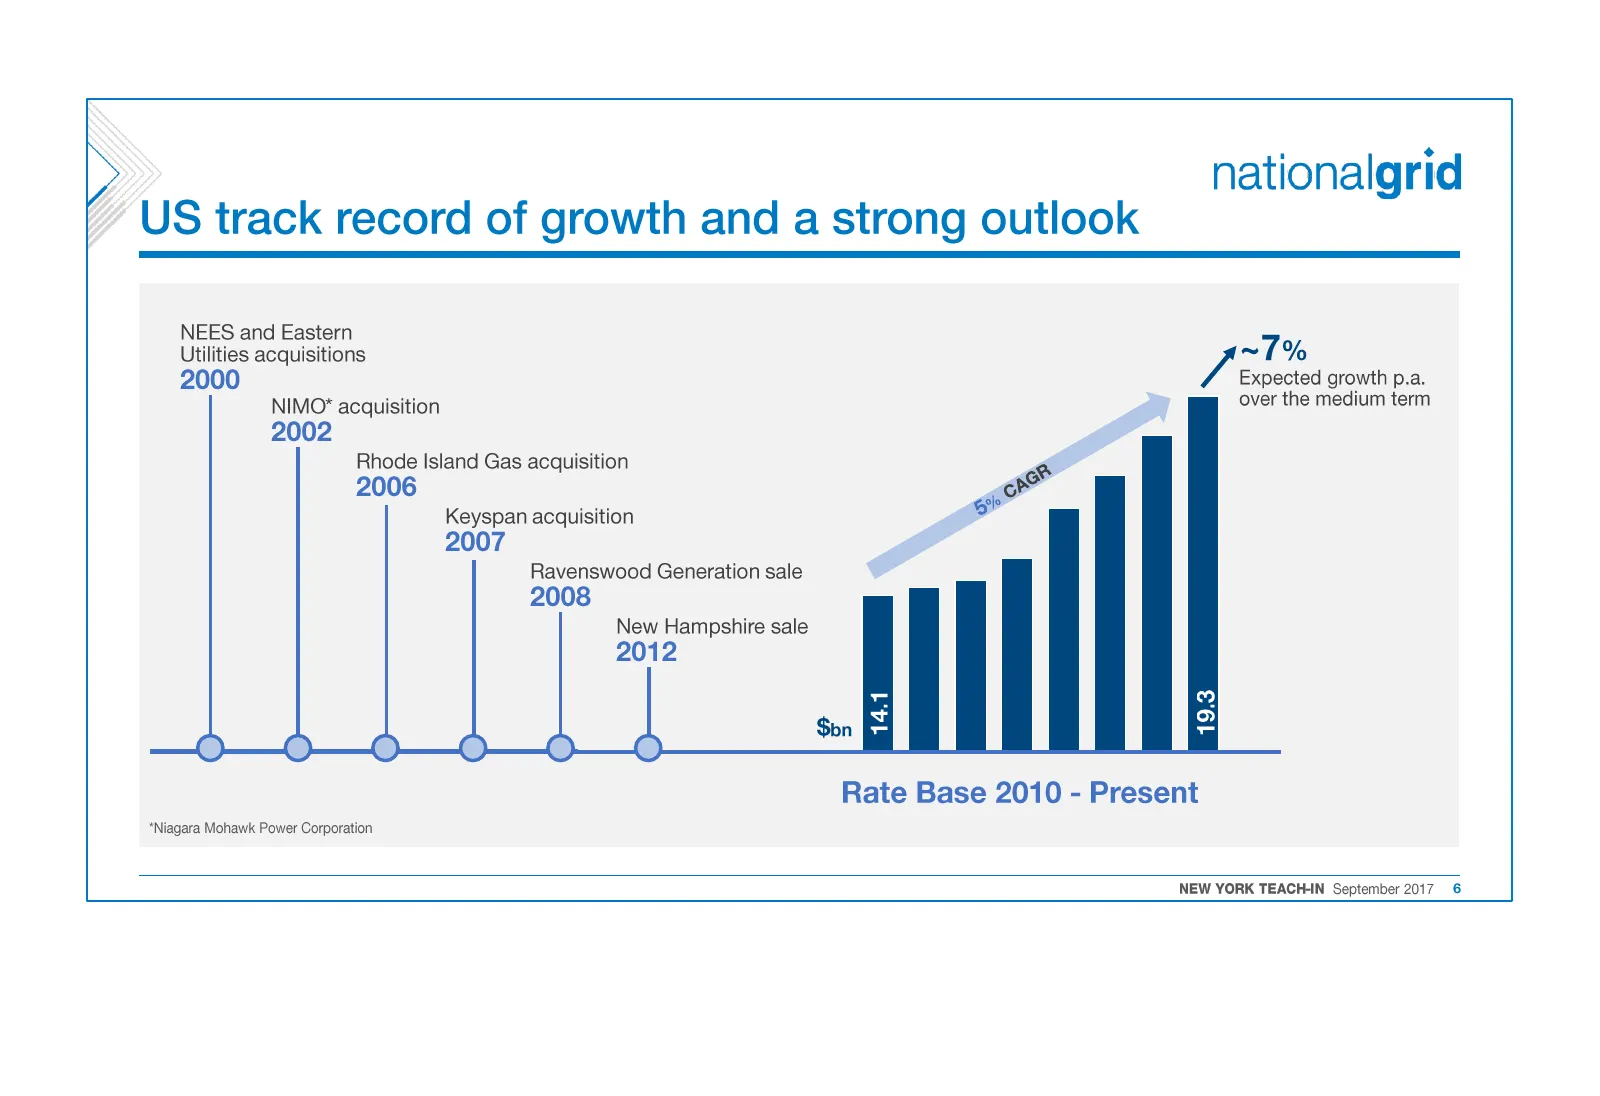
US track record of growth and a strong outlook nationalgrid NEES and Eastern Utilities acquisitions 2000 NIMO* acquisition 2002 Rhode Island Gas acquisition eo 2006 go Keyspan acquisition 8 2007 Ravenswood Generation sale 2008 New Hampshire sale 2012 0). l , ~7% Expected growth p.a. over the medium
Slide 7: National Grid is a major US utility
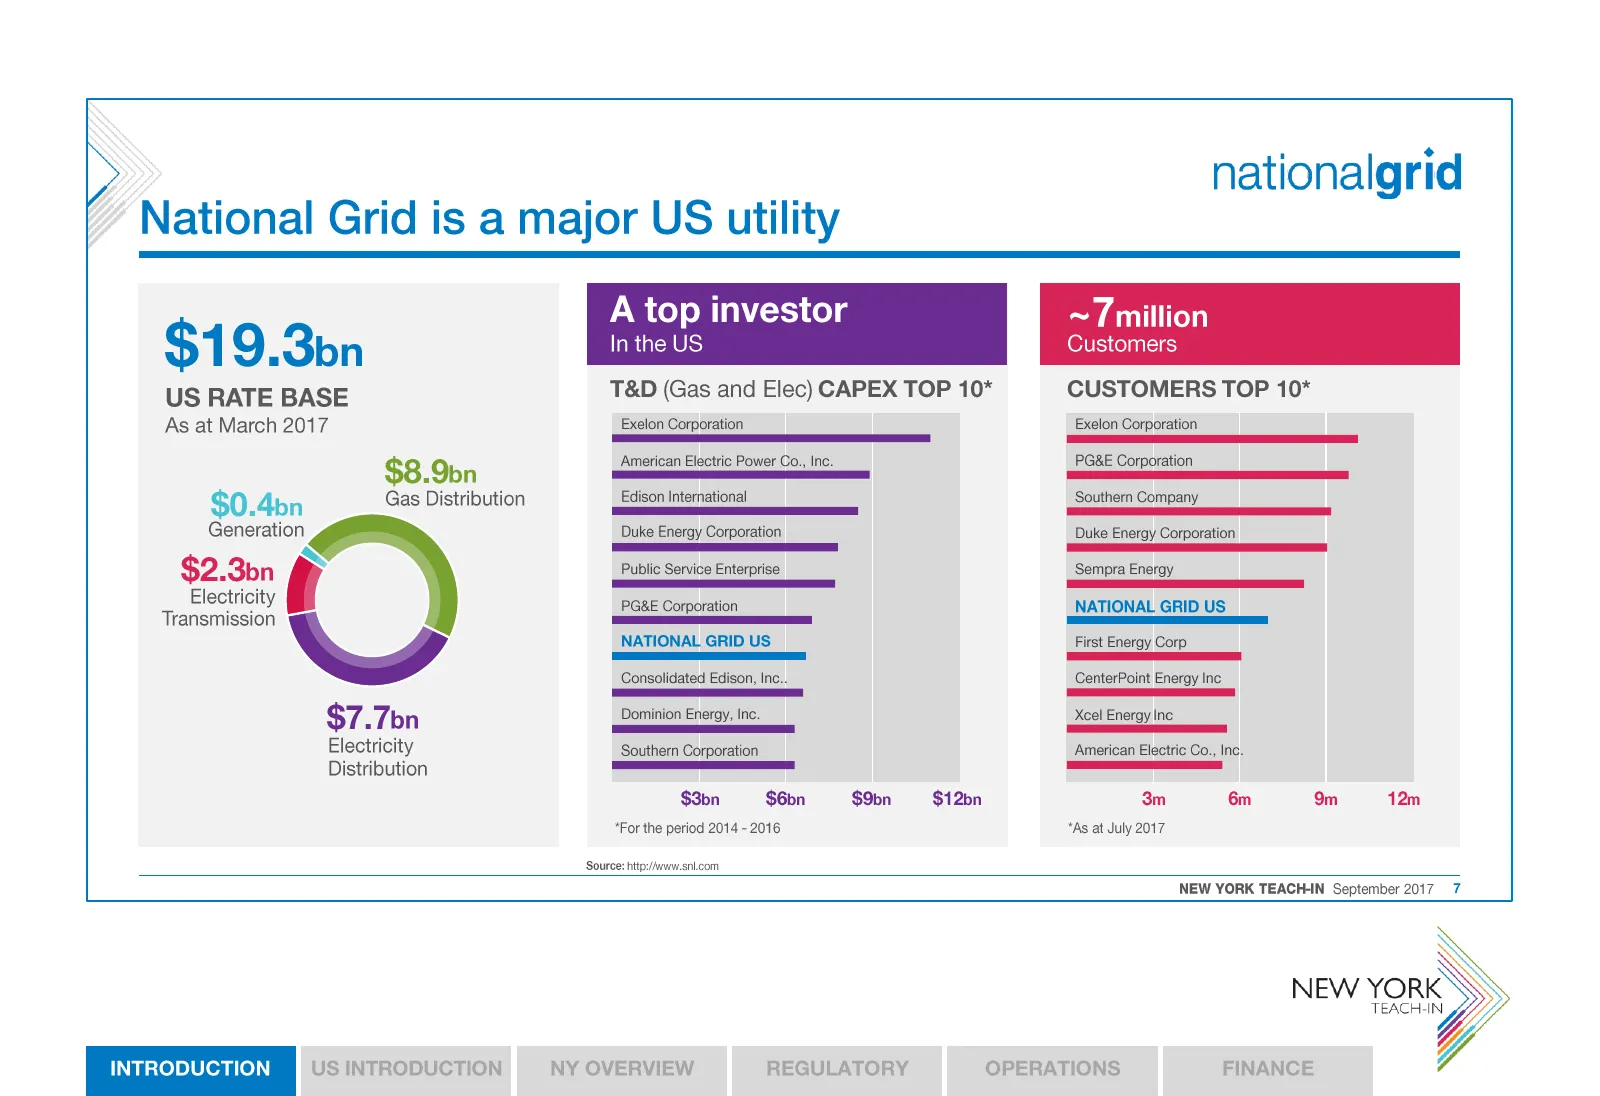
$1 9.3bn US RATE BASE As at March 2017 $8.9bn Gas Distribution $0.4bn National Grid is a major US utility A top investor In the US T&D (Gas and Elec) CAPEX TOP 10* Exelon Corporation ‘American Electric Power Co., Inc. Edison International nationalgrid ~7 million Customers CUSTOMERS TOP 10* Exelon Co
Slide 8: The US is an important part of our portfolio
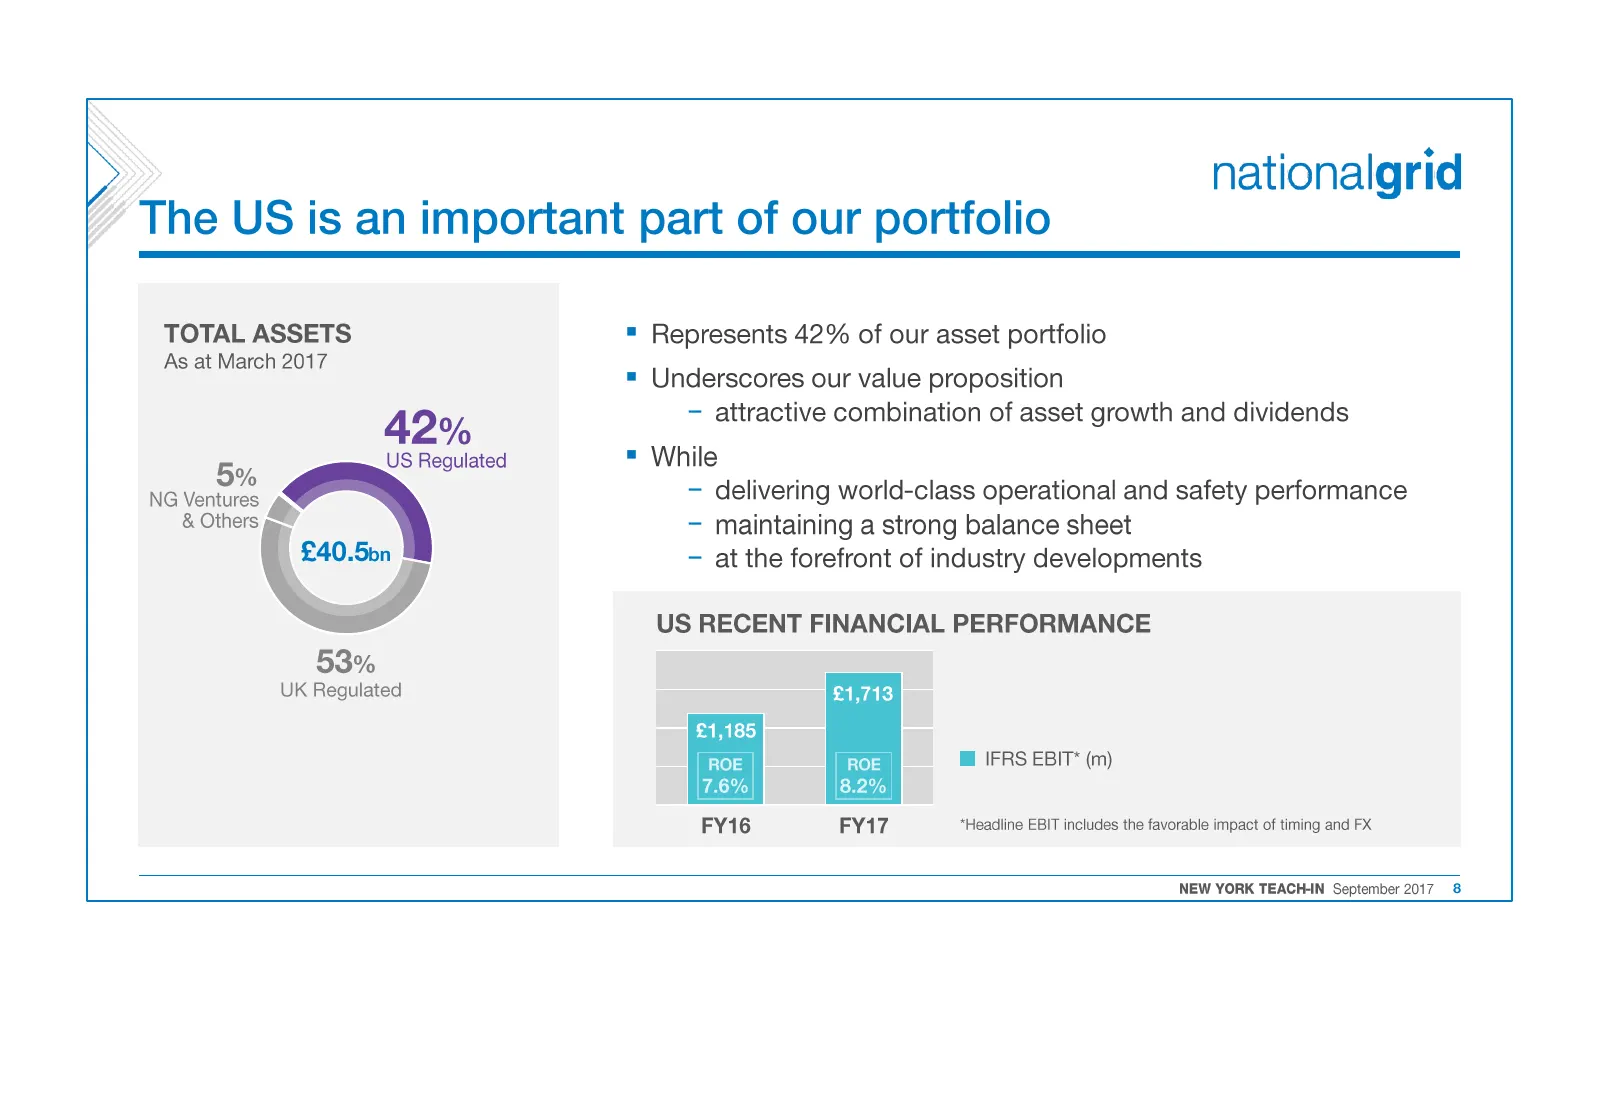
y nationalgrid The US is an important part of our portfolio TOTAL ASSETS As at March 2017 42% US Regulated 5% ° NG Ventures & Others £40.5bn 53% UK Regulated = Represents 42% of our asset portfolio = Underscores our value proposition - attractive combination of asset growth and dividends = While - d
Slide 9: Significant need for investment in US infrastructure
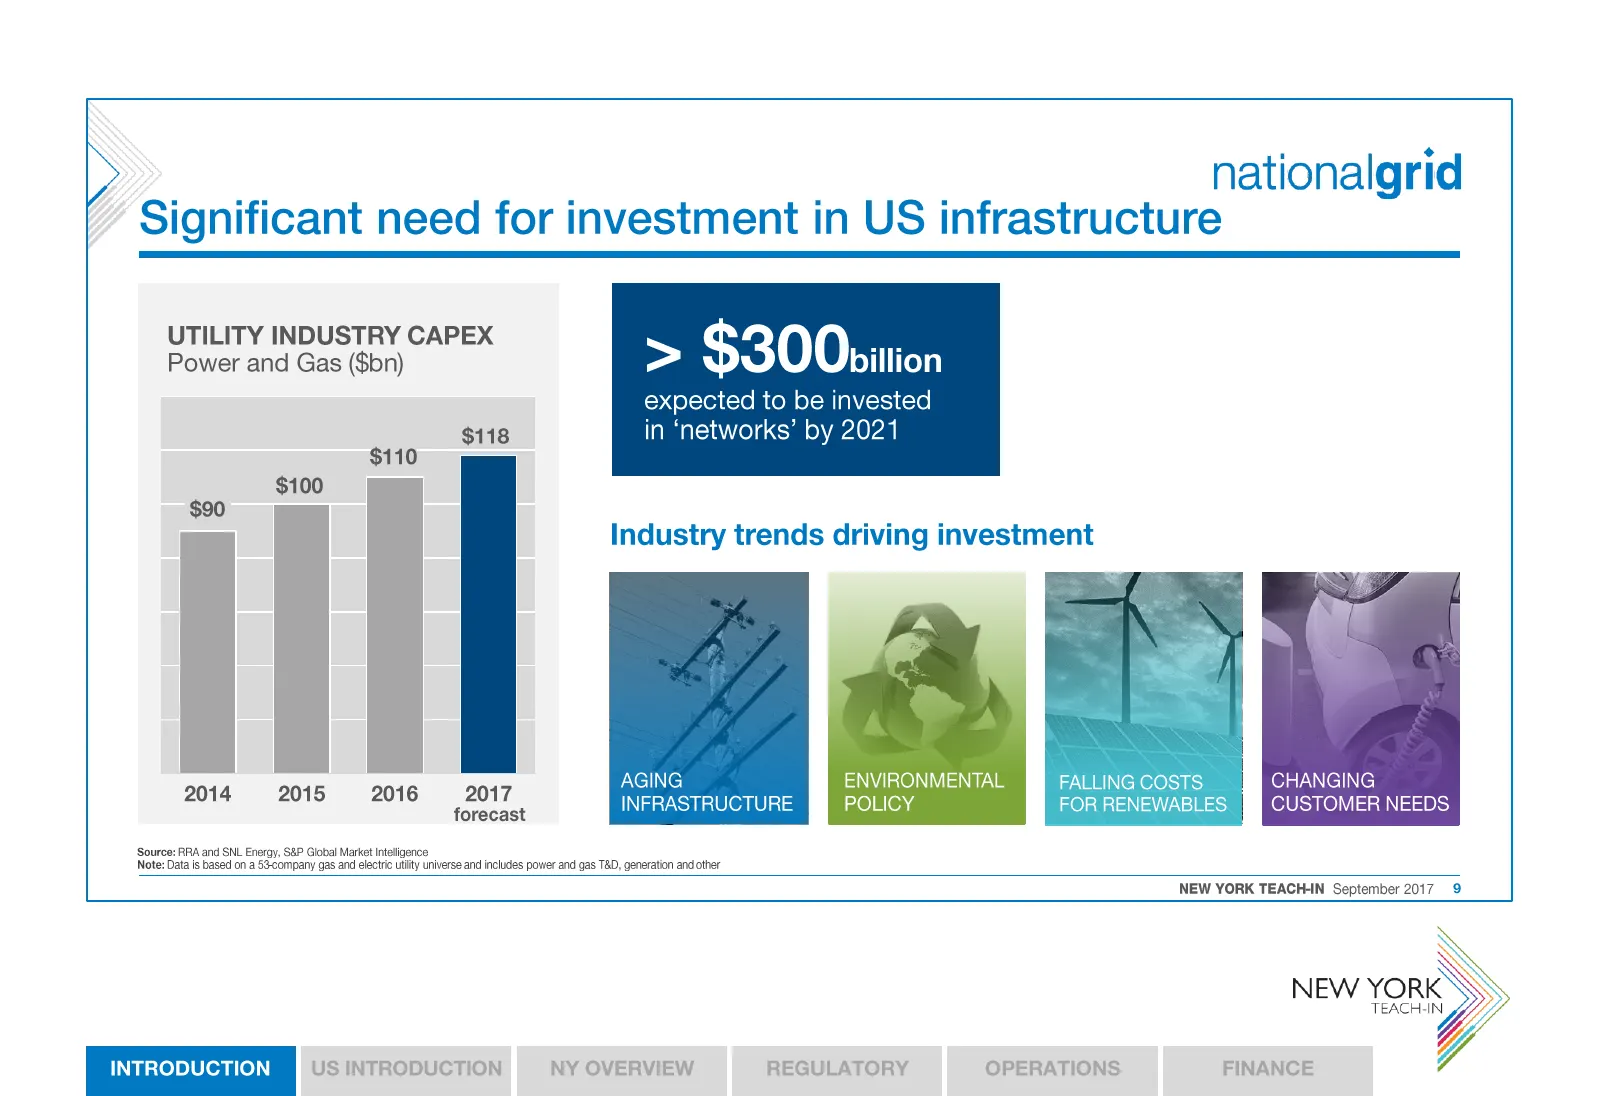
nationalgrid Significant need for investment in US infrastructure UTILITY INDUSTRY CAPEX Power and Gas ($bn) > $30 Obitiion expected to be invested $118 in ‘networks’ by 2021 $110 $100 2014 2015 2016 2017 forecast Industry trends driving investment AGING INFRASTRUCTURE ENVIRONMENTAL POLICY FALLING C
Slide 10: Summary
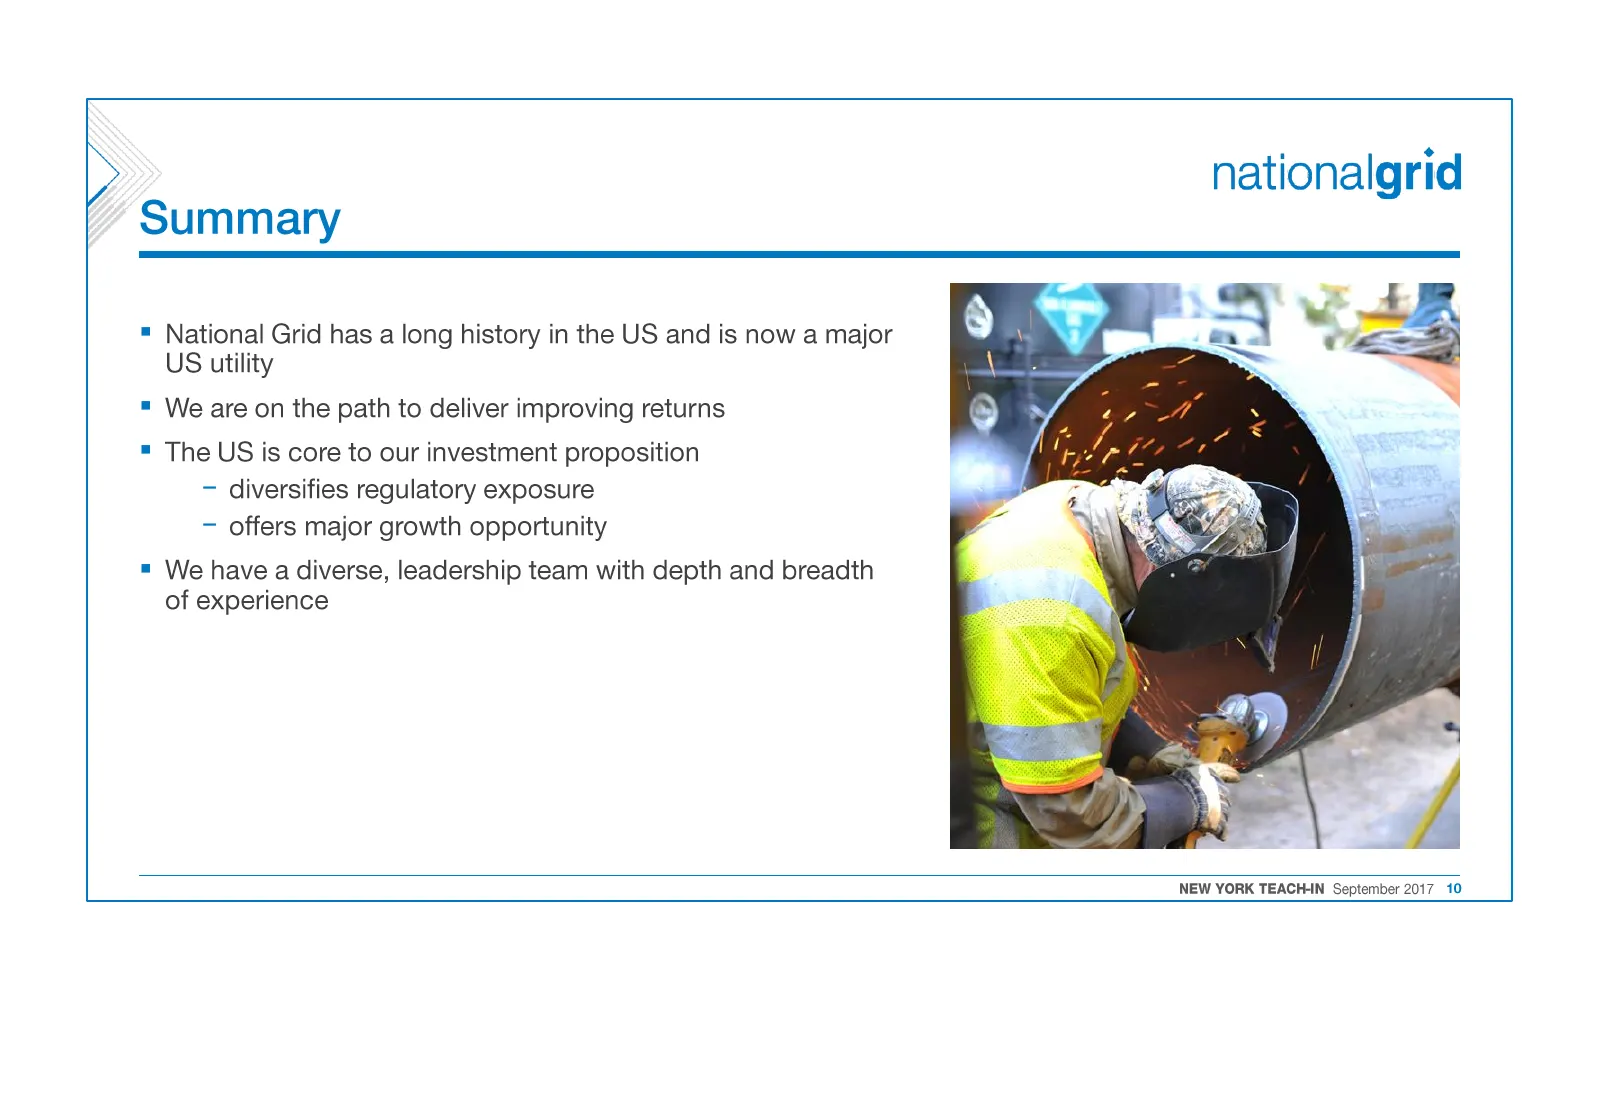
nationalgrid Summary National Grid has a long history in the US and is now a major US utility = We are on the path to deliver improving returns The US is core to our investment proposition - diversifies regulatory exposure — offers major growth opportunity We have a diverse, leadership team with dep

Slide 11: Deliberately left blank
Deliberately left blank NEW 1H) TEACH-IN

Slide 12: Deliberately left blank
Deliberately left blank
Slide 13: US Introduction
nationalgrid US INTRODUCTION DEAN SEAVERS EXECUTIVE DIRECTOR, US INTRODUCTION US INTRODUCTION NY OVERVIEW REGULATORY OPERATIONS FINANCE
Slide 14: Progress since November 2015
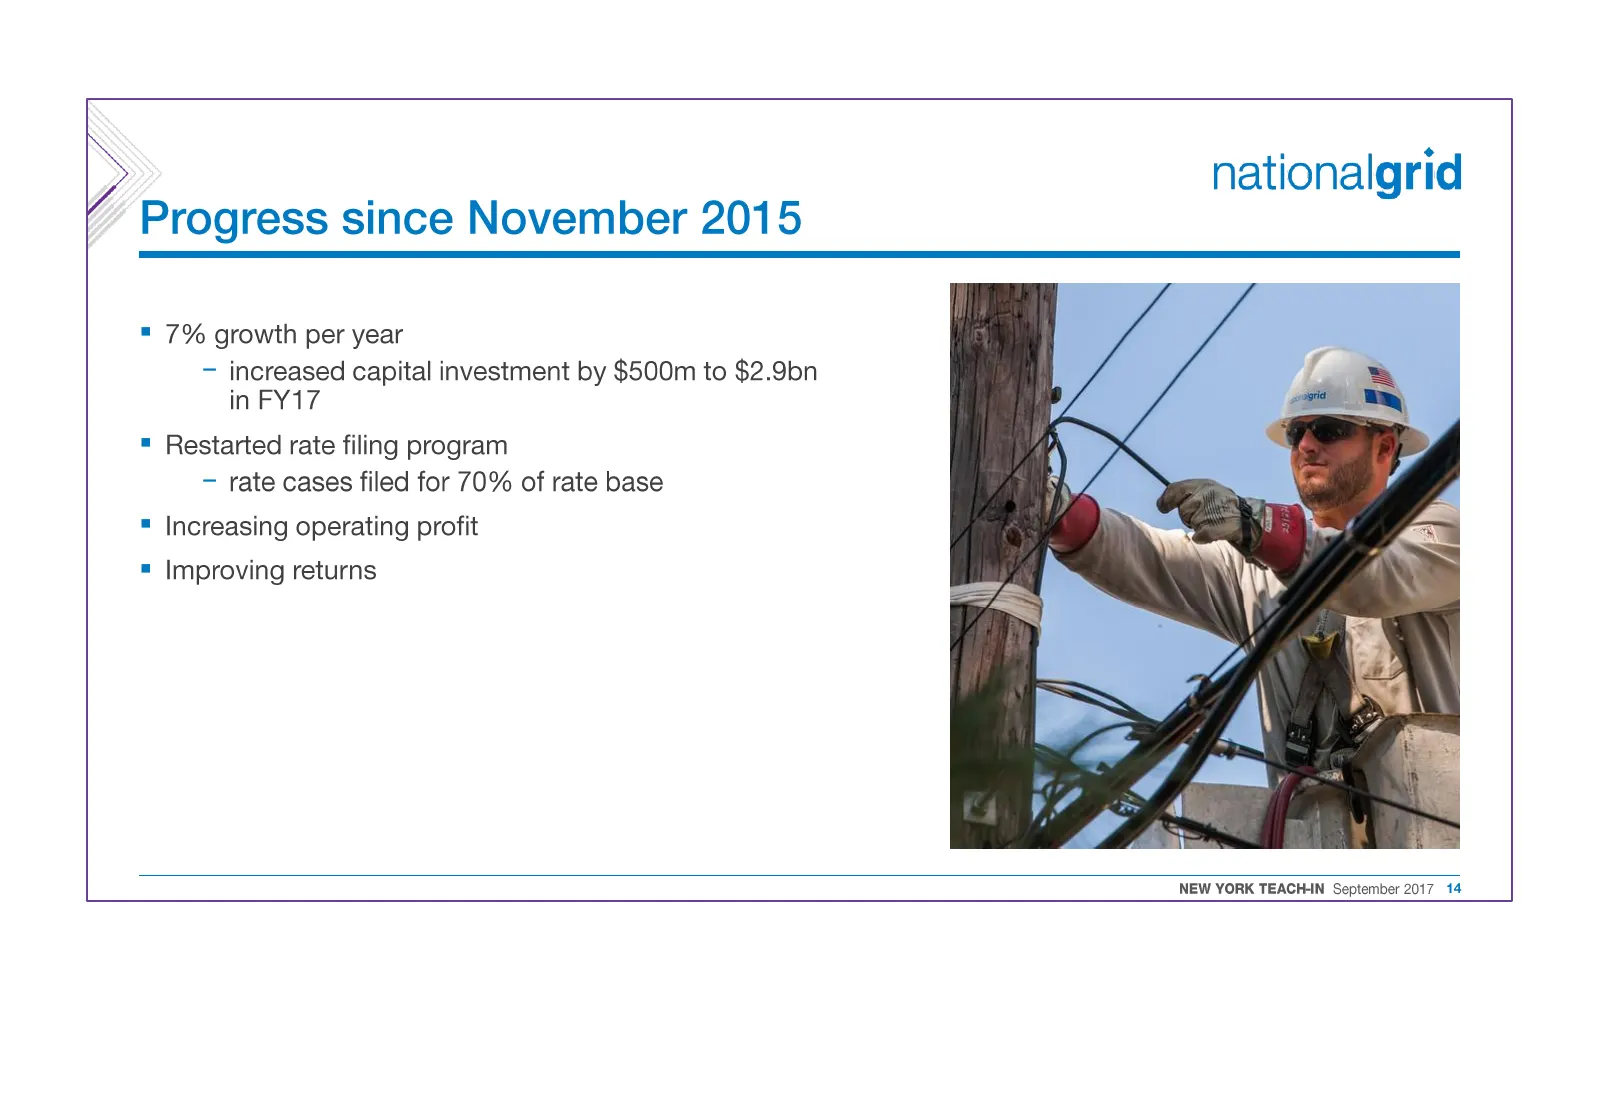
) nationalgrid Progress since November 2015 7% growth per year - increased capital investment by $500m to $2.9bn in FY17 = Restarted rate filing program — rate cases filed for 70% of rate base = Increasing operating profit = Improving returns NEW YORK TEACH-N September 2017 14
Slide 15: Our priorities are clear
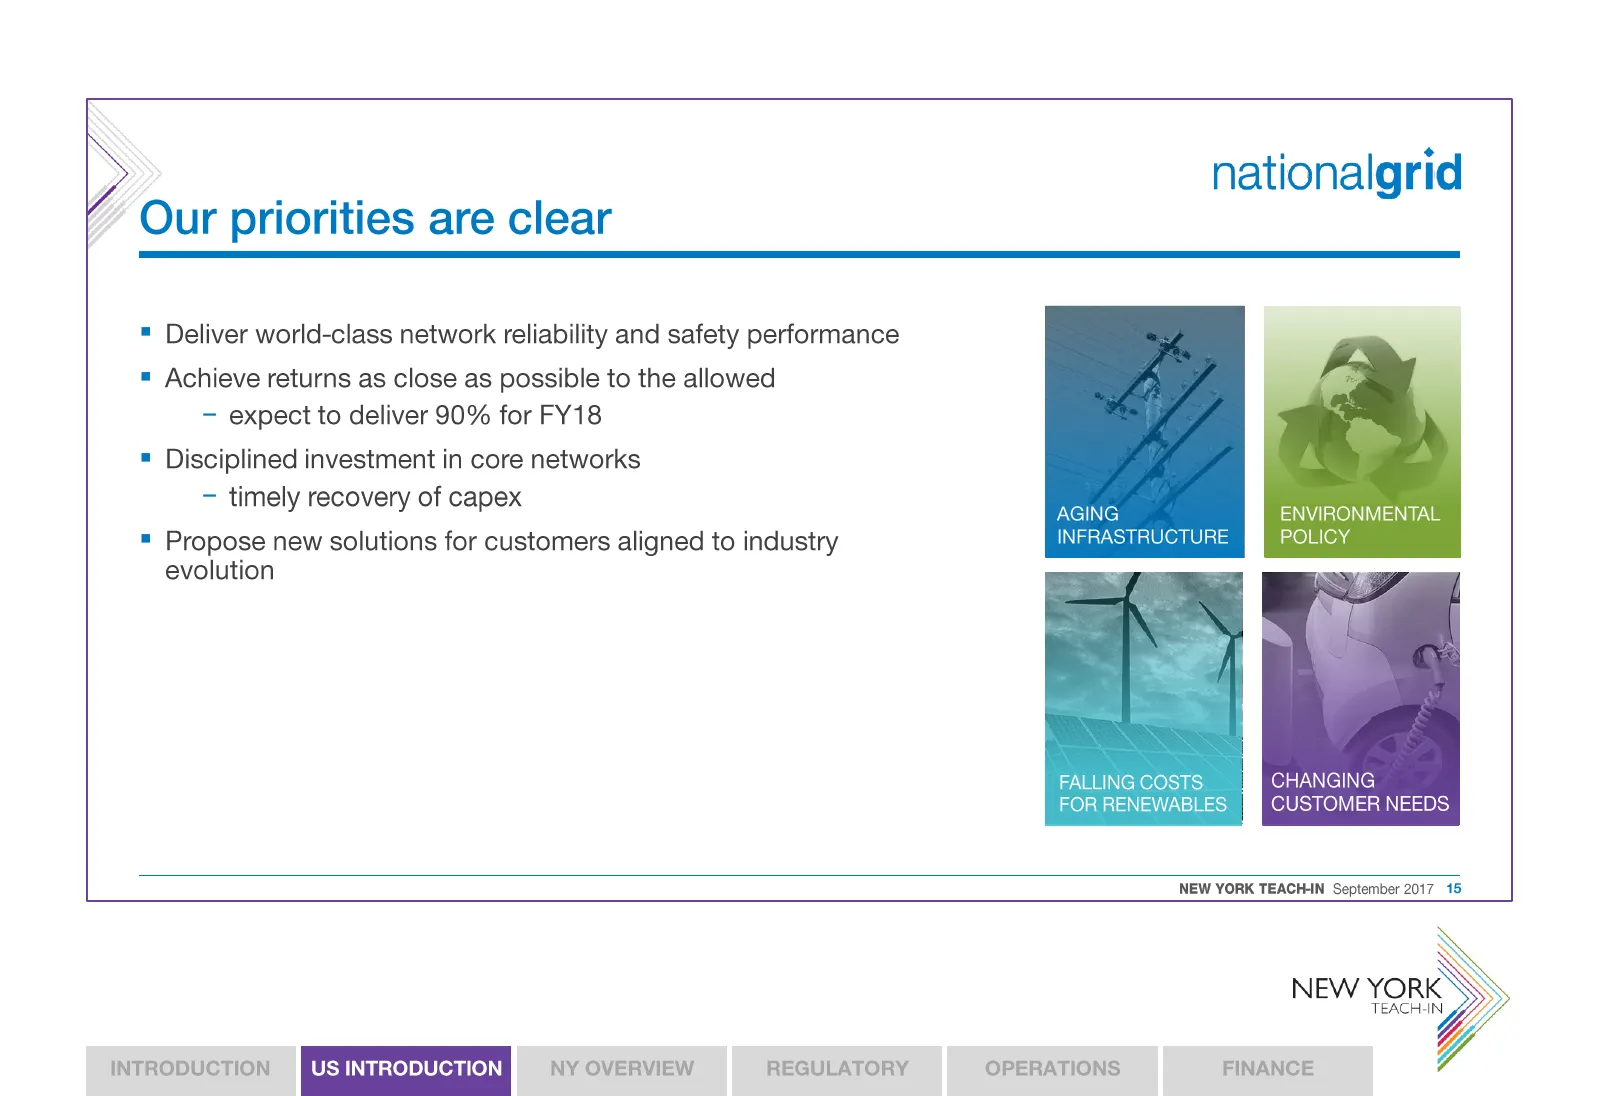
> nationalgrid Our priorities are clear = Deliver world-class network reliability and safety performance = Achieve returns as close as possible to the allowed - expect to deliver 90% for FY18 = Disciplined investment in core networks - timely recovery of capex AGING ENVIRONMEN = Propose new solution
Slide 16: Industry trends driving investment: aging infrastructure
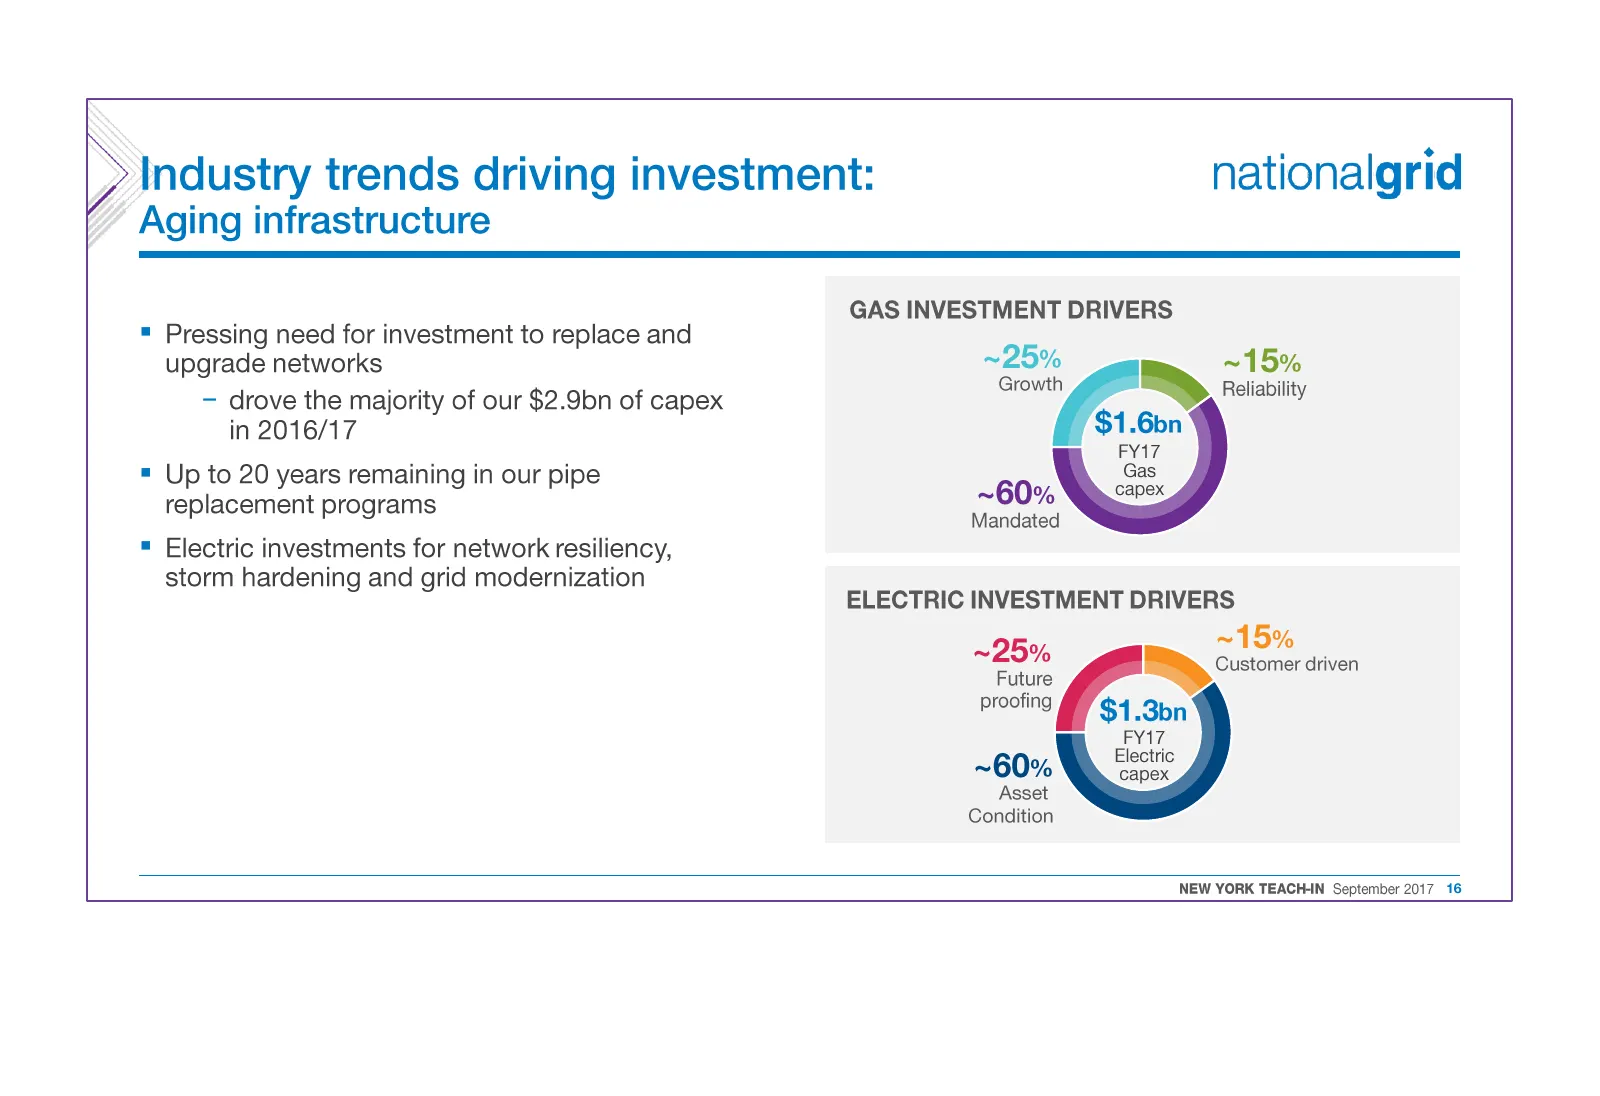
Industry trends driving investment: nationalgrid Aging infrastructure GAS INVESTMENT DRIVERS = Pressing need for investment to replace and upgrade networks ~25% ~15% vt Growth y Reliability — drove the majority of our $2.9bn of capex in 2016/17 =a = Up to 20 years remaining in our pipe Gas replaceme
Slide 17: Industry trends driving investment: environmental policy
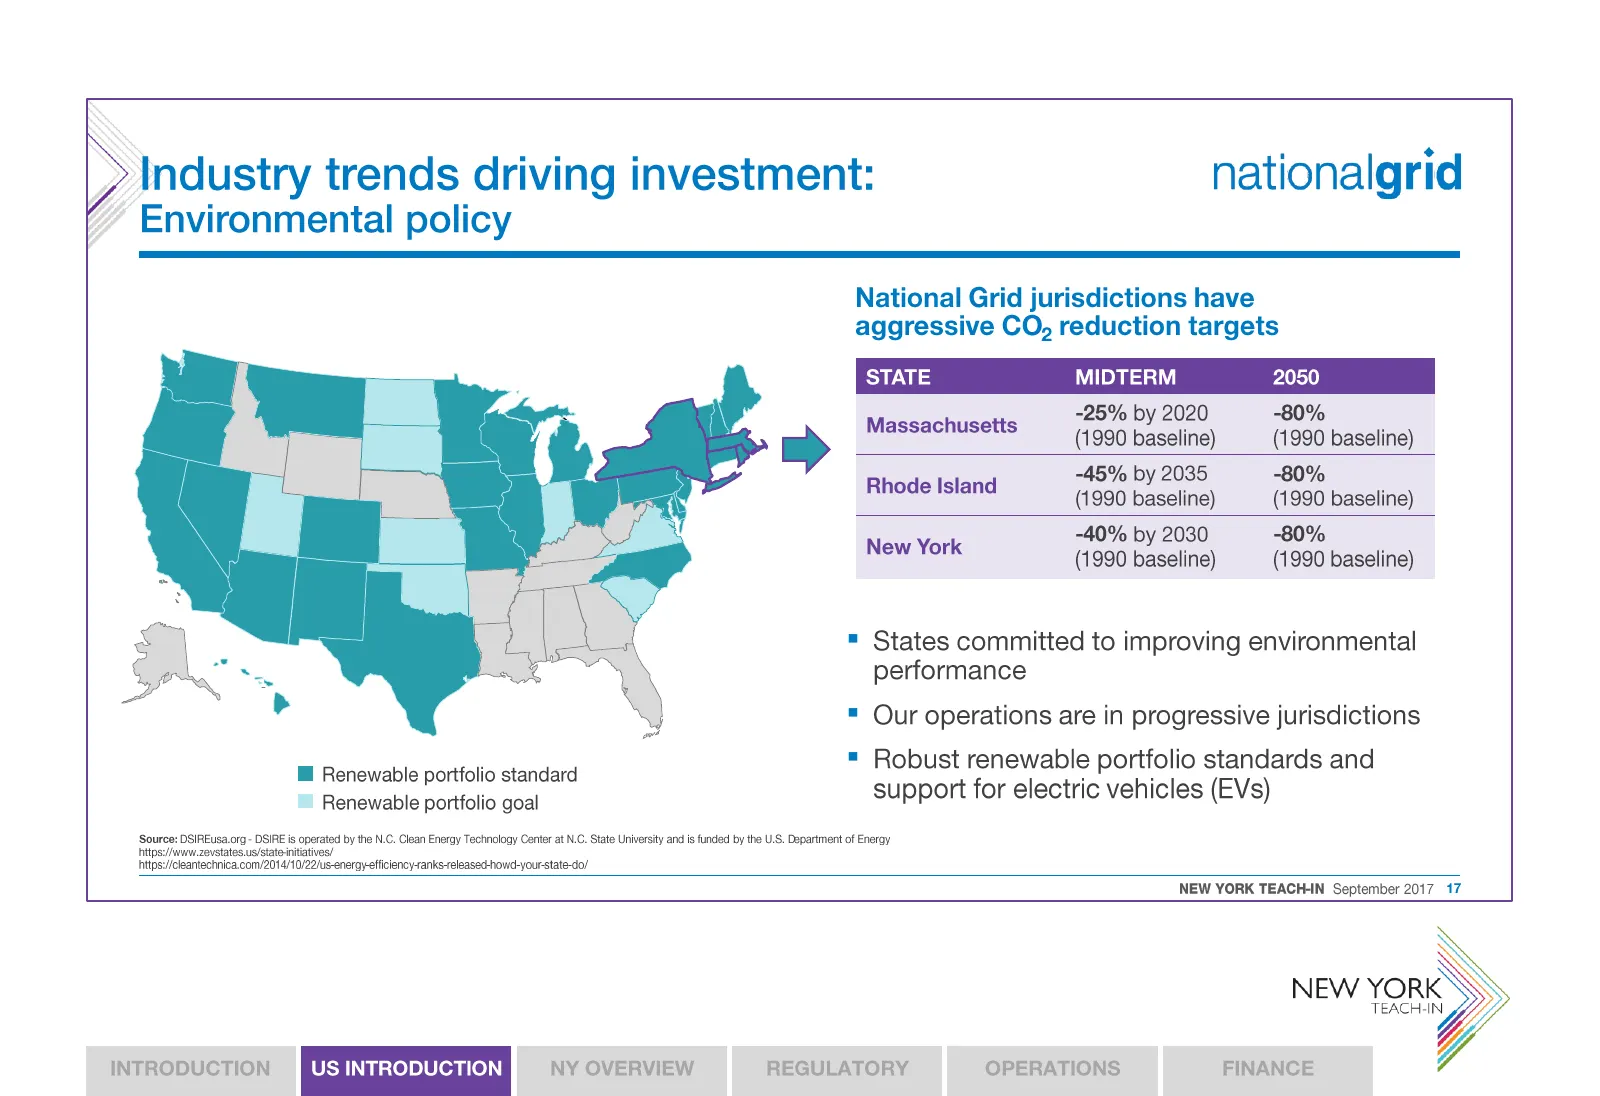
Industry trends driving investment: nationalgrid Environmental policy National Grid jurisdictions have aggressive CO, reduction targets STATE MIDTERM 2050 -25% by 2020 -80% Massachusetts (1990 baseline) __(1990 baseline) -45% by 2035 -80% Rhode Island (1990 baseline) __ (1990 baseline) New York 0% b
Slide 18: Industry trends driving investment: falling costs for renewables
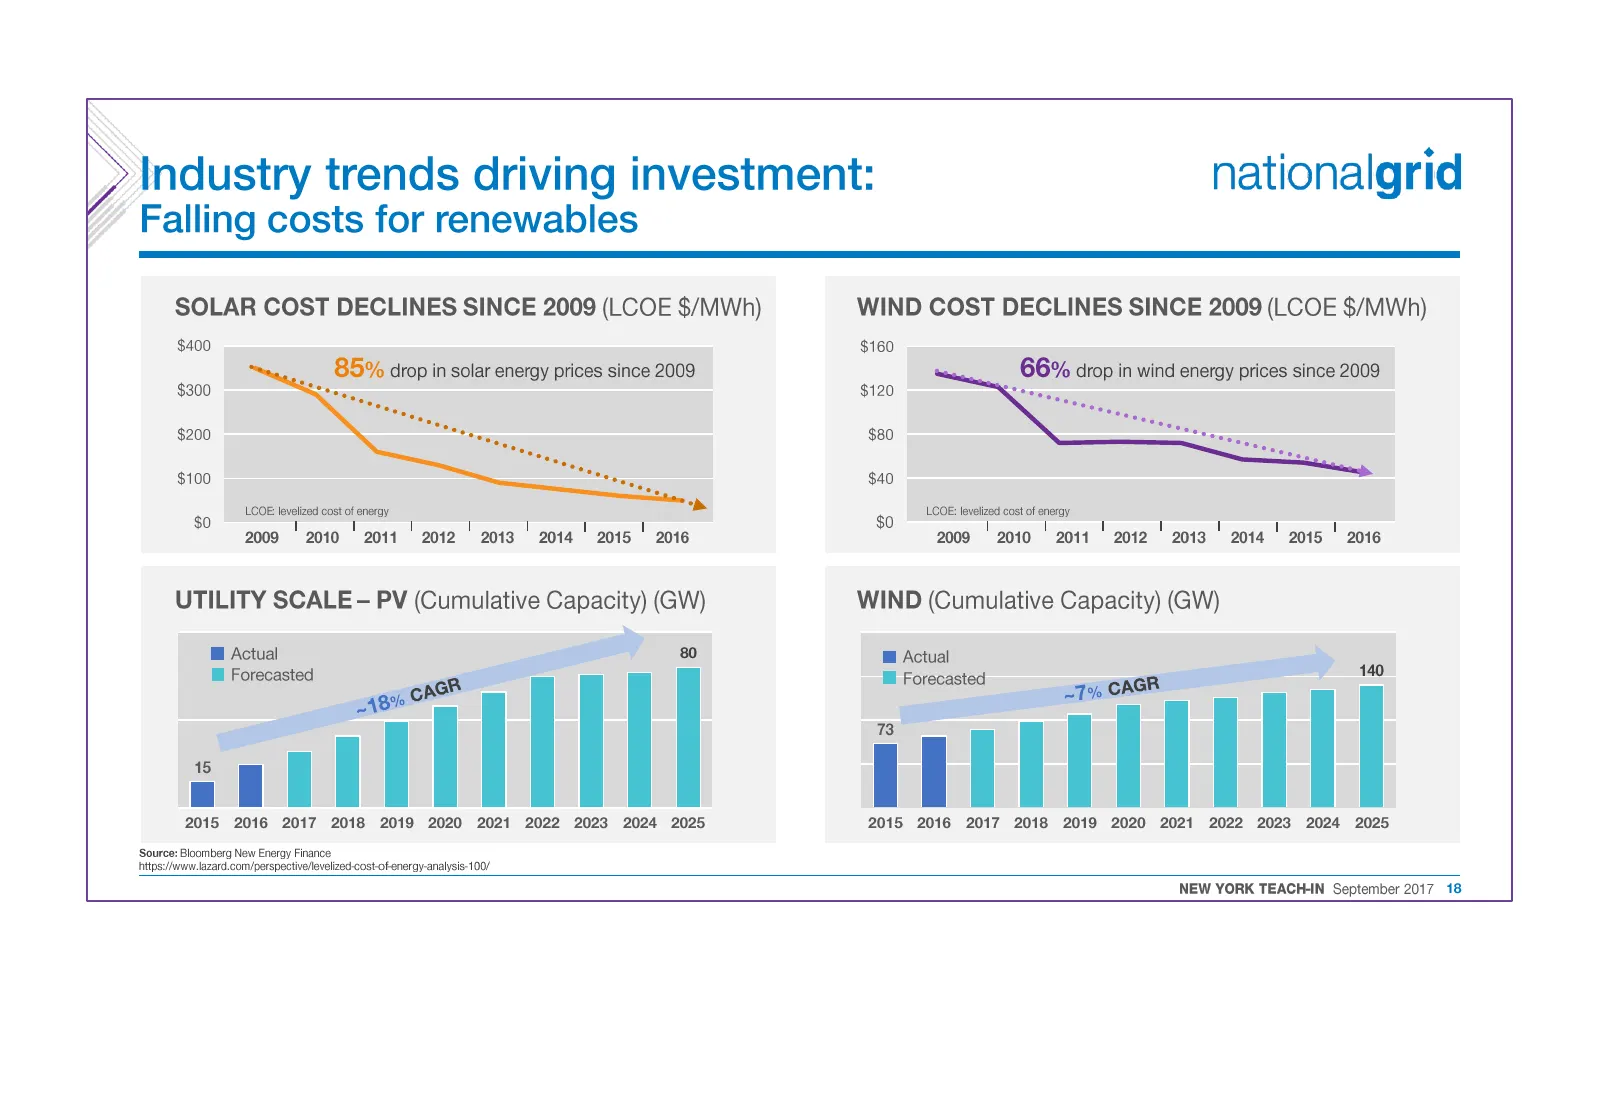
Industry trends driving investment: nationalgrid Falling costs for renewables SOLAR COST DECLINES SINCE 2009 (LCOE $/MWh) $400 85% drop in solar energy prices since 2009 $20) STE $200 ee goood oh 2009 " s010 " p011 ' 2012 ' 2013 ' 2014 ' 2015 ' 2016 UTILITY SCALE - PV (Cumulative Capacity) (GW) @ Ac
Slide 19: Industry trends driving investment: changing customer needs
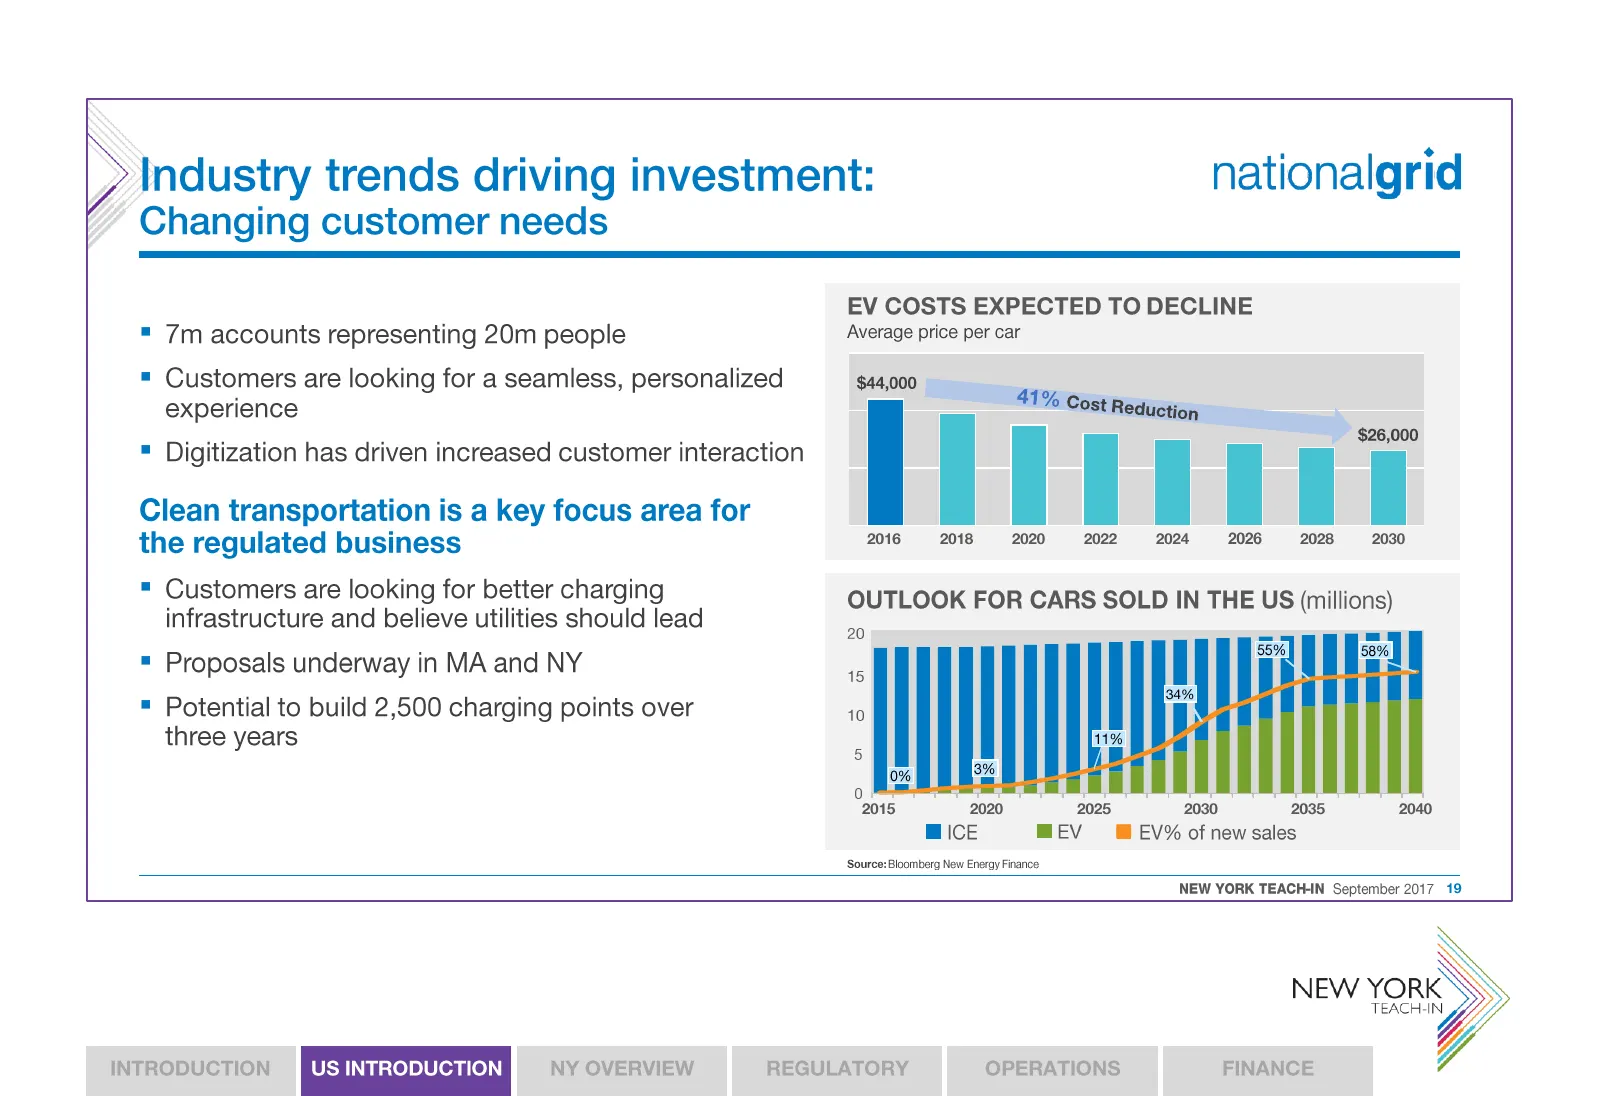
Industry trends driving investment: nationalgrid Changing customer needs EV COSTS EXPECTED TO DECLINE = 7m accounts representing 20m people Average price per car = Customers are looking for a seamless, personalized $44,000 = experience 1% Cost Reduction = Digitization has driven increased customer i
Slide 20: Organization evolved to support higher growth
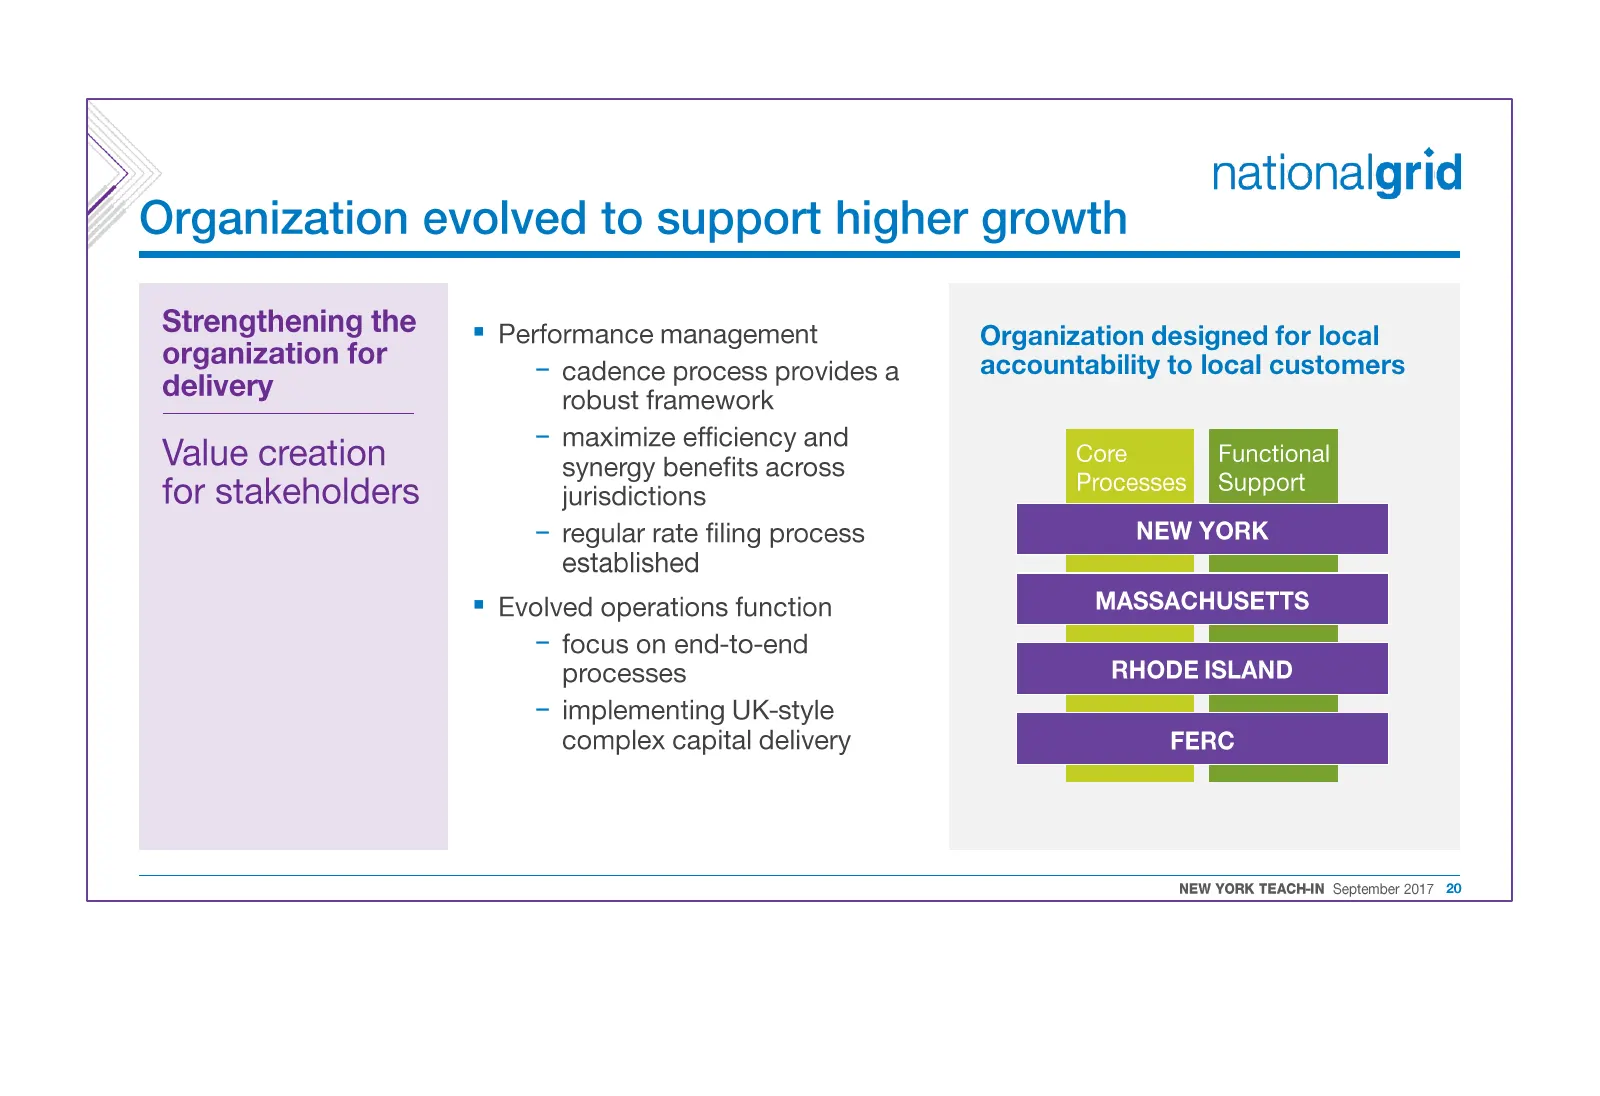
> nationalgrid Organization evolved to support higher growth Strengthening the « performance management Organization designed for local GIG EINTEOT Hy - cadence process provides a accountability to local customers delivery robust framework Value creation ~ eee onic sercce Functional for stakeholders
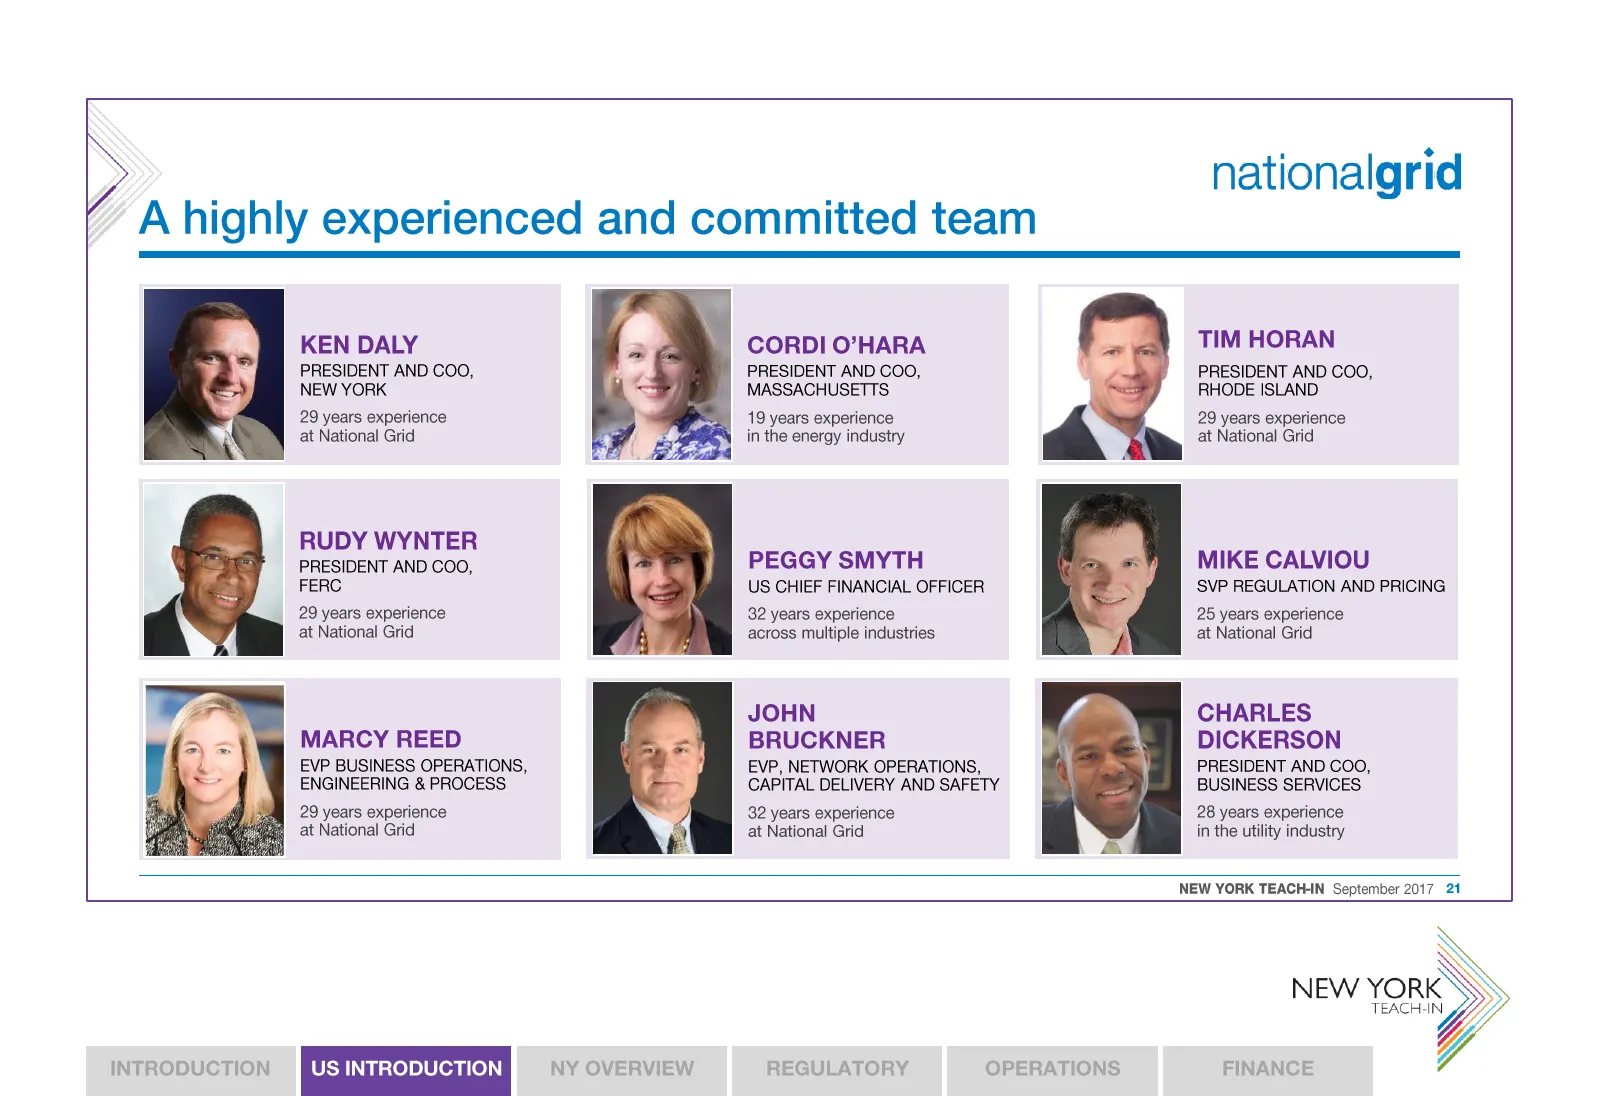
Slide 21: A highly experienced and committed team
KEN DALY PRESIDENT AND COO, NEW YORK 29 years experience at National Grid RUDY WYNTER PRESIDENT AND COO, FERC 29 years experience at National Grid MARCY REED EVP BUSINESS OPERATIONS, ENGINEERING & PROCESS 29 years experience at National Grid A highly experienced and committed team CORDI O’HARA PRESI
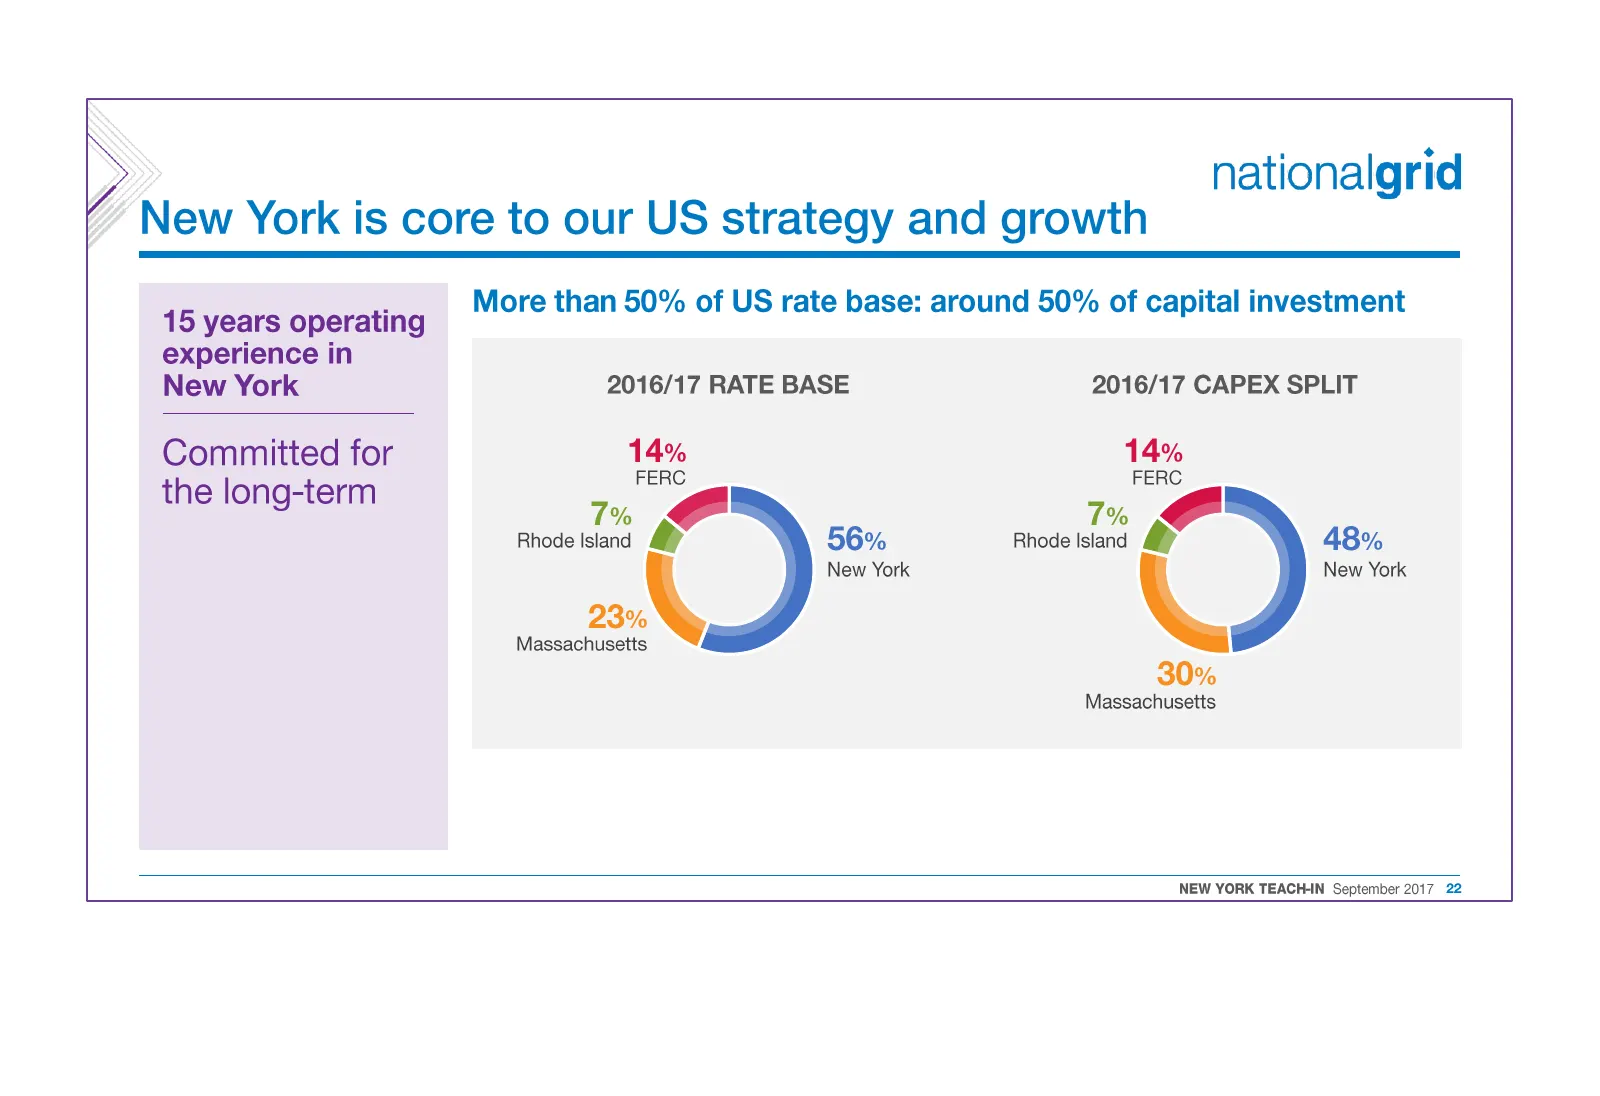
Slide 22: New York is core to our US strategy and growth
experience in New York the long-term » New York is core to our US strategy and growth 15 years operating Committed for nationalgrid More than 50% of US rate base: around 50% of capital investment 2016/17 RATE BASE 2016/17 CAPEX SPLIT 14% 14% FERC FERC 7% , a 7% Rhode Island Mp 56% Rhode stand @p 48%
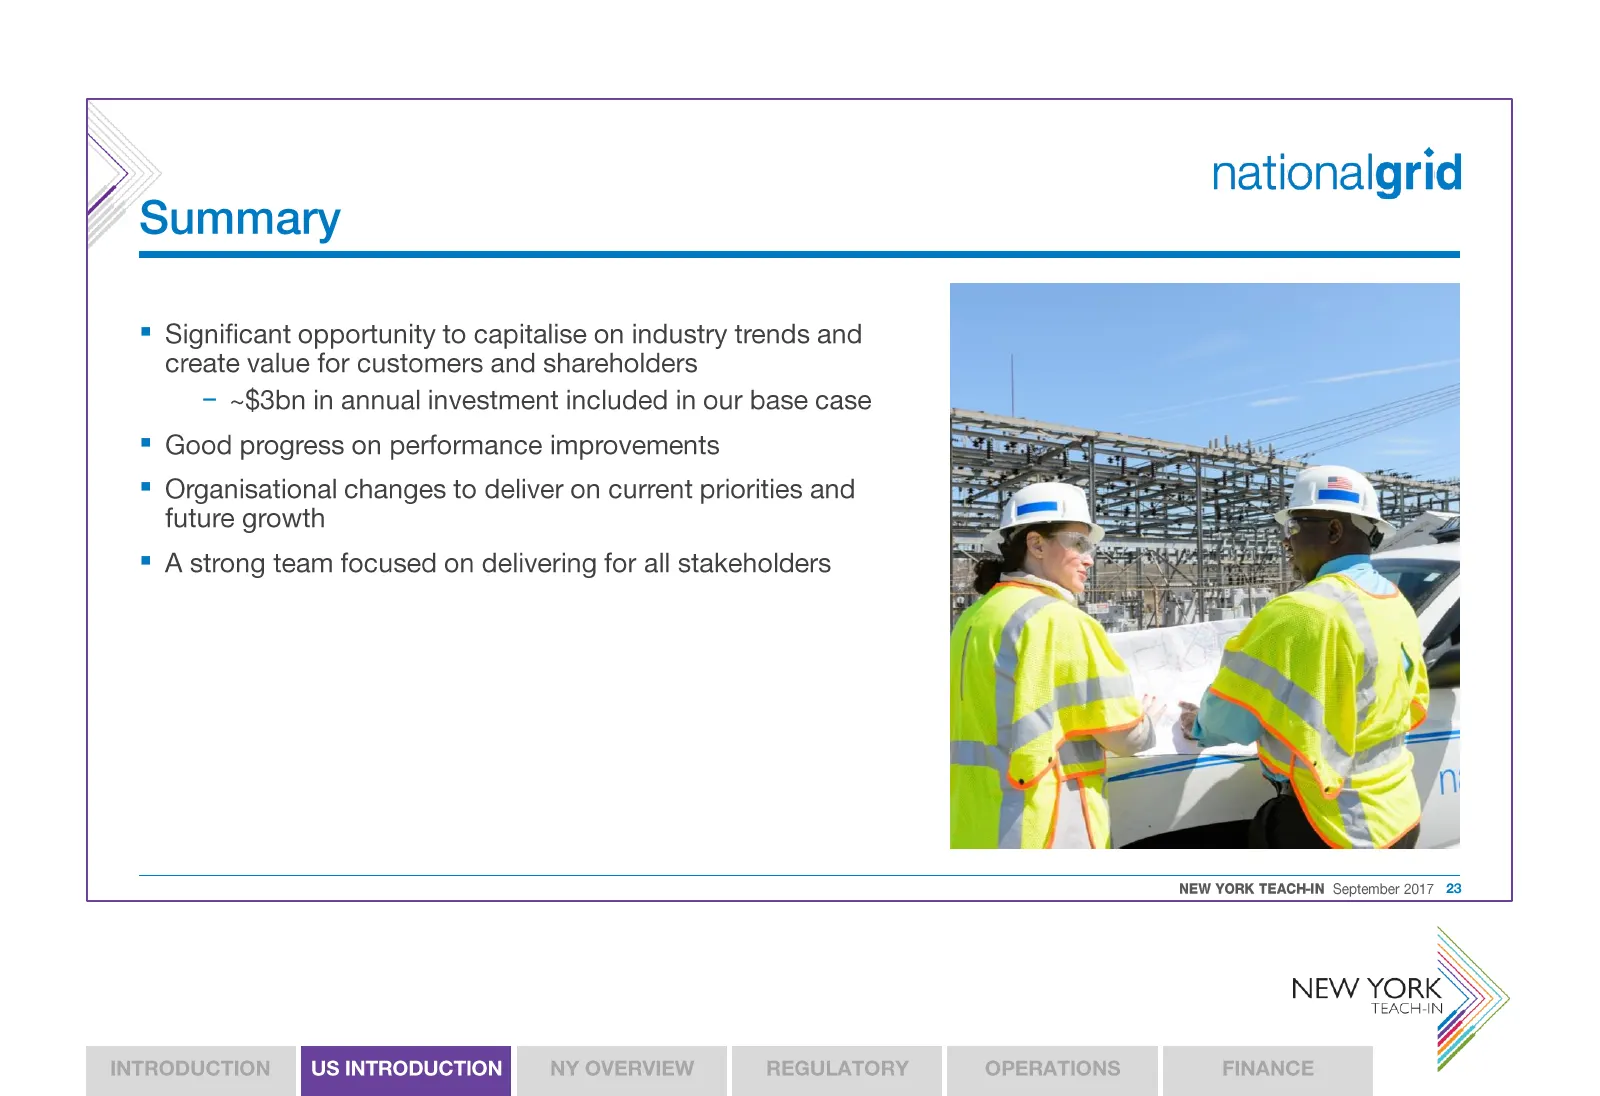
Slide 23: Summary
> nationalgrid Summary Significant opportunity to capitalise on industry trends and create value for customers and shareholders — ~$3bn in annual investment included in our base case = Good progress on performance improvements = Organisational changes to deliver on current priorities and future grow

Slide 24: Deliberately left blank
Deliberately left blank
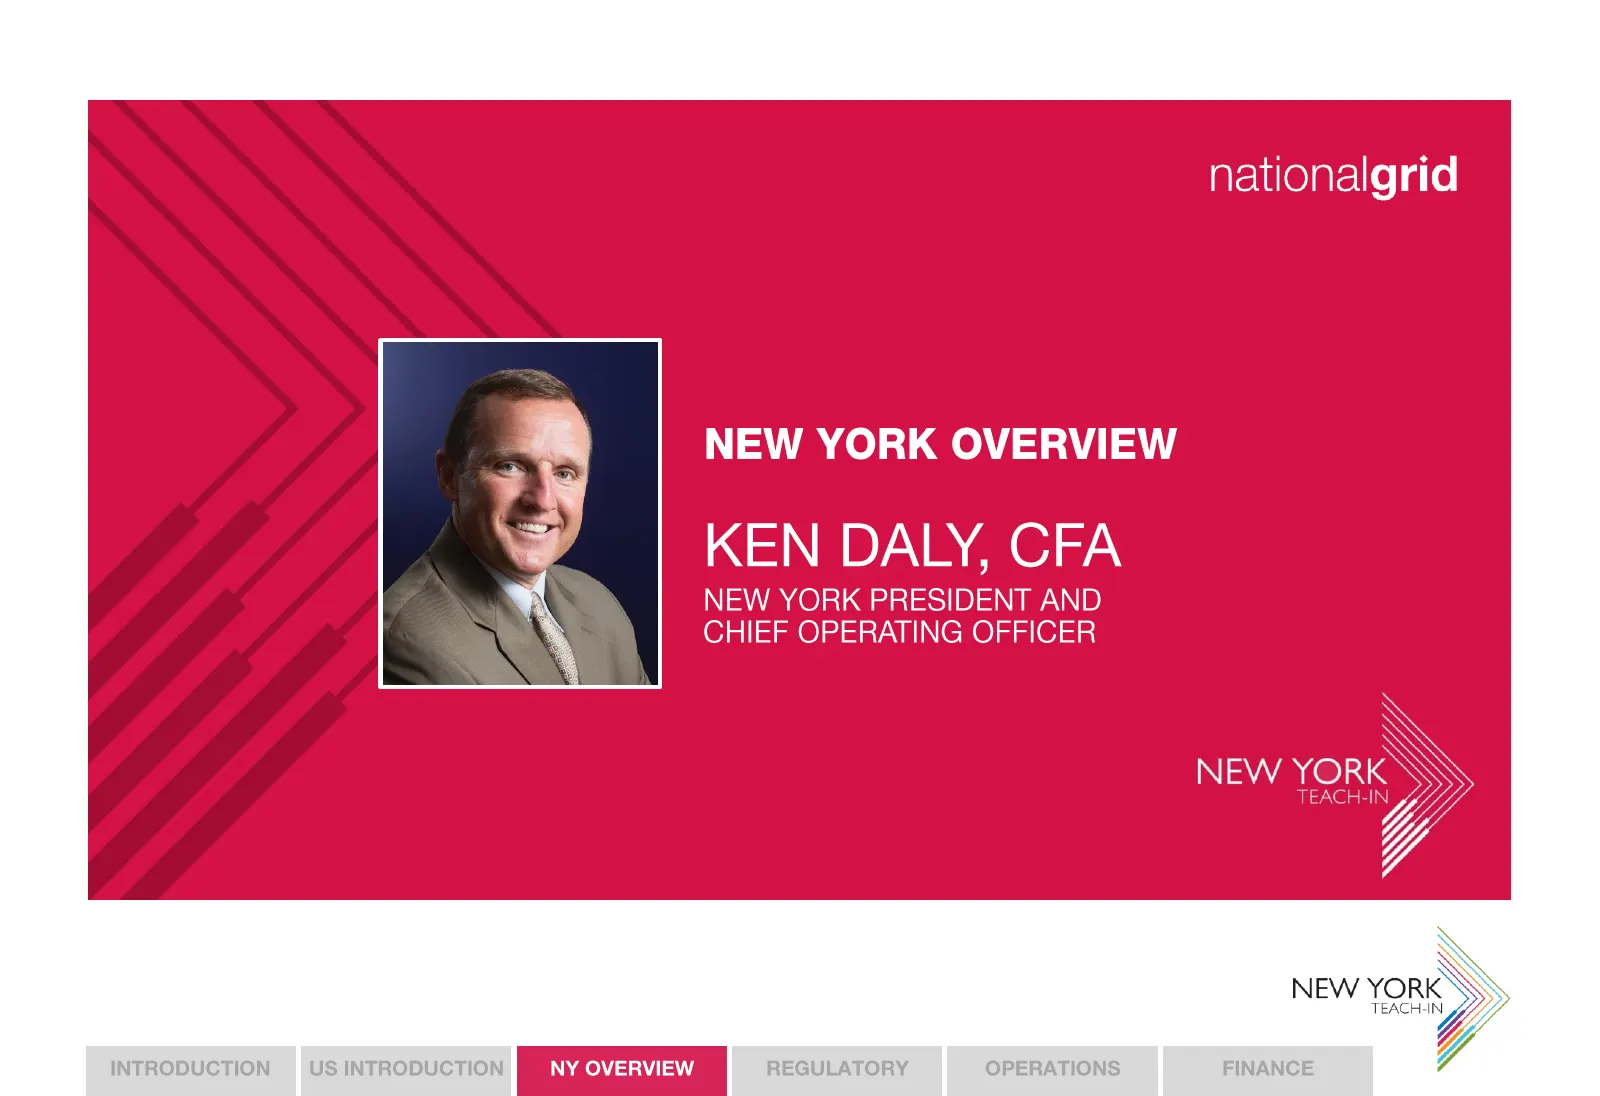
Slide 25: New York Overview
Slide 26: Ken Daly, CFA
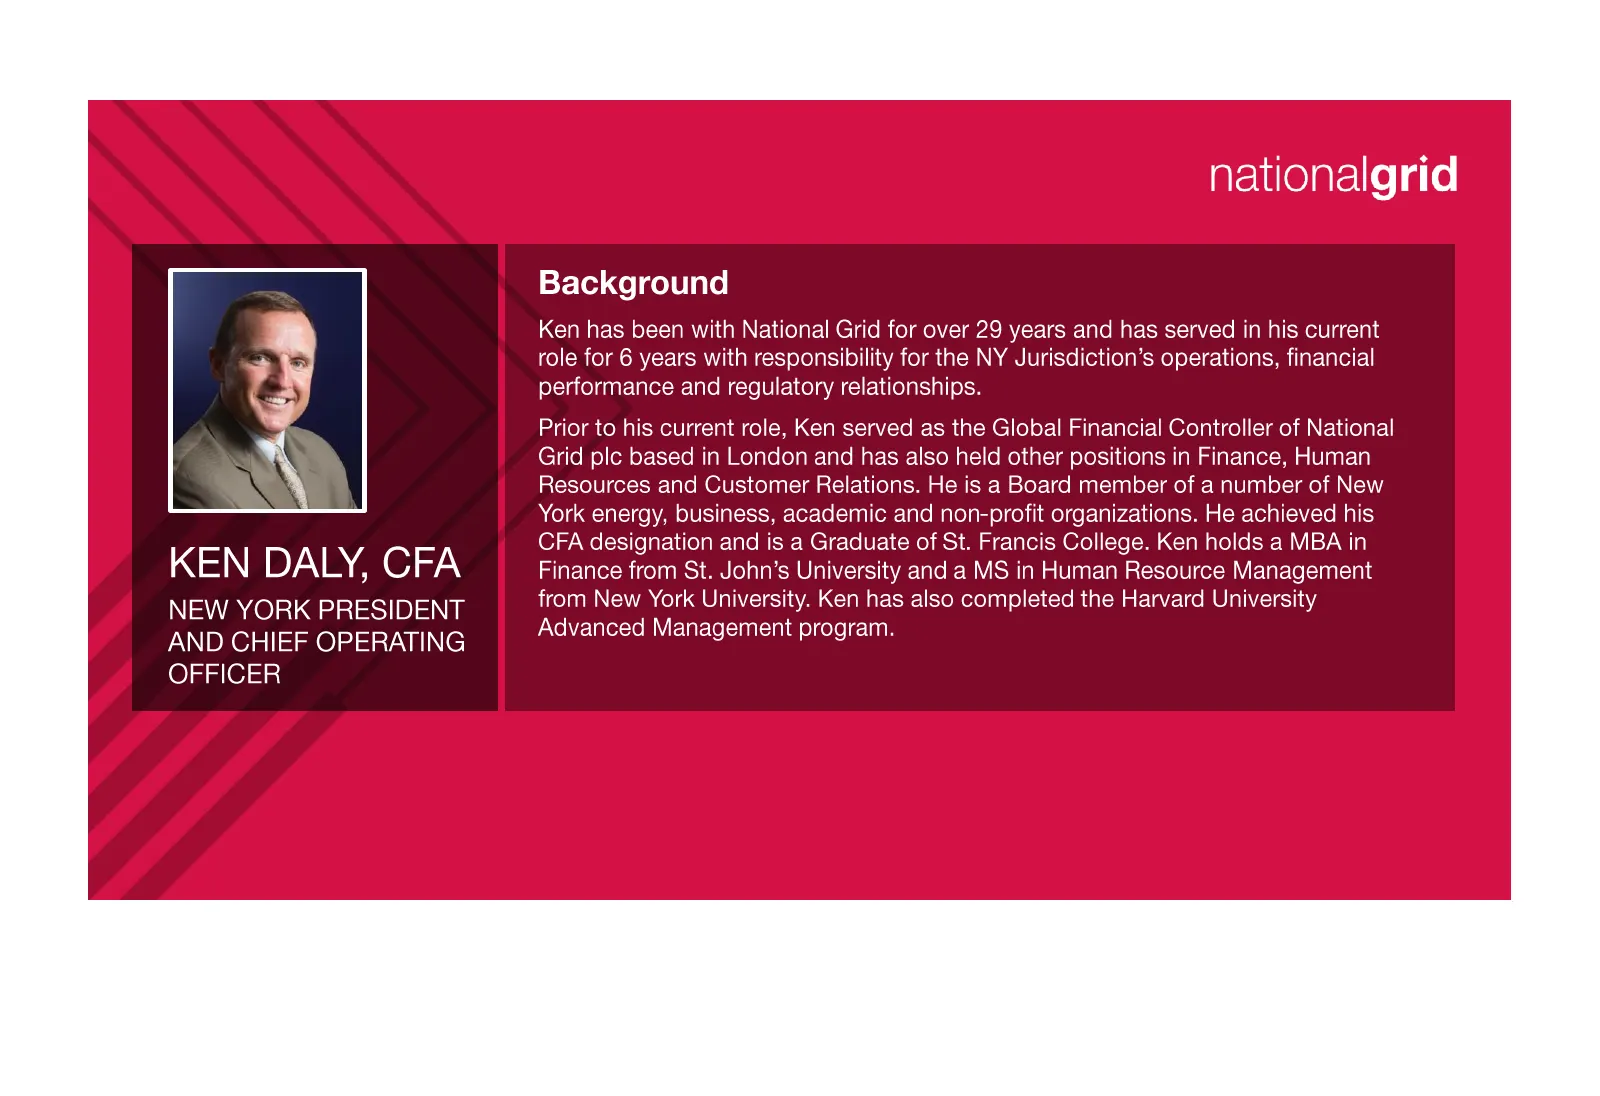
KEN DALY, CFA NEW YORK PRESIDENT AND CHIEF OPERATING OFFICER Background Ken has been with National Grid for over 29 years and has served in his current role for 6 years with responsibility for the NY Jurisdiction’s operations, financial performance and regulatory relationships. Prior to his current
Slide 27: National Grid has a major presence in NY State
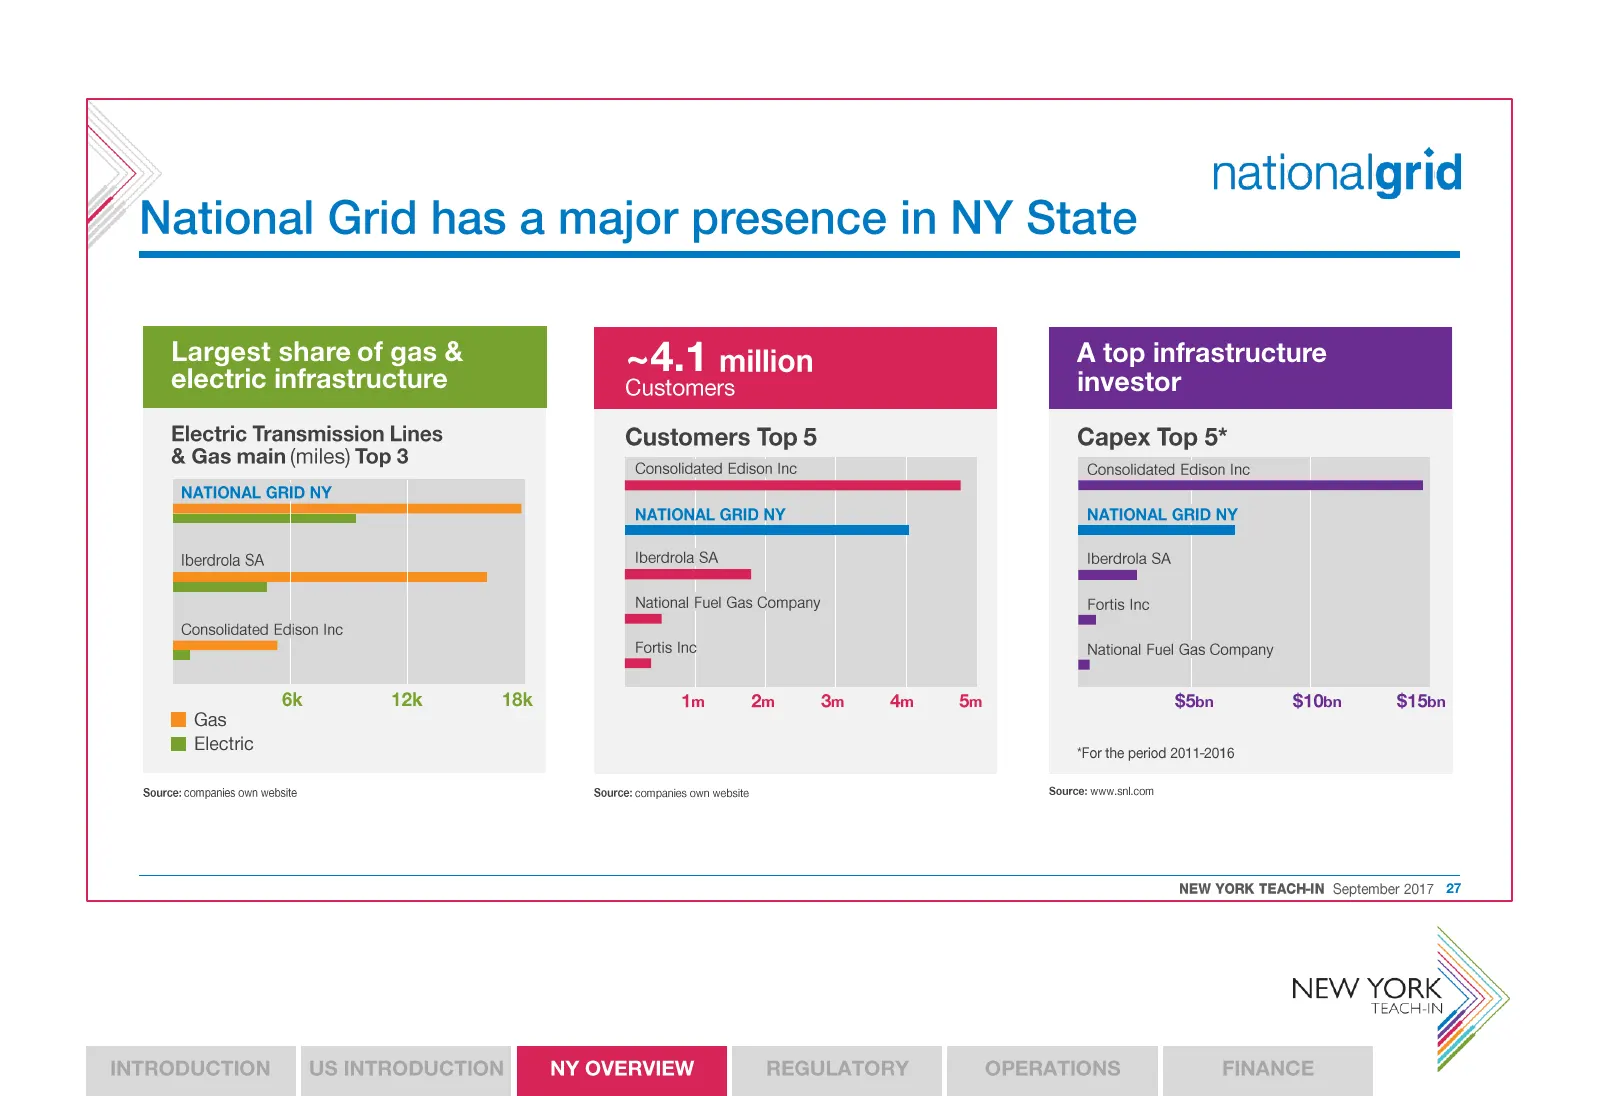
nationalgrid National Grid has a major presence in NY State Largest share of gas & electric infrastructure ~4.1 million Customers A top infrastructure investor Electric Transmission Lines & Gas main (miles) Top 3 NATIONAL GRID NY ———————— Iberdrola SA Consolidated Edison Inc _ 6k 12k 18k @ Gas @ Ele
Slide 28: New York overview and rate base
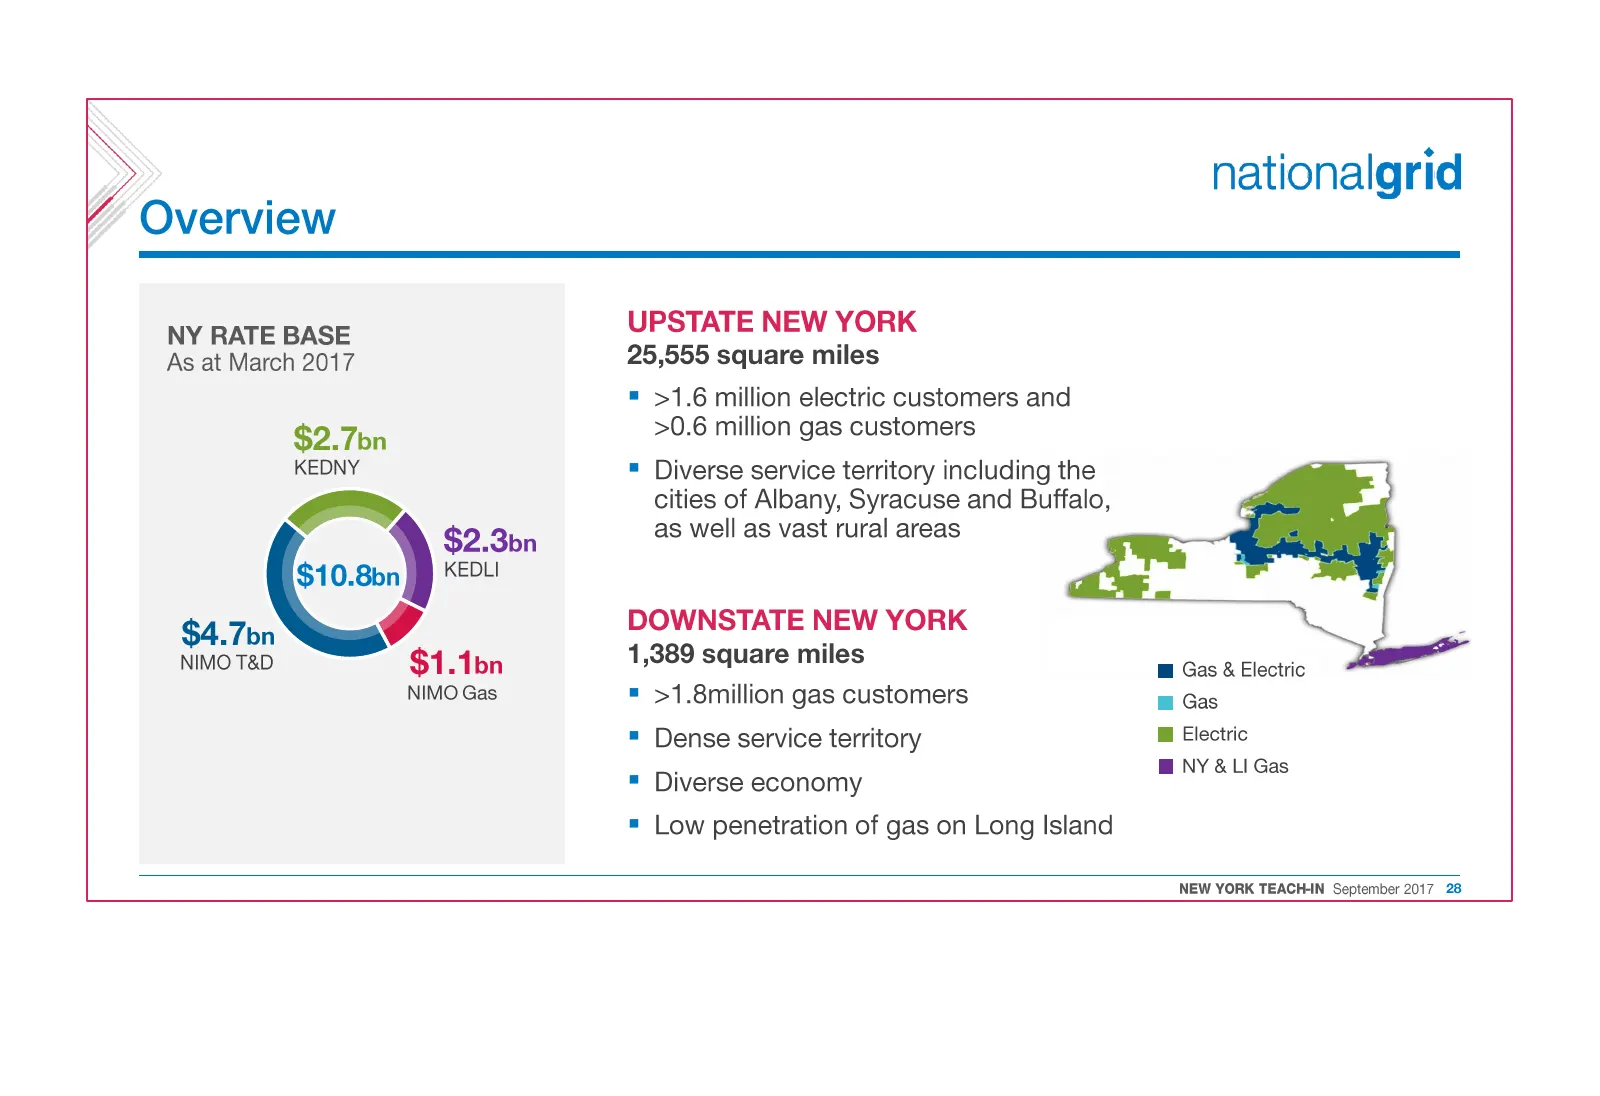
Dv ecview NY RATE BASE As at March 2017 $2.7bn KEDNY } ) $2.3bn $1 0.8bn KEDLI $4.7bn 4 NIMO T&D $1.1bn NIMO Gas UPSTATE NEW YORK 25,555 square miles = >1.6 million electric customers and >0.6 million gas customers = Diverse service territory including the cities of Albany, Syracuse and Buffalo, as
Slide 29: NY has been delivering improving financial performance
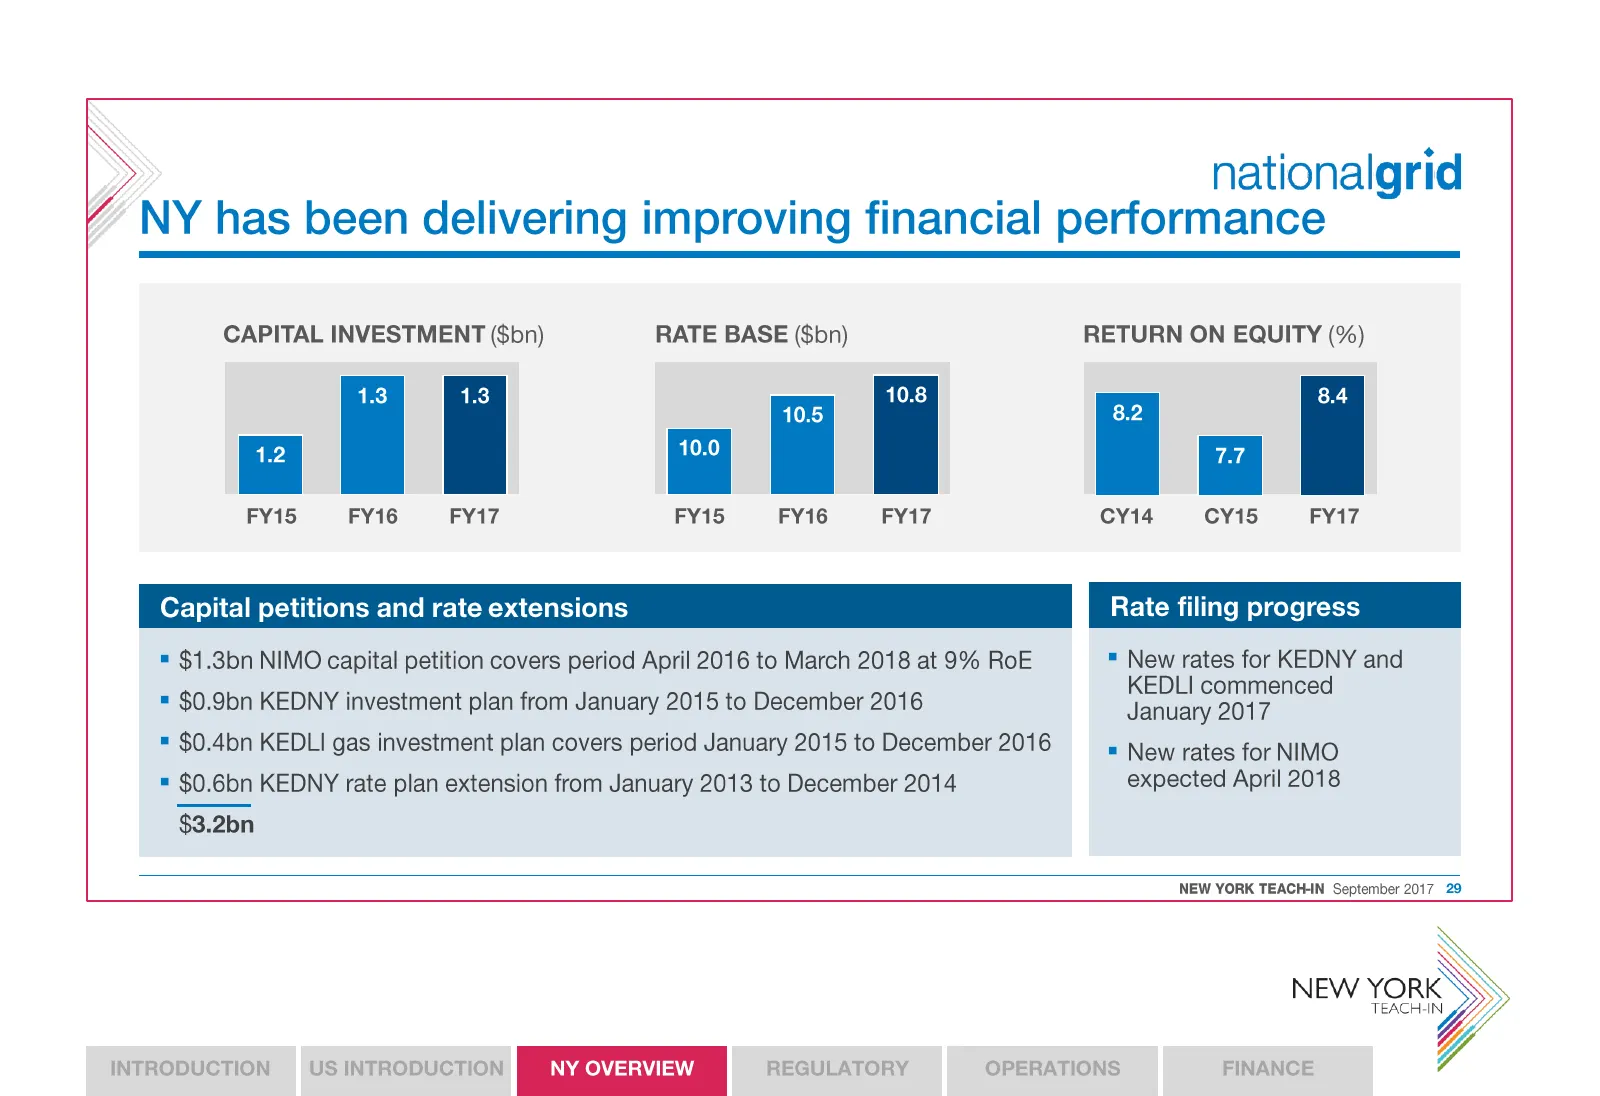
nationalgrid NY has been delivering improving financial performance CAPITAL INVESTMENT ($bn) RATE BASE ($bn) RETURN ON EQUITY (%) FY15 FY16 FY17 FY15 FY16 FY17 cY14. = CY15 FY17 Capital petitions and rate extensions Rate filing progress = $1.3bn NIMO capital petition covers period April 2016 to Marc
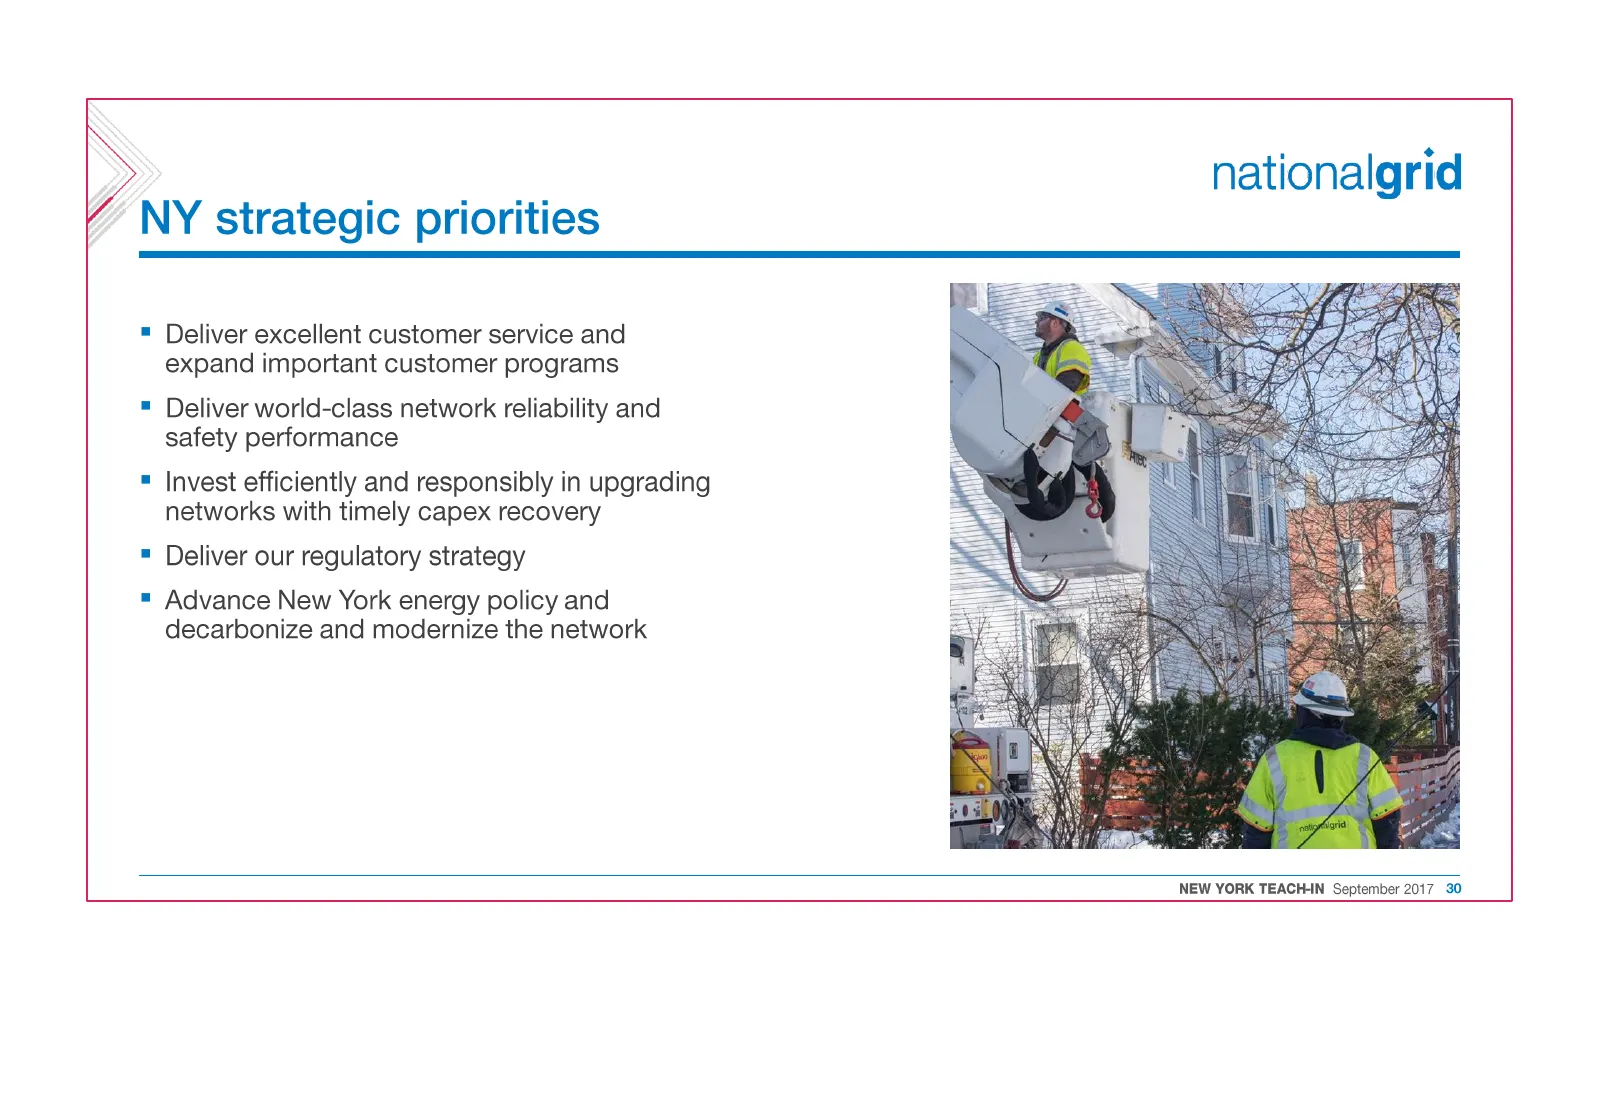
Slide 30: NY strategic priorities
nationalgrid NY strategic priorities = Deliver excellent customer service and expand important customer programs = Deliver world-class network reliability and safety performance = Invest efficiently and responsibly in upgrading networks with timely capex recovery = Deliver our regulatory strategy =
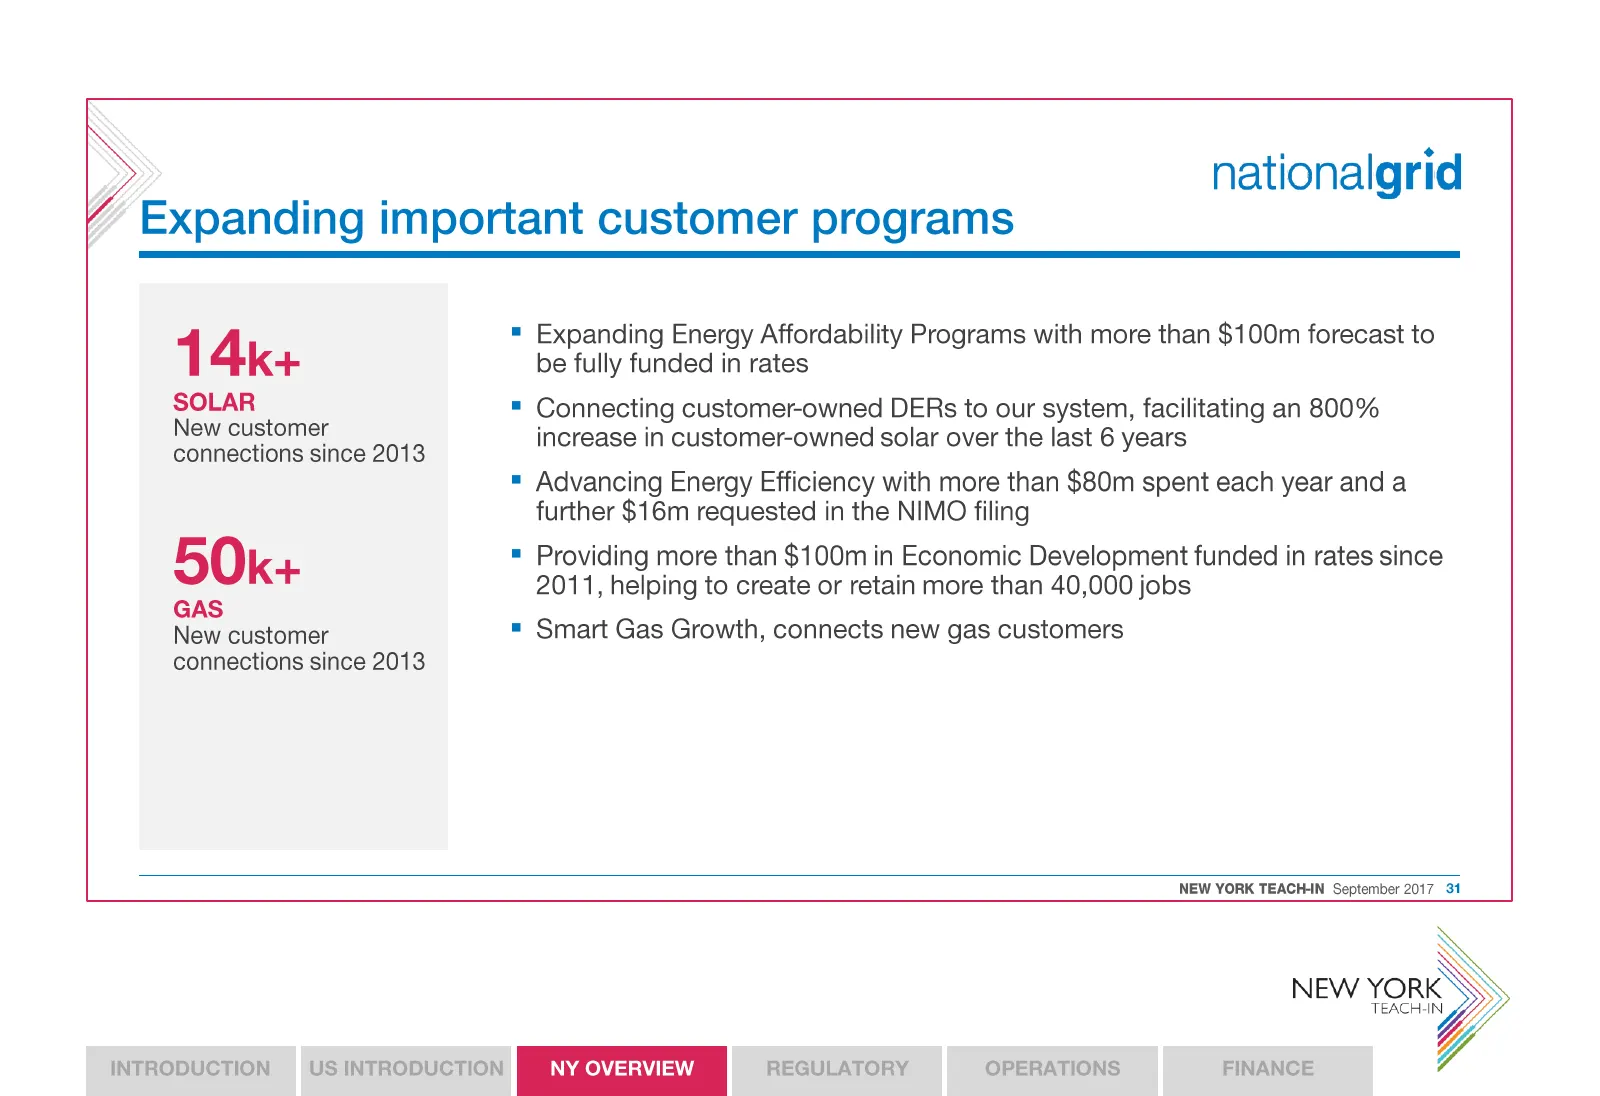
Slide 31: Expanding important customer programs
connections since 2013 GAS New customer connections since 2013 Smart Gas Growth, connects new gas customers » nationalgrid Expanding important customer programs " Expanding Energy Affordability Programs with more than $100m forecast to 1 4k+ be fully funded in rates SOLAR = Connecting customer-owned
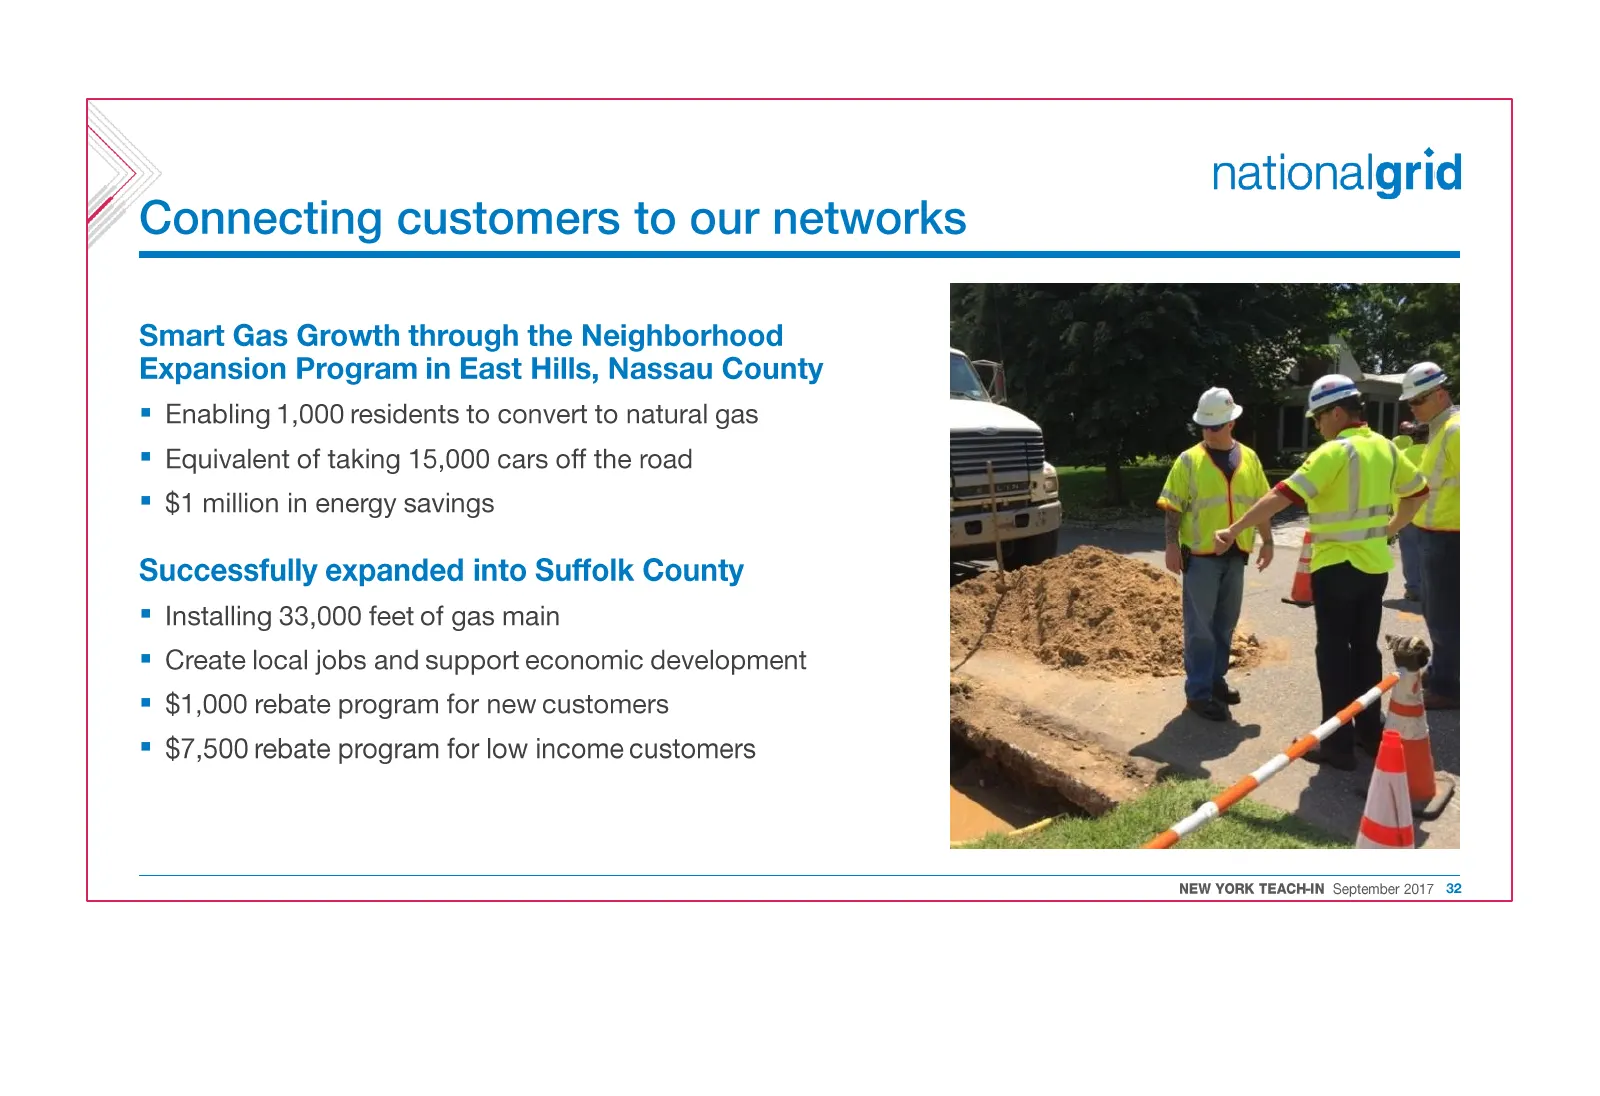
Slide 32: Connecting customers to our networks
» nationalgrid Connecting customers to our networks Smart Gas Growth through the Neighborhood Expansion Program in East Hills, Nassau County = Enabling 1,000 residents to convert to natural gas = Equivalent of taking 15,000 cars off the road = $1 million in energy savings Successfully expanded into
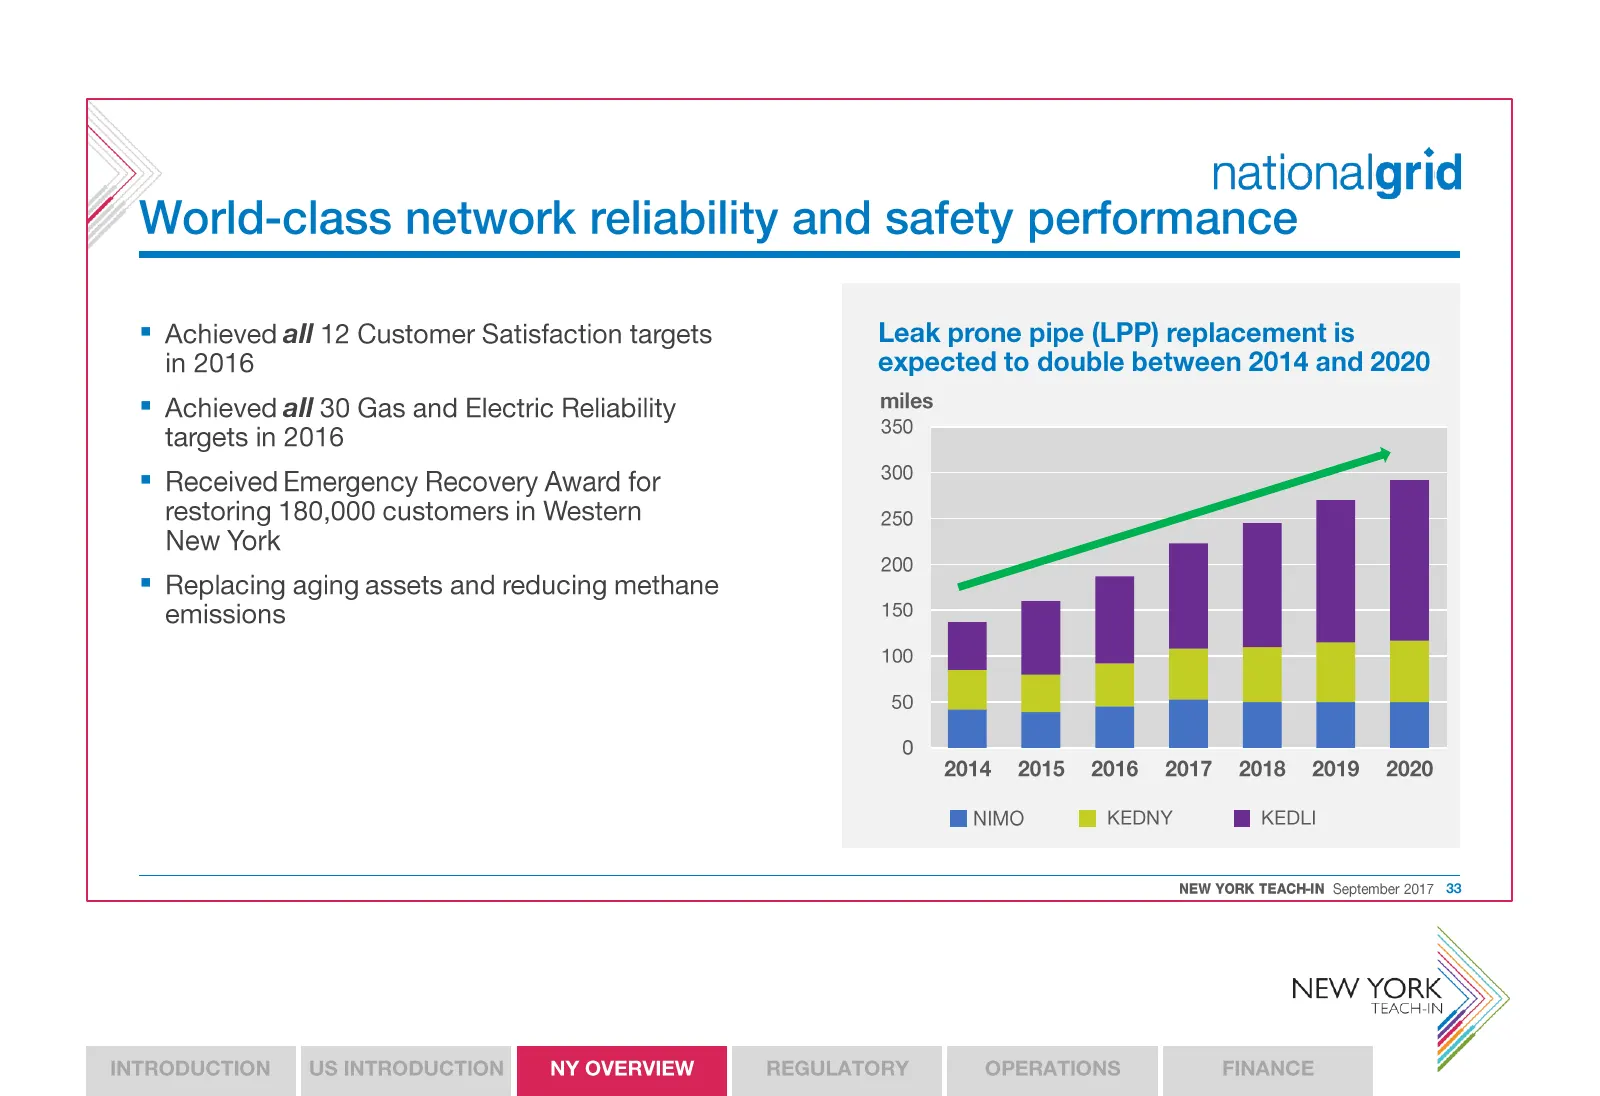
Slide 33: World-class network reliability and safety performance
» nationalgrid World-class network reliability and safety performance = Achieved all 12 Customer Satisfaction targets Leak prone pipe (LPP) replacement is in 2016 expected to double between 2014 and 2020 " Achieved all 30 Gas and Electric Reliability miles targets in 2016 ey " Received Emergency Rec
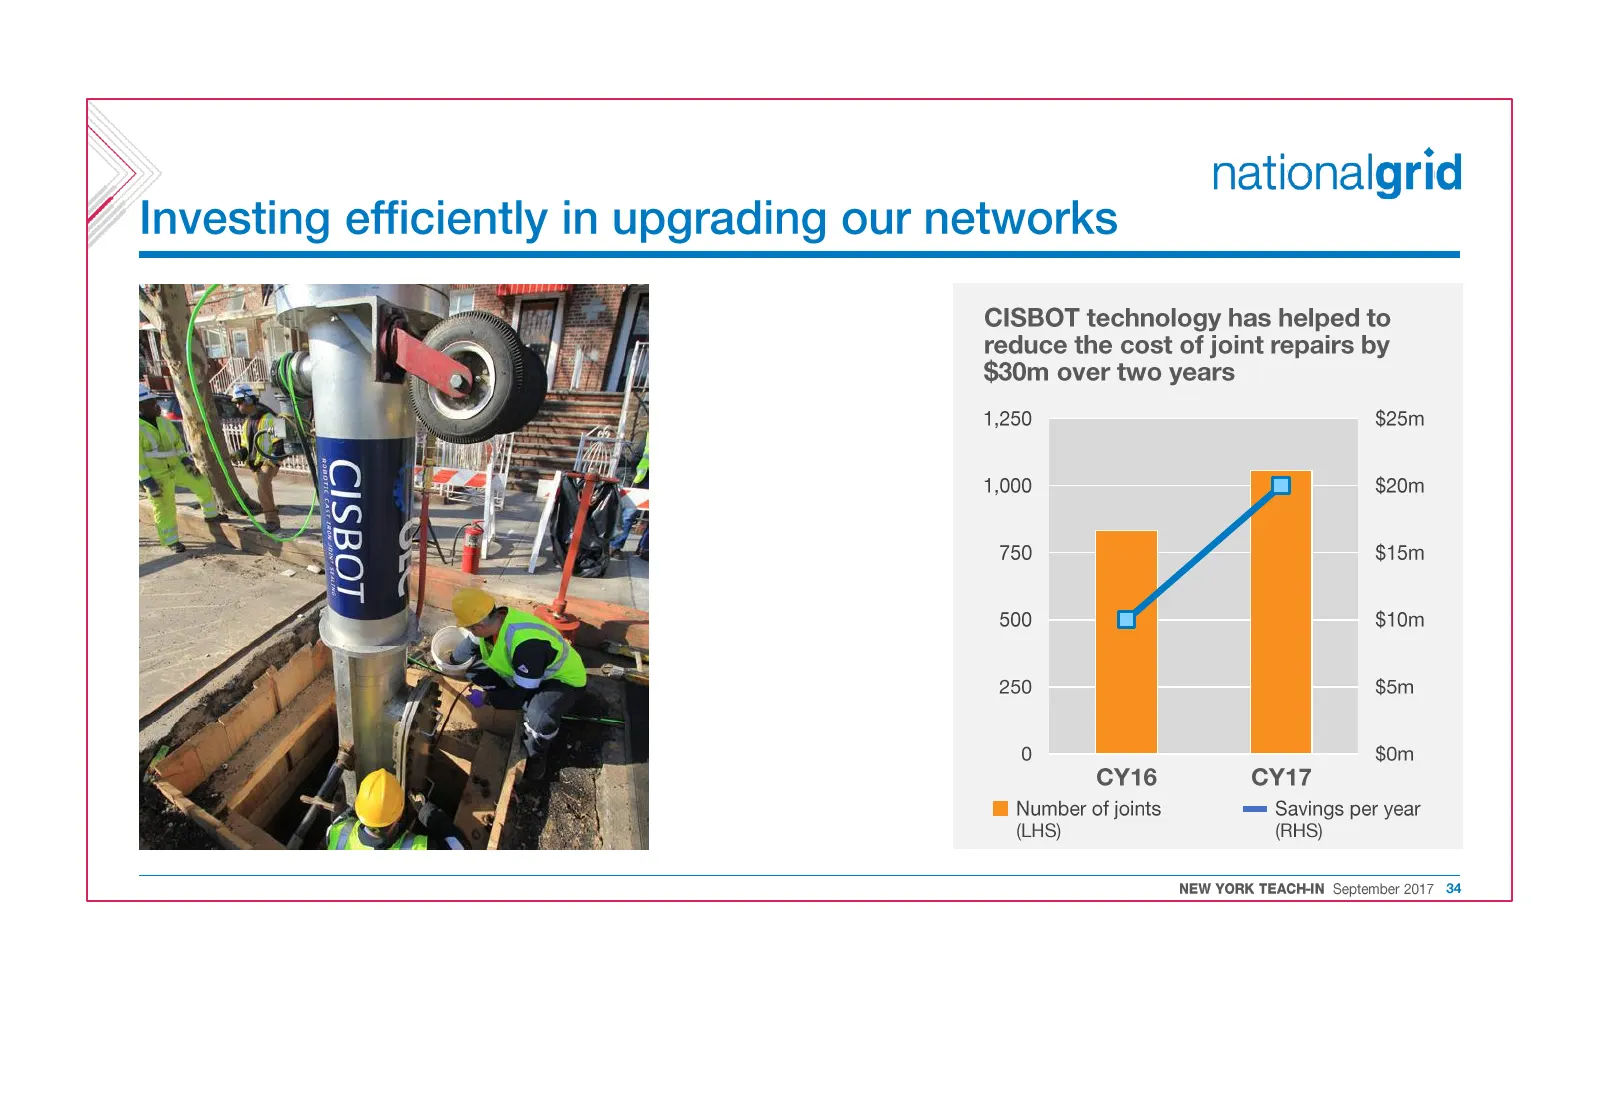
Slide 34: Investing efficiently in upgrading our networks
» nationalgrid Investing efficiently in upgrading our networks CISBOT technology has helped to reduce the cost of joint repairs by $30m over two years 1,250 $25m 1,000 $20m 750 $15m 500 $10m 250 $5m 0 $om CY16 CY17 @ Number of joints = Savings per year (LHS) (RHS) NEW YORK TEACHAN September 2017 34
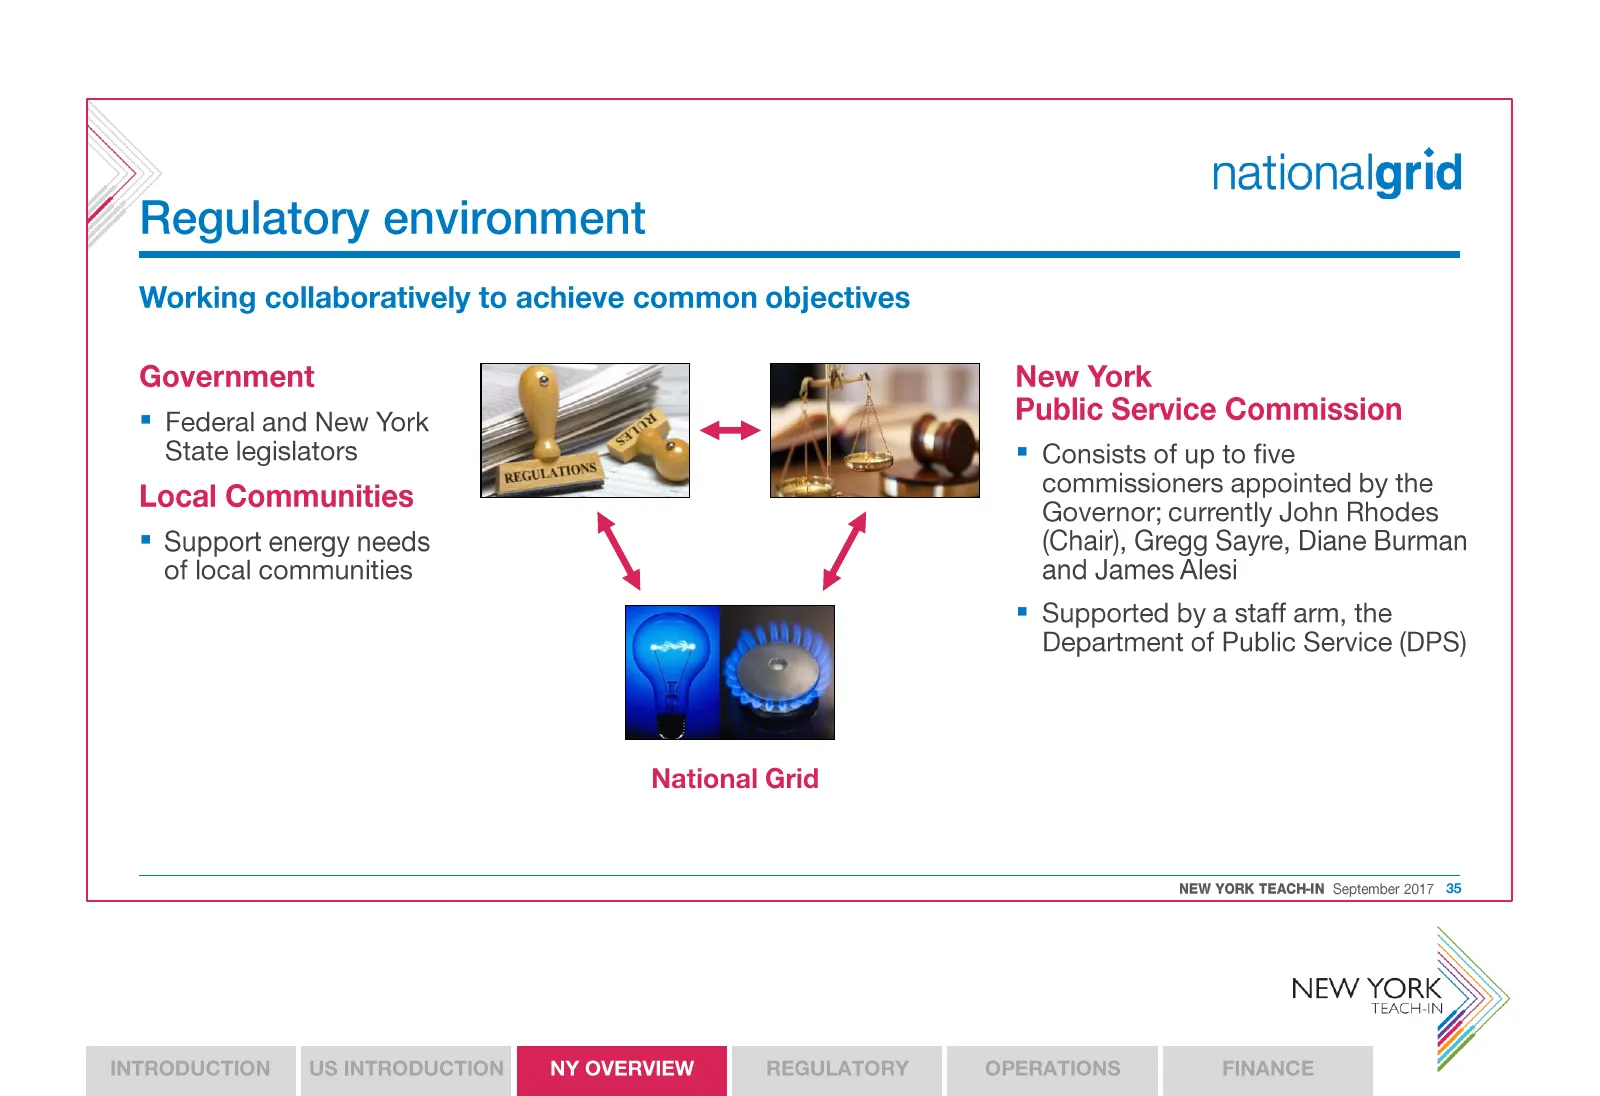
Slide 35: Regulatory environment
» nationalgrid Regulatory environment Working collaboratively to achieve common objectives New York Public Service Commission = Consists of up to five commissioners appointed by the Governor; currently John Rhodes (Chair), Gregg Sayre, Diane Burman and James Alesi = Supported by a staff arm, the Dep
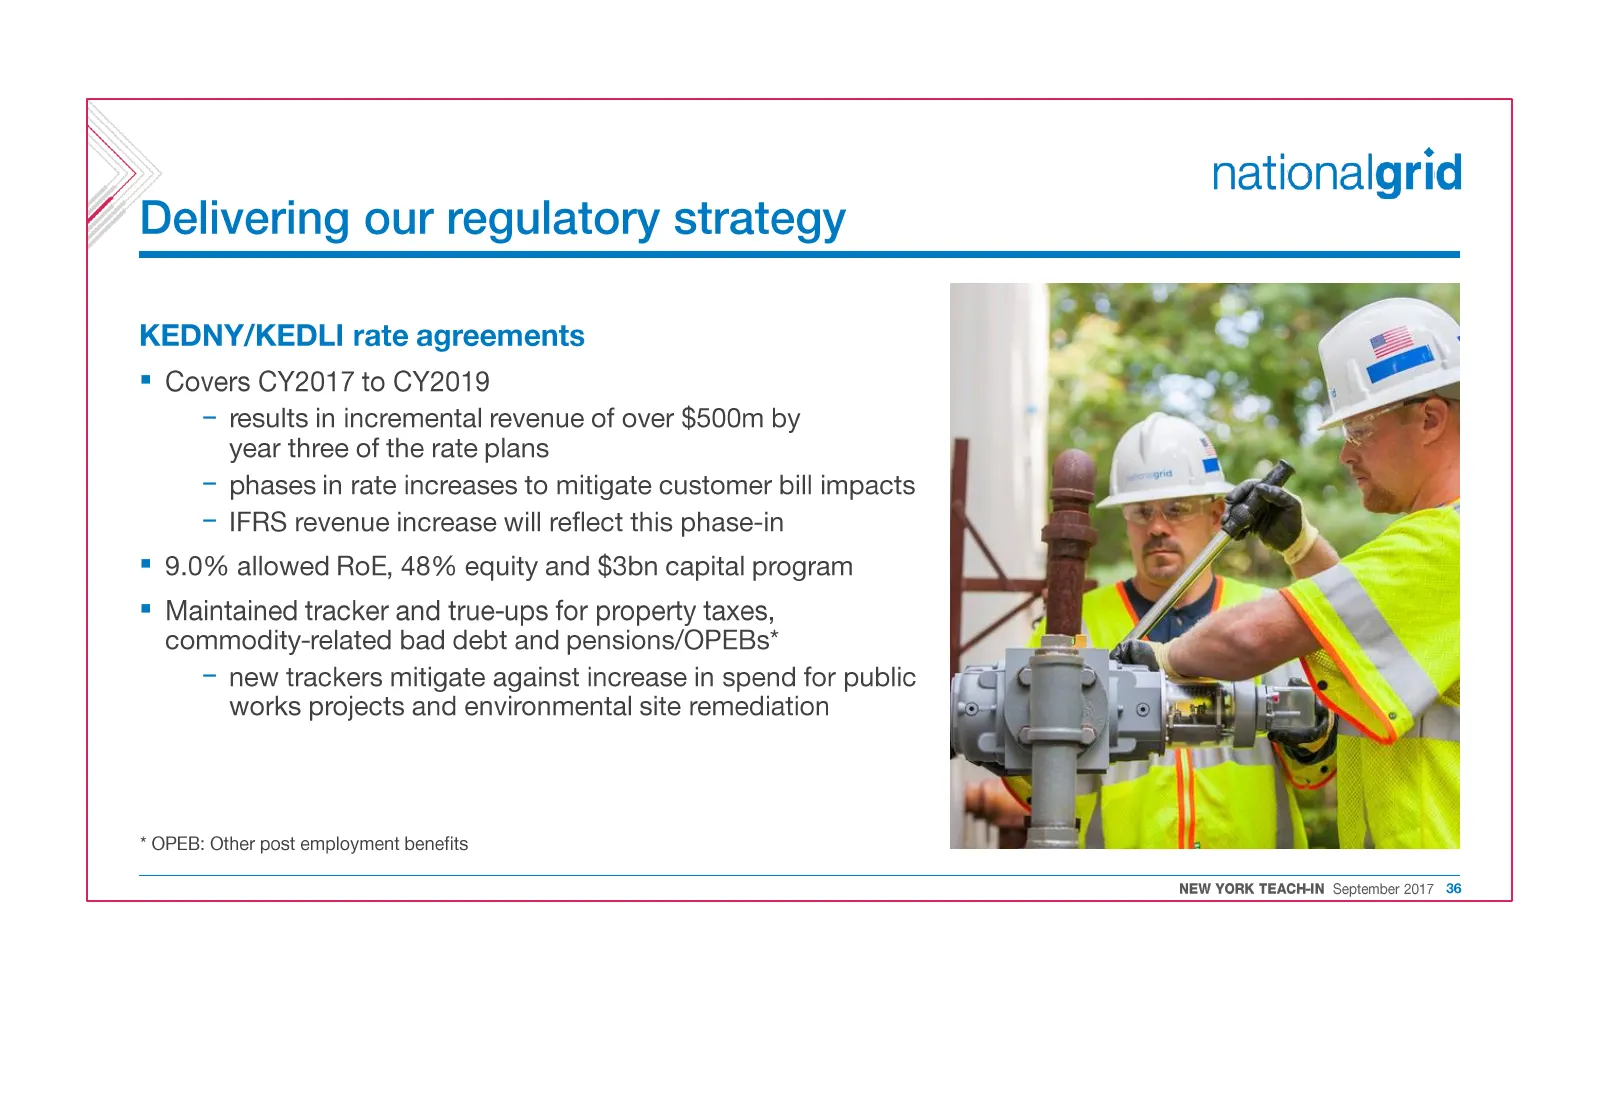
Slide 36: Delivering our regulatory strategy
D> eivering our regulatory strategy nationalgrid KEDNY/KEDLI rate agreements = Covers CY2017 to CY2019 — results in incremental revenue of over $500m by year three of the rate plans — phases in rate increases to mitigate customer bill impacts — IFRS revenue increase will reflect this phase-in = 9.0%
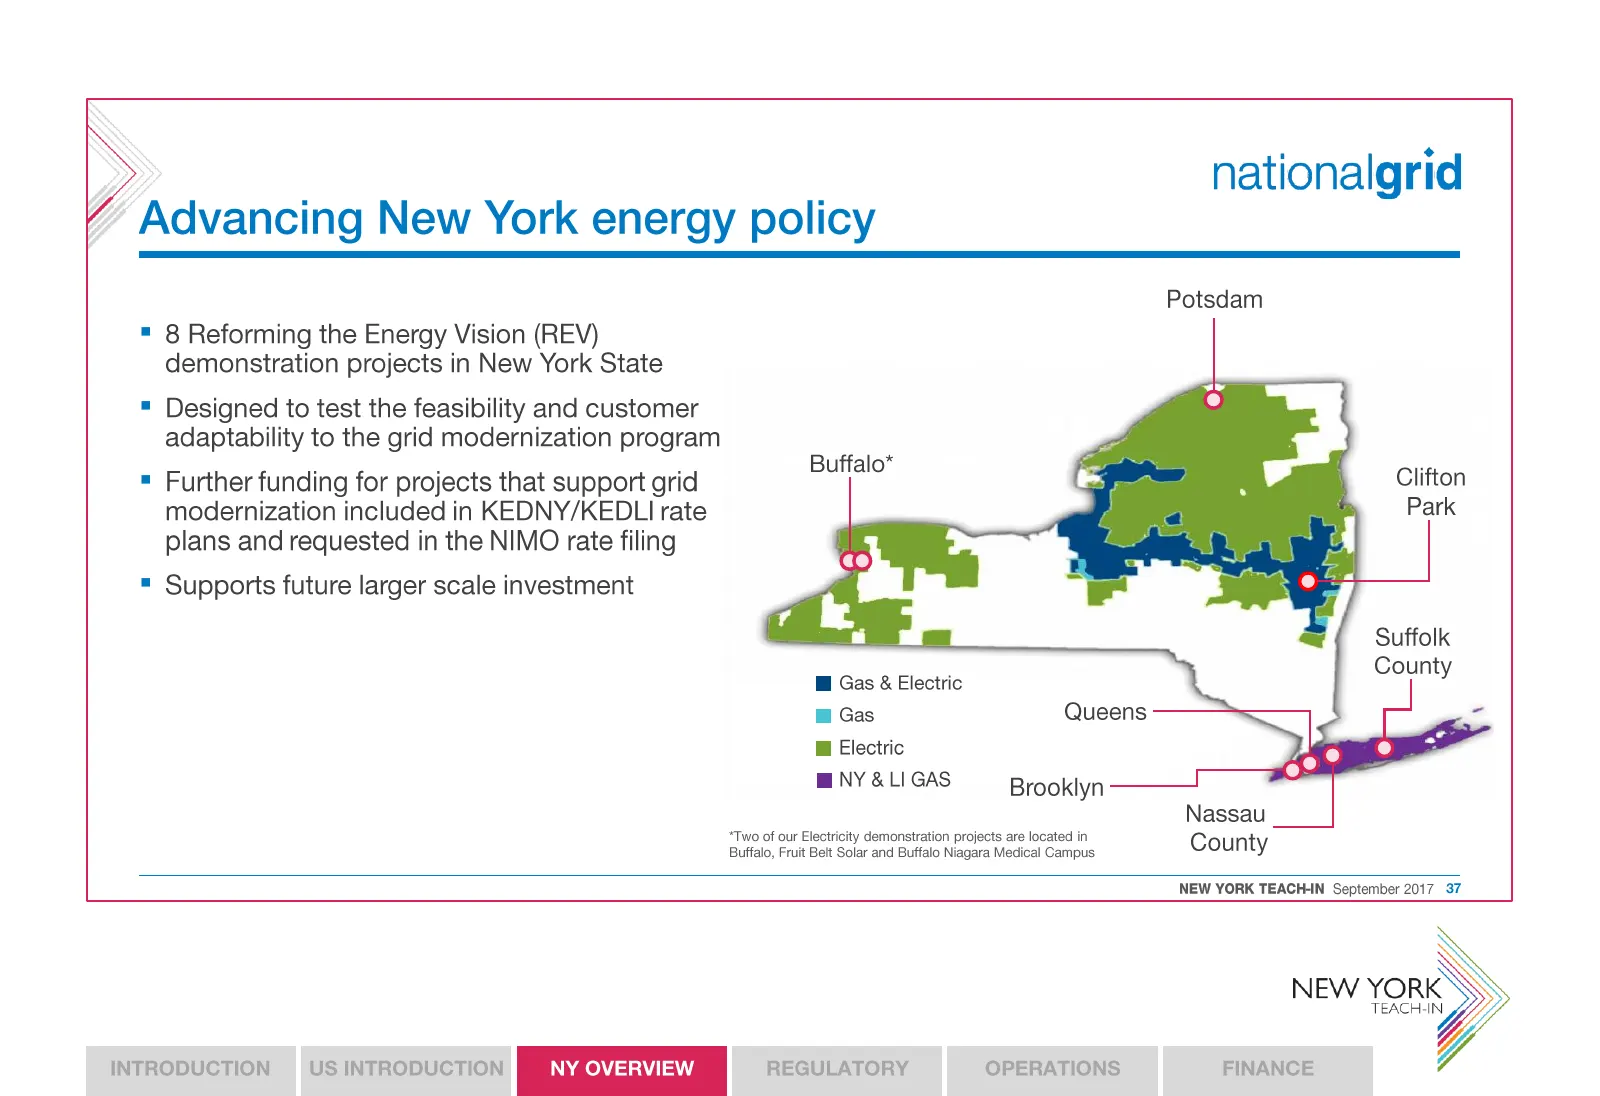
Slide 37: Advancing New York energy policy
nationalgrid Advancing New York energy policy Potsdam = 8 Reforming the Energy Vision (REV) demonstration projects in New York State = Designed to test the feasibility and customer adaptability to the grid modernization program = Further funding for projects that support grid modernization included
Slide 38: NY summary
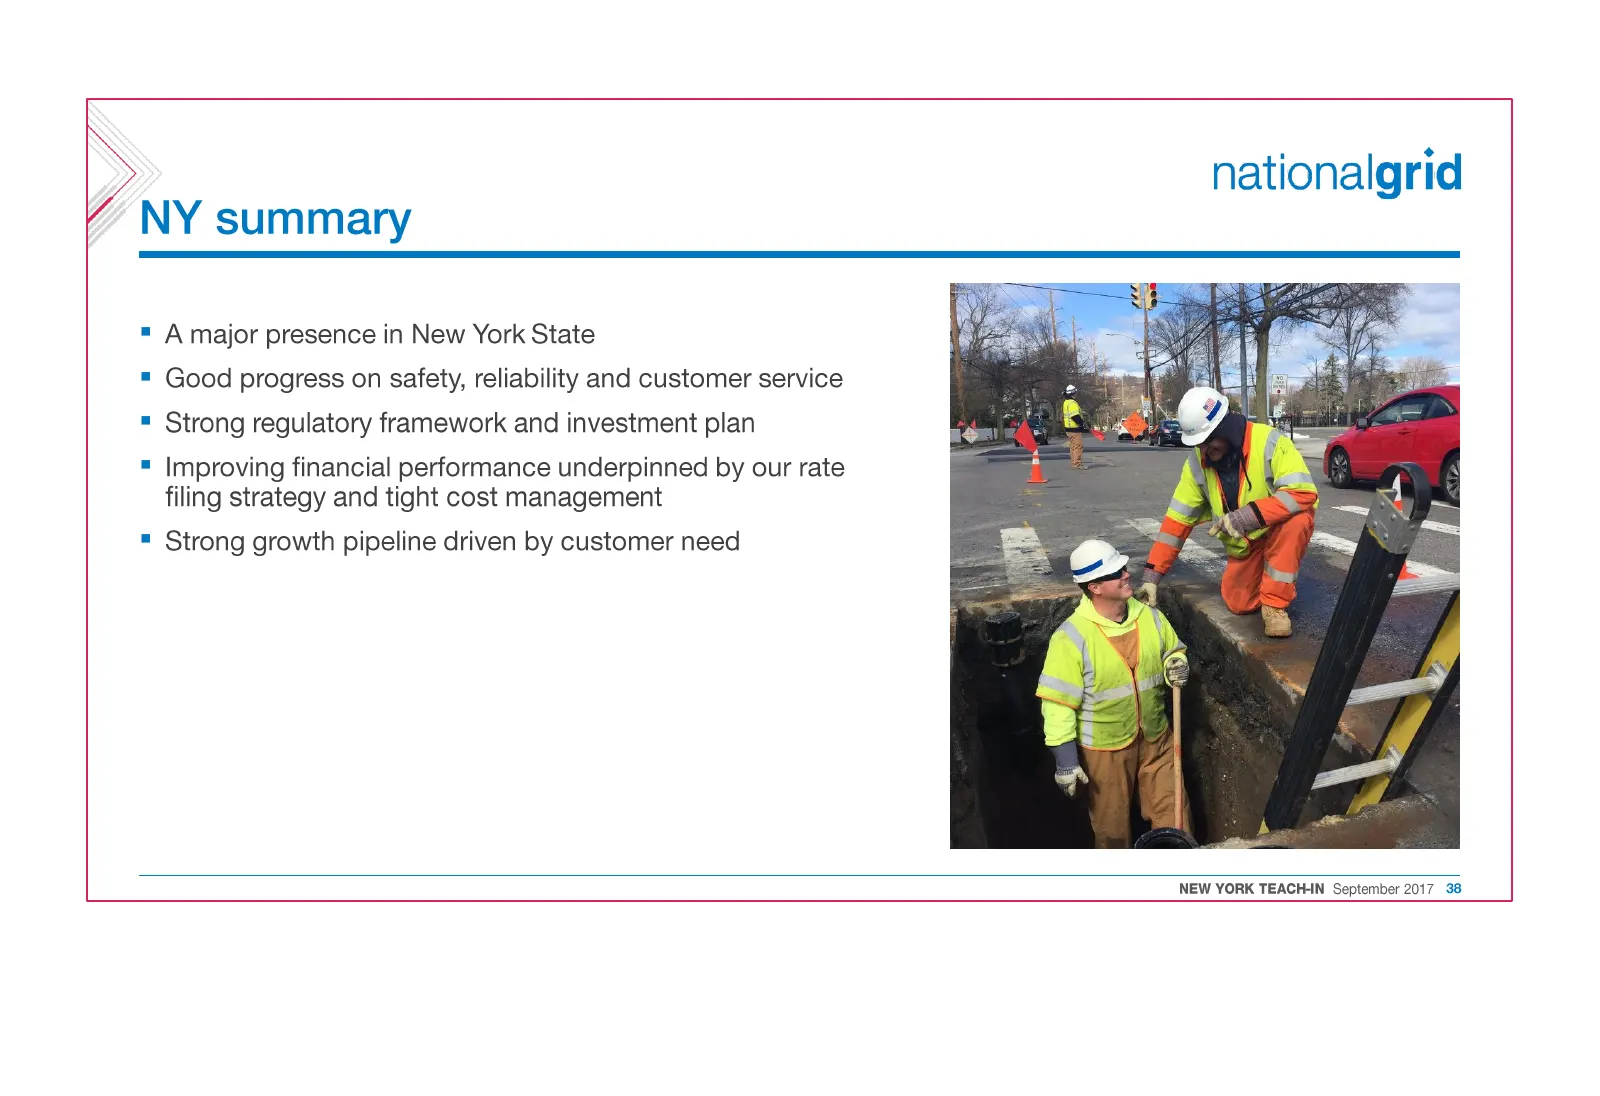
» nationalgrid NY summary = A major presence in New York State = Good progress on safety, reliability and customer service = Strong regulatory framework and investment plan = Improving financial performance underpinned by our rate filing strategy and tight cost management = Strong growth pipeline dr

Slide 39: Deliberately left blank
Deliberately left blank NEW 128) TEACH-IN

Slide 40: Deliberately left blank
Deliberately left blank

Slide 41: Regulatory
NEW et) TEACH-IN

Slide 42: Mike Calviou
MIKE CALVIOU SVP REGULATION AND PRICING Background Mike has been with National Grid for 27 years and overseas the regulatory and pricing functions across all National Grid’s U.S. jurisdictions and operating companies. In past roles Mike led all of the customer and commercial activities as well as th
Slide 43: Regulatory objectives
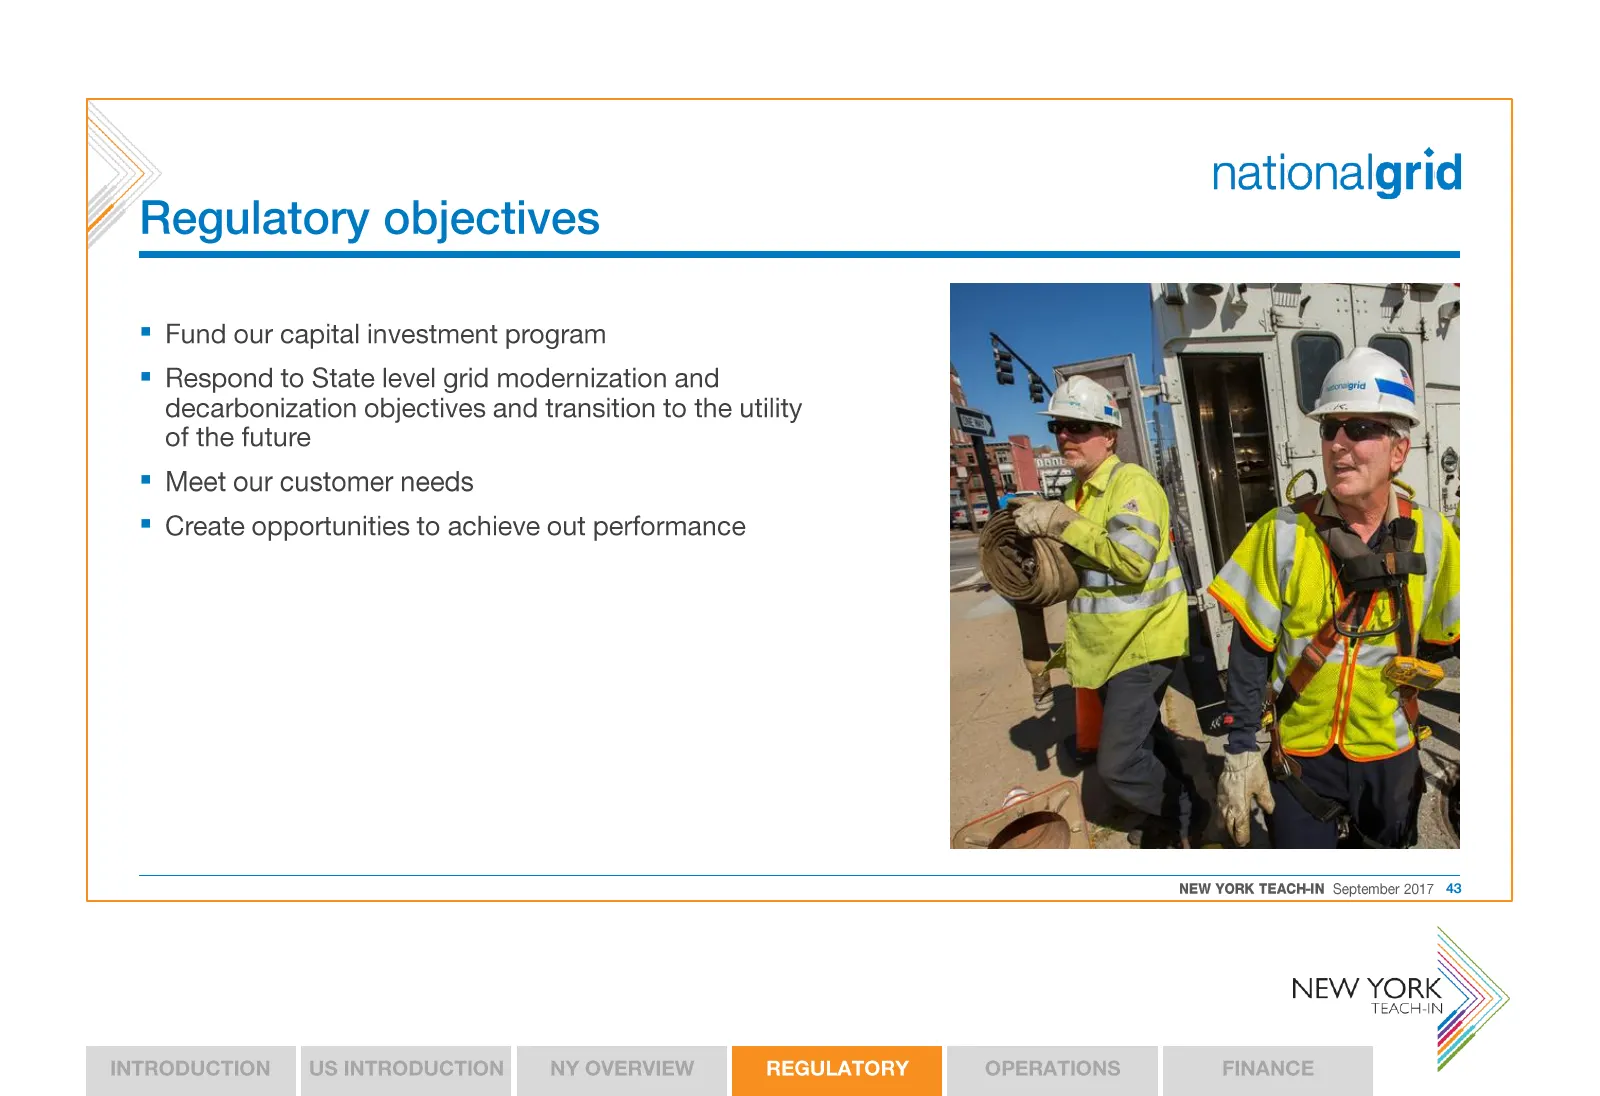
nationalgrid Regulatory objectives = Fund our capital investment program Respond to State level grid modernization and decarbonization objectives and transition to the utility of the future = Meet our customer needs = Create opportunities to achieve out performance NEW YORK TEACHN September 2017 43
Slide 44: US regulatory overview
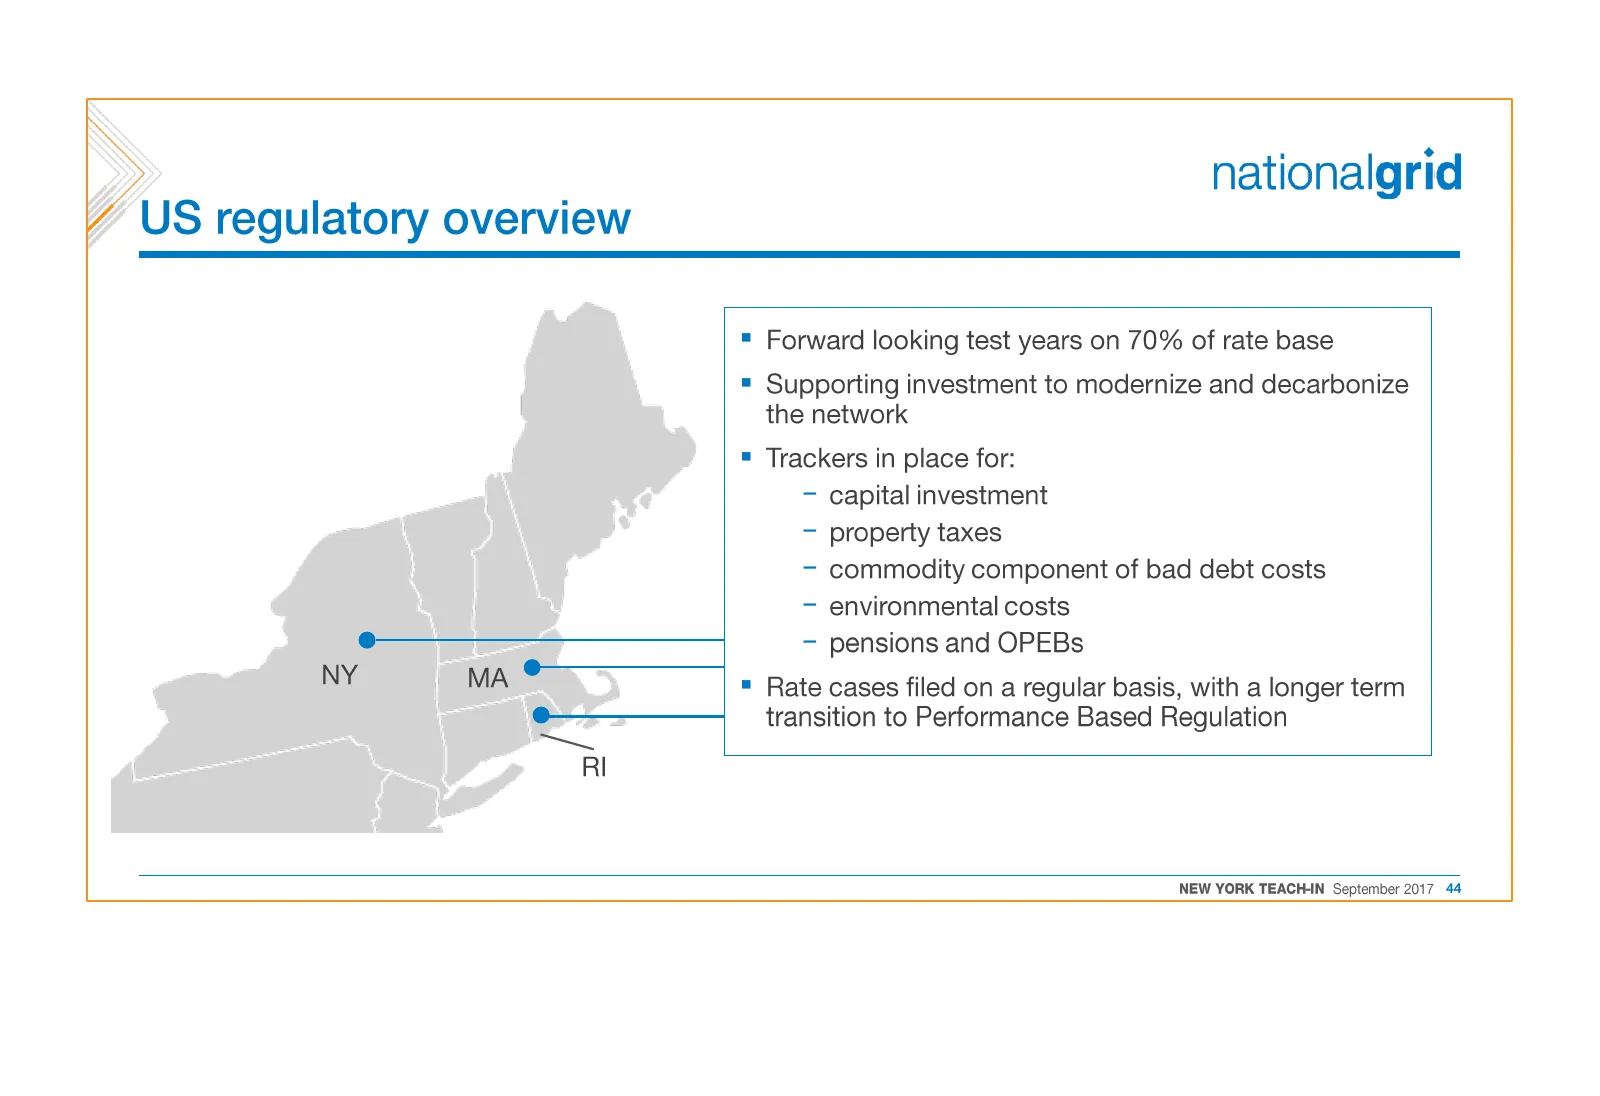
nationalgrid US regulatory overview = Forward looking test years on 70% of rate base = Supporting investment to modernize and decarbonize the network = Trackers in place for: — capital investment — property taxes — commodity component of bad debt costs — environmental costs e - pensions and OPEBs =
Slide 45: Working effectively within the NY framework
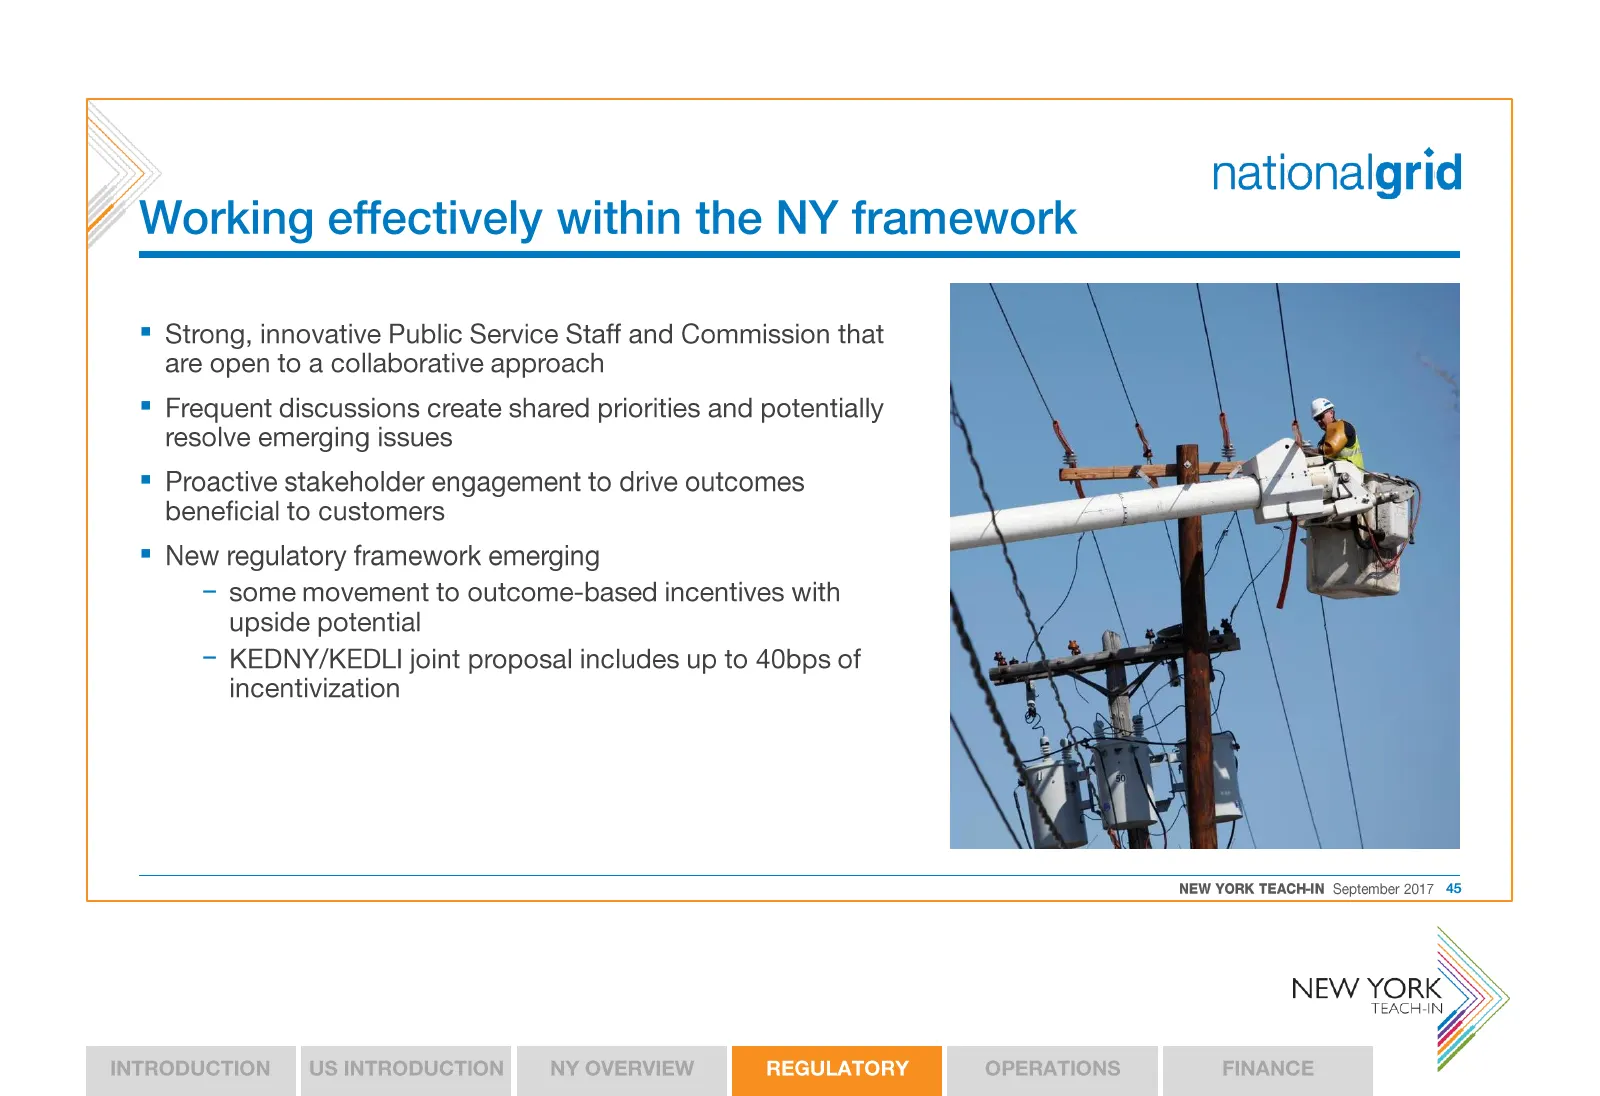
nationalgrid Working effectively within the NY framework = Strong, innovative Public Service Staff and Commission that are open to a collaborative approach = Frequent discussions create shared priorities and potentially resolve emerging issues = Proactive stakeholder engagement to drive outcomes ben
Slide 46: Significant rate case progress made in NY
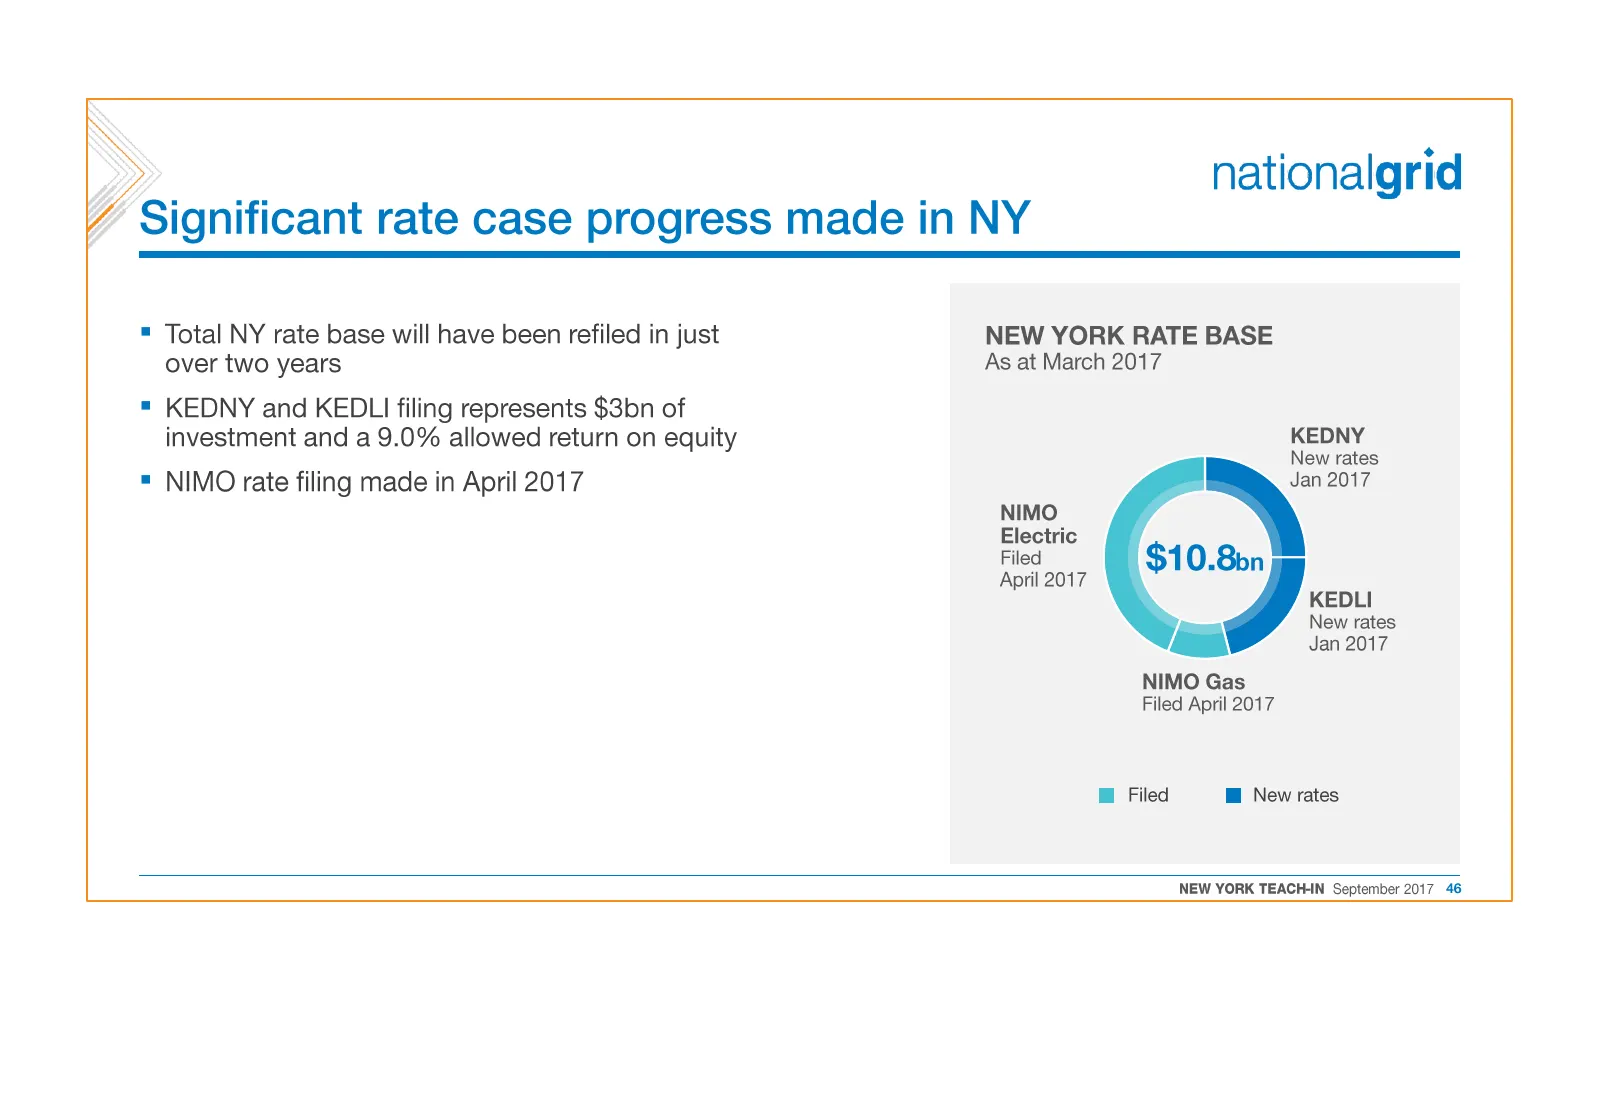
nationalgrid Significant rate case progress made in NY = Total NY rate base will have been refiled in just NEW YORK RATE BASE over two years As at March 2017 = KEDNY and KEDLI filing represents $3bn of investment and a 9.0% allowed return on equity KEDNY New rates = NIMO rate filing made in April 20
Slide 47: NIMO rate case development
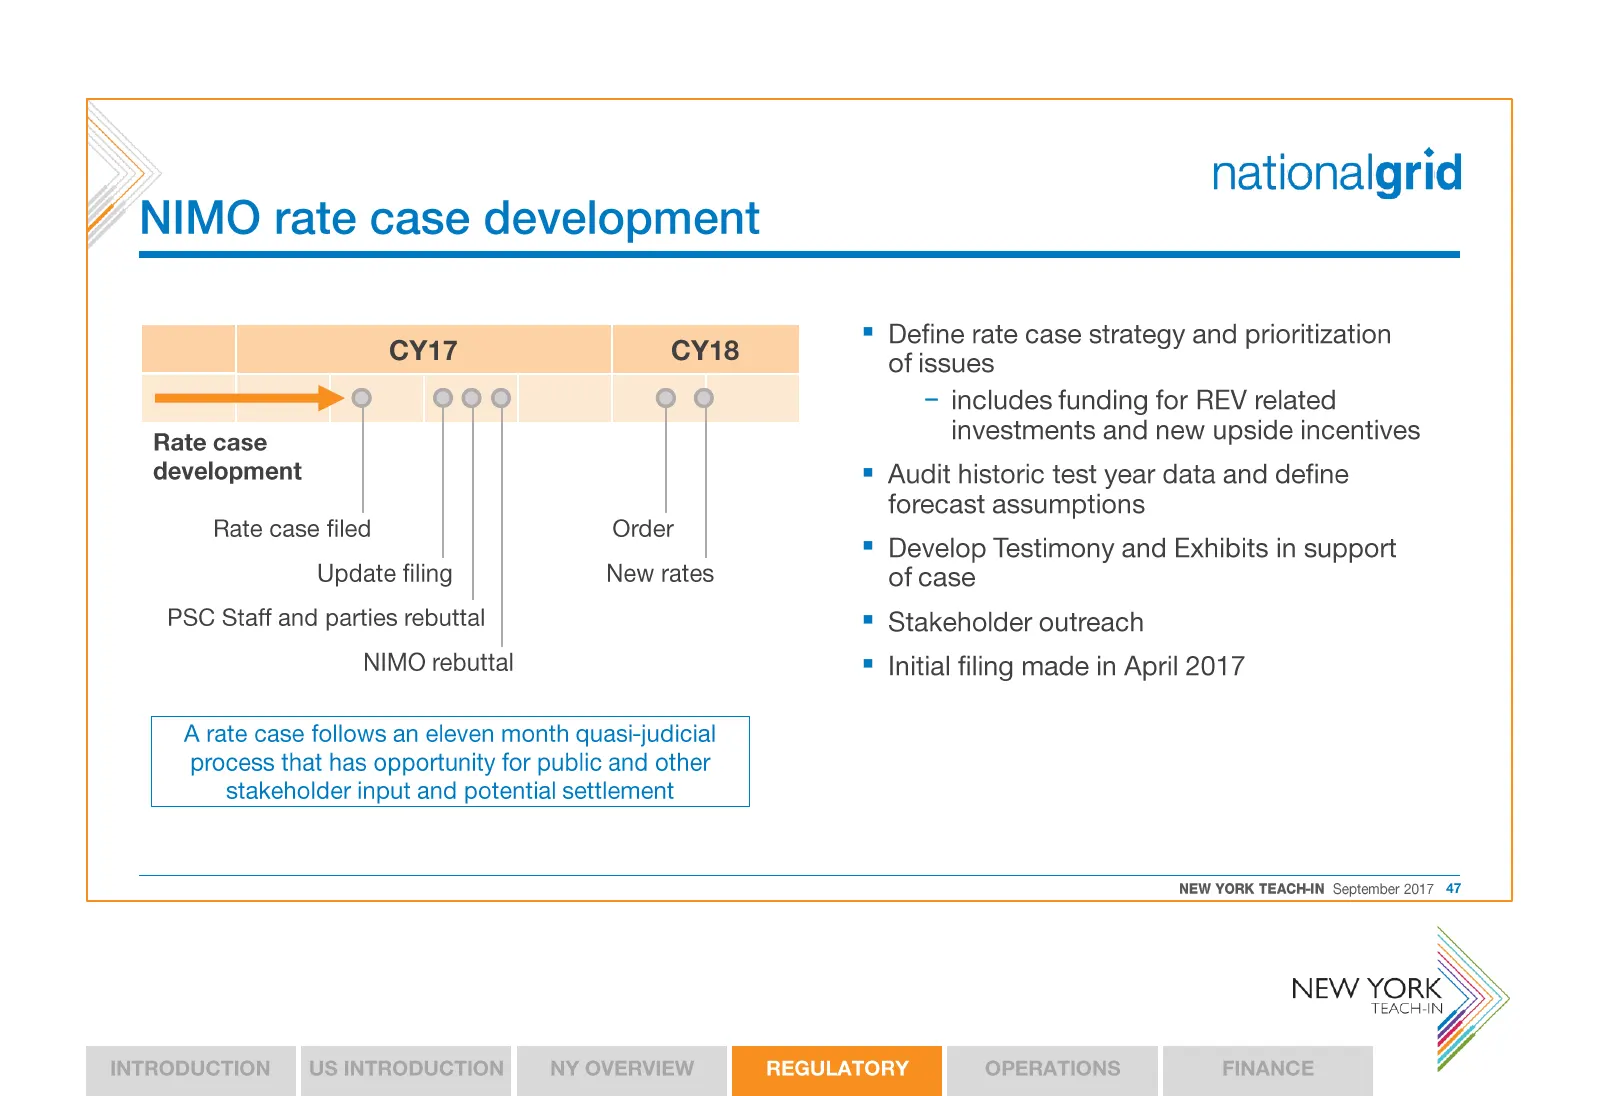
nationalgrid NIMO rate case development of issues —————==_> - includes funding for REV related investments and new upside incentives Audit historic test year data and define forecast assumptions Rate case development Rate case filed Order = Develop Testimony and Exhibits in support Update filing New
Slide 48: NIMO rate case filing
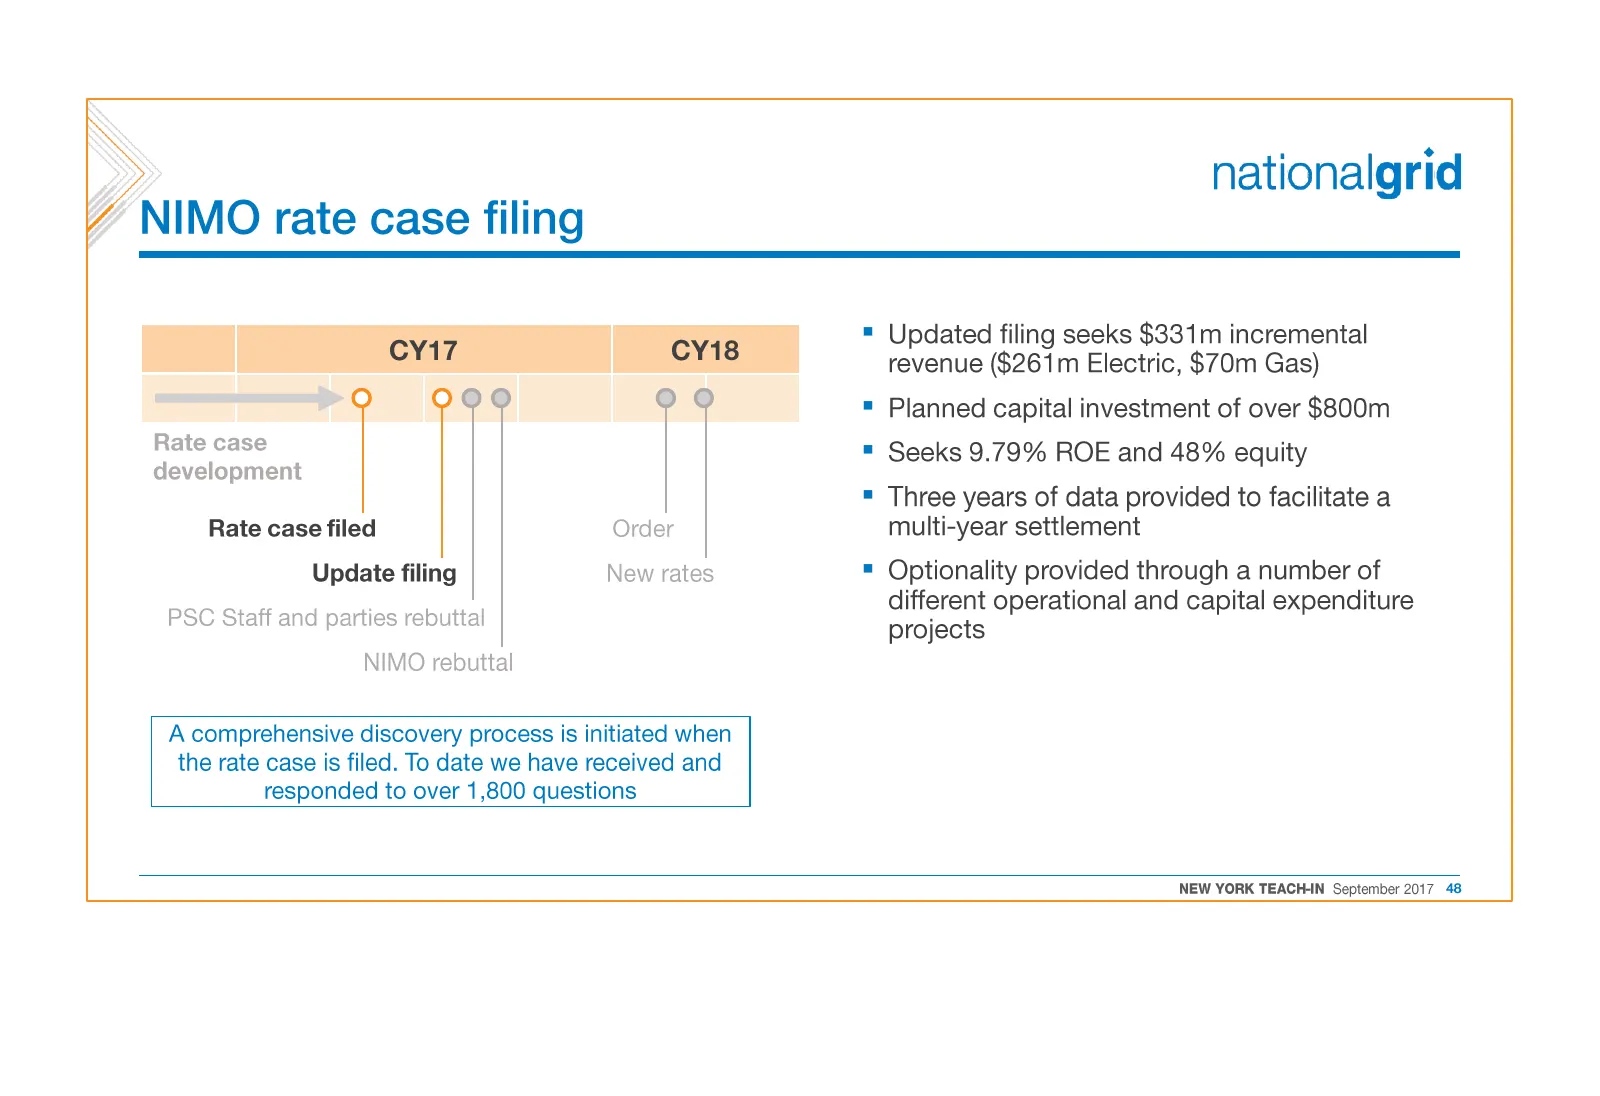
nationalgrid NIMO rate case filing revenue ($261m Electric, $70m Gas) Planned capital investment of over $800m Seeks 9.79% ROE and 48% equity Three years of data provided to facilitate a Rate case development Rate case filed Order multi-year settlement Update filing New rates = Optionality provided
Slide 49: NIMO rate case: PSC Staff and parties rebuttal
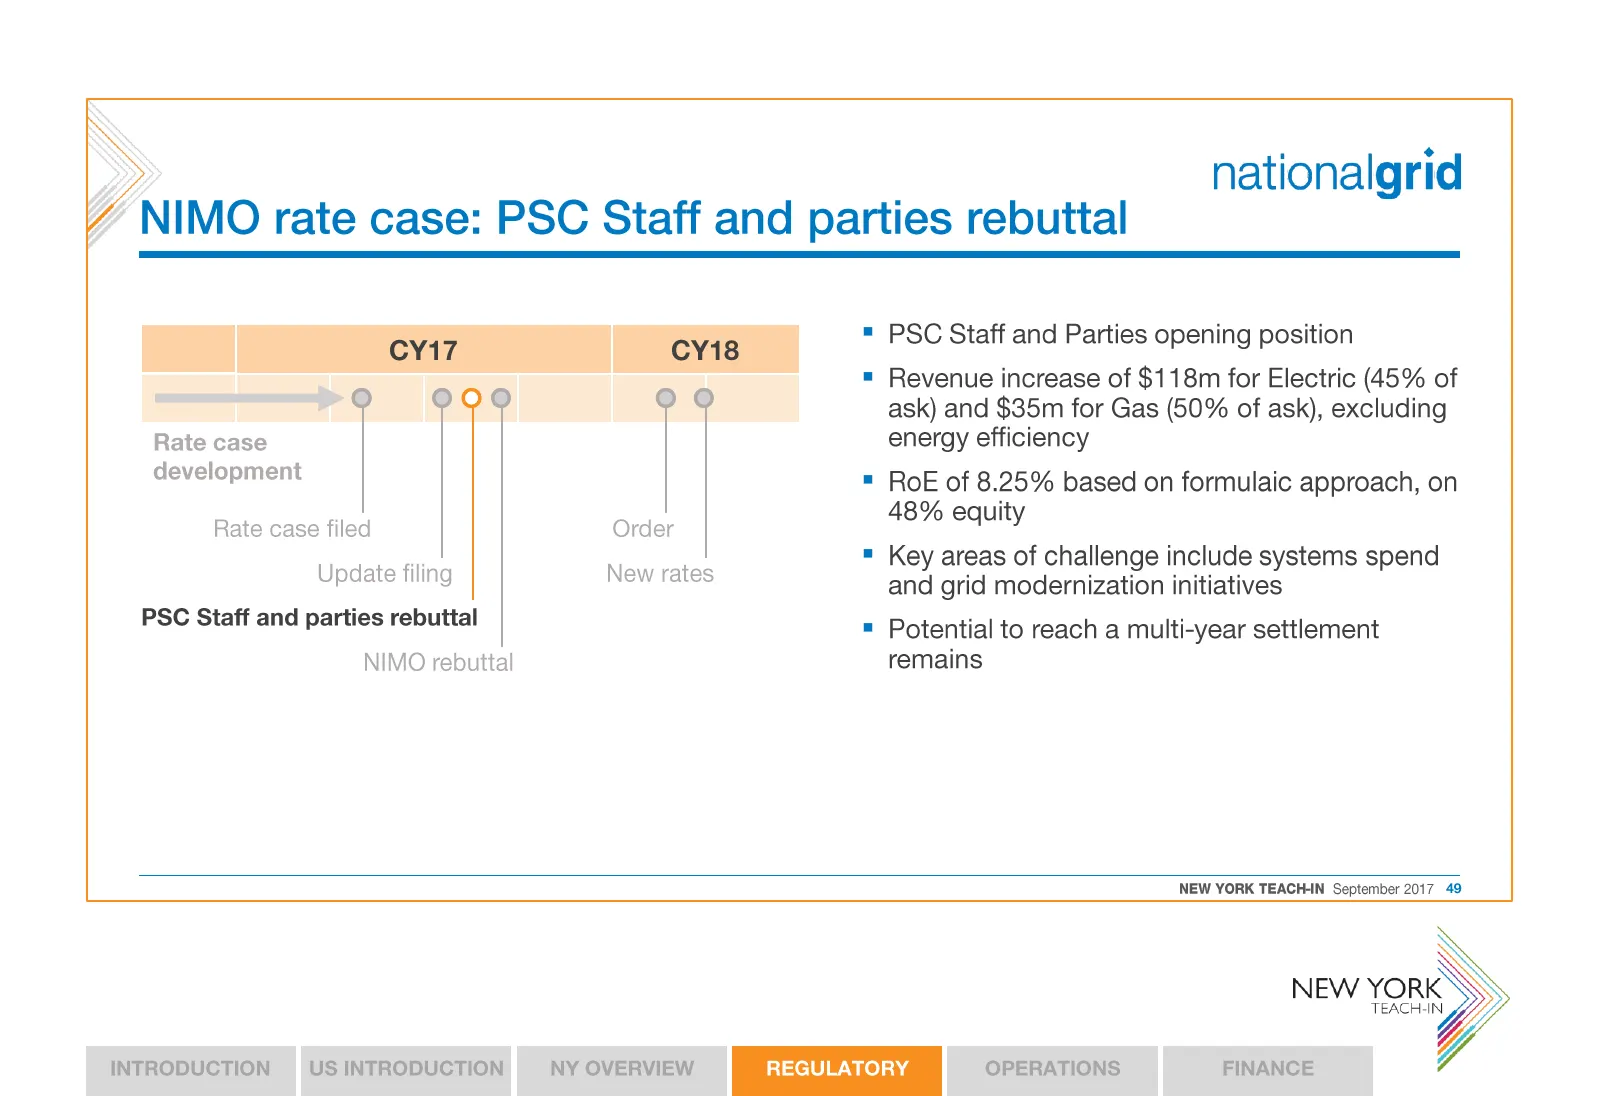
nationalgrid NIMO rate case: PSC Staff and parties rebuttal " Revenue increase of $118m for Electric (45% of ask) and $35m for Gas (50% of ask), excluding Rate case energy efficiency development = RoE of 8.25% based on formulaic approach, on Rate case filed Order 48% equity ; Updating Now ae * Key a
Slide 50: NIMO rebuttal the next step in the process
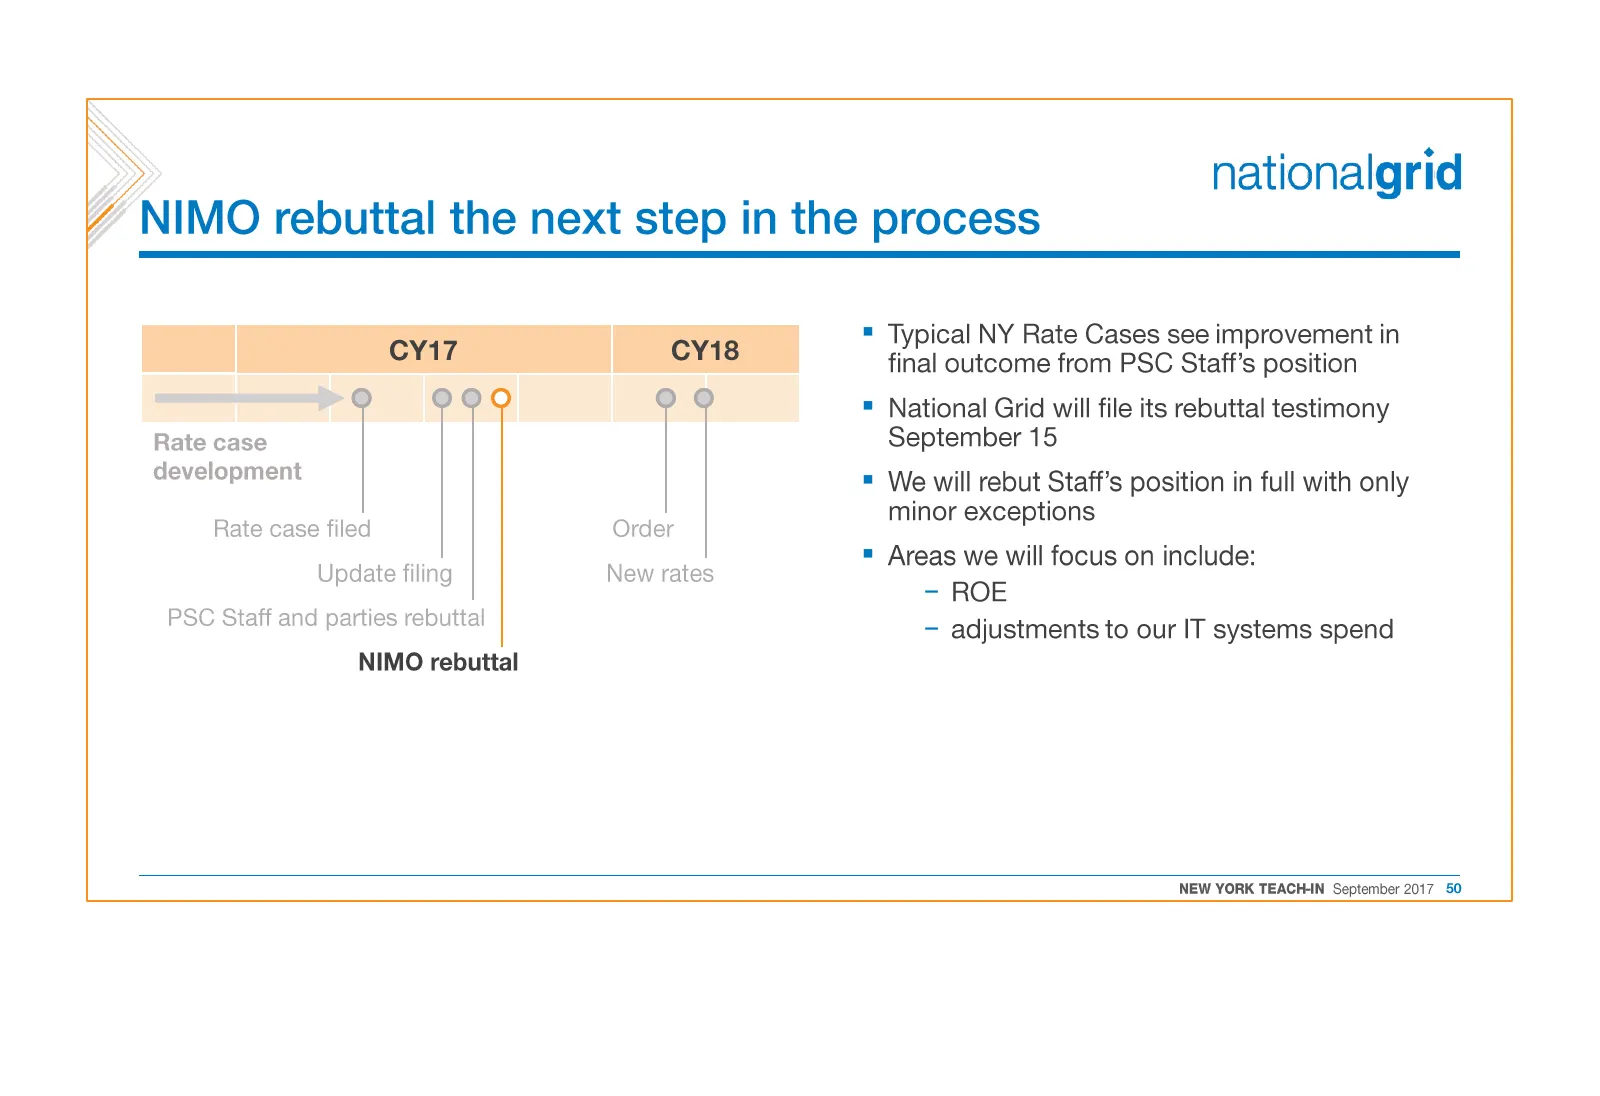
nationalgrid NIMO rebuttal the next step in the process er te re Sutcome trom PSC Staffs postion final outcome from PSC Staff’s position National Grid will file its rebuttal testimony Rate case September 15 development We will rebut Staff’s position in full with only Rate case filed Order minor exce
Slide 51: Regulatory summary
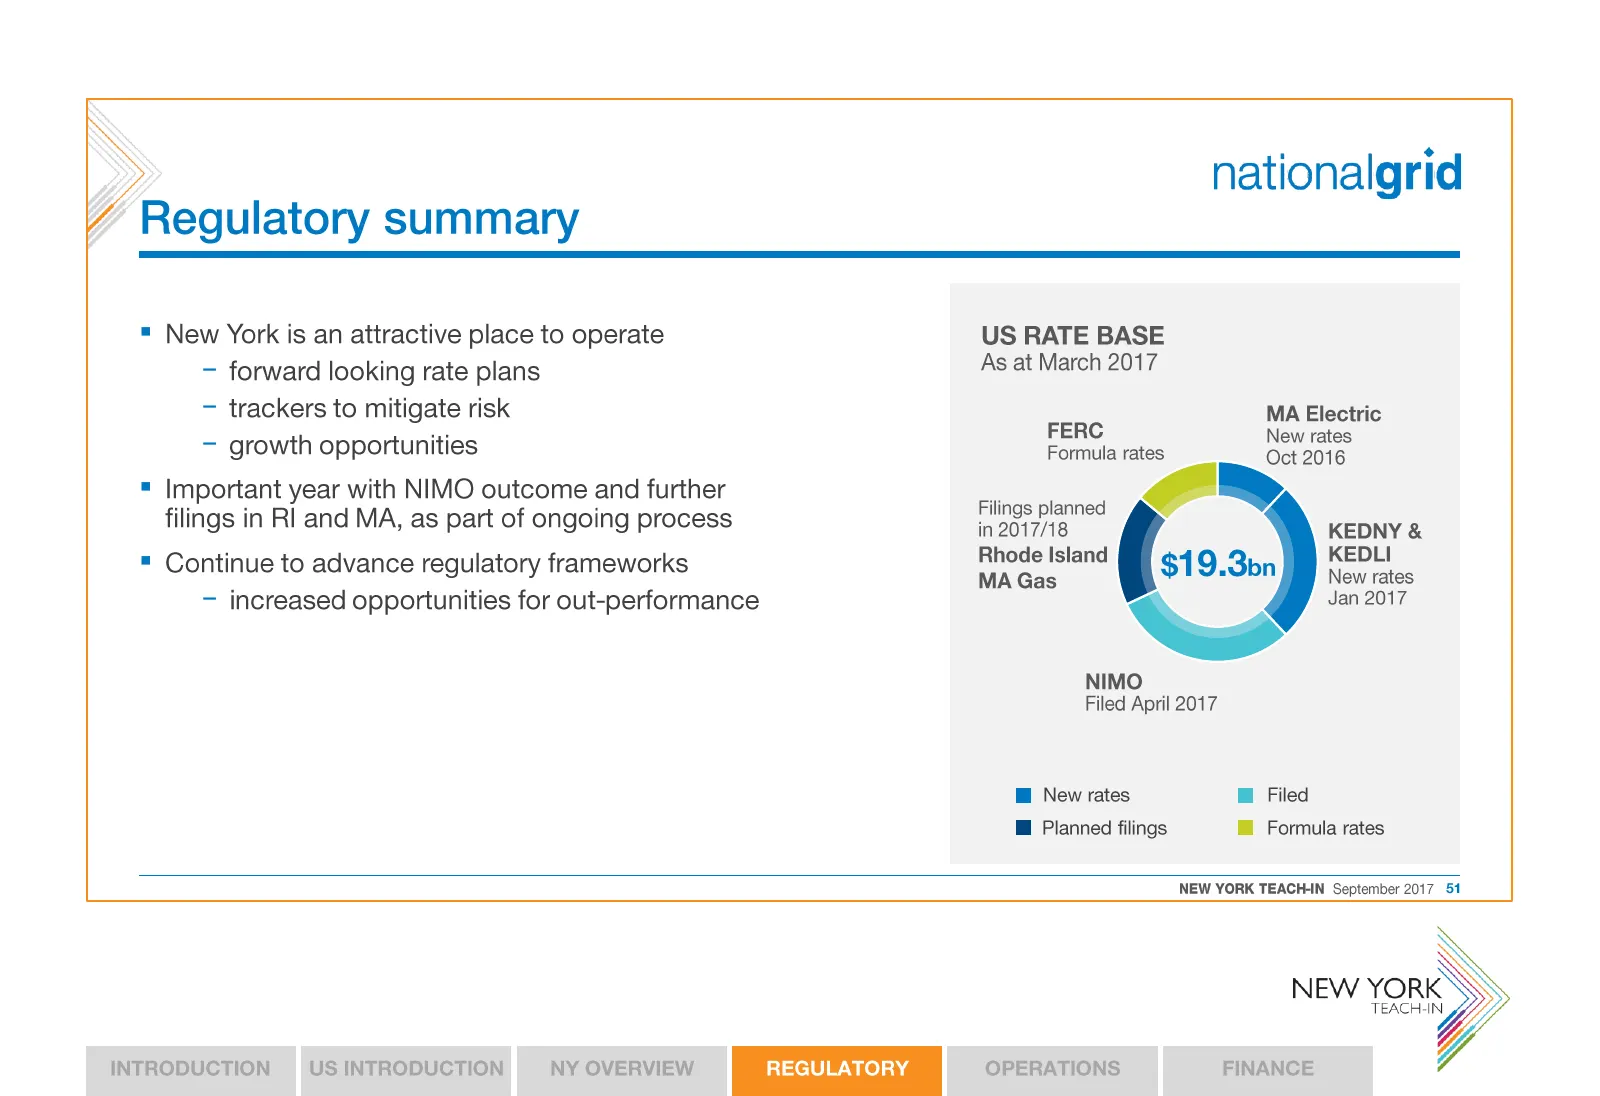
- forward looking rate plans — trackers to mitigate risk — growth opportunities Regulatory summary = New York is an attractive place to operate = Important year with NIMO outcome and further filings in RI and MA, as part of ongoing process = Continue to advance regulatory frameworks - increased oppo
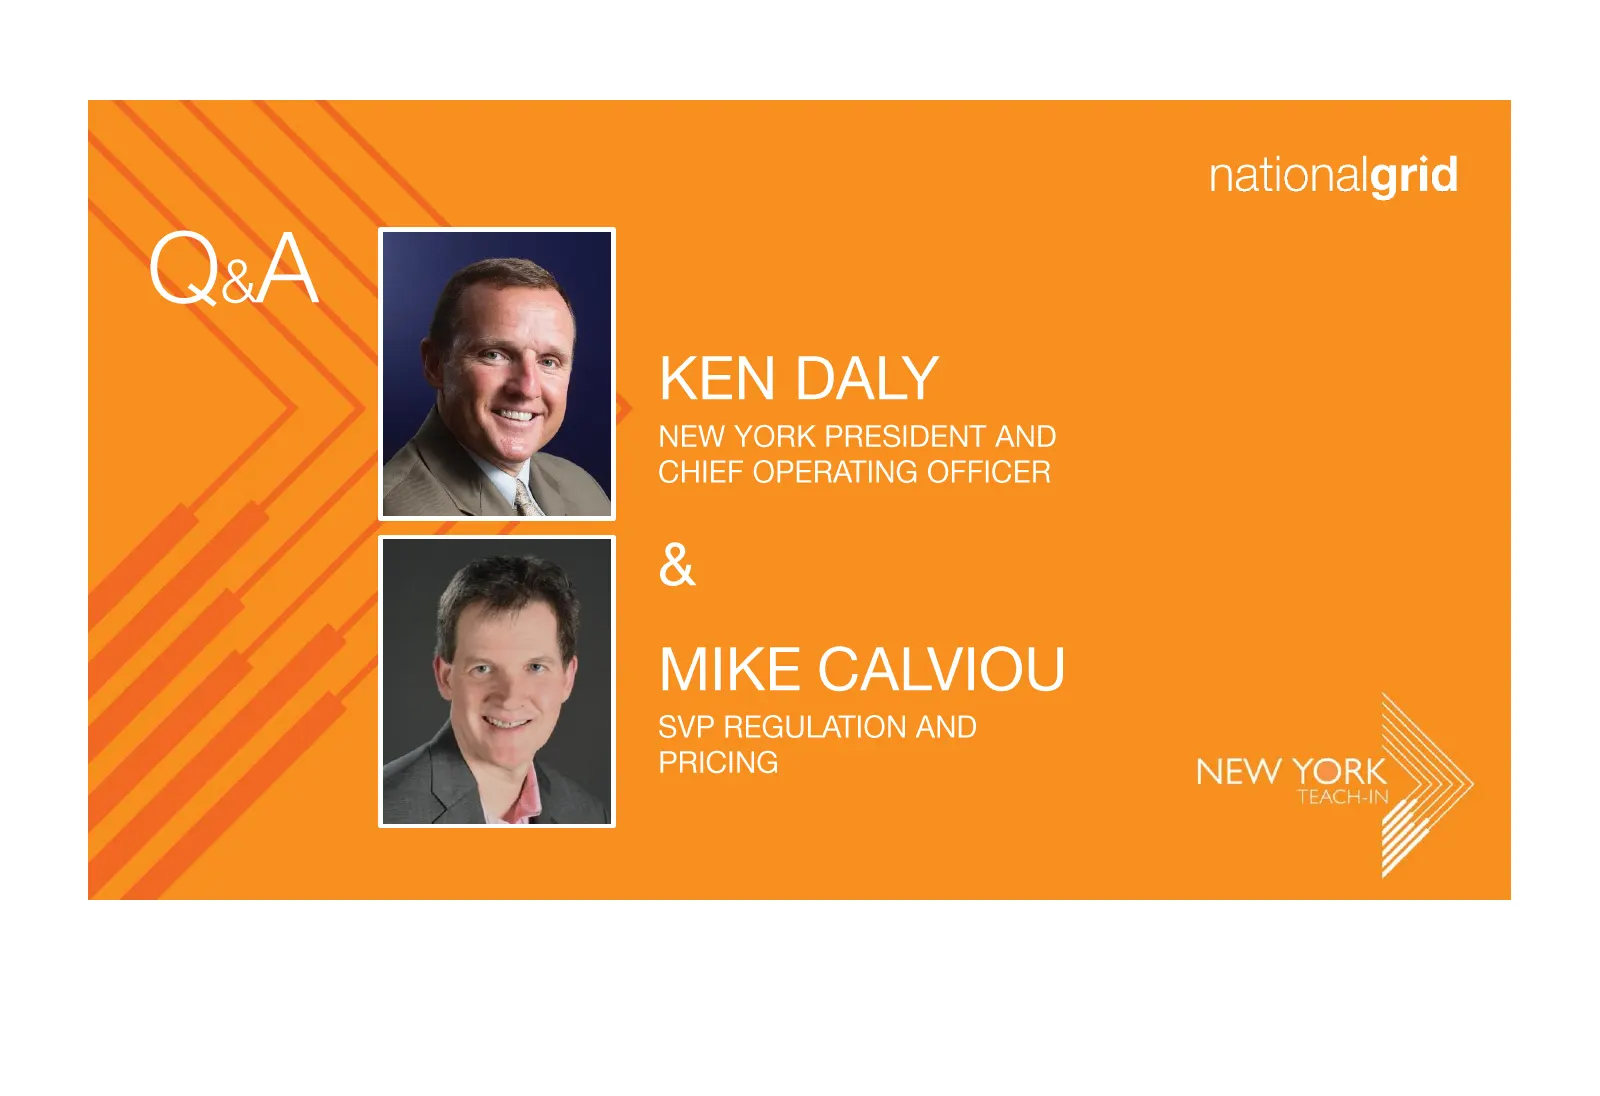
Slide 52: Q&A

Slide 53: Deliberately left blank
Deliberately left blank NEW 1H) TEACH-IN

Slide 54: Deliberately left blank
Deliberately left blank
Slide 55: Operations
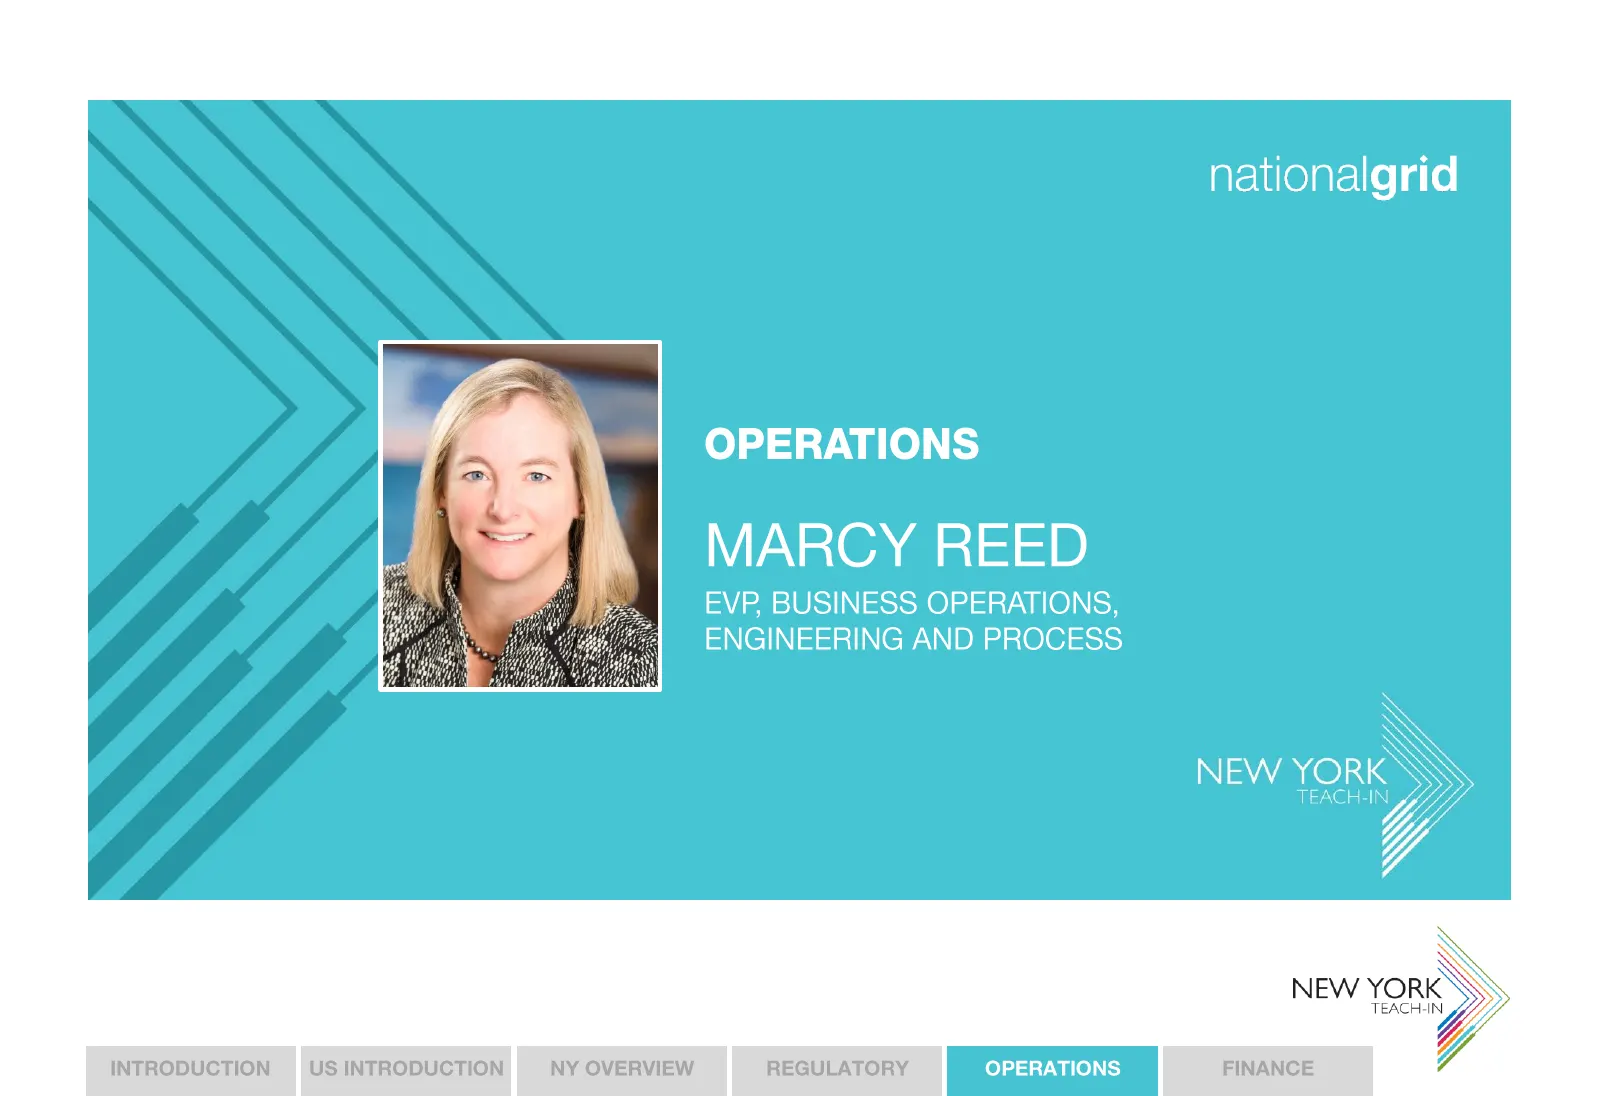
nationalgrid OPERATIONS MARCY REED EVP, BUSINESS OPERATIONS, ENGINEERING AND PROCESS NEW YORK TEACH-IN \y) NEW >) OPERATIONS
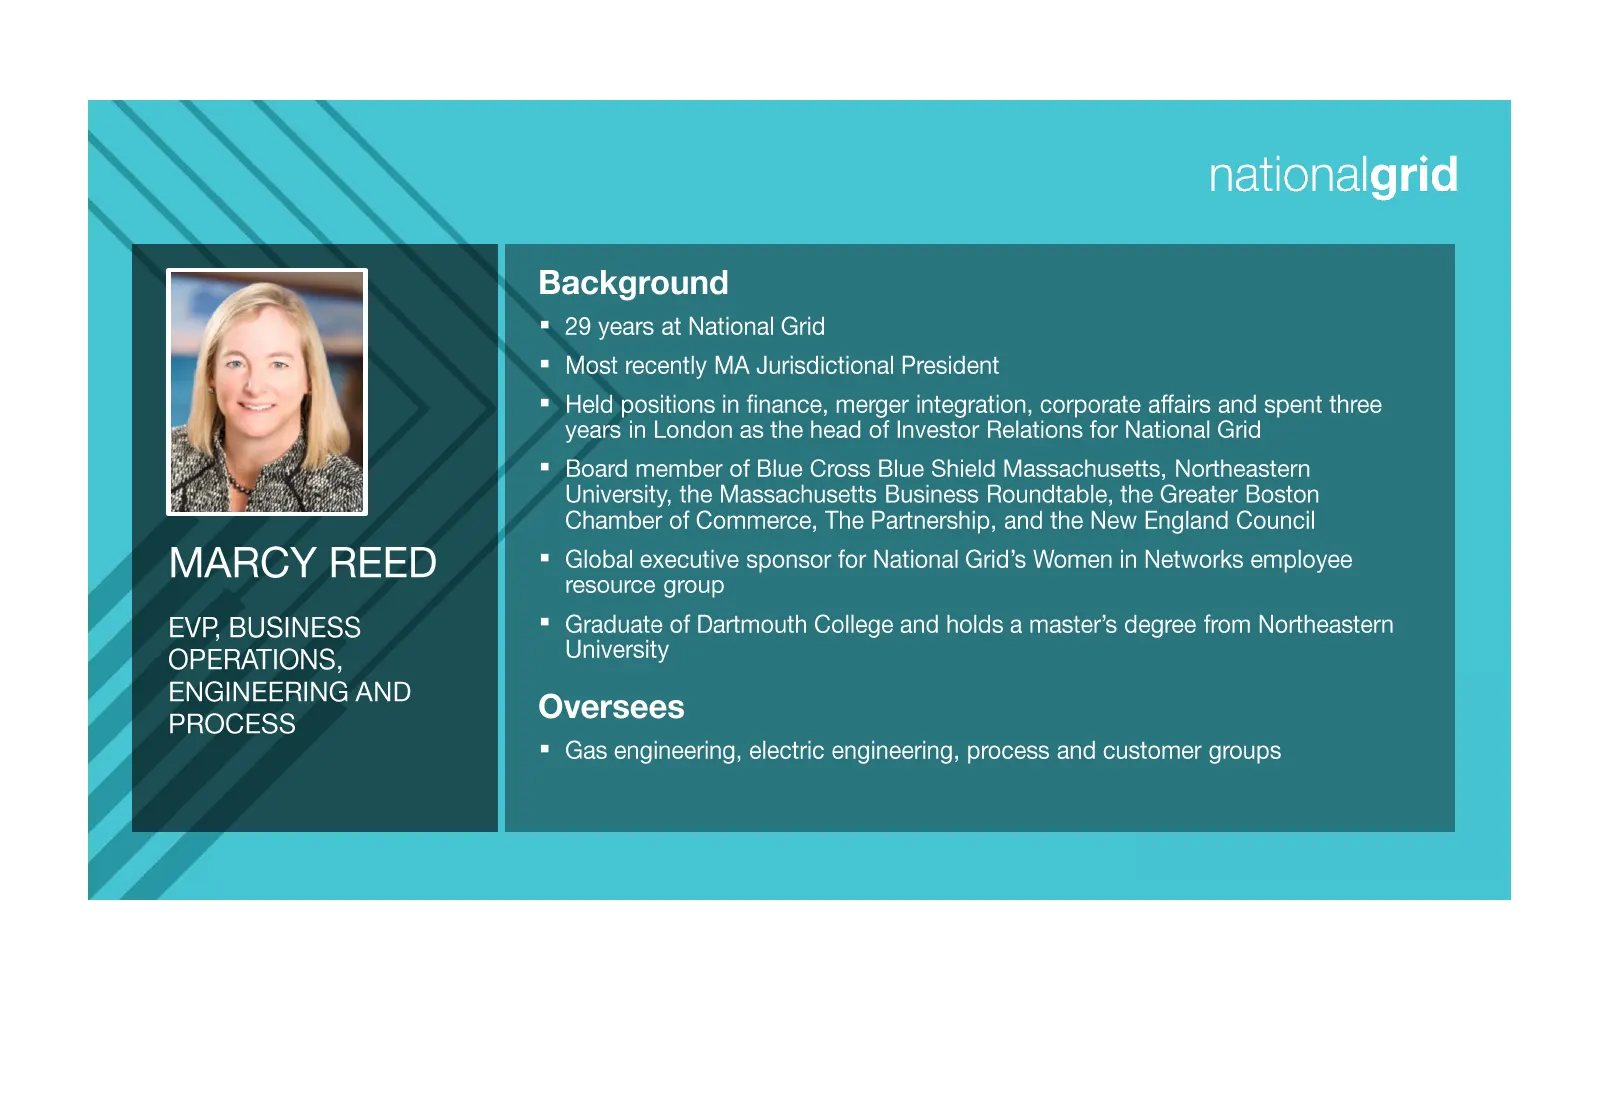
Slide 56: Marcy Reed
nationalgrid Background = 29 years at National Grid = Most recently MA Jurisdictional President = Held positions in finance, merger integration, corporate affairs and spent three years in London as the head of Investor Relations for National Grid Board member of Blue Cross Blue Shield Massachusetts,
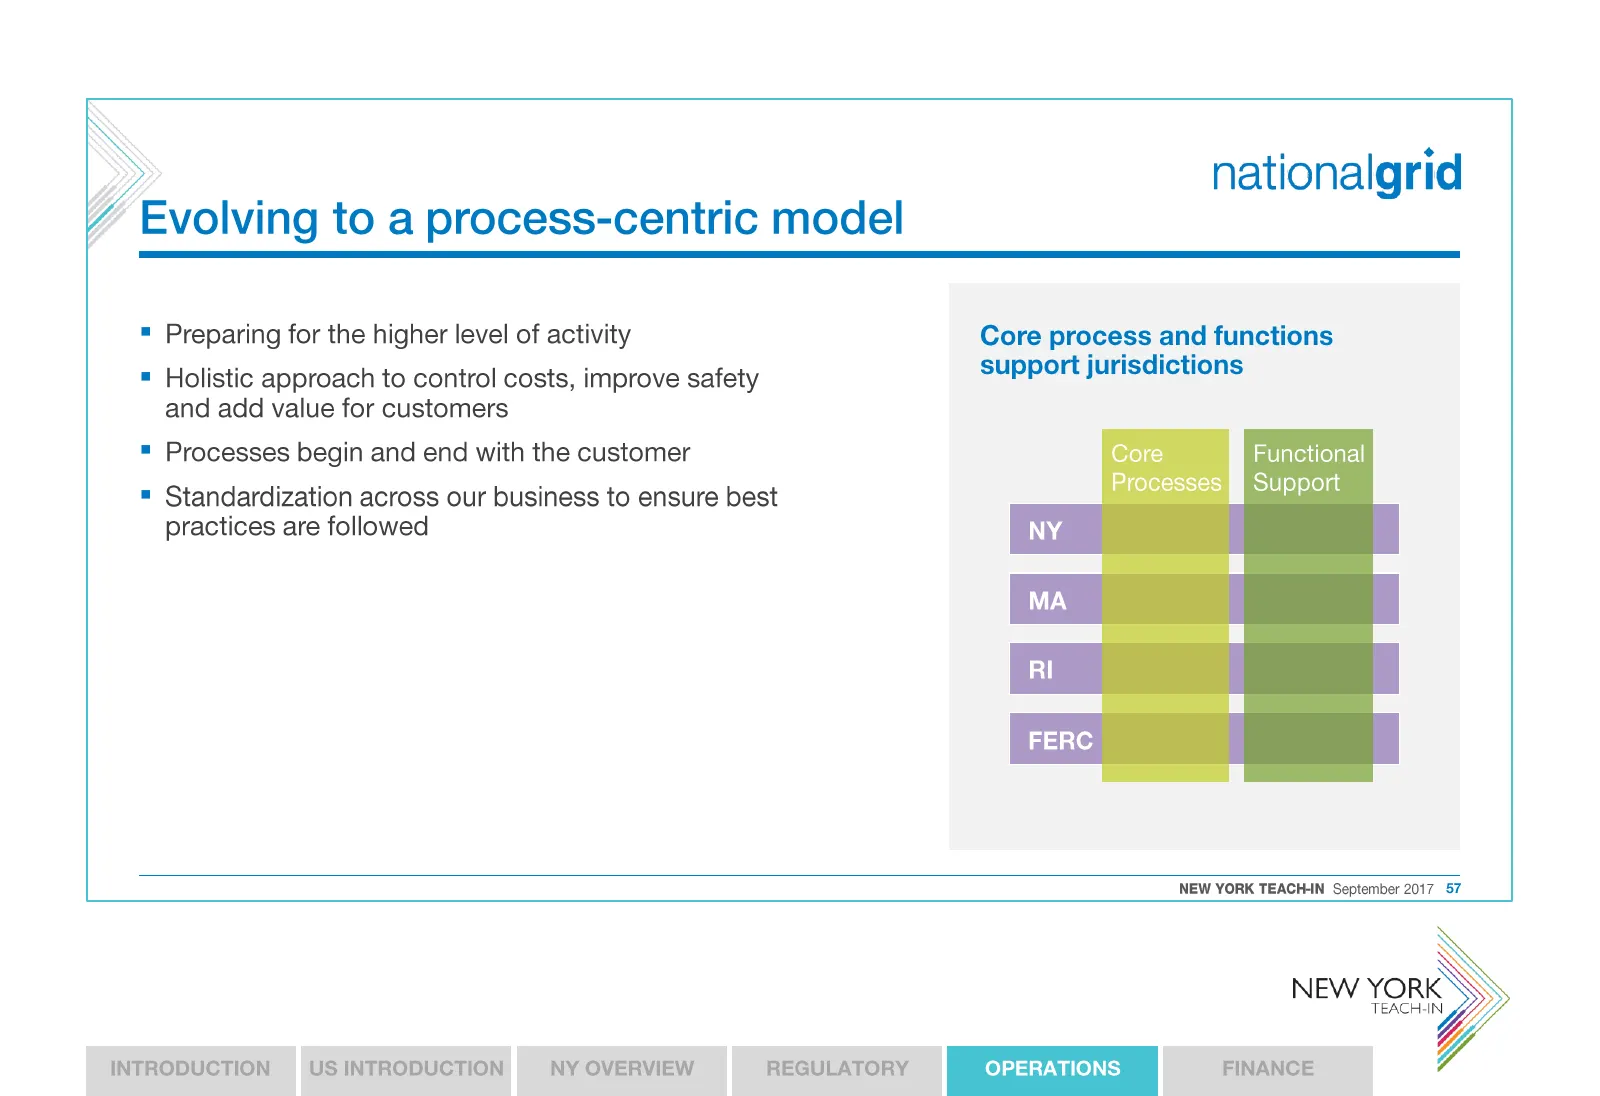
Slide 57: Evolving to a process-centric model
nationalgrid Evolving to a process-centric model = Preparing for the higher level of activity Core process and functions = Holistic approach to control costs, improve safety support jurisdictions and add value for customers = Processes begin and end with the customer Core Functional Processes J Supp
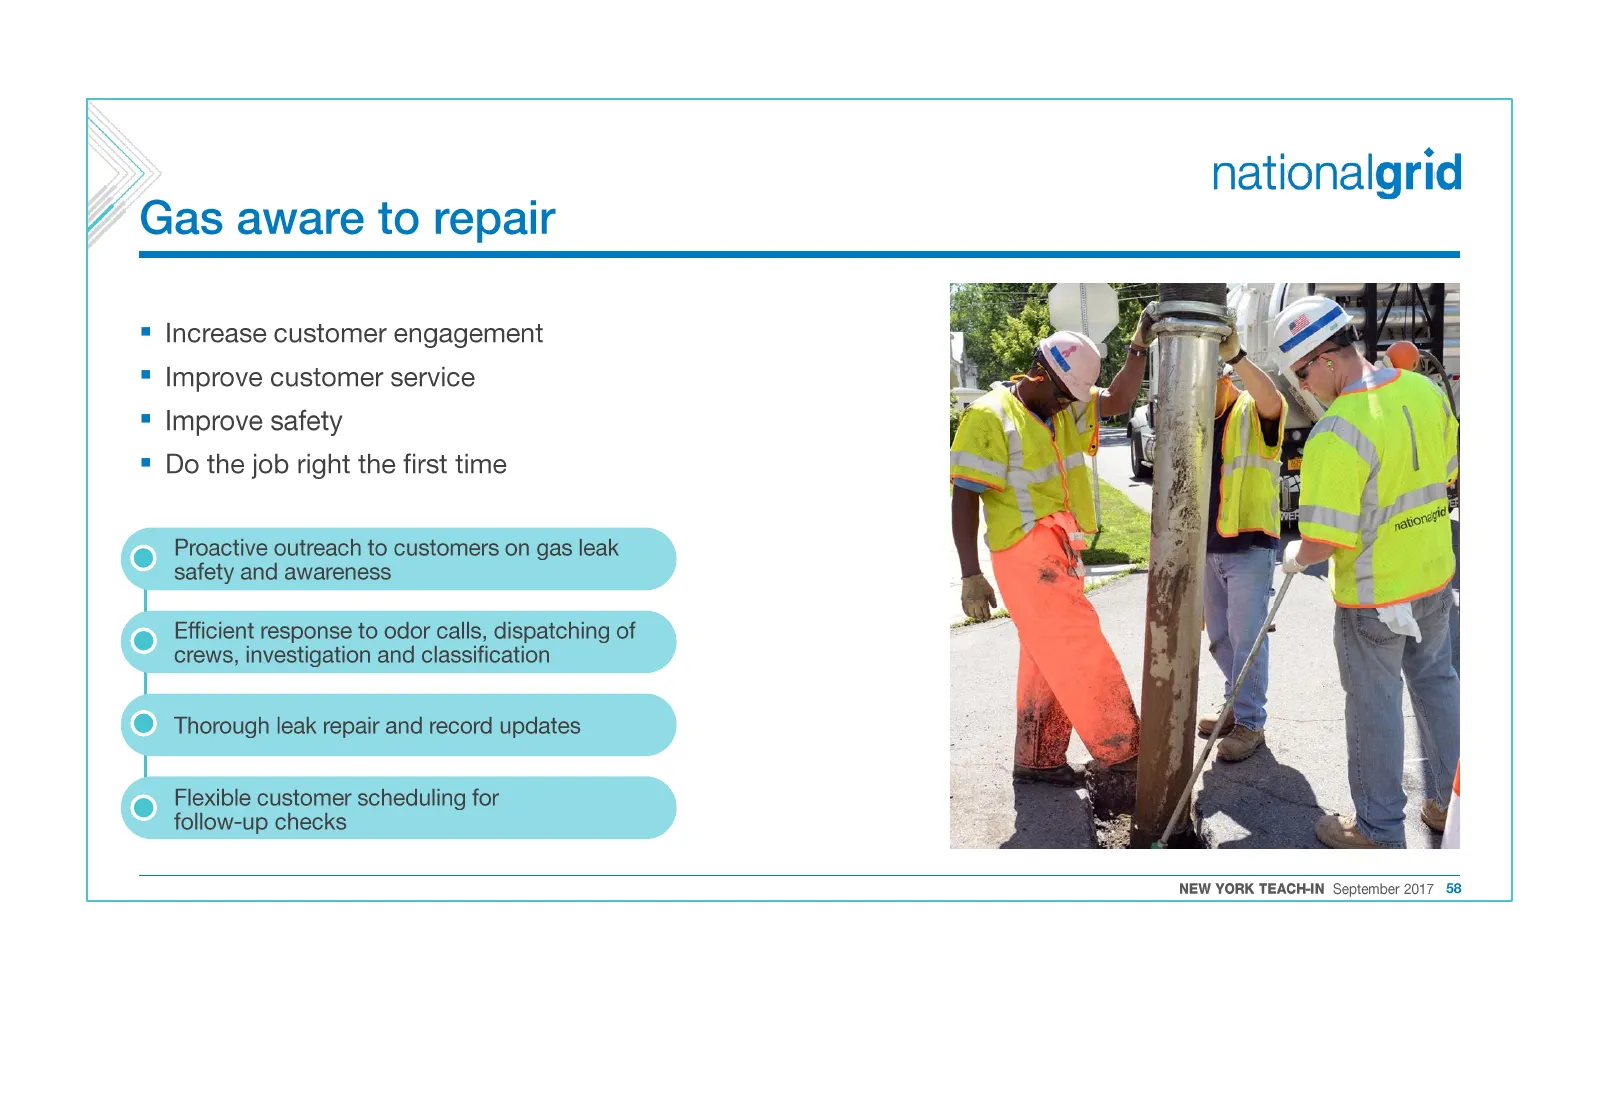
Slide 58: Gas aware to repair
Gas aware to repair = Increase customer engagement = Improve customer service = Improve safety = Do the job right the first time nationalgrid NEW YORK TEACH-N September 2017 58
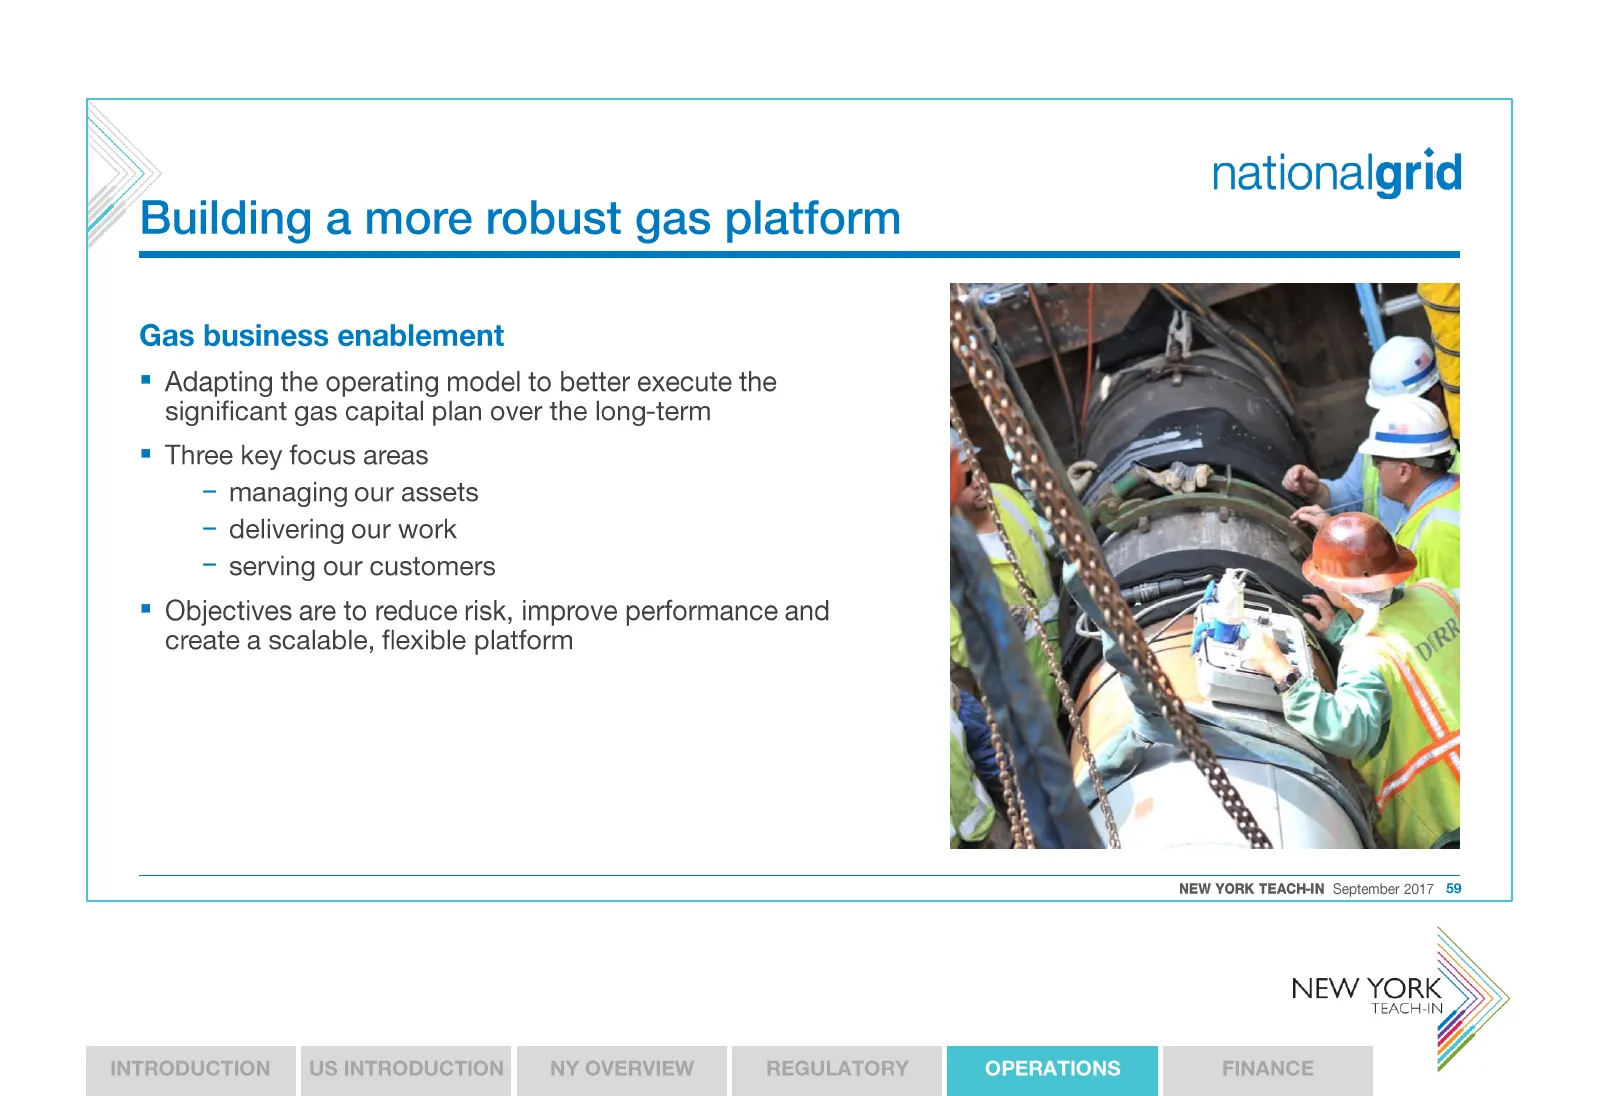
Slide 59: Building a more robust gas platform
Building a more robust gas platform nationalgrid Gas business enablement = Adapting the operating model to better execute the significant gas capital plan over the long-term = Three key focus areas — managing our assets - delivering our work — serving our customers = Objectives are to reduce risk, i
Slide 60: Bringing complex capital delivery to the US business
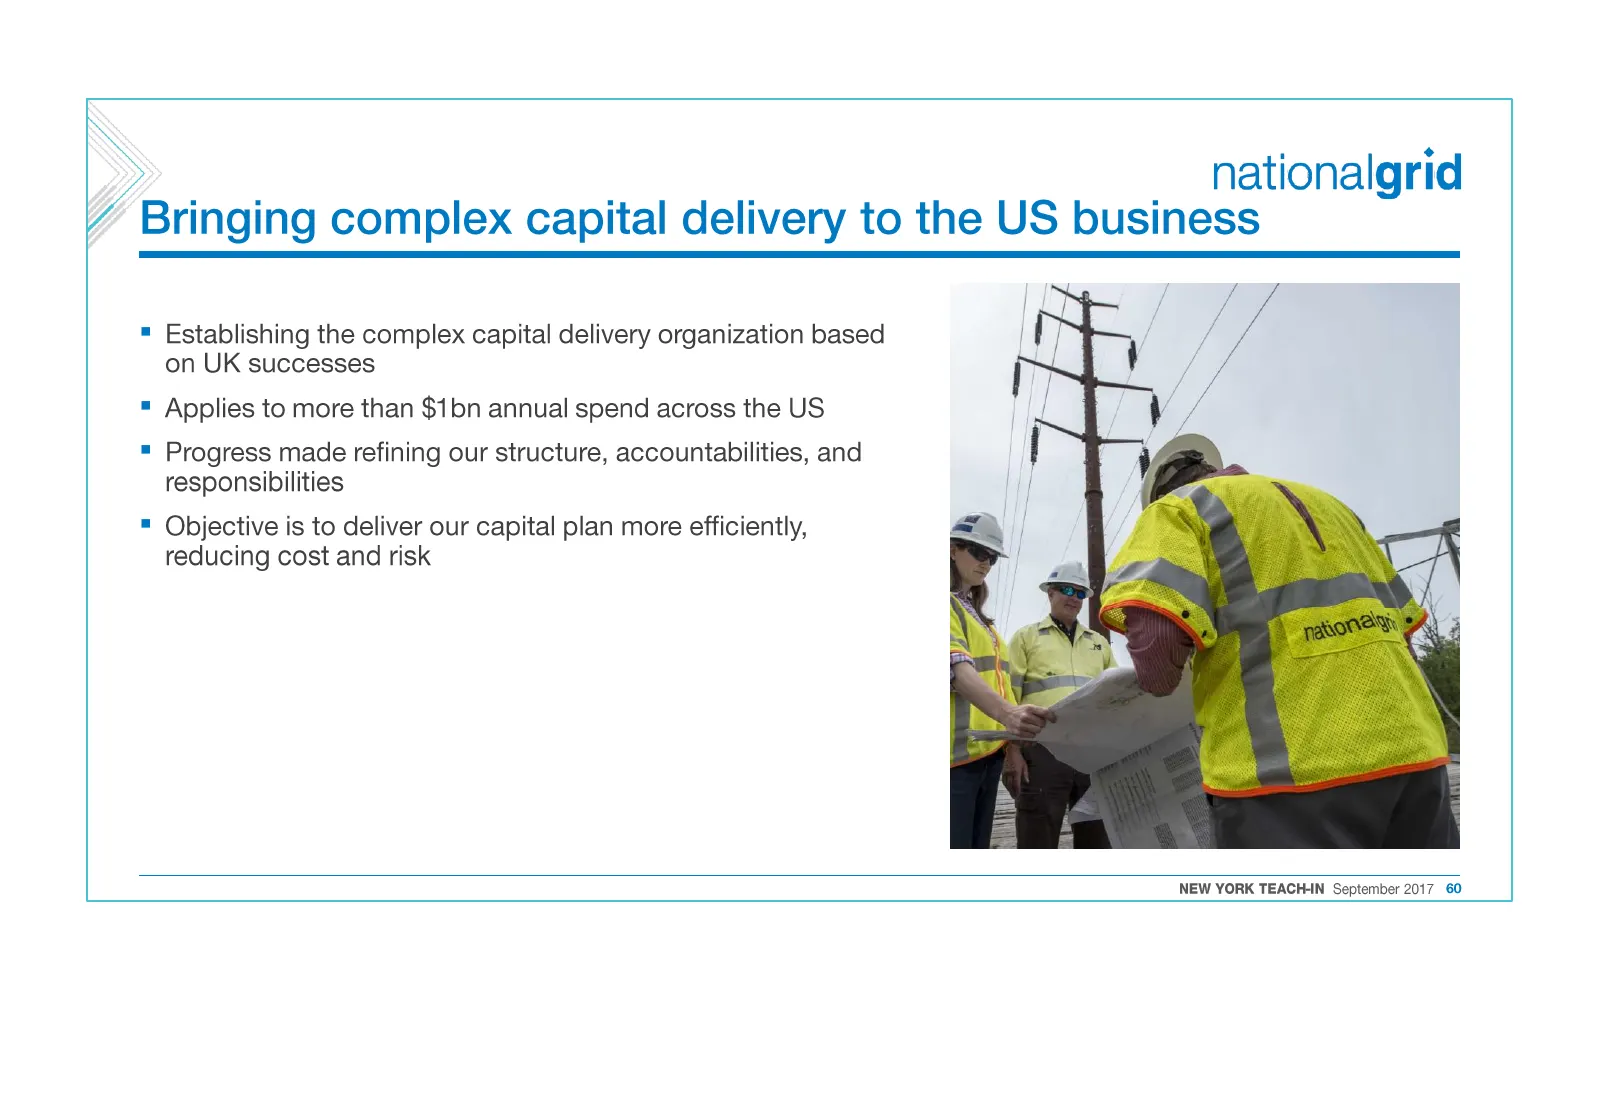
nationalgrid Bringing complex capital delivery to the US business = Establishing the complex capital delivery organization based on UK successes = Applies to more than $1bn annual spend across the US = Progress made refining our structure, accountabilities, and responsibilities = Objective is to del
Slide 61: Improving reliability and enabling future growth
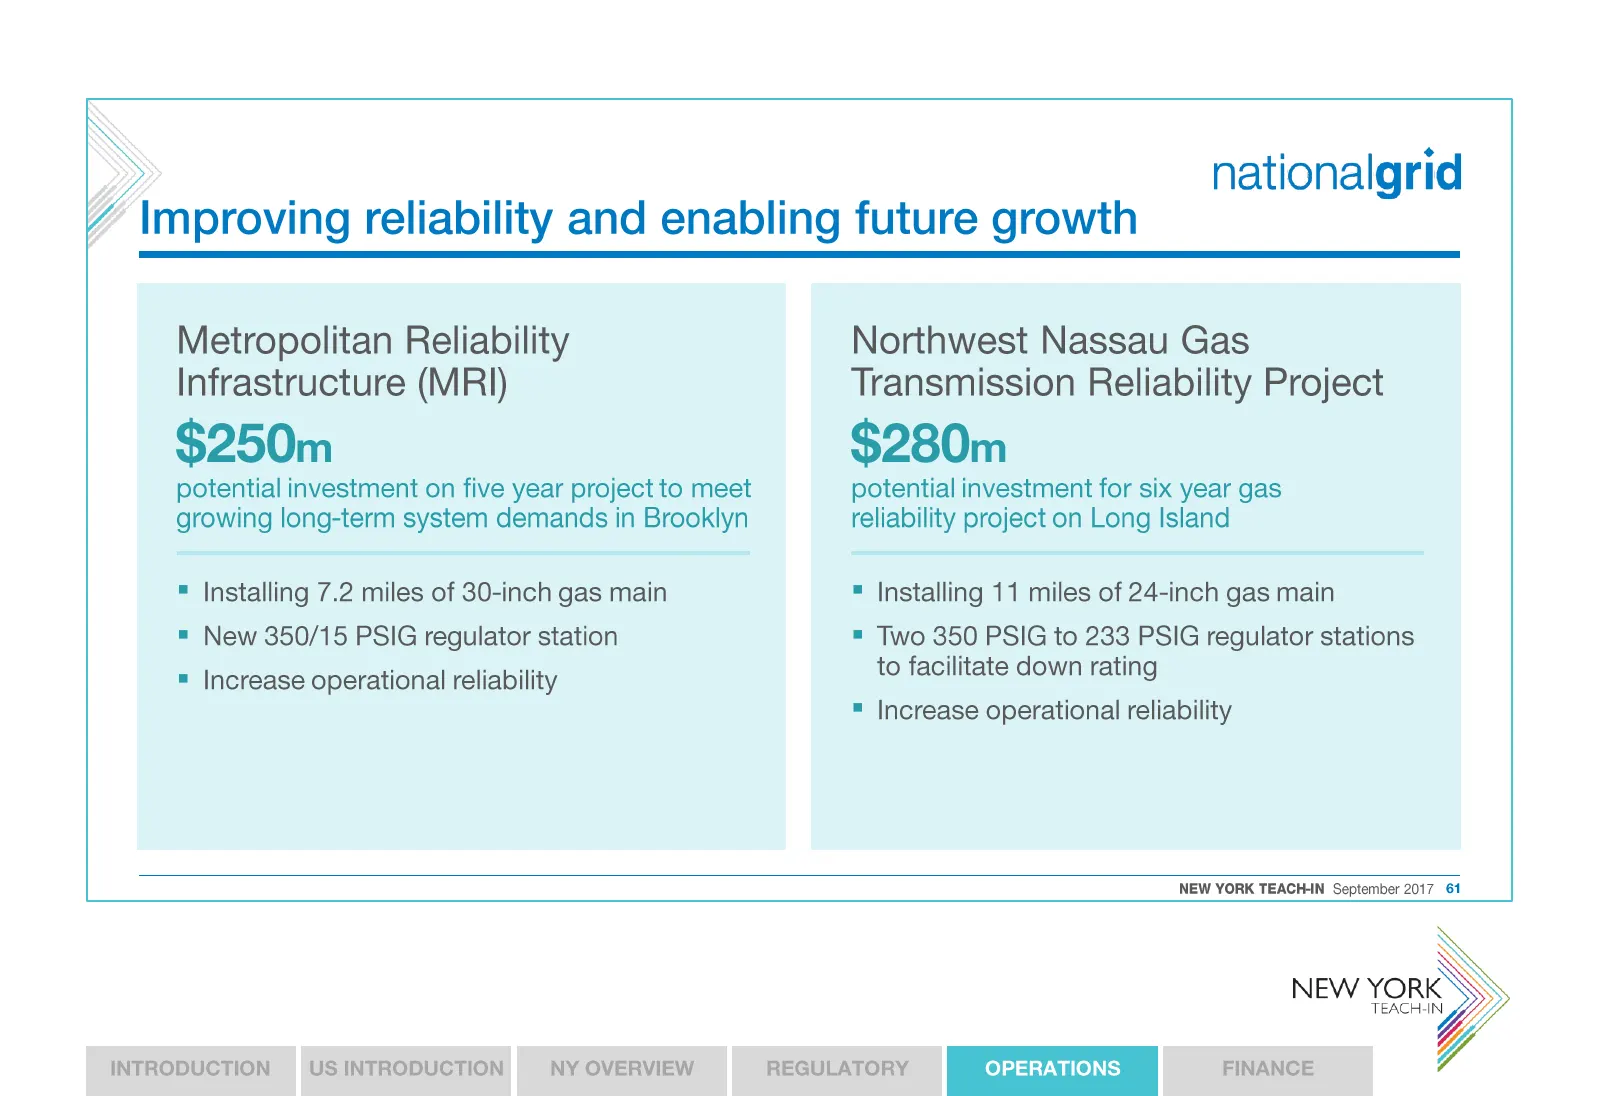
nationalgrid Improving reliability and enabling future growth Metropolitan Reliability Northwest Nassau Gas Infrastructure (MRI) Transmission Reliability Project $250m $280m potential investment on five year project to meet potential investment for six year gas growing long-term system demands in Br
Slide 62: Revitalizing Western New York
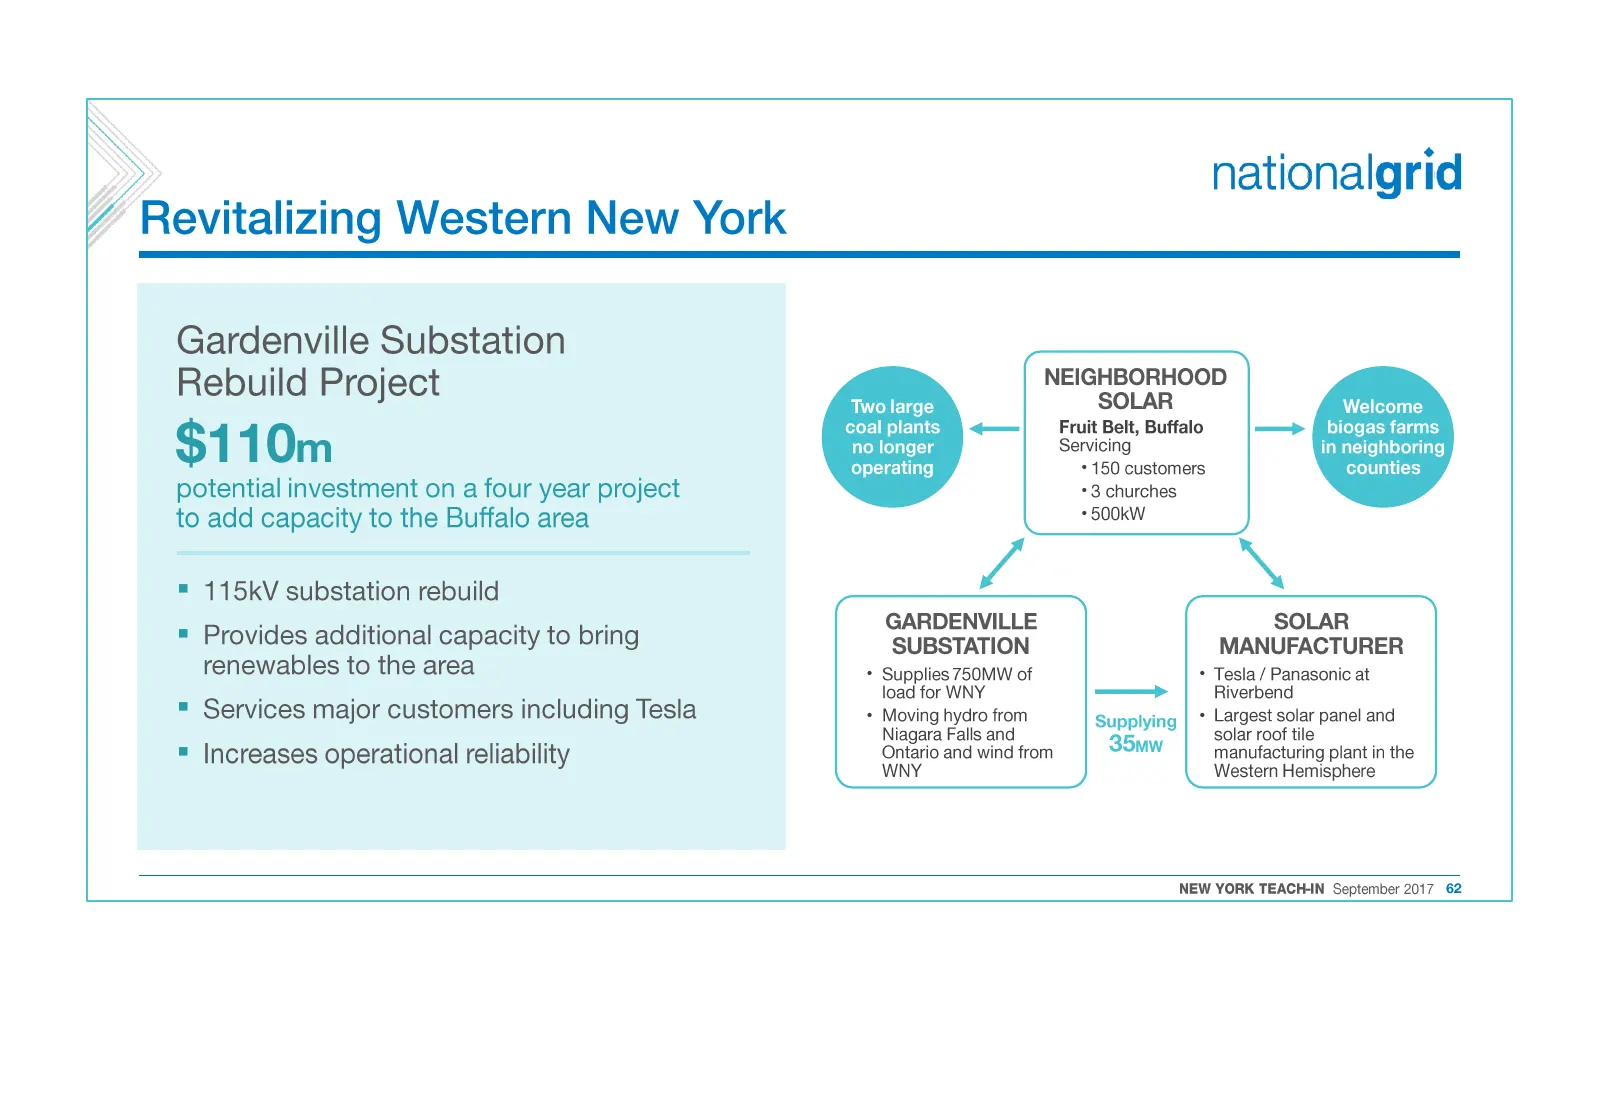
Revitalizing Western New York nationalgrid Gardenville Substation Rebuild Project $110m potential investment on a four year project to add capacity to the Buffalo area = 115kV substation rebuild = Provides additional capacity to bring renewables to the area = Services major customers including Tesla
Slide 63: Operations summary
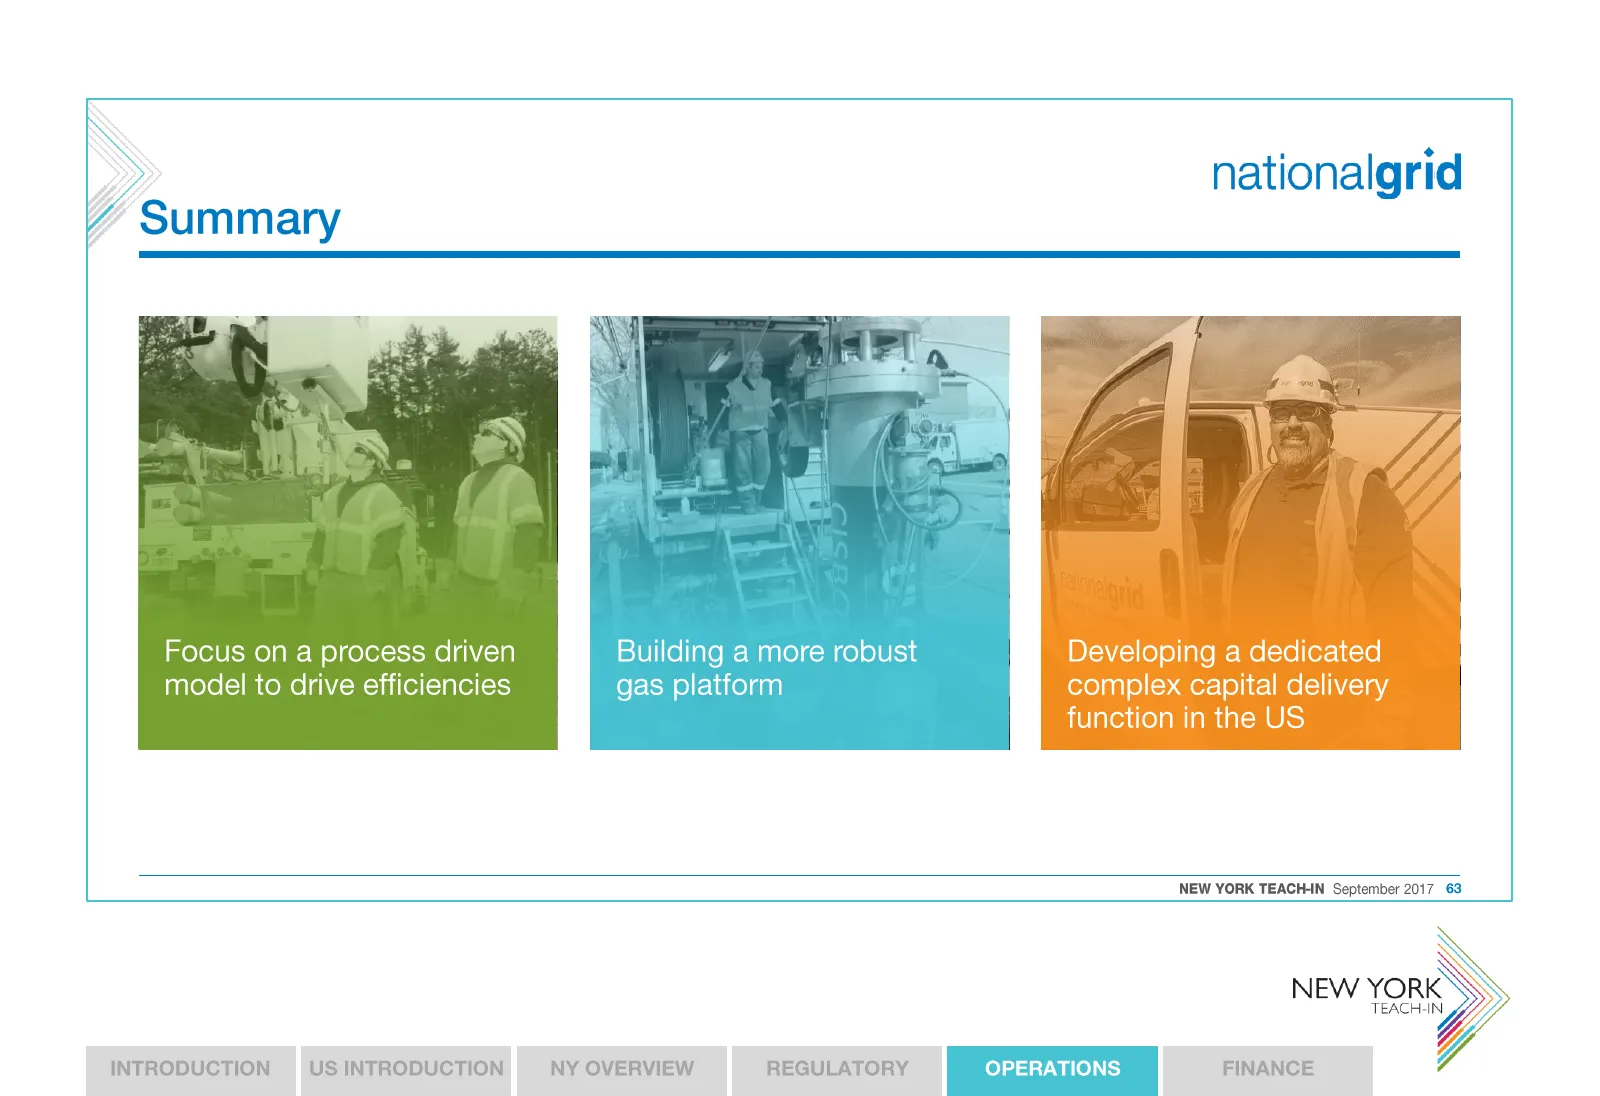
nationalgrid Focus on a process driven Building a more robust Developing a dedicated model to drive efficiencies gas platform complex capital delivery function in the US NEW YORK TEACH-N September 2017 63 NEW YORK TEACH-IN INTRODUCTION US INTRODUCTION NY OVERVIEW REGULATORY OPERATIONS FINANCE VW

Slide 64: Deliberately left blank
Deliberately left blank
Slide 65: Finance
nationalgrid FINANCE PEGGY SMYTH US CHIEF FINANCIAL OFFICER NEW YORK TEACH-IN NEW YORK TEACH-IN Y INTRODUCTION US INTRODUCTION NY OVERVIEW REGULATORY OPERATIONS FINANCE
Slide 66: Peggy Smyth
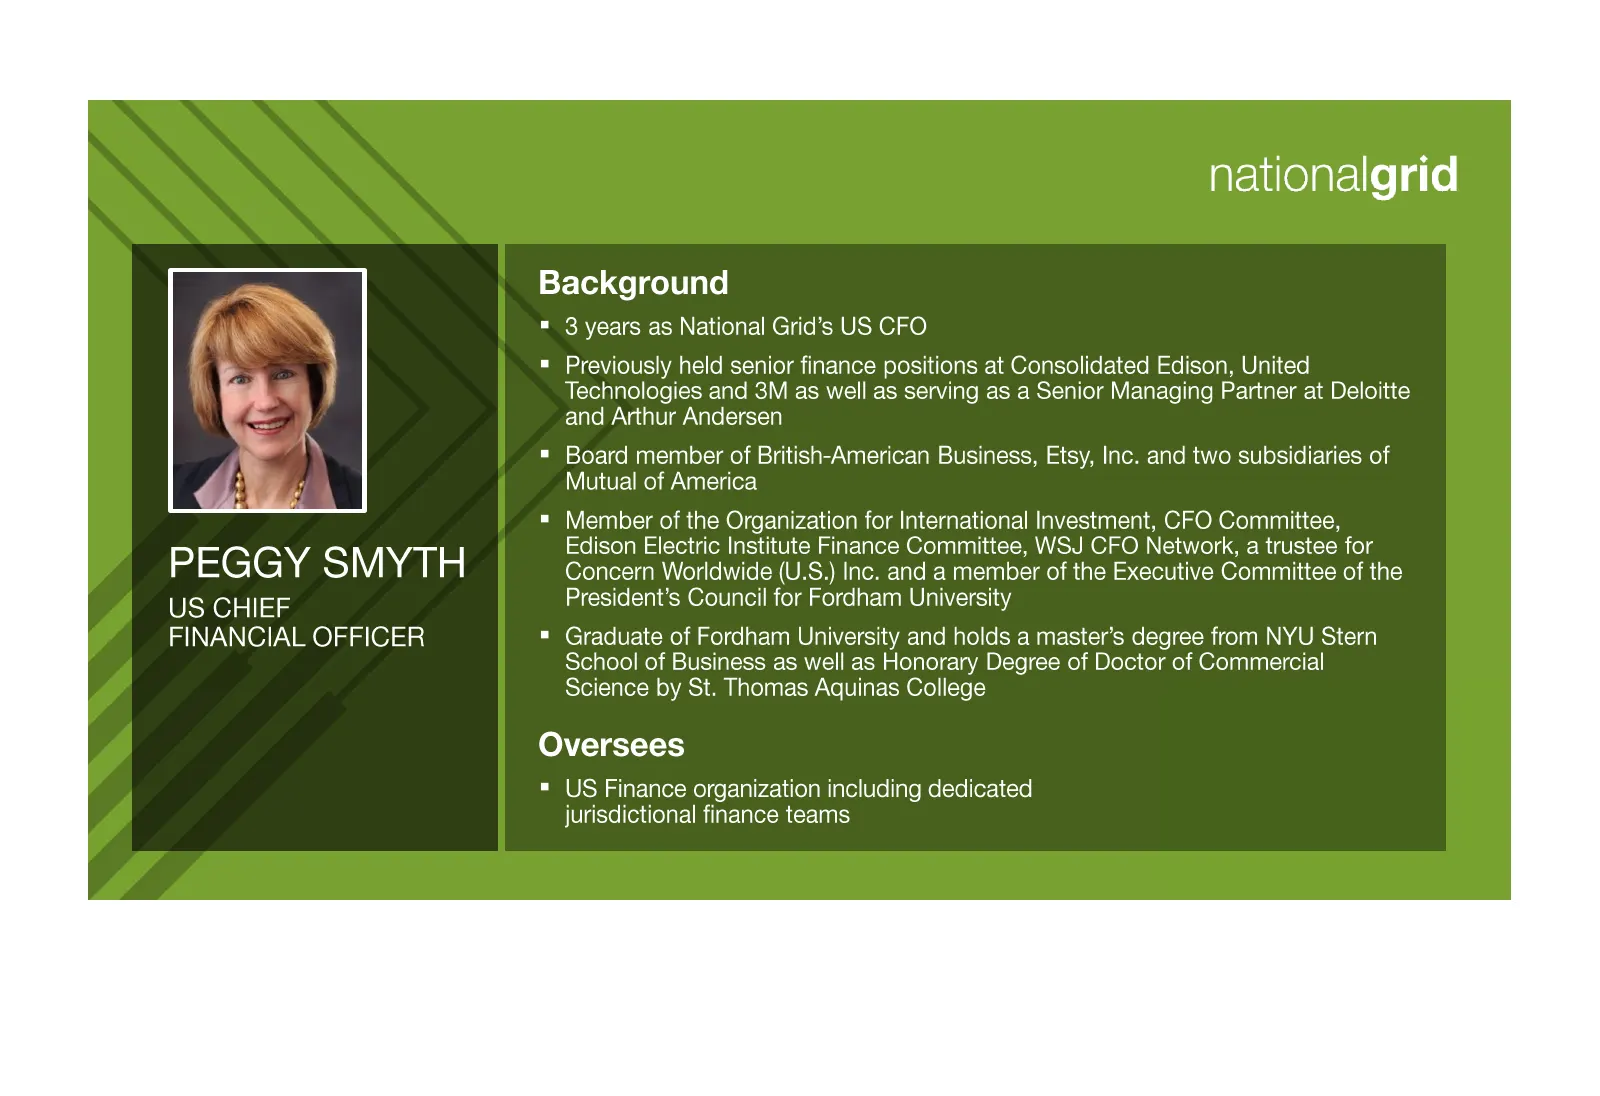
PEGGY SMYTH US CHIEF FINANCIAL OFFICER nationalgrid Background = 3 years as National Grid’s US CFO = Previously held senior finance positions at Consolidated Edison, United Technologies and 3M as well as serving as a Senior Managing Partner at Deloitte and Arthur Andersen Board member of British-Ame
Slide 67: Good progress in NY since 2015
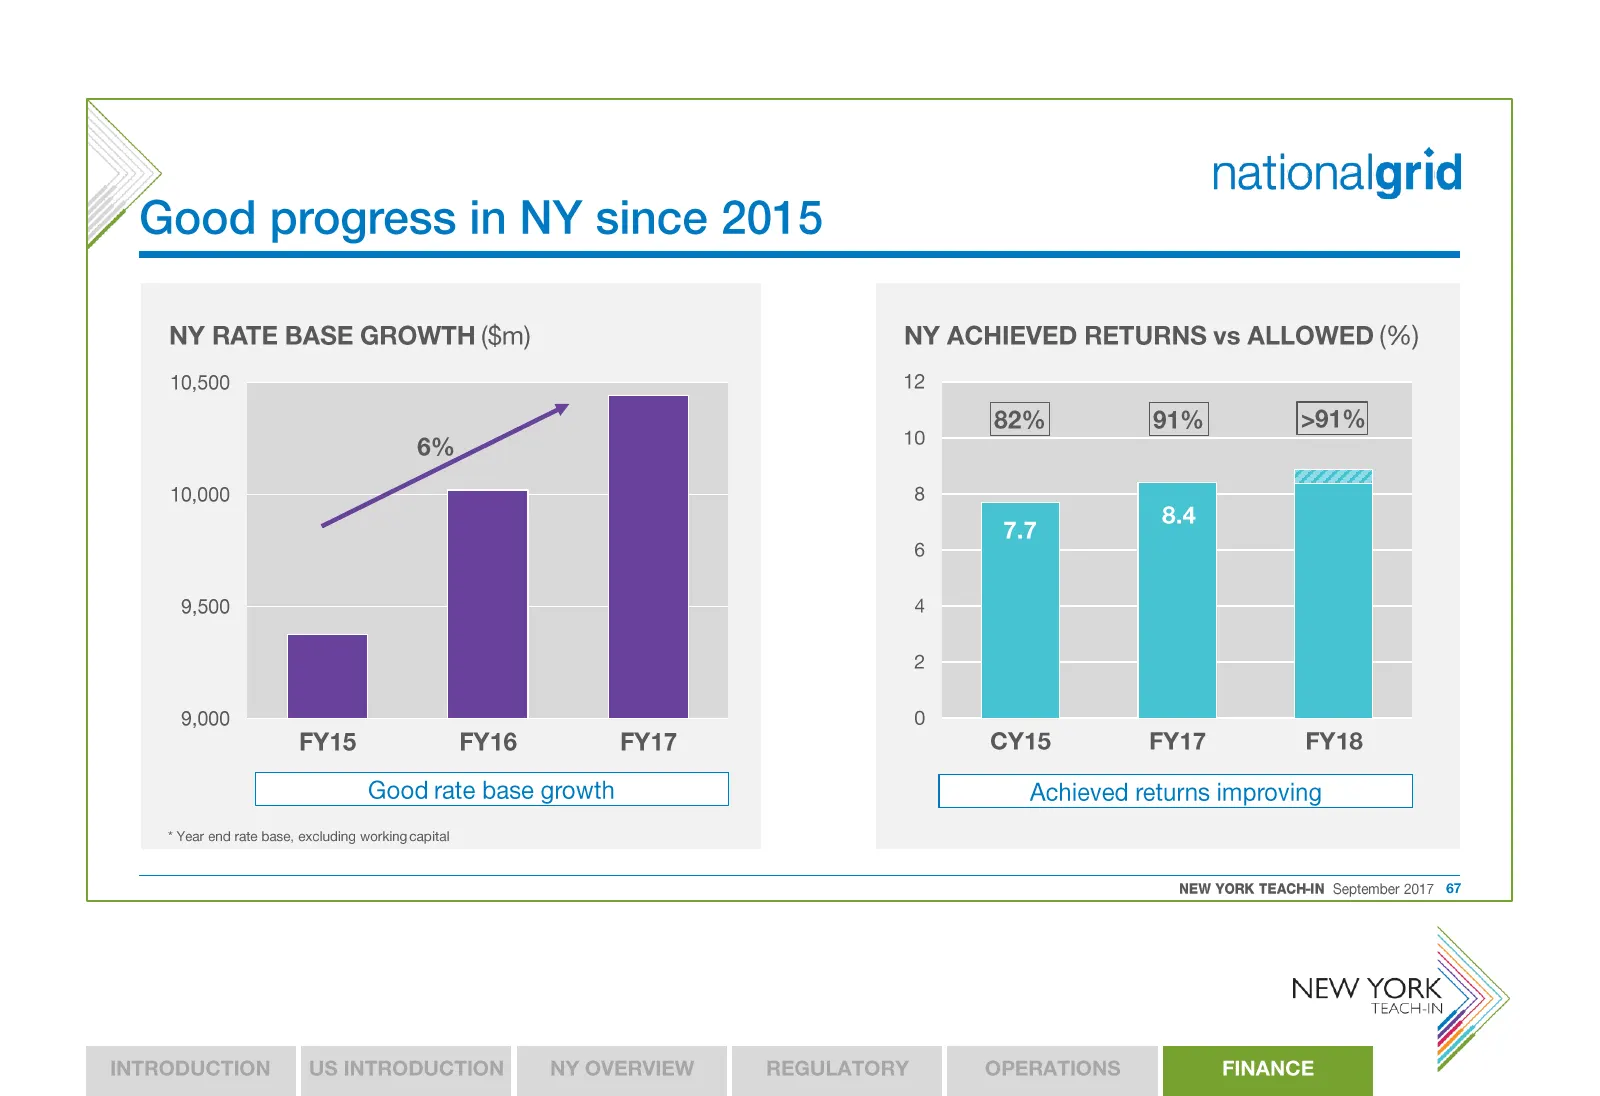
Good progress in NY since 2015 nationalgrid NY RATE BASE GROWTH ($m) 10,500 6% 10,000 9,500 9,000 LJ FY15 FY16 FY17 Good rate base growth * Year end rate base, excluding working capital NY ACHIEVED RETURNS vs ALLOWED (%) 12 [82%] [91%] [>91%] LLLLSS 8 7.7 6 4 2 0 cY15 FY17 FY18 Achieved returns impr
Slide 68: US and UK returns not directly comparable
US and UK returns not directly comparable nationalgrid = Headline returns differ - US to UK — US regulation provides faster recovery through a full cash return upfront — higher equity ratio provides a return on a larger portion of assets = Expect NY to be supportive of the US business’ targeting 90%
Slide 69: NY has a clear path for >7% growth
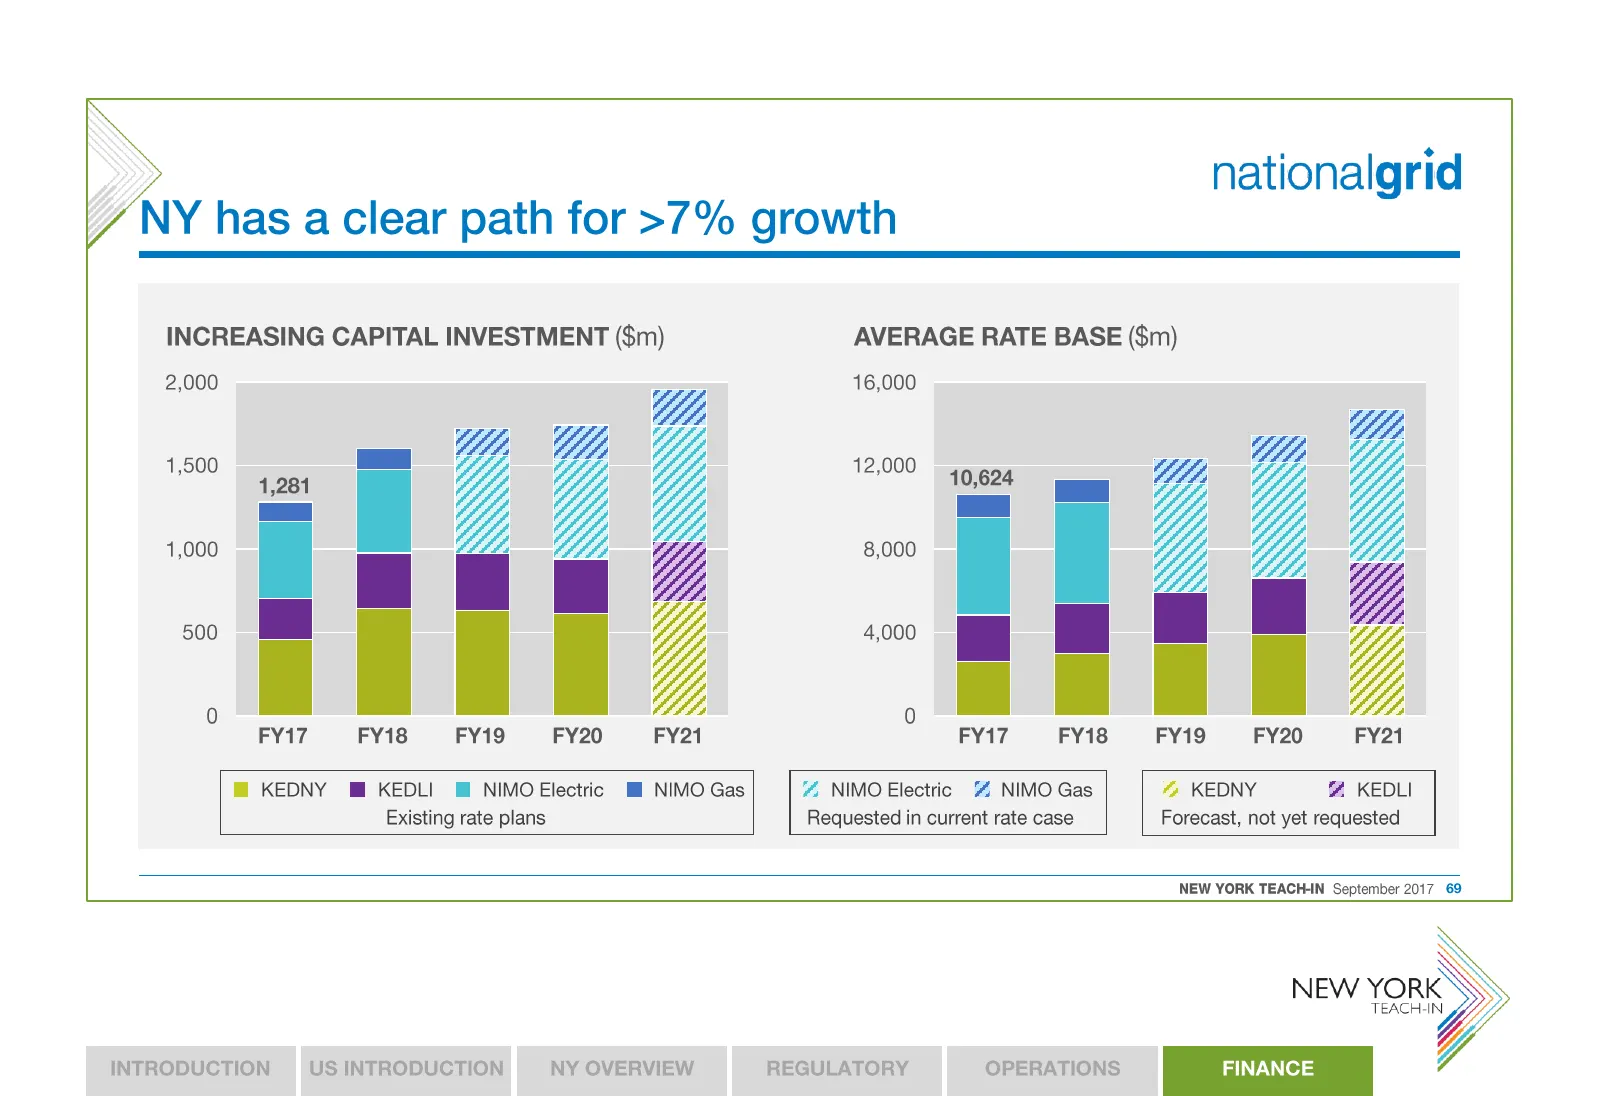
nationalgrid NY has a clear path for >7% growth INCREASING CAPITAL INVESTMENT ($m) AVERAGE RATE BASE ($m) 2,000 16,000 \ ty Yh Gy th Y 1,500 4201 | Yj “Wy Y, 12,000 49.694 = ty WY Y, Yj _ soo oi i UW j 4,000 || | | | || Yj a YZ ,OebizZ FY17 FY18 FY19 FY20 FY21 FY17 FY18 FY19 FY20 FY21 ™ KEDNY M@ KED
Slide 70: How investment flows into rate base
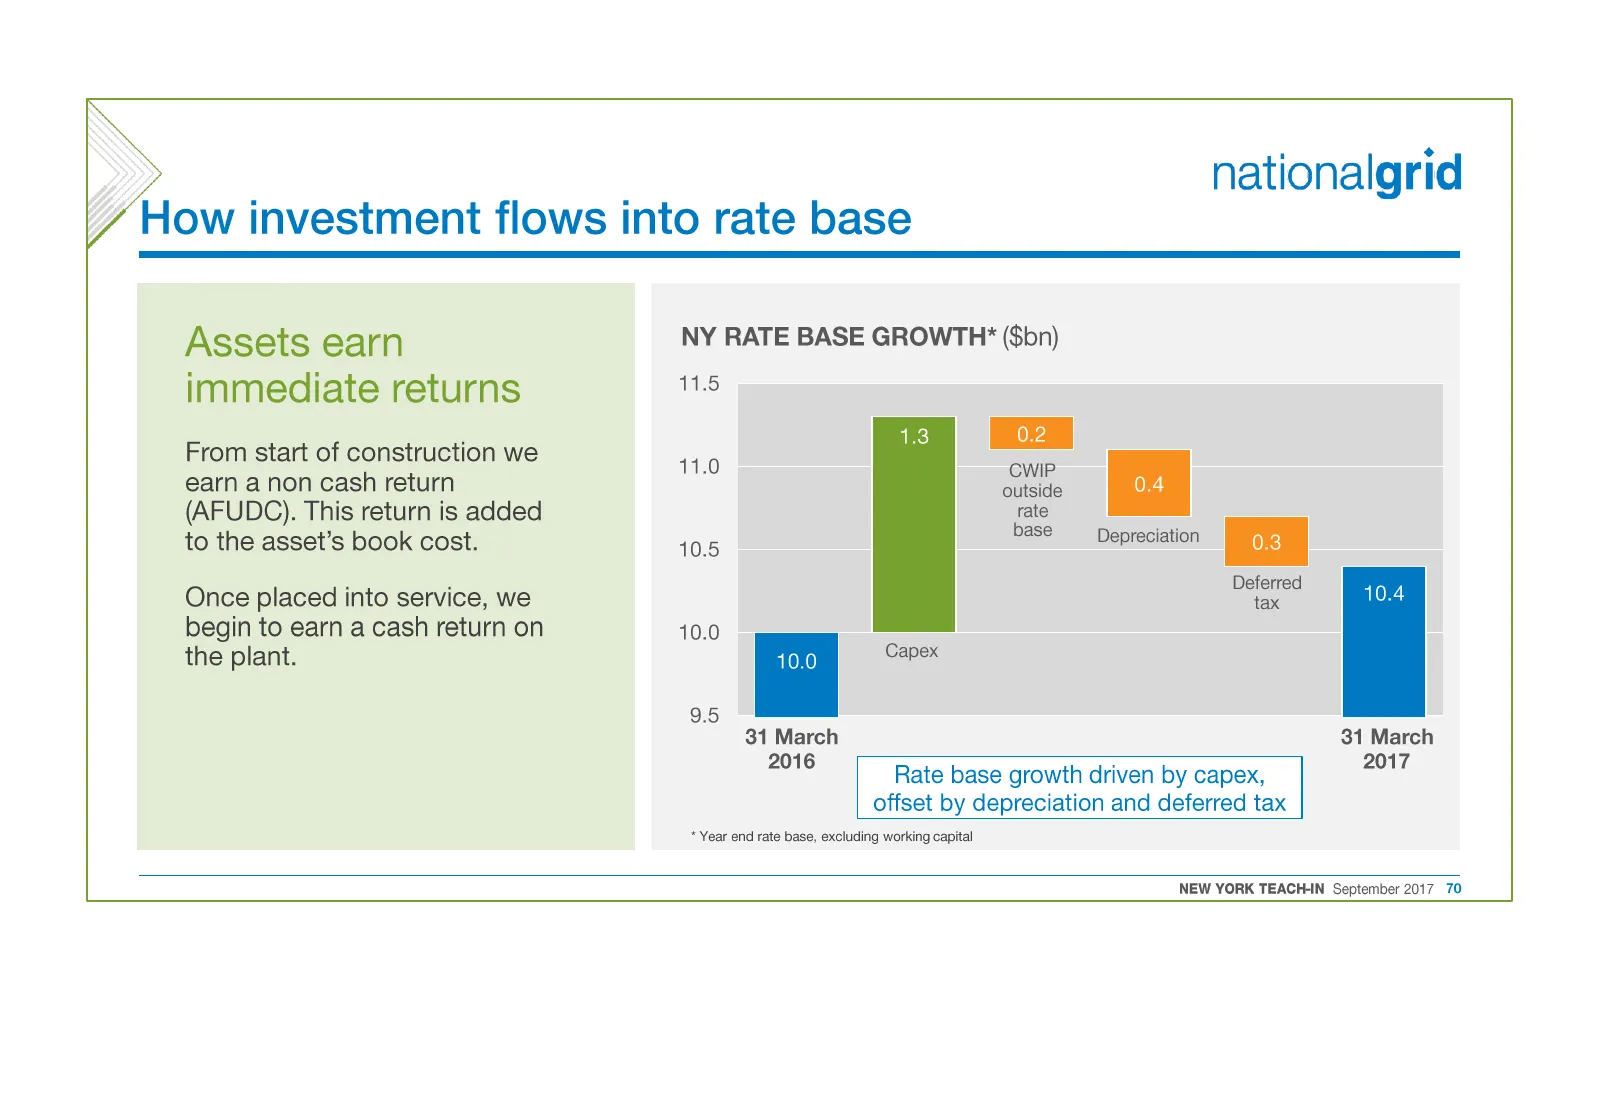
nationalgrid How investment flows into rate base Assets earn immediate returns From start of construction we earn anon cash return (AFUDC). This return is added to the asset’s book cost. Once placed into service, we begin to earn a cash return on the plant. NY RATE BASE GROWTH* ($bn) 11.5 11.0 10.5
Slide 71: Funding our growth
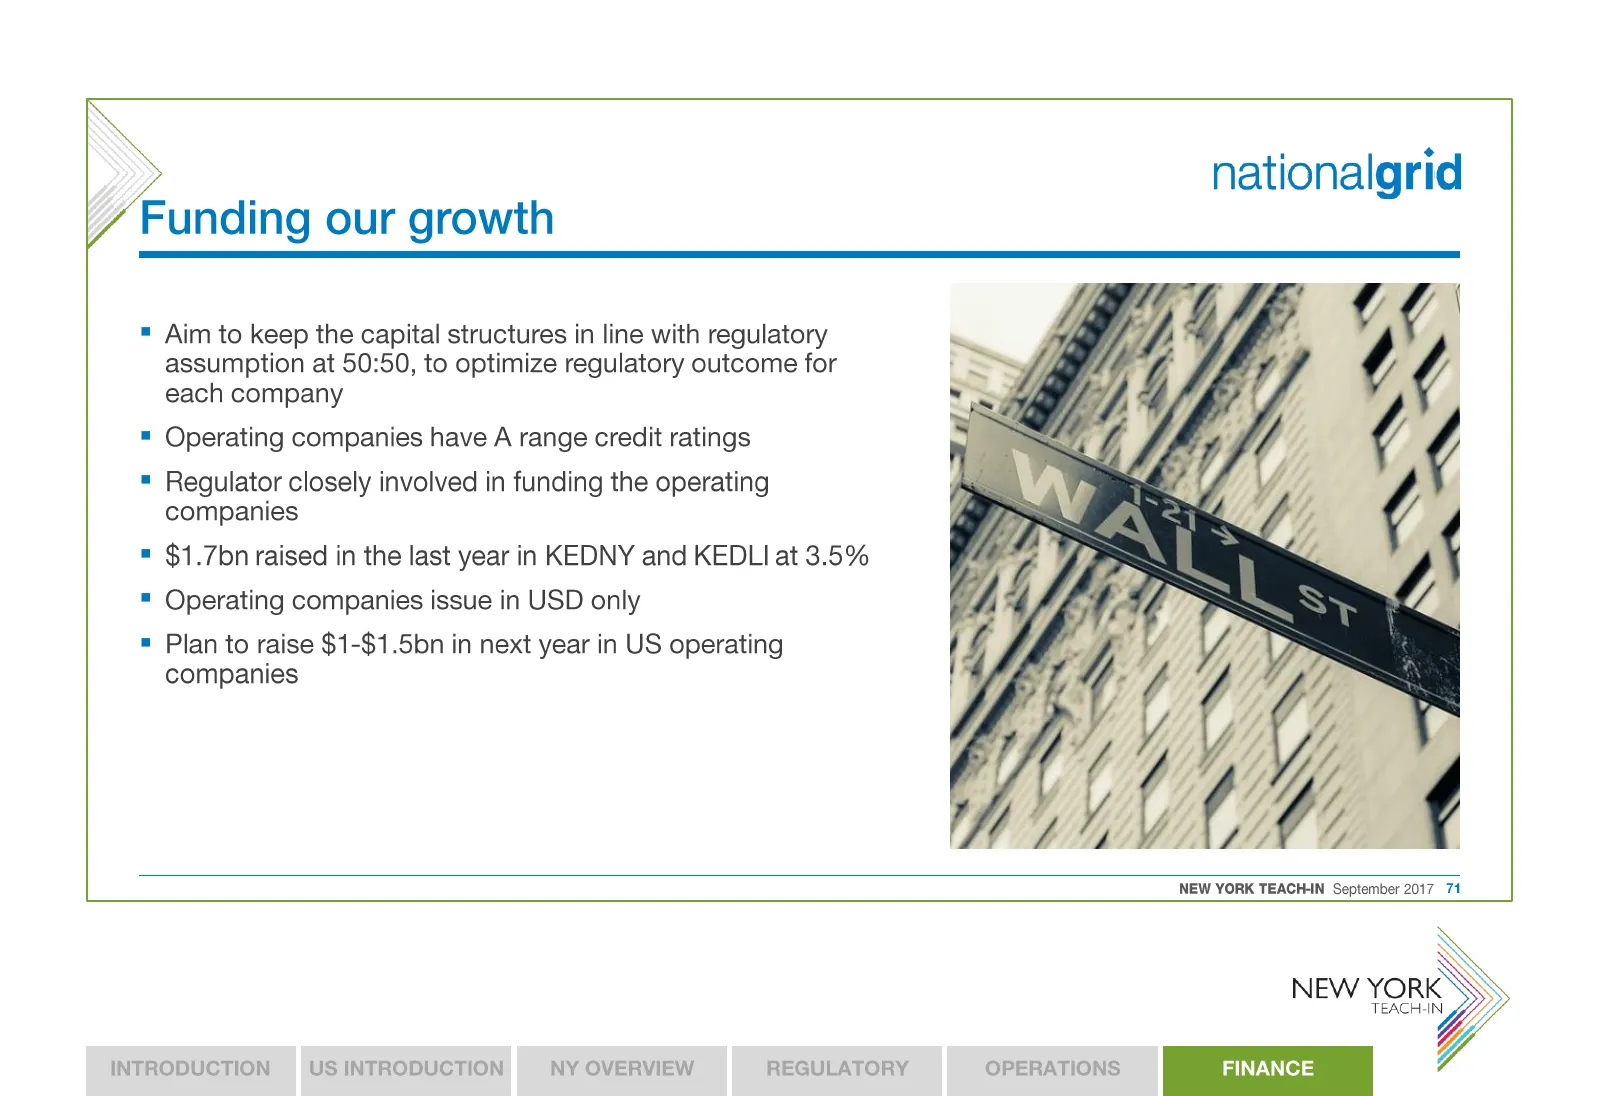
nationalgrid Funding our growth = Aim to keep the capital structures in line with regulatory assumption at 50:50, to optimize regulatory outcome for each company = Operating companies have A range credit ratings = Regulator closely involved in funding the operating companies = $1.7bn raised in the l
Slide 72: NY expected to deliver increased operating profit
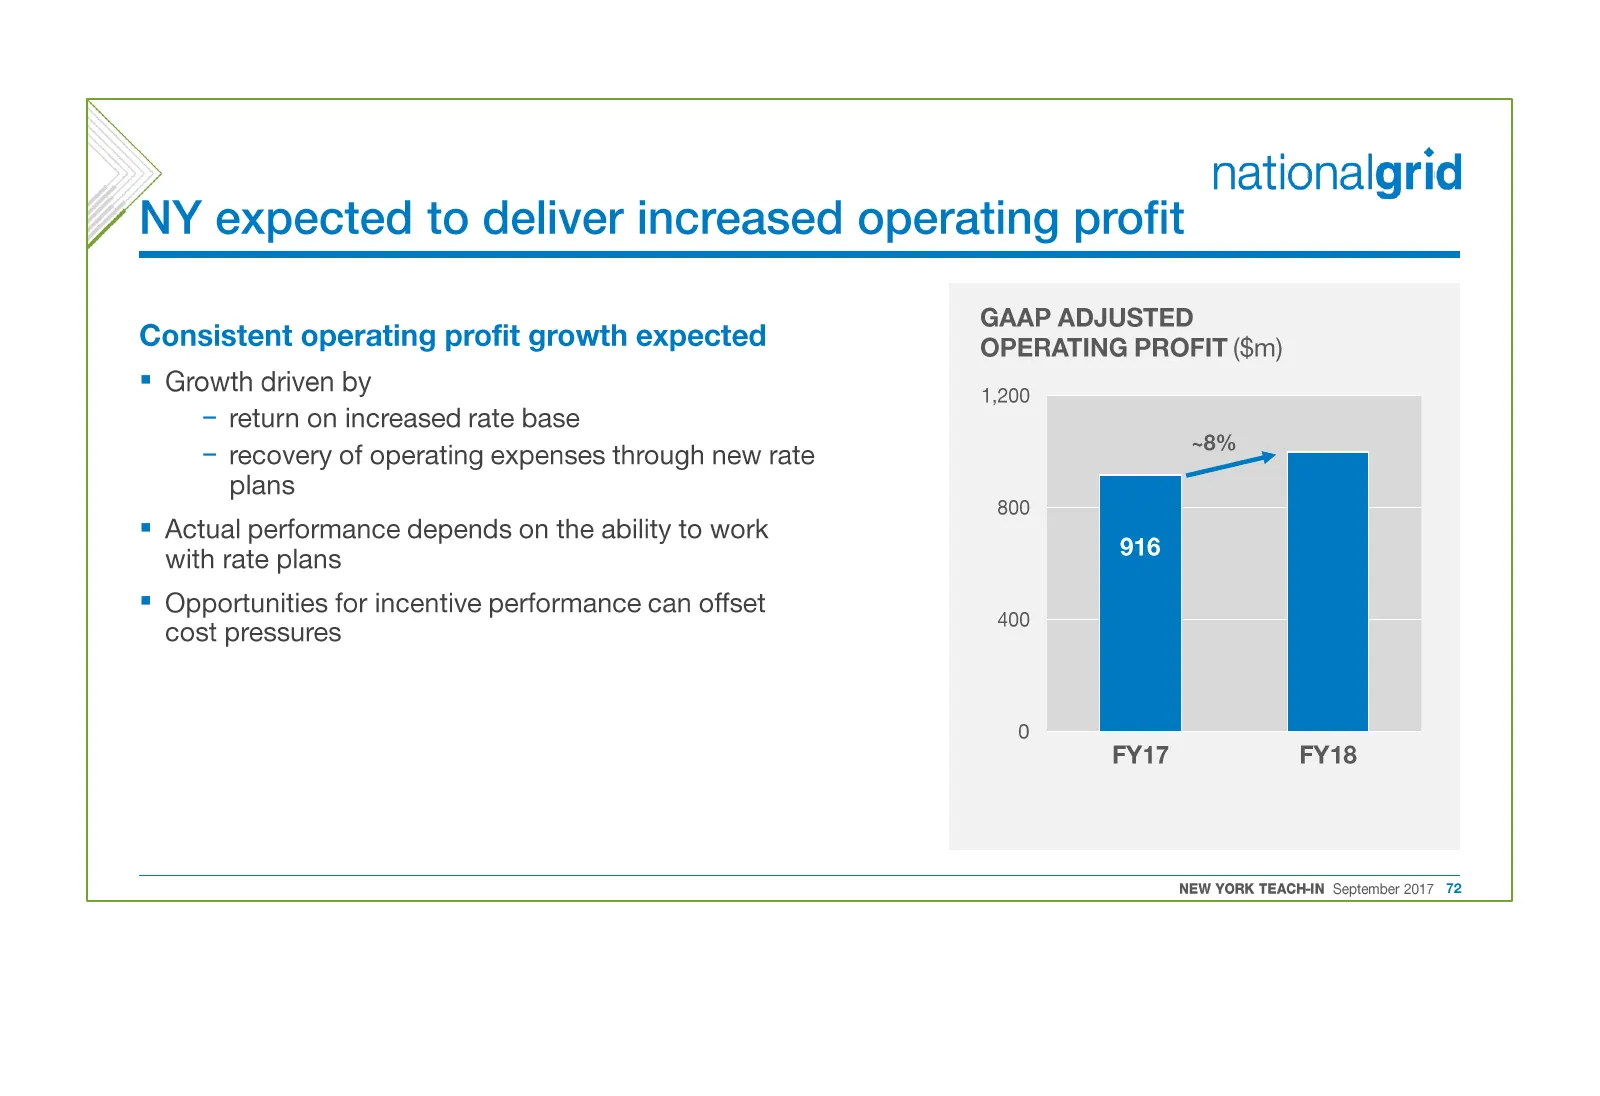
nationalgrid NY expected to deliver increased operating profit . . . GAAP Consistent operating profit growth expected OPER ane onoerr ($m) = Growth driven by aue — return on increased rate base y — recovery of operating expenses through new rate a plans 300 = Actual performance depends on the abilit
Slide 73: GAAP to IFRS differences can be volatile
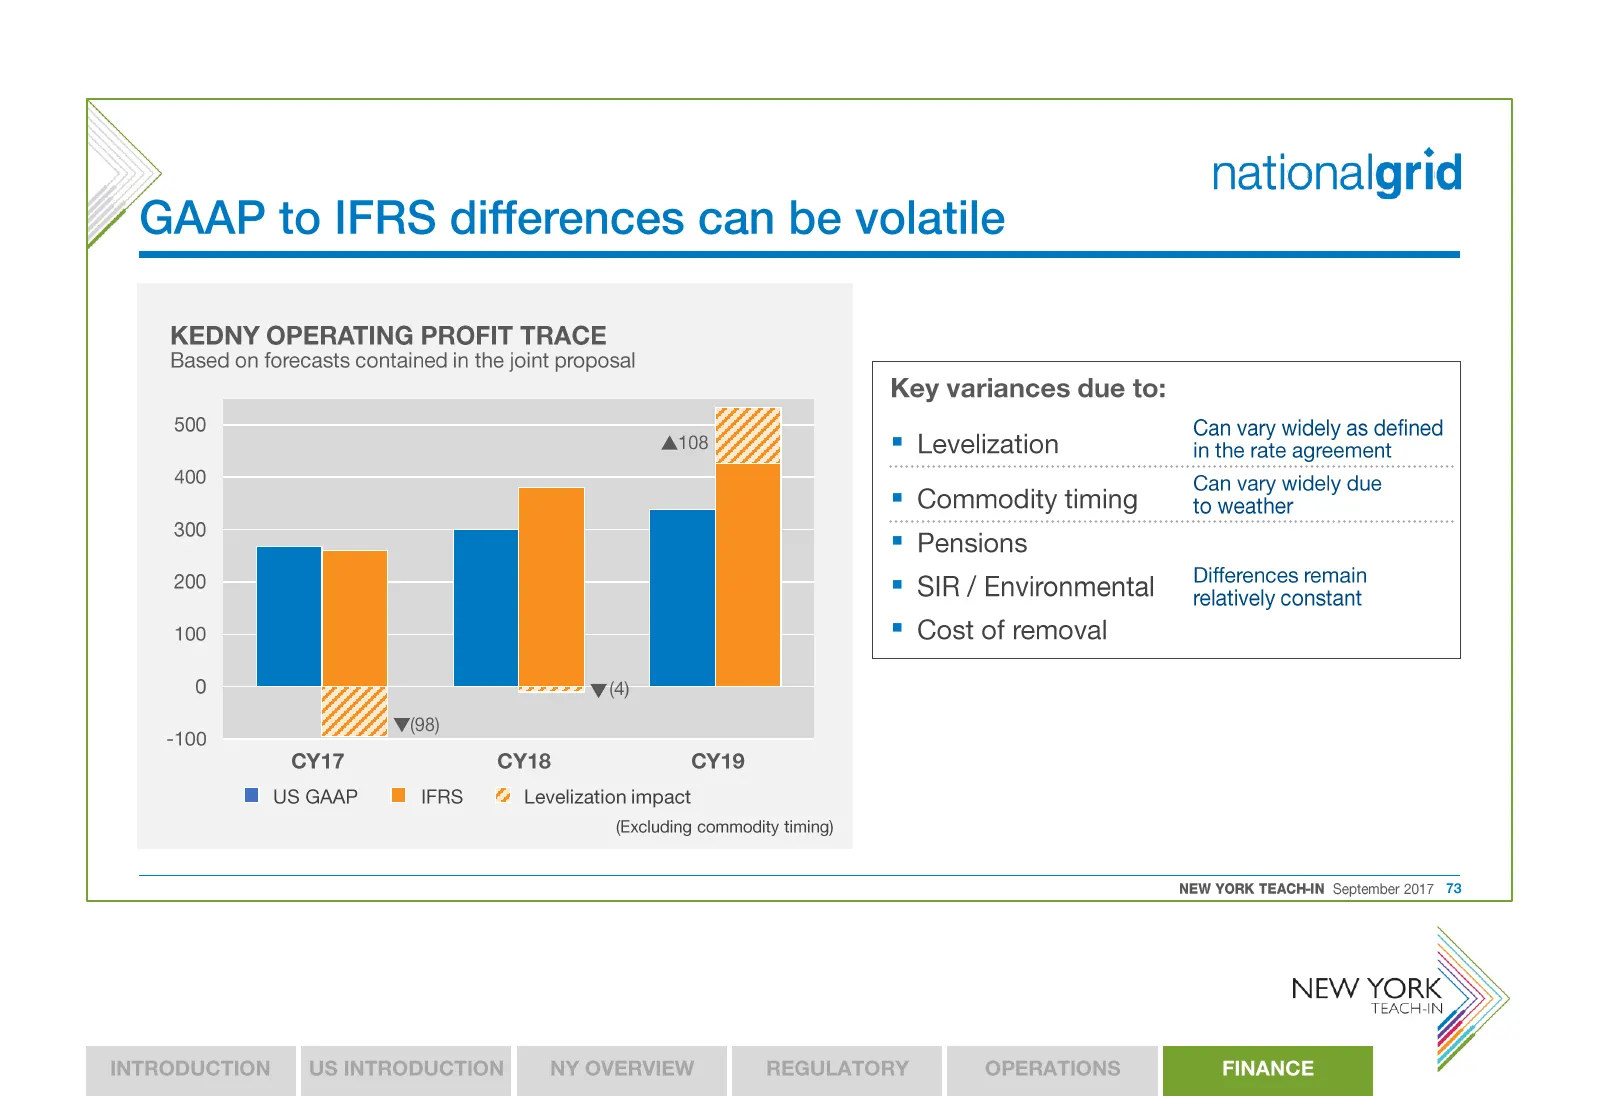
nationalgrid GAAP to IFRS differences can be volatile KEDNY OPERATING PROFIT TRACE Based on forecasts contained in the joint proposal 500 400 Yl v(98) 300 . 200 . 100 . () Key variances due to: Pensions Can vary widely as defined Levelizati Commodity timing —toweather Differences remain SIR / Enviro
Slide 74: NY supports overall US growth
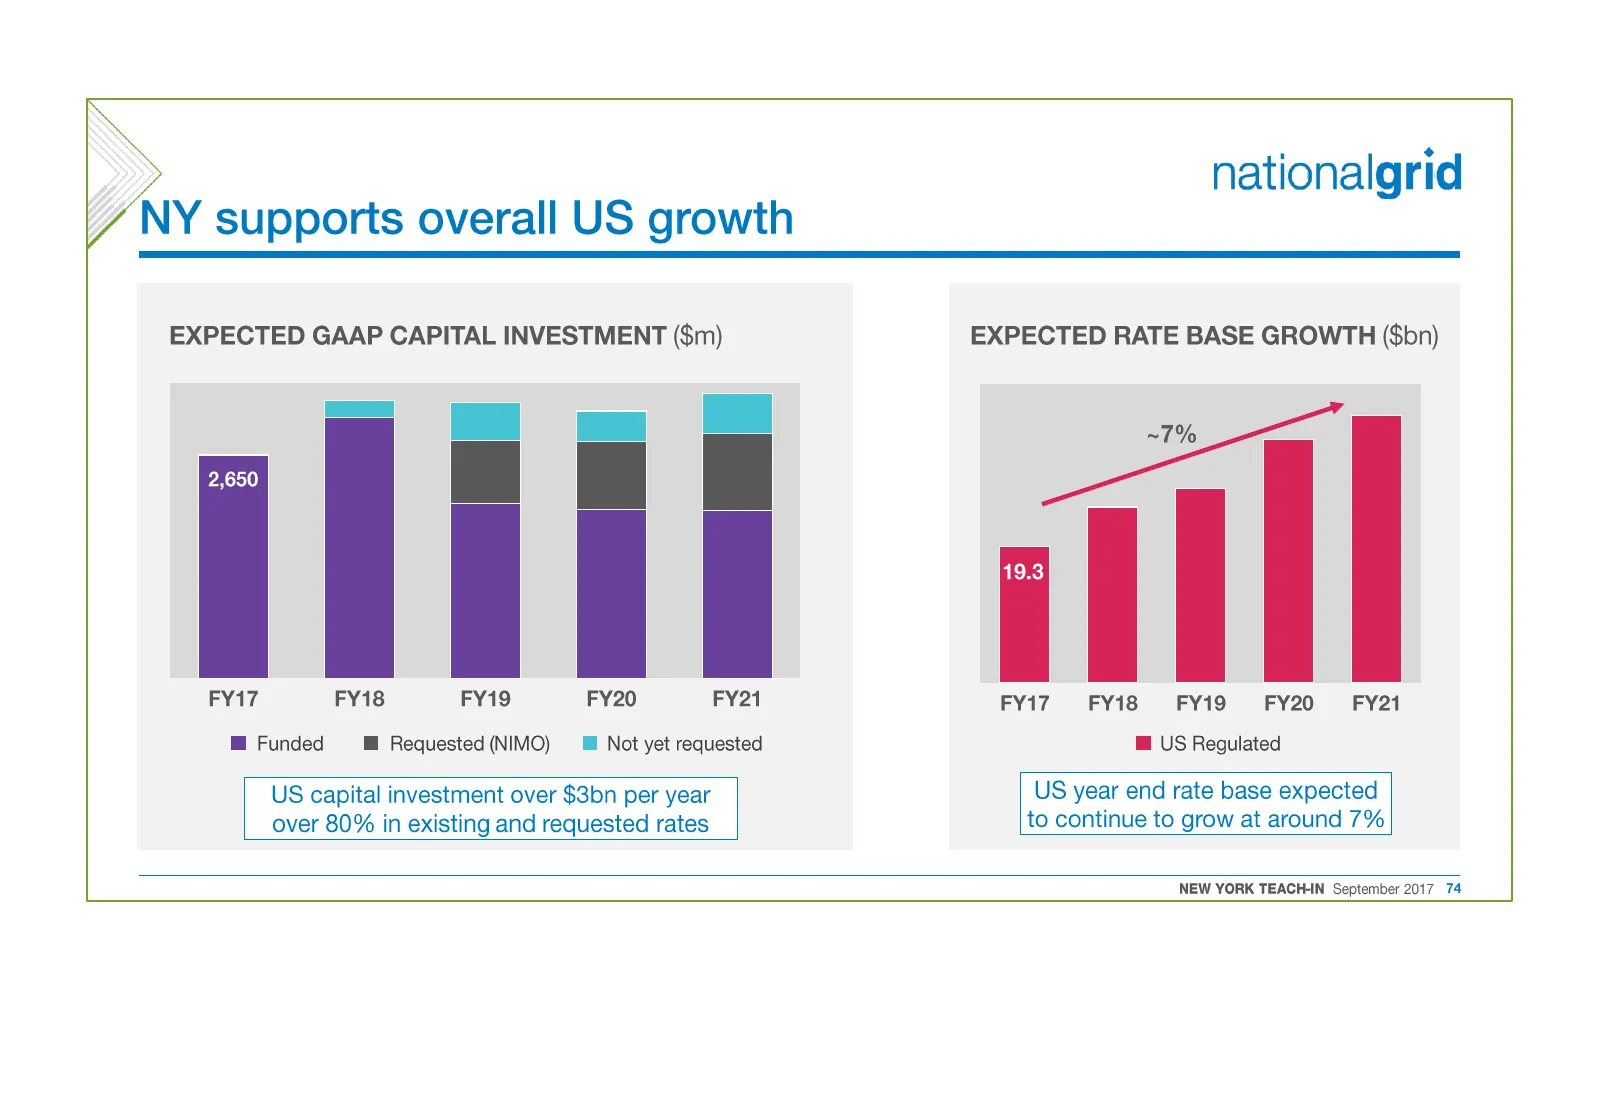
nationalgrid NY supports overall US growth EXPECTED GAAP CAPITAL INVESTMENT ($m) EXPECTED RATE BASE GROWTH ($bn) | | | a in = ' FY17 FY18 FY19 FY20 FY21 FY17 FY18 FY19 -FY20-~ FY21 @ Funded @ Requested (NIMO) ™ Not yet requested @ US Regulated US capital investment over $3bn per year US year end rat
Slide 75: And increasing US profitability
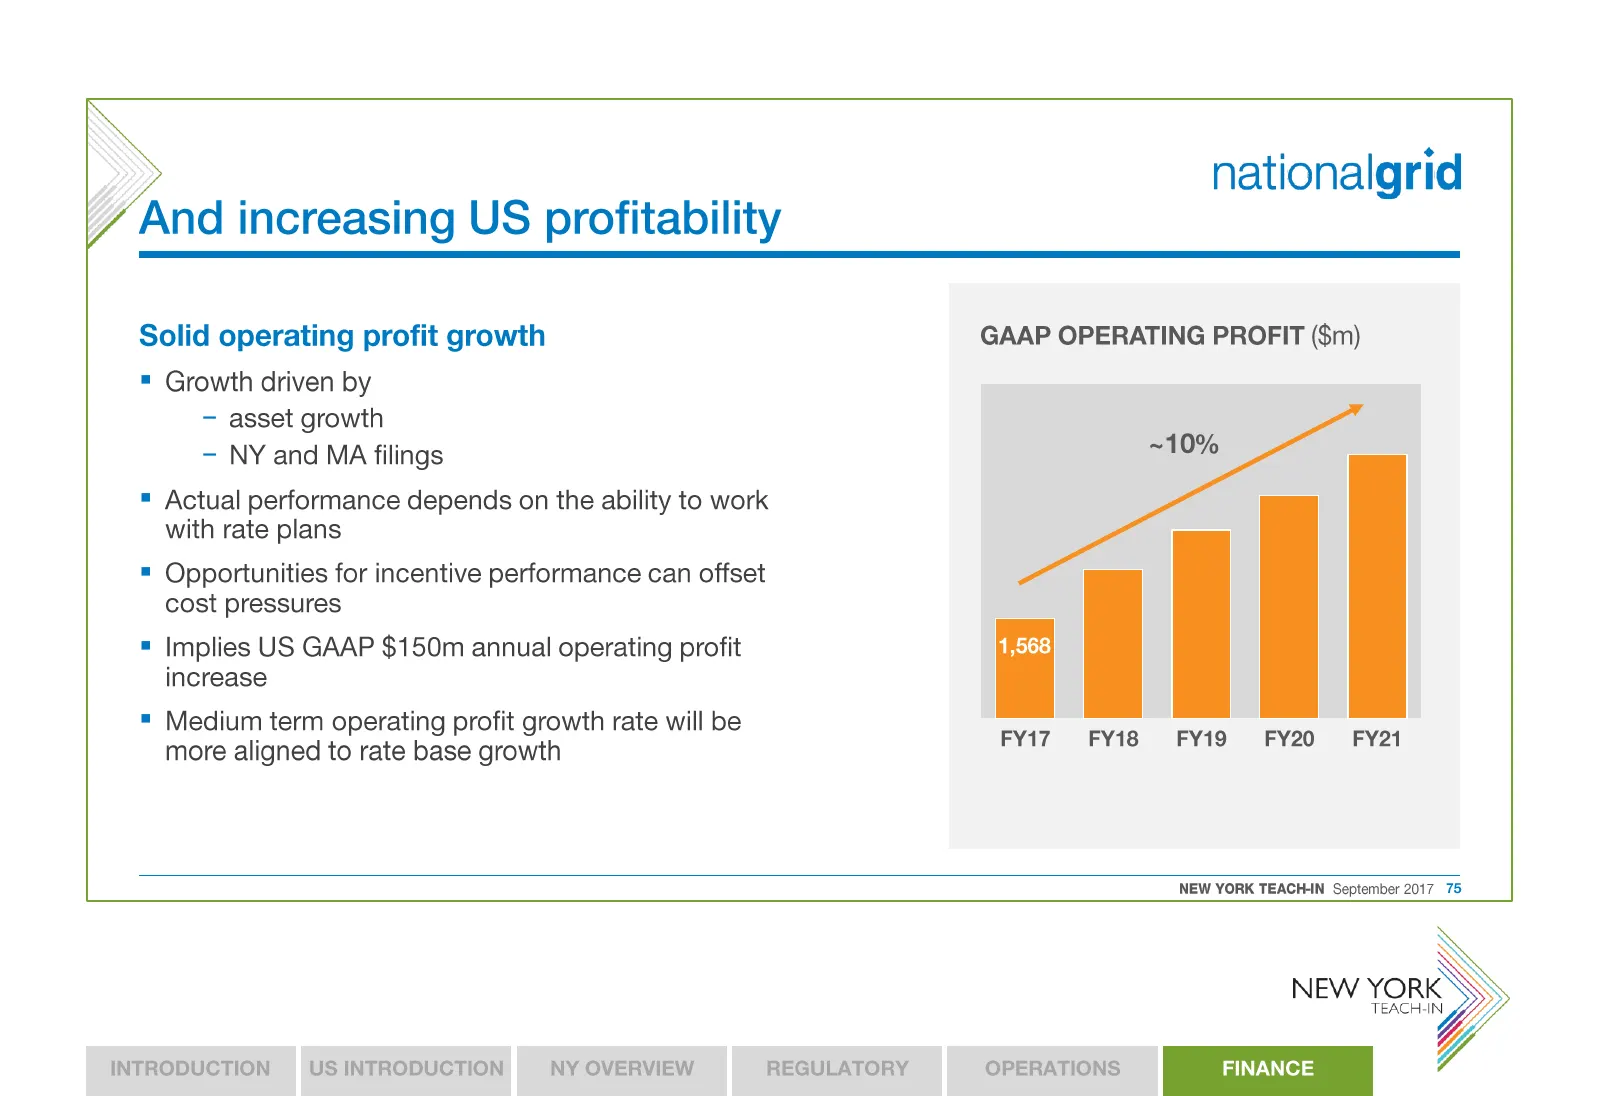
And increasing US profitability nationalgrid Solid operating profit growth = Growth driven by — asset growth - NY and MA filings = Actual performance depends on the ability to work with rate plans = Opportunities for incentive performance can offset cost pressures = Implies US GAAP $150m annual oper
Slide 76: Summary
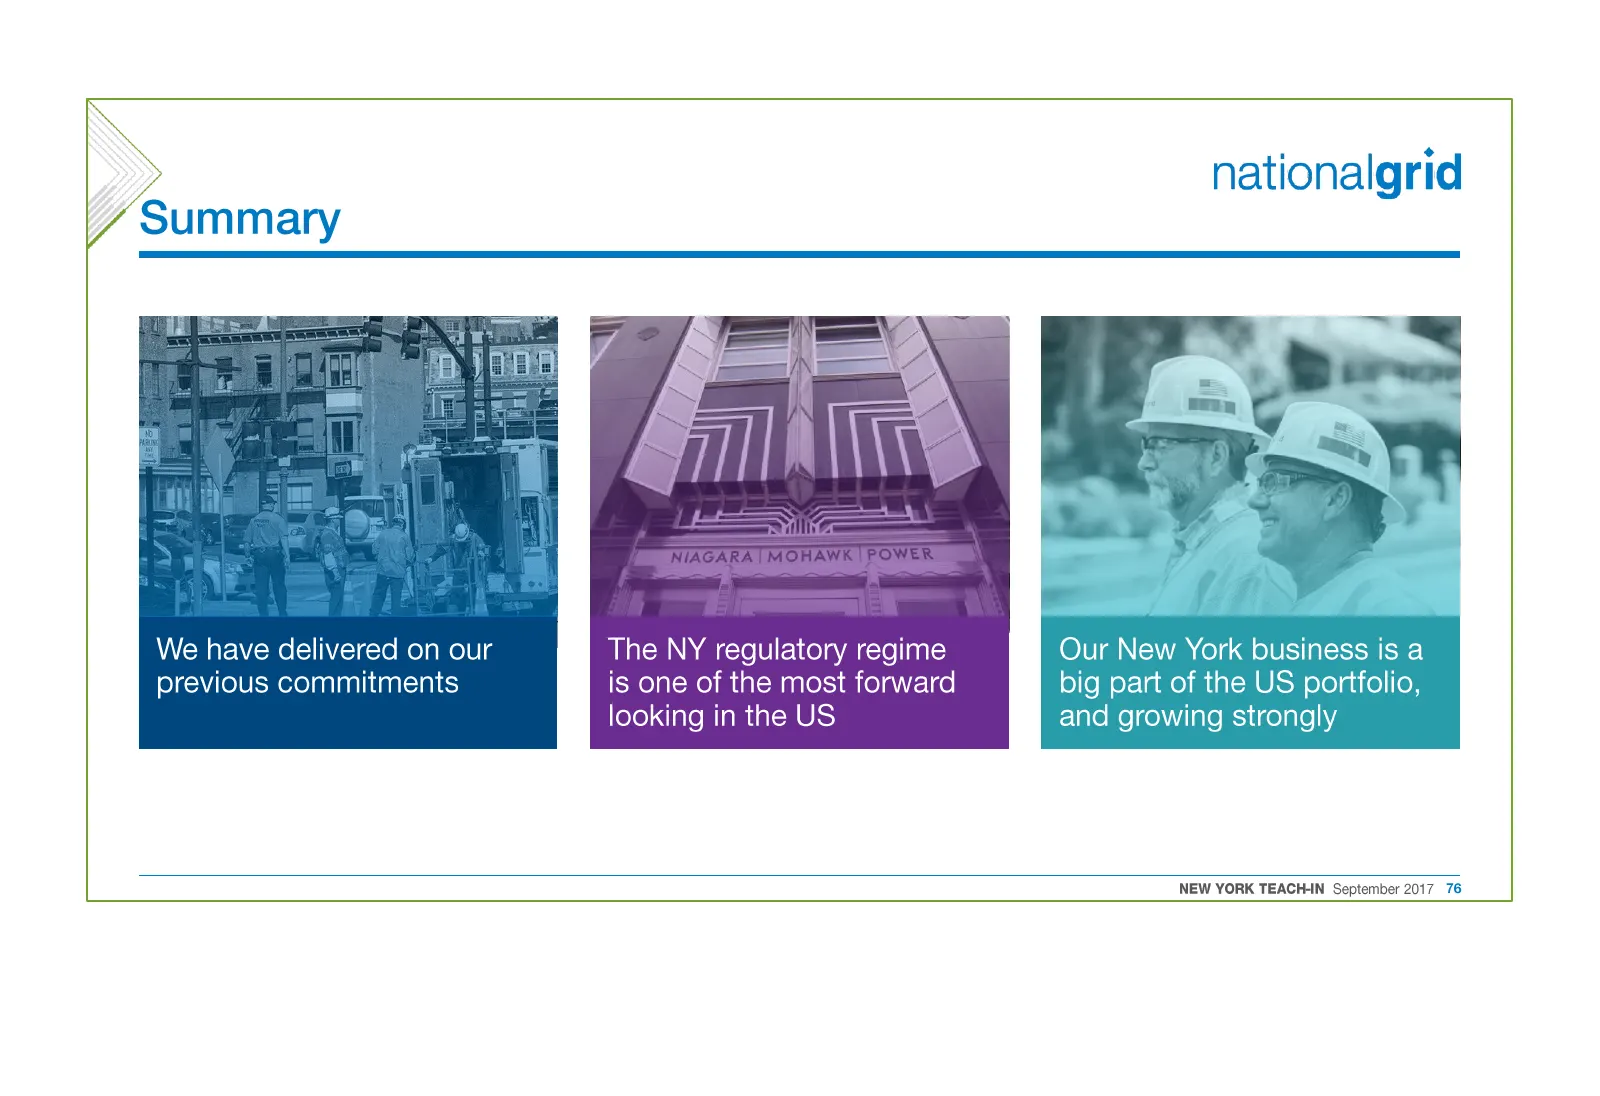
Summary We have delivered on our previous commitments The NY regulatory regime is one of the most forward looking in the US nationalgrid Our New York business is a big part of the US portfolio, and growing strongly NEW YORK TEACH-N September 2017 76

Slide 77: Deliberately left blank
Deliberately left blank NEW YORI TEACH-IN K Vi;

Slide 78: Deliberately left blank
Deliberately left blank
Slide 79: Summary
nationalgrid SUMMARY JOHN PETTIGREW CHIEF EXECUTIVE NEW YORK TEACH-IN
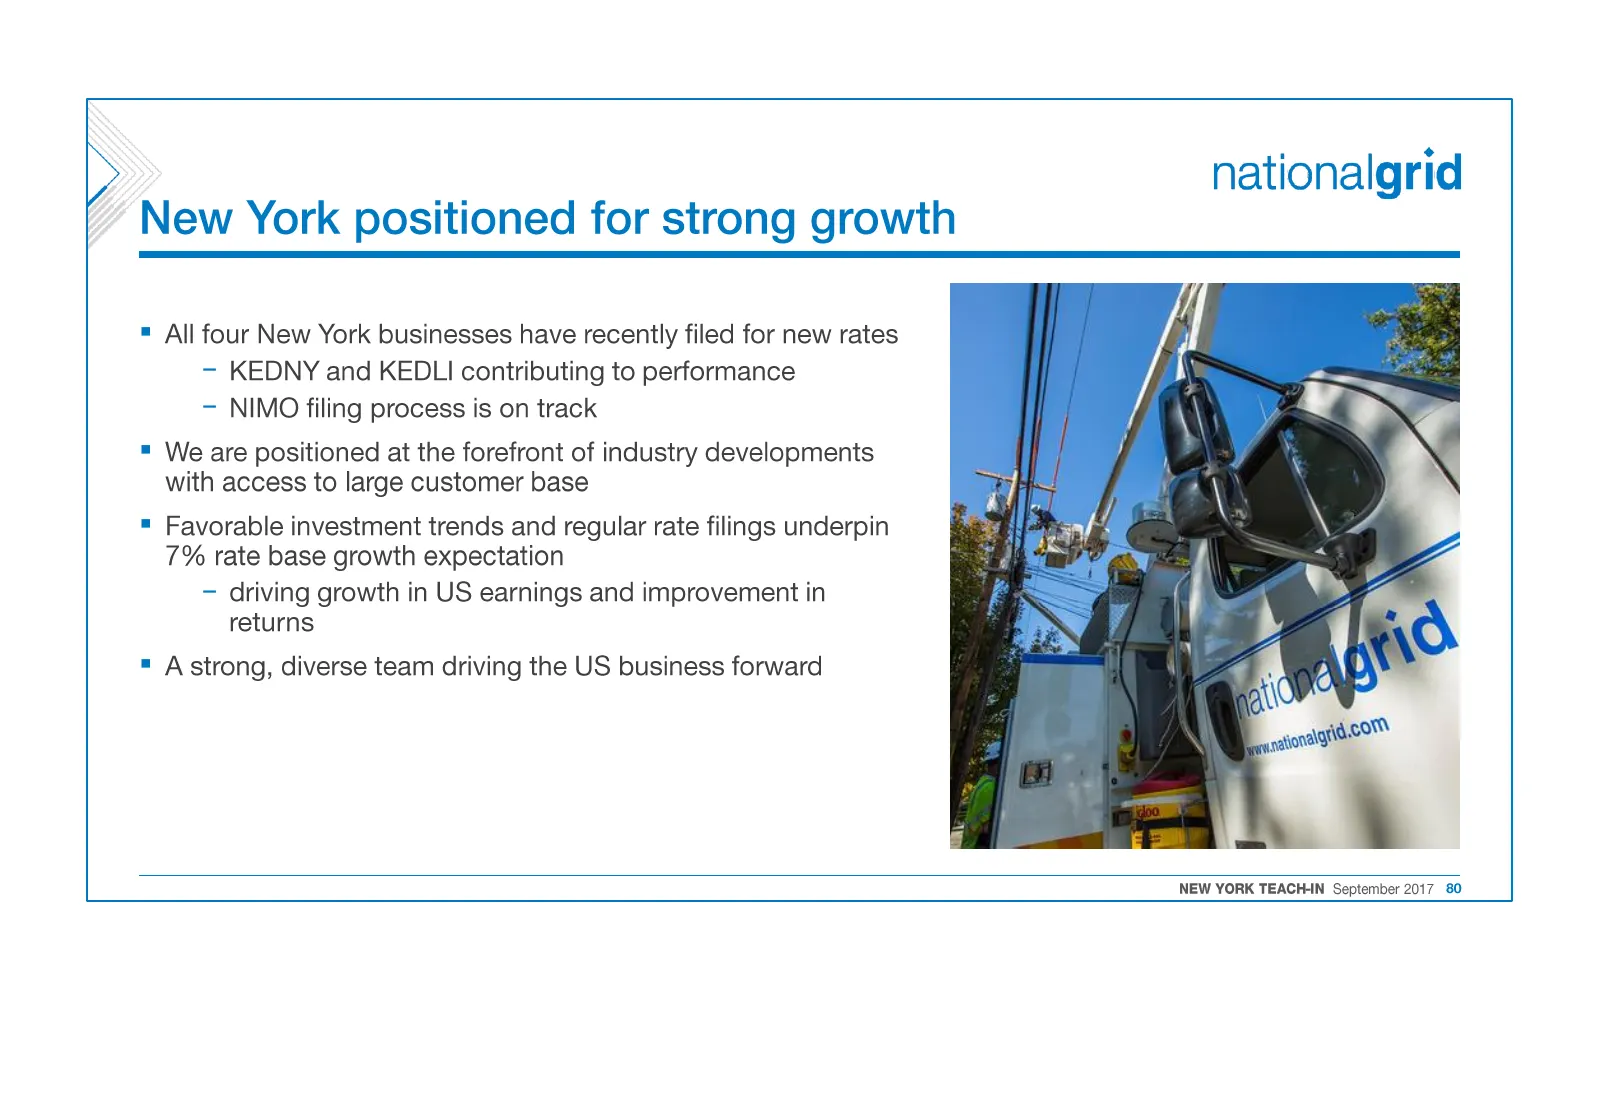
Slide 80: New York positioned for strong growth
nationalgrid New York positioned for strong growth All four New York businesses have recently filed for new rates - KEDNY and KEDLI contributing to performance — NIMO filing process is on track = We are positioned at the forefront of industry developments with access to large customer base = Favorab
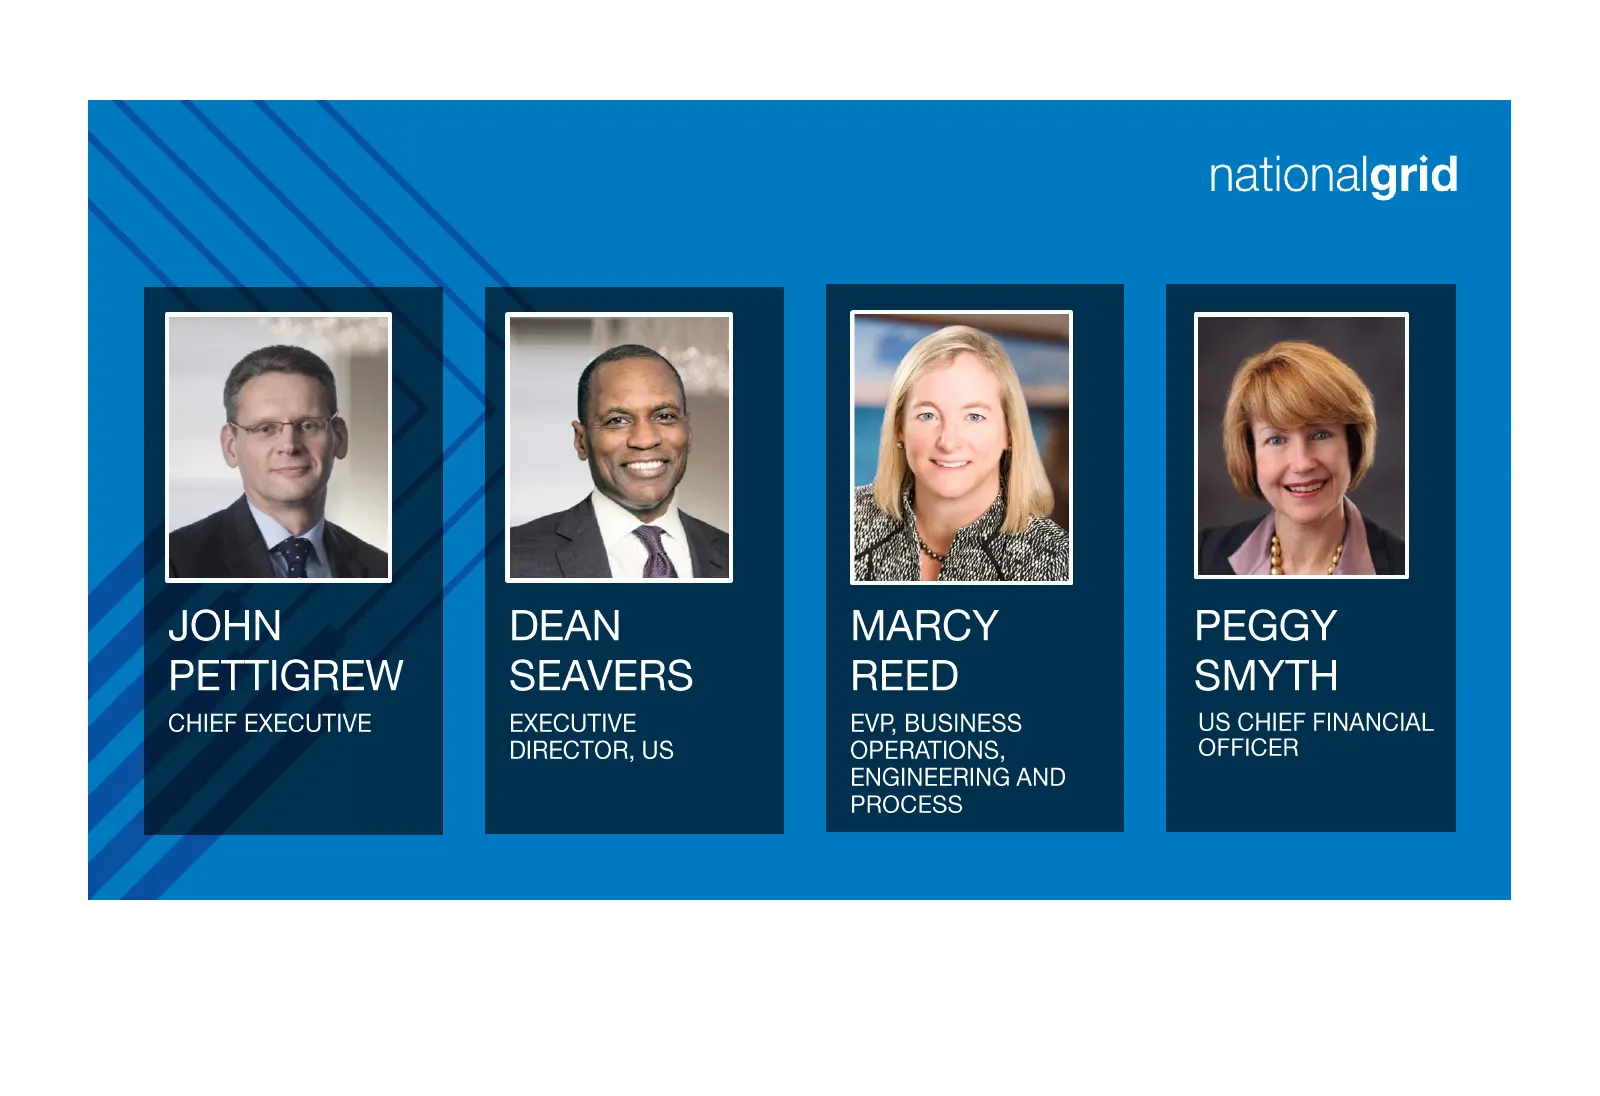
Slide 81: Management team
Slide 82: Investor Relations team
Slide 83: Appendix
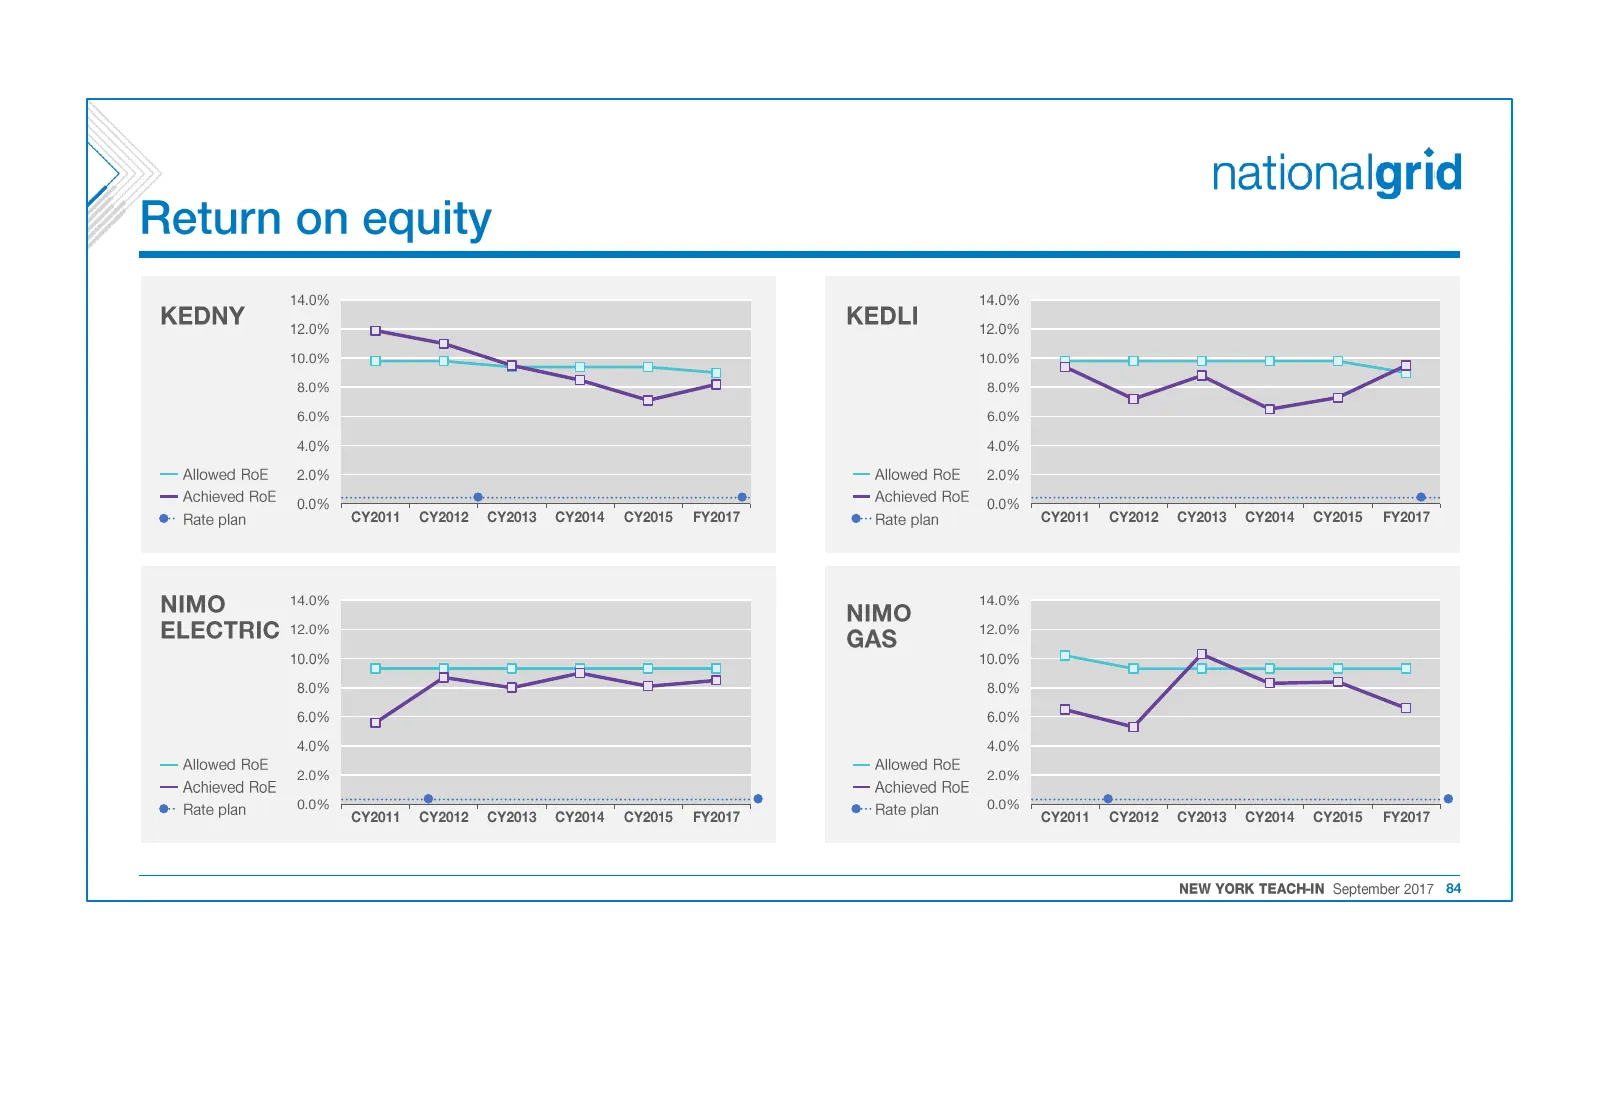
Slide 84: Return on equity
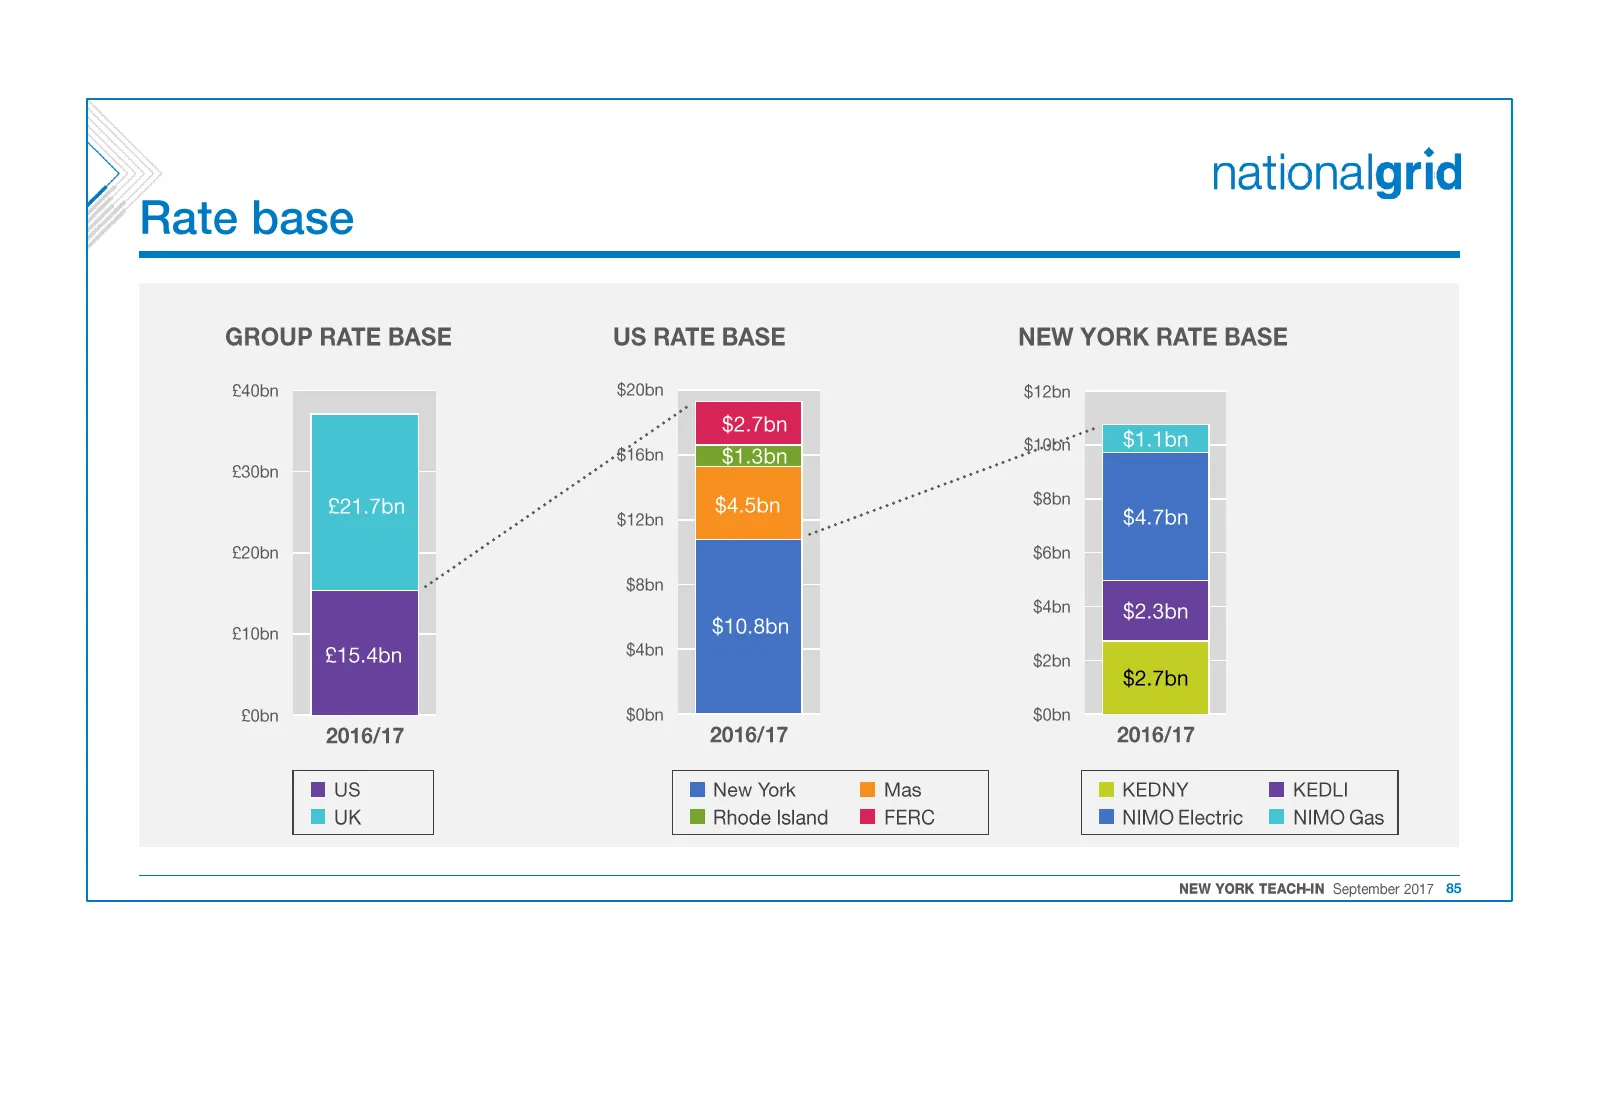
Slide 85: Rate base
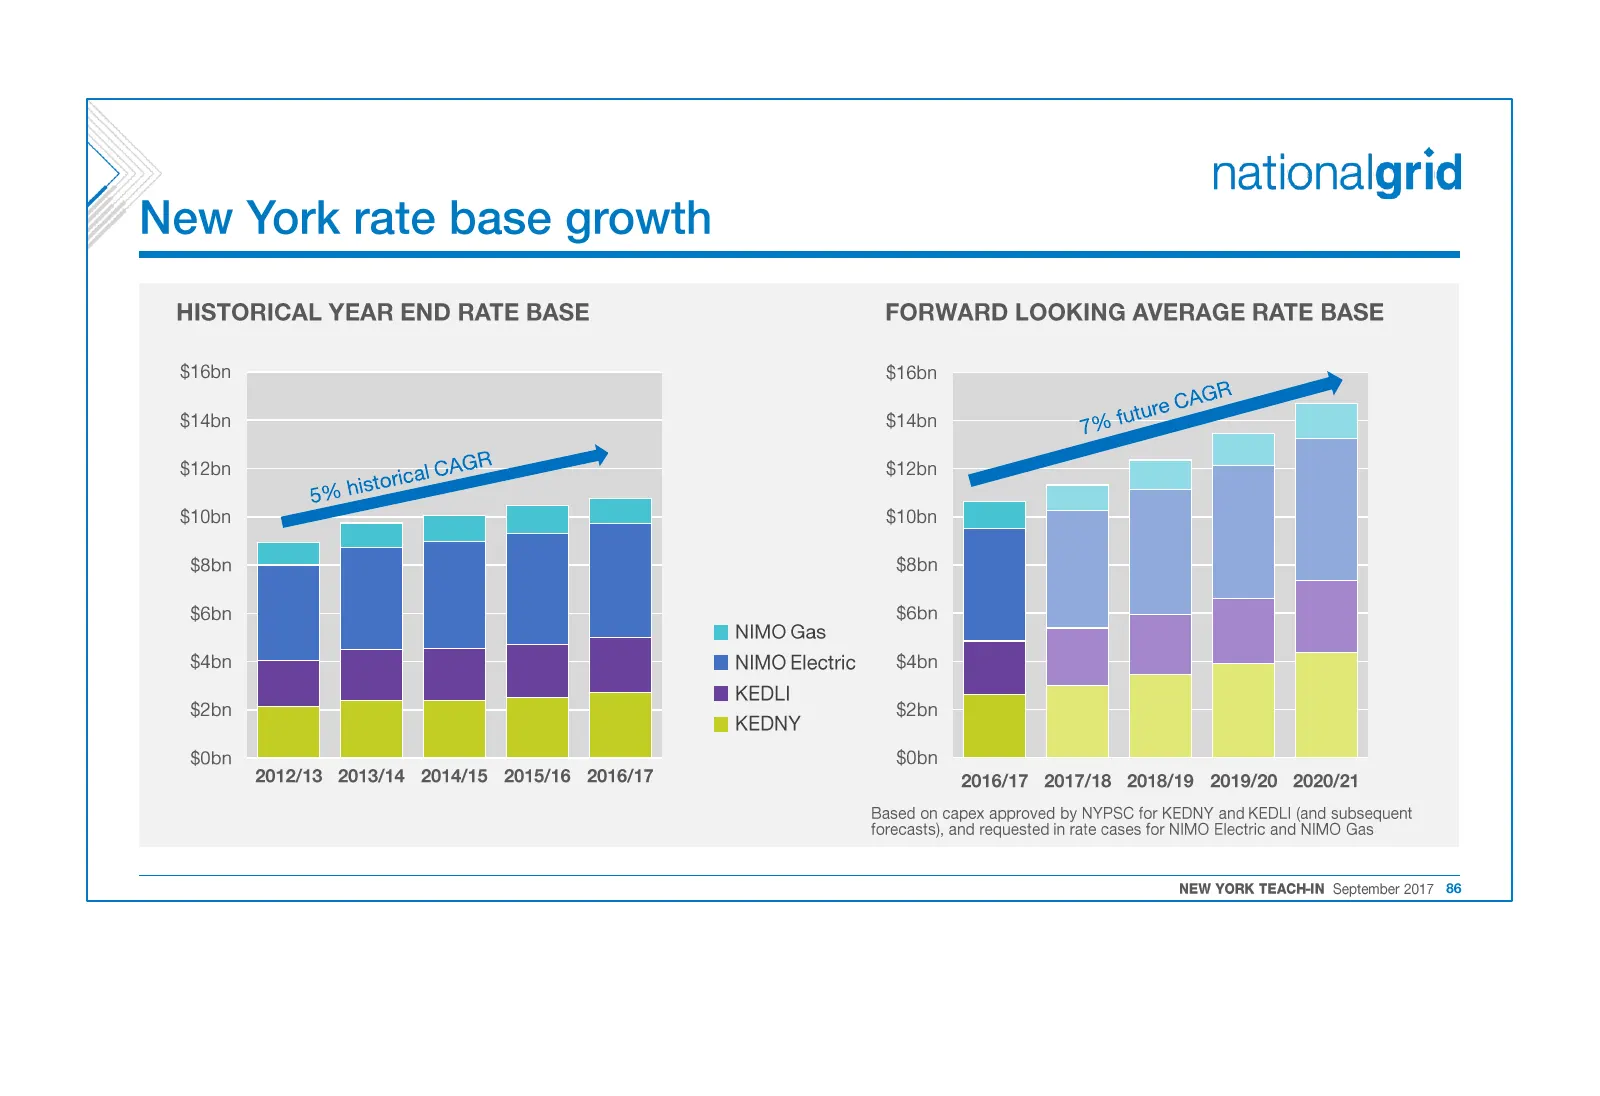
Slide 86: New York rate base growth
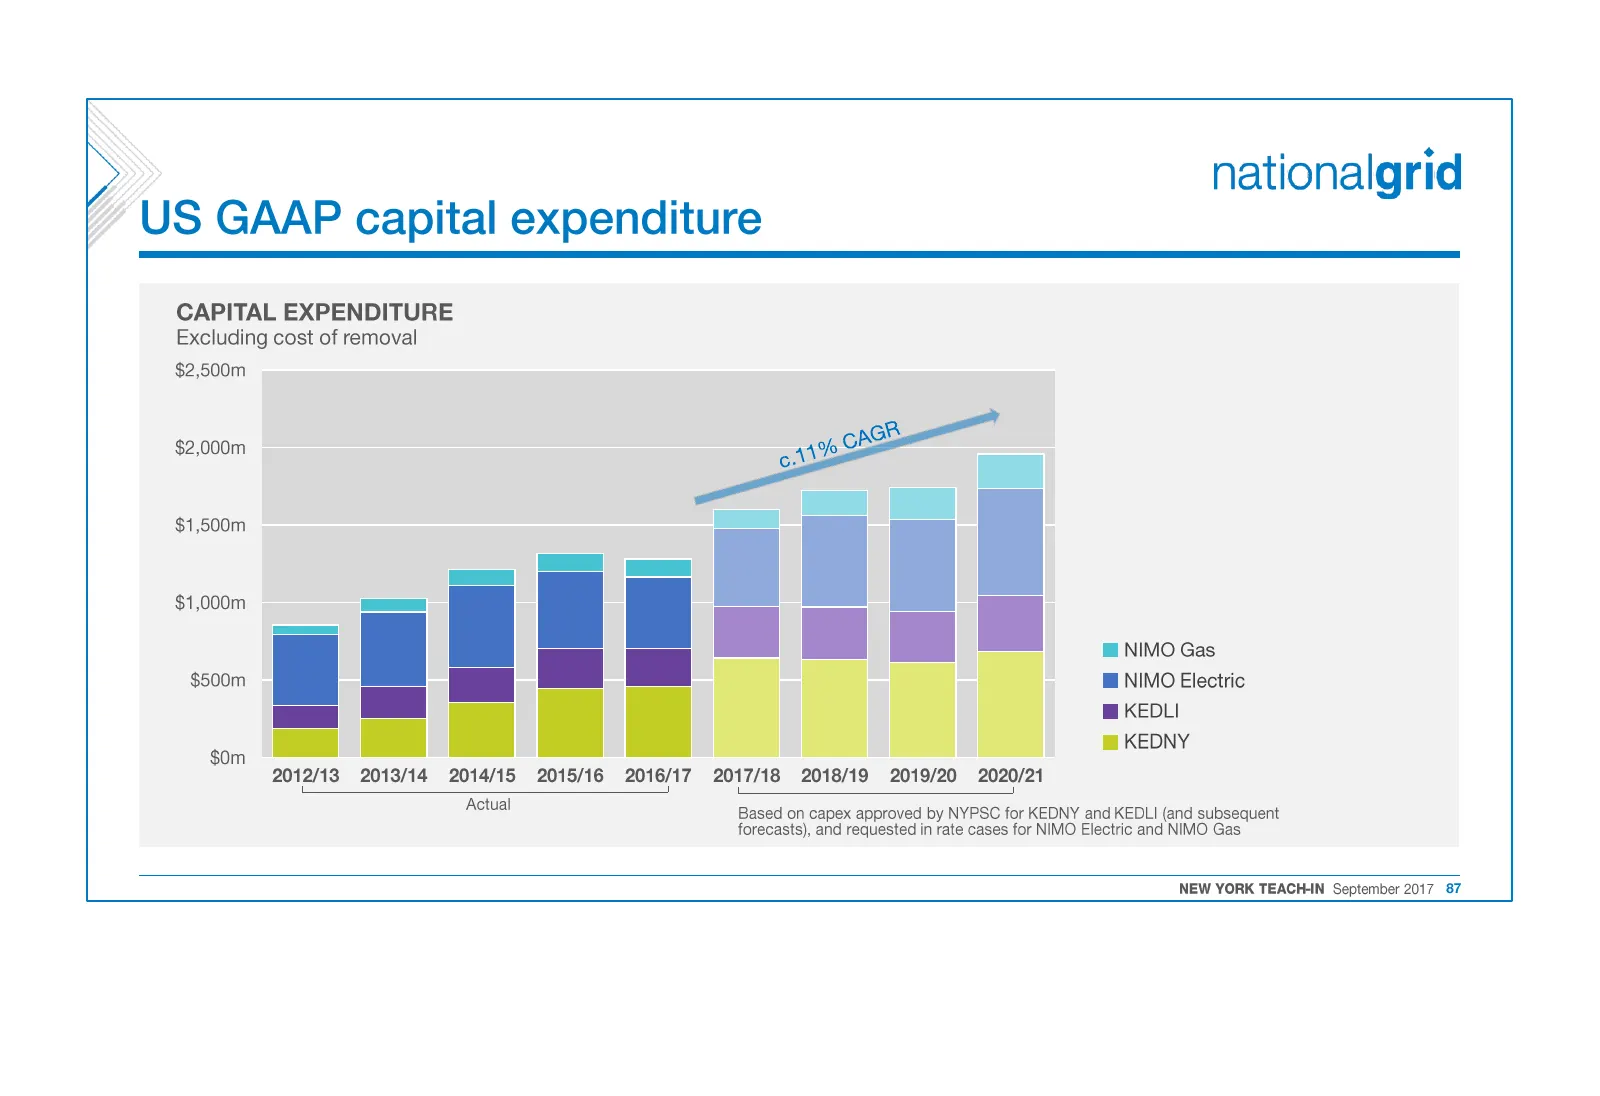
Slide 87: US GAAP capital expenditure
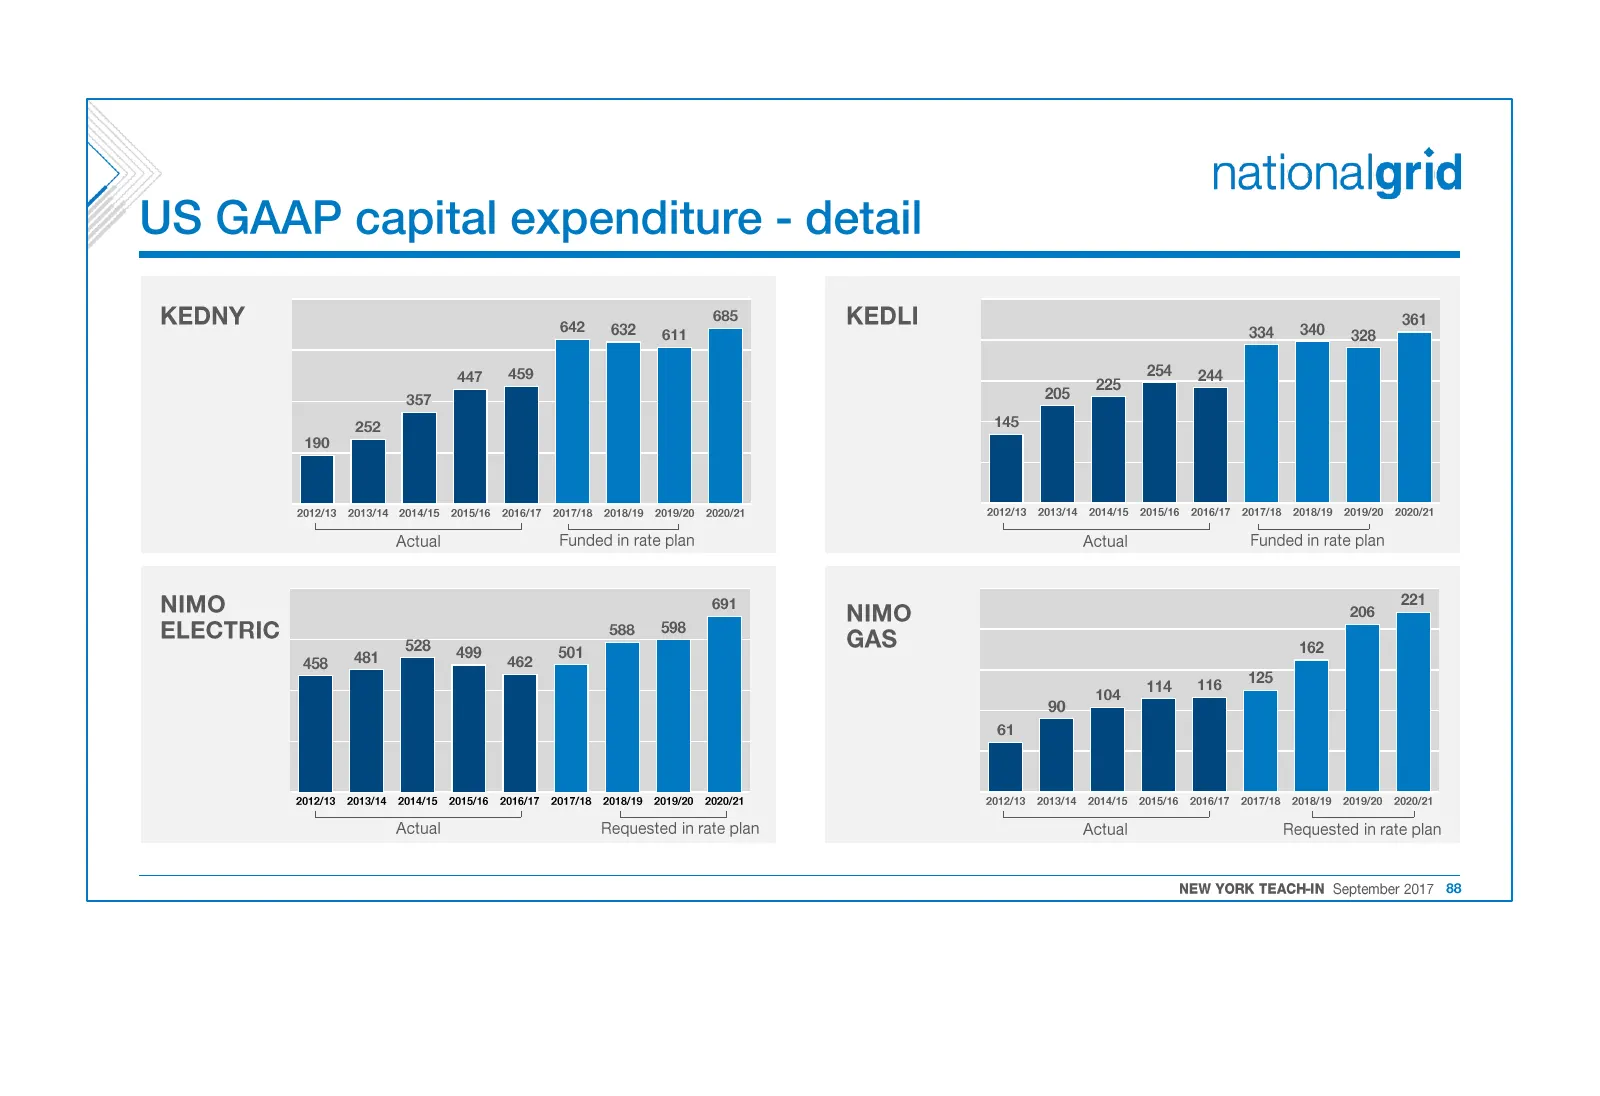
Slide 88: US GAAP capital expenditure - detail
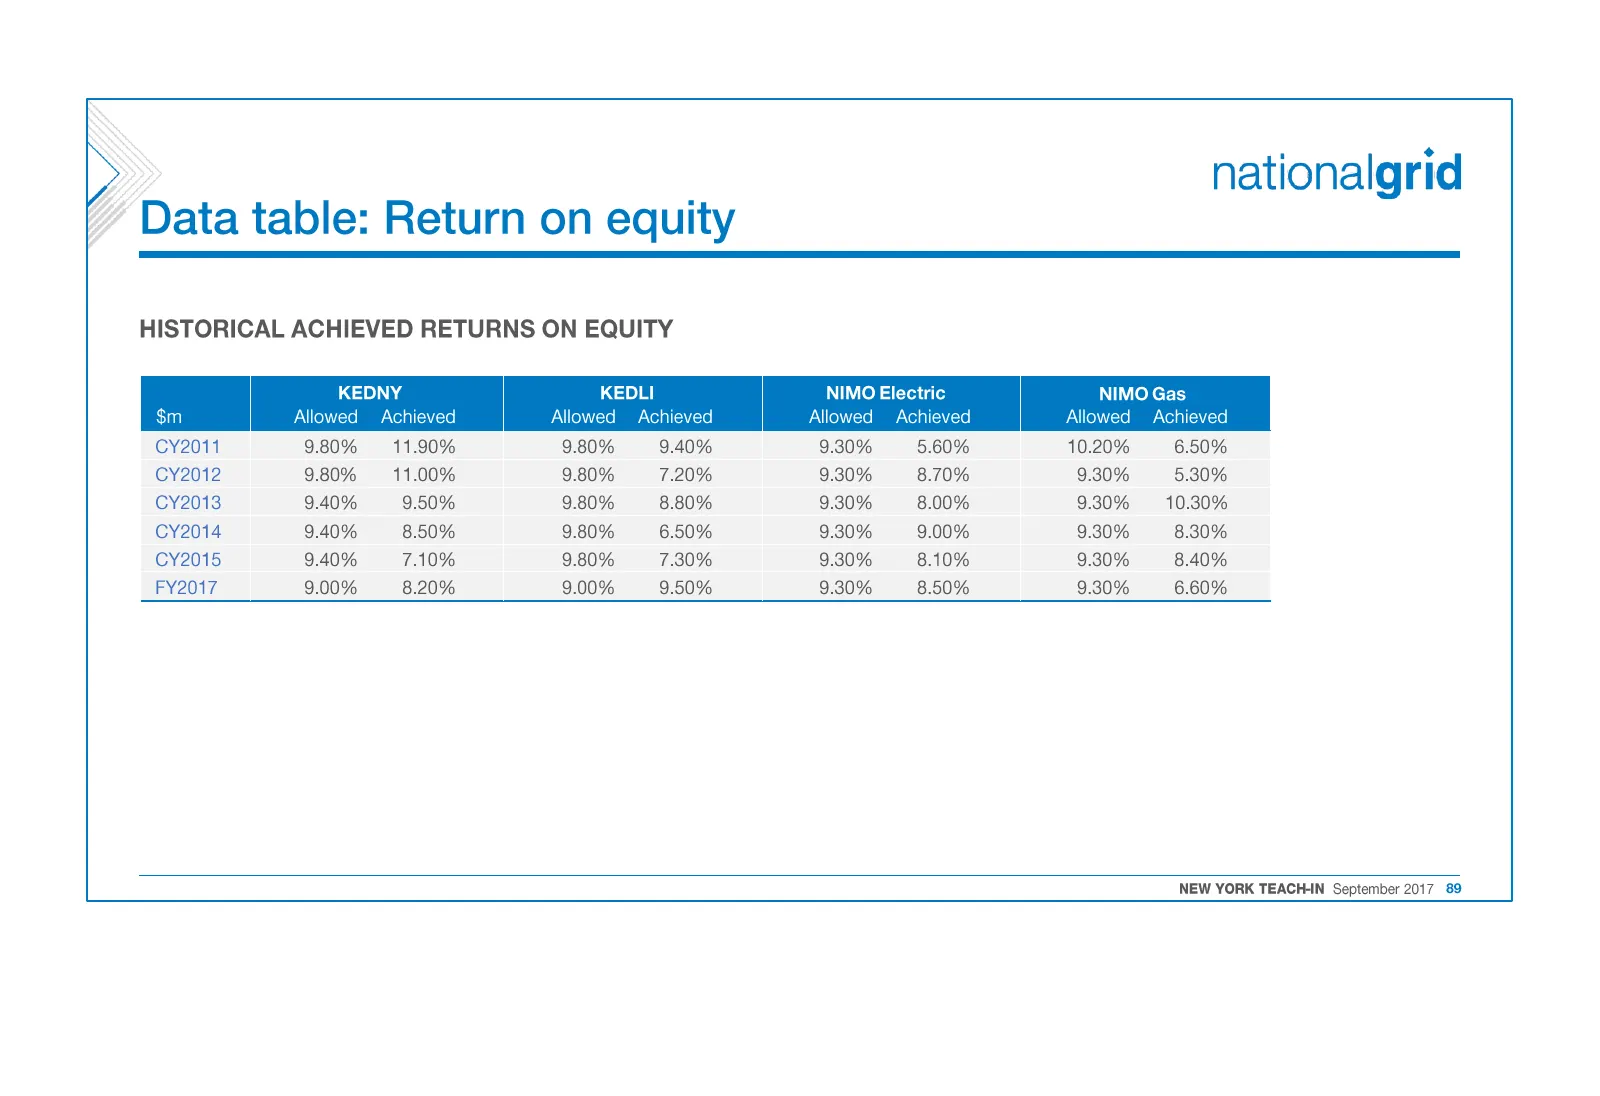
Slide 89: Data table: Return on equity
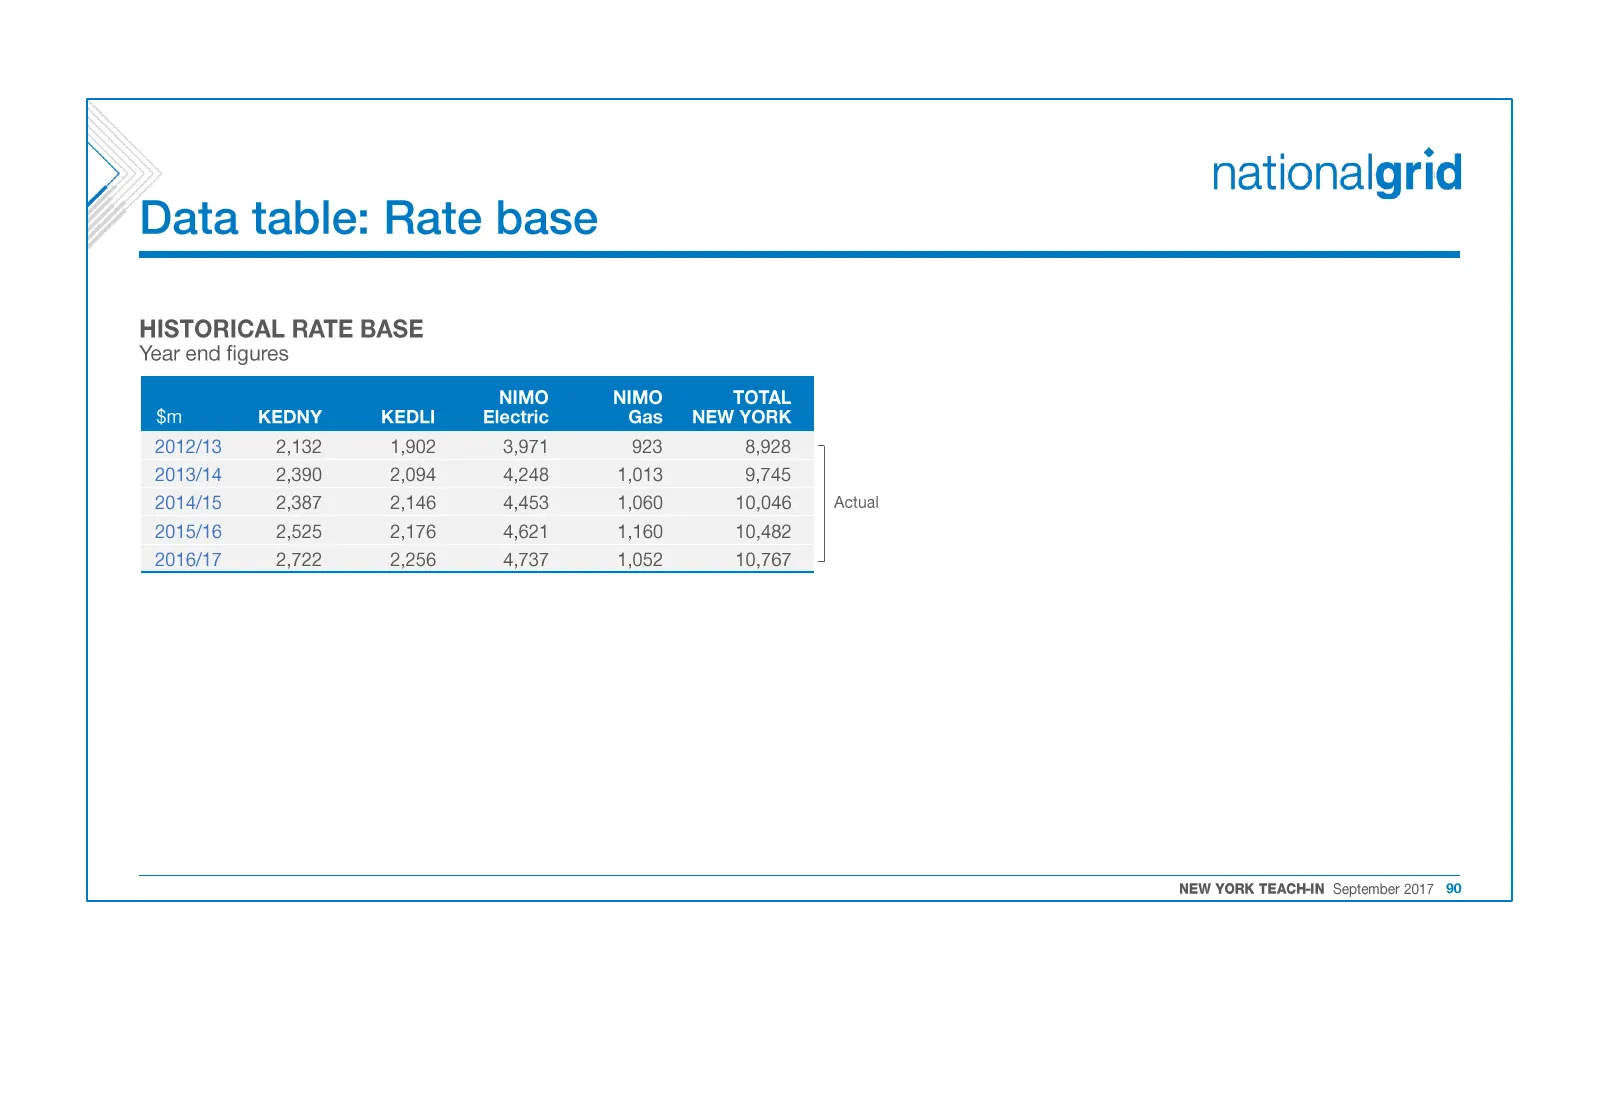
Slide 90: Data table: Rate base
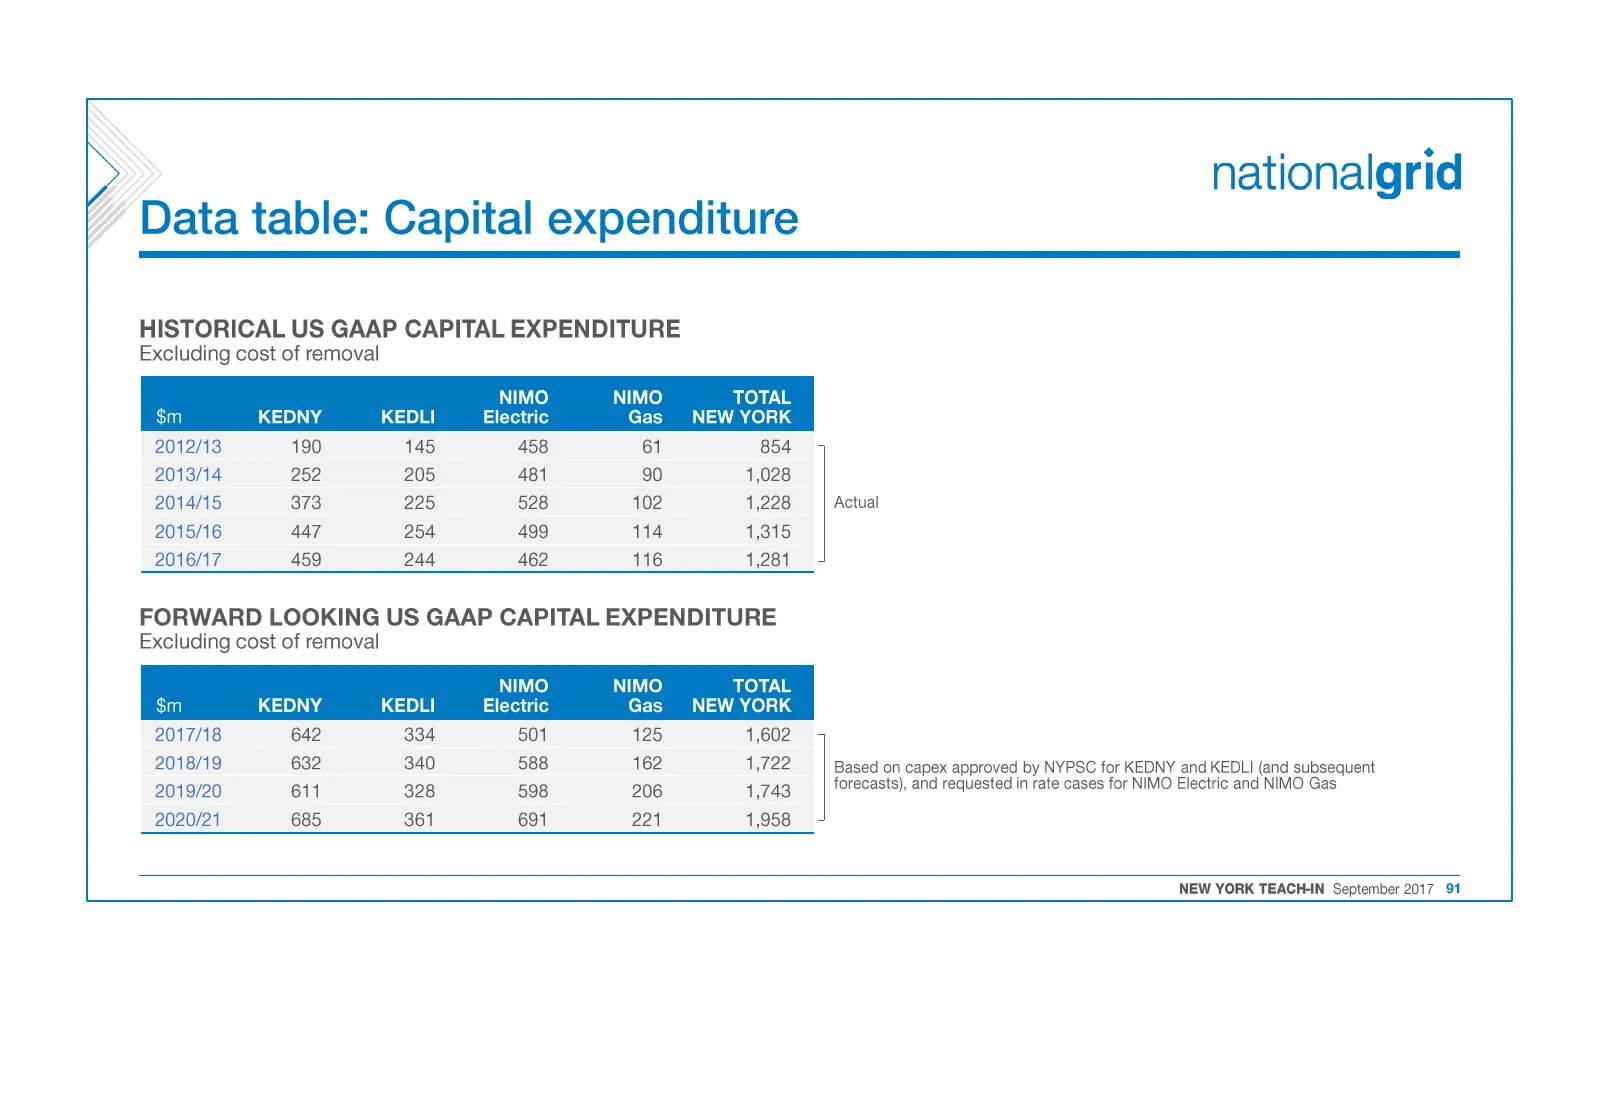
Slide 91: Data table: Capital expenditure
Source: Internet Archive copy of investors.nationalgrid.com
More decks from National Grid plc
 H1 2026/27 Earnings Presentation35 slides · Nov 5, 2026
 FY2026 Earnings Presentation52 slides · May 14, 2026
 Debt Investor Presentation (November 2025)21 slides · Nov 6, 2025
 Q2 2026 Earnings Presentation34 slides · Nov 6, 2025
 Technical Presentation (August 2025)20 slides · Aug 8, 2025
 Debt Investor Presentation (May 2025)22 slides · May 16, 2025