Sonic Solutions — Investor Day (January 2011)
56 slides from Sonic Solutions's investor day presentation, Jan 7, 2011
Slide 1: Rovi 2011 Analyst Day
Filed by: Rovi Corporation pursuant to Rule 425 under the Securities Act of 1933, as amended, and deemed filed pursuant to Rule 14d-2 under the Securities Exchange Act of 1934, as amended Subject Company: Sonic Solutions Commission File No. 000-23190 Rovi 2011Analyst Day Copyright ® 2010 Rovi Corpor
Slide 2: Safe Harbor Statement
Safe Harbor Statement All statements contained herein, as well as oral statements that may be made by the Company or by officers, directors or employees of the Company acting on the Company’s behalf, that are not statements of historical fact, including but not limited to any description of the Comp
Slide 3: Additional Information
Additional Information Additional Information and Where to Find It The exchange offer for the outstanding common stock of Sonic Solutions has not yet commenced. This announcement is neither an offer to purchase nor a solicitation of an offer to sell shares of Sonic Solutions. Sonic Solutions shareho
Slide 4: Agenda
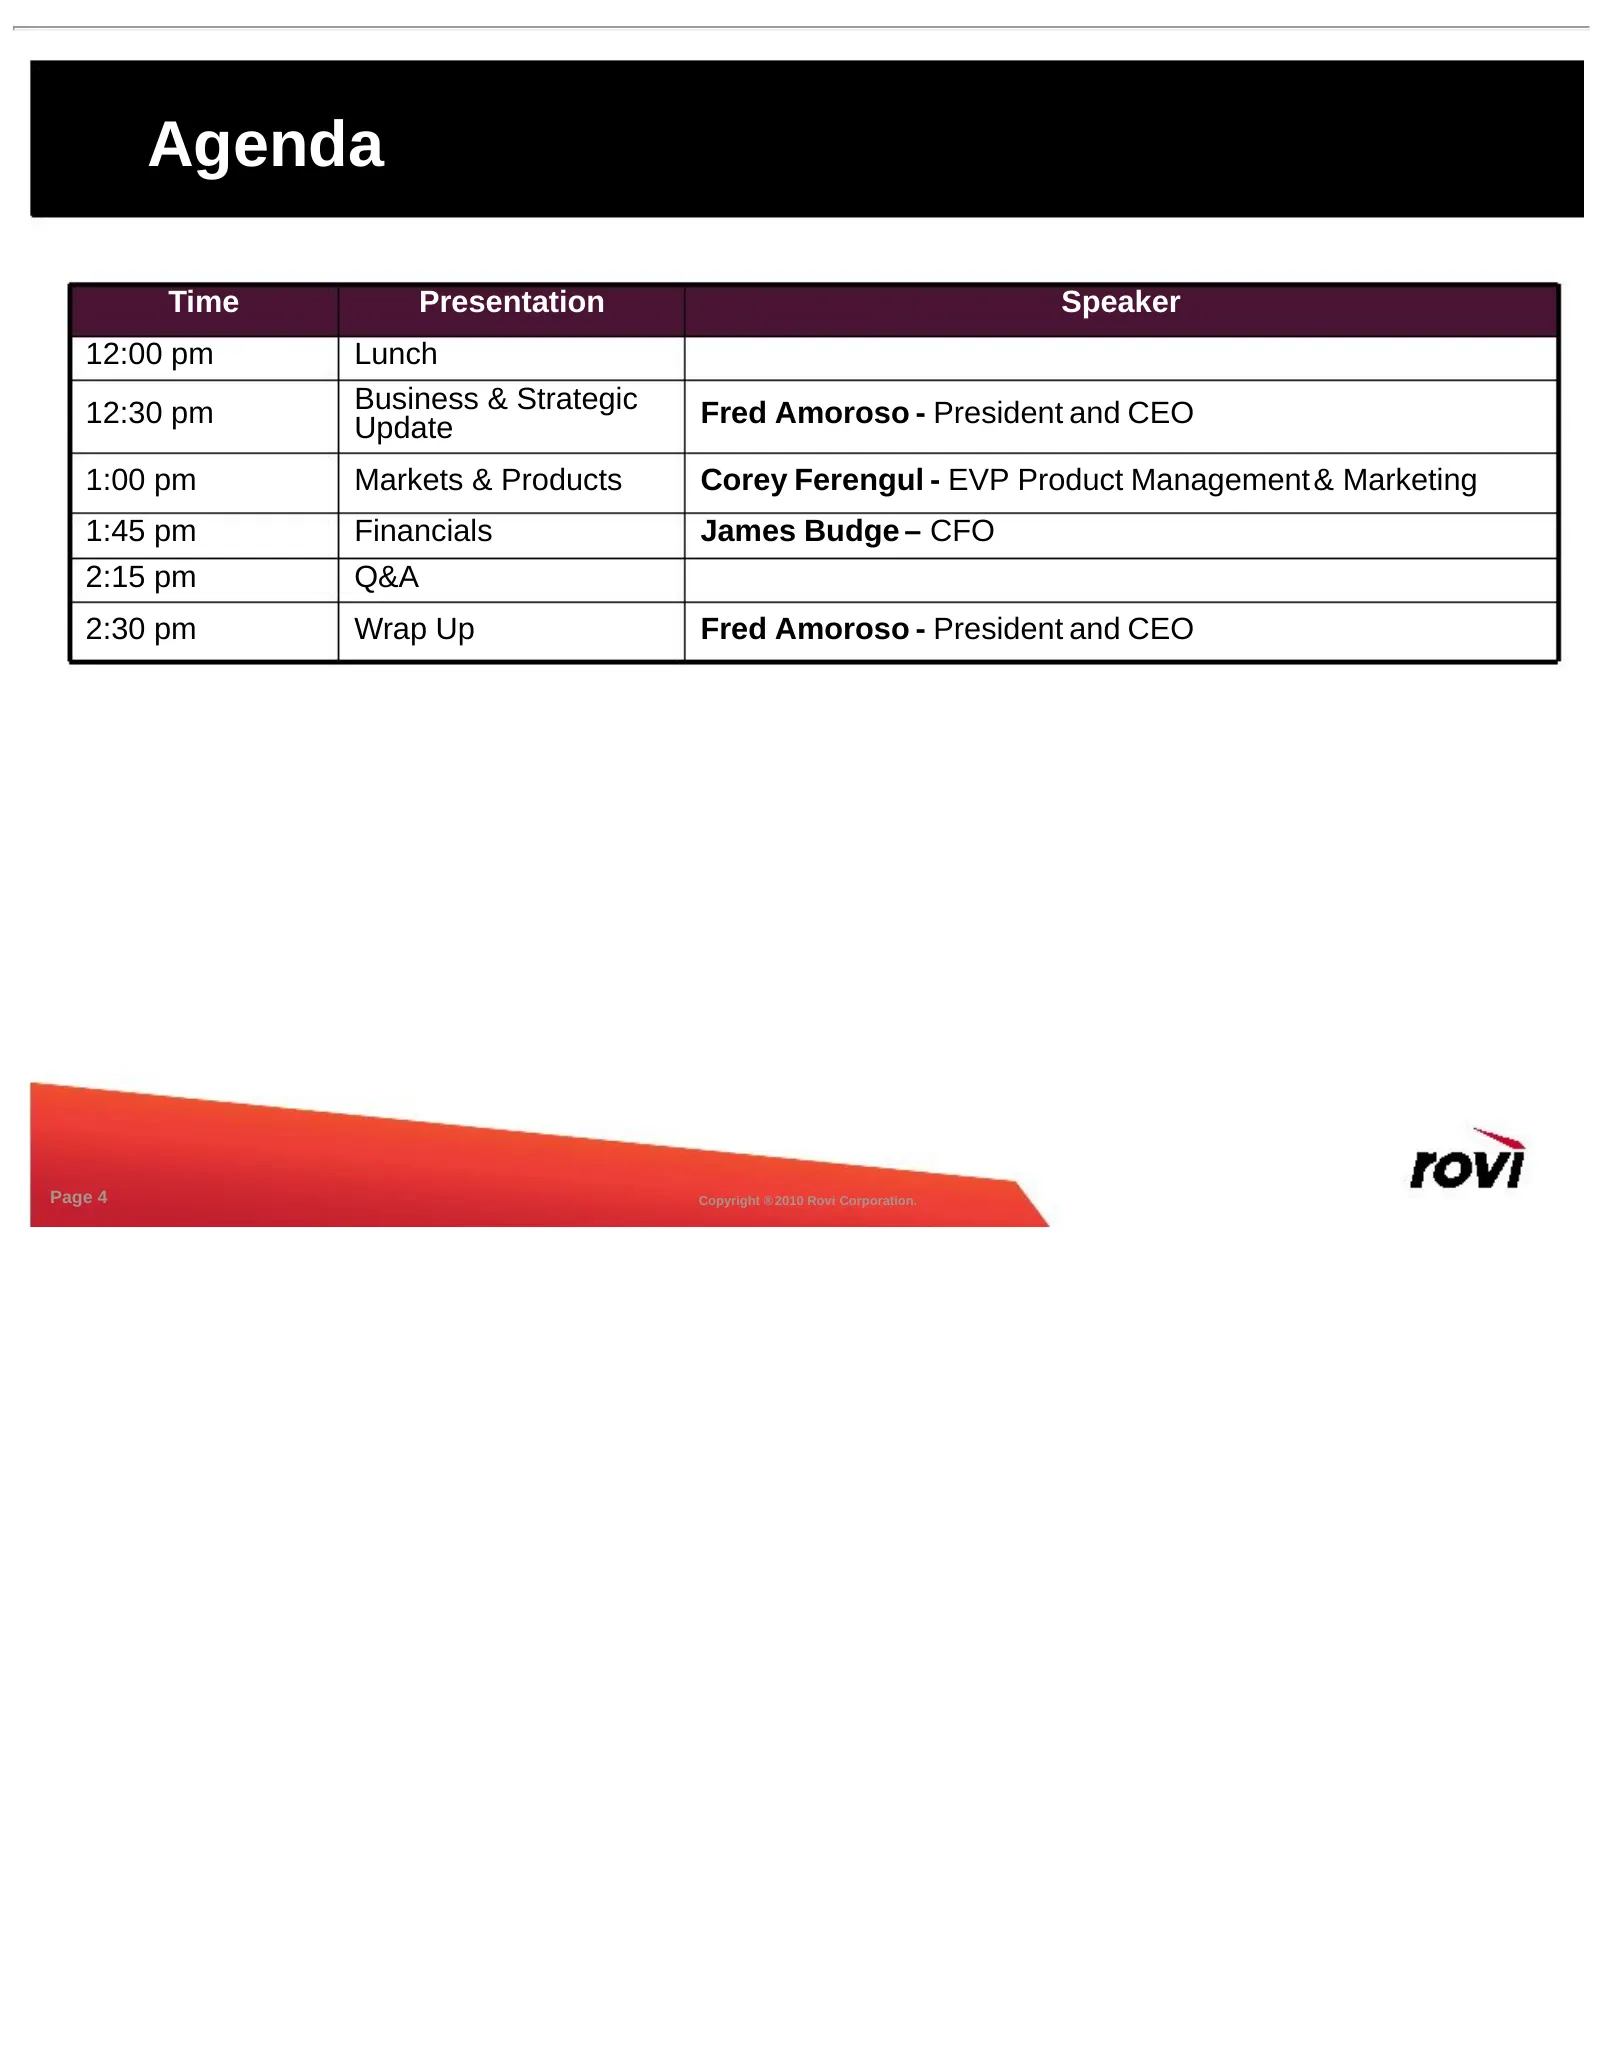
Agenda Time Presentation Speaker 12:00 pm Lunch 12:30 pm Business & Strategic Fred Amoroso - President and CEO Update 1:00 pm Markets & Products Corey Ferengul - EVP Product Management & Marketing 1:45 pm Financials James Budge – CFO 2:15 pm Q&A 2:30 pm Wrap Up Fred Amoroso - President and CEO Page
Slide 5: Our Transformation
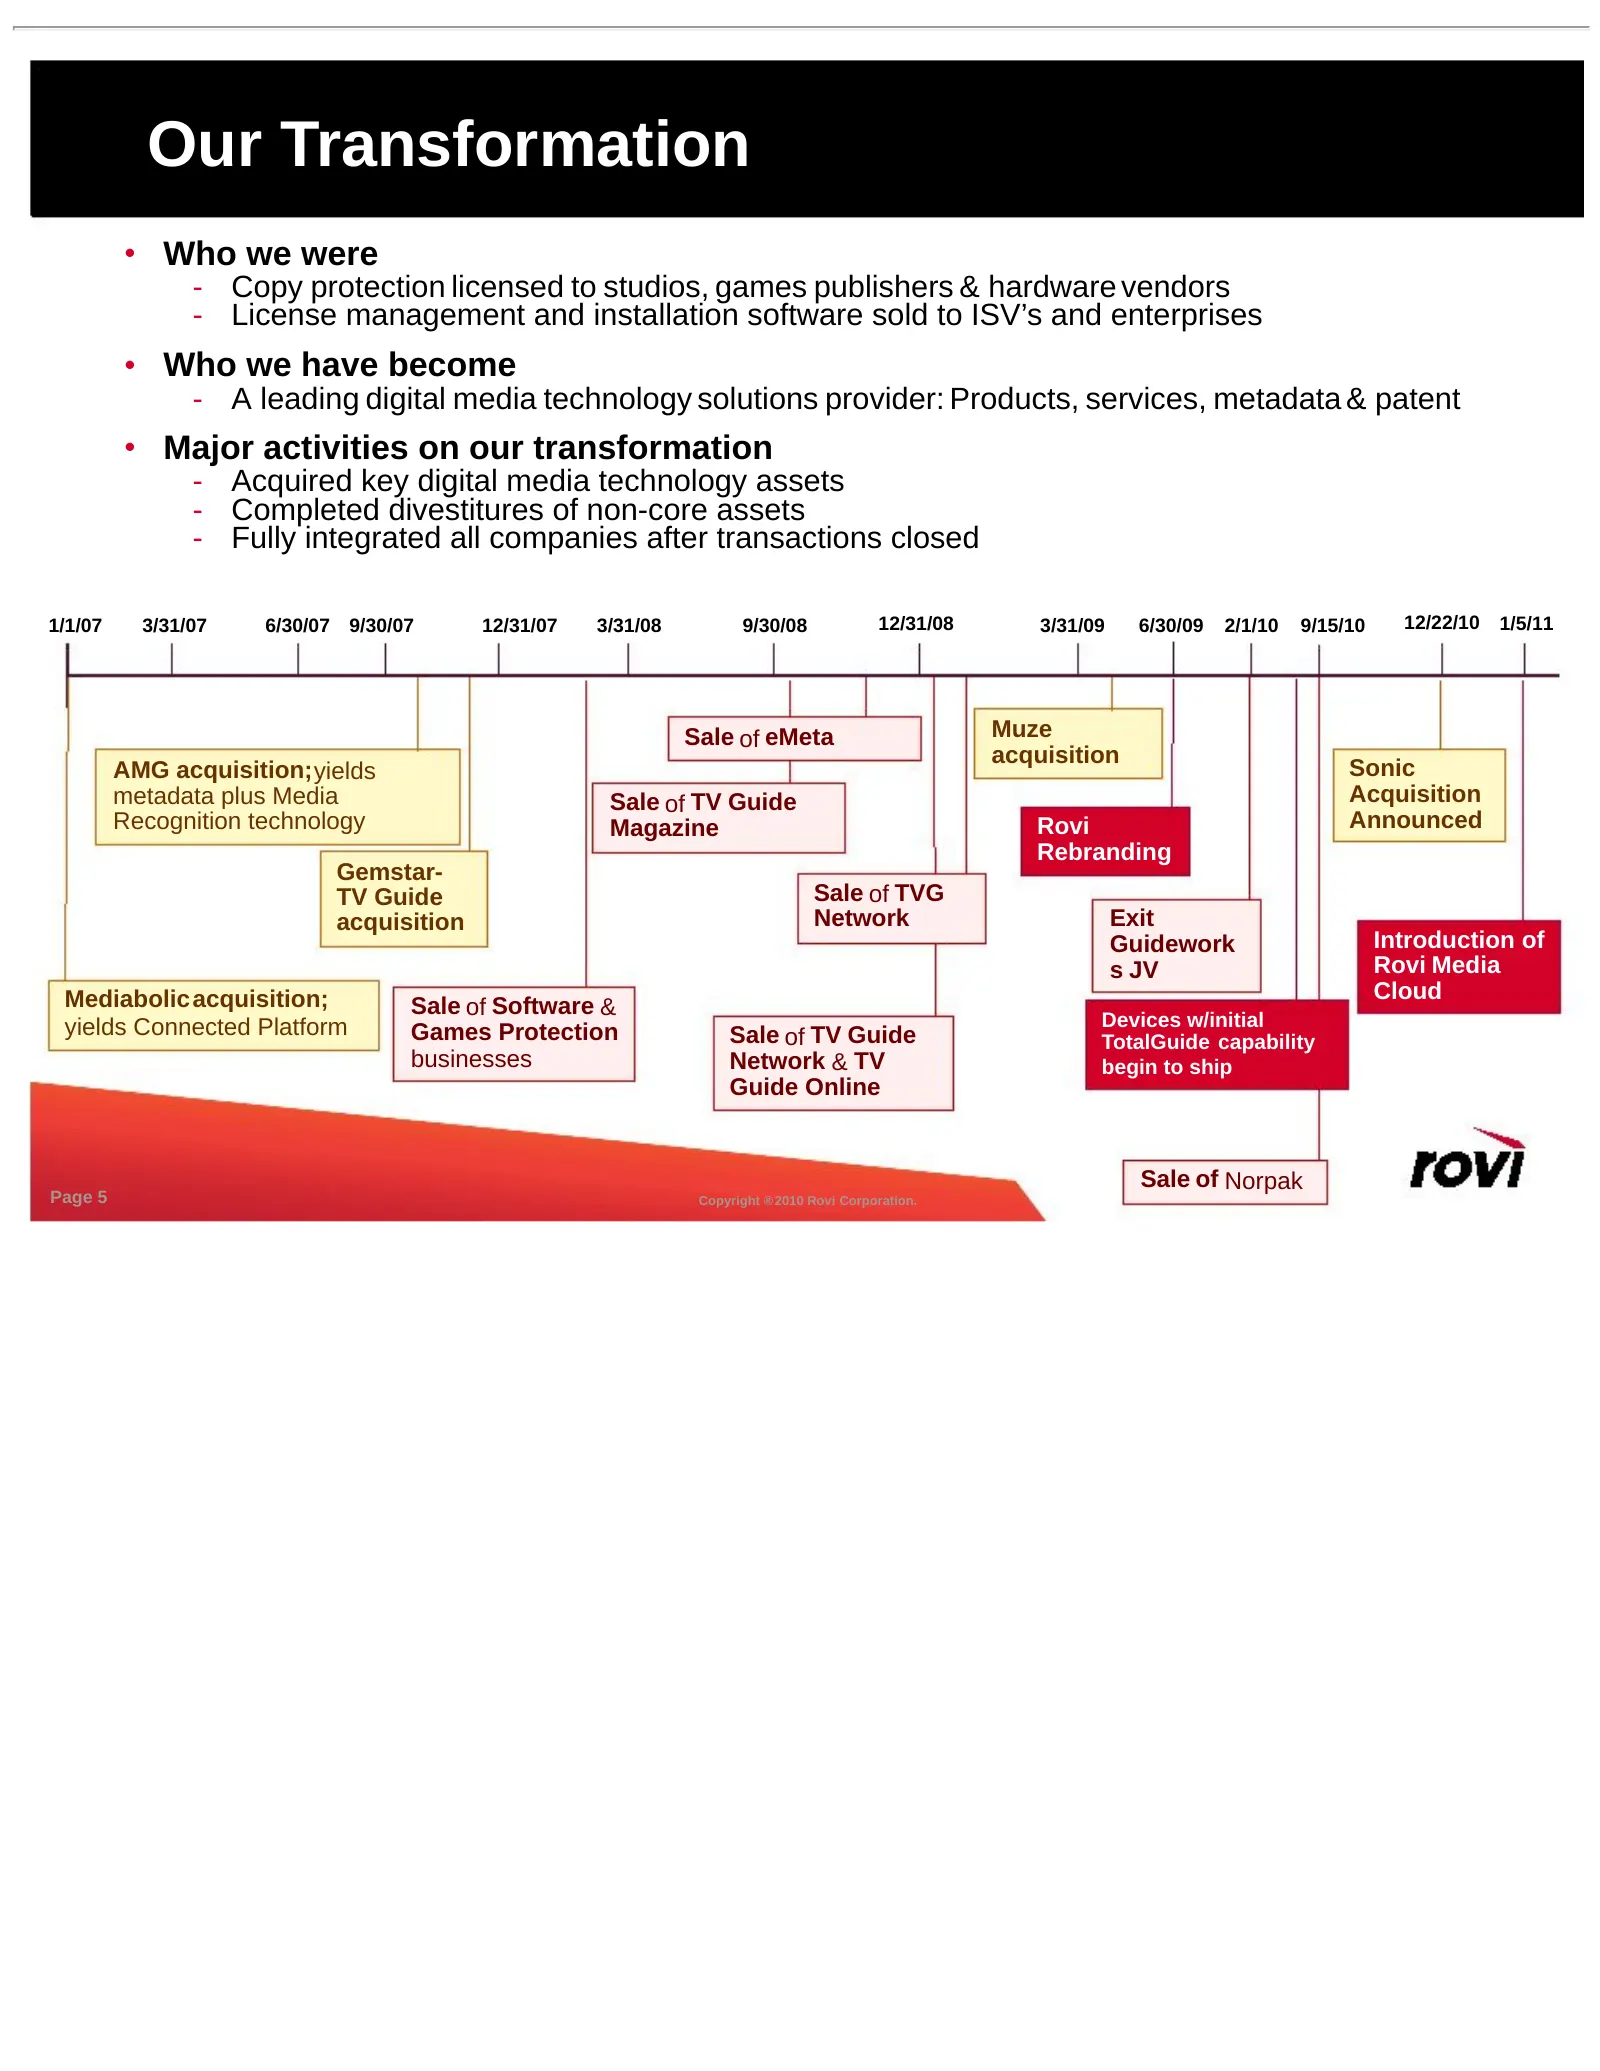
Our Transformation • Who we were - Copy protection licensed to studios, games publishers & hardware vendors - License management and installation software sold to ISV’s and enterprises • Who we have become - A leading digital media technology solutions provider: Products, services, metadata & patent
Slide 6: Rovi Products & Solutions
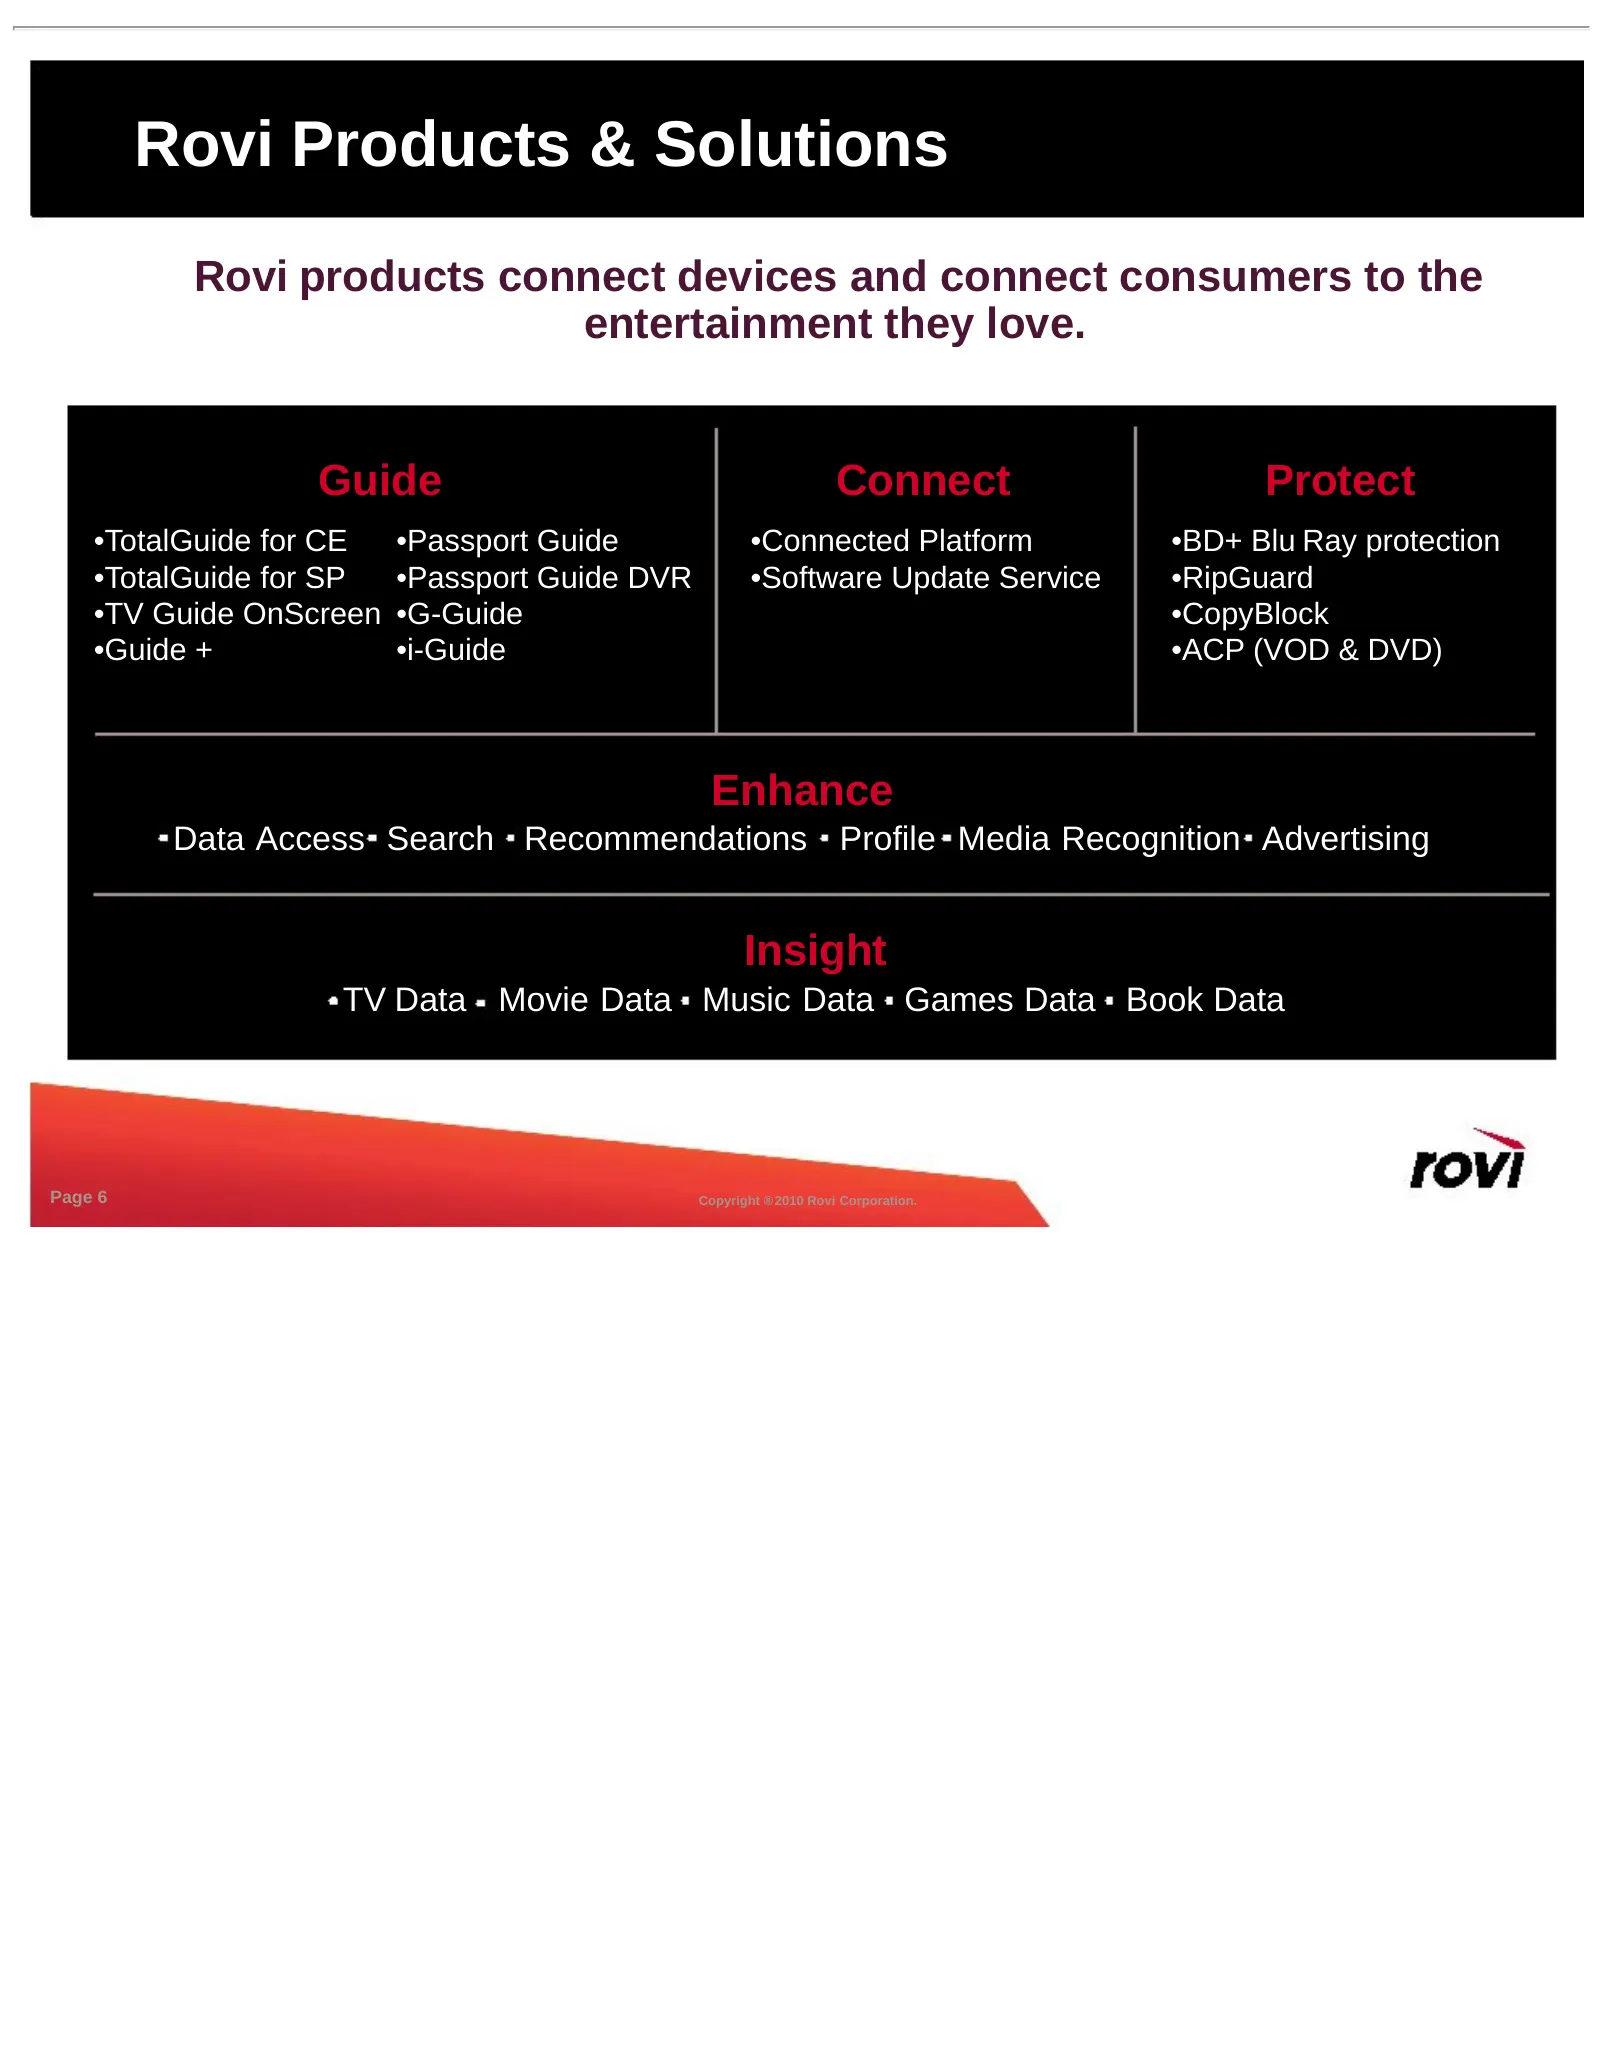
Rovi Products & Solutions Rovi products connect devices and connect consumers to the entertainment they love. Guide Connect Protect •TotalGuide for CE •Passport Guide •Connected Platform •BD+ Blu Ray protection •TotalGuide for SP •Passport Guide DVR •Software Update Service •RipGuard •TV Guide OnScr
Slide 7: Entertainment Metadata
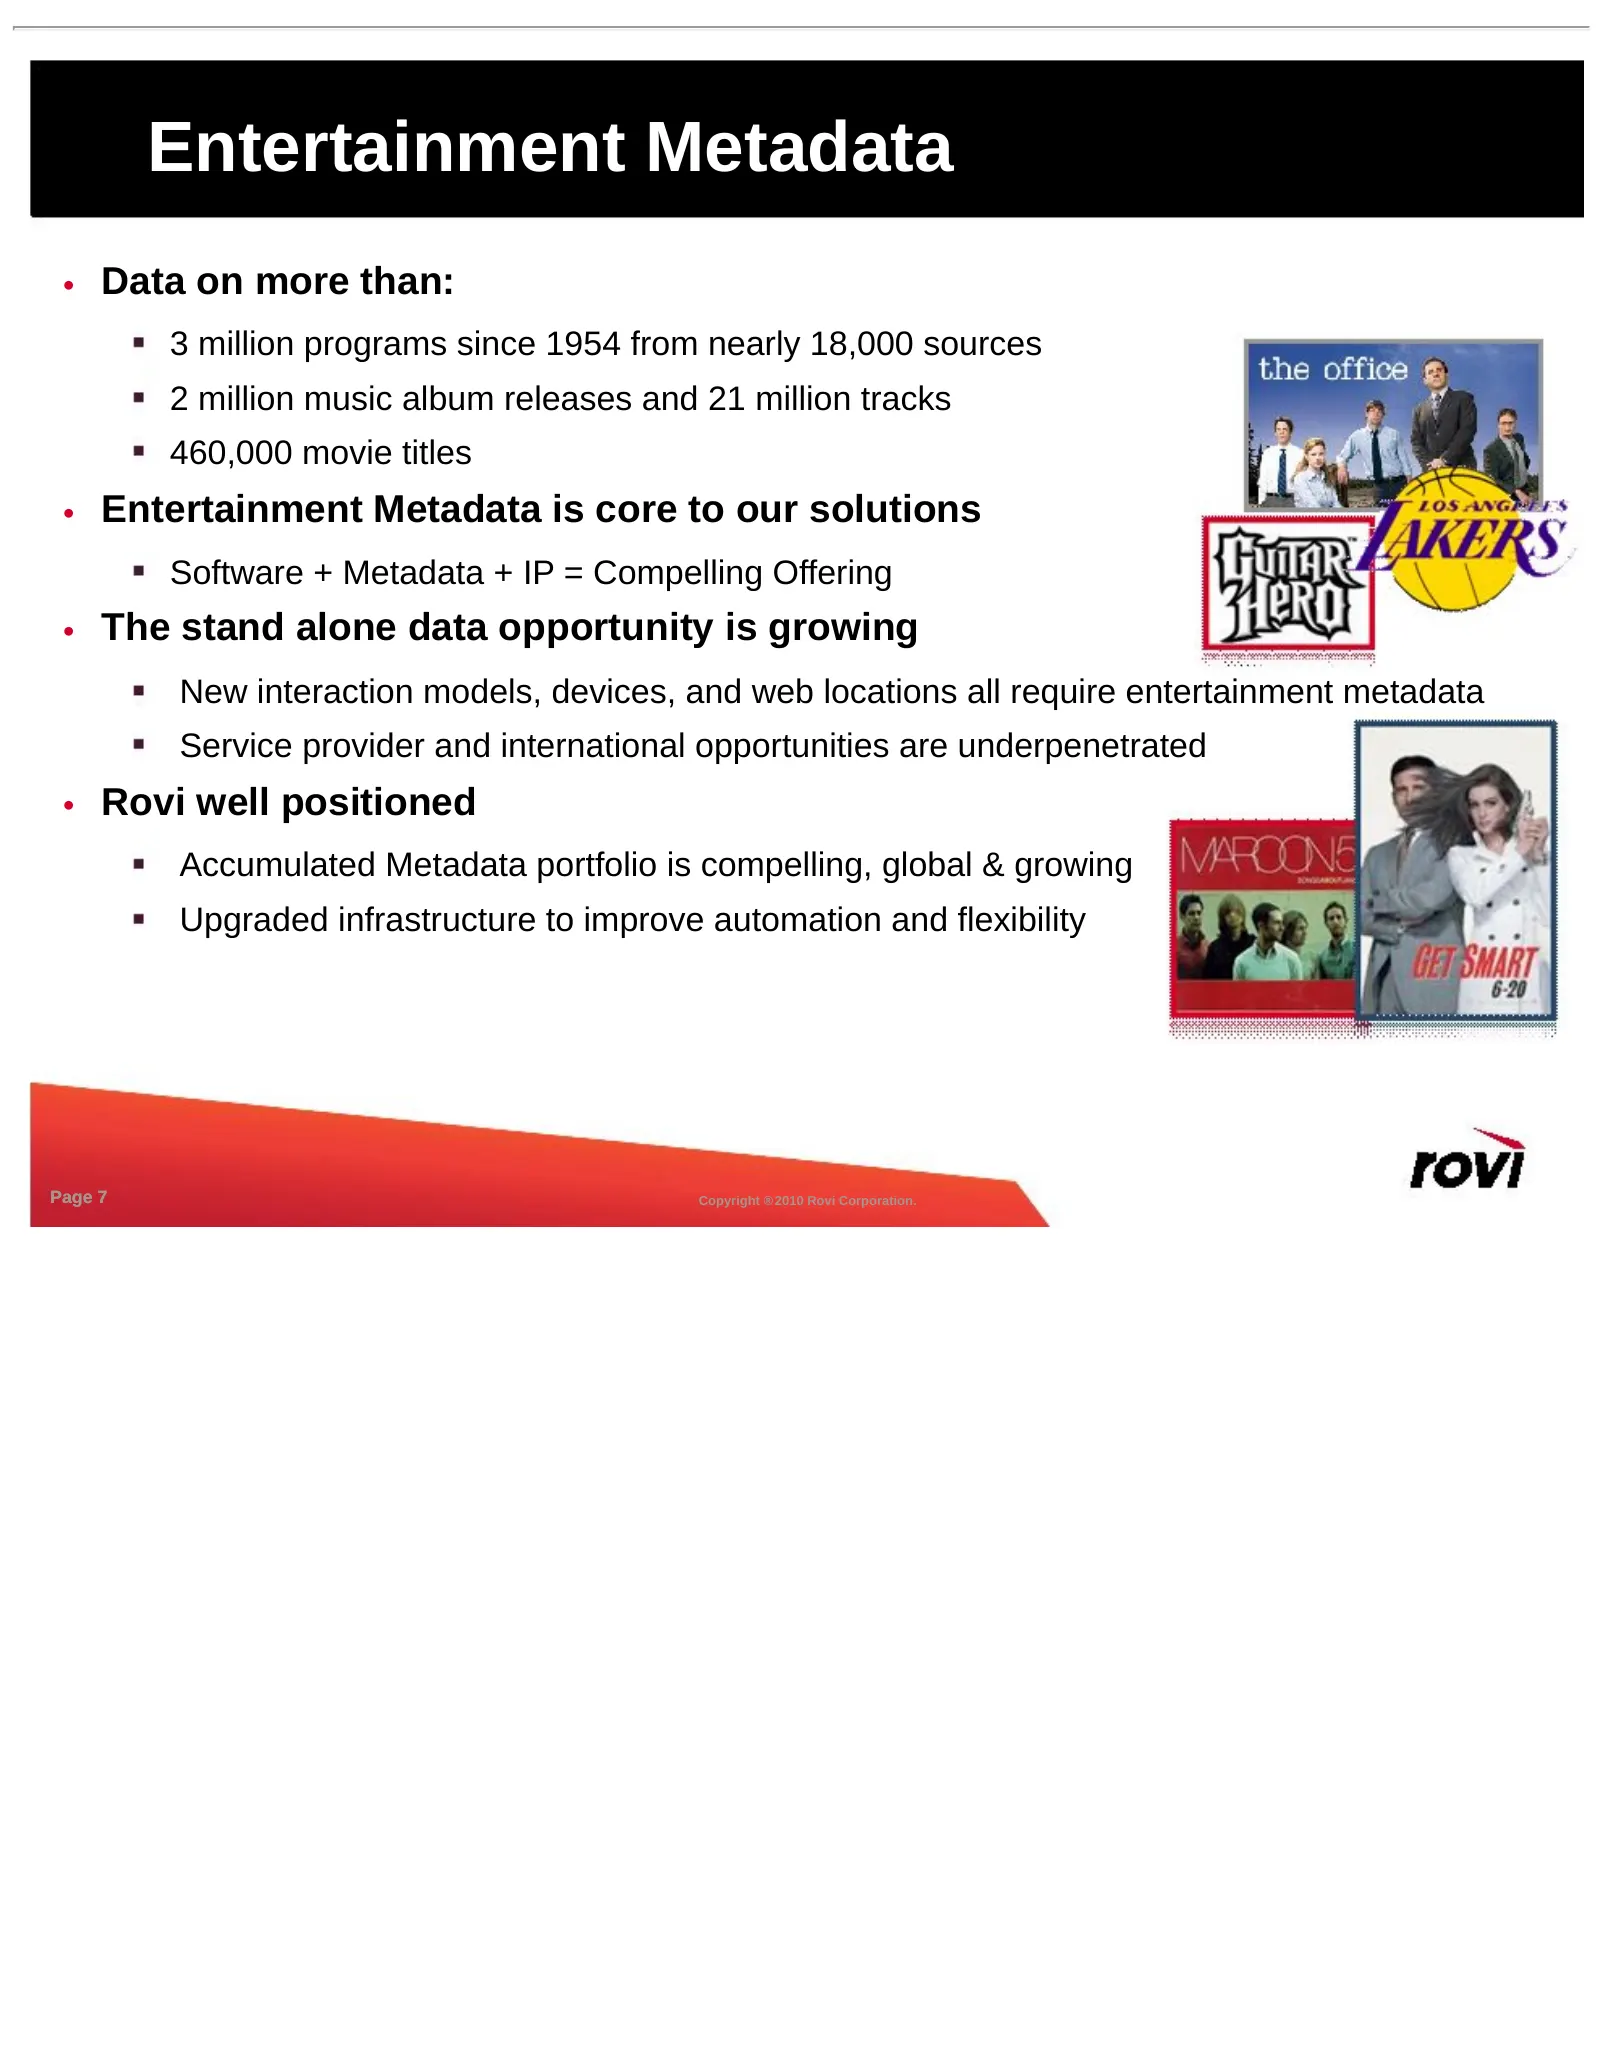
Entertainment Metadata • Data on more than: 3 million programs since 1954 from nearly 18,000 sources 2 million music album releases and 21 million tracks 460,000 movie titles • Entertainment Metadata is core to our solutions Software + Metadata + IP = Compelling Offering • The stand alone data oppor
Slide 8: Rovi metadata around the world
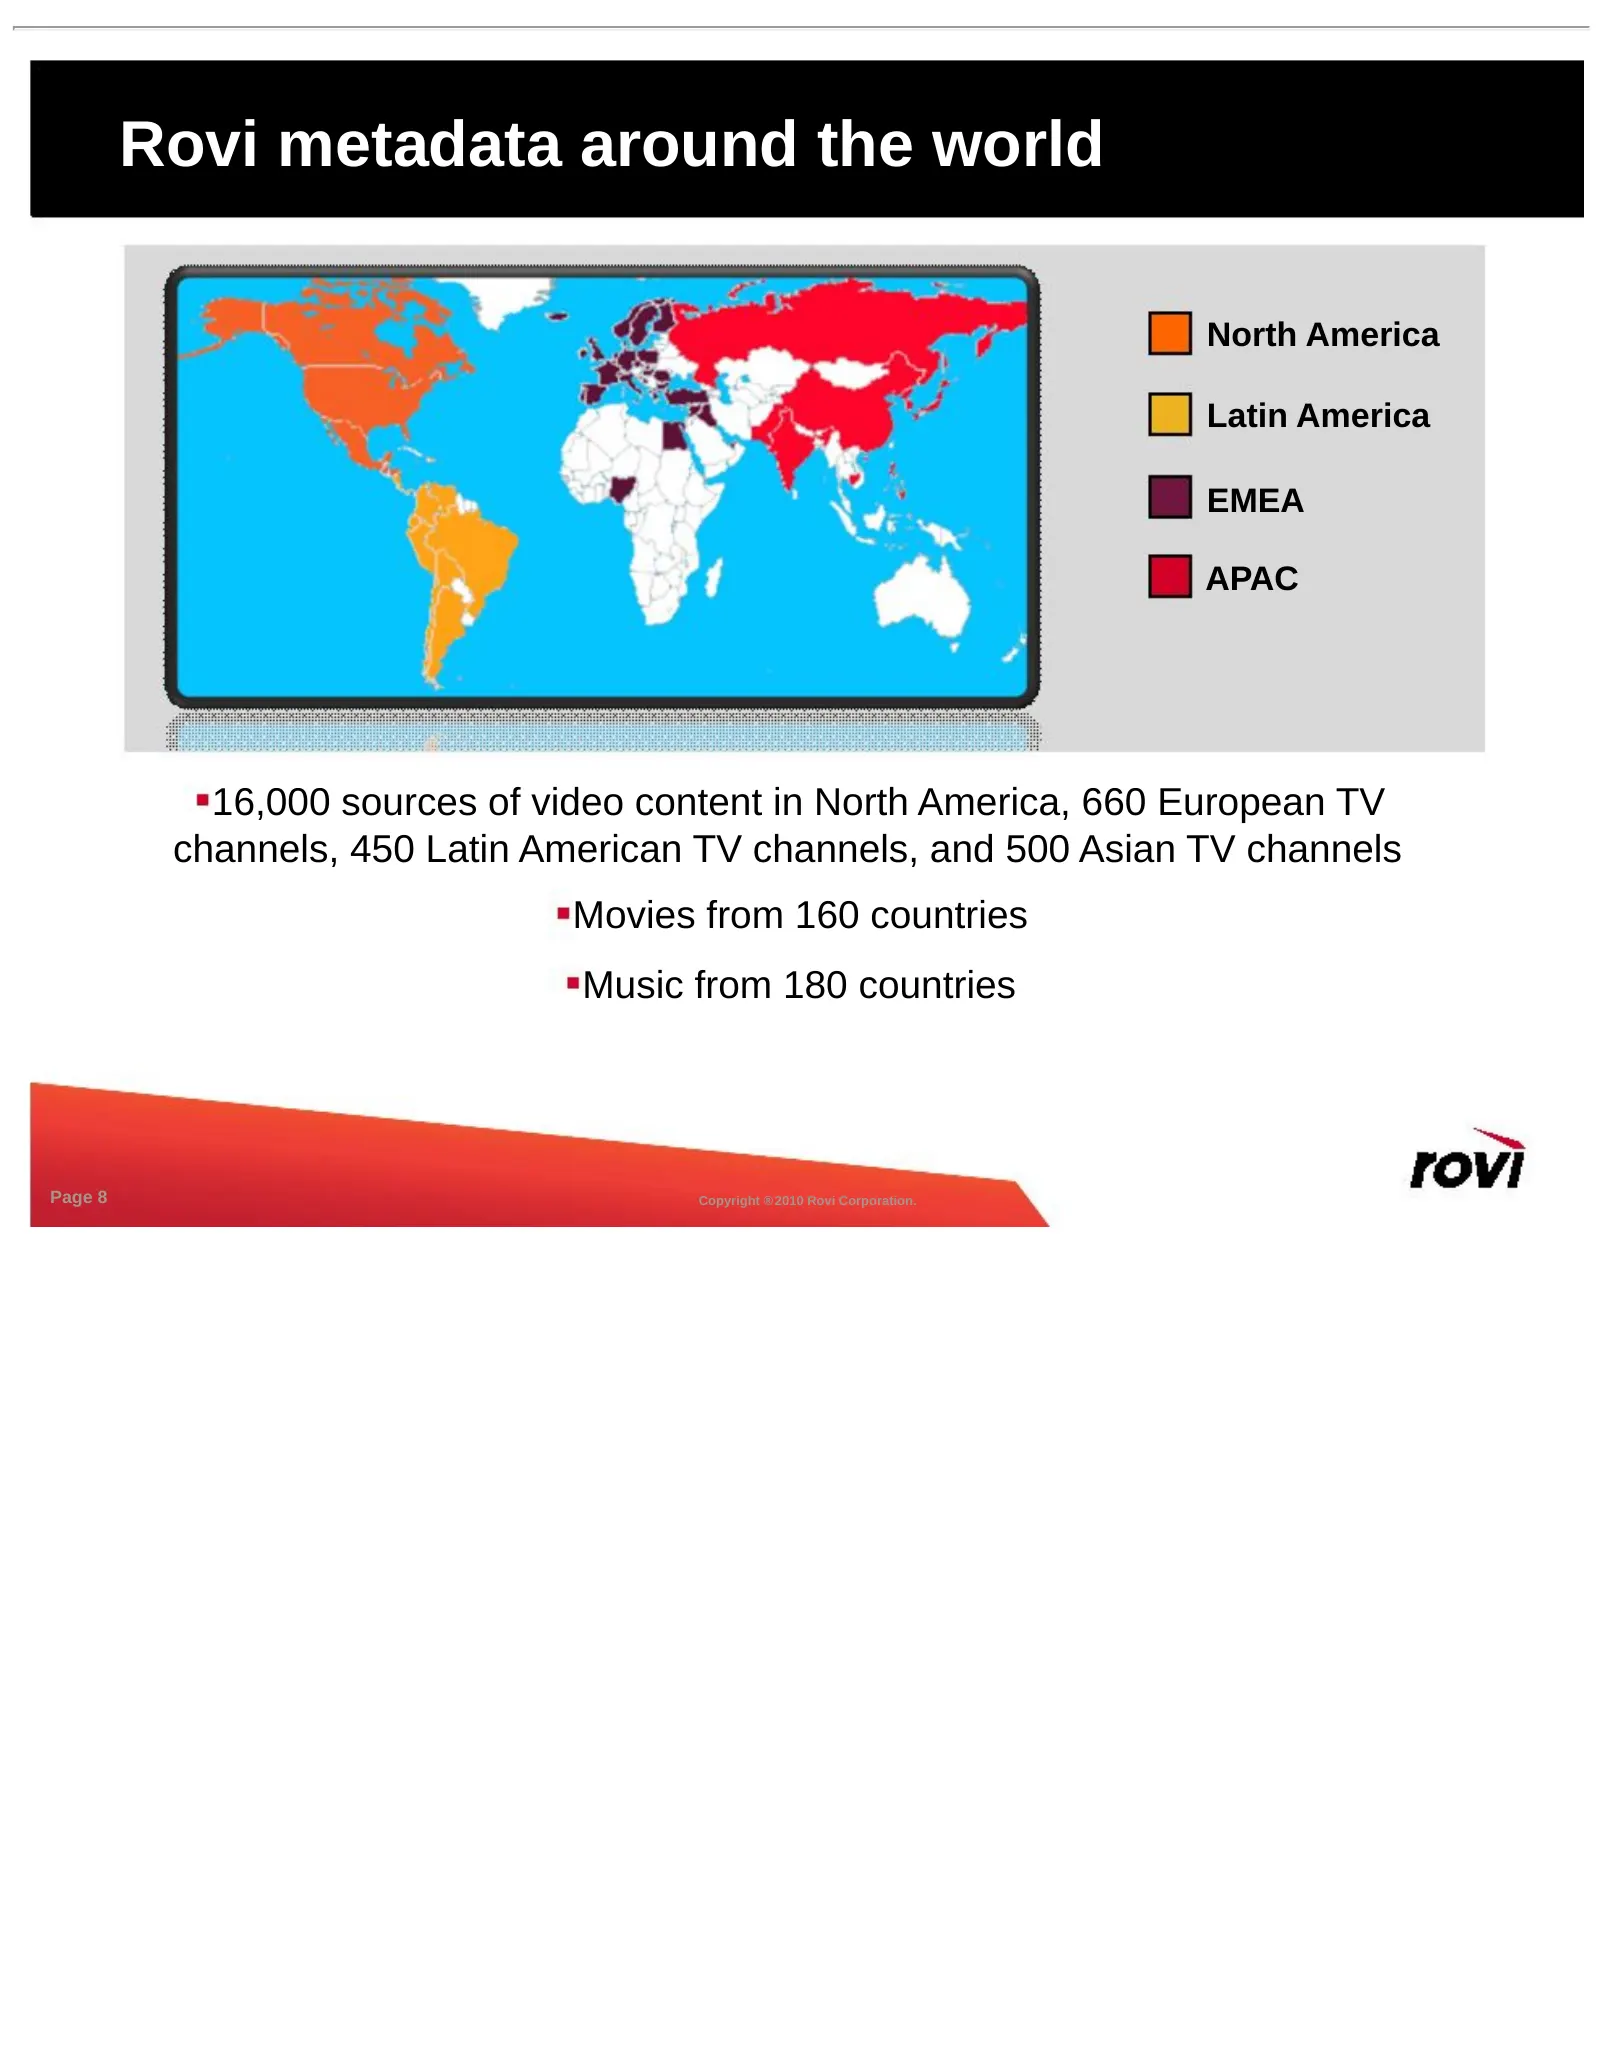
Rovi metadata around the world North America Latin America EMEA APAC 16,000 sources of video content in North America, 660 European TV channels, 450 Latin American TV channels, and 500 Asian TV channels Movies from 160 countries Music from 180 countries Page 8 Copyright ® 2010 Rovi Corporation.
Slide 9: Backed by Strong Patent Portfolio
Backed by Strong Patent Portfolio • Over 4,700 patents & patent applications worldwide covering: Display of and interaction with TV program schedule data - Basic Guidance Features - Digital Recording including embedded DVR & Network DVR - Online Guidance & Video Search - Cross-Platform Functionality
Slide 10: Rovi Customer Highlights
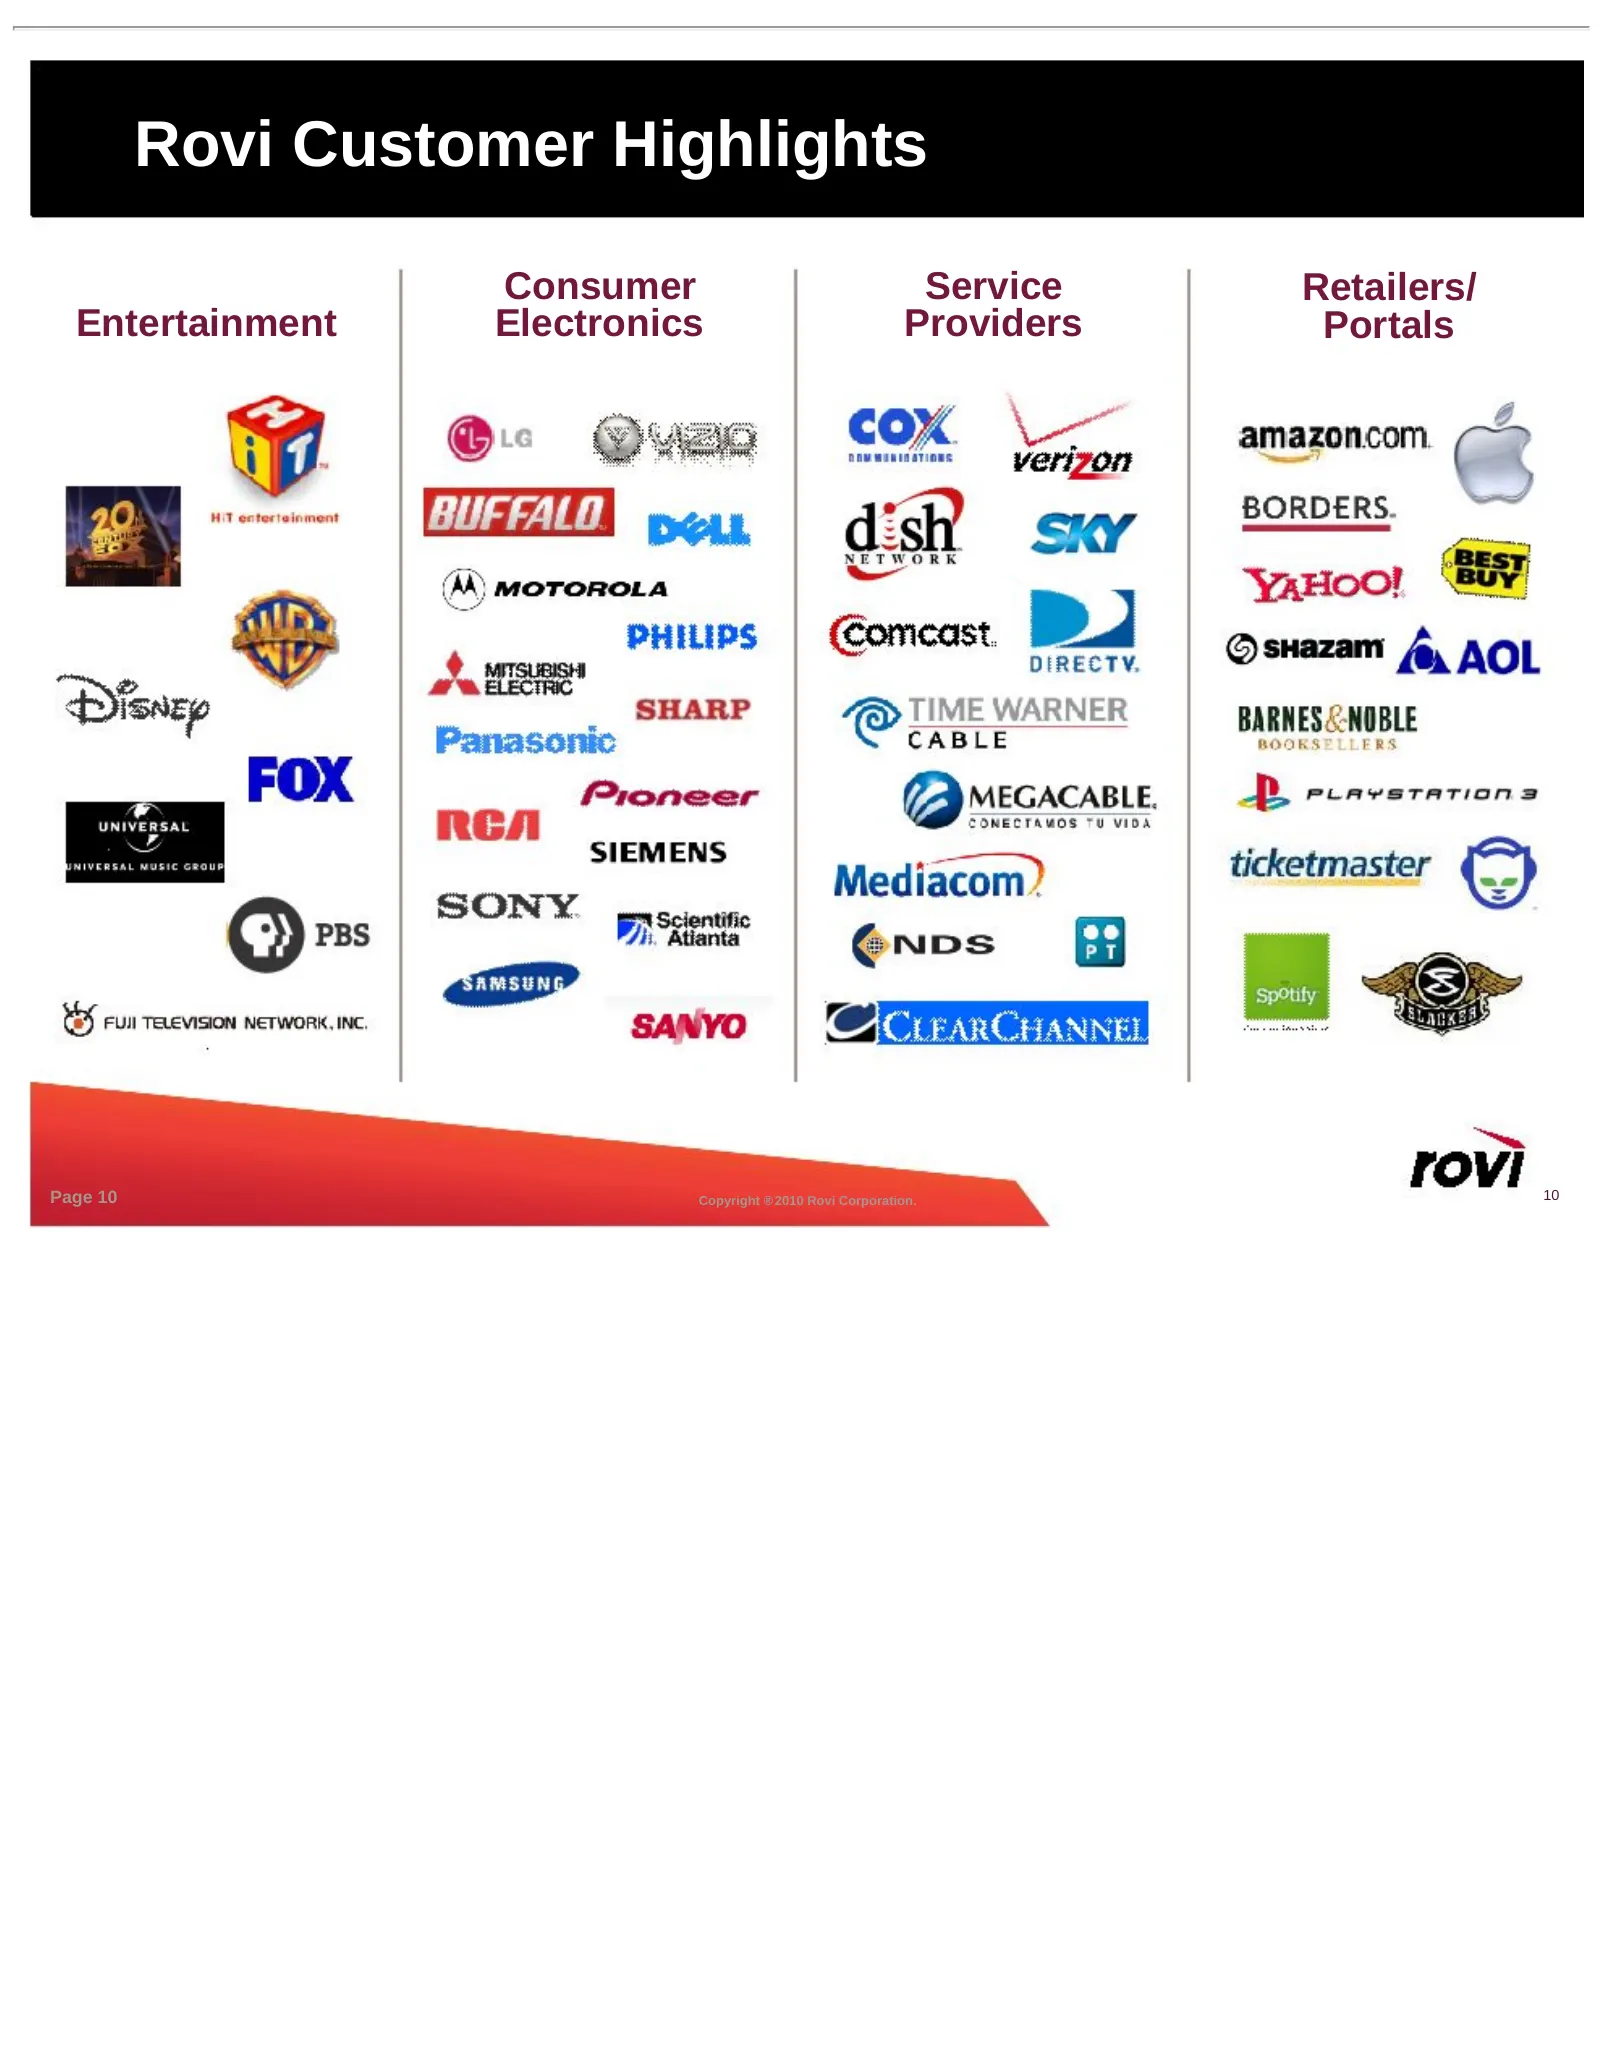
Rovi Customer Highlights Consumer Service Retailers/ Entertainment Electronics Providers Portals Page 10 Copyright ® 2010 Rovi Corporation. 10
Slide 11: Fundamental Business Drivers - Digital & Connectivity Driving Growth
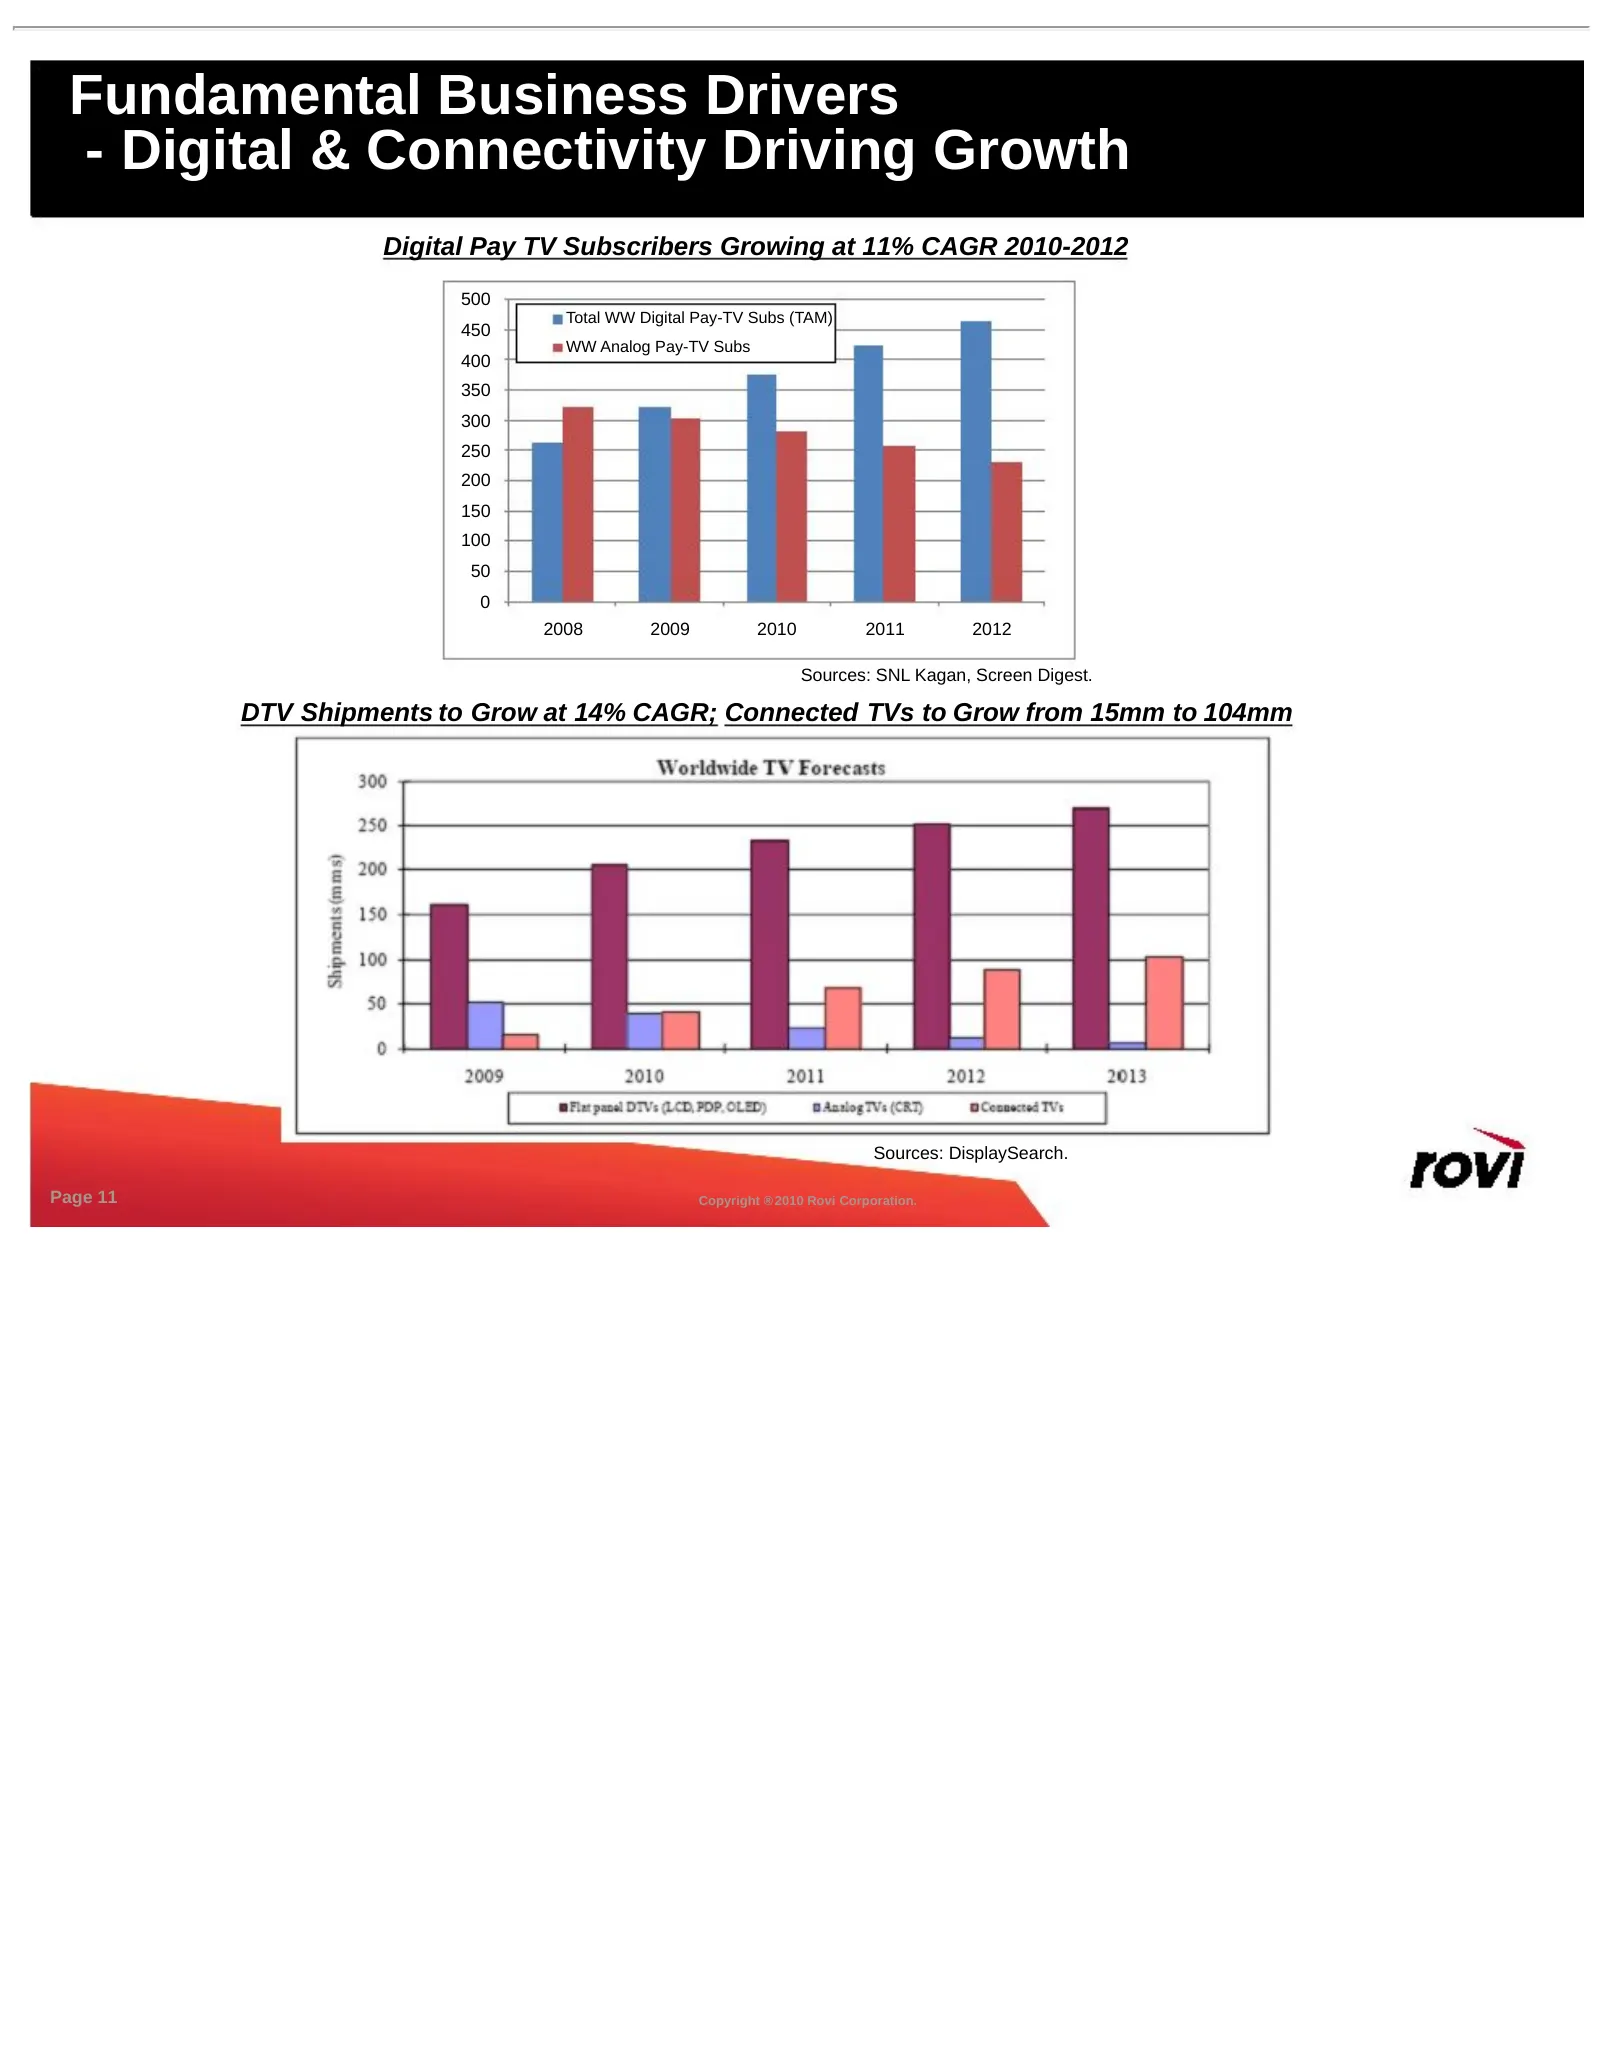
Fundamental Business Drivers - Digital & Connectivity Driving Growth Digital Pay TV Subscribers Growing at 11% CAGR 2010-2012 500 Total WW Digital Pay-TV Subs (TAM) 450 WW Analog Pay-TV Subs 400 350 300 250 200 150 100 50 0 2008 2009 2010 2011 2012 Sources: SNL Kagan, Screen Digest. DTV Shipments to
Slide 12: The Industry is Moving Fast
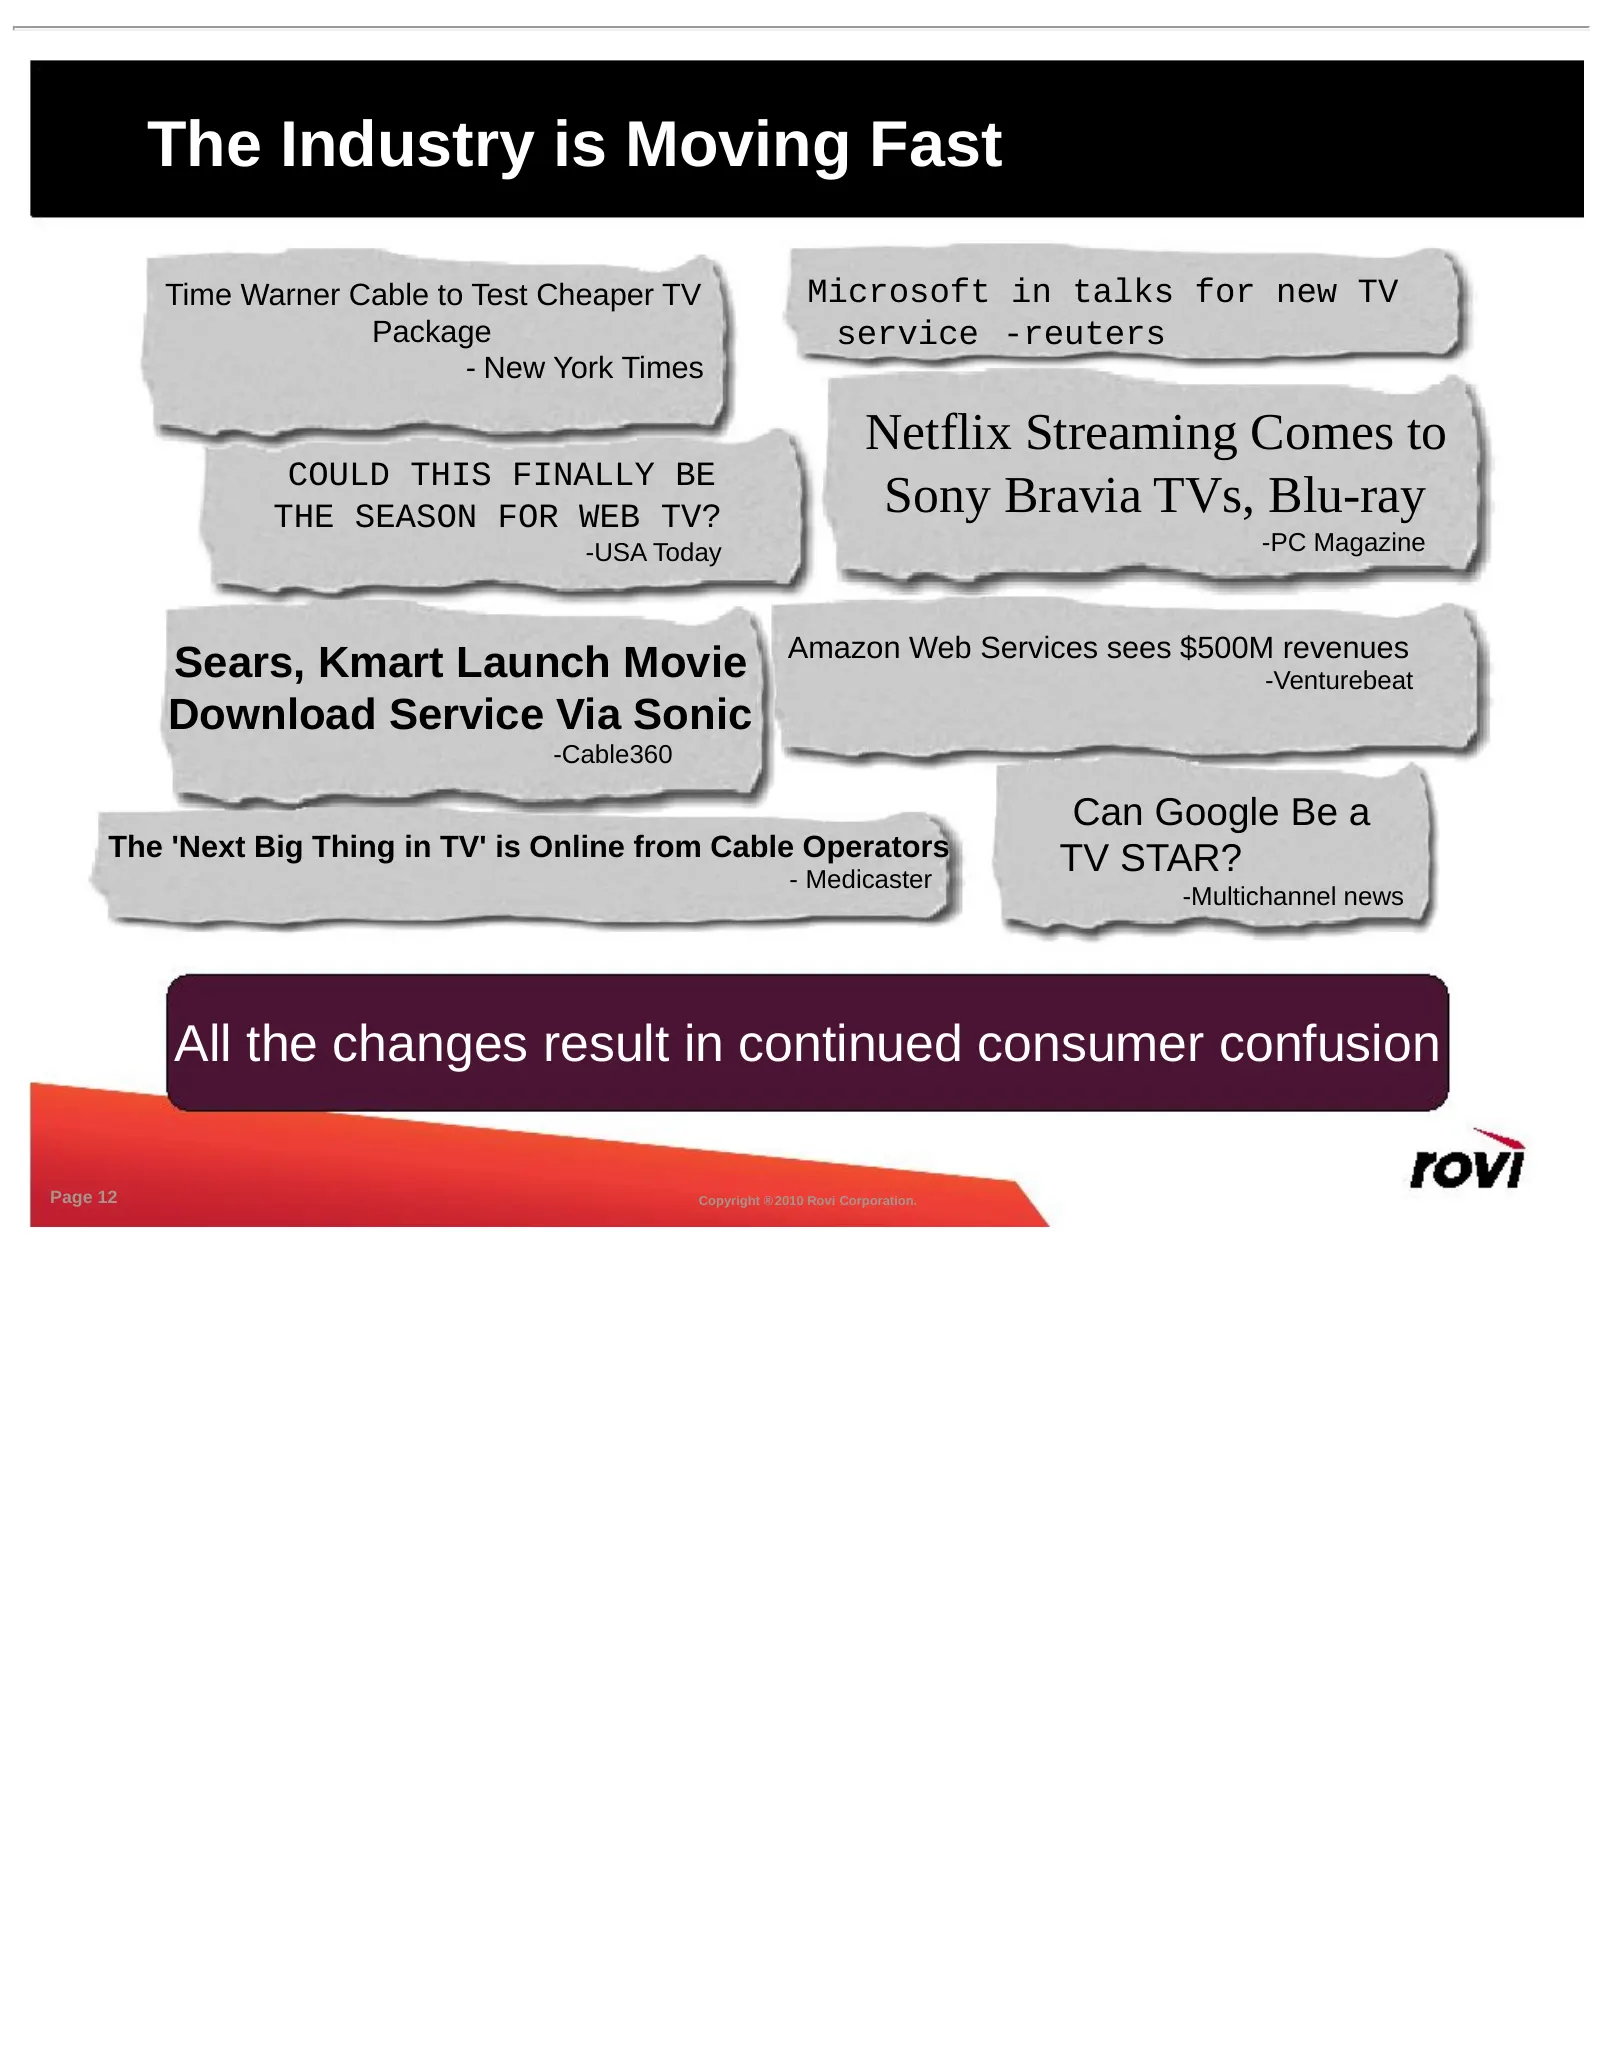
The Industry is Moving Fast Time Warner Cable to Test Cheaper TV Microsoft in talks for new TV Package service -reuters - New York Times Netflix Streaming Comes to COULD THIS FINALLY BE THE SEASON FOR WEB TV? Sony Bravia TVs, Blu-ray -USA Today -PC Magazine Amazon Web Services sees $500M revenues Se
Slide 13: Trends Facing The Industry
Trends Facing The Industry • Market Speed - The transformation is occurring faster than we expected - Connected devices usage increasing • Consumers spreading their entertainment dollars - Connected devices or Over The Top - Cable operators actively seeking “connected” features • Advertising models
Slide 14: Shifts in Digital Entertainment Distribution
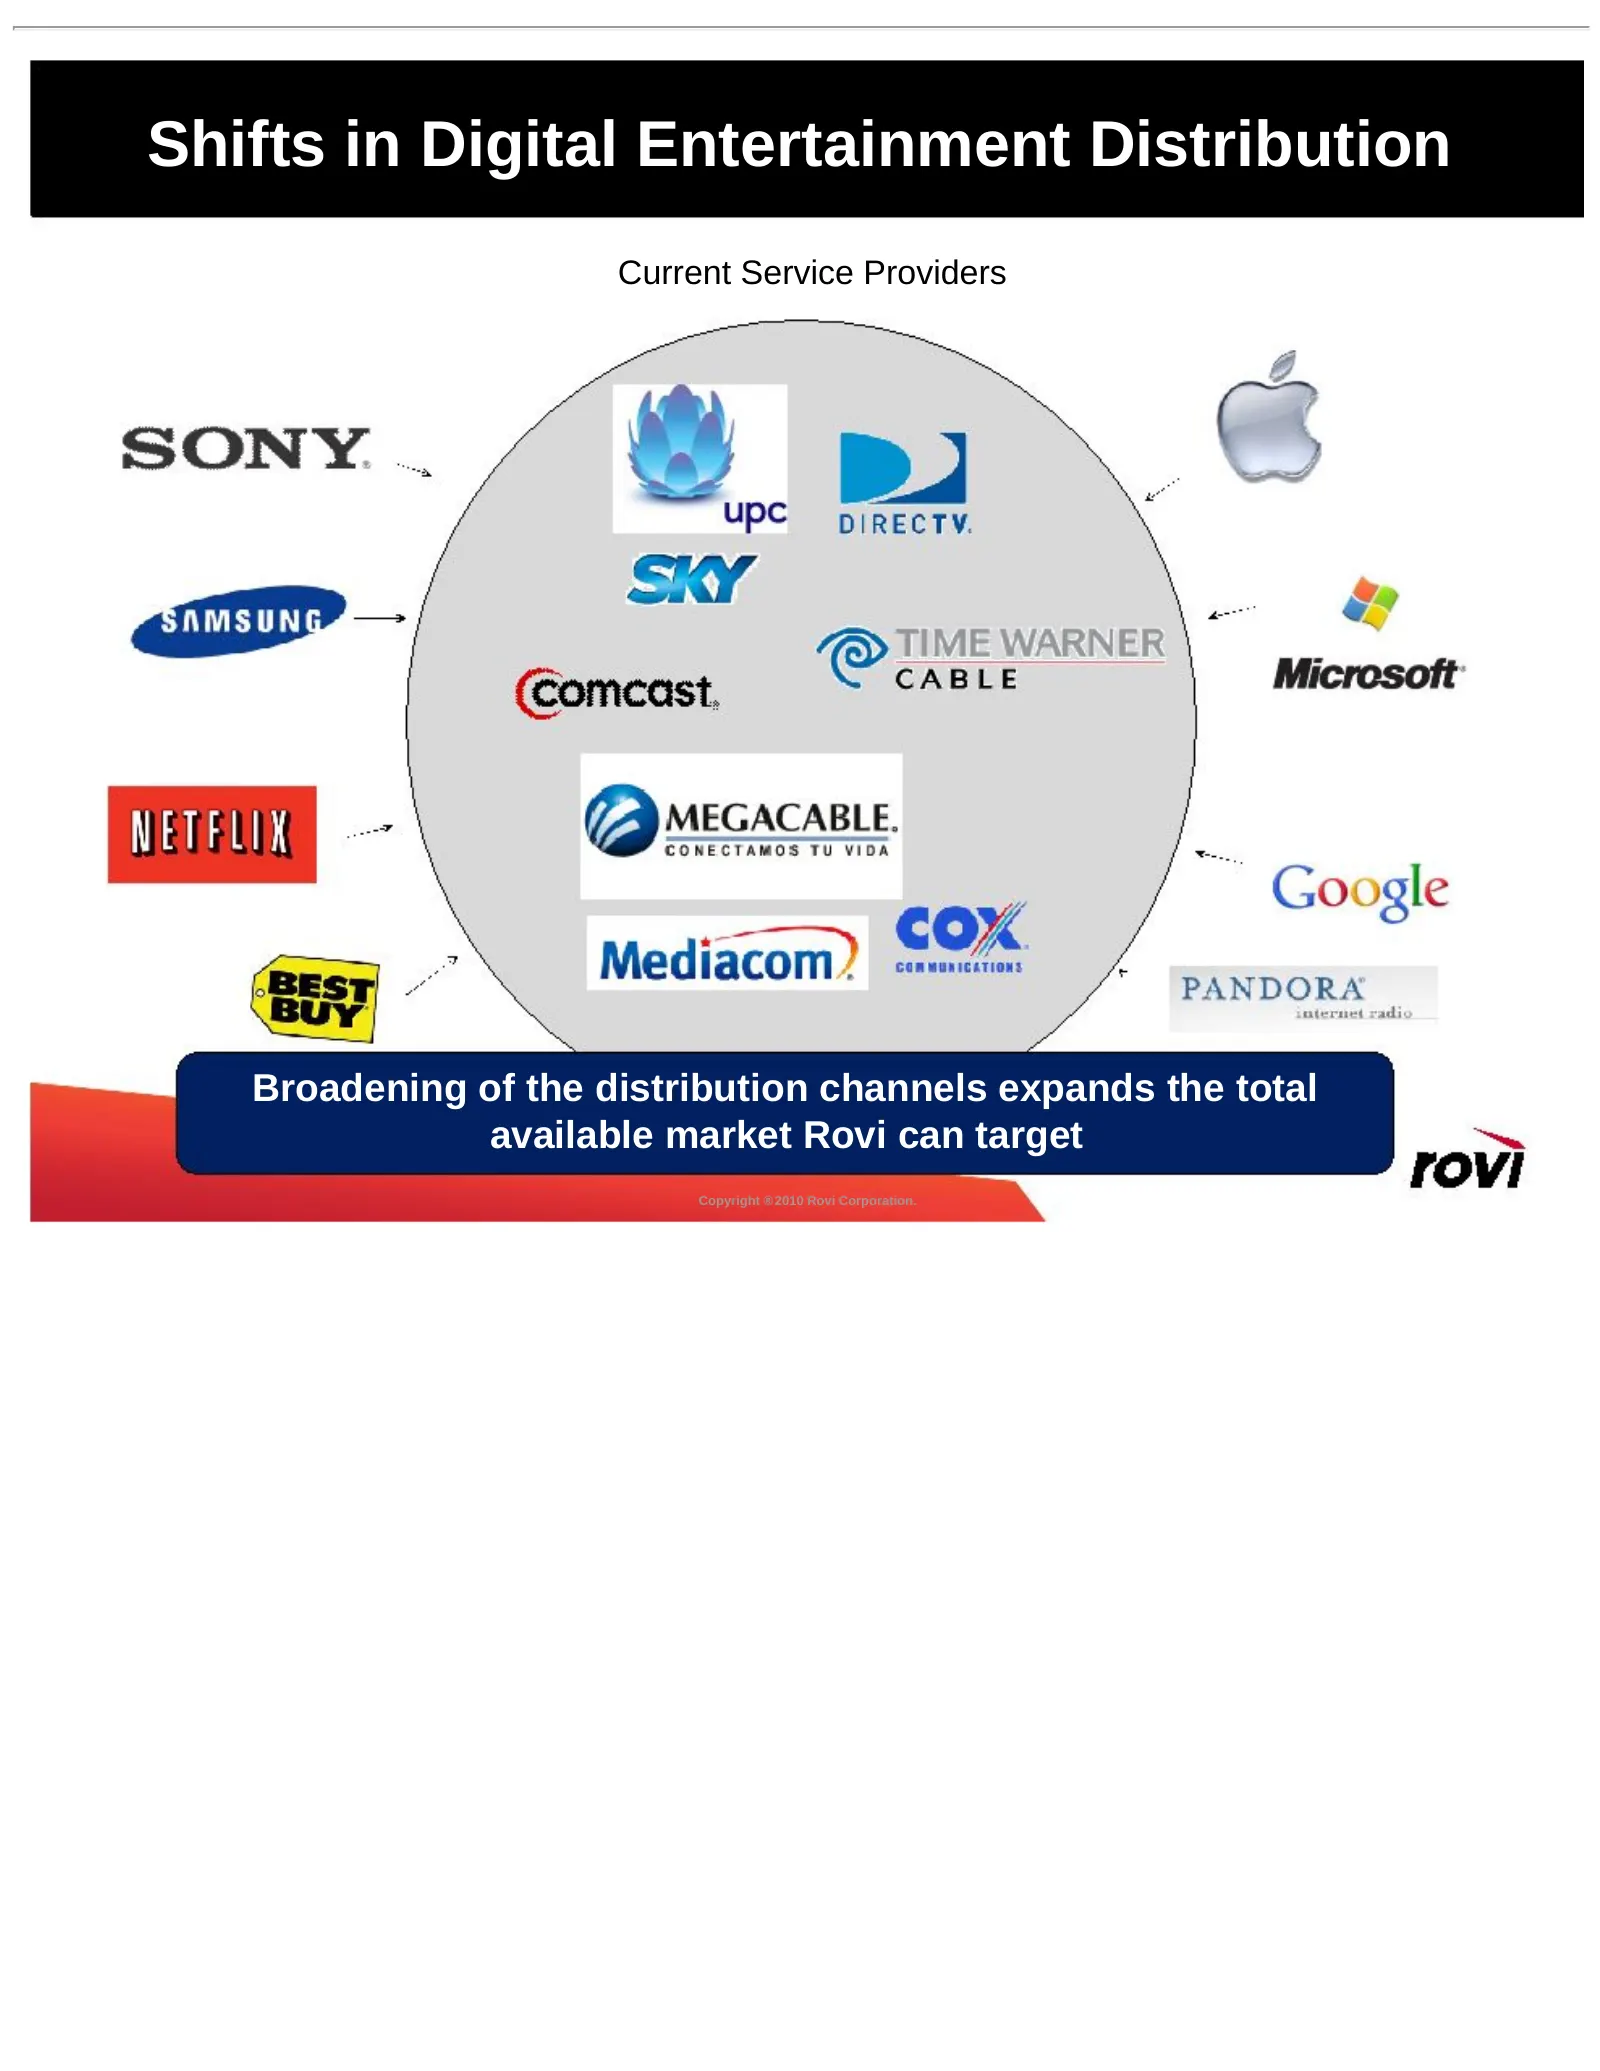
Shifts in Digital Entertainment Distribution Current Service Providers Broadening of the distribution channels expands the total available market Rovi can target Copyright ® 2010 Rovi Corporation.
Slide 15: Increased Adoption of Connected Media
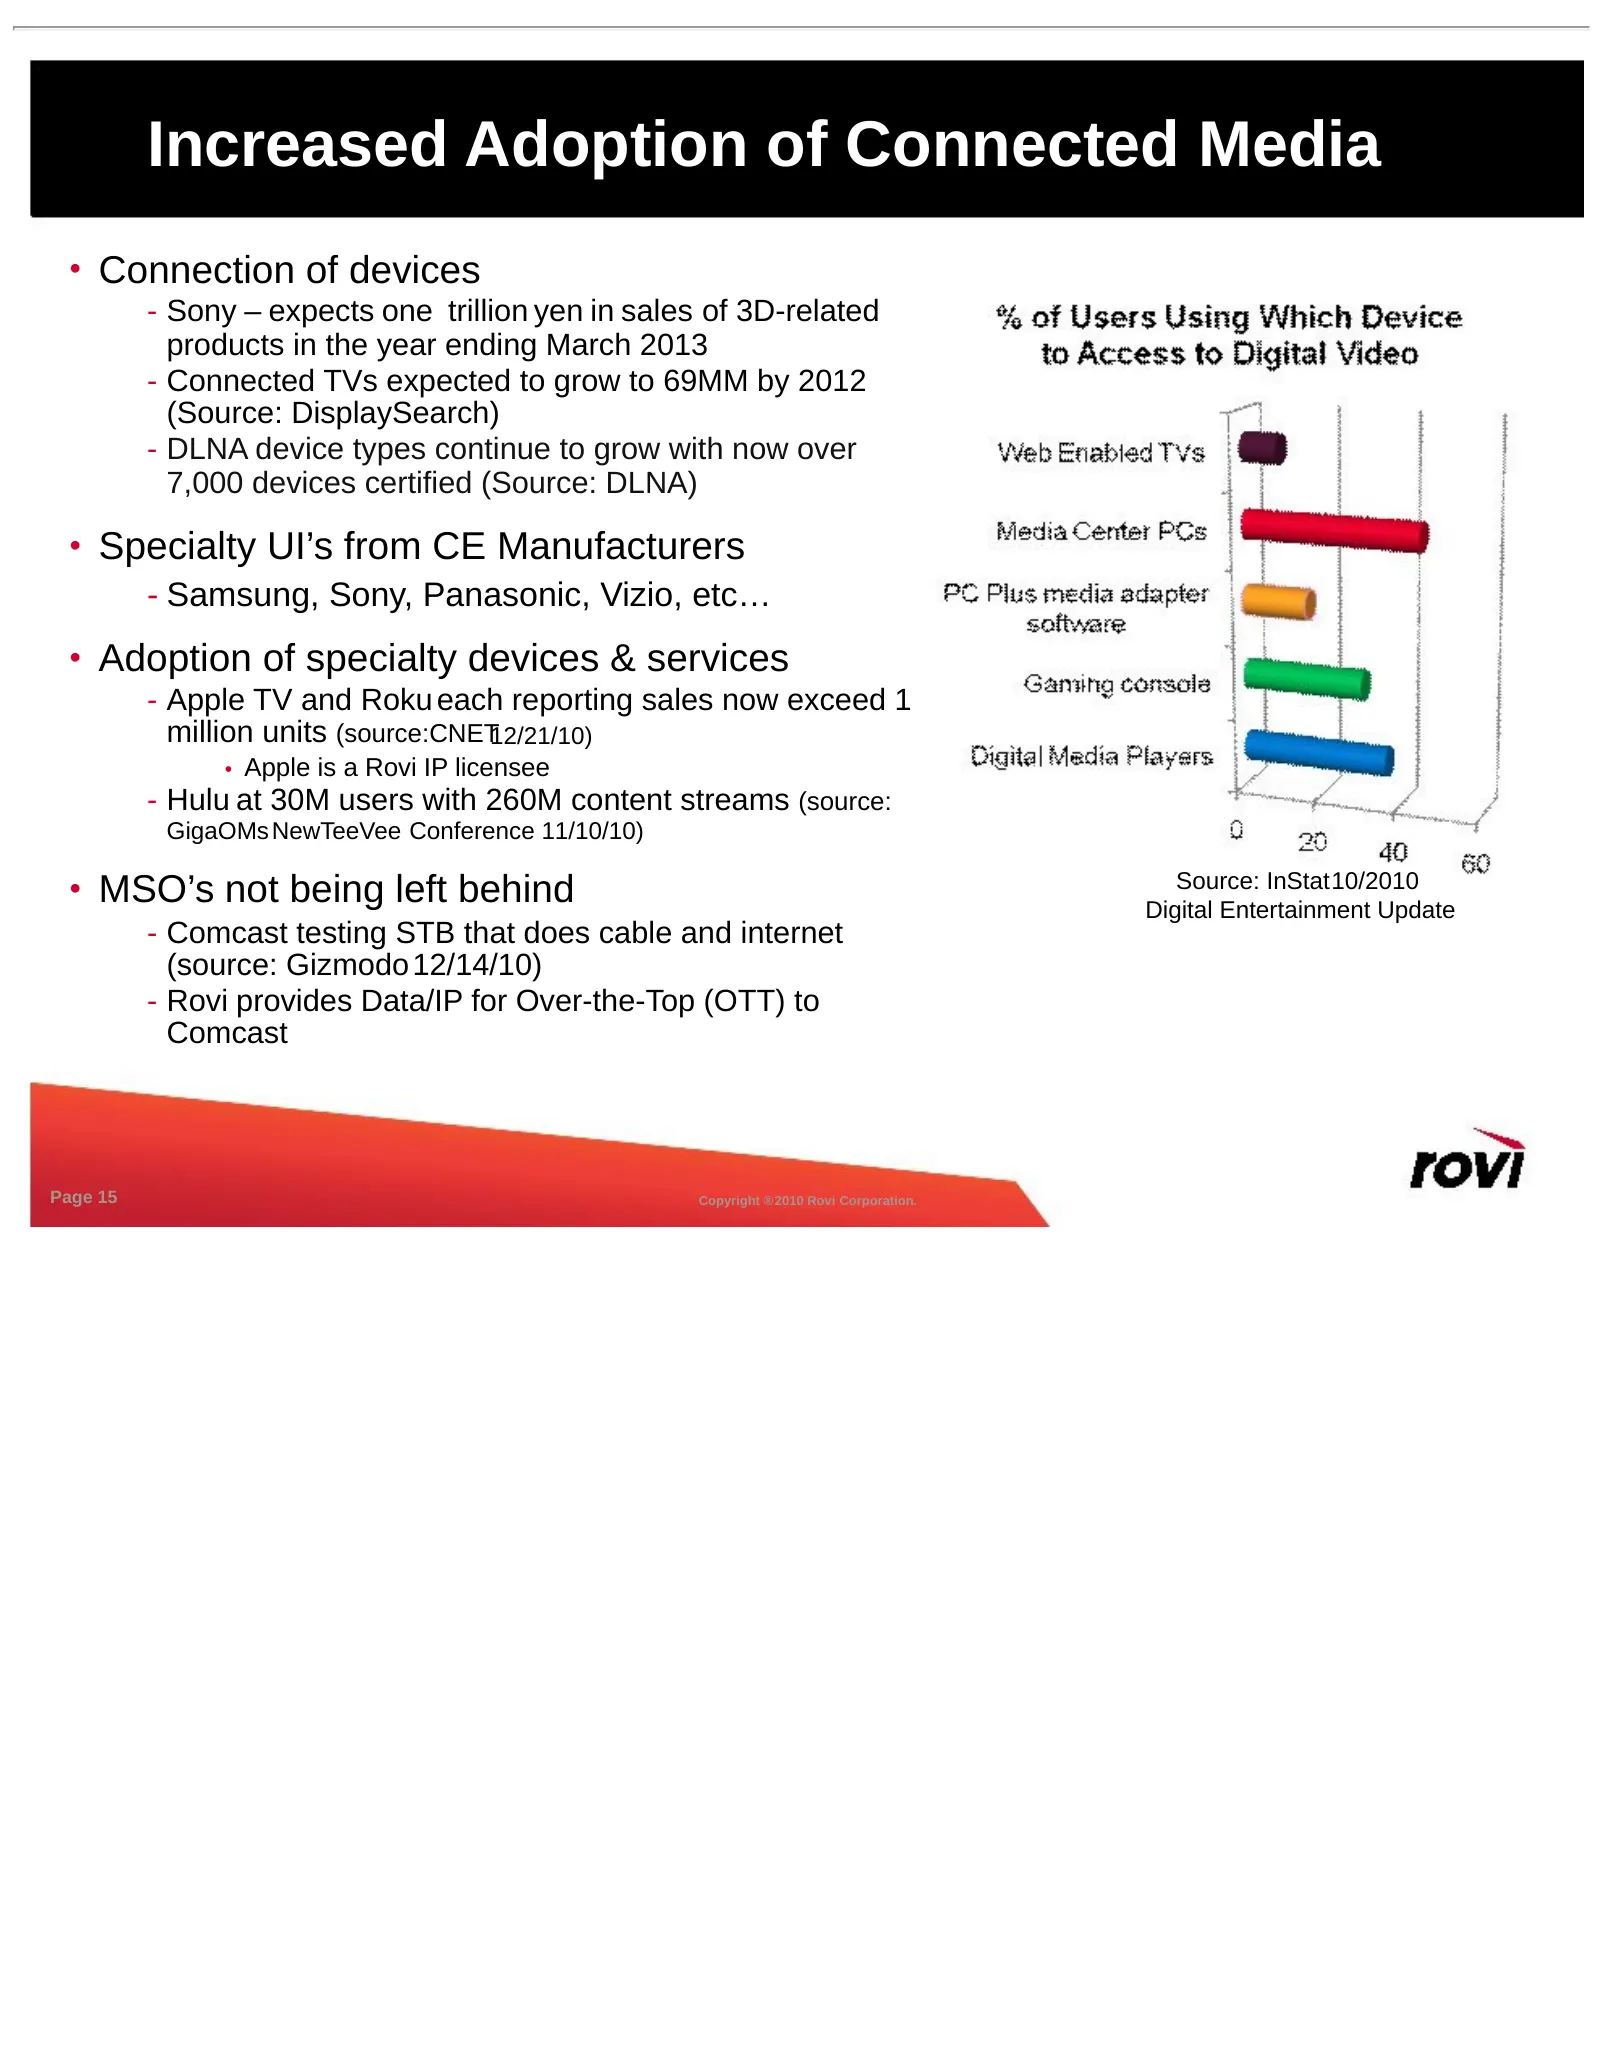
Increased Adoption of Connected Media • Connection of devices - Sony – expects one trillion yen in sales of 3D-related products in the year ending March 2013 - Connected TVs expected to grow to 69MM by 2012 (Source: DisplaySearch) - DLNA device types continue to grow with now over 7,000 devices cert
Slide 16: Industry Seeking The Road To Revenue
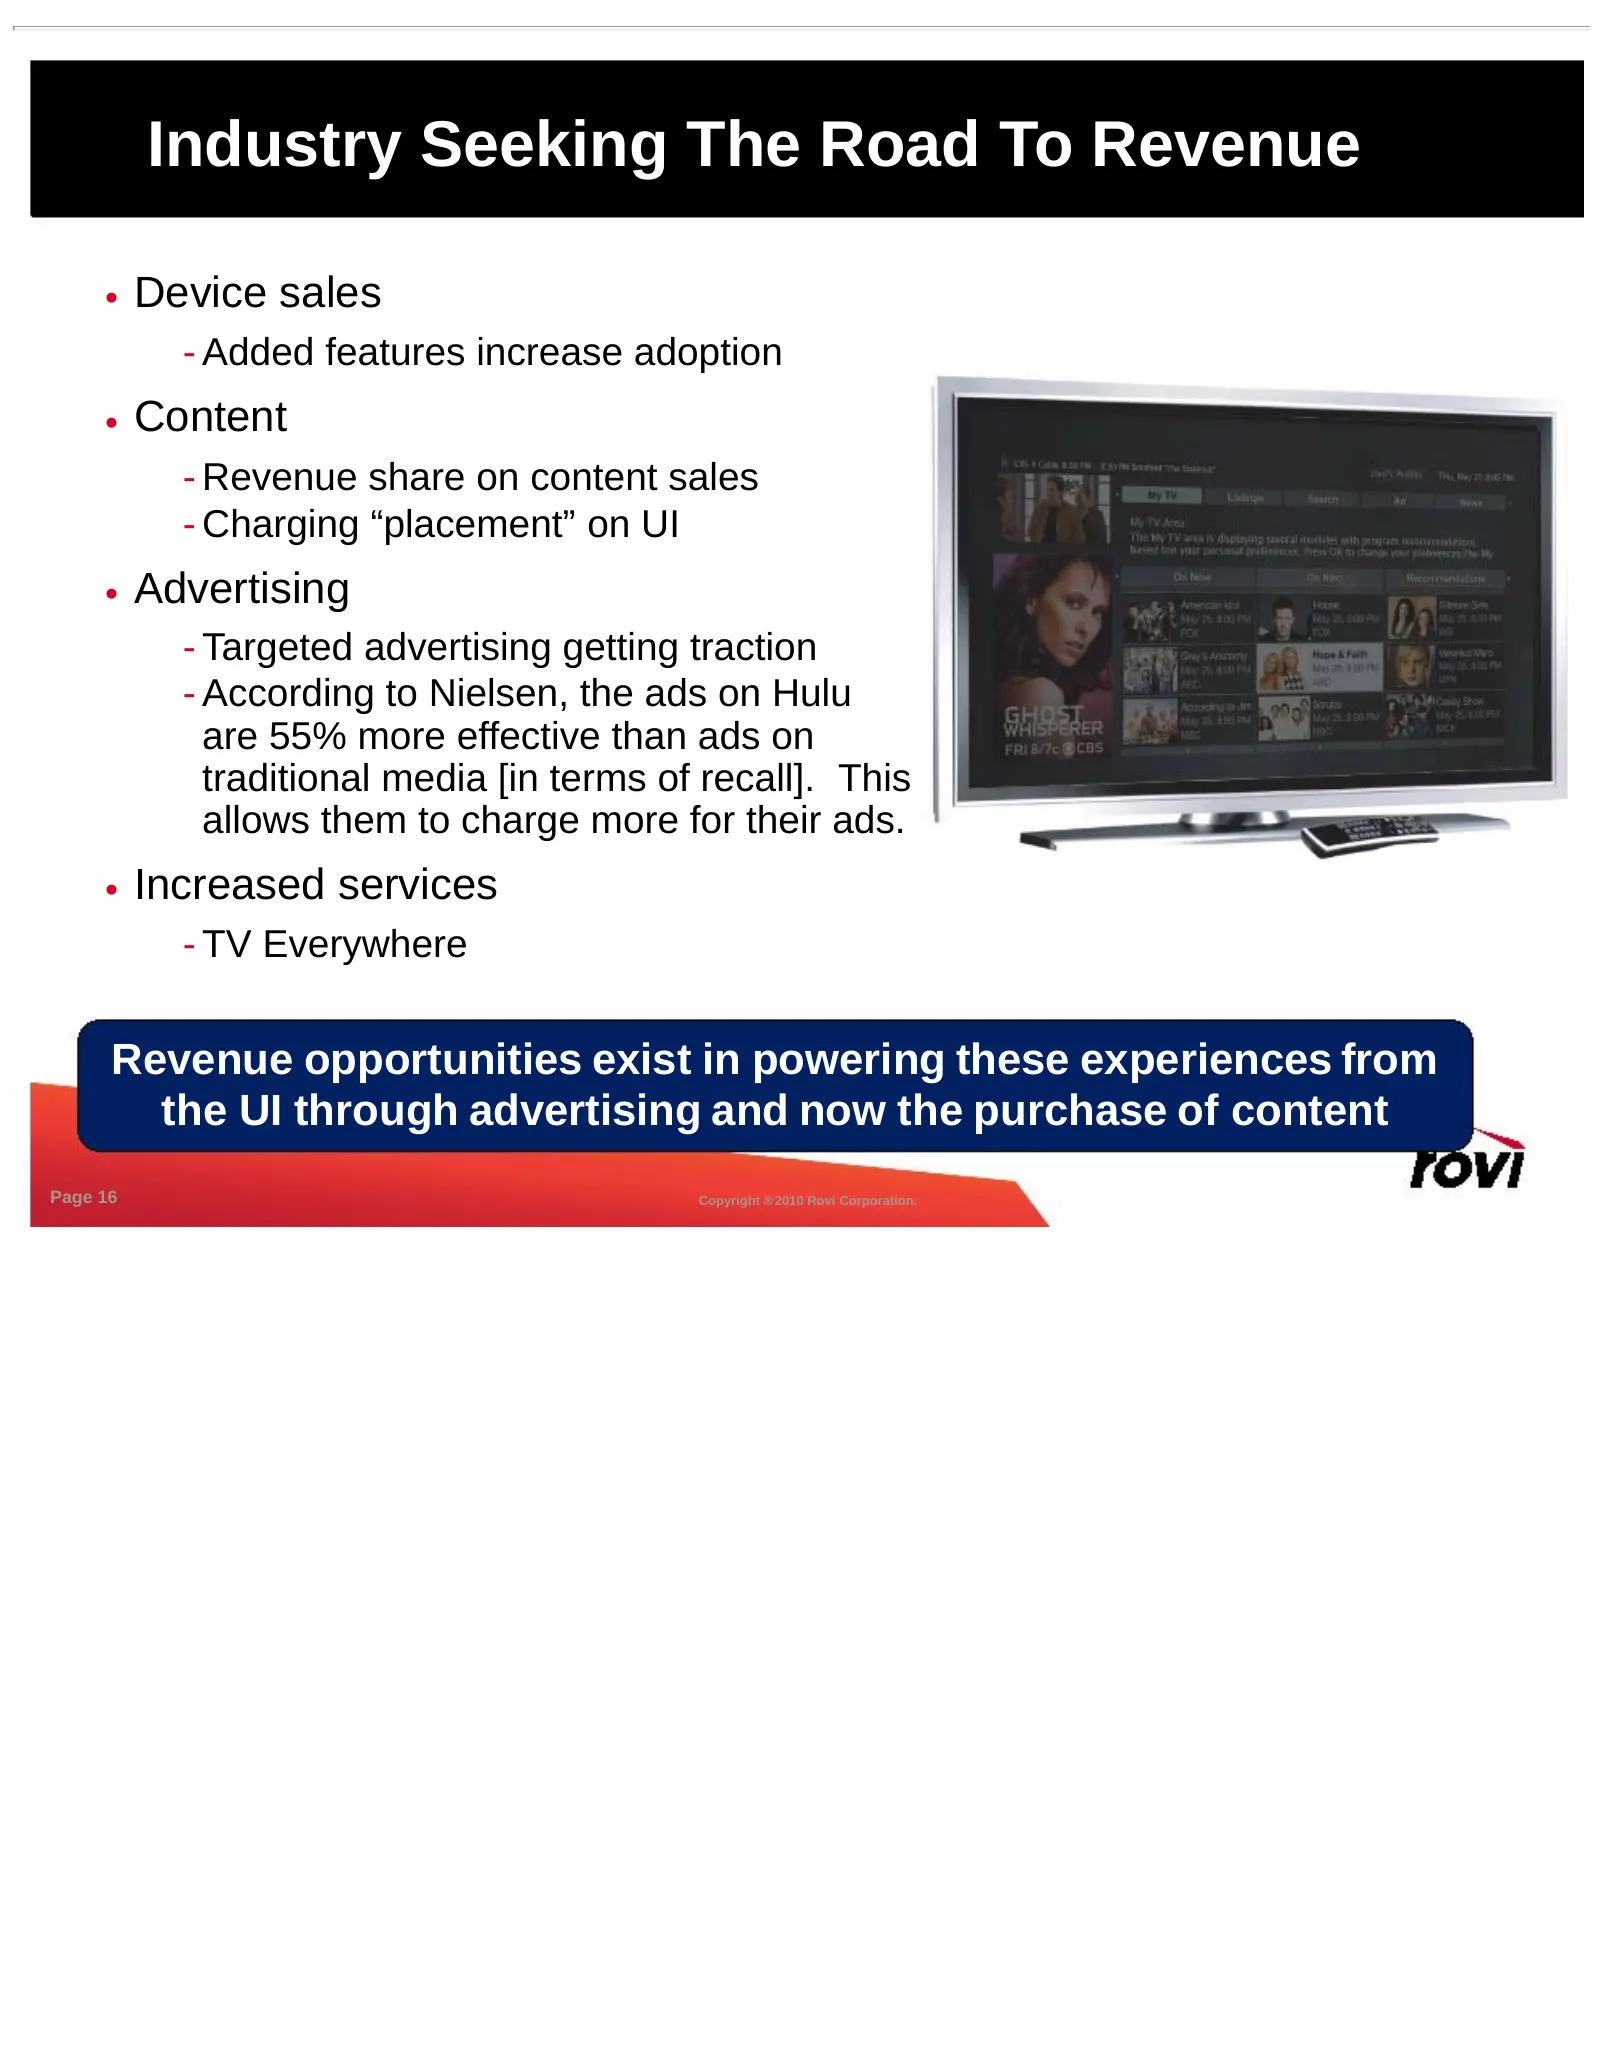
Industry Seeking The Road To Revenue • Device sales - Added features increase adoption • Content - Revenue share on content sales - Charging “placement” on UI • Advertising - Targeted advertising getting traction - According to Nielsen, the ads on Hulu are 55% more effective than ads on traditional
Slide 17: A New Digital Experience Is Coming
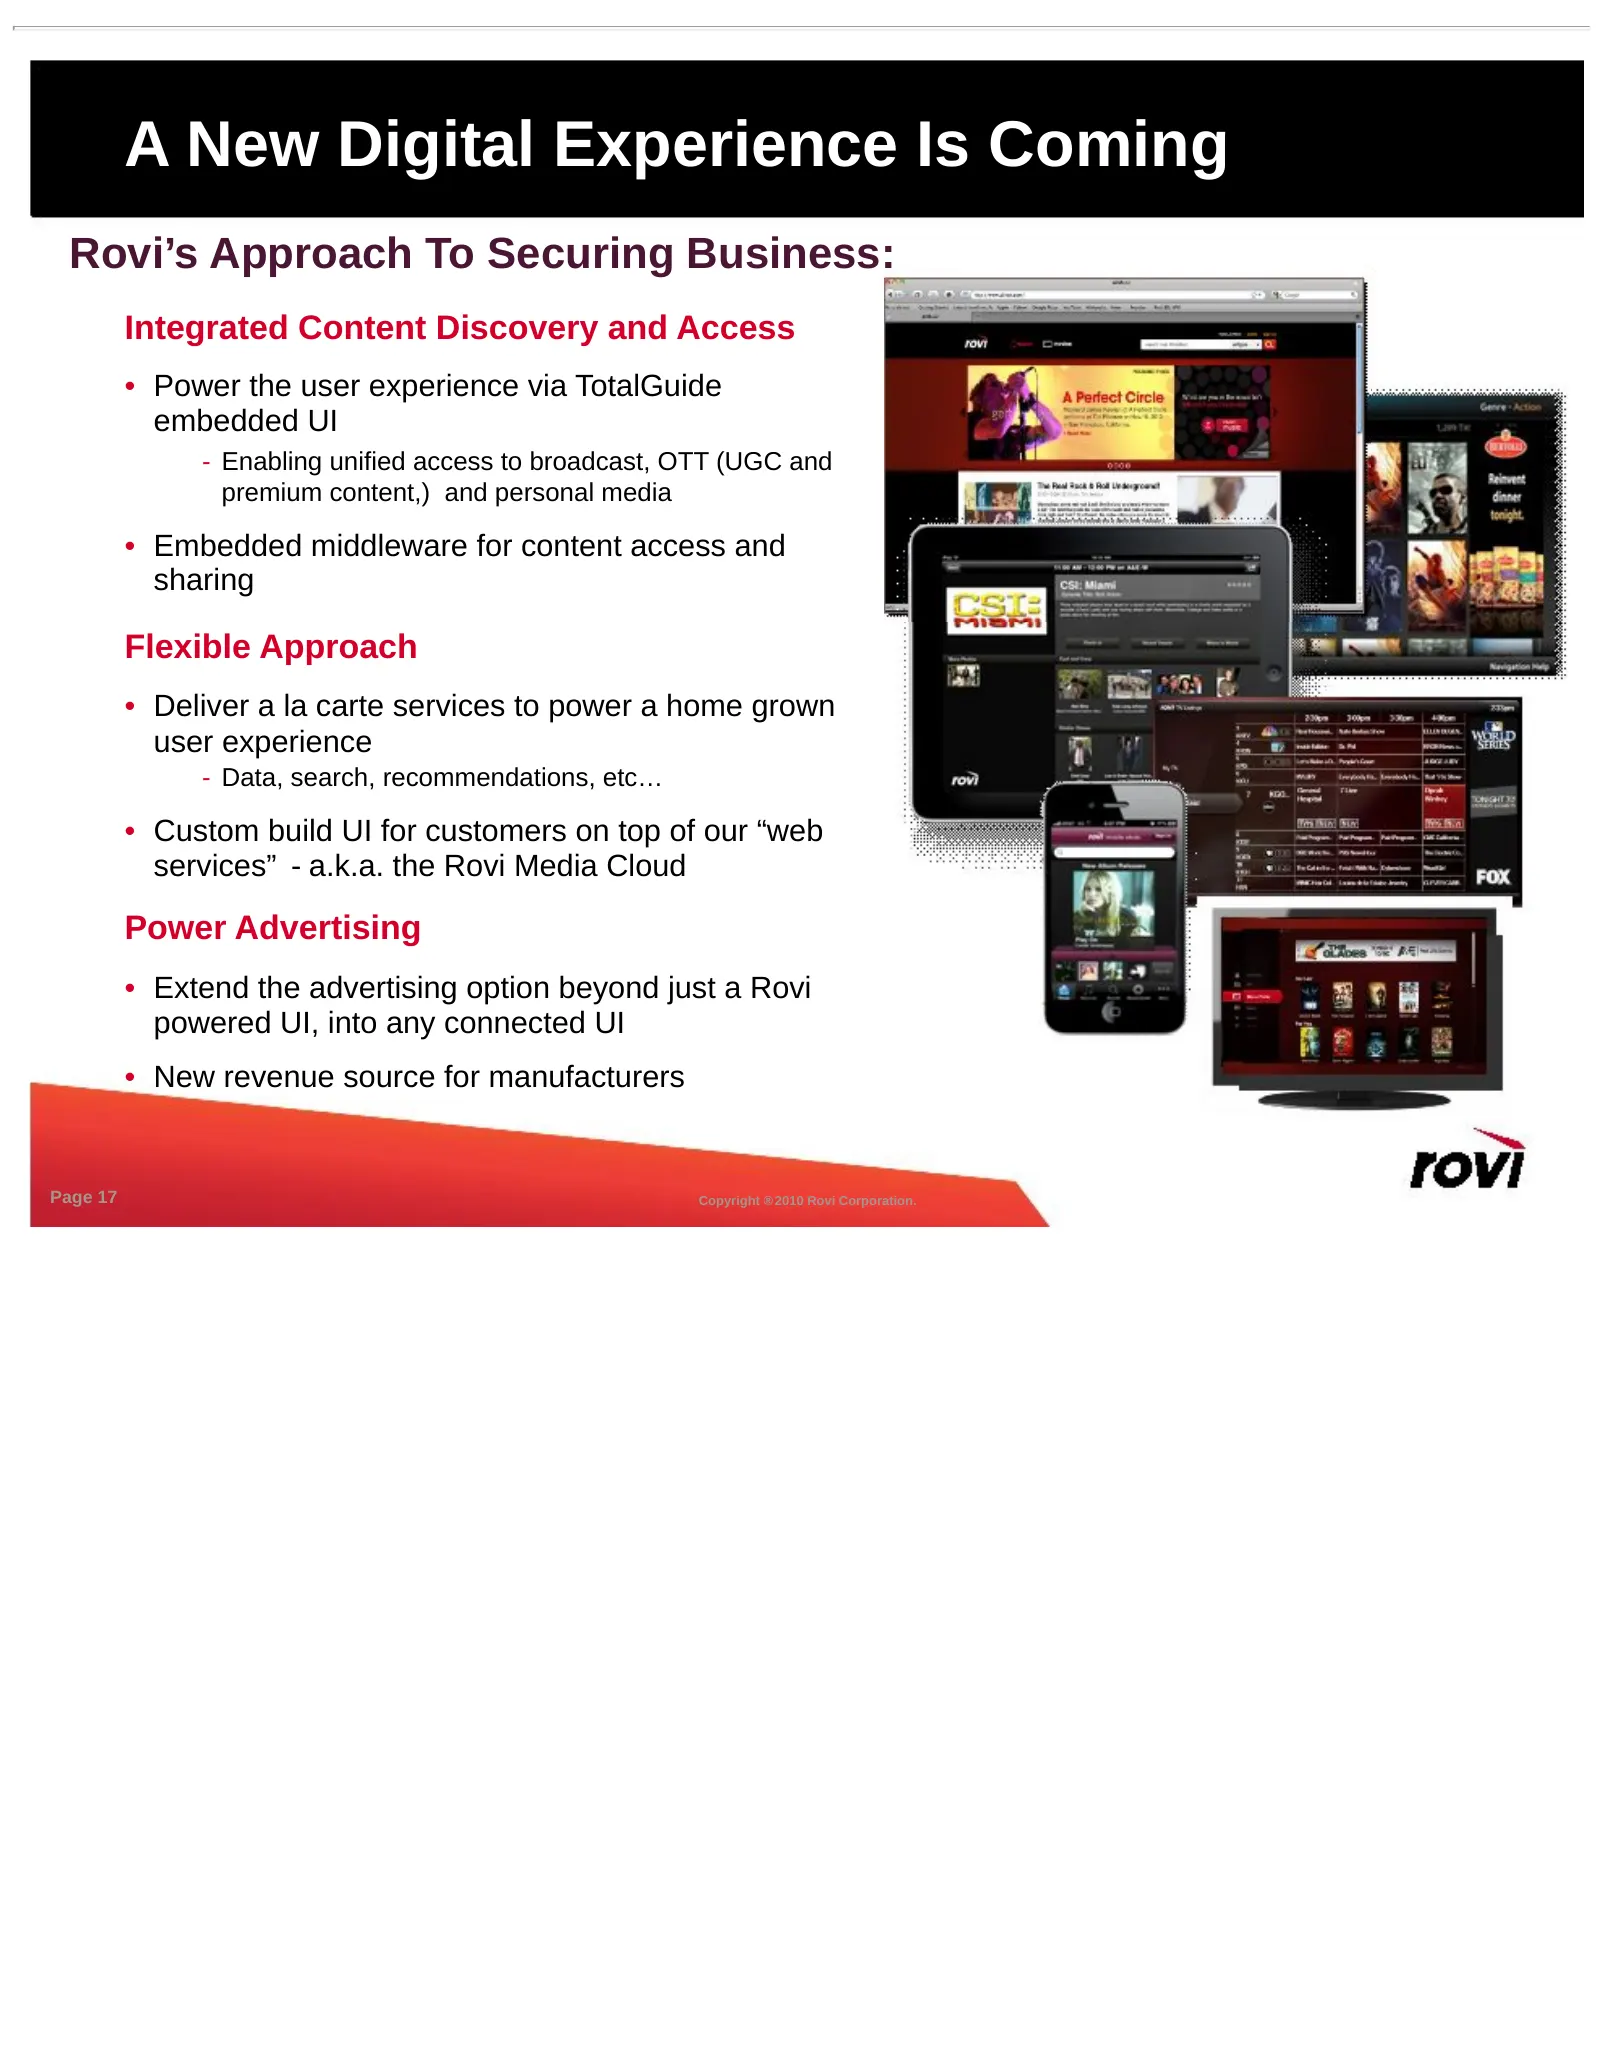
A New Digital Experience Is Coming Rovi’s Approach To Securing Business: Integrated Content Discovery and Access • Power the user experience via TotalGuide embedded UI - Enabling unified access to broadcast, OTT (UGC and premium content,) and personal media • Embedded middleware for content access a
Slide 18: Sonic
Sonic • Signed definitive agreement to acquire Sonic in a cash and stock transaction - Announced December 22, 2010 and valued at ~$720M - 55/45 - cash/stock transaction with a close targeted in Q1 • Employees:~1,000 • Key products - RoxioNow – video delivery platform • Movie and TV library of over 1
Slide 19: Expanding the Rovi Value Proposition
Expanding the Rovi Value Proposition • Expanded addressable marketplace - Rovi: Service providers, CE makers, content owners - Sonic: Retail partners, content owners, mobile carriers, consumers • Envision bringing each company’s products to each others targets • Expand solution offering for services
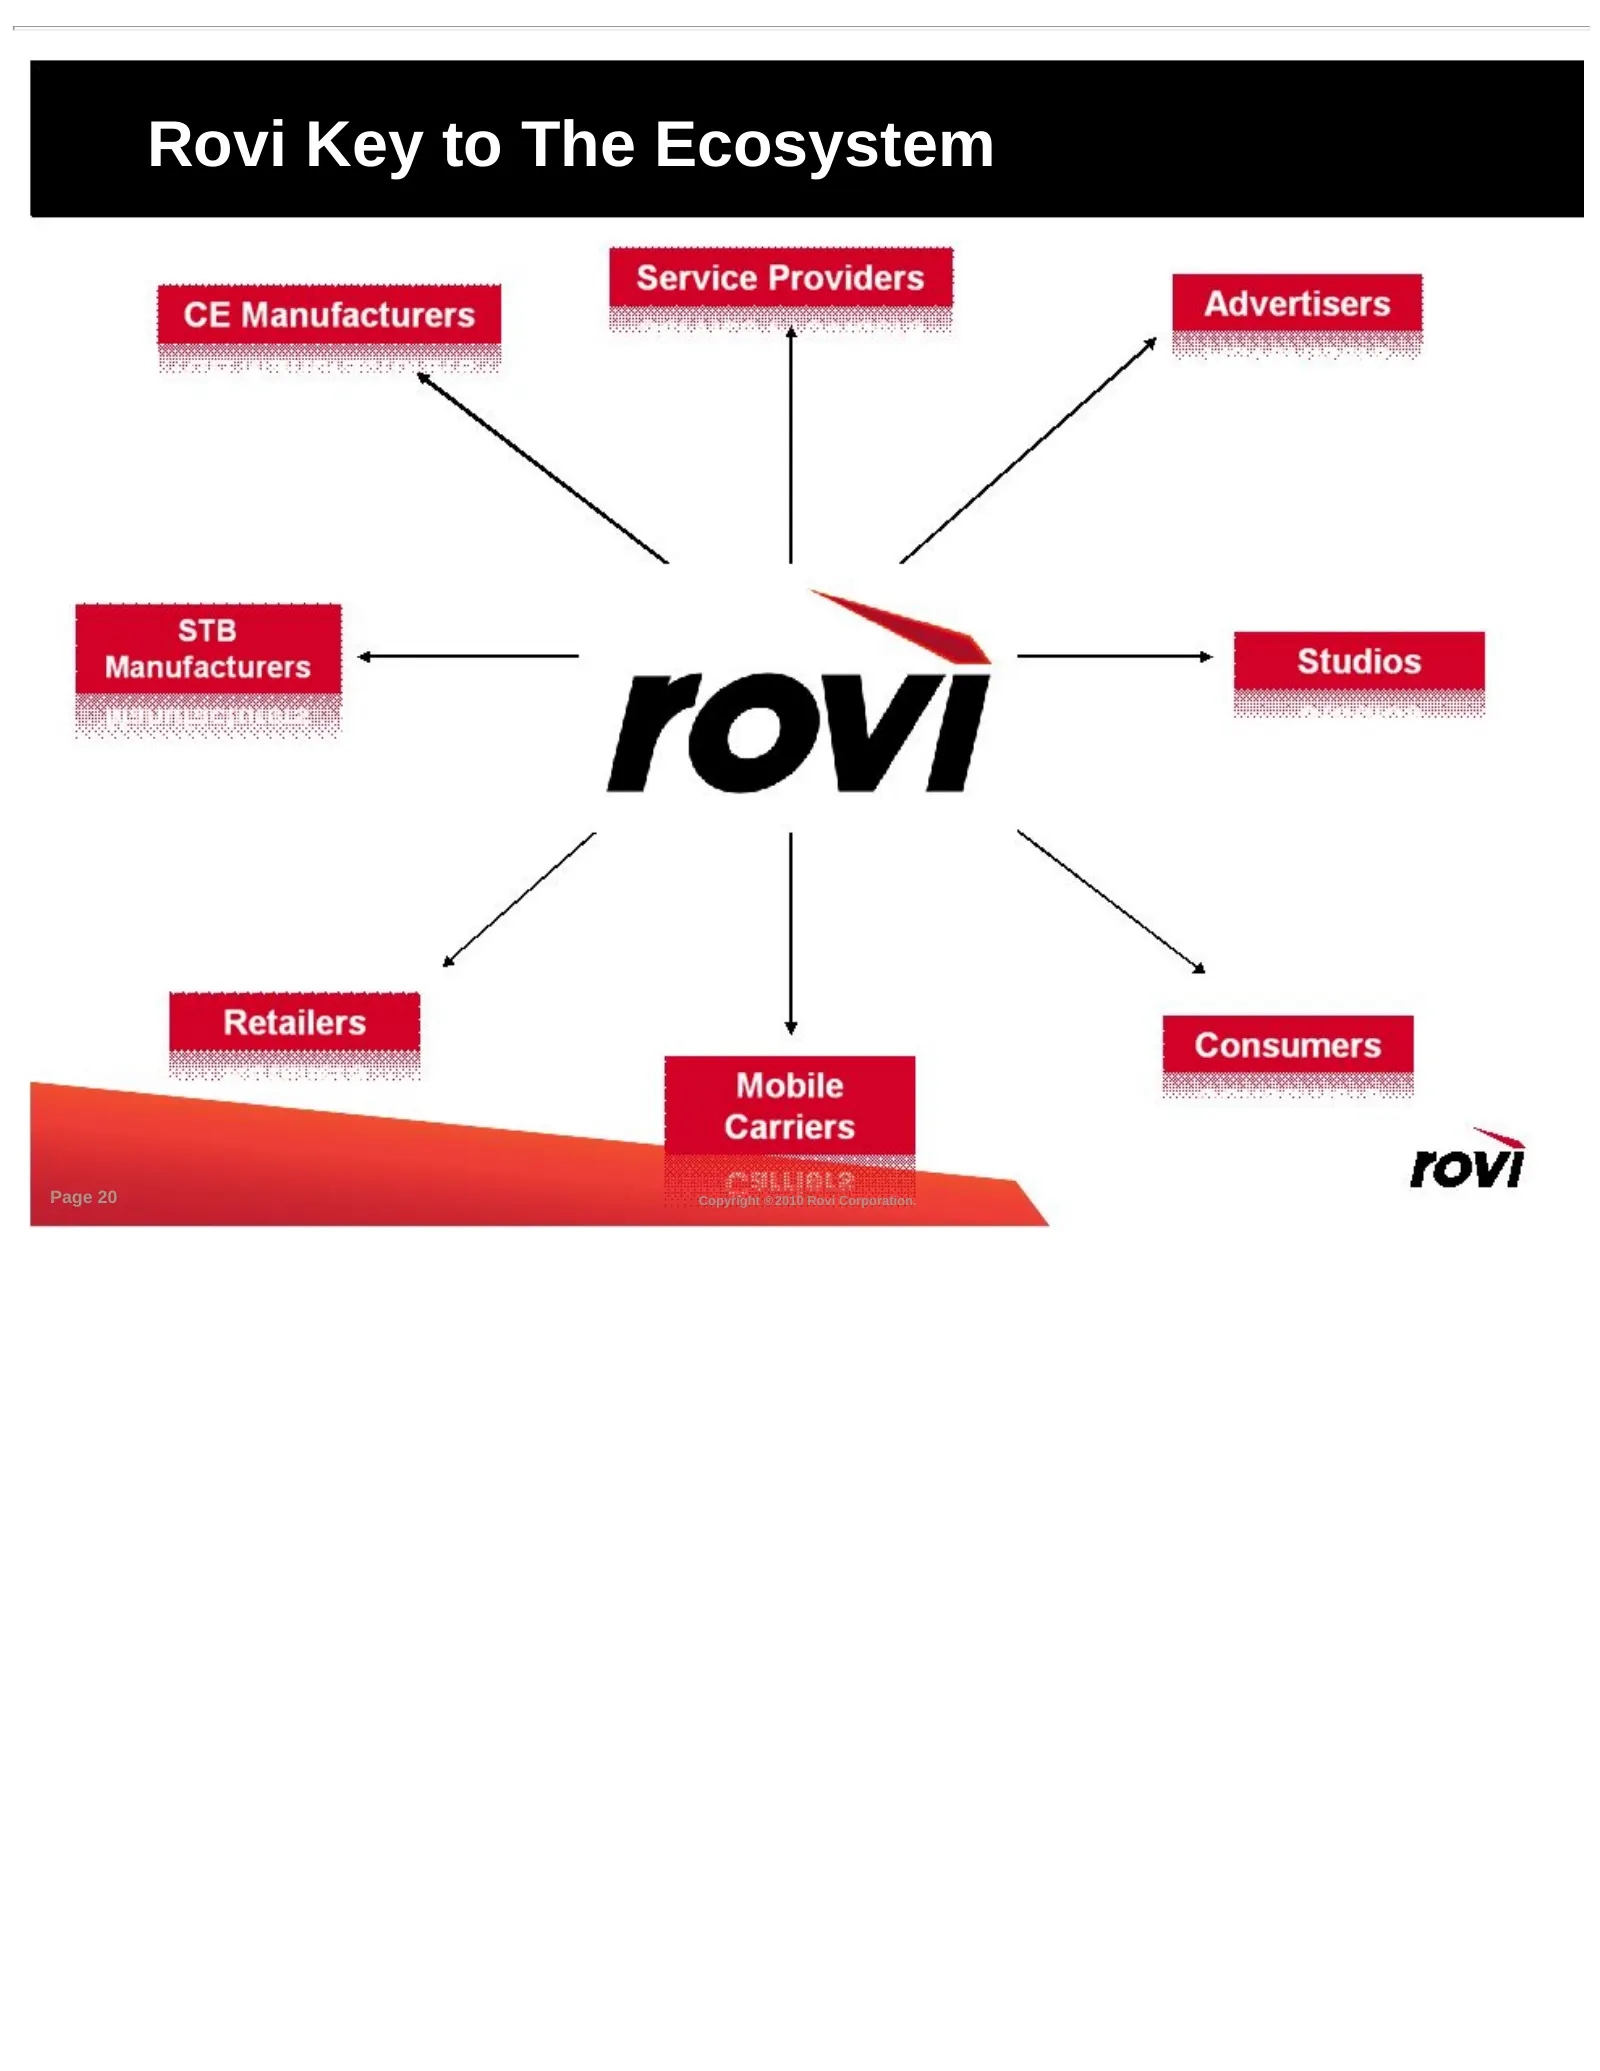
Slide 20: Rovi Key to The Ecosystem
Rovi Key to The Ecosystem Page 20 Copyright ® 2010 Rovi Corporation.
Slide 21: Summary Investment Highlights
Summary Investment Highlights • Compelling strategic combination of complementary solutions - Guidance + Connectivity + Metadata + Security - Independent purveyor of key pillars of Digital Media technology requirements • Strong competitive position - Proven and growing patent portfolio with long rem
Slide 22: New Solutions
* * * * * New Solutions Copyright ® 2010 Rovi Corporation. Company Confidential.
Slide 23: Rovi at CES
Rovi at CES • Key PR - Introducing the Rovi Media Cloud • Set of Web services customers can use to build their own entertainment applications. • Not limited to any single customer type, can span CE, Service providers, application developers and even studios and retailers looking to build their own e
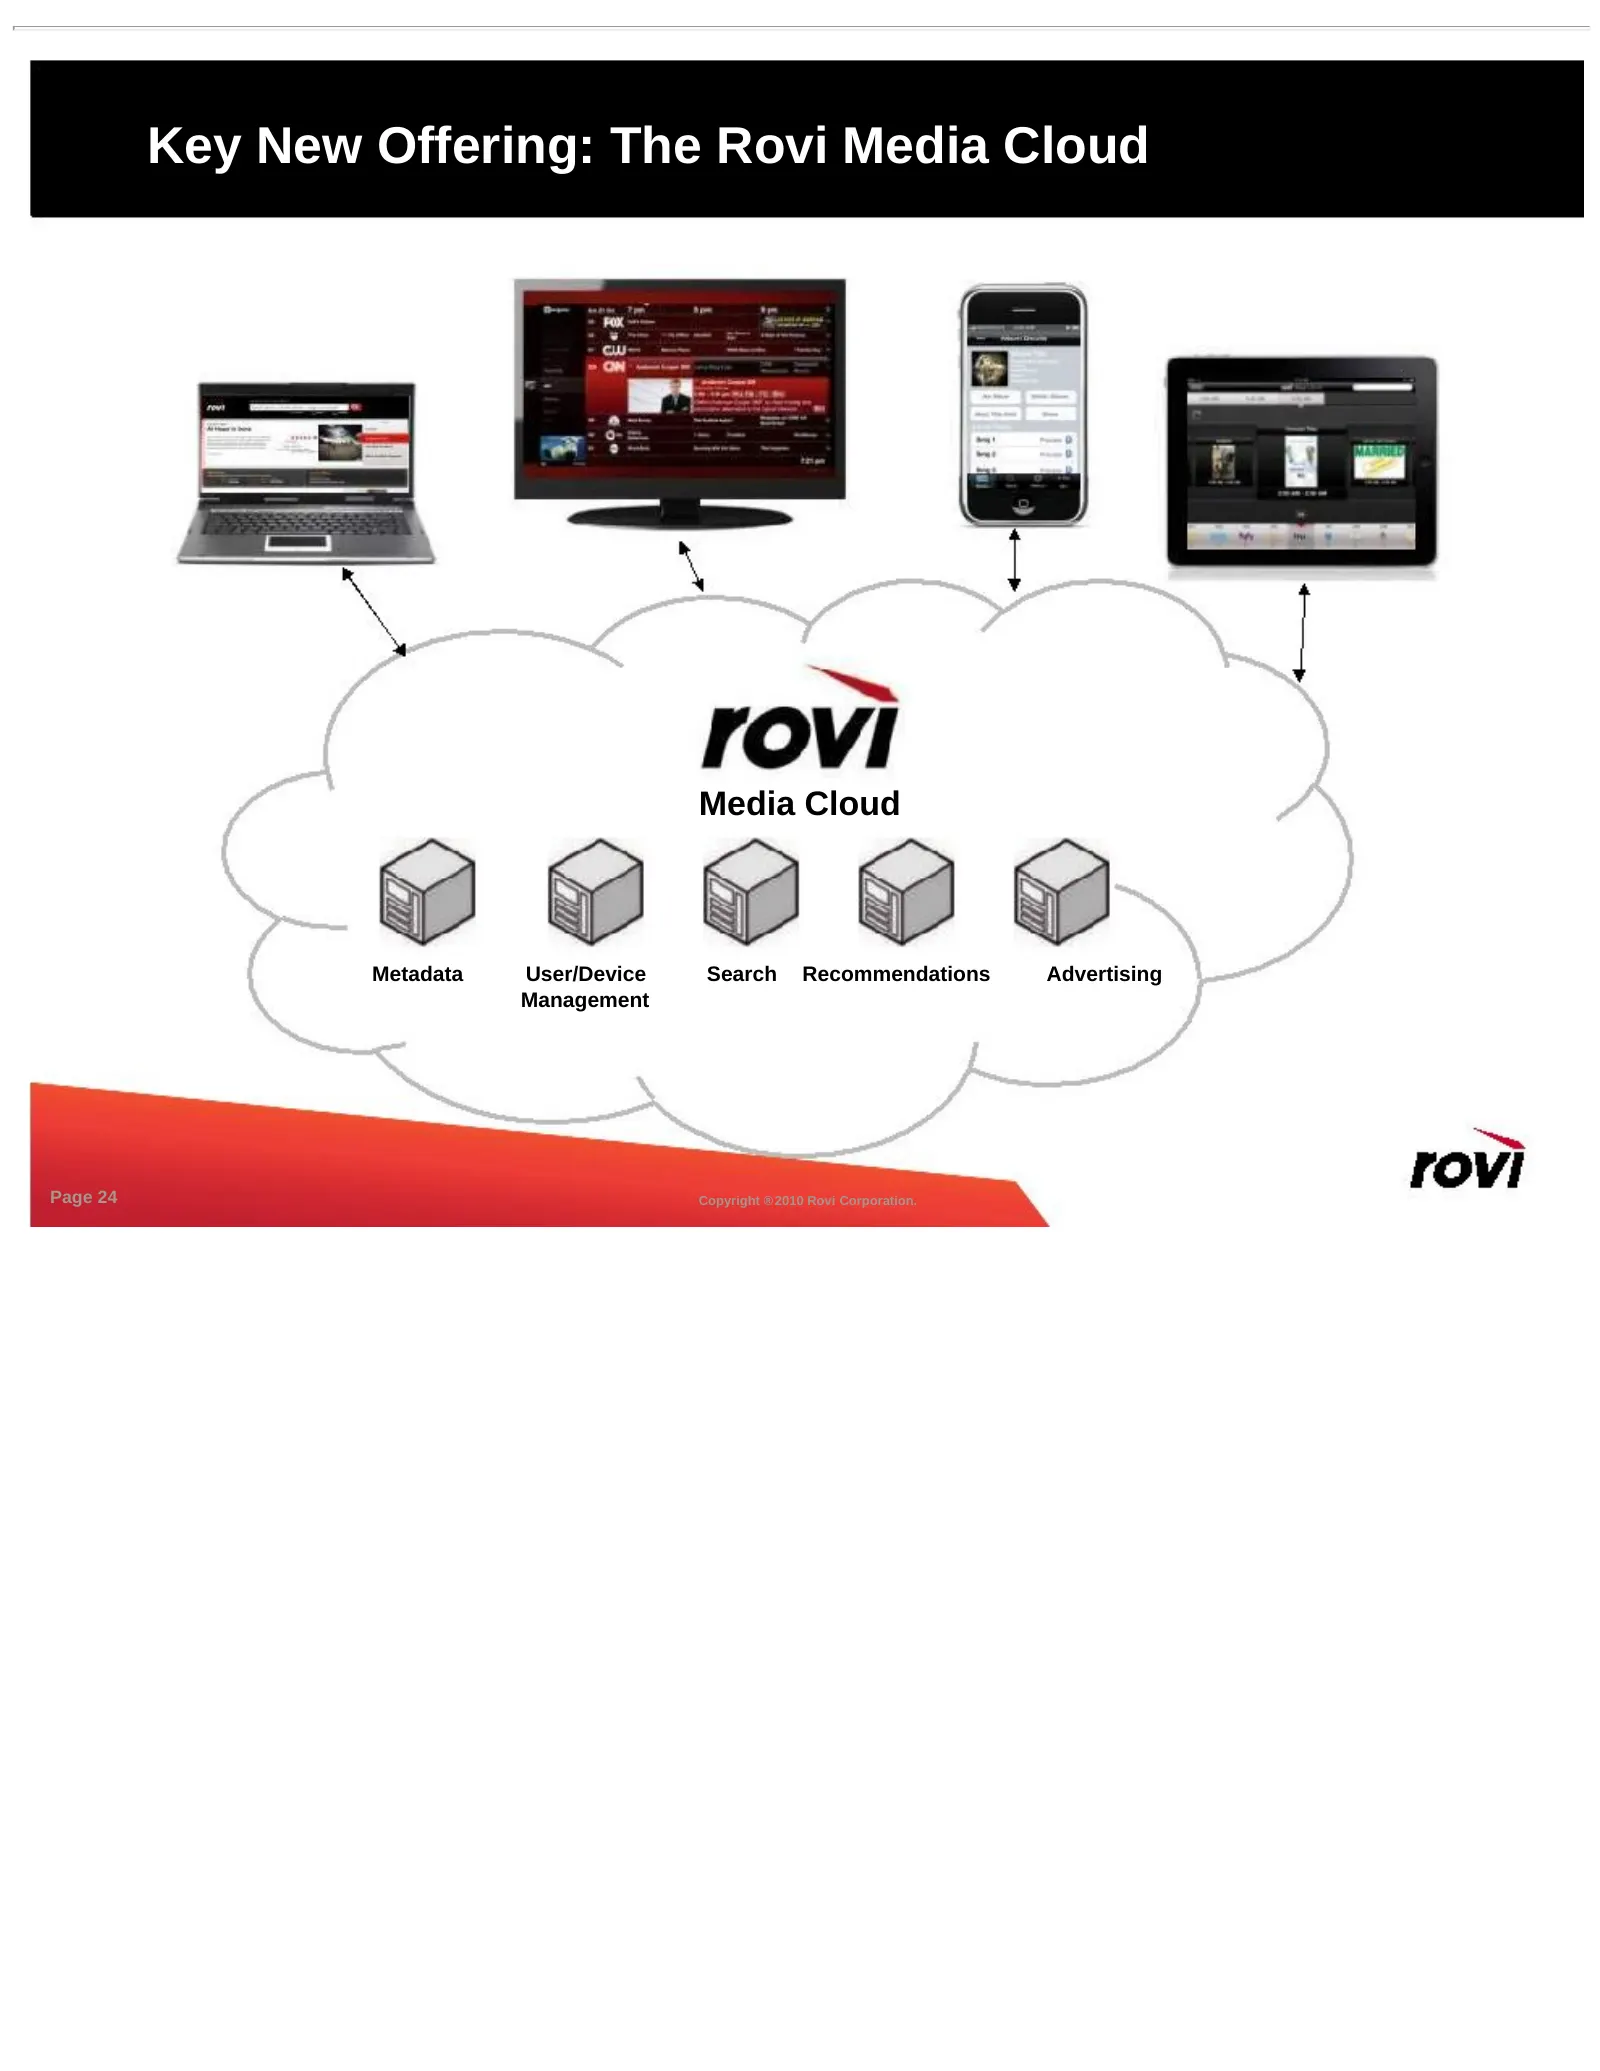
Slide 24: Key New Offering: The Rovi Media Cloud
Key New Offering: The Rovi Media Cloud Media Cloud Metadata User/Device Search Recommendations Advertising Management Page 24 Copyright ® 2010 Rovi Corporation.
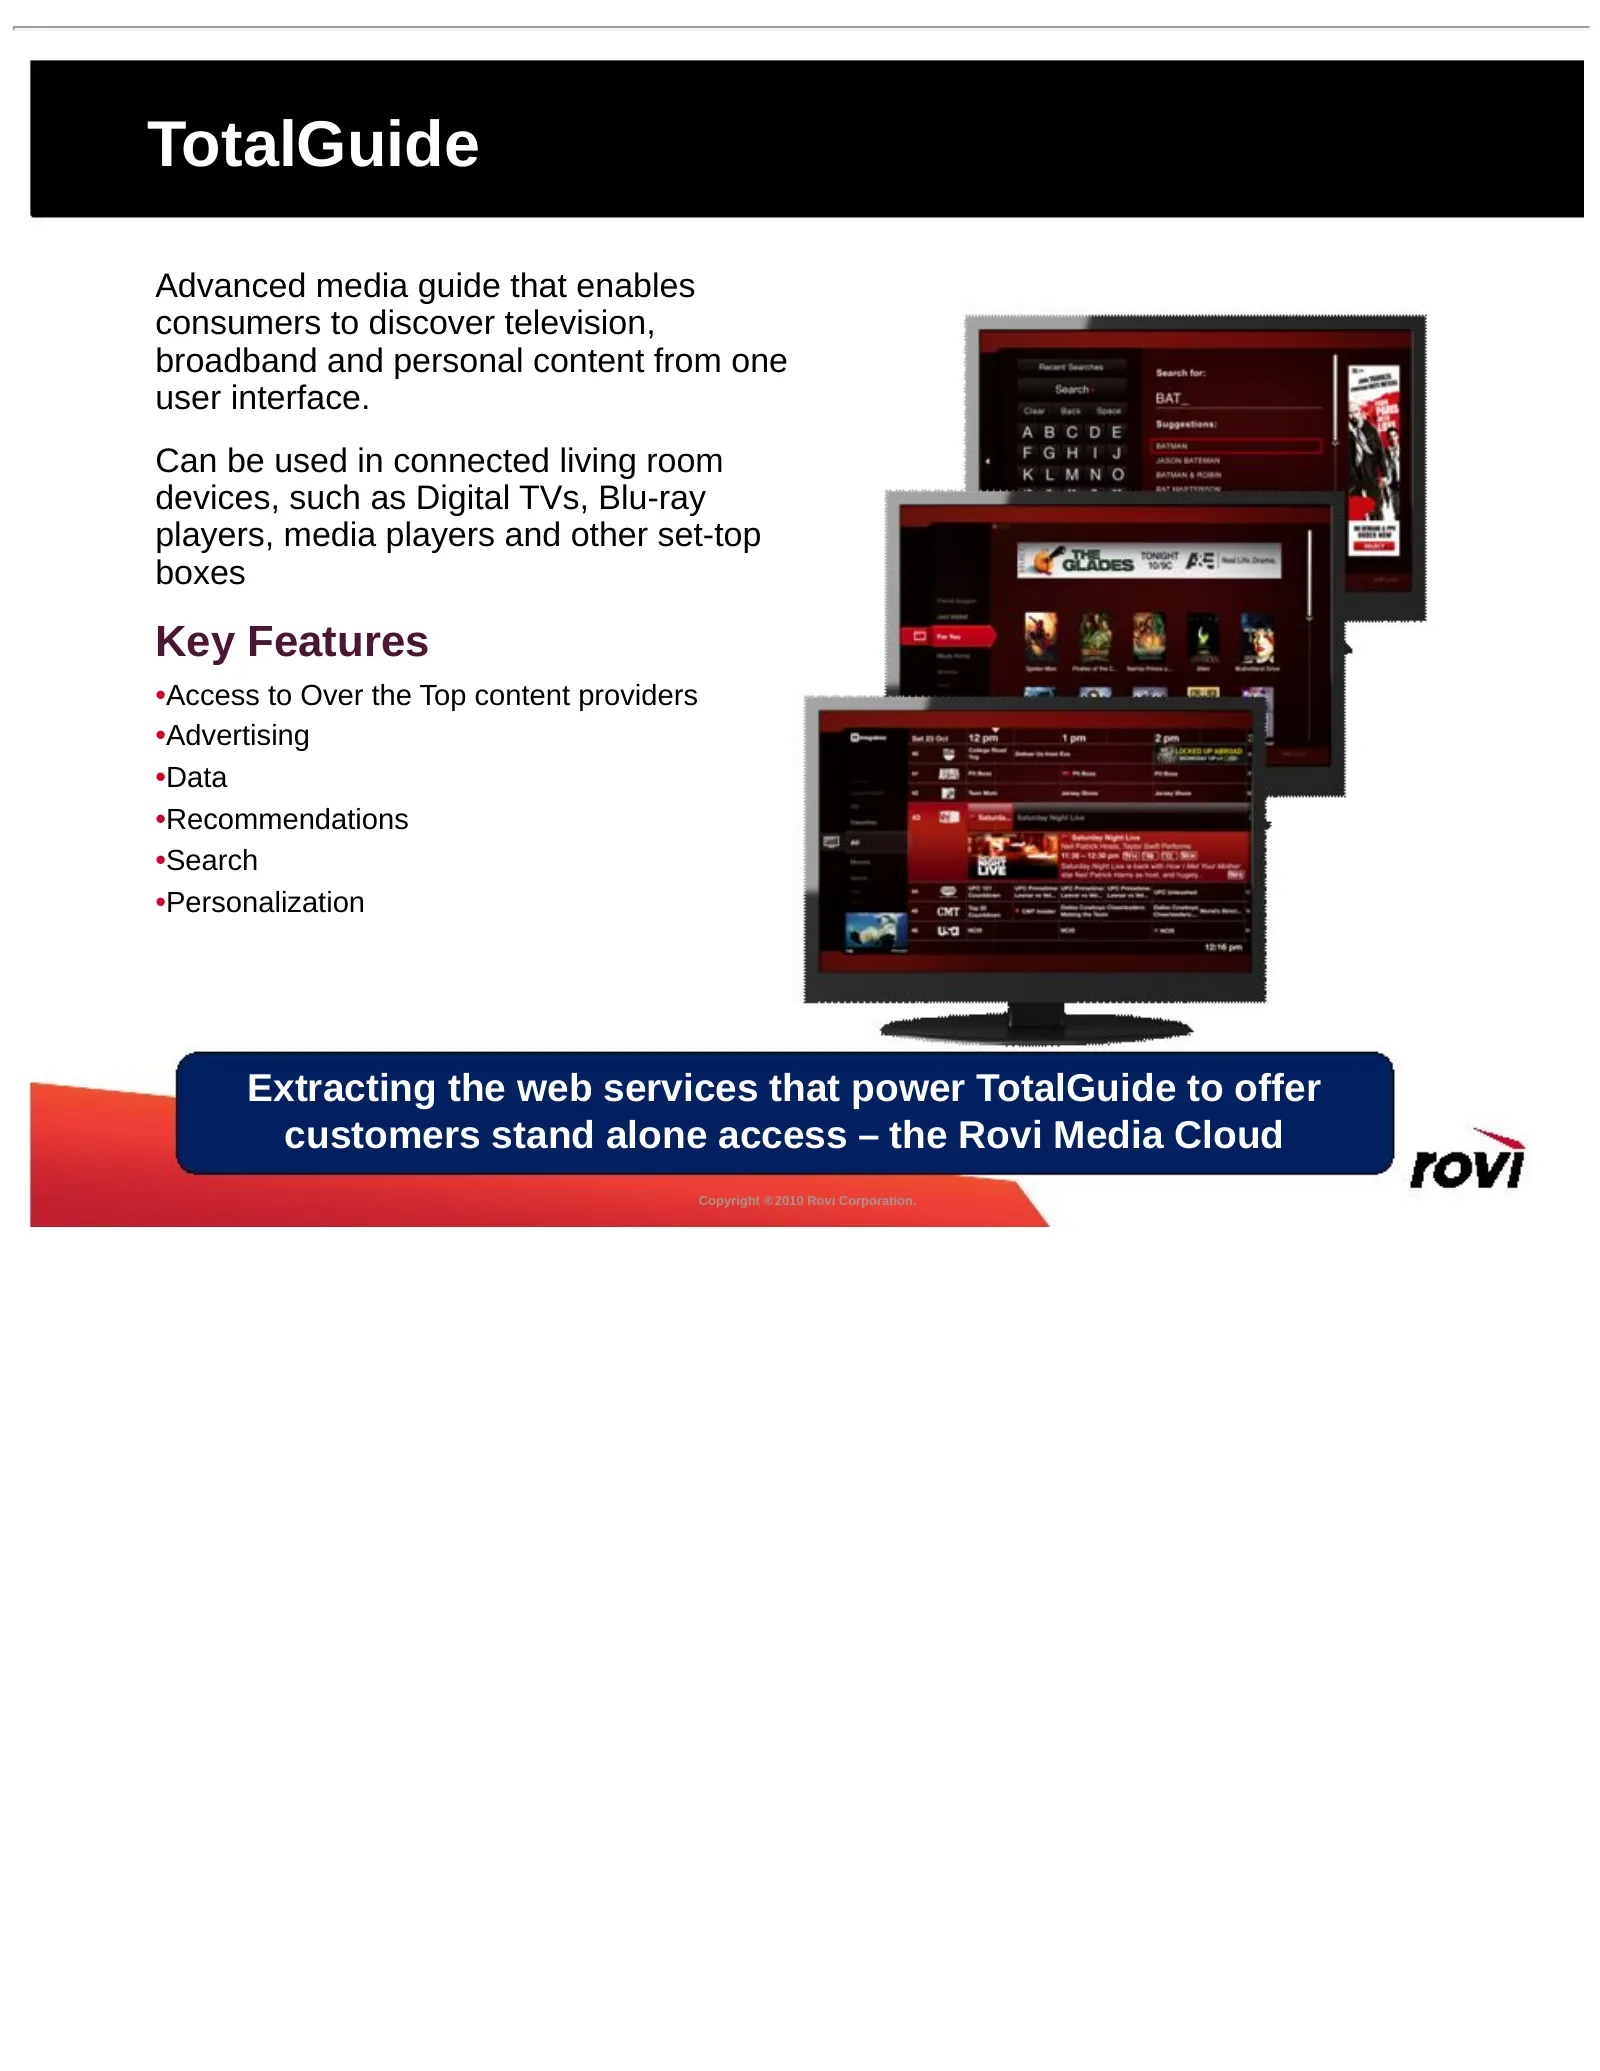
Slide 25: TotalGuide
TotalGuide Advanced media guide that enables consumers to discover television, broadband and personal content from one user interface. Can be used in connected living room devices, such as Digital TVs, Blu-ray players, media players and other set-top boxes Key Features •Access to Over the Top conten
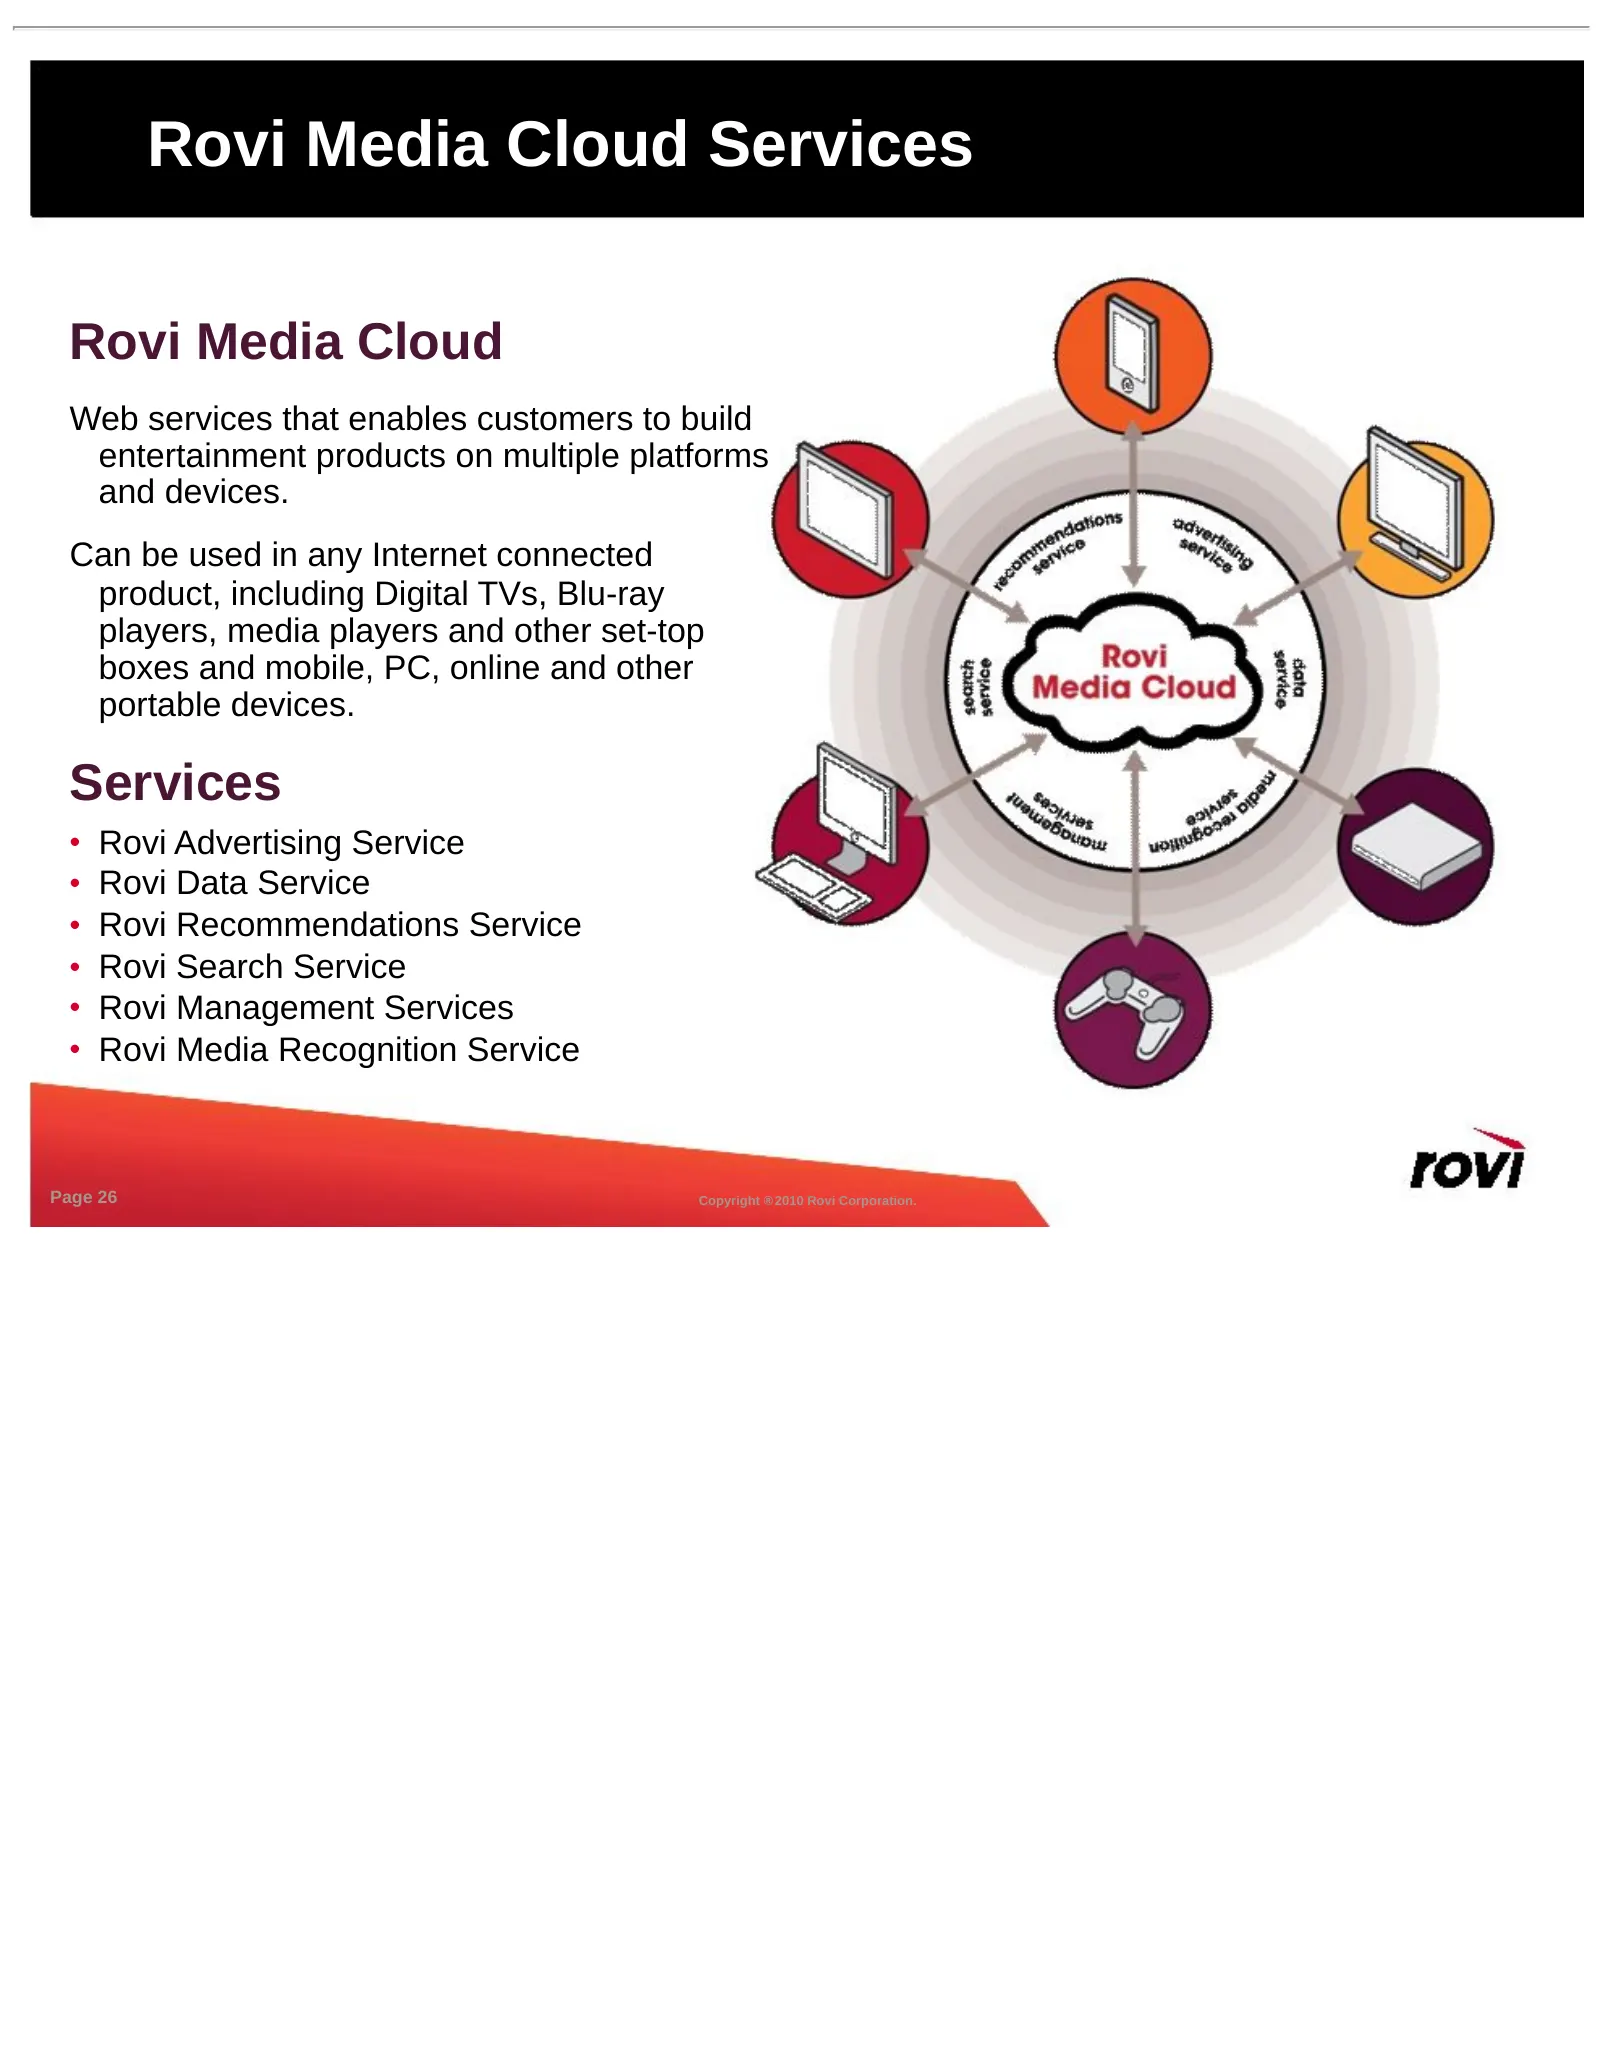
Slide 26: Rovi Media Cloud Services
Rovi Media Cloud Services Rovi Media Cloud Web services that enables customers to build entertainment products on multiple platforms and devices. Can be used in any Internet connected product, including Digital TVs, Blu-ray players, media players and other set-top boxes and mobile, PC, online and ot
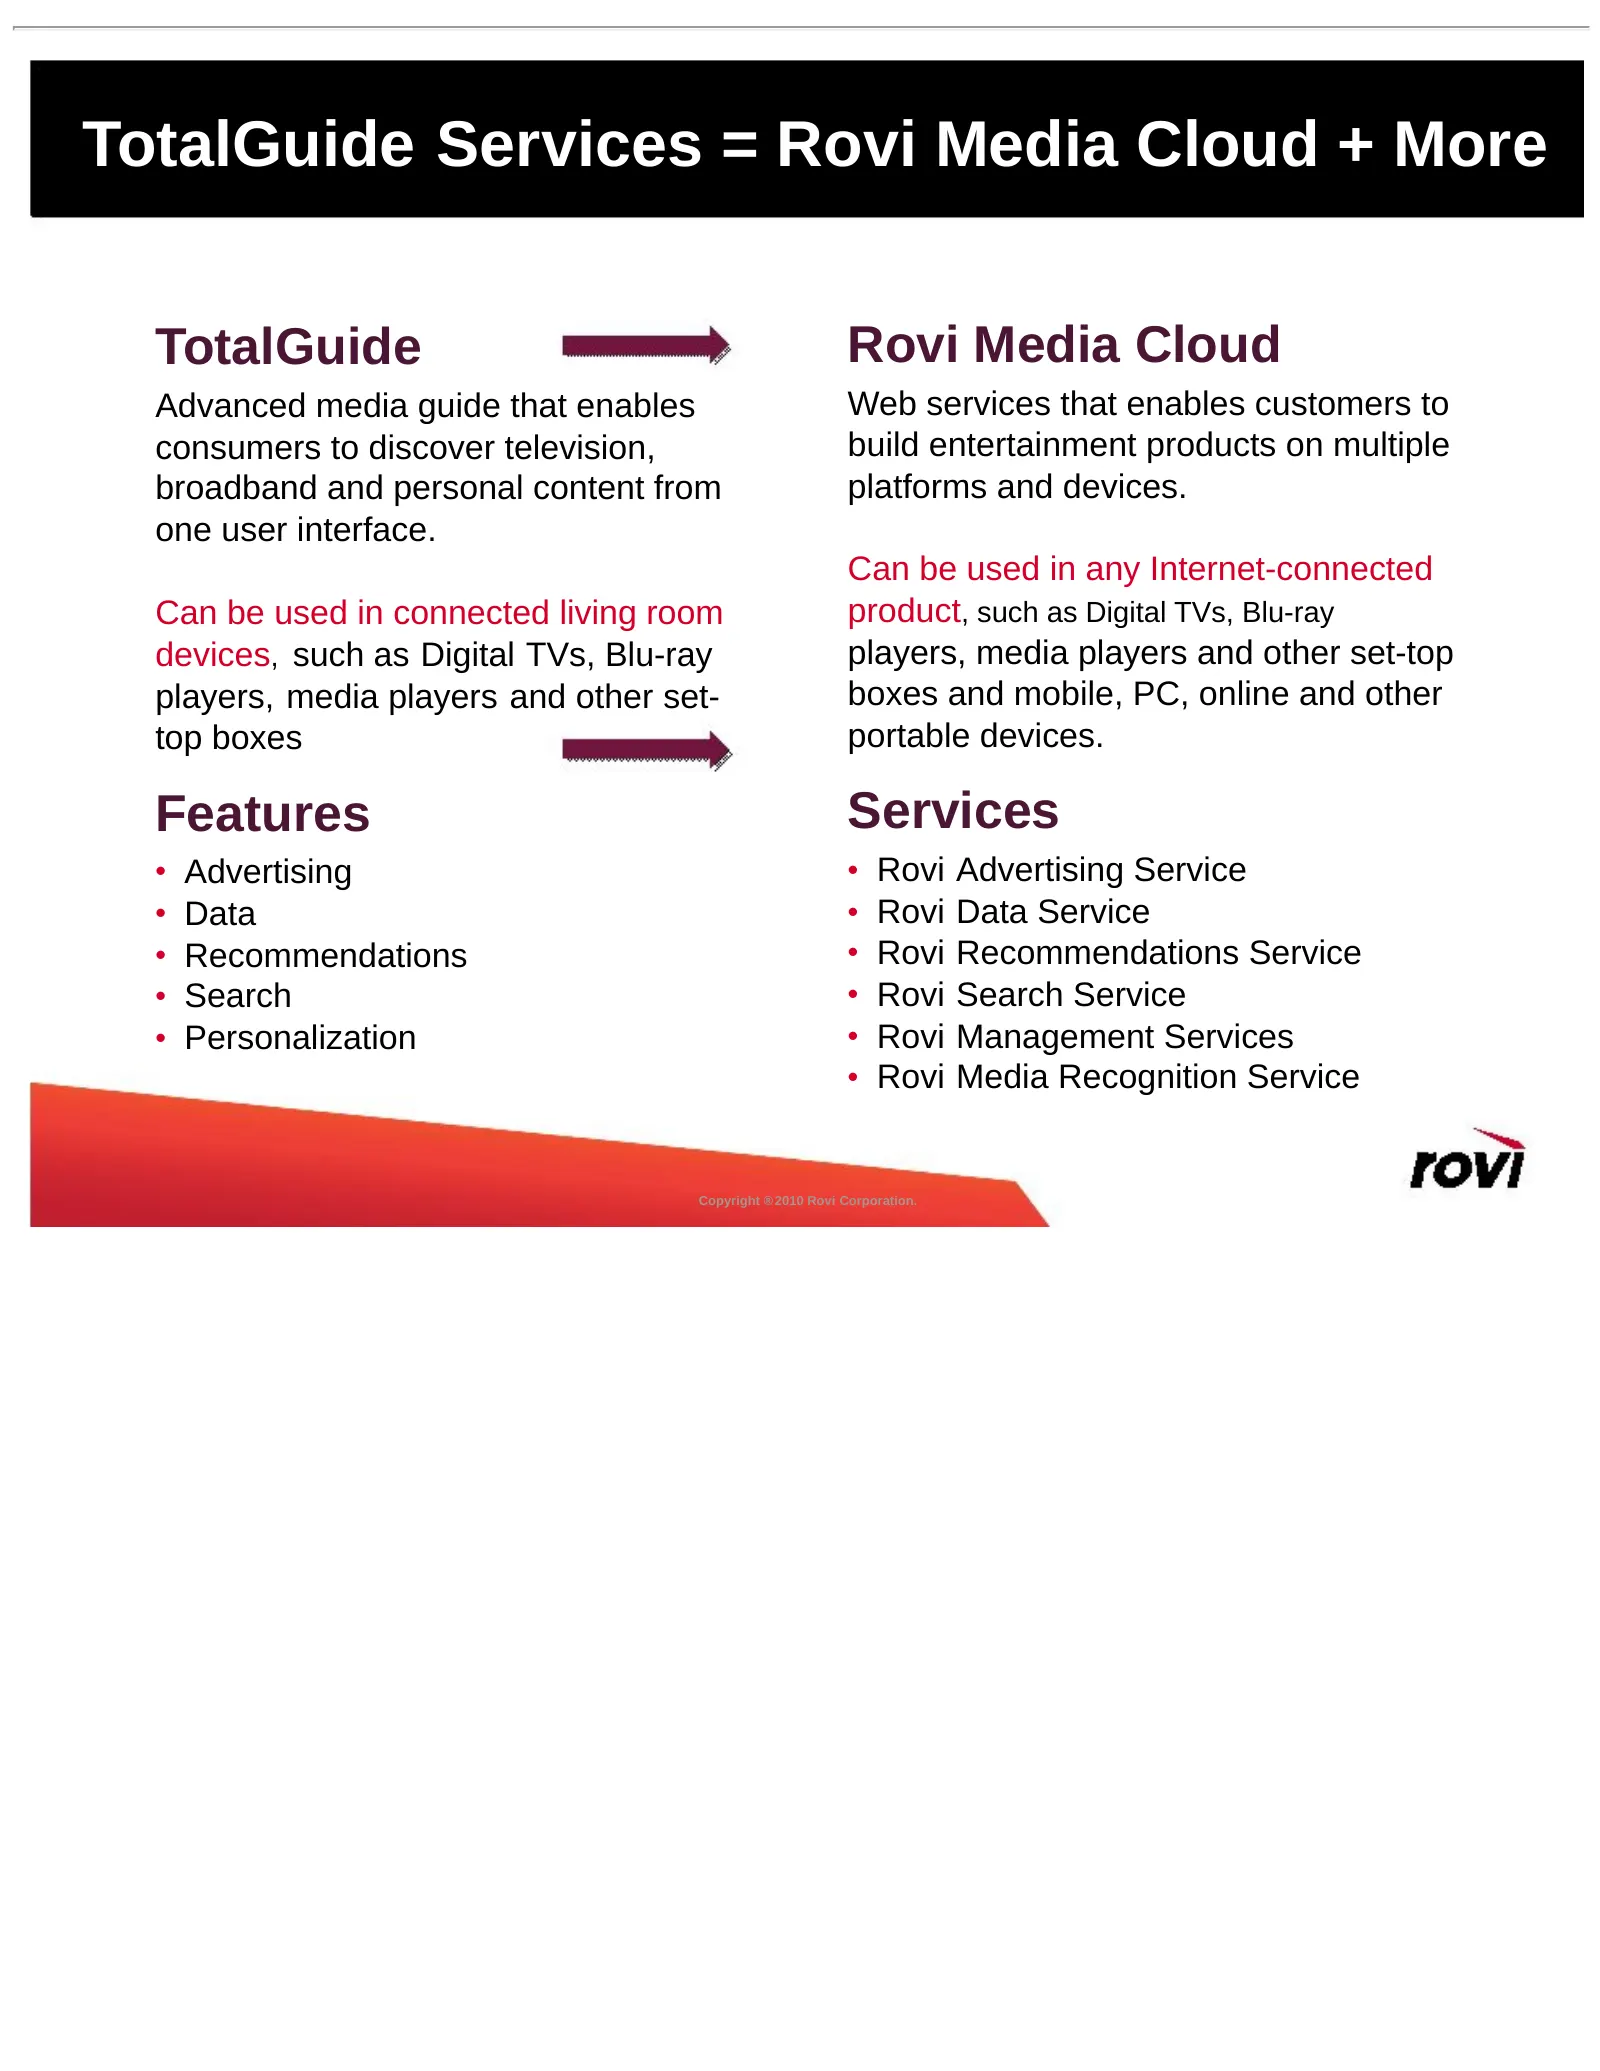
Slide 27: TotalGuide Services = Rovi Media Cloud + More
TotalGuide Services = Rovi Media Cloud + More TotalGuide Rovi Media Cloud Advanced media guide that enables Web services that enables customers to consumers to discover television, build entertainment products on multiple broadband and personal content from platforms and devices. one user interface.
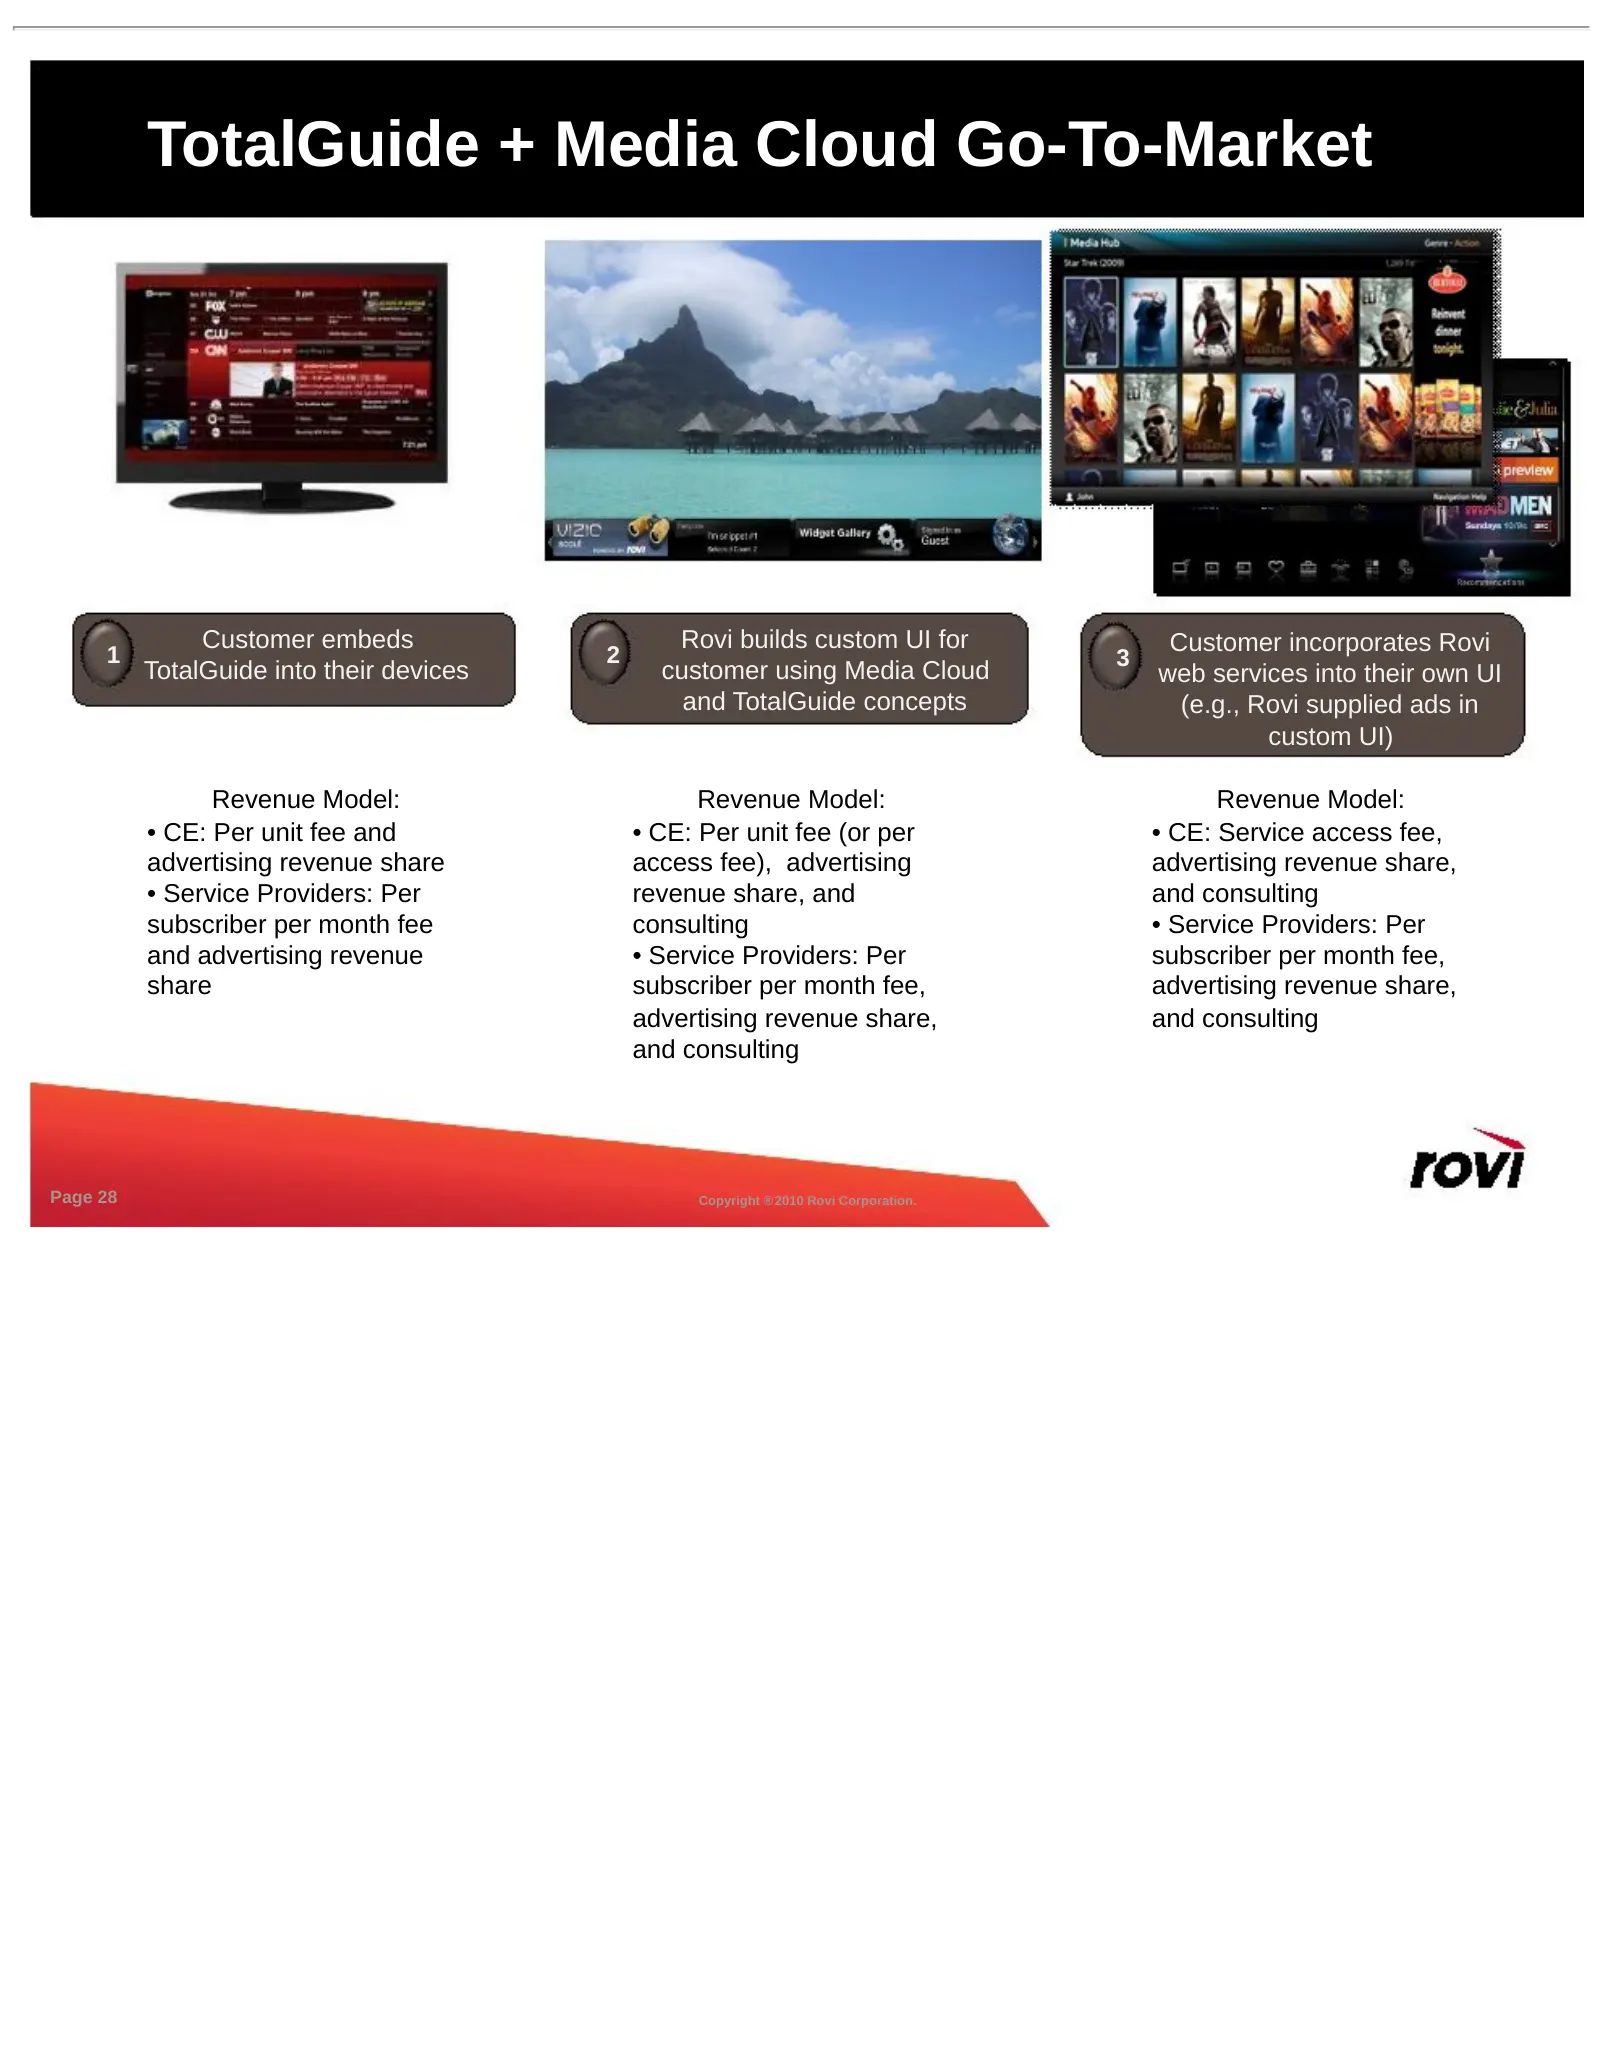
Slide 28: TotalGuide + Media Cloud Go-To-Market
TotalGuide + Media Cloud Go-To-Market Customer embeds Rovi builds custom UI for Customer incorporates Rovi 1 2 3 TotalGuide into their devices customer using Media Cloud web services into their own UI and TotalGuide concepts (e.g., Rovi supplied ads in custom UI) Revenue Model: Revenue Model: Revenu
Slide 29: Rovi Media Cloud and TotalGuide for Service Providers
Rovi Media Cloud and TotalGuide for Service Providers st • Targeting initial customers signing up 1 half 2011 • Solution encompasses - TotalGuide – for advanced set top boxes • Targeting initial deployments late 2011 - TotalGuide lite – for older, non IP connected set top boxes • Targeting initial d
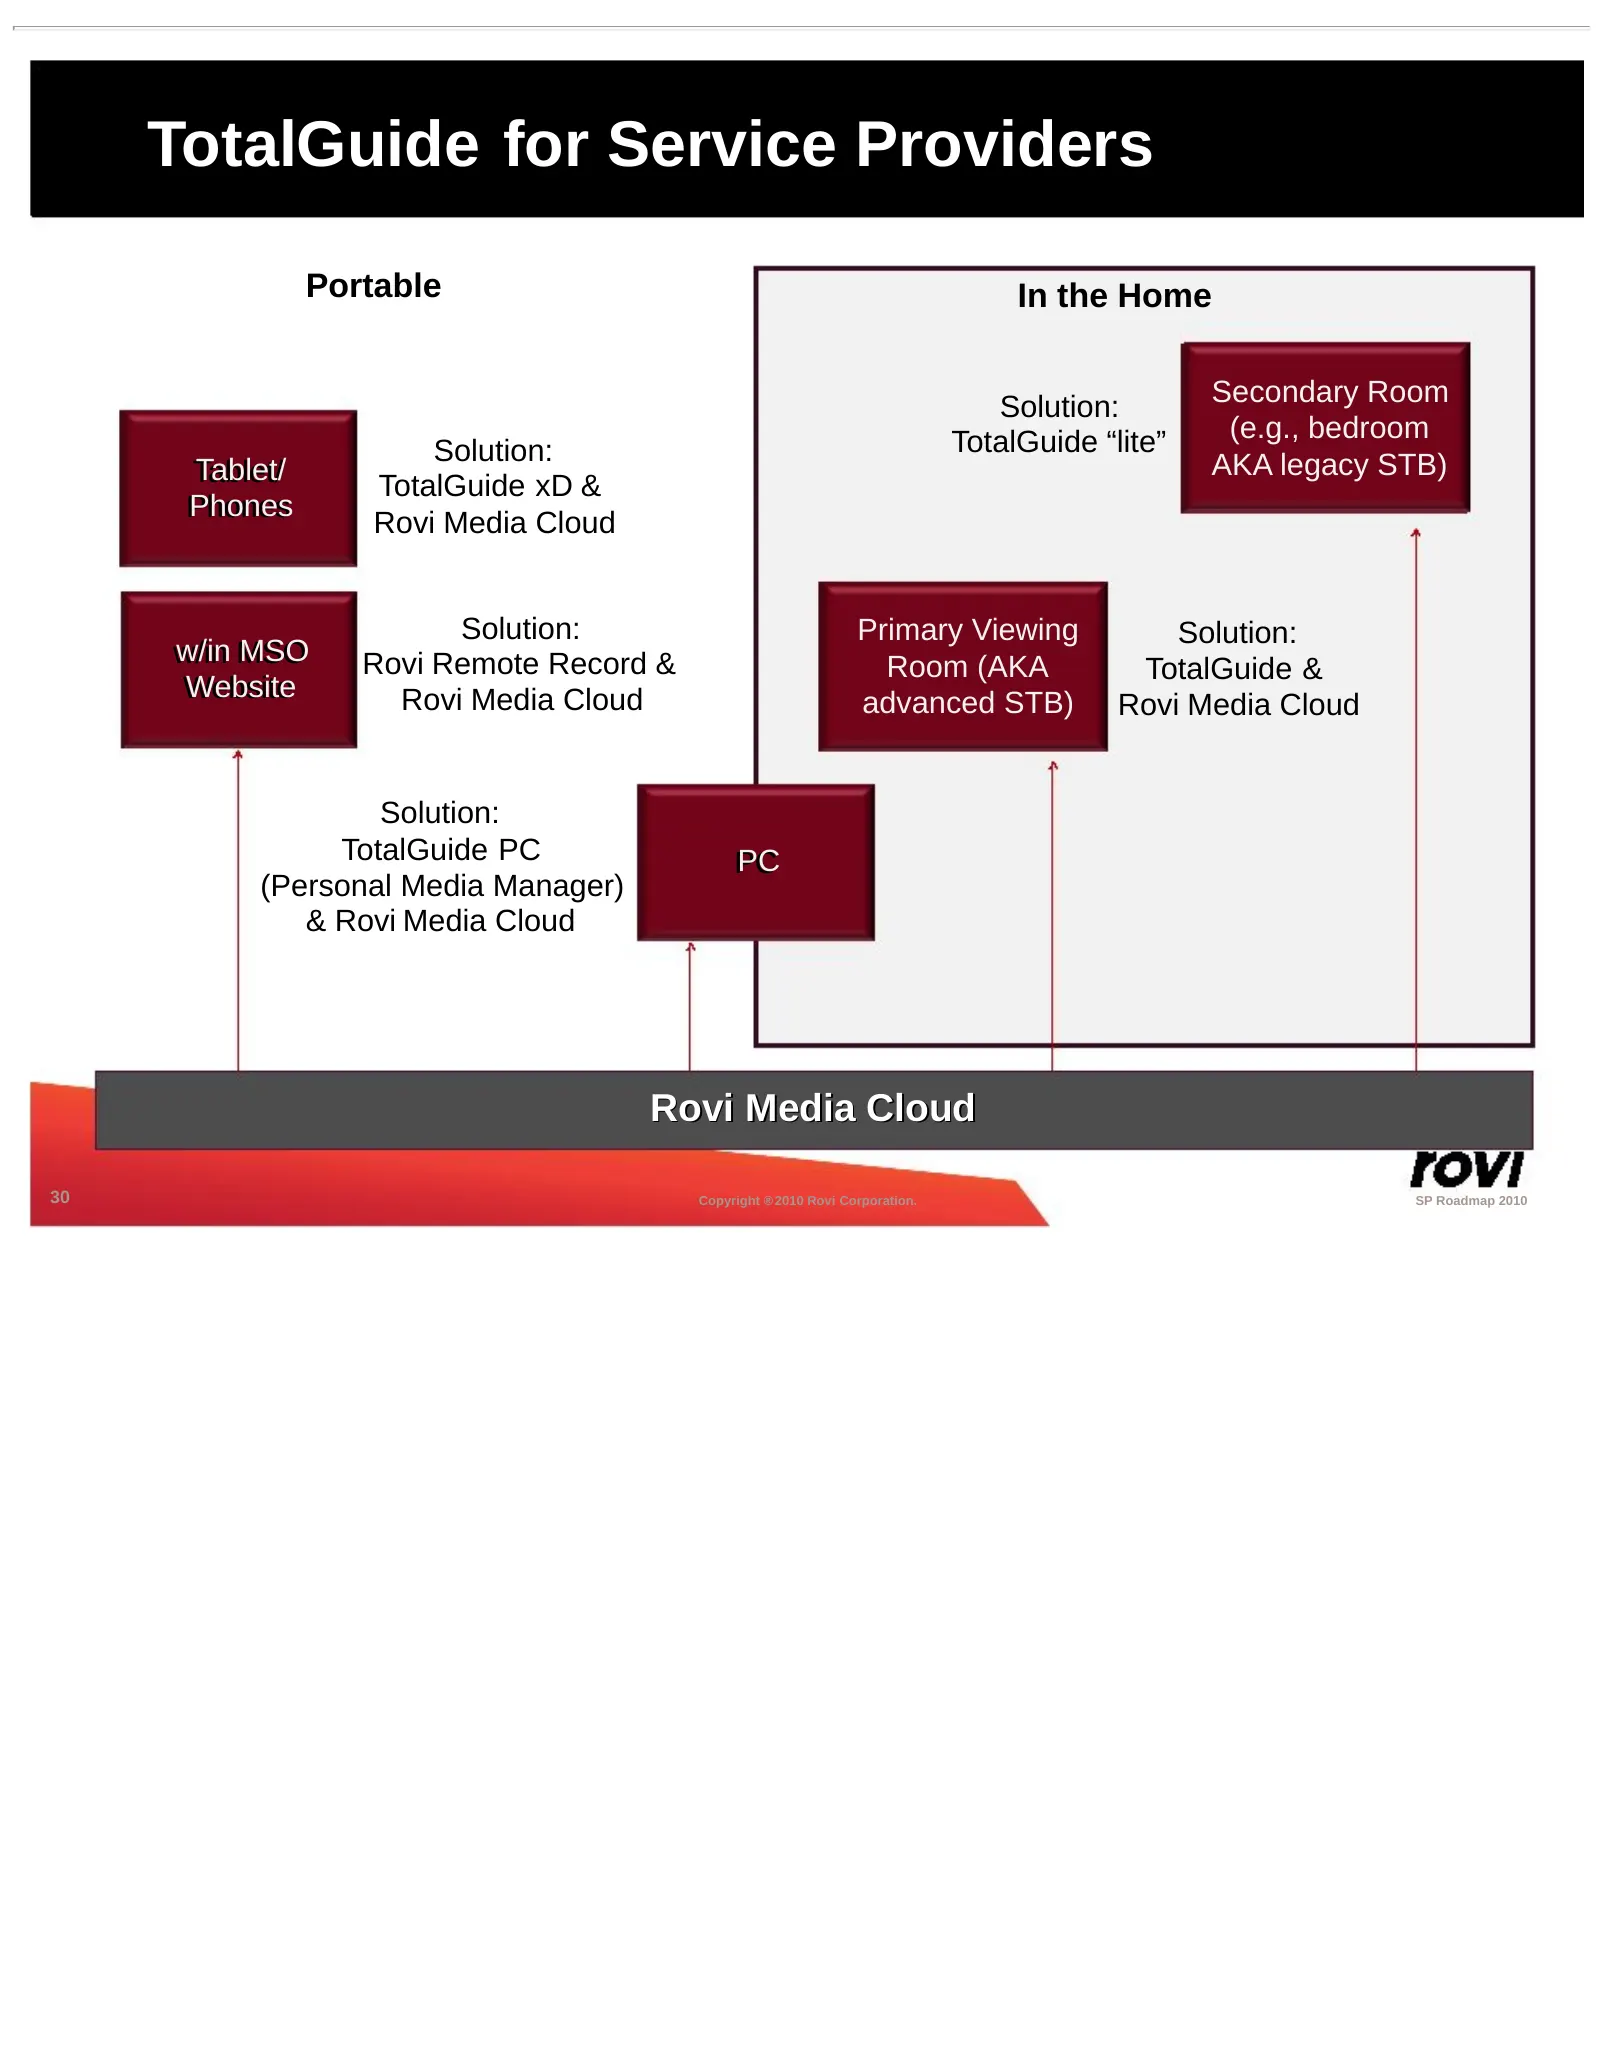
Slide 30: TotalGuide for Service Providers
TotalGuide for Service Providers Portable In the Home Solution: Secondary Room TotalGuide “lite” (e.g., bedroom Solution: AKA legacy STB) Tablet/ Tablet/ TotalGuide xD & Phones Phones Rovi Media Cloud Solution: Primary Viewing Solution: w/in MSO w/in MSO Rovi Remote Record & Room (AKA TotalGuide & W
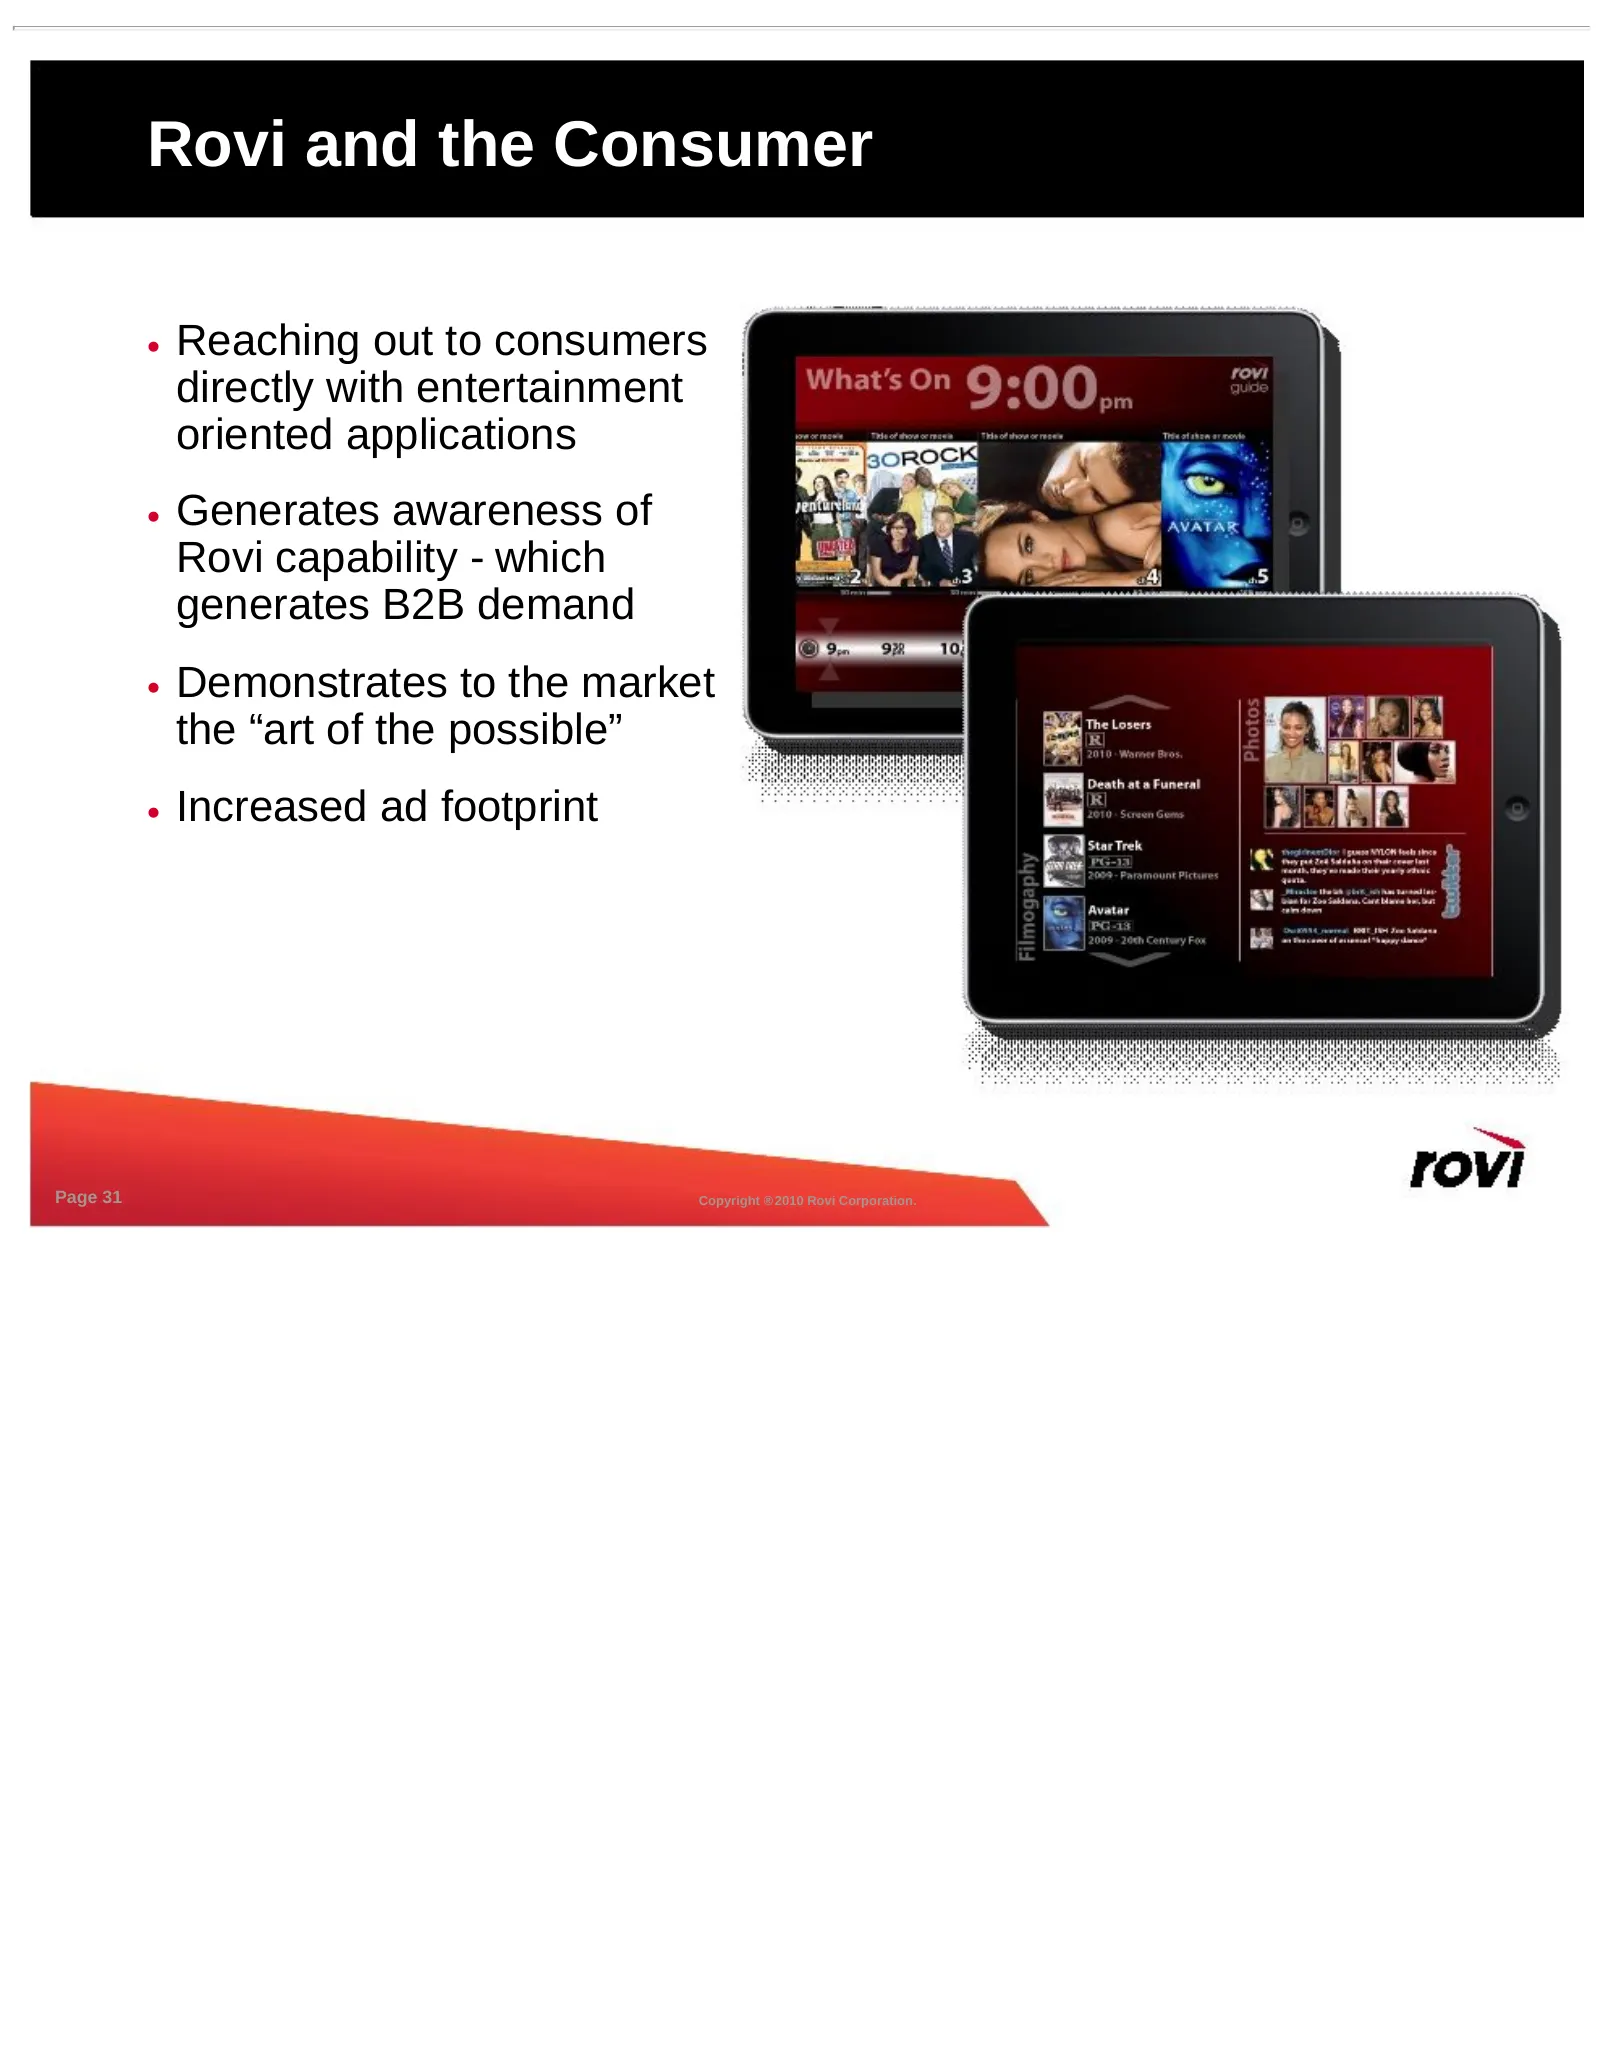
Slide 31: Rovi and the Consumer
Rovi and the Consumer • Reaching out to consumers directly with entertainment oriented applications • Generates awareness of Rovi capability - which generates B2B demand • Demonstrates to the market the “art of the possible” • Increased ad footprint Page 31 Copyright ® 2010 Rovi Corporation.
Slide 32: Advertising Update
Advertising Update ~~ rovi
Slide 33: Rovi Advertising Capability Today
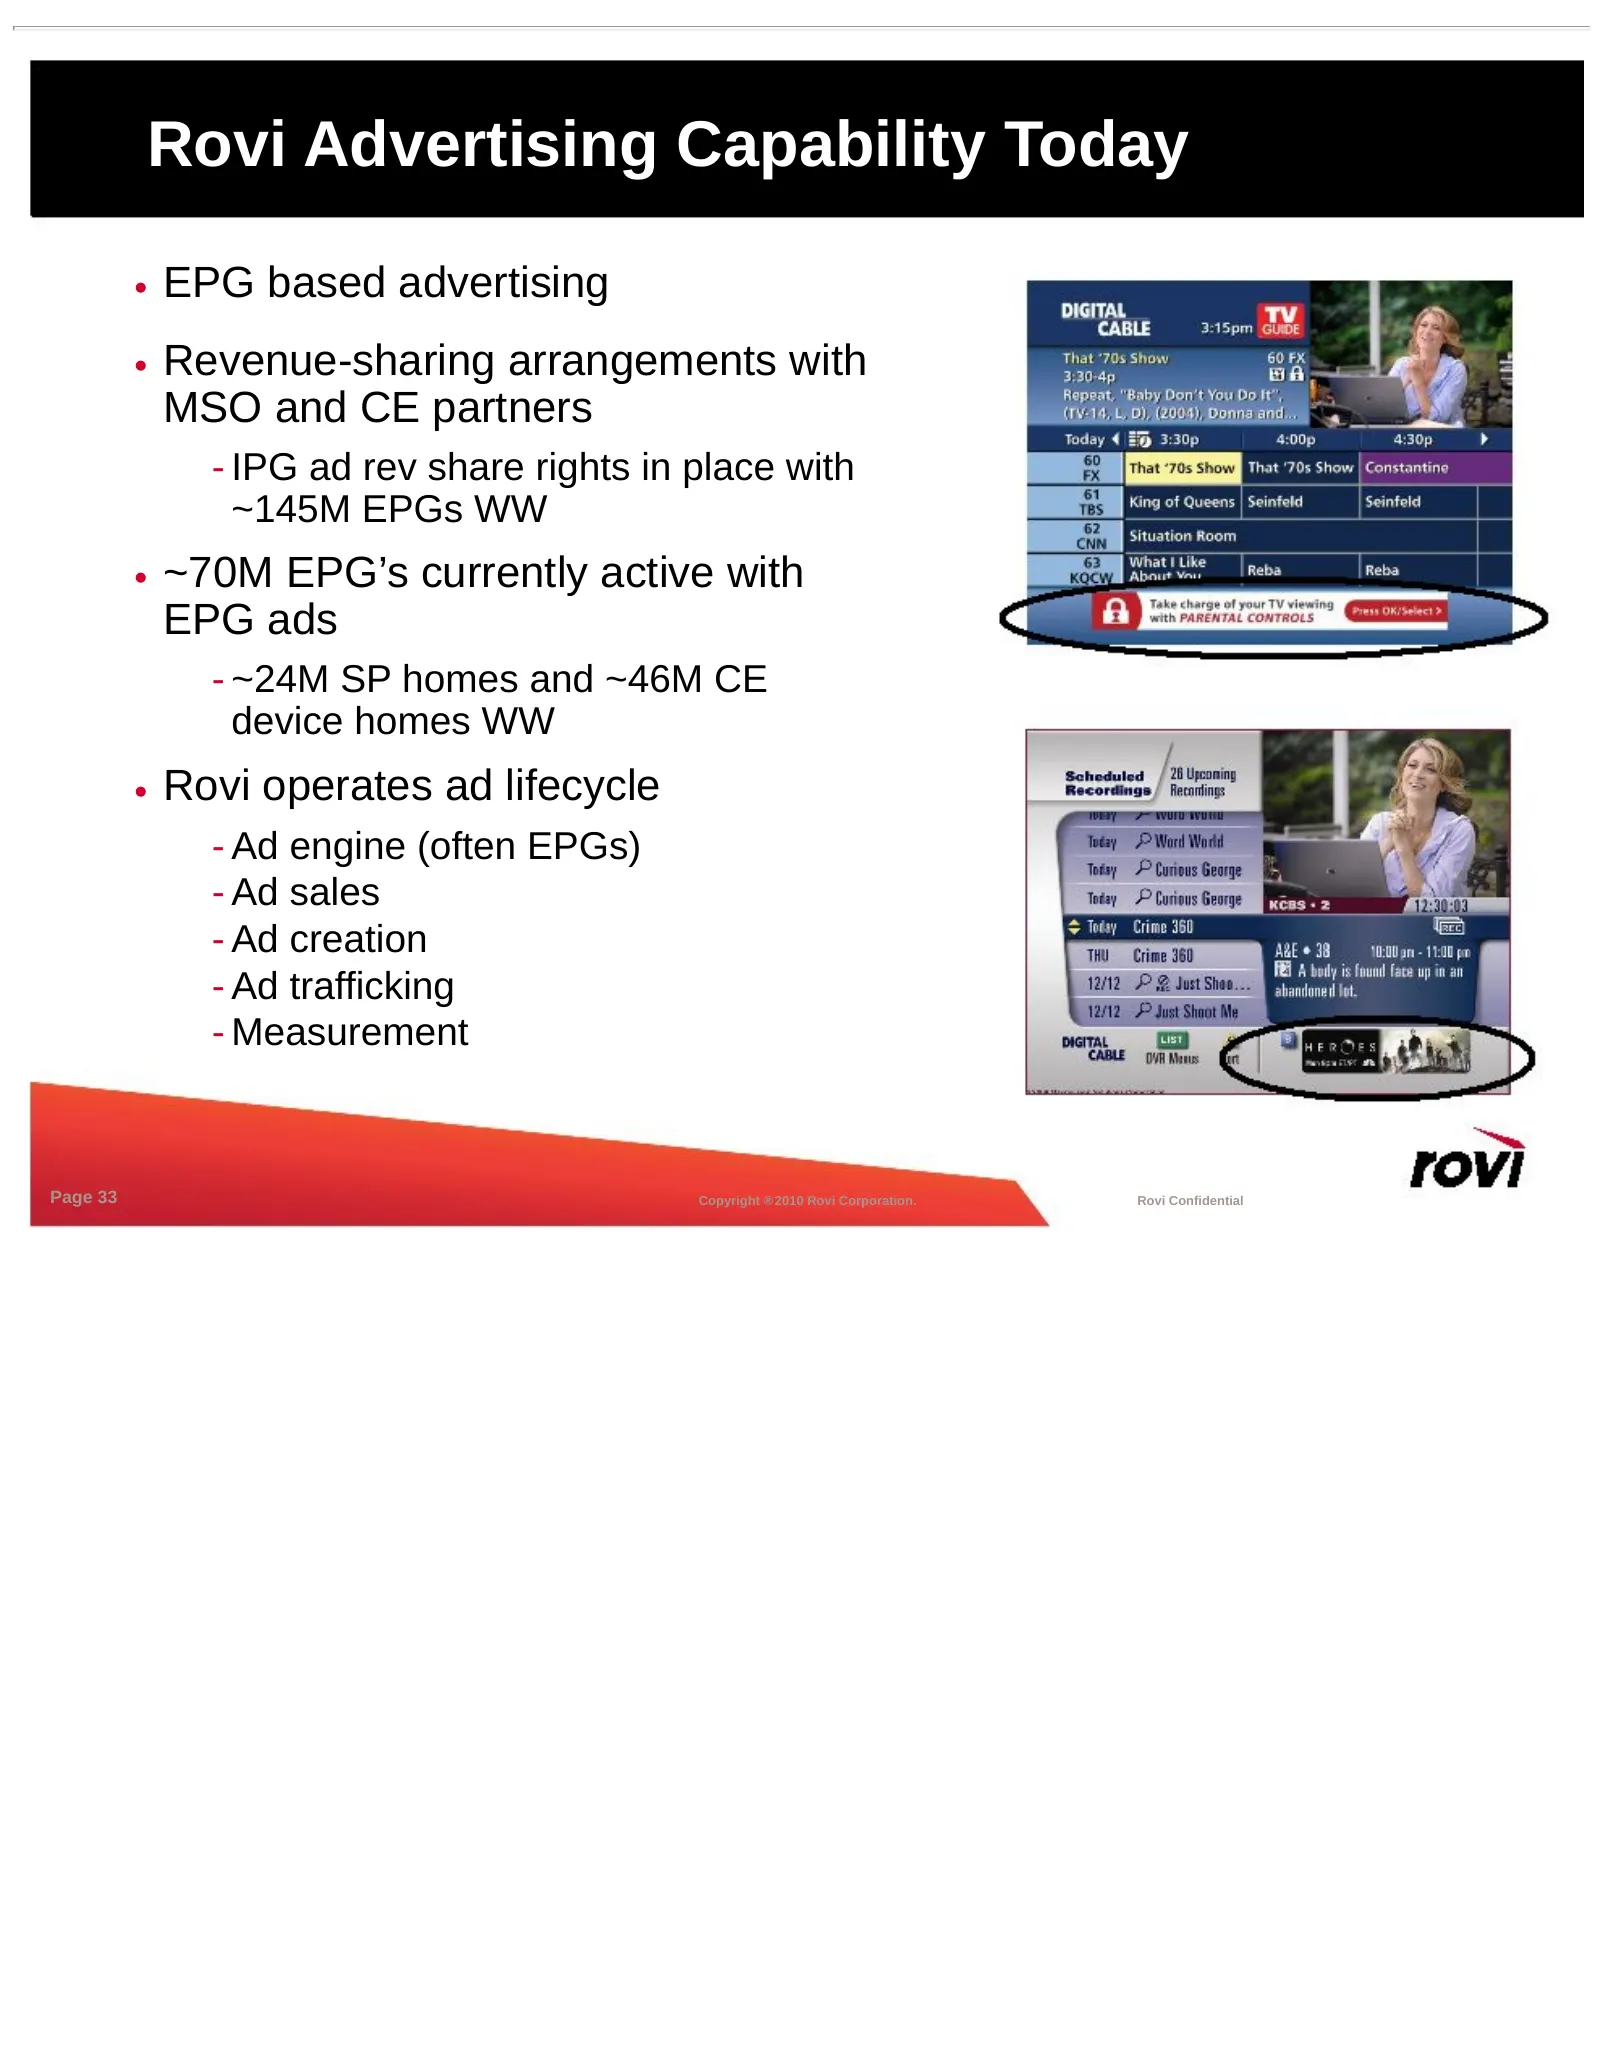
Rovi Advertising Capability Today • EPG based advertising • Revenue-sharing arrangements with MSO and CE partners - IPG ad rev share rights in place with ~145M EPGs WW • ~70M EPG’s currently active with EPG ads - ~24M SP homes and ~46M CE device homes WW • Rovi operates ad lifecycle - Ad engine (oft
Slide 34: Rovi IPG Advertisers
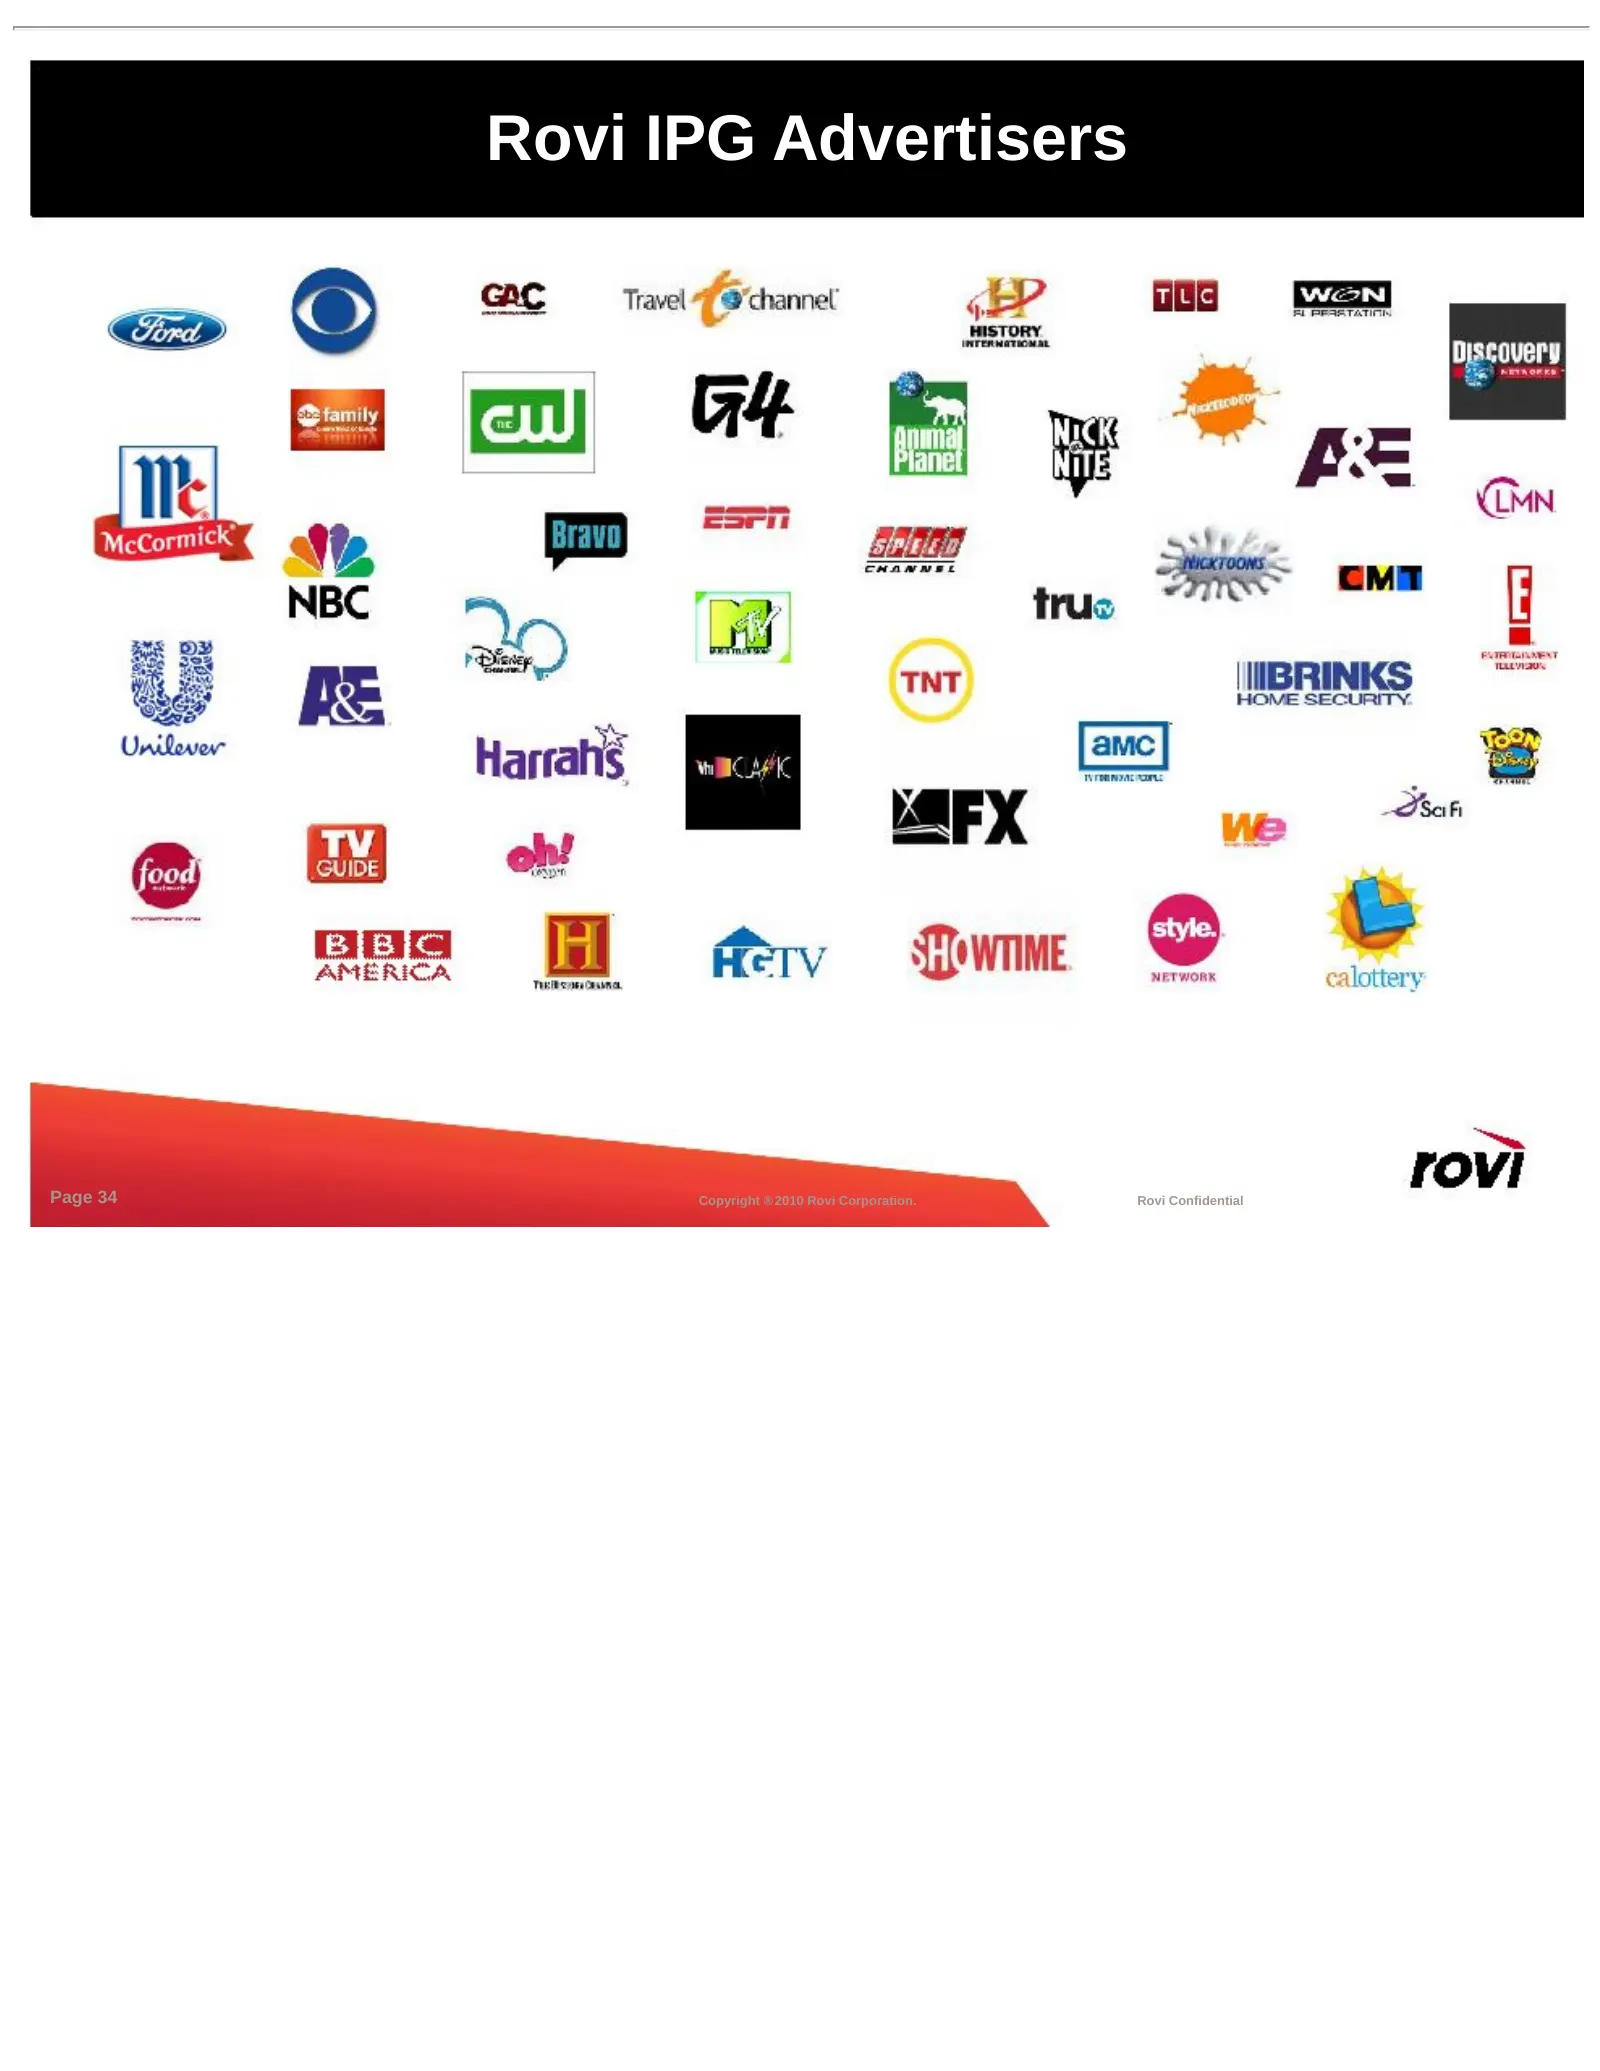
Rovi IPG Advertisers Page 34 Copyright ® 2010 Rovi Corporation. Rovi Confidential
Slide 35: Key Success Factors
Key Success Factors • Measurement - To prove the impact of our ad platform to advertisers • Rich, interactive ad experiences - To deliver an engaging consumer experience - To provide a powerful messaging platform for advertisers • New products & distribution - To lead the market in interactive TV ad
Slide 36: Expanding Ad Footprint in 2011
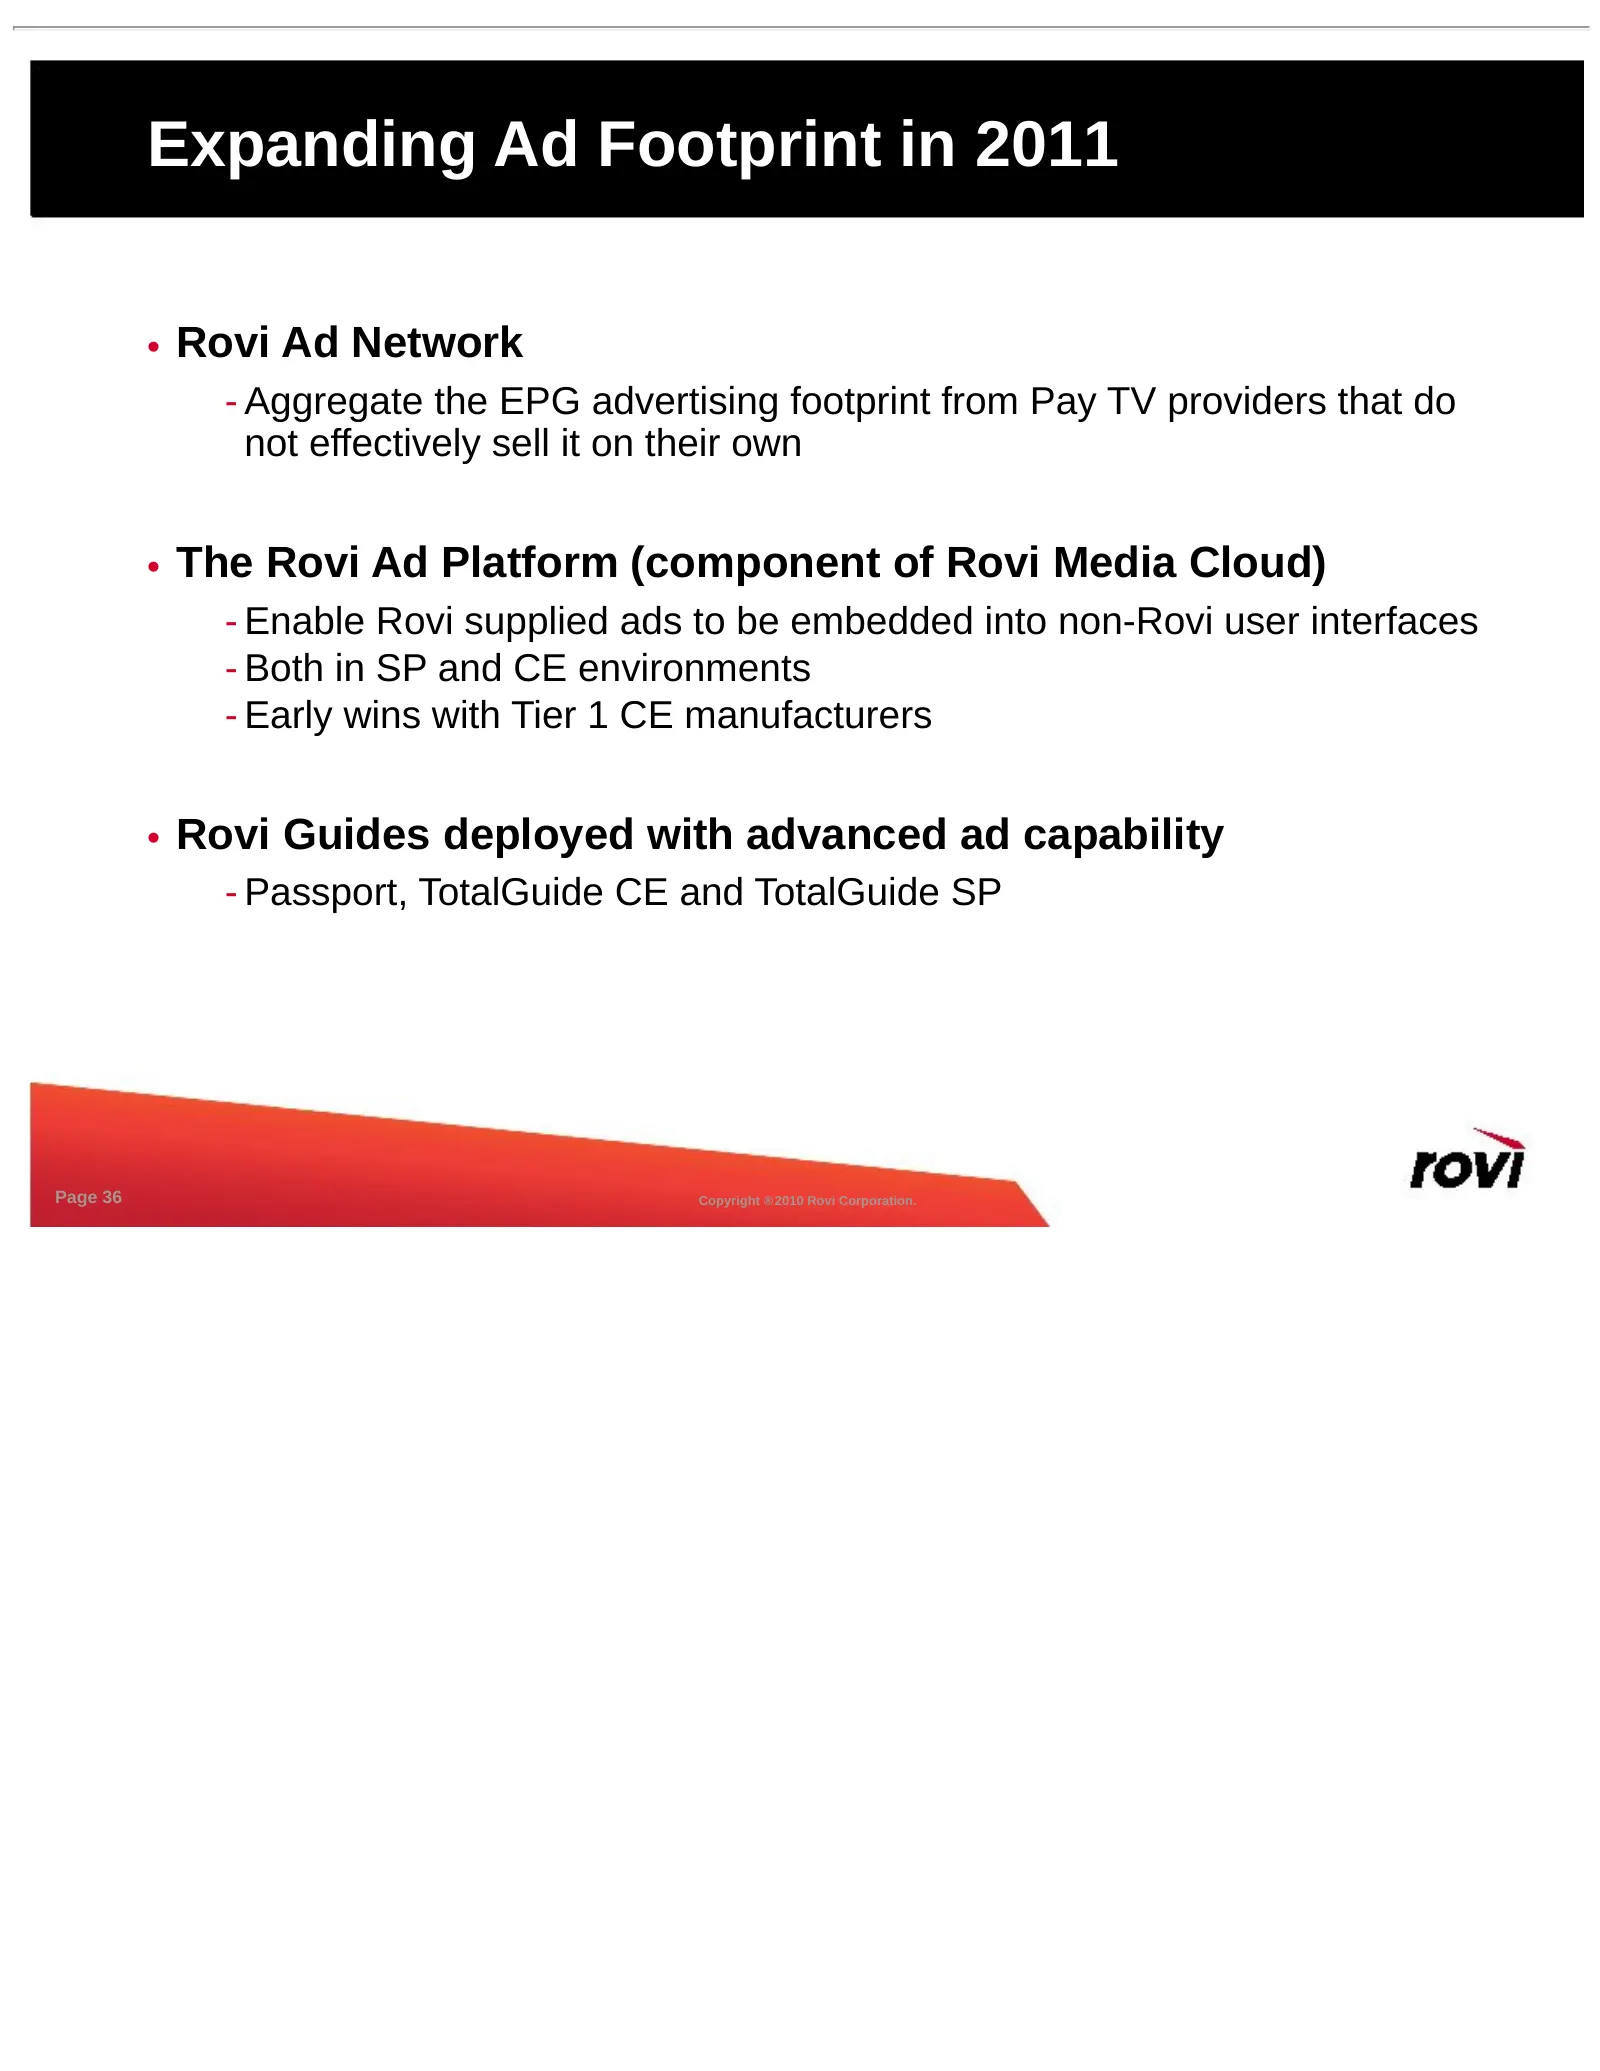
Expanding Ad Footprint in 2011 • Rovi Ad Network - Aggregate the EPG advertising footprint from Pay TV providers that do not effectively sell it on their own • The Rovi Ad Platform (component of Rovi Media Cloud) - Enable Rovi supplied ads to be embedded into non-Rovi user interfaces - Both in SP an
Slide 37: Financials
* * * * ** Financials Copyright ® 2010 Rovi Corporation. Company Confidential.
Slide 38: Preliminary 2010 Highlights
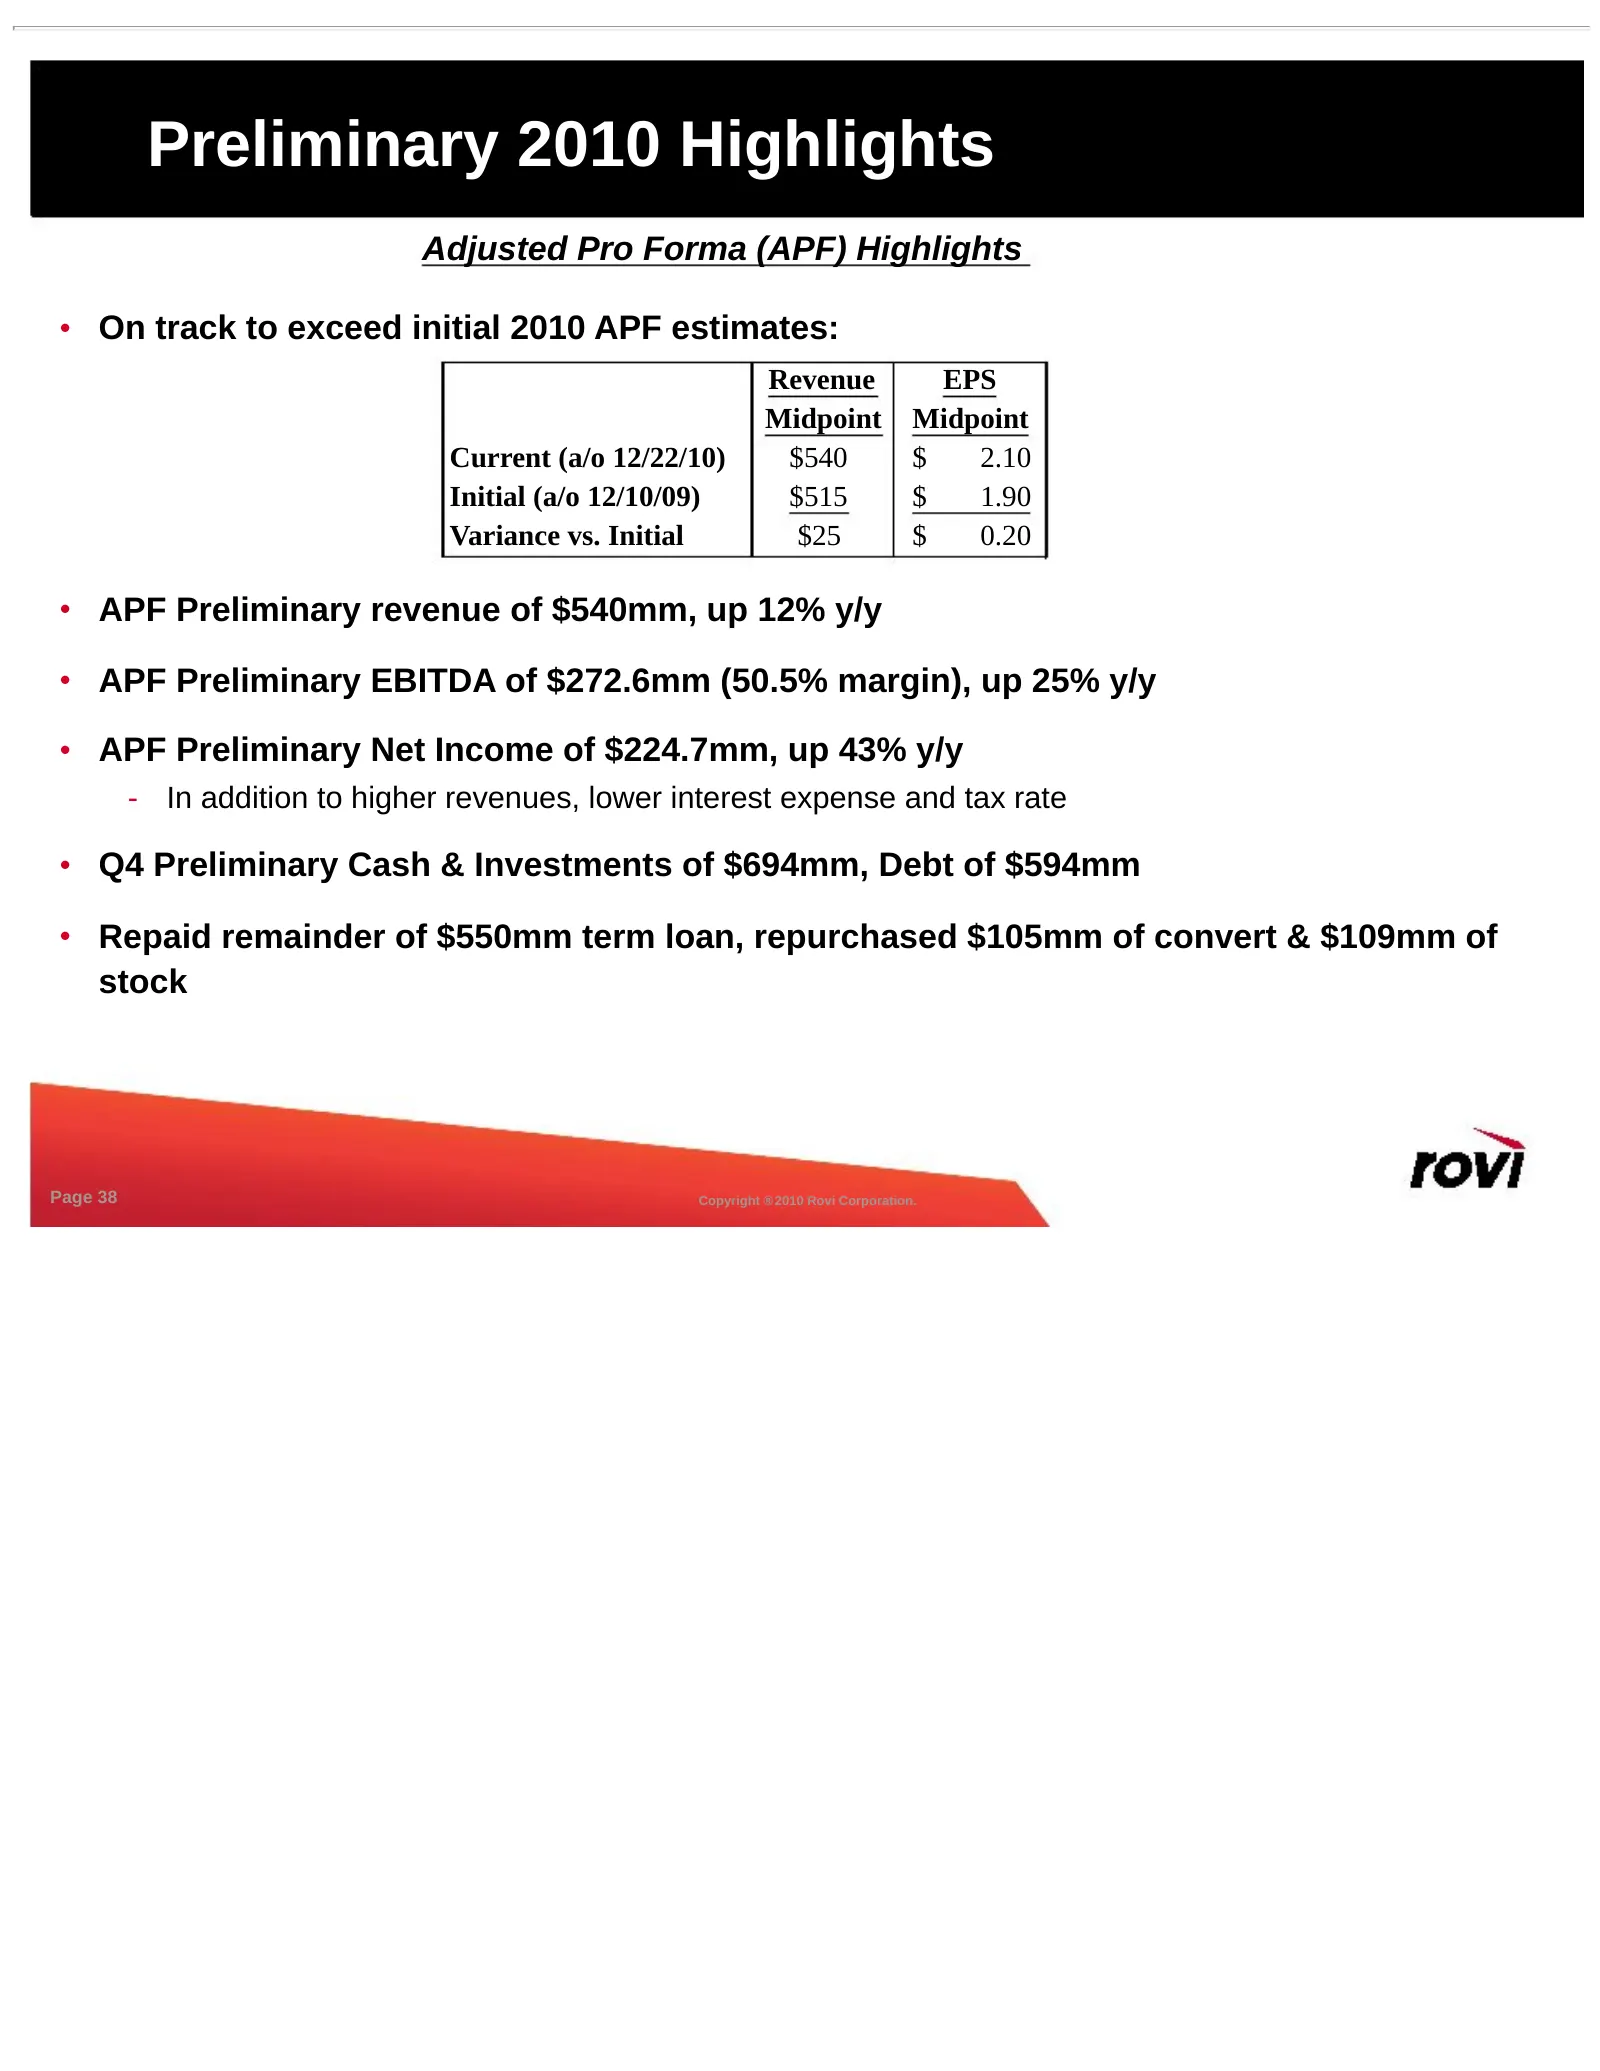
Preliminary 2010 Highlights Adjusted Pro Forma (APF) Highlights • On track to exceed initial 2010 APF estimates: Revenue EPS Midpoint Midpoint Current (a/o 12/22/10) $540 $ 2.10 Initial (a/o 12/10/09) $515 $ 1.90 Variance vs. Initial $25 $ 0.20 • APF Preliminary revenue of $540mm, up 12% y/y • APF P
Slide 39: Adjusted Pro Forma Information
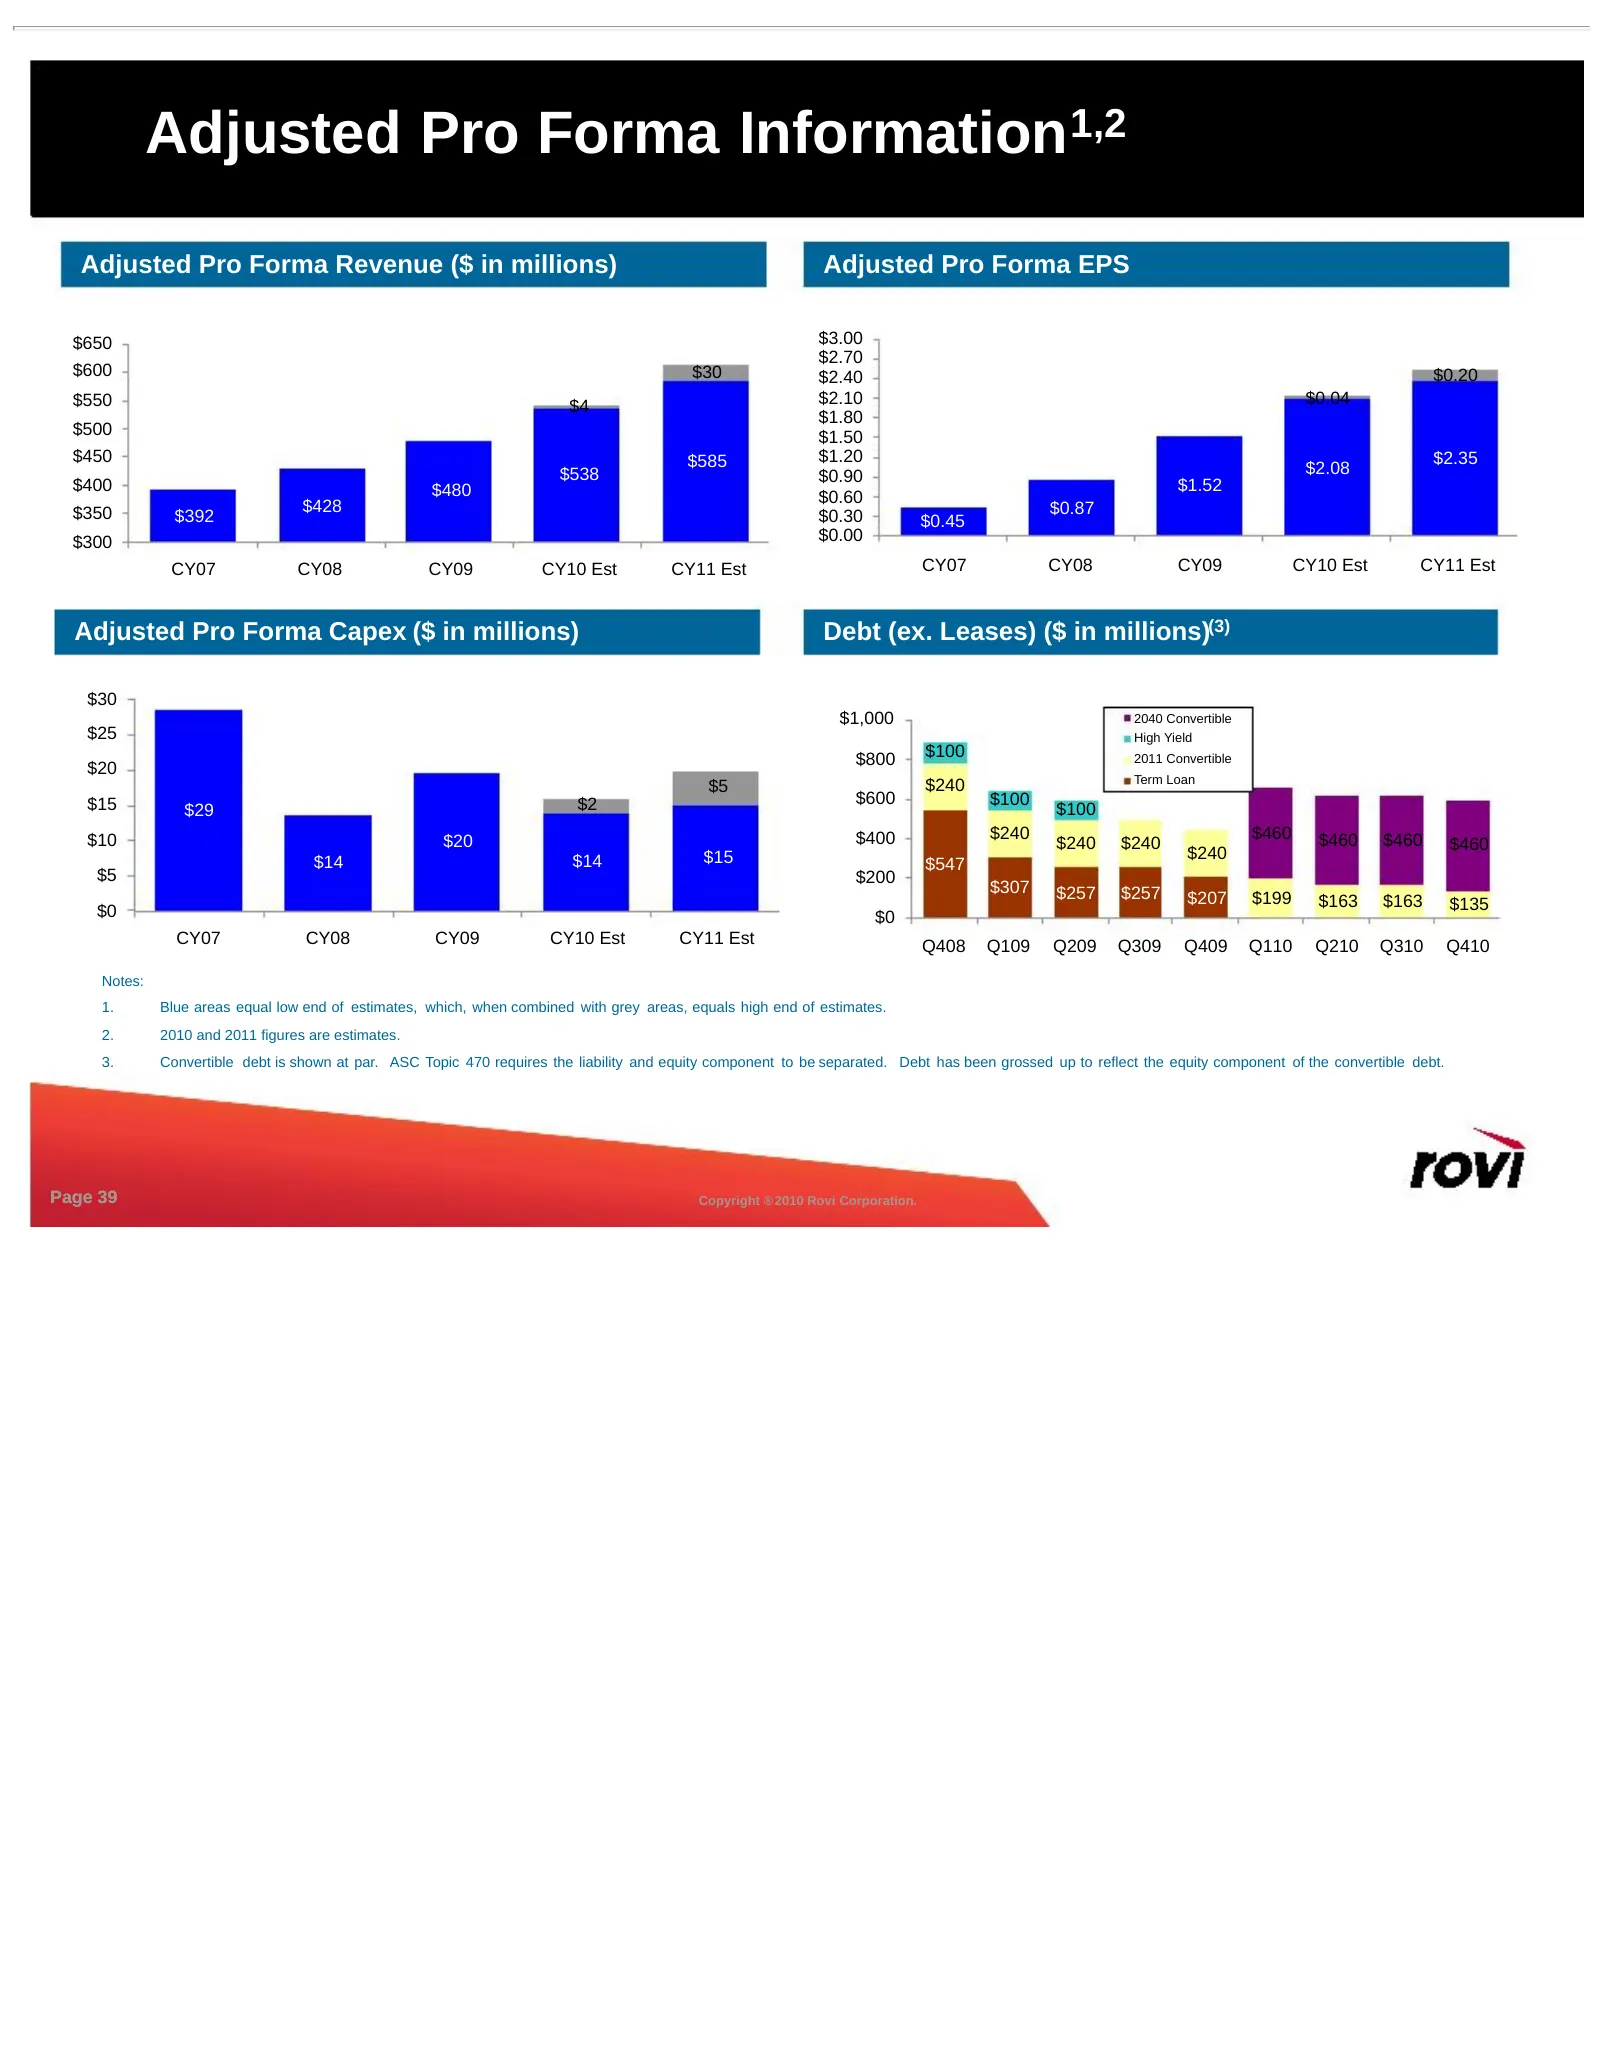
Adjusted Pro Forma Information 1,2 Adjusted Pro Forma Revenue ($ in millions) Adjusted Pro Forma EPS $650 $3.00 $2.70 $600 $30 $2.40 $0.20 $550 $4 $2.10 $0.04 $1.80 $500 $1.50 $450 $585 $1.20 $2.35 $538 $0.90 $2.08 $400 $480 $1.52 $0.60 $350 $428 $0.87 $392 $0.30 $0.45 $300 $0.00 CY07 CY08 CY09 CY10
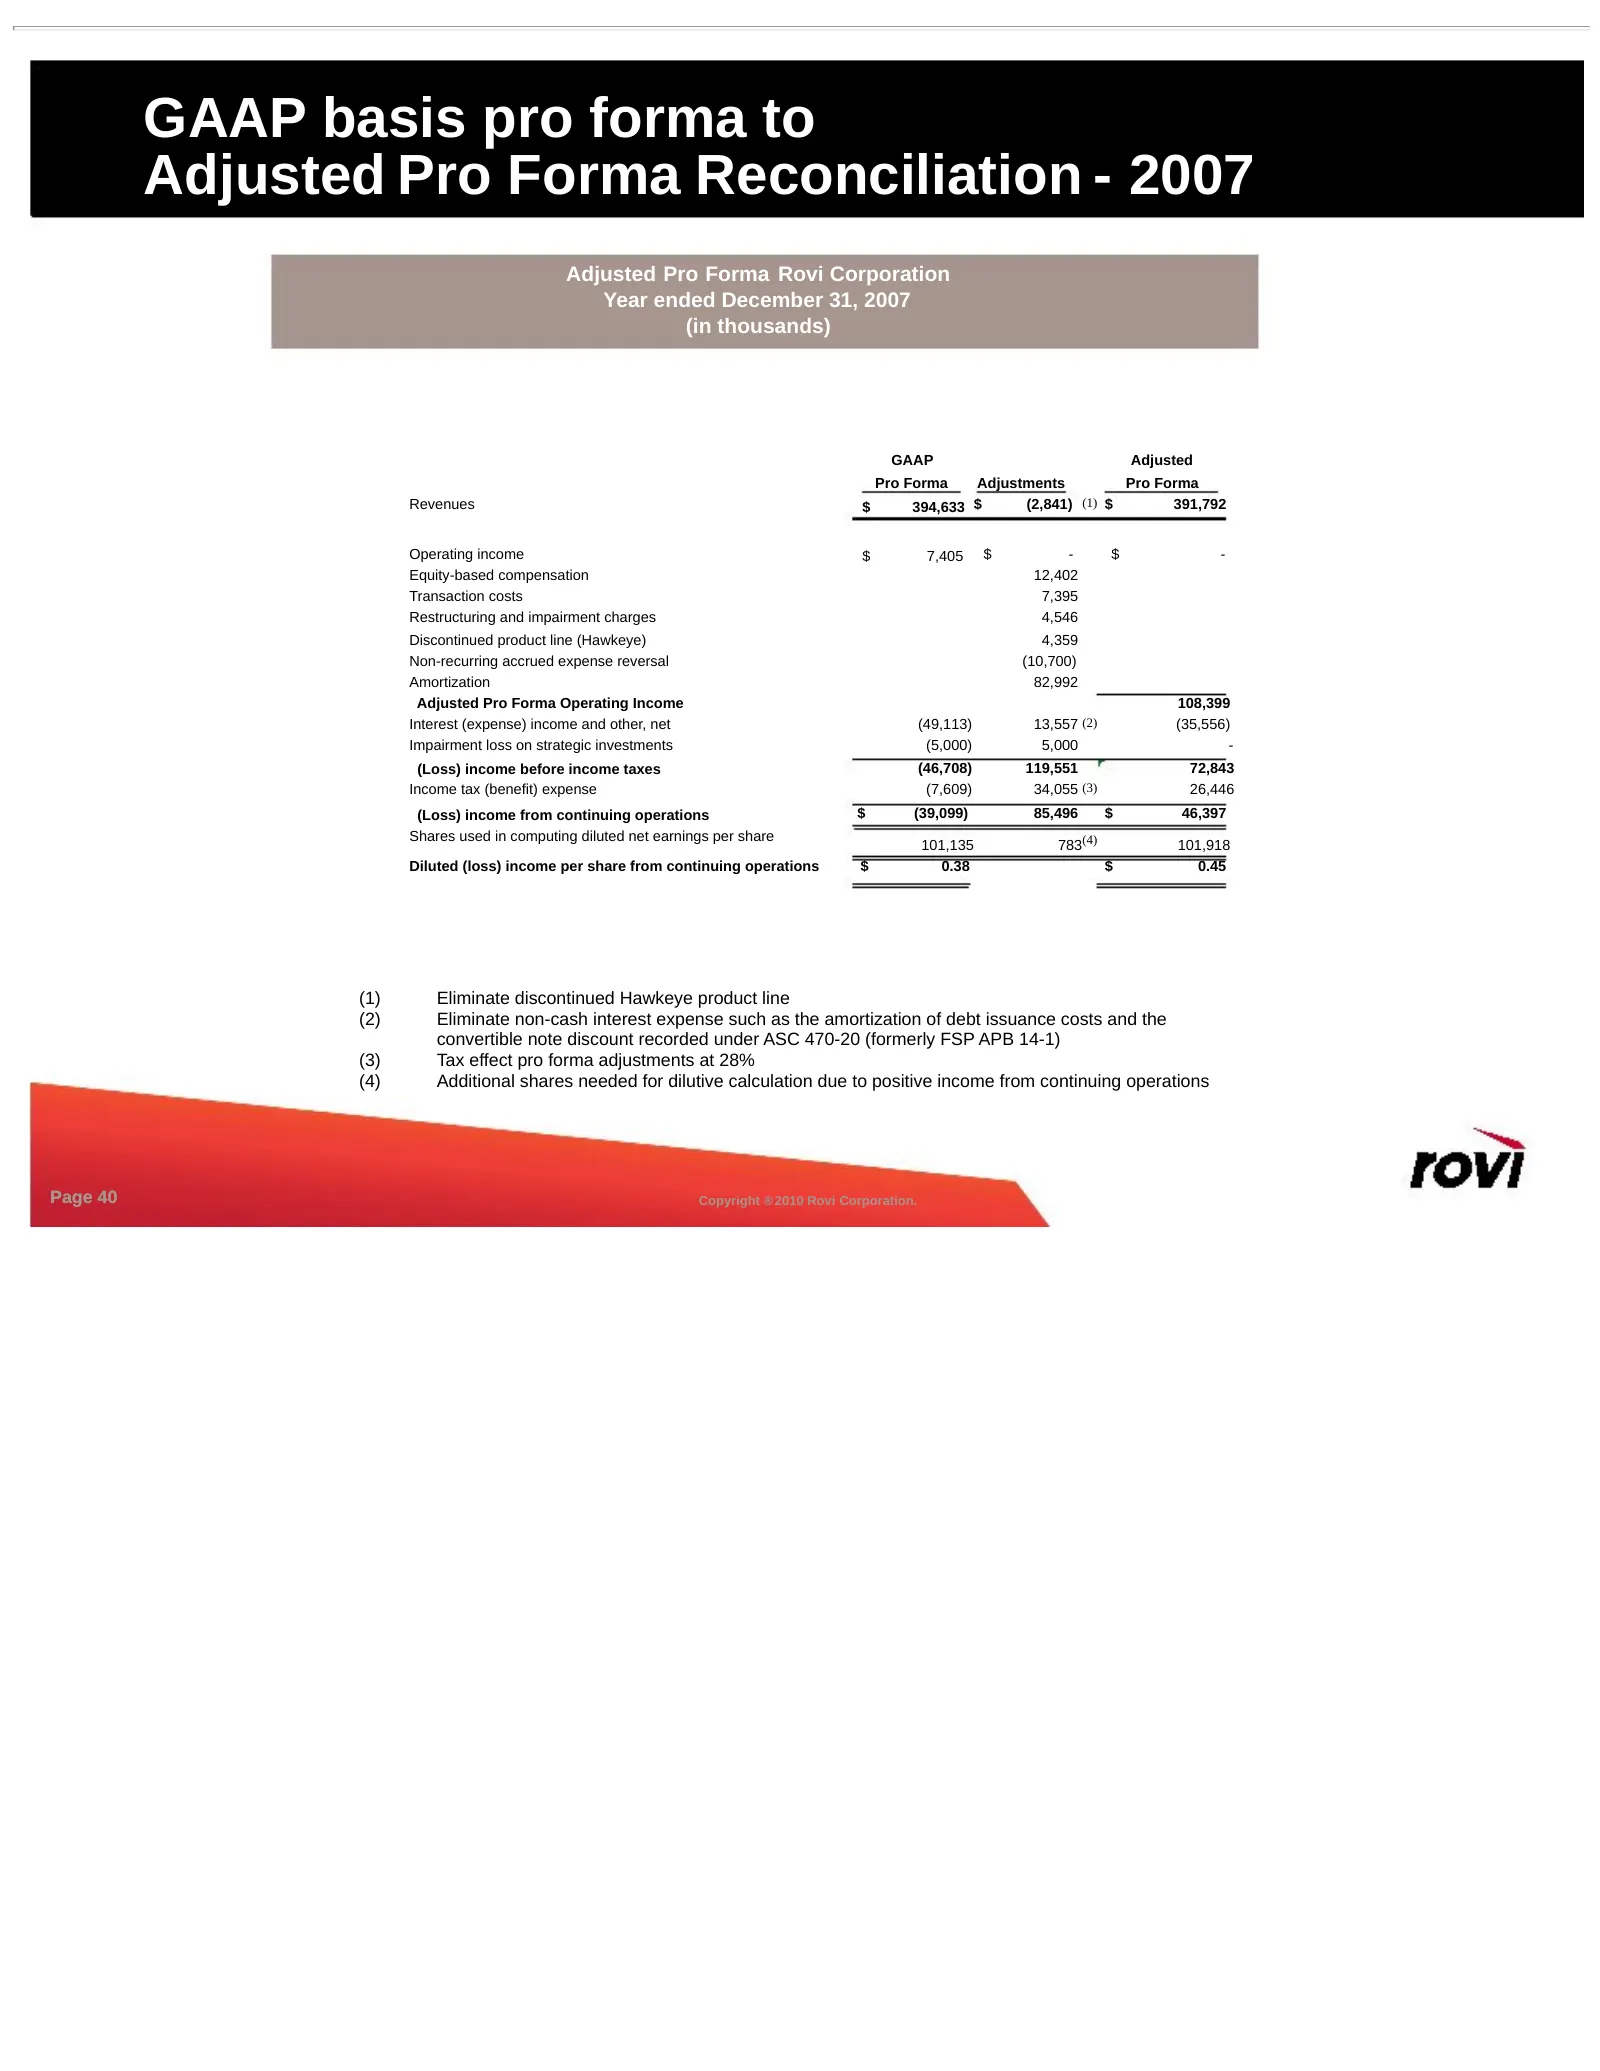
Slide 40: GAAP basis pro forma to Adjusted Pro Forma Reconciliation - 2007
GAAP basis pro forma to Adjusted Pro Forma Reconciliation - 2007 Adjusted Pro Forma Rovi Corporation Year ended December 31, 2007 (in thousands) GAAP Adjusted Pro Forma Adjustments Pro Forma Revenues $ 394,633 $ (2,841) (1) $ 391,792 Operating income $ 7,405 $ - $ - Equity-based compensation 12,402
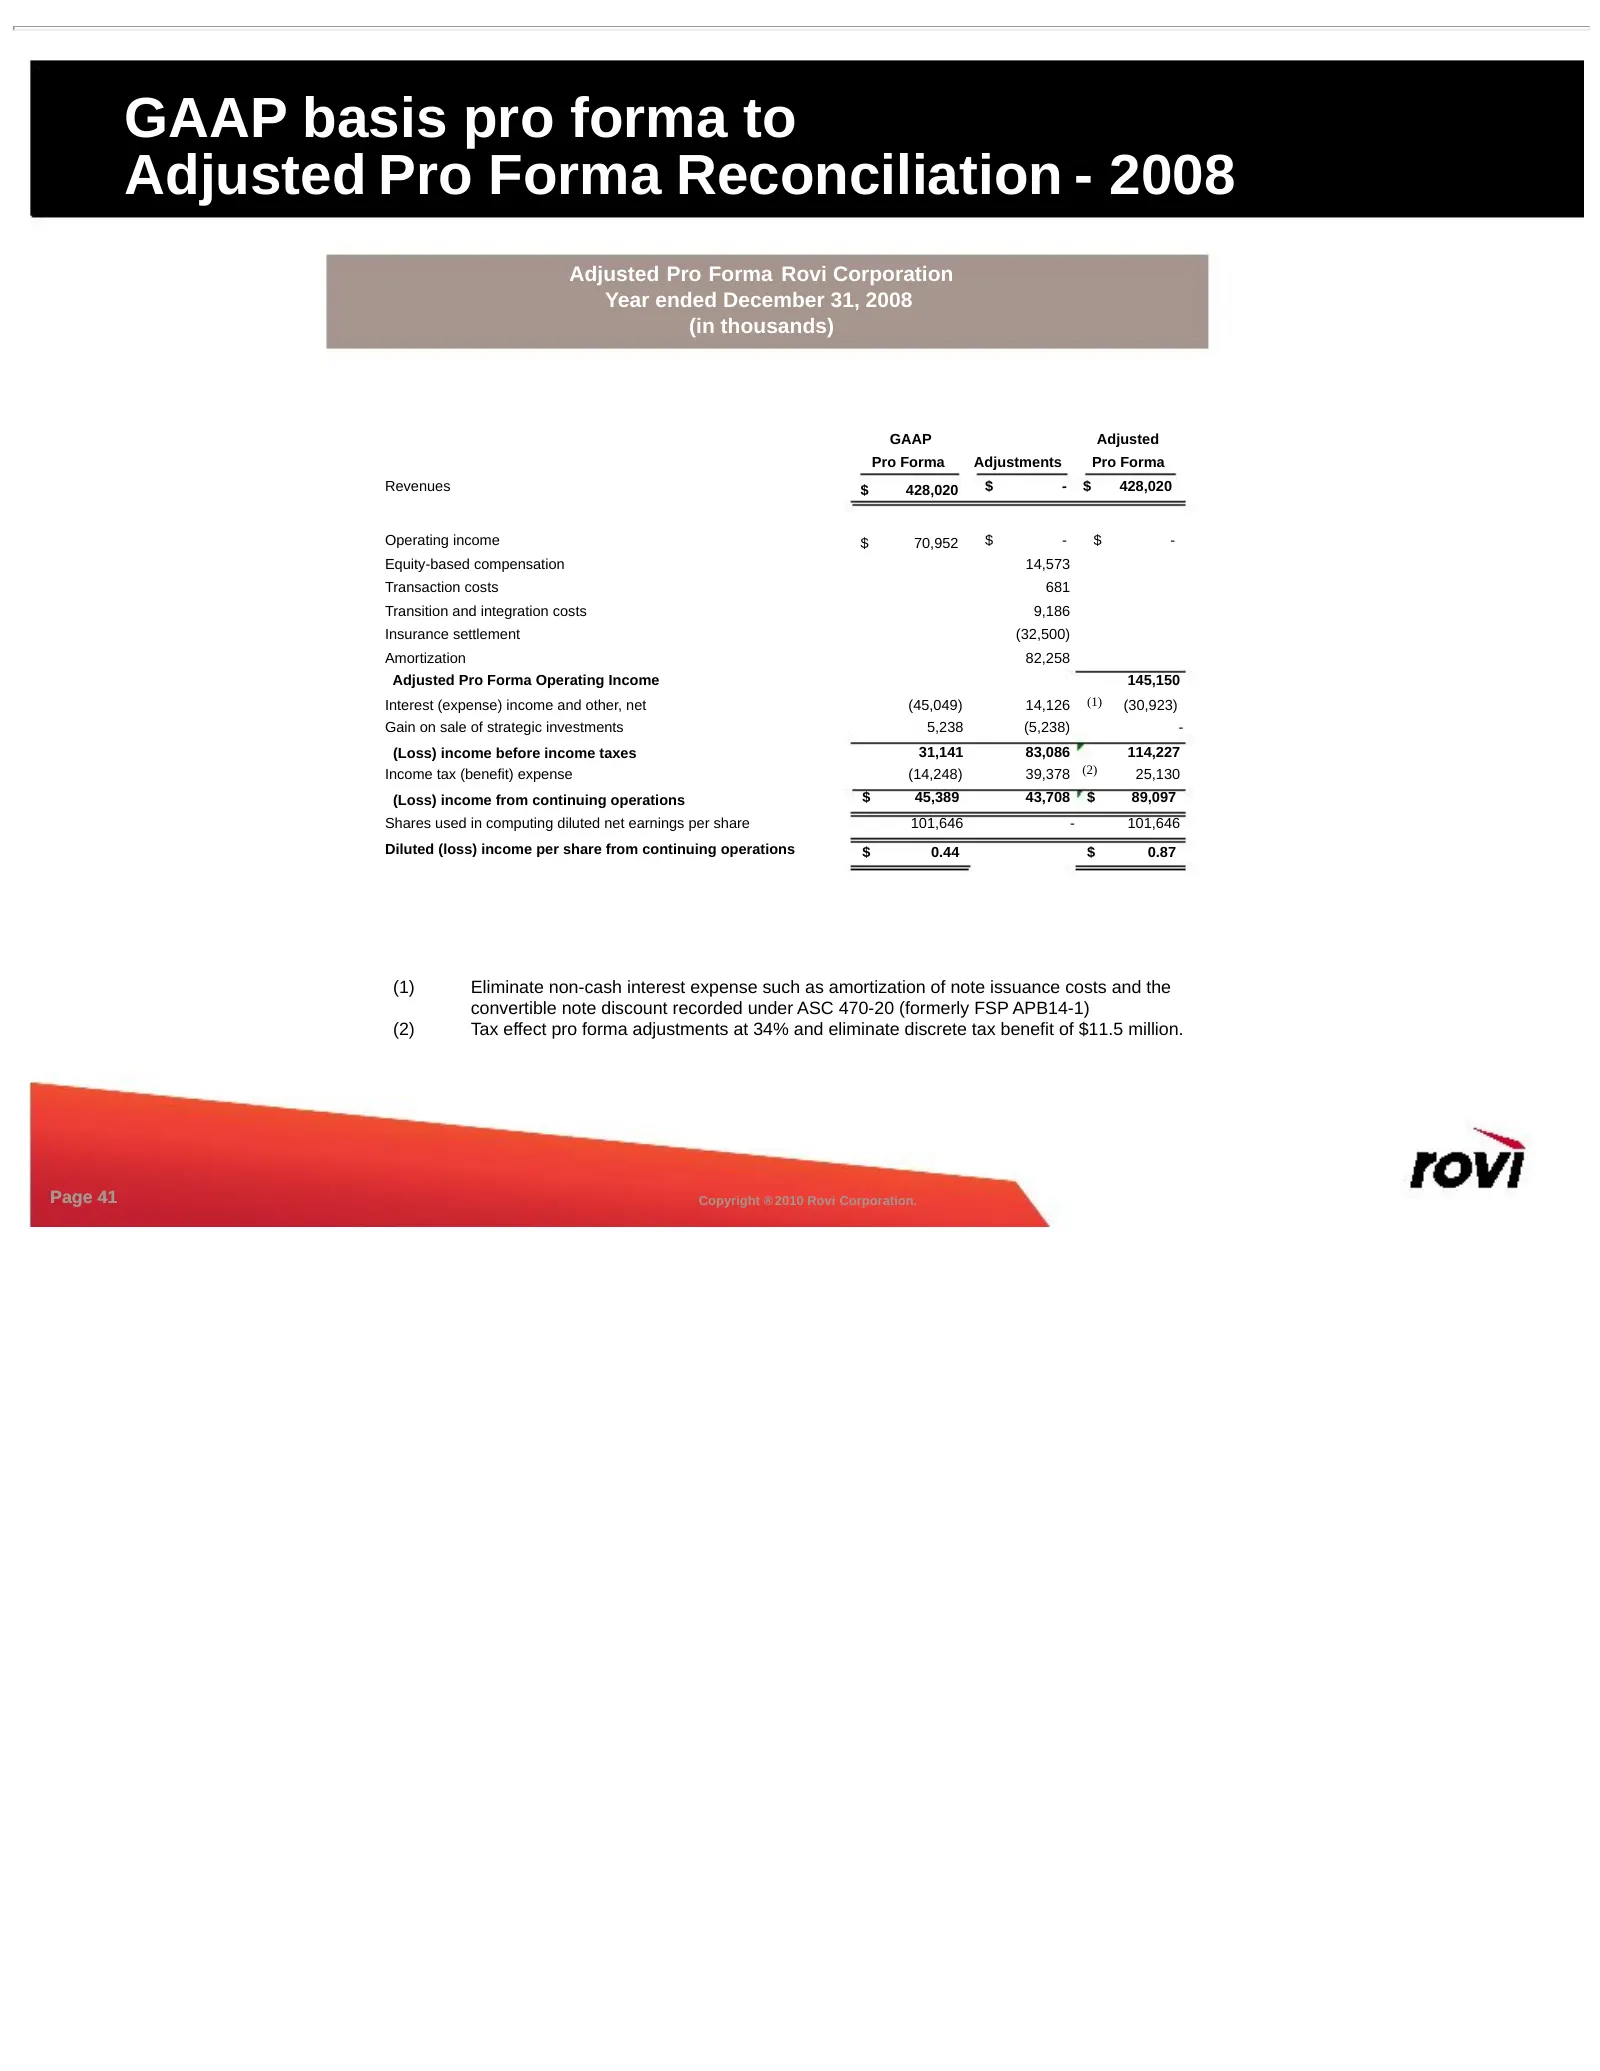
Slide 41: GAAP basis pro forma to Adjusted Pro Forma Reconciliation - 2008
GAAP basis pro forma to Adjusted Pro Forma Reconciliation - 2008 Adjusted Pro Forma Rovi Corporation Year ended December 31, 2008 (in thousands) GAAP Adjusted Pro Forma Adjustments Pro Forma Revenues $ 428,020 $ - $ 428,020 Operating income $ 70,952 $ - $ - Equity-based compensation 14,573 Transacti
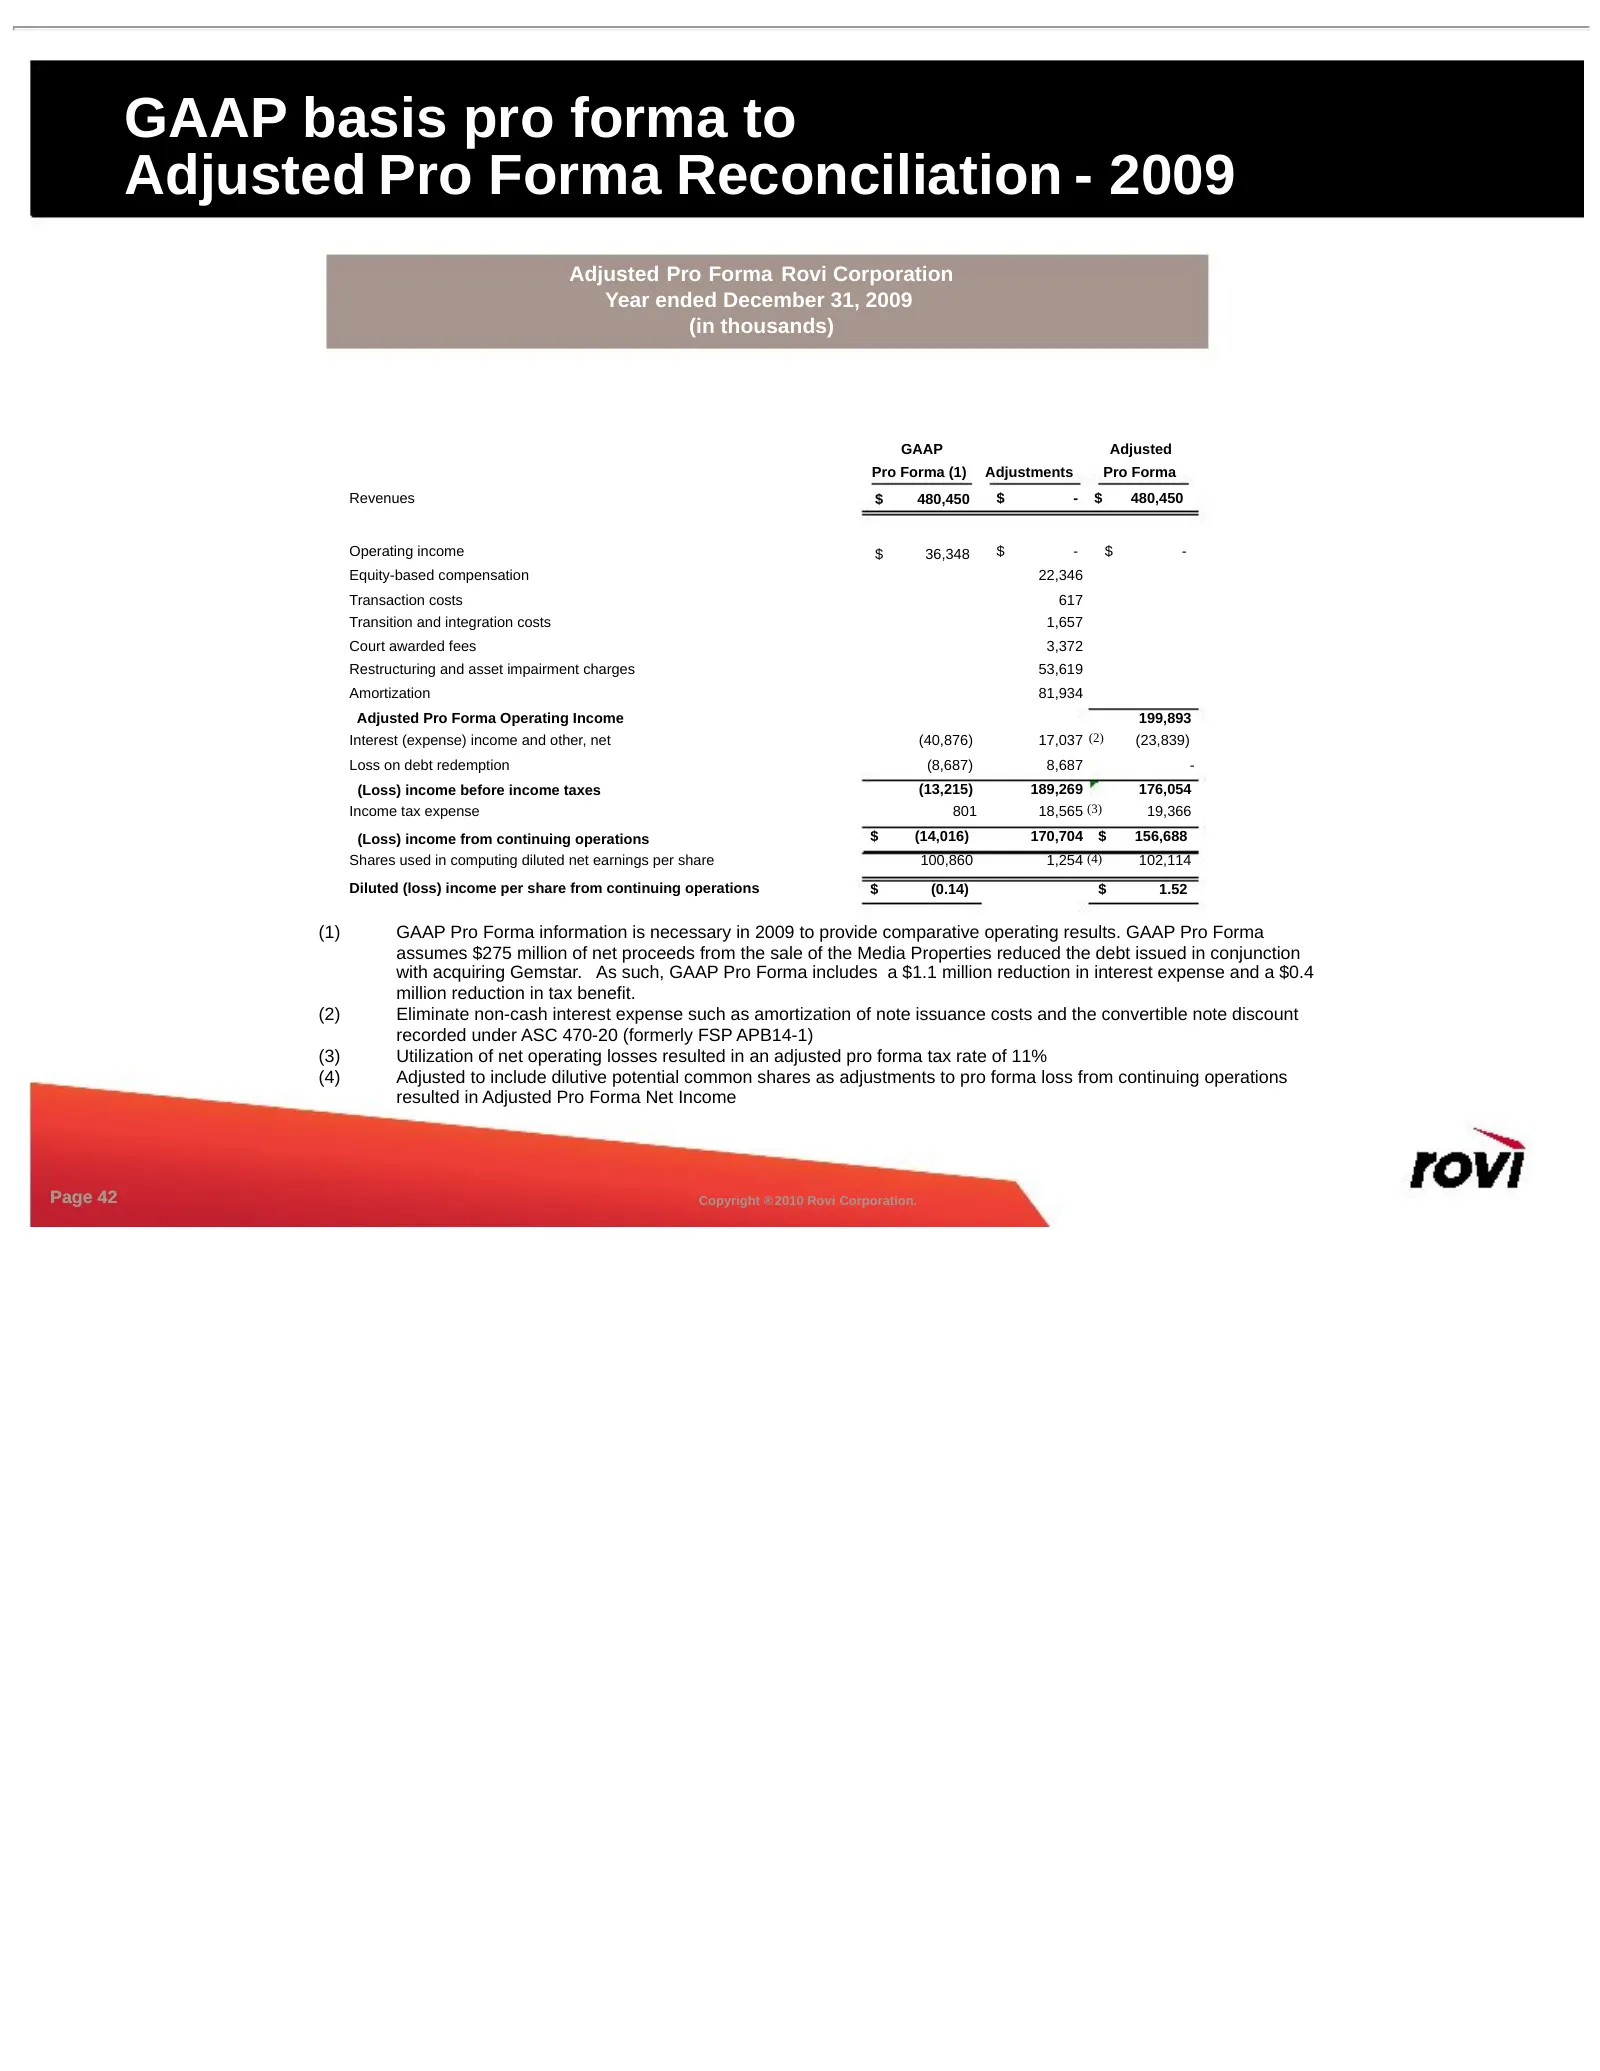
Slide 42: GAAP basis pro forma to Adjusted Pro Forma Reconciliation - 2009
GAAP basis pro forma to Adjusted Pro Forma Reconciliation - 2009 Adjusted Pro Forma Rovi Corporation Year ended December 31, 2009 (in thousands) GAAP Adjusted Pro Forma (1) Adjustments Pro Forma Revenues $ 480,450 $ - $ 480,450 Operating income $ 36,348 $ - $ - Equity-based compensation 22,346 Trans
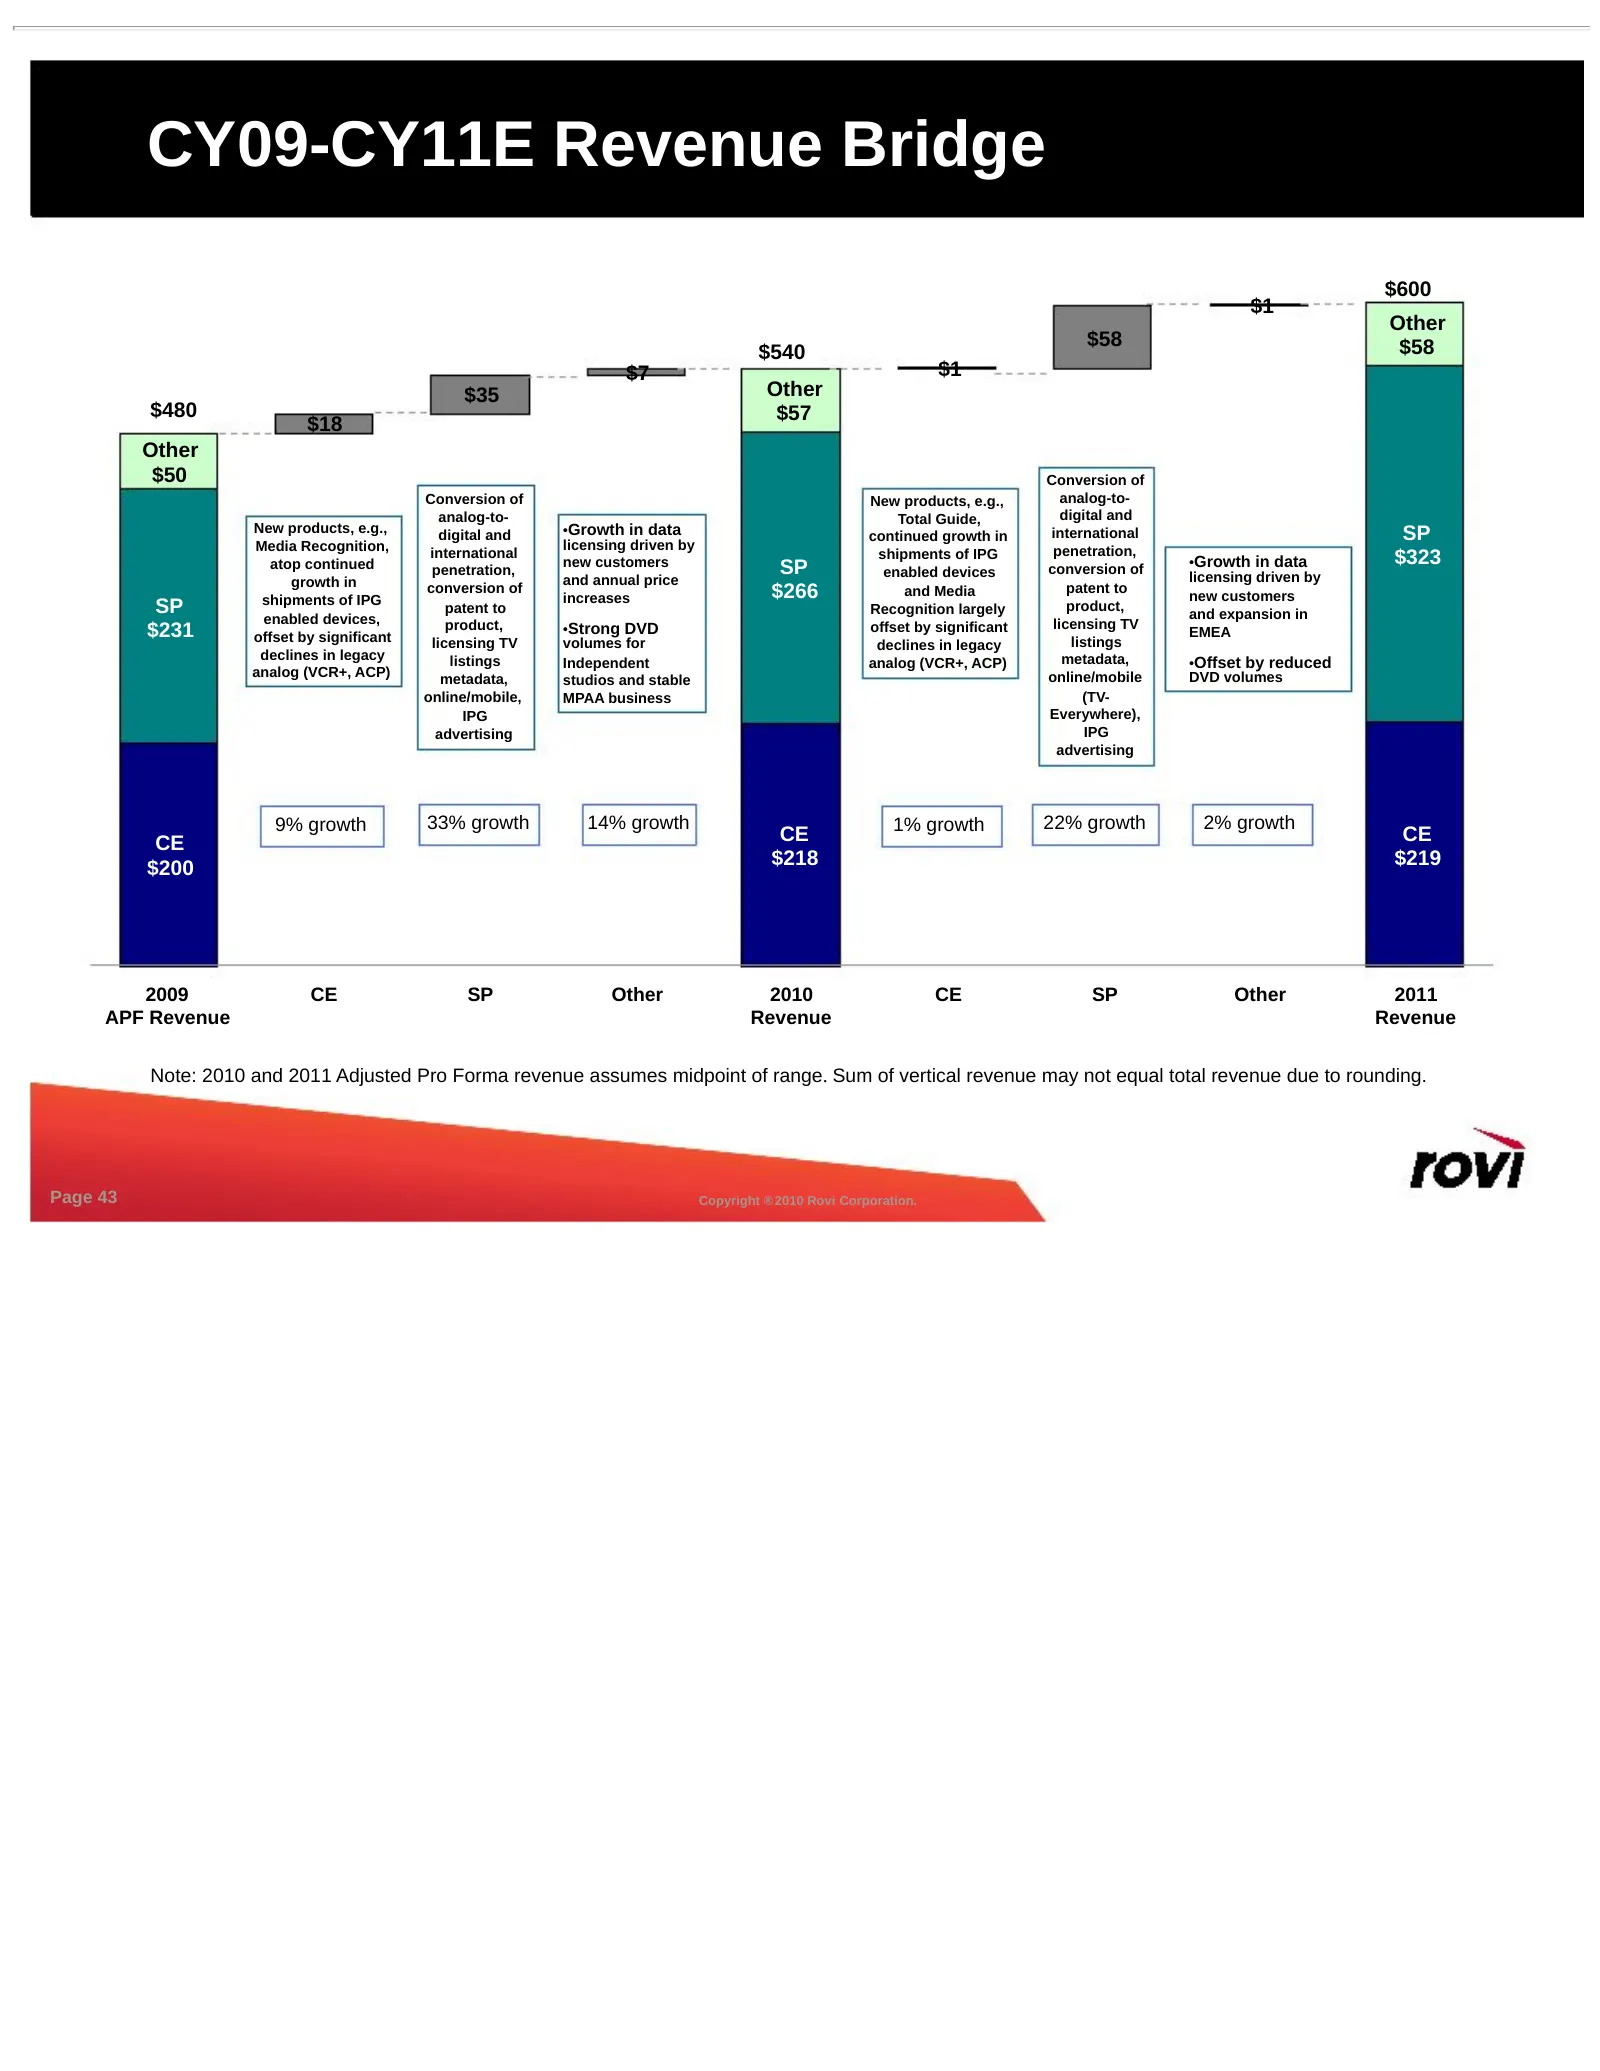
Slide 43: CY09-CY11E Revenue Bridge
CY09-CY11E Revenue Bridge $600 $1 Other $58 $58 $540 $7 $1 $35 Other $480 $57 $18 Other $50 Conversion of Conversion of New products, e.g., analog-to- analog-to- Total Guide, digital and New products, e.g., digital and •Growth in data international SP continued growth in Media Recognition, licensing
Slide 44: Business Models
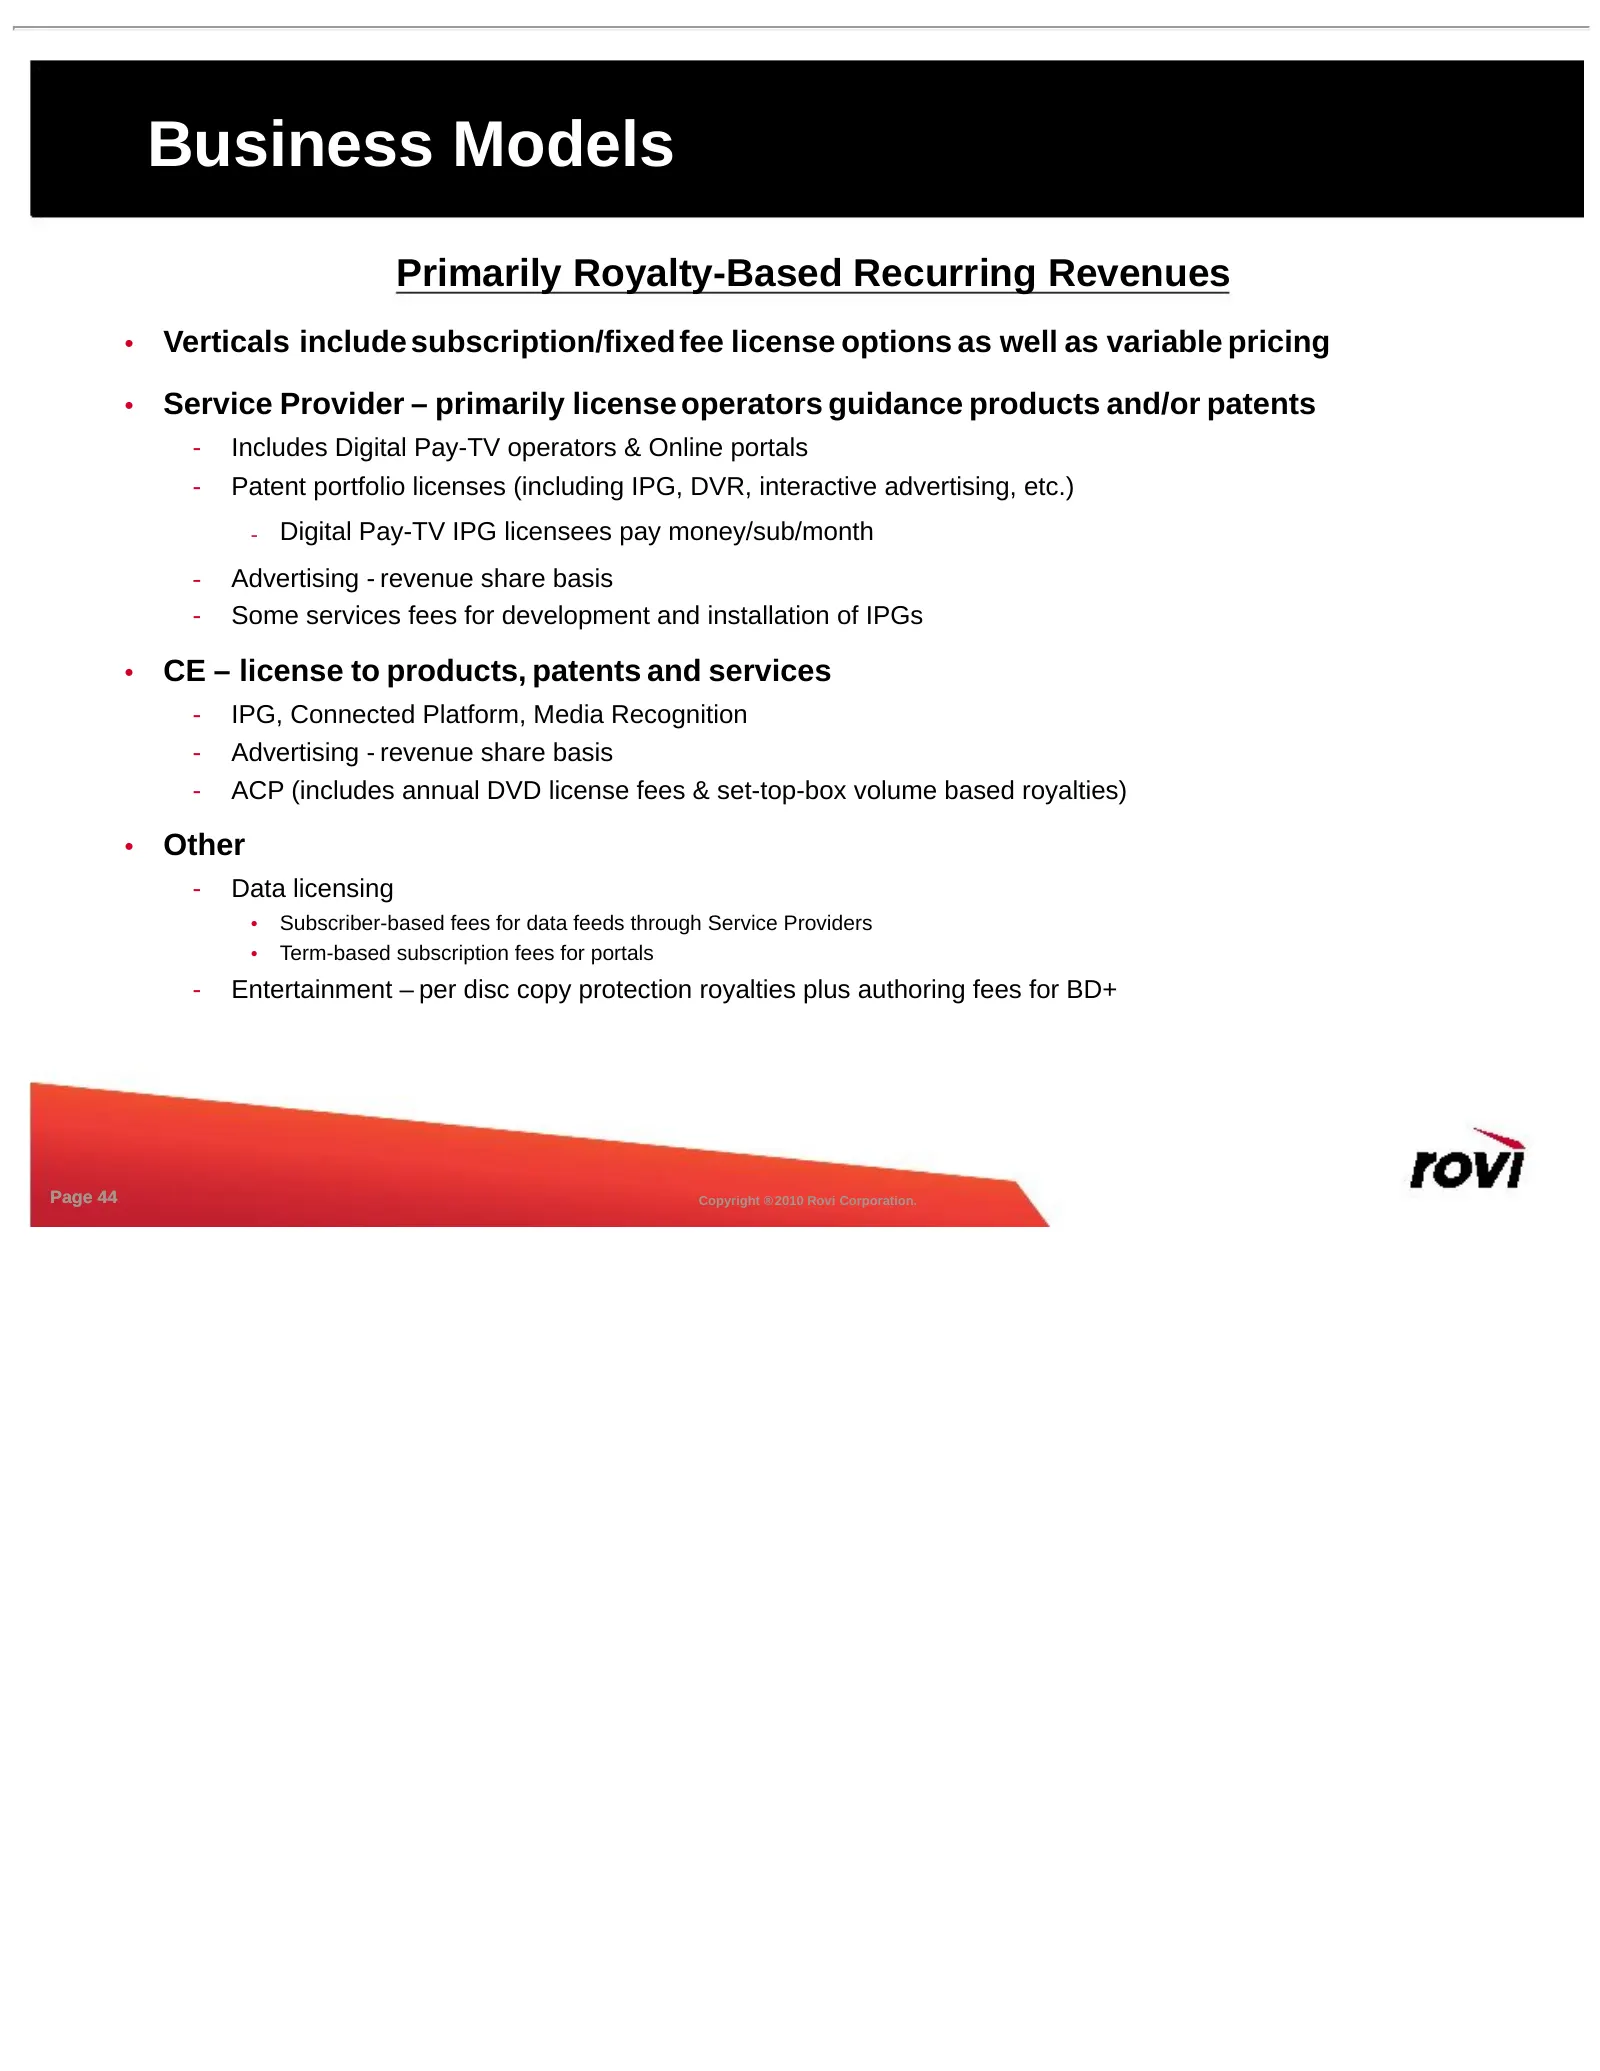
Business Models Primarily Royalty-Based Recurring Revenues • Verticals include subscription/fixed fee license options as well as variable pricing • Service Provider – primarily license operators guidance products and/or patents - Includes Digital Pay-TV operators & Online portals - Patent portfolio
Slide 45: Service Provider IPG Drivers
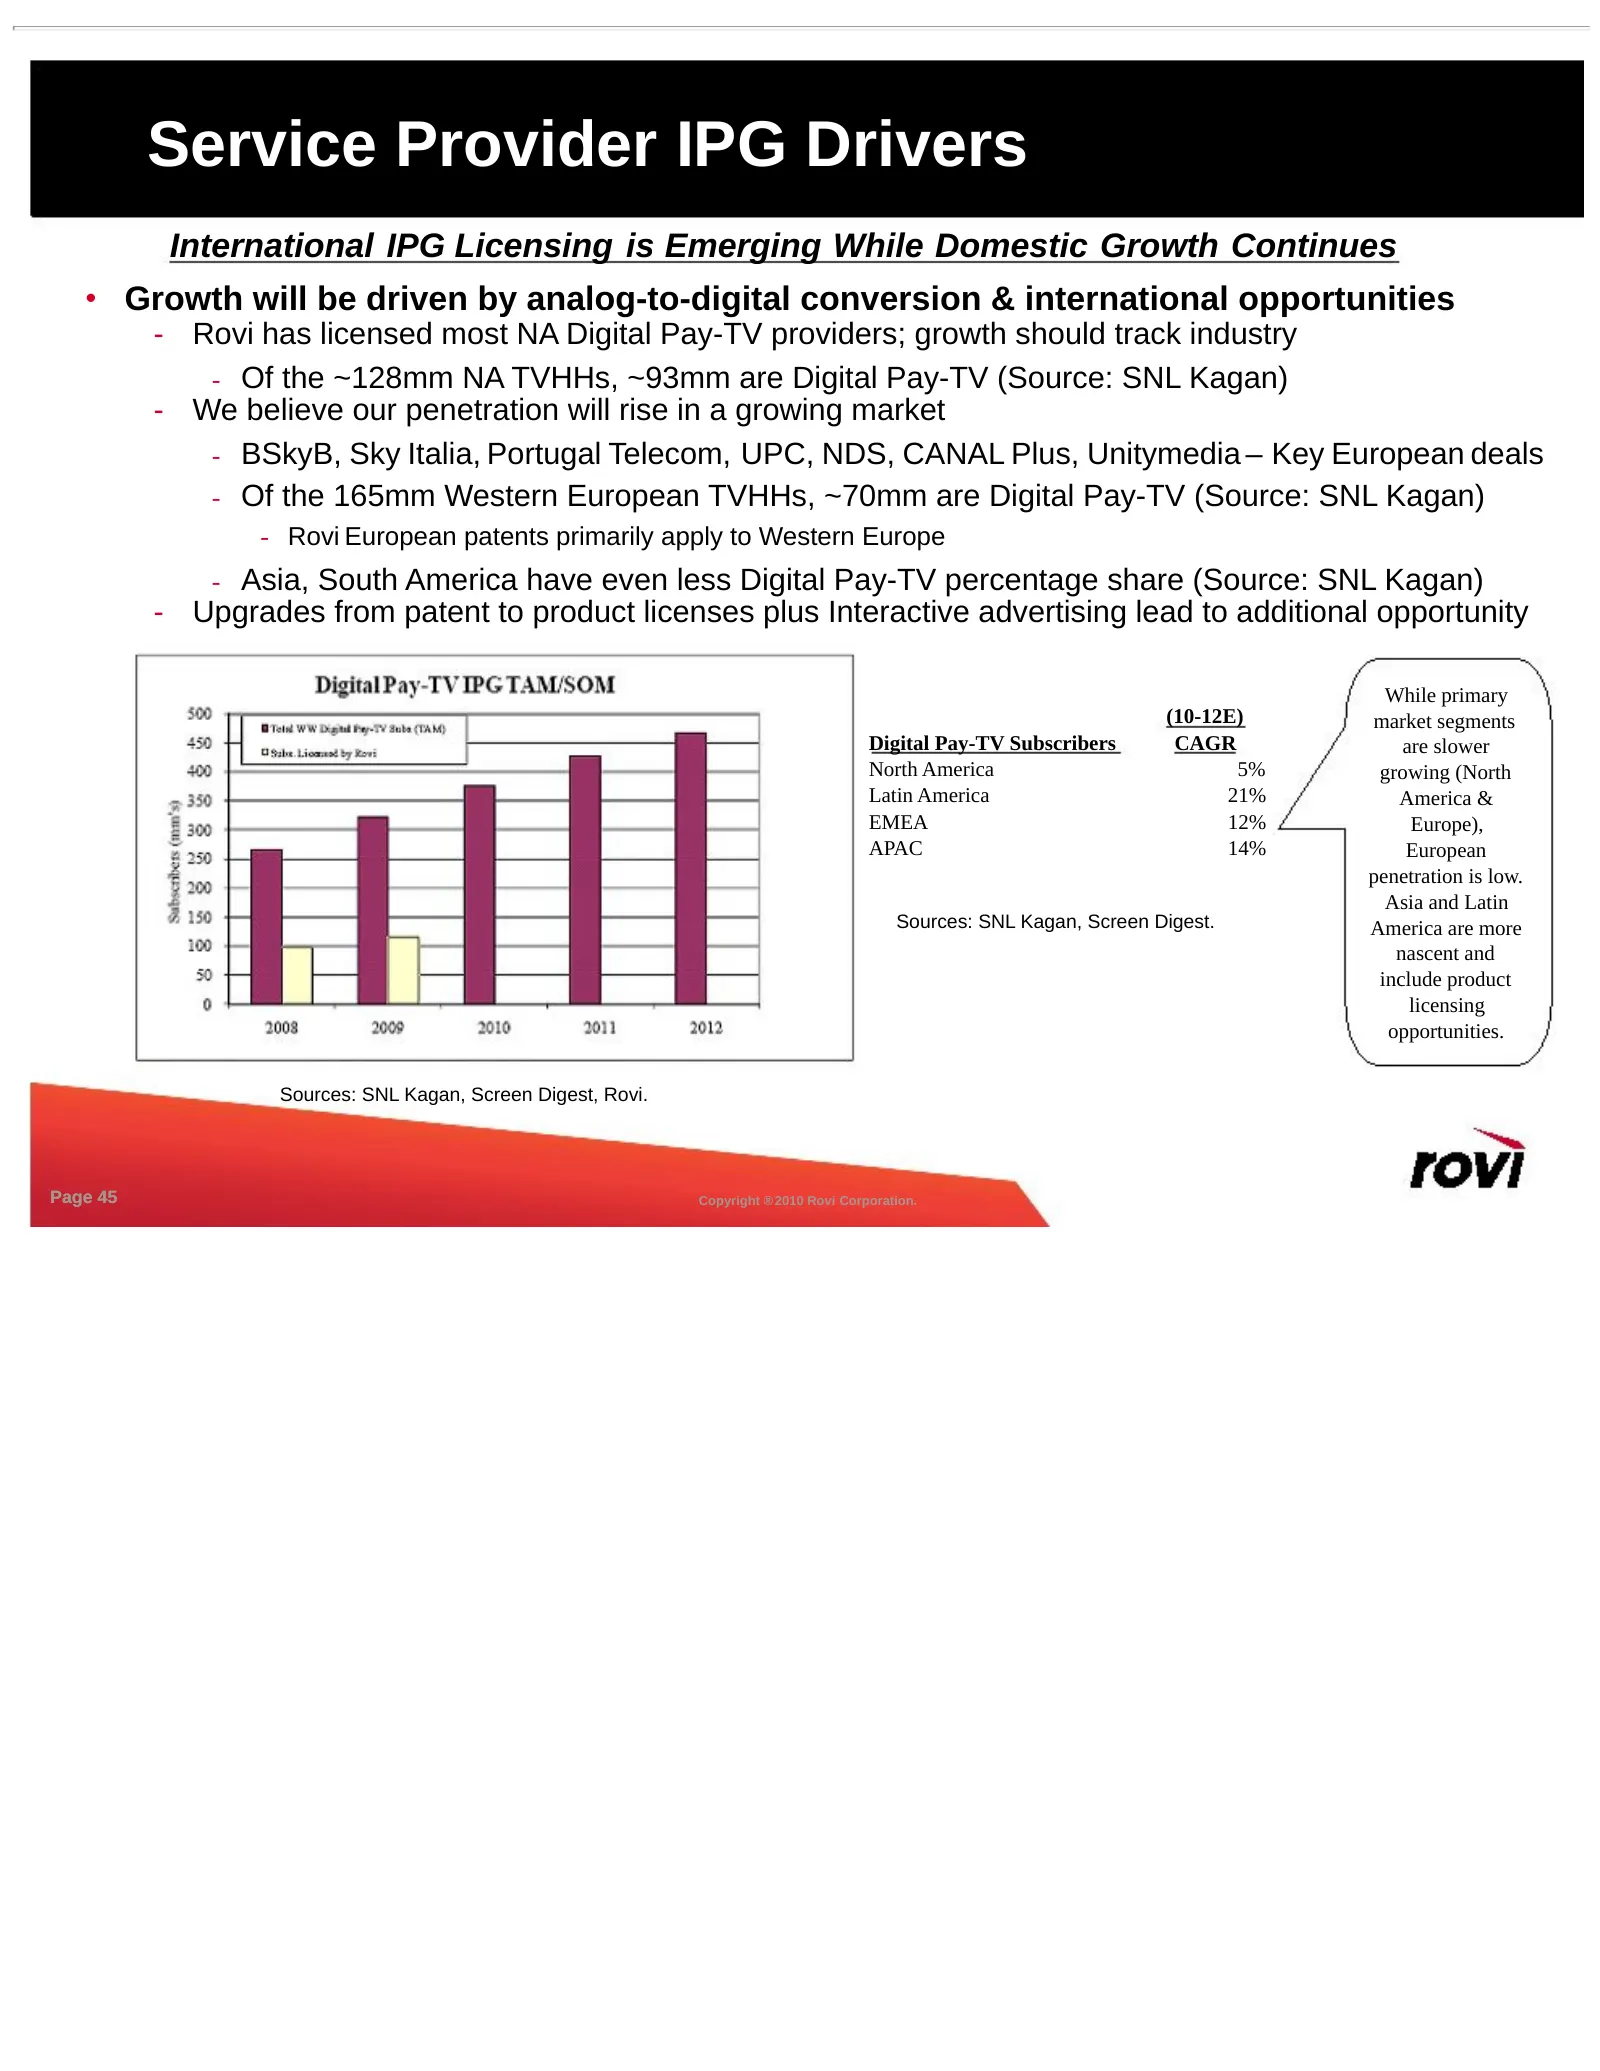
Service Provider IPG Drivers International IPG Licensing is Emerging While Domestic Growth Continues • Growth will be driven by analog-to-digital conversion & international opportunities - Rovi has licensed most NA Digital Pay-TV providers; growth should track industry - Of the ~128mm NA TVHHs, ~93m
Slide 46: Video Subs By Territory
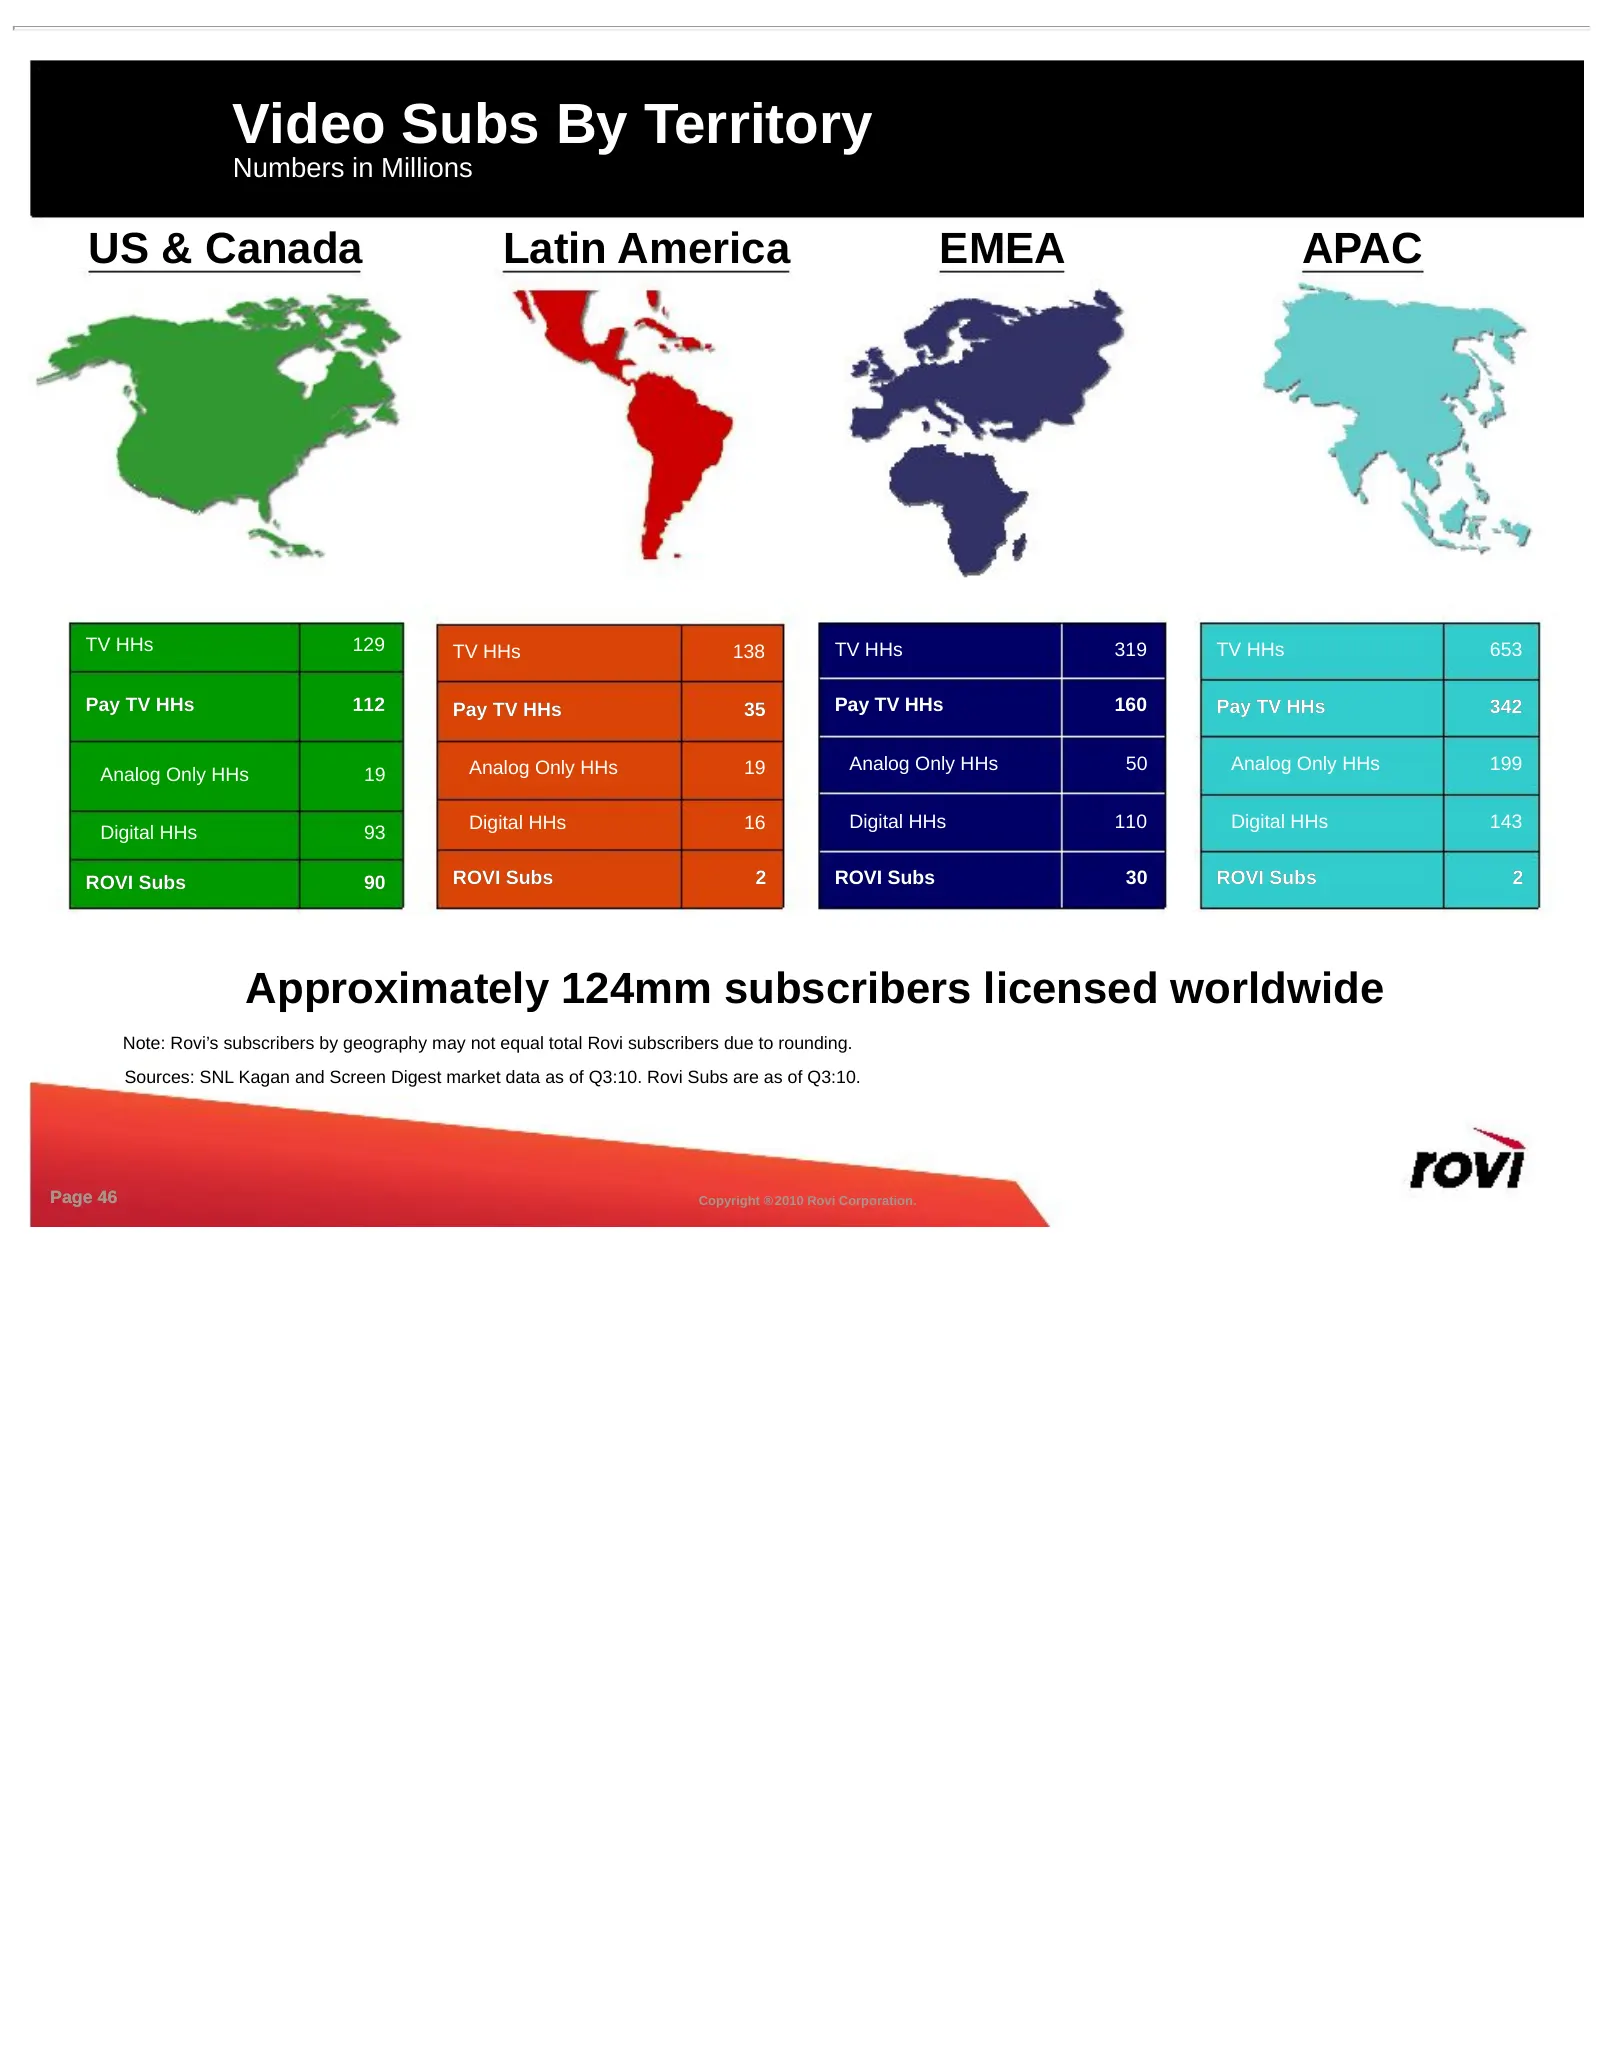
Video Subs By Territory Numbers in Millions US & Canada Latin America EMEA APAC TV HHs 129 TV HHs 138 TV HHs 319 TV HHs 653 Pay TV HHs 112 Pay TV HHs 35 Pay TV HHs 160 Pay TV HHs 342 Analog Only HHs 19 Analog Only HHs 50 Analog Only HHs 199 Analog Only HHs 19 Digital HHs 16 Digital HHs 110 Digital H
Slide 47: SP Growth Drivers
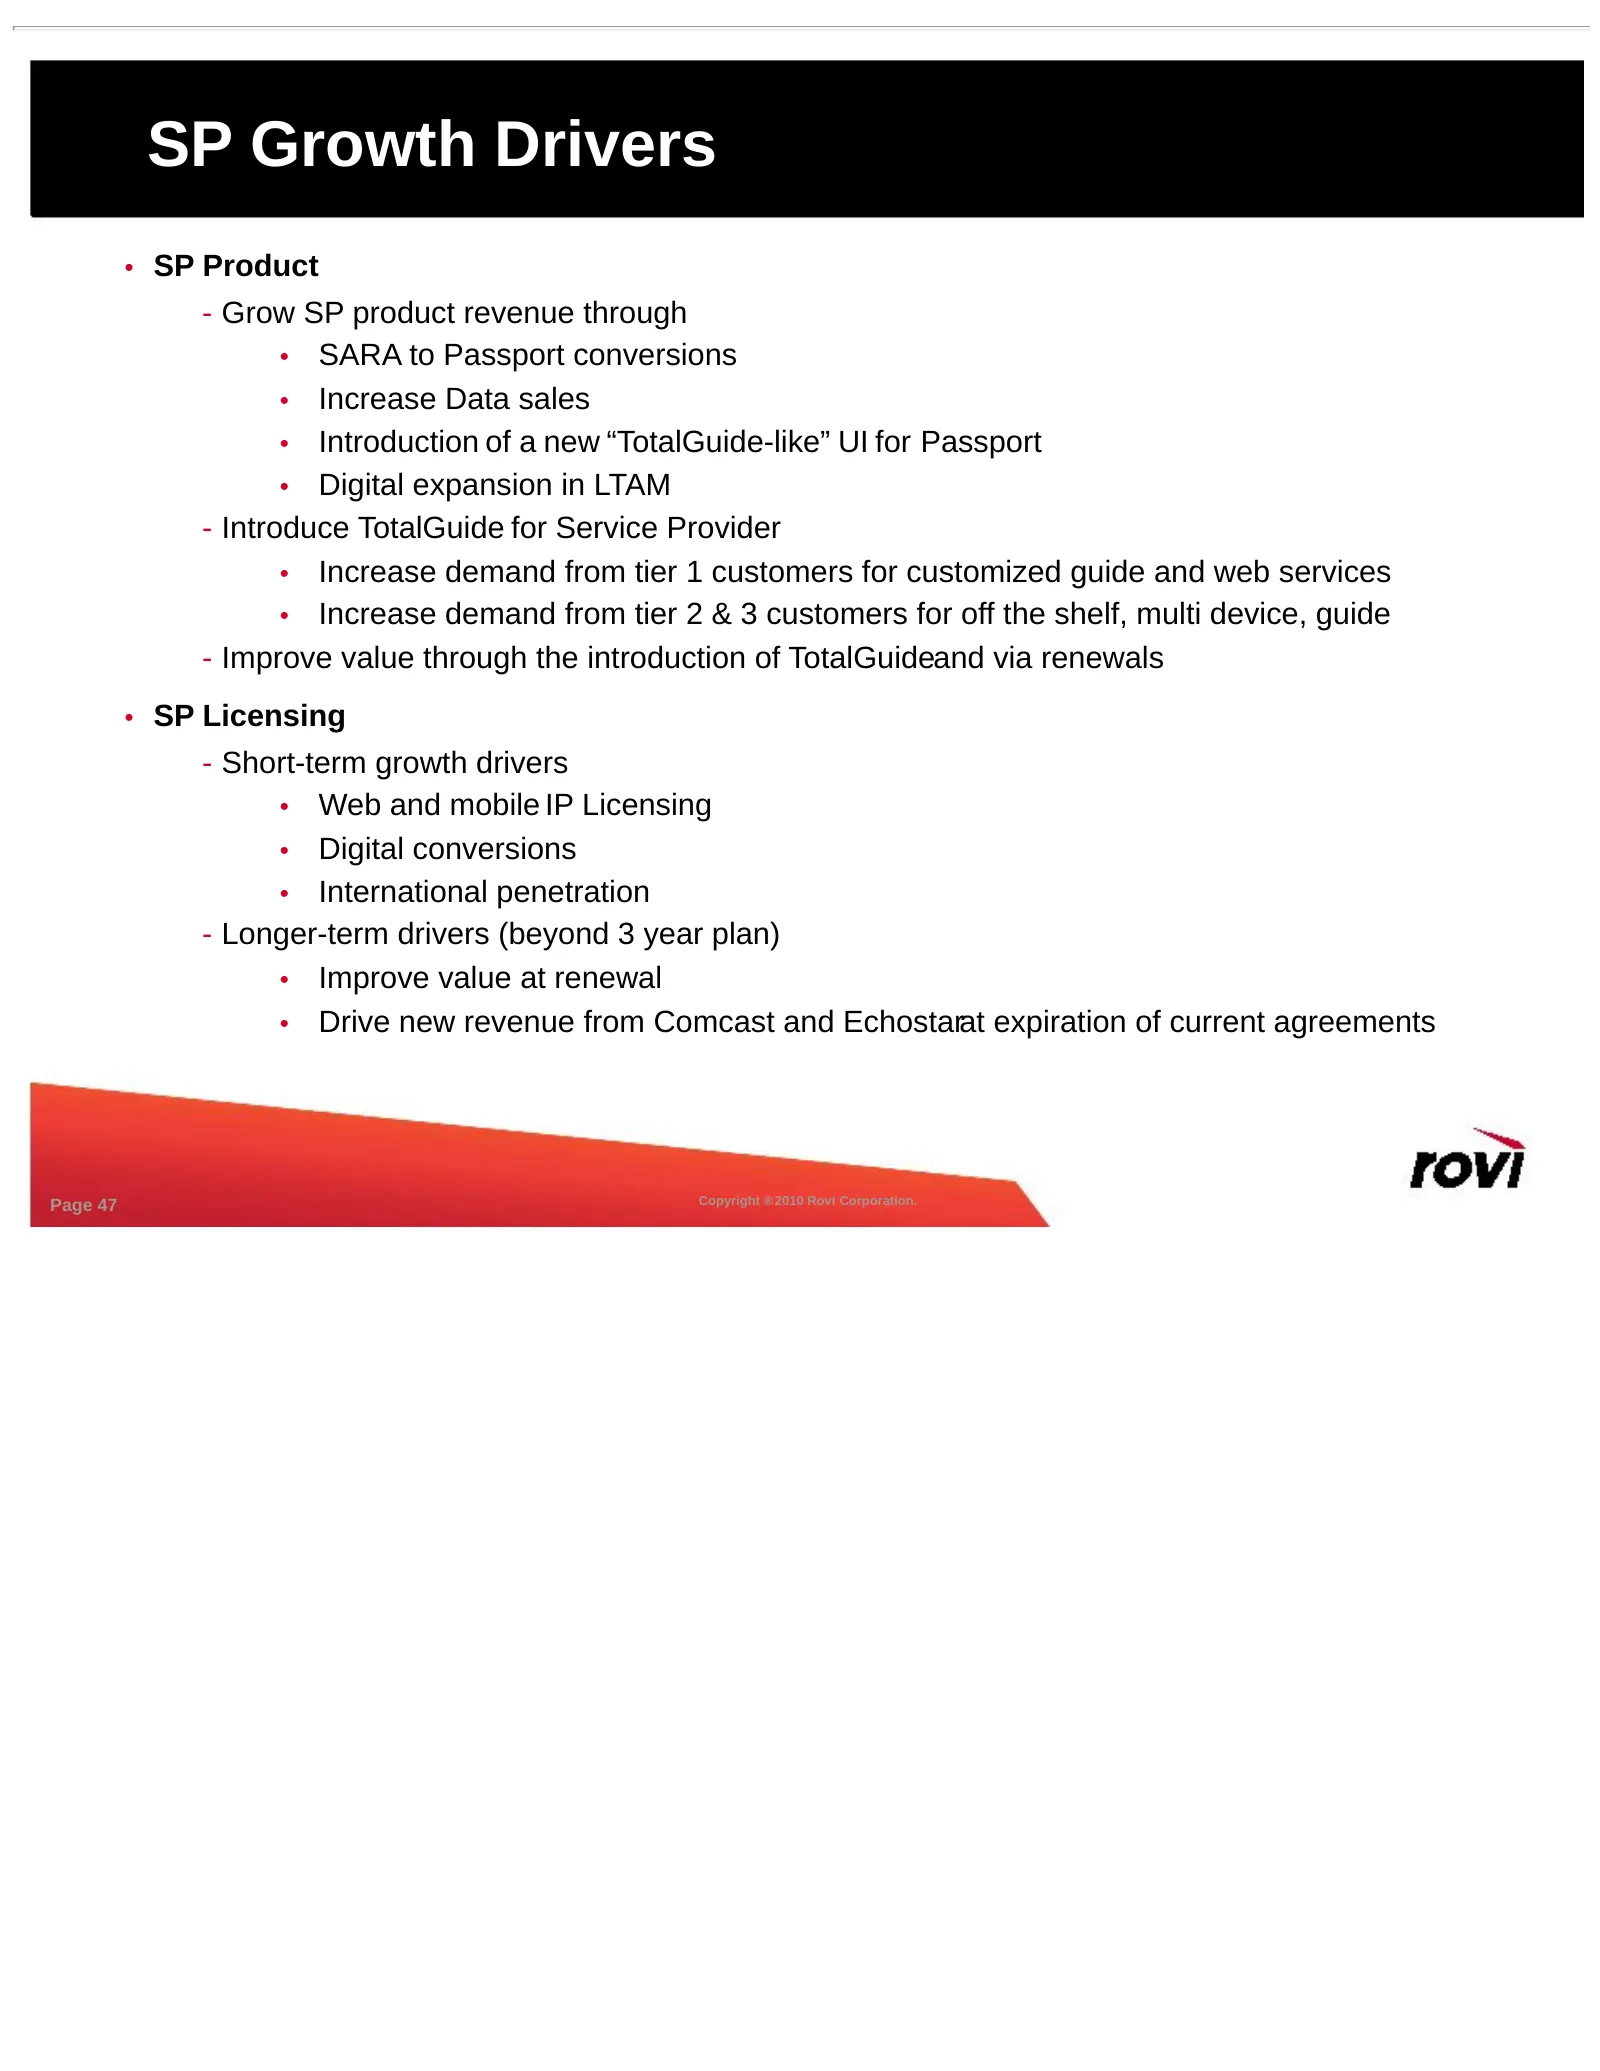
SP Growth Drivers • SP Product - Grow SP product revenue through • SARA to Passport conversions • Increase Data sales • Introduction of a new “TotalGuide-like” UI for Passport • Digital expansion in LTAM - Introduce TotalGuide for Service Provider • Increase demand from tier 1 customers for customiz
Slide 48: CE IPG Opportunity
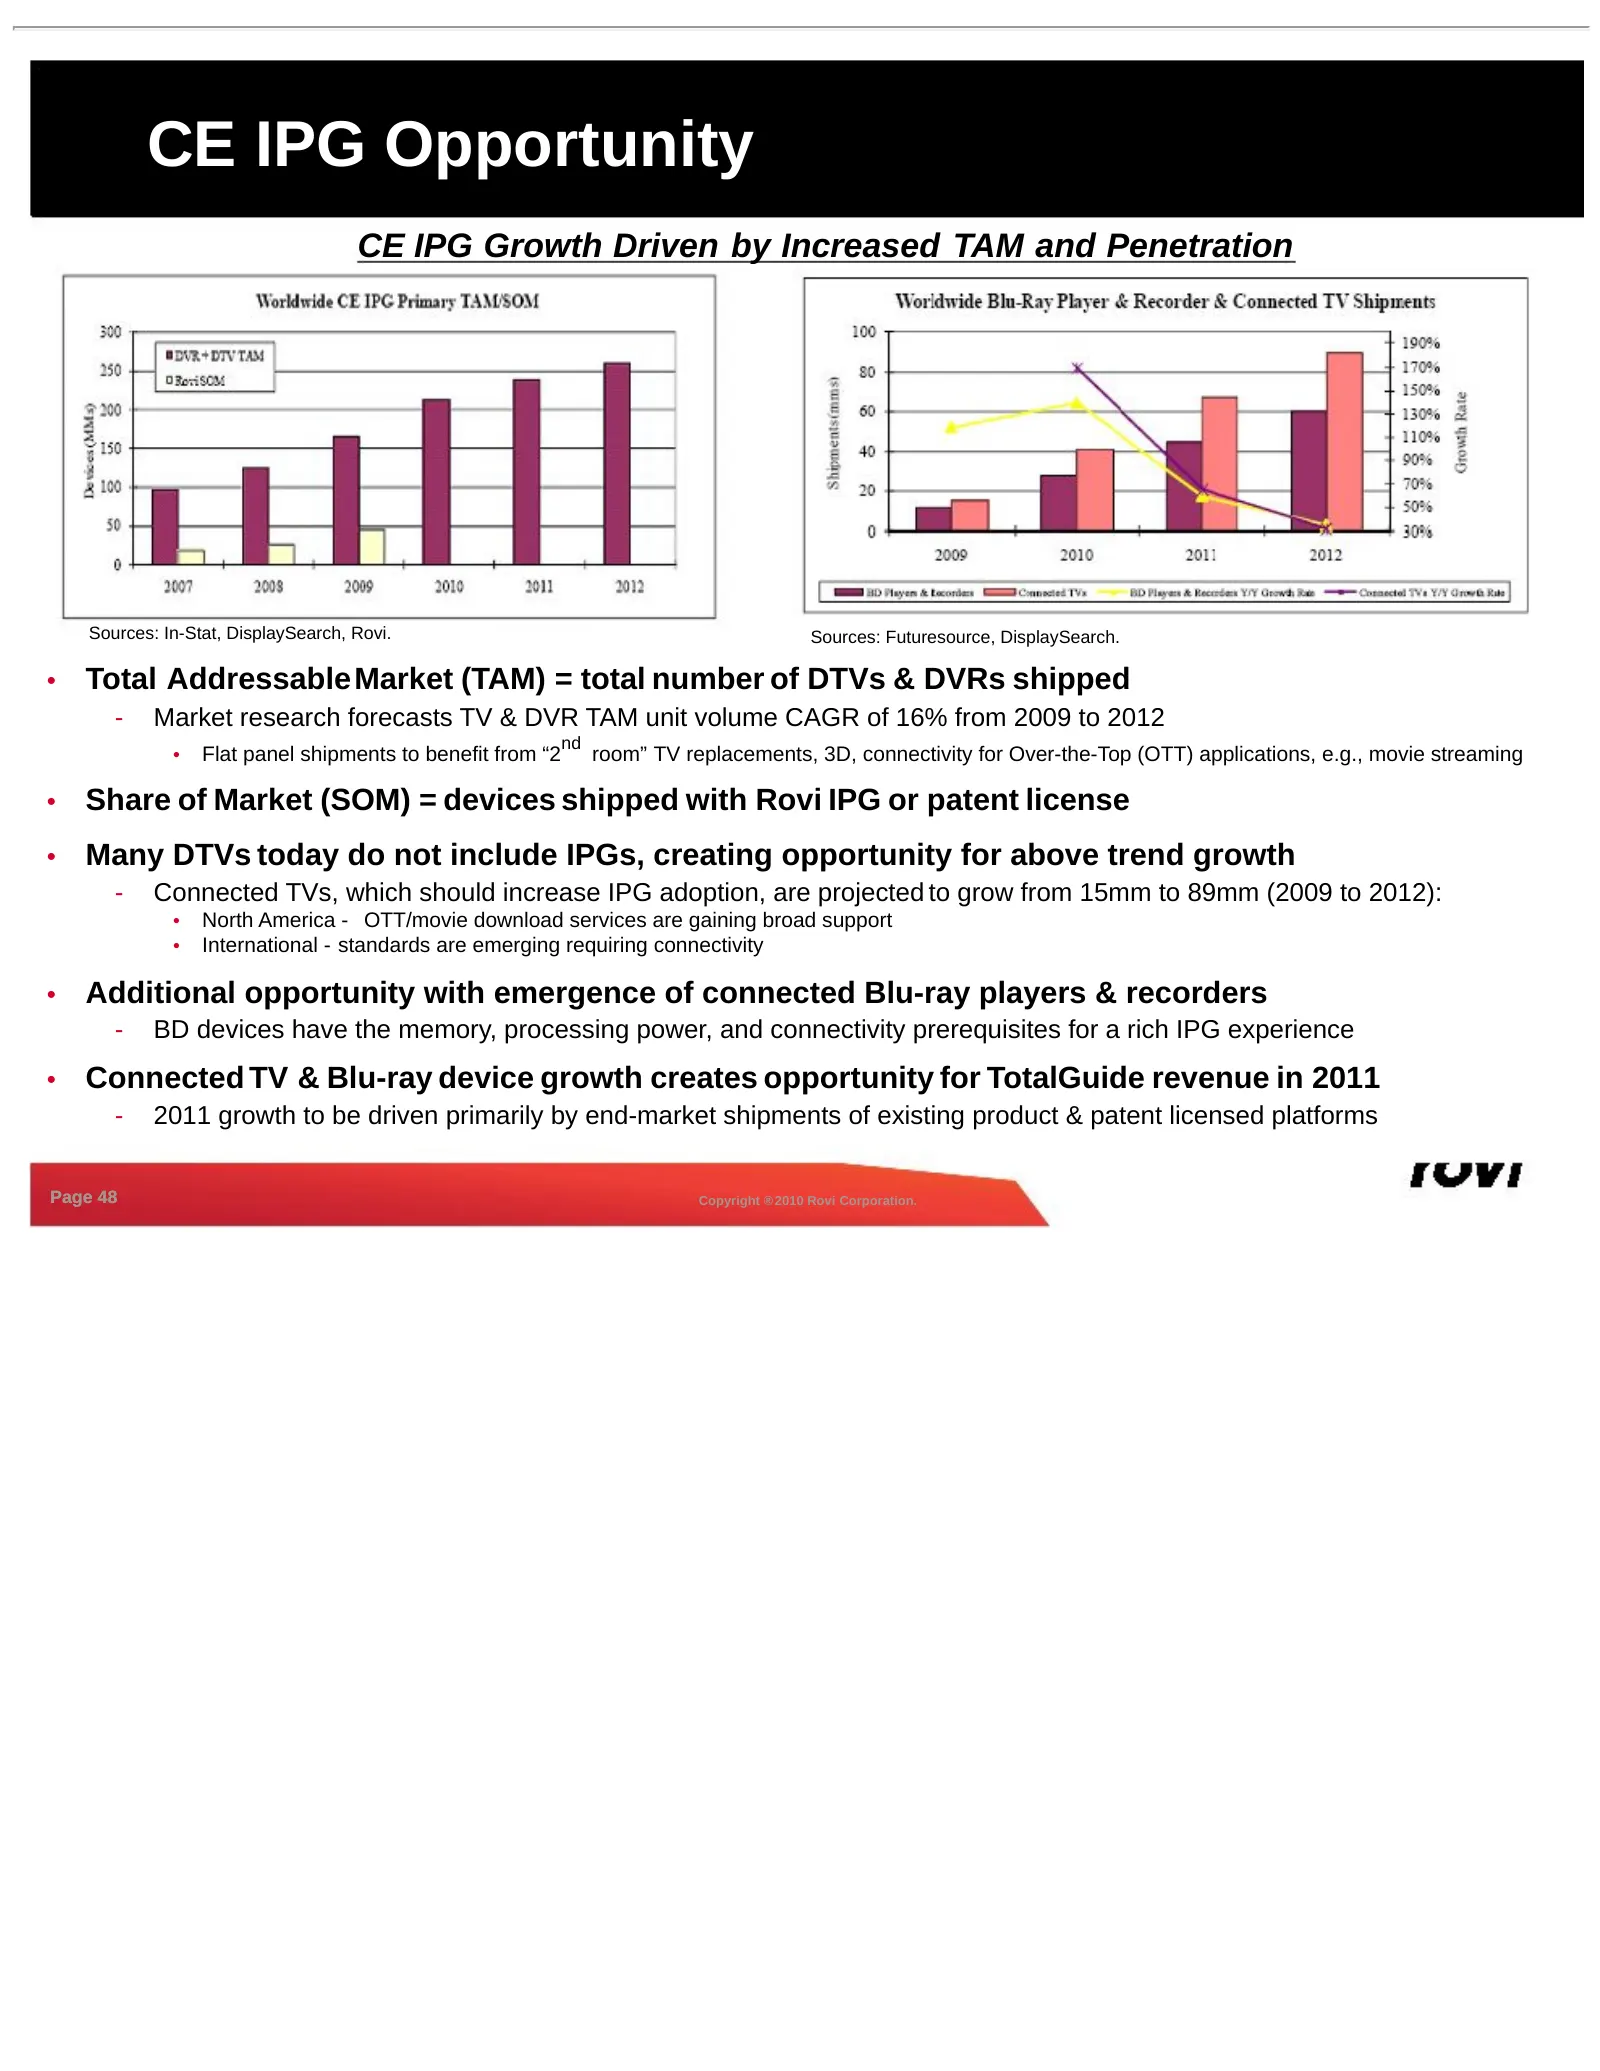
CE IPG Opportunity CE IPG Growth Driven by Increased TAM and Penetration Sources: In-Stat, DisplaySearch, Rovi. Sources: Futuresource, DisplaySearch. • Total Addressable Market (TAM) = total number of DTVs & DVRs shipped - Market research forecasts TV & DVR TAM unit volume CAGR of 16% from 2009 to 2
Slide 49: CE Growth Drivers & Assumptions
CE Growth Drivers & Assumptions • CE Product - CE Guides • TotalGuide off-the-shelf for sub tier 1 manufacturers • TotalGuide web services/RMC and data for tier 1 manufacturers • Increase in number of devices shipped & revenue per device - ACP & VCR+ • VCR+ goes to $0 by 2011 • Analog copy protectio
Slide 50: Visibility is Largely a Function of Patent Duration & Inclusion in Standards
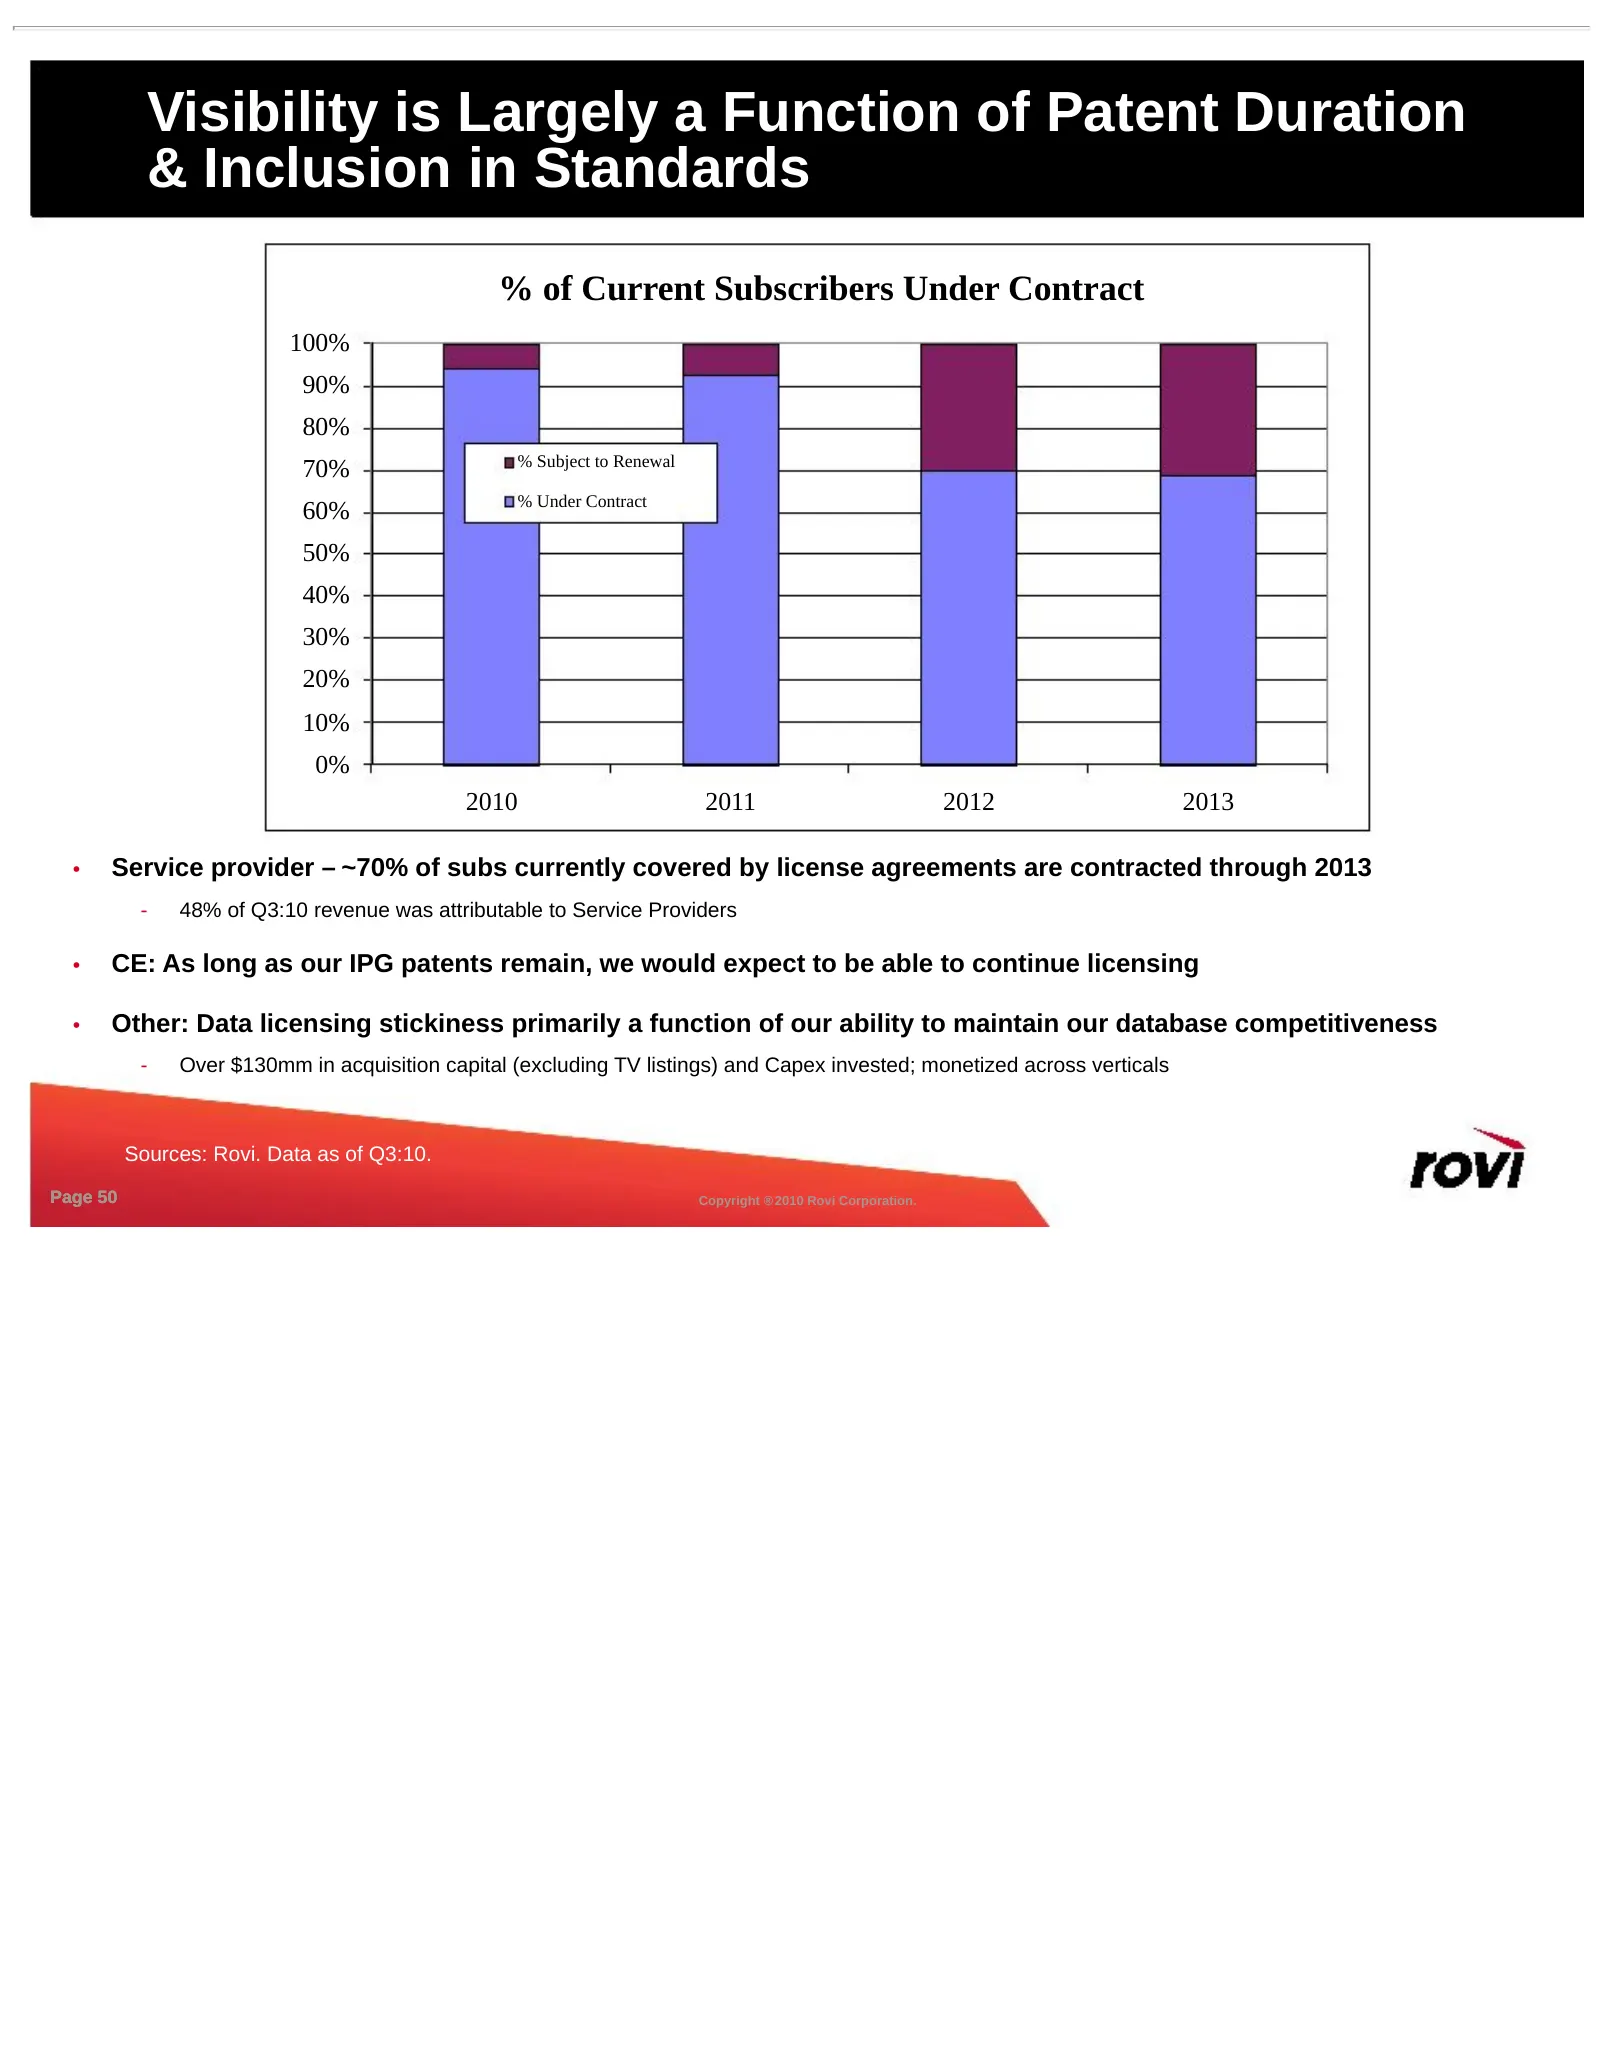
Visibility is Largely a Function of Patent Duration & Inclusion in Standards % of Current Subscribers Under Contract 100% 90% 80% % Subject to Renewal 70% % Under Contract 60% 50% 40% 30% 20% 10% 0% 2010 2011 2012 2013 • Service provider – ~70% of subs currently covered by license agreements are con
Slide 51: Revenue Split to Resemble Prior Years
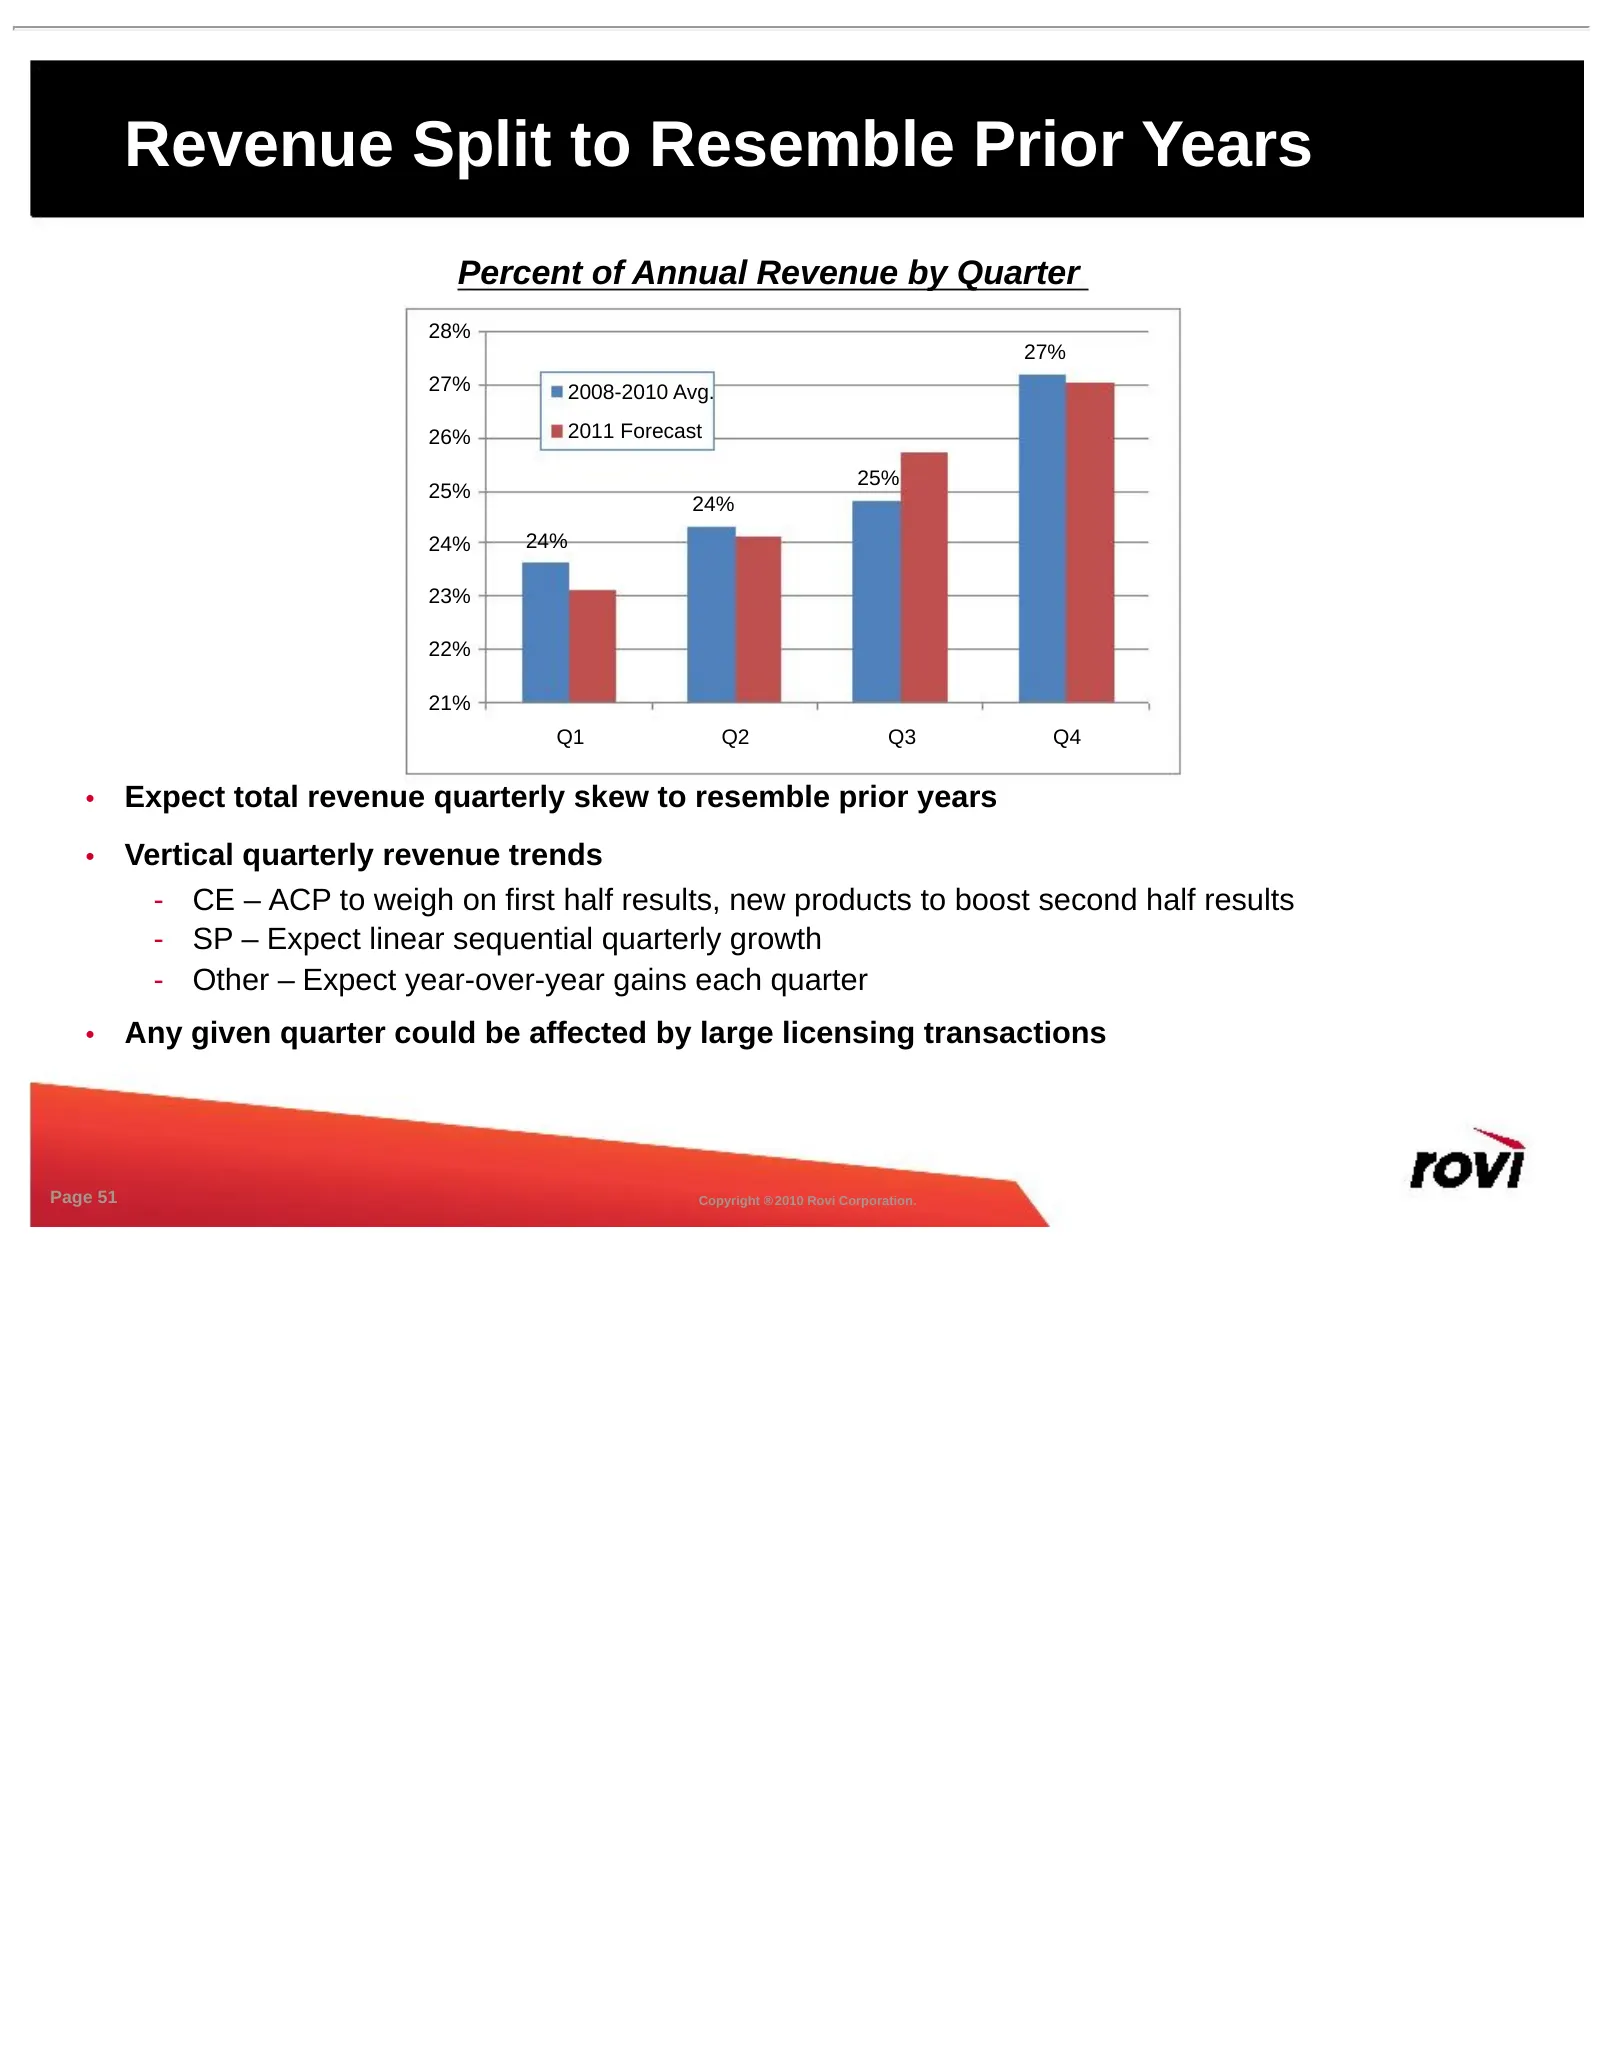
Revenue Split to Resemble Prior Years Percent of Annual Revenue by Quarter 28% 27% 27% 2008-2010 Avg. 26% 2011 Forecast 25% 25% 24% 24% 24% 23% 22% 21% Q1 Q2 Q3 Q4 • Expect total revenue quarterly skew to resemble prior years • Vertical quarterly revenue trends - CE – ACP to weigh on first half resu
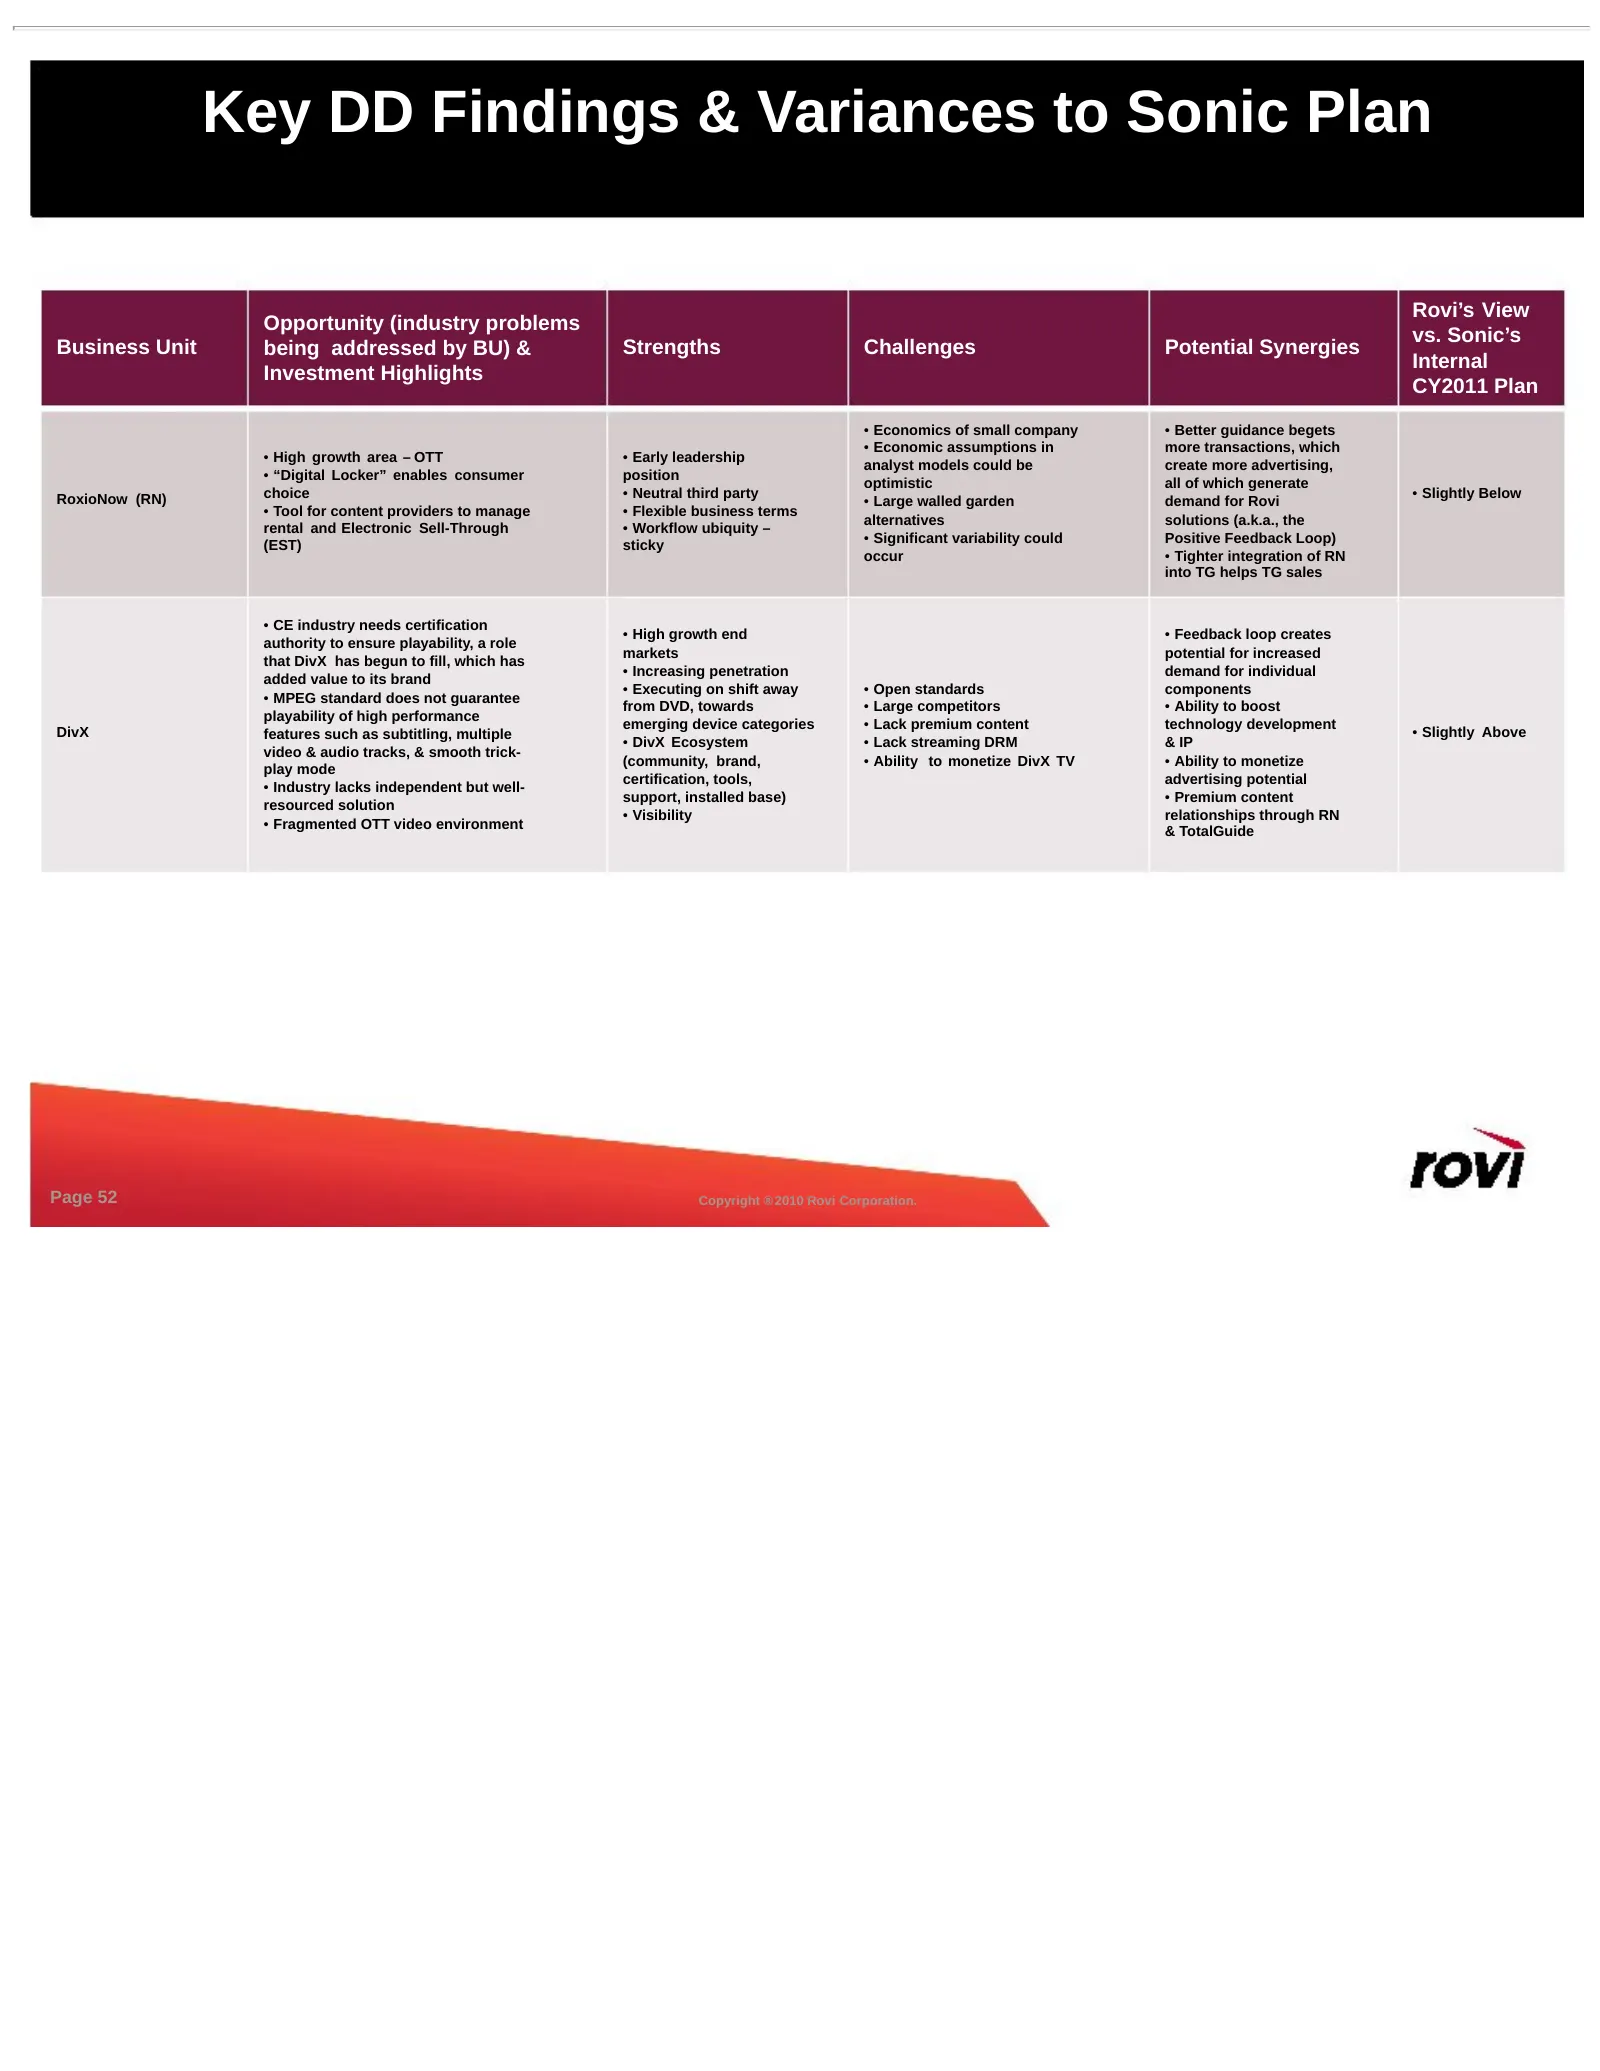
Slide 52: Key DD Findings & Variances to Sonic Plan
Key DD Findings & Variances to Sonic Plan Rovi’s View Opportunity (industry problems vs. Sonic’s Business Unit being addressed by BU) & Strengths Challenges Potential Synergies Internal Investment Highlights CY2011 Plan • Economics of small company • Better guidance begets • Economic assumptions in
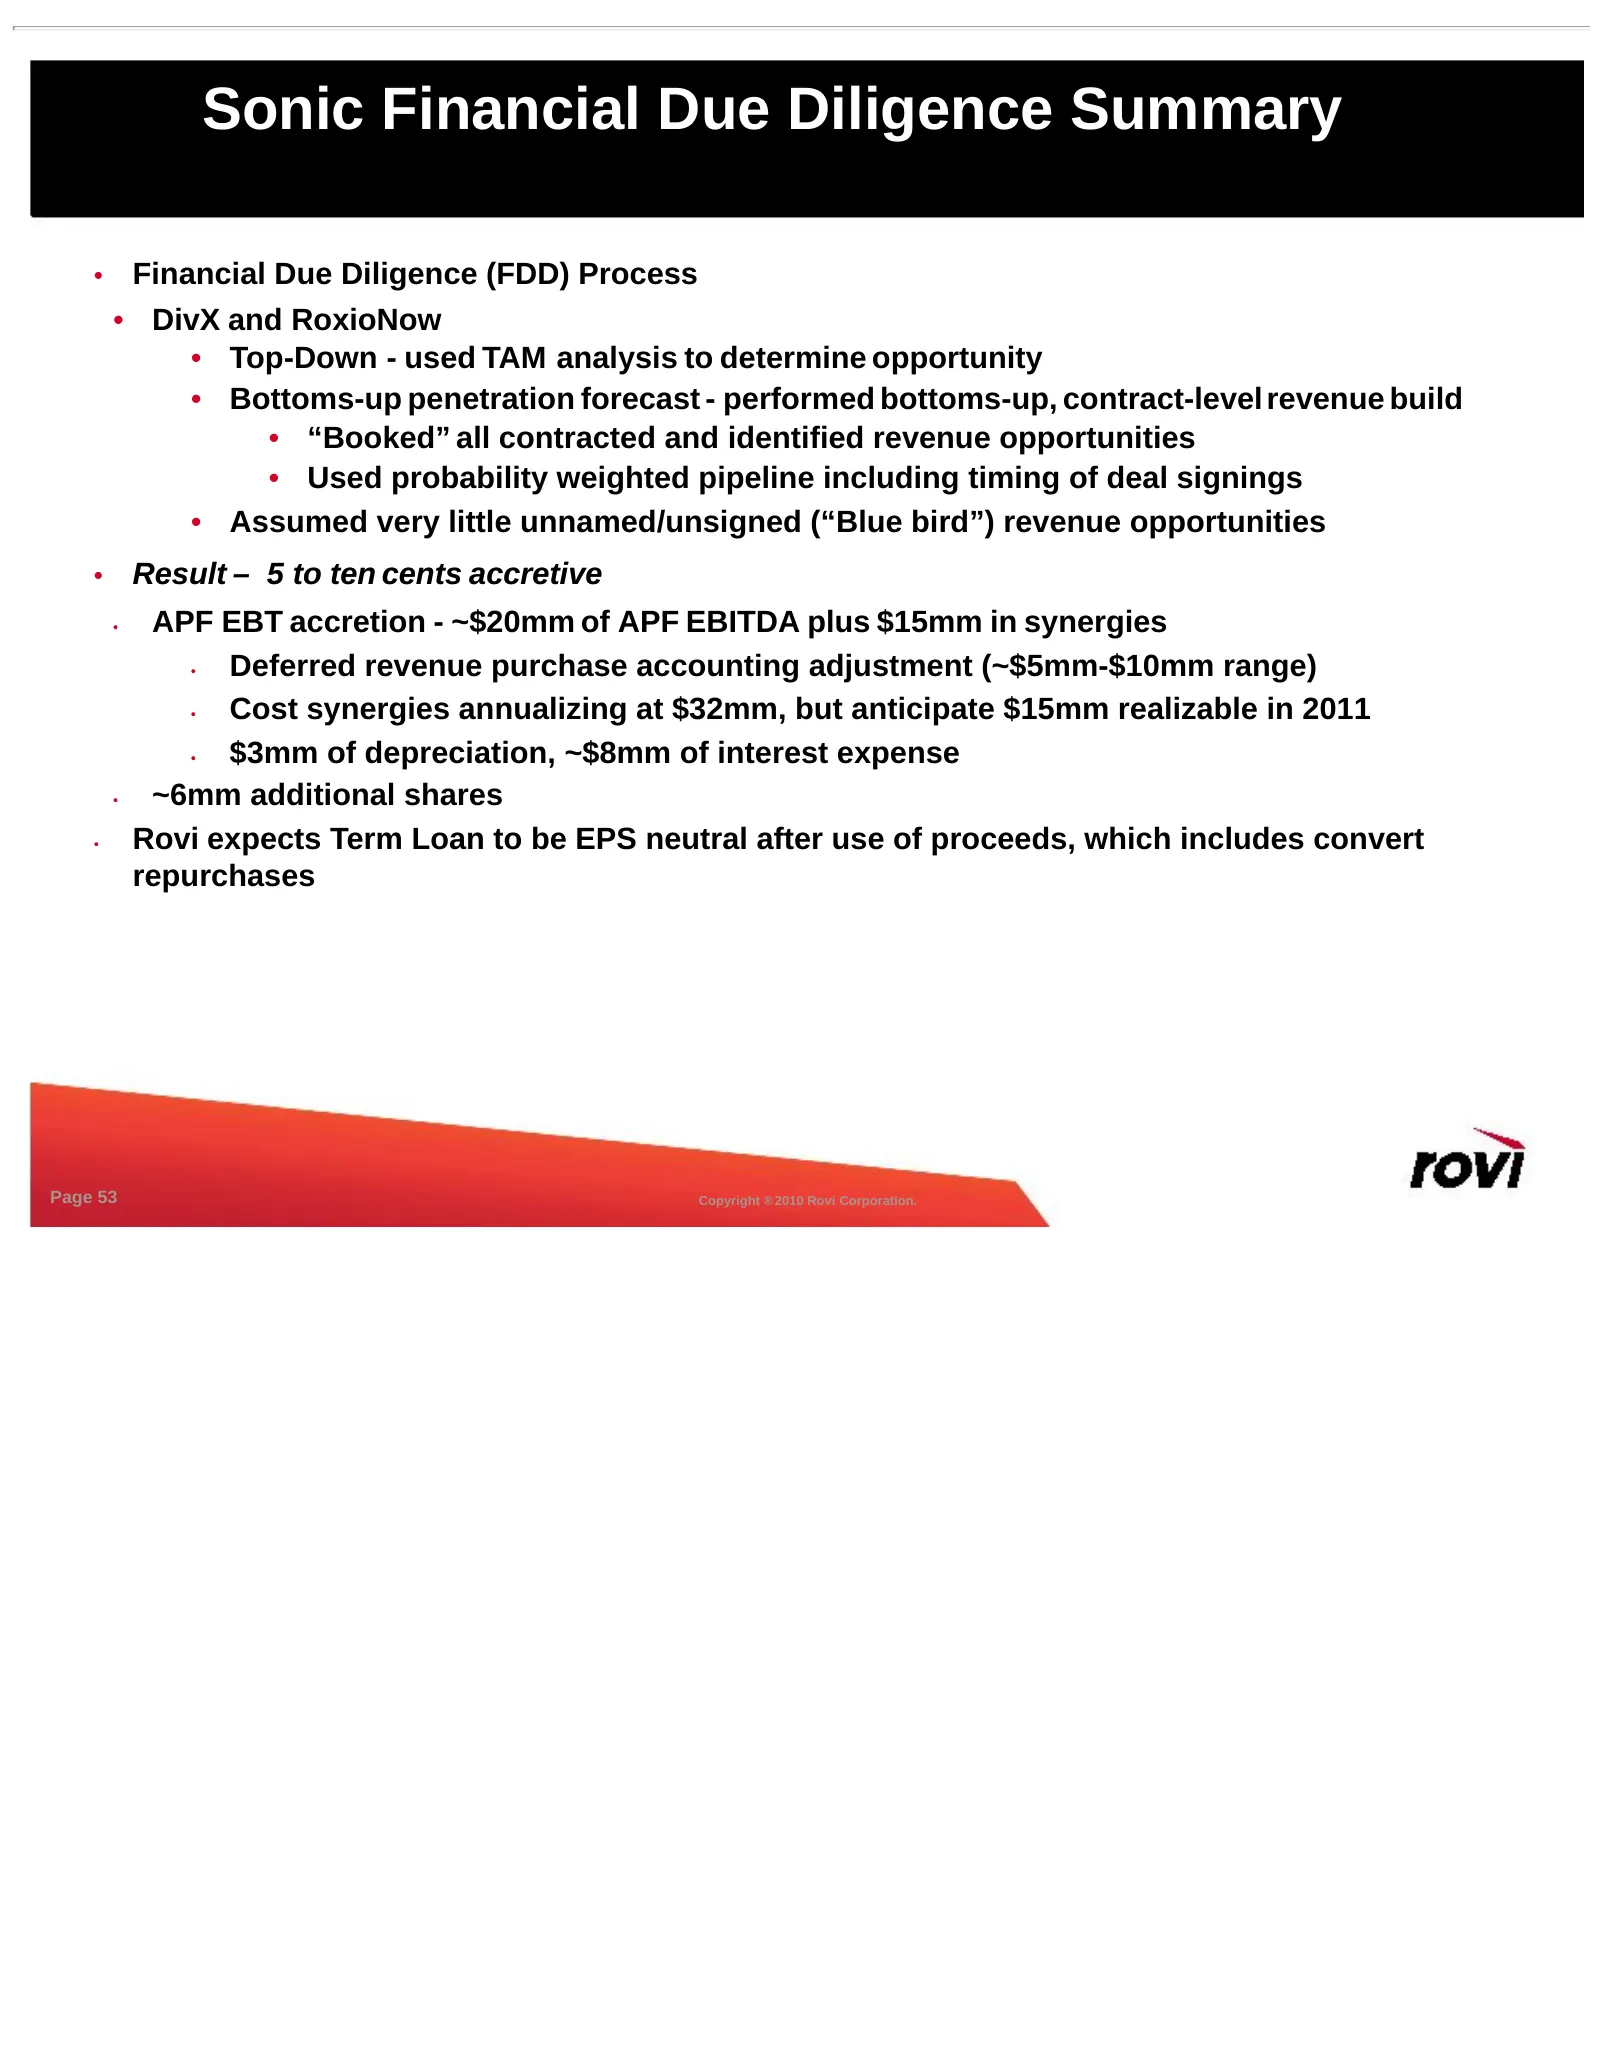
Slide 53: Sonic Financial Due Diligence Summary
Sonic Financial Due Diligence Summary • Financial Due Diligence (FDD) Process • DivX and RoxioNow • Top-Down - used TAM analysis to determine opportunity • Bottoms-up penetration forecast - performed bottoms-up, contract-level revenue build • “Booked” all contracted and identified revenue opportunit
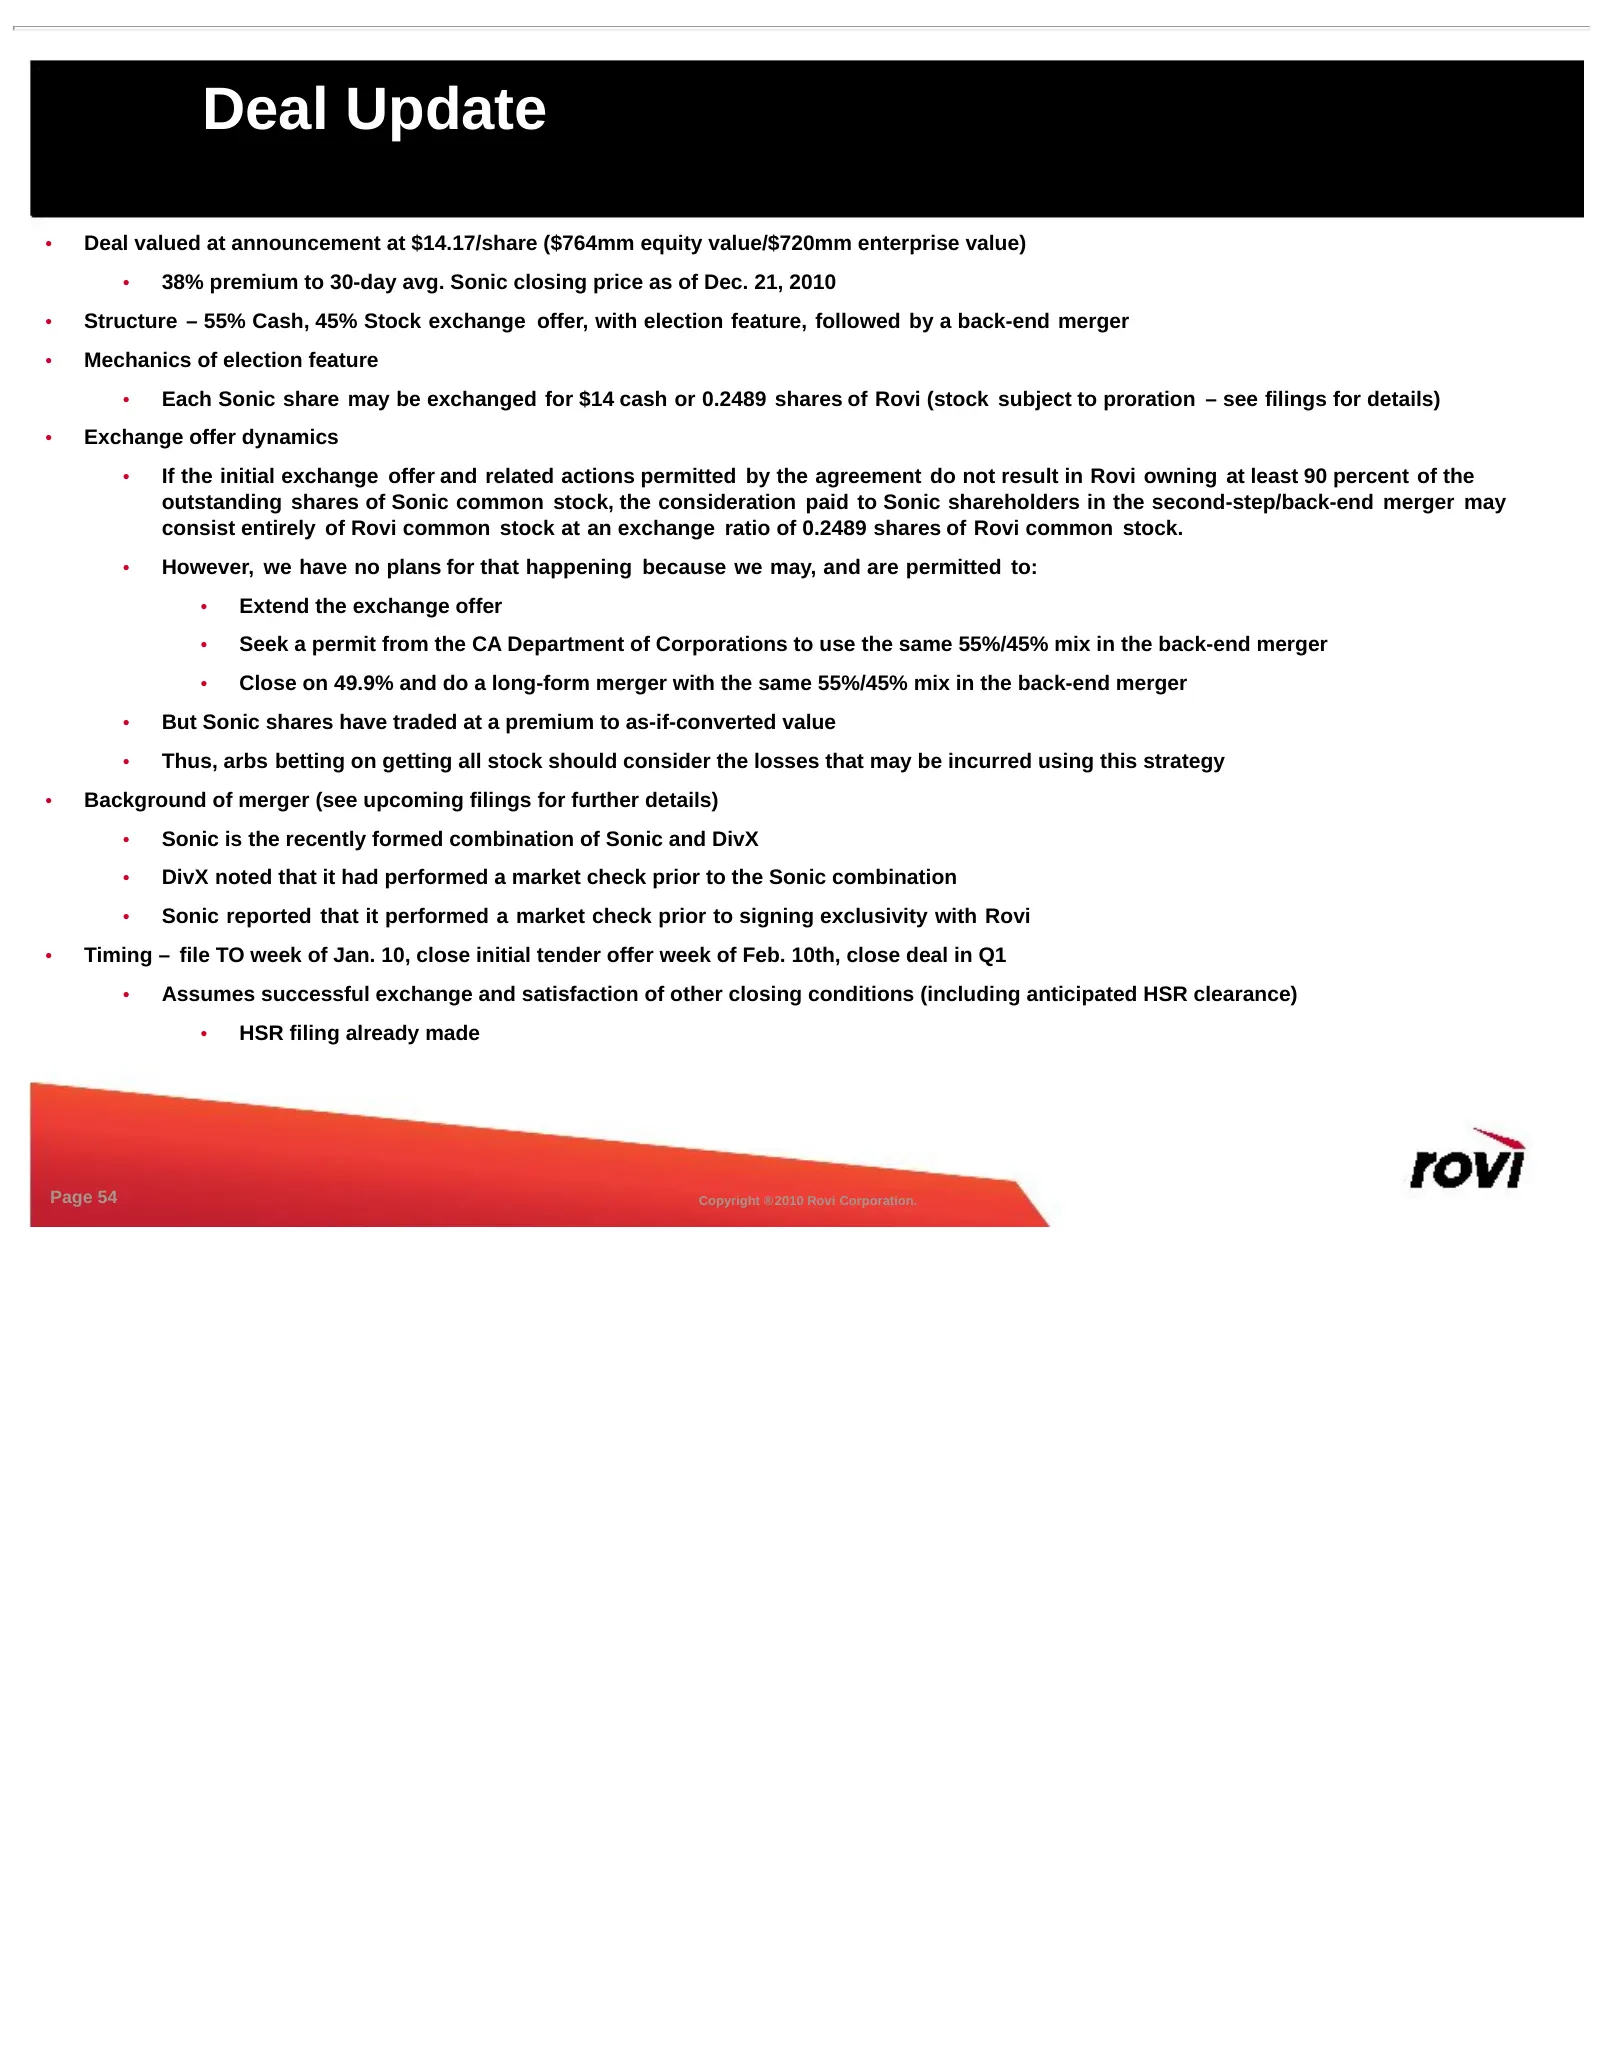
Slide 54: Deal Update
Deal Update • Deal valued at announcement at $14.17/share ($764mm equity value/$720mm enterprise value) • 38% premium to 30-day avg. Sonic closing price as of Dec. 21, 2010 • Structure – 55% Cash, 45% Stock exchange offer, with election feature, followed by a back-end merger • Mechanics of election
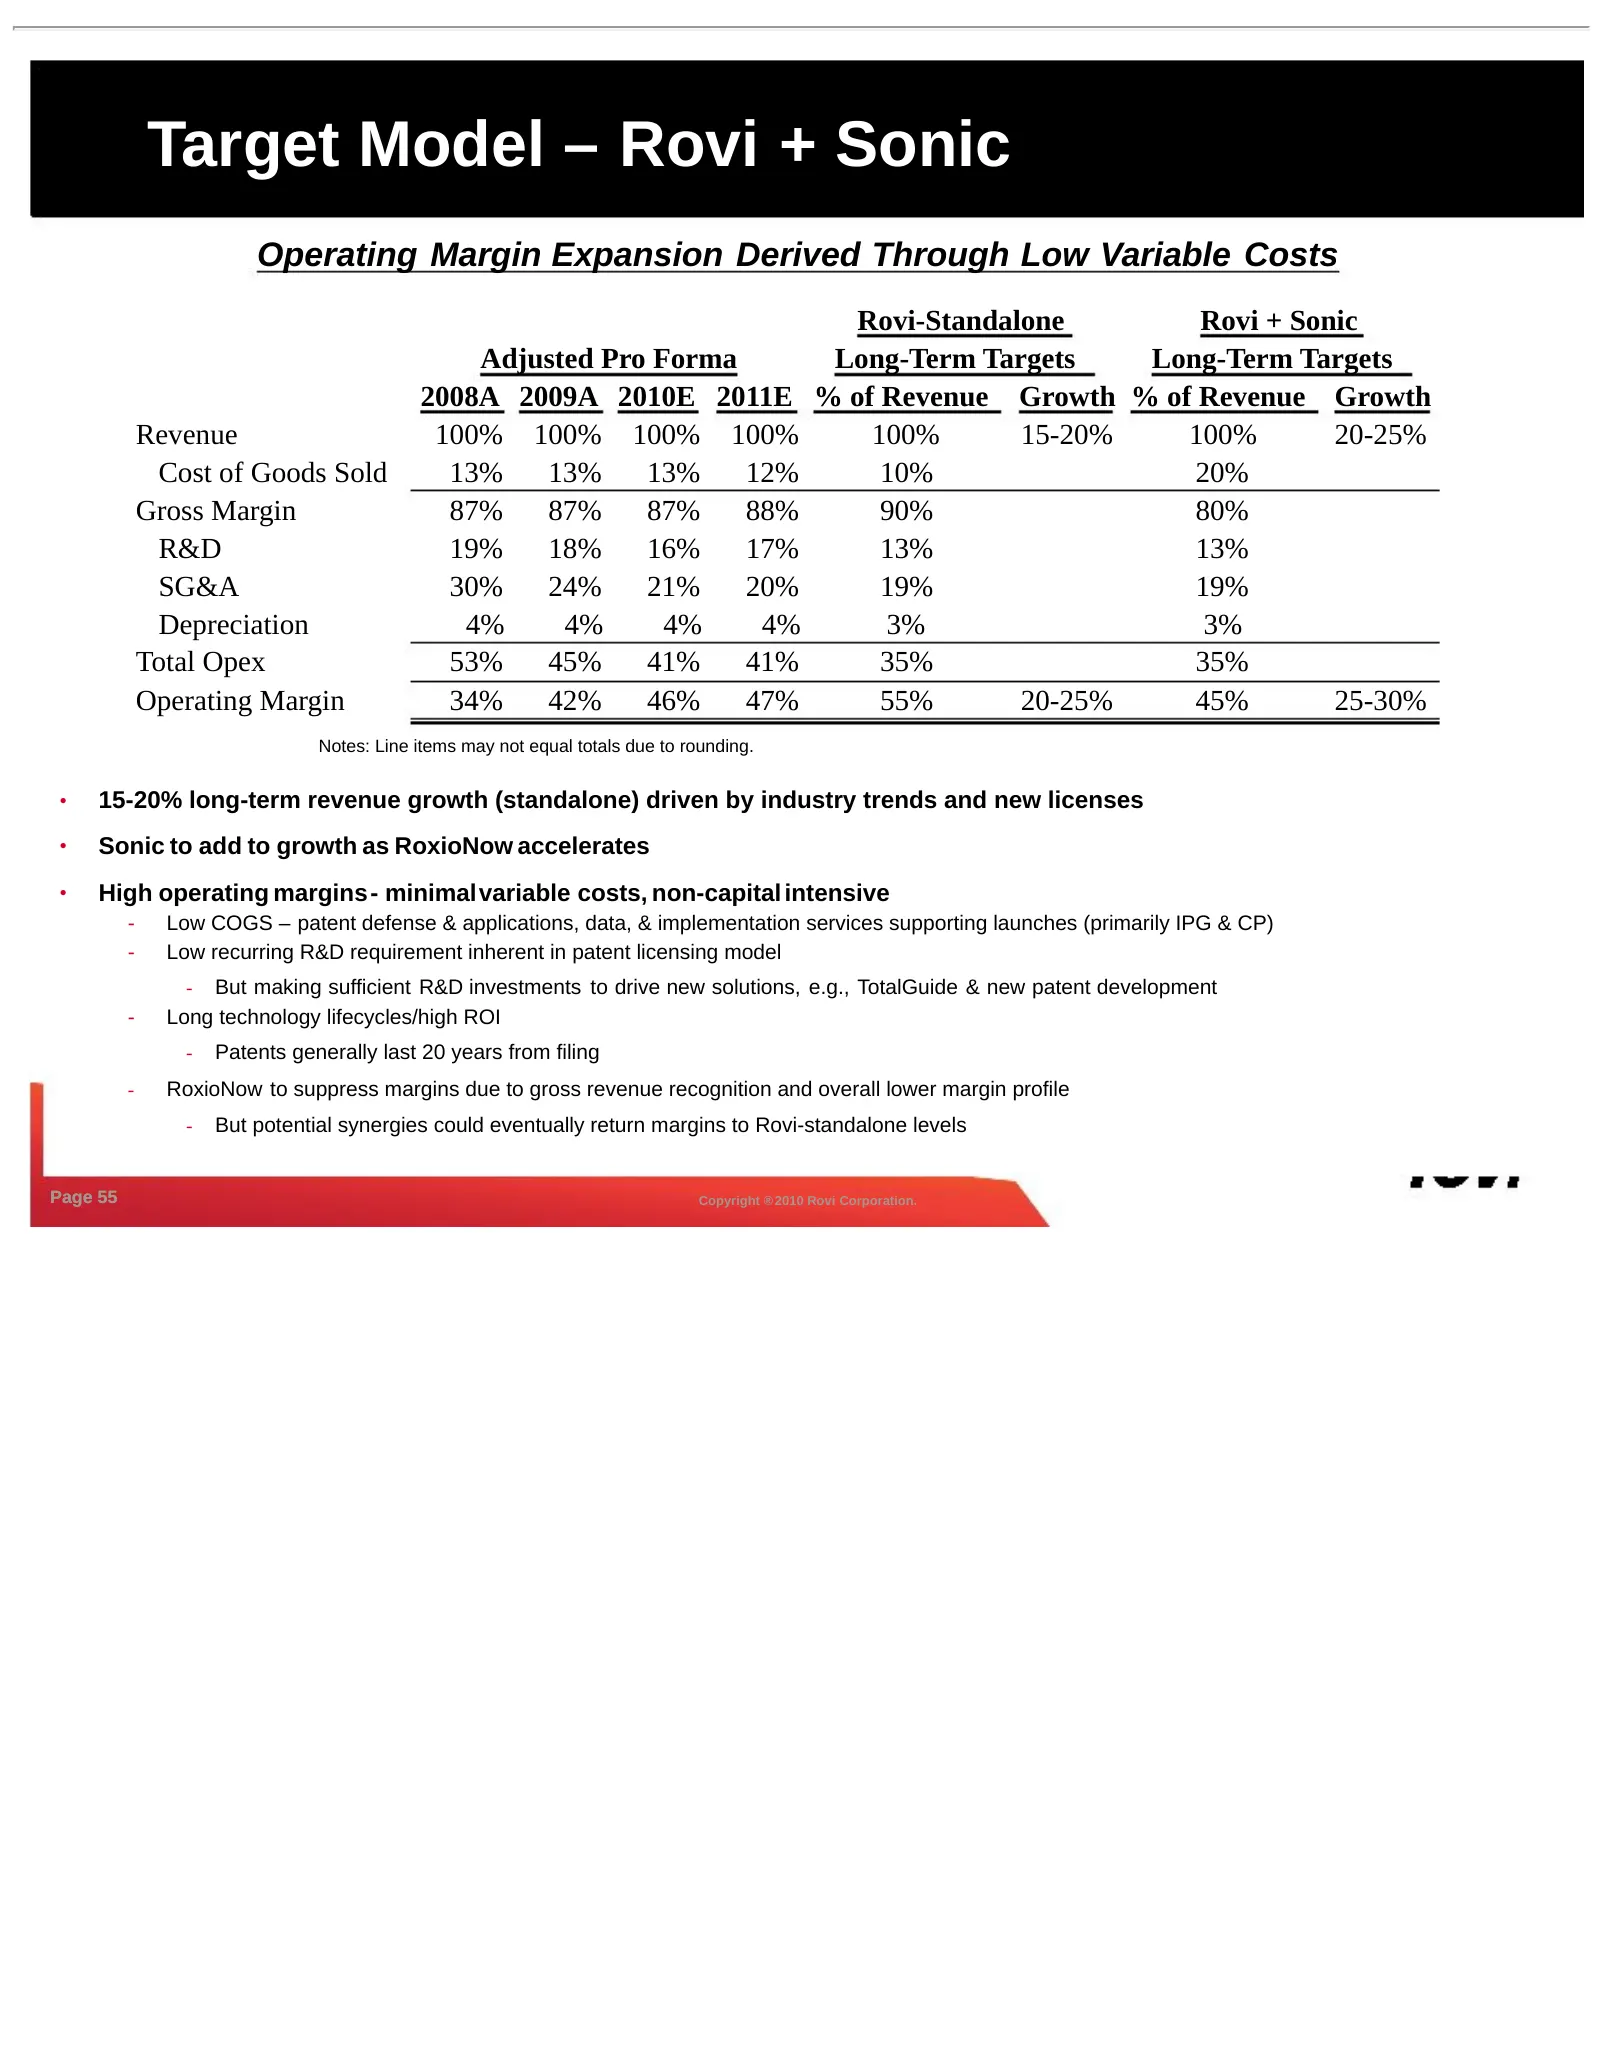
Slide 55: Target Model – Rovi + Sonic
Target Model – Rovi + Sonic Operating Margin Expansion Derived Through Low Variable Costs Rovi-Standalone Rovi + Sonic Adjusted Pro Forma Long-Term Targets Long-Term Targets 2008A 2009A 2010E 2011E % of Revenue Growth % of Revenue Growth Revenue 100% 100% 100% 100% 100% 15-20% 100% 20-25% Cost of Go
Slide 56: Summary Investment Highlights
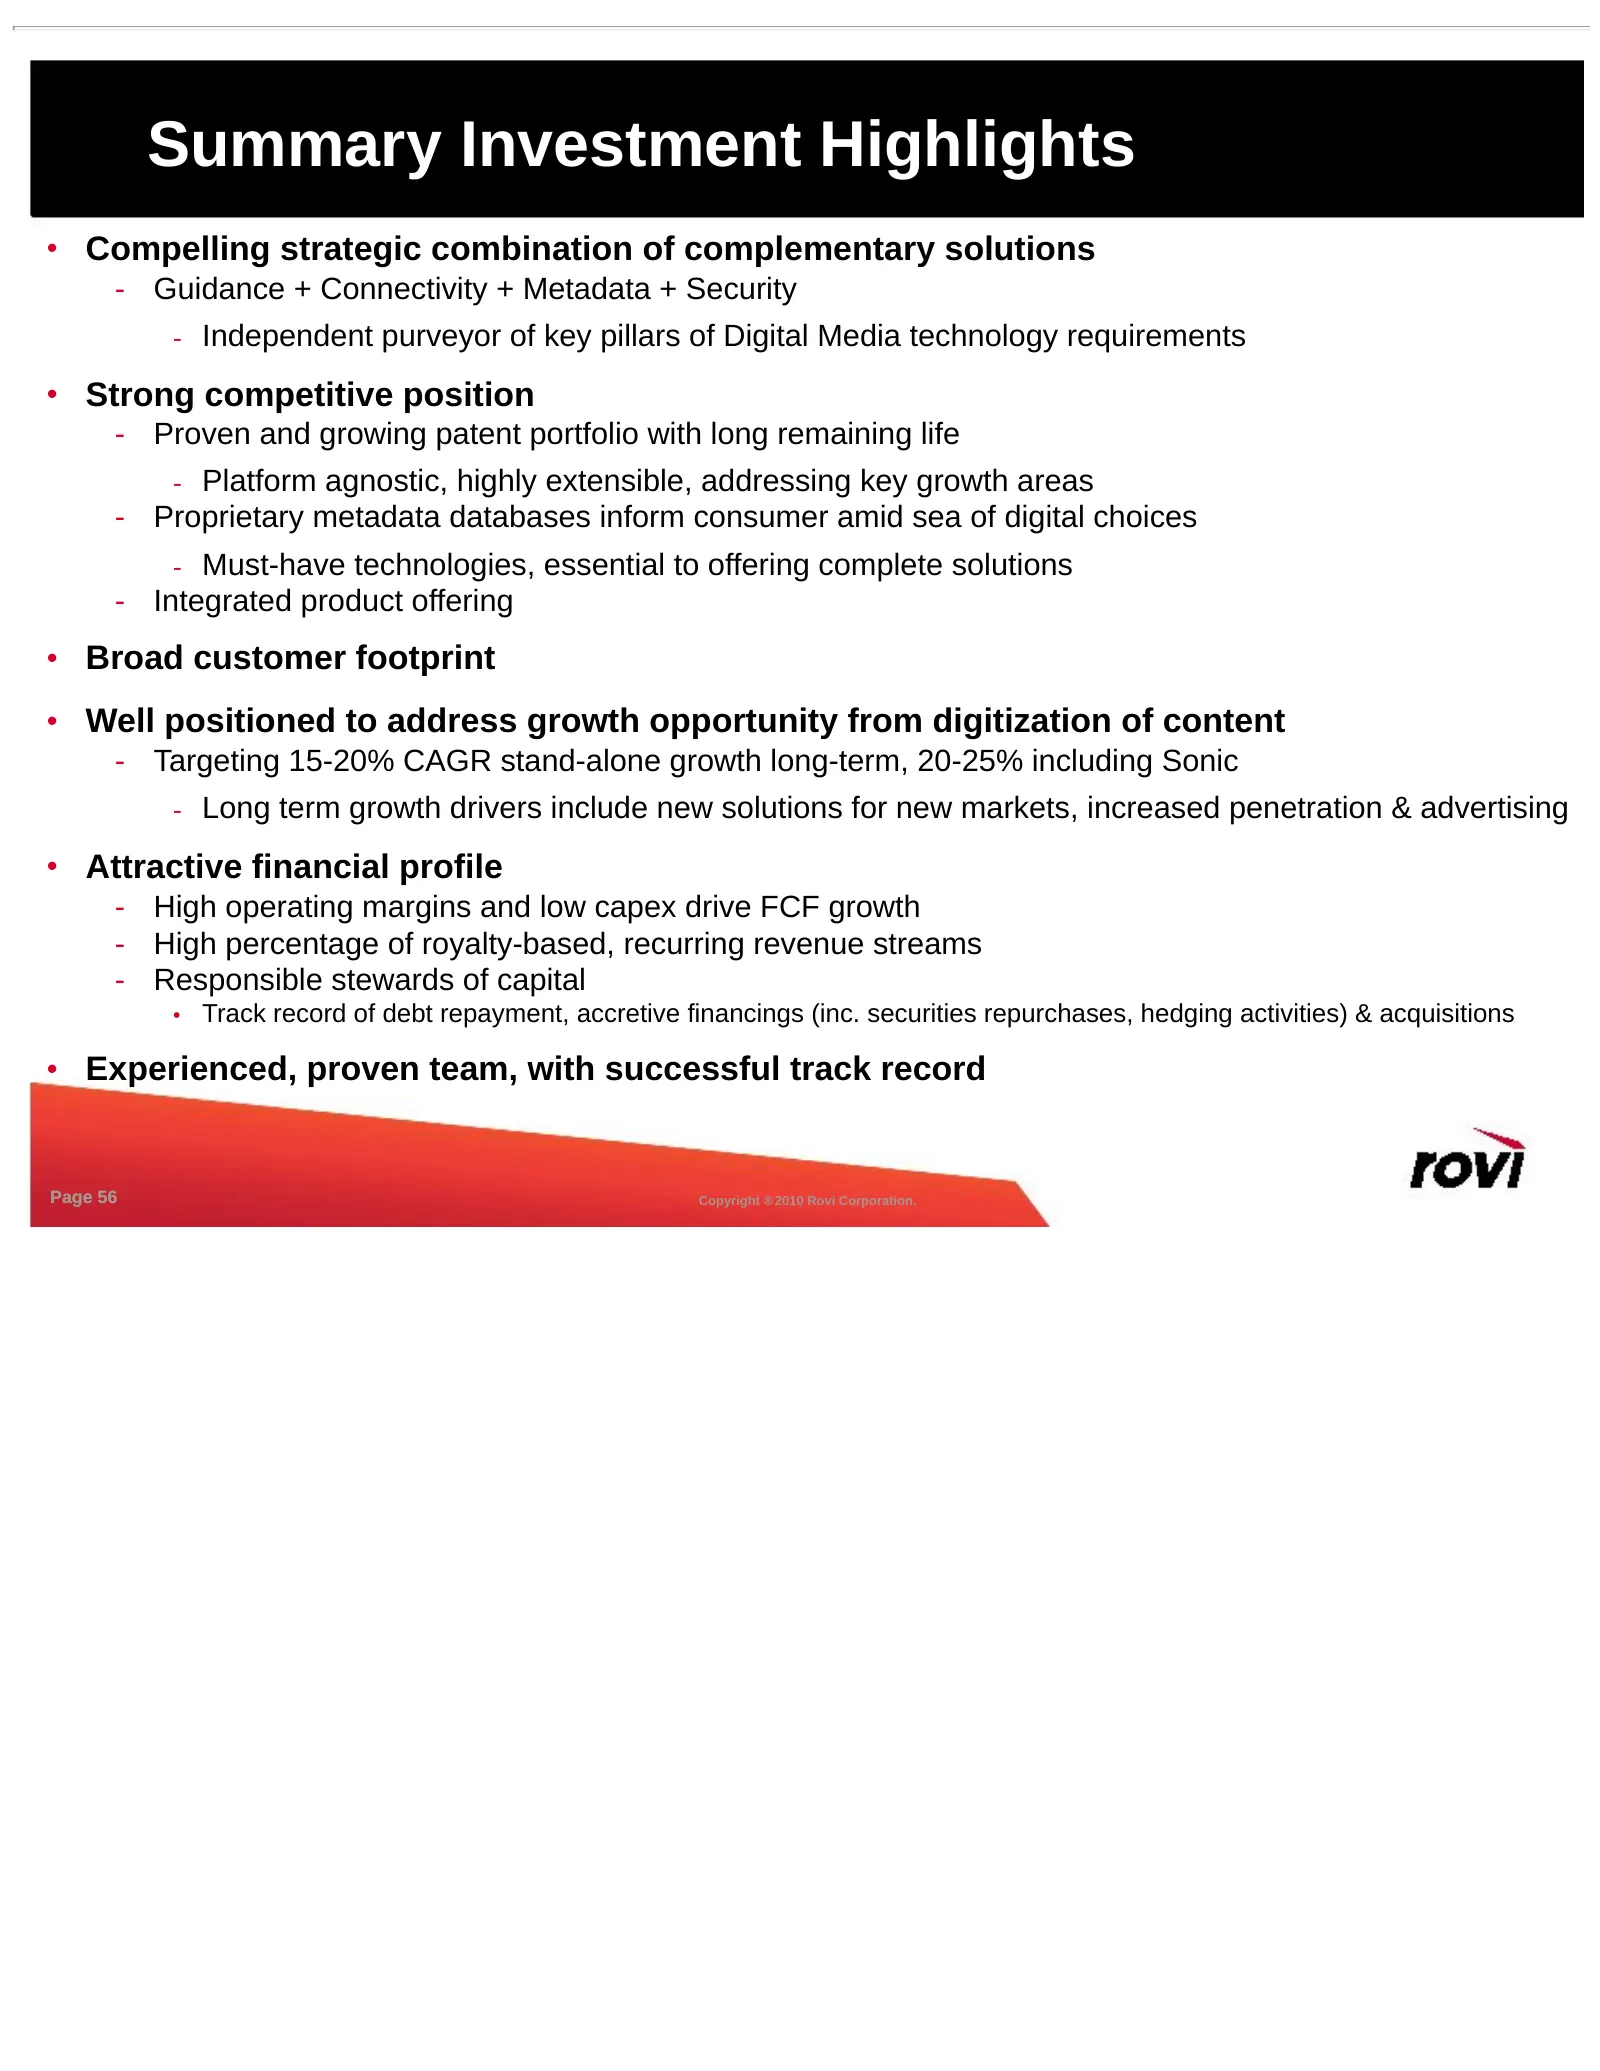
Summary Investment Highlights • Compelling strategic combination of complementary solutions - Guidance + Connectivity + Metadata + Security - Independent purveyor of key pillars of Digital Media technology requirements • Strong competitive position - Proven and growing patent portfolio with long rem
Source: SEC EDGAR · 425 filed Jan 7, 2011