Capital Bank Financial — Investor Presentation (May 2013)
31 slides from Capital Bank Financial's investor presentation, May 14, 2013
Slide 1: Capital Bank Financial Corp. Investor Presentation May 2013
@ CAPITAL BANK FINANCIAL CORP Investor Presentation May 2013
Slide 2: Safe Harbor Statement
could under inclusion plans, our results activity, or changes of the are that made Safe Harbor Statement Statements presentation contains forward-looking statements. Any statements objectives, assumptions or future events or performance are not are often, but not always, made through the use of word
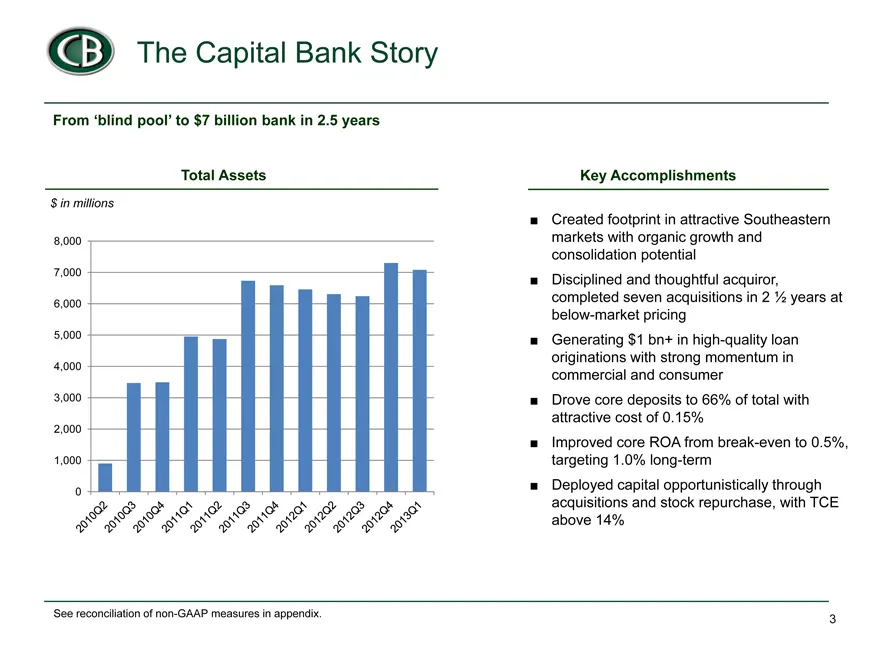
Slide 3: The Capital Bank Story: From 'blind pool' to $7 billion bank in 2.5 years
© The Capital Bank Story From ‘blind pool’ to $7 billion bank in 2.5 years Total Assets Key Accomplishments Sin milions = Created footprint in attractive Southeastern 2,000 markets with organic growth and consolidation potential 70m: ‘= Disciplined and thoughtful acquiror, 6,000 completed seven acqu
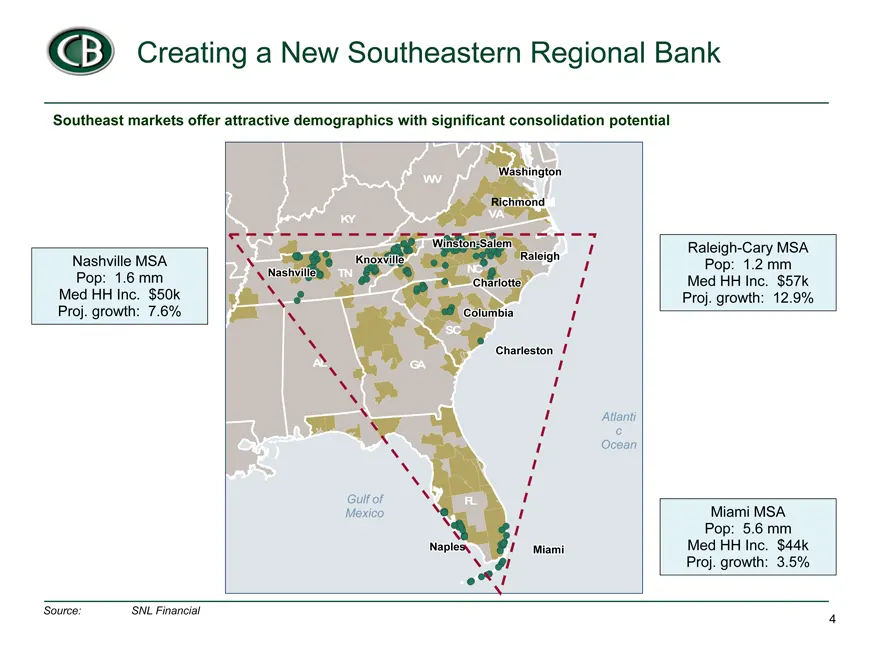
Slide 4: Creating a New Southeastern Regional Bank
@© Creating a New Southeastern Regional Bank Southeast markets offer attractive demographics with significant consolidation potential - Raleigh-Cary MSA. Nashville MSA Pop: 1.2mm Pop: 1.6mm Med HH Inc. $57k Med HH Inc. $50k Proj. growth: 12.9% Proj. growth: 7.6% Miami MSA. Pop: 5.6mm Med HH Inc. $44
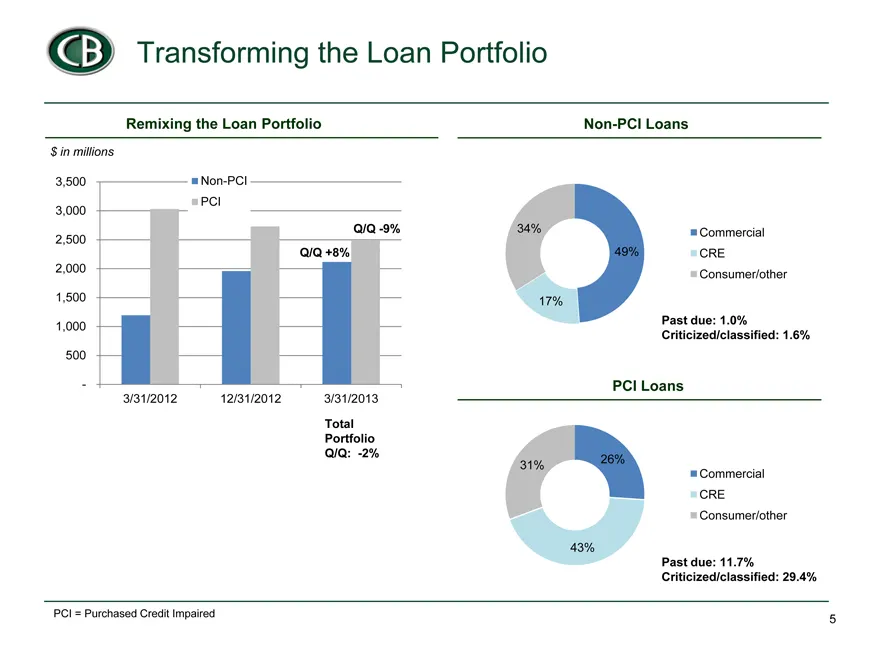
Slide 5: Remixing the Loan Portfolio
© Transforming the Loan Portfolio Remixing the Loan Portfolio Non-PCI Loans Sin millions 3,500 = Non-PCI 3,000 __=PCl a -9% 2,500 10. +8% 2,000 41,500 41,000 500 3/31/2012 12/31/2012 3/31/2013 Total Portfolio QIQ: -2% M% = Commercial CRE Consumerlother 17% 1.0% Iclassified: 1.6% PCI Loans Shey = Com
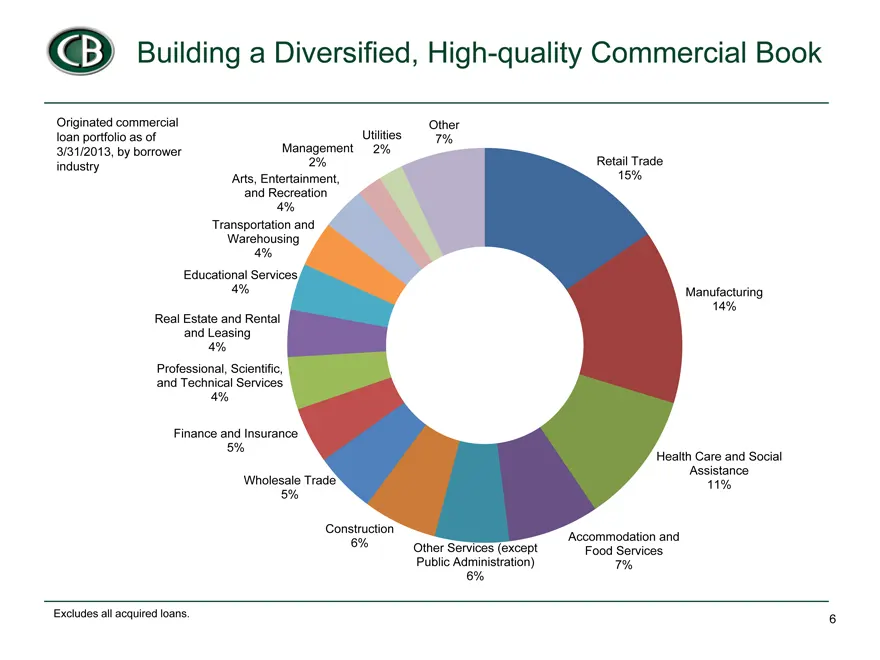
Slide 6: Building a Diversified, High-quality Commercial Book
© Building a Diversified, High-quality Commercial Book Originated commercial loan portfolio as of Uilities 3/31/2013, by borrower Management 2% industry 2% ‘Arts, Entertainment, and Recreation a% ‘Transportation and ‘Warehousing 4% Educational Services, M% Other 7 % Retail Trade 15% Manufacturing 14
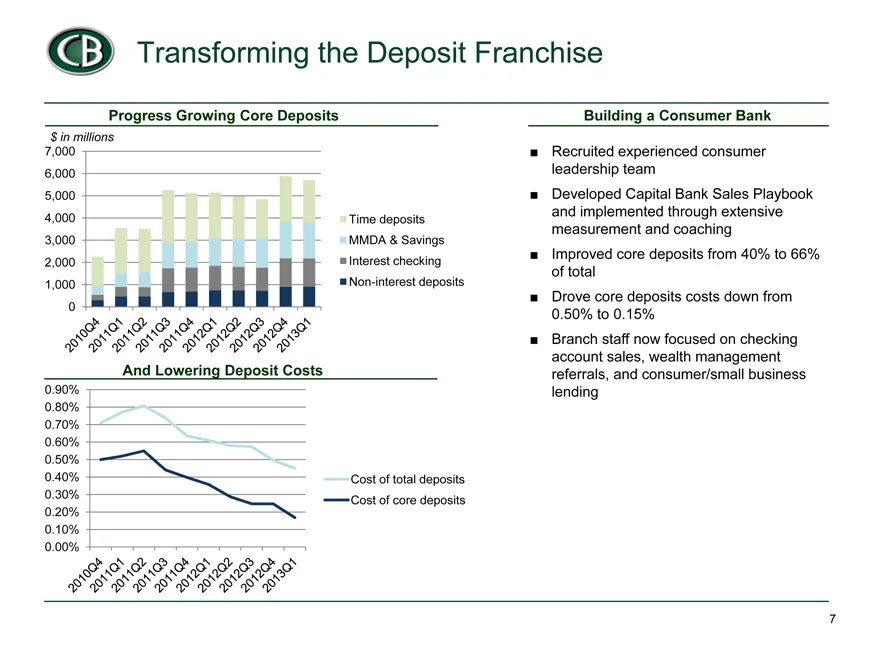
Slide 7: Progress Growing Core Deposits
© Transforming the Deposit Franchise Progress Growing Core Deposits Building a Consumer Bank Sin millions 7,000 6,000 8,000} $e 4,000 + Time deposits 3,000 + MMDA & Savings ‘Interest checking = Non-interest deposits \d Lowering Deposit Costs Cost of total deposits —Cost of core deposits Recruited ex
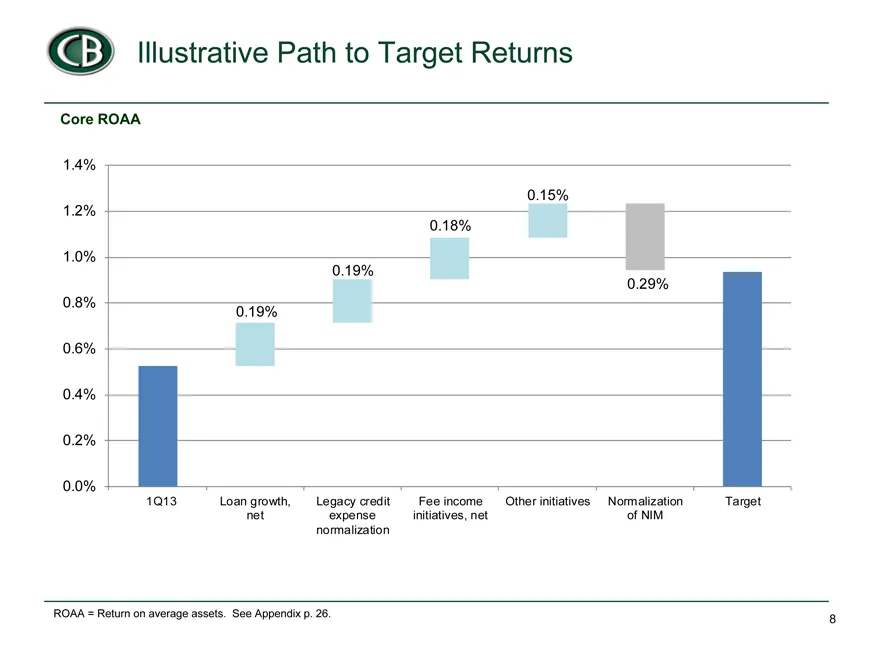
Slide 8: Illustrative Path to Target Returns
@© Illustrative Path to Target Returns Core ROAA 14% 1.2% 0.15% 1.0% 0.18% 0.8% 0.19% 0.29% 0.19% 0.6% 0.4% 0.2% 0.0% 1013 Loan growth, Legacy credit net ‘expense normalization Fee income Other initiatives. Normalization initiatives, net of NIM Target ROAA = Retum on average assets. See Appendix p.
Slide 9: First Quarter Highlights
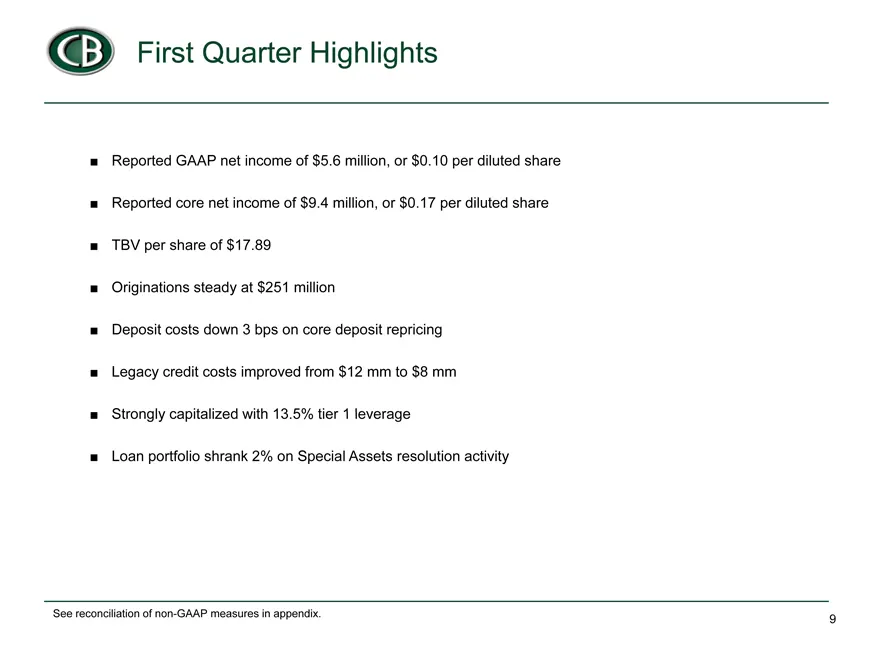
Reported GAAP net income of $5.6 million, or $0.10 per diluted share Reported core net income of $9.4 million, or $0.17 per diluted share TBV per share of $17.89 Originations steady at $251 million Deposit costs down 3 bps on core deposit repricing Legacy credit costs improved from $12 mm to $8 mm S
Slide 10: First Quarter Core Earnings Summary
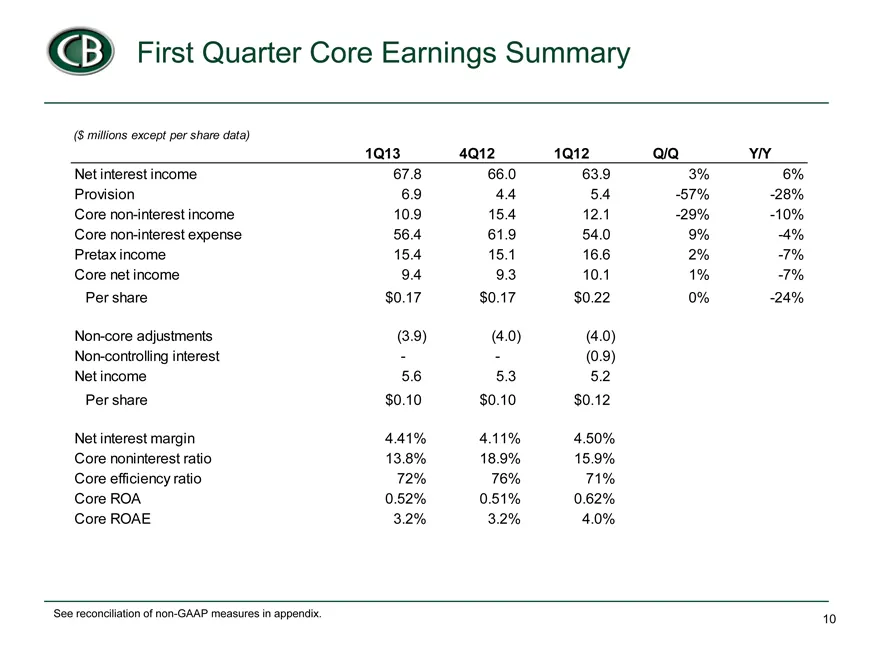
First Quarter Core Earnings Summary ($ millions except per share data) 1Q13 4Q12 1Q12 Q/Q Y/Y Net interest income 67.8 66.0 63.9 3% 6% Provision 6.9 4.4 5.4 -57% -28% Core non-interest income 10.9 15.4 12.1 -29% -10% Core non-interest expense 56.4 61.9 54.0 9% -4% Pretax income 15.4 15.1 16.6 2% -7%
Slide 11: Steady origination momentum
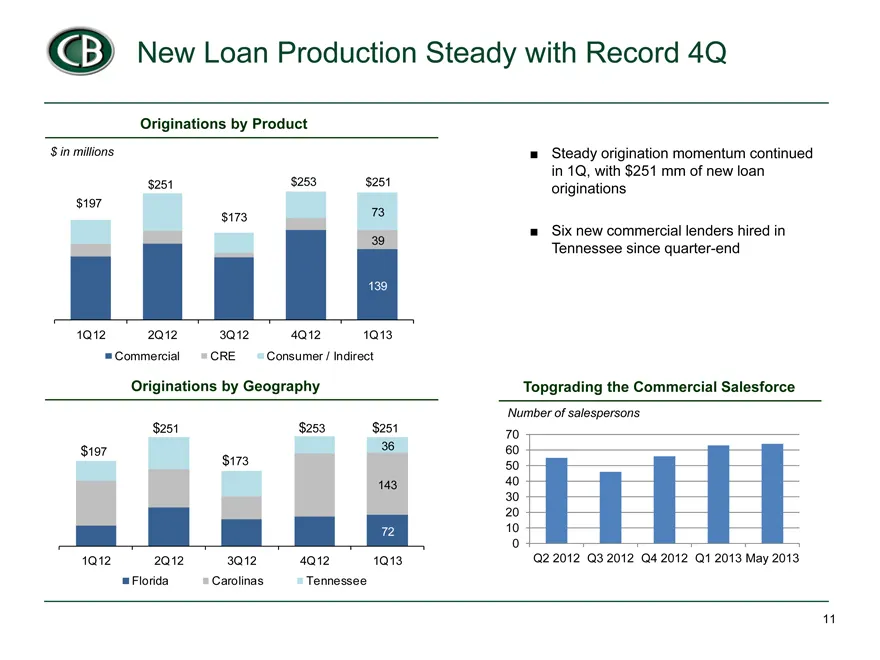
$ in Steady origination momentum continued in 1Q, with $251 mm of new loan originations Six new commercial lenders hired in Tennessee since quarter-end ?
Slide 12: CRE Concentration and loan portfolio growth
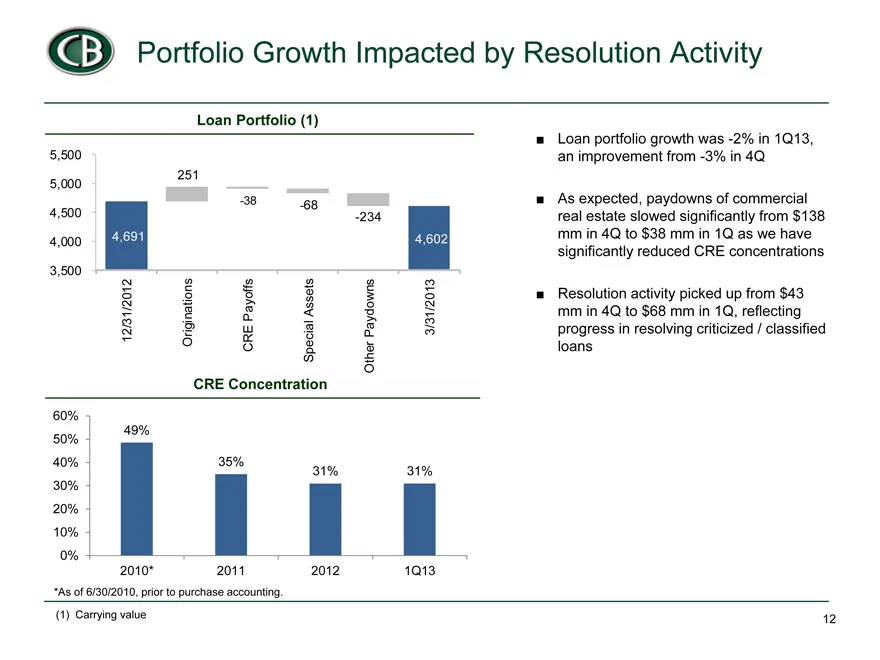
5,500 5,000 4,500 4,000 3,500 60% 50% 40% 30% 20% 10% /31/2012 ginations Payoffs al Assets aydowns /31/2013 12 Ori E CR Speci Other P 3 CRE Concentration Loan portfolio growth was -2% in 1Q13, an improvement from -3% in 4Q As expected, paydowns of commercial real estate slowed significantly from $13
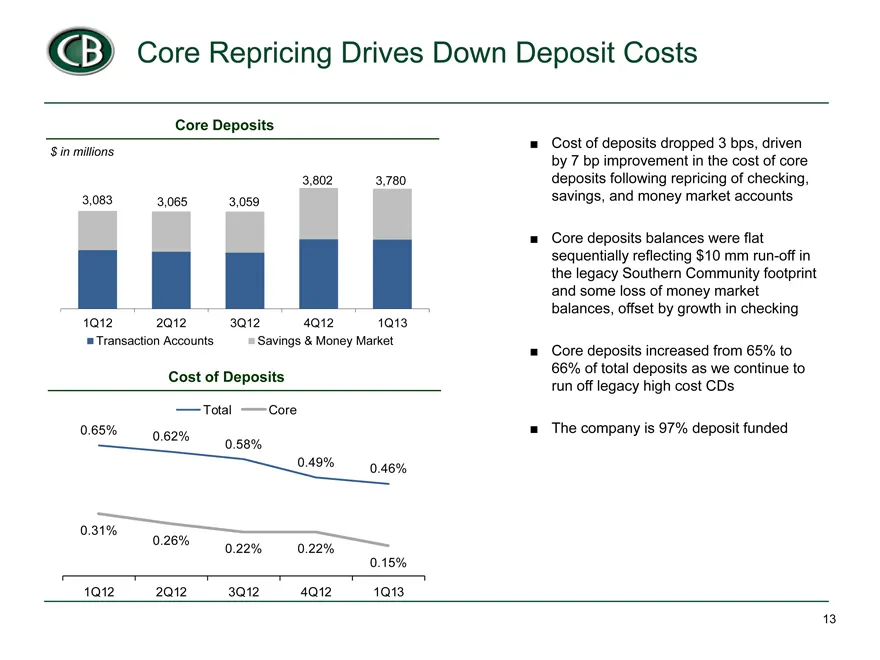
Slide 13: Cost of Deposits and core deposits
$ in 1Q12 2Q12 3Q12 4Q12 1Q13 Transaction Accounts Savings & Money Market Cost of Deposits Total Core 0.65% 0.62% 0.58% 0.49% 0.46% Cost of deposits dropped 3 bps, driven by 7 bp improvement in the cost of core deposits following repricing of checking, savings, and money market accounts Core deposit
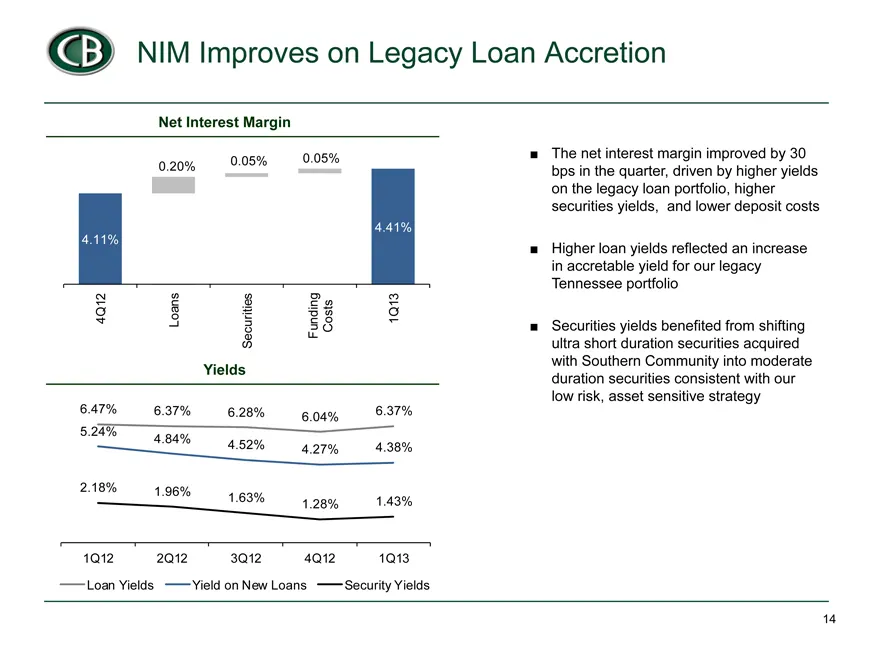
Slide 14: Loan yields and net interest margin
6.47% 6.37% 6.28% 6.04% 6.37% 5.24% 4.84% 4.52% 4.27% 4.38% 2.18% 1.96% 1.63% 1.28% 1.43% 1Q12 2Q12 3Q12 4Q12 1Q13 Loan Yields Yield on New Loans Security Yields The net interest margin improved by 30 bps in the quarter, driven by higher yields on the legacy loan portfolio, higher securities yields,
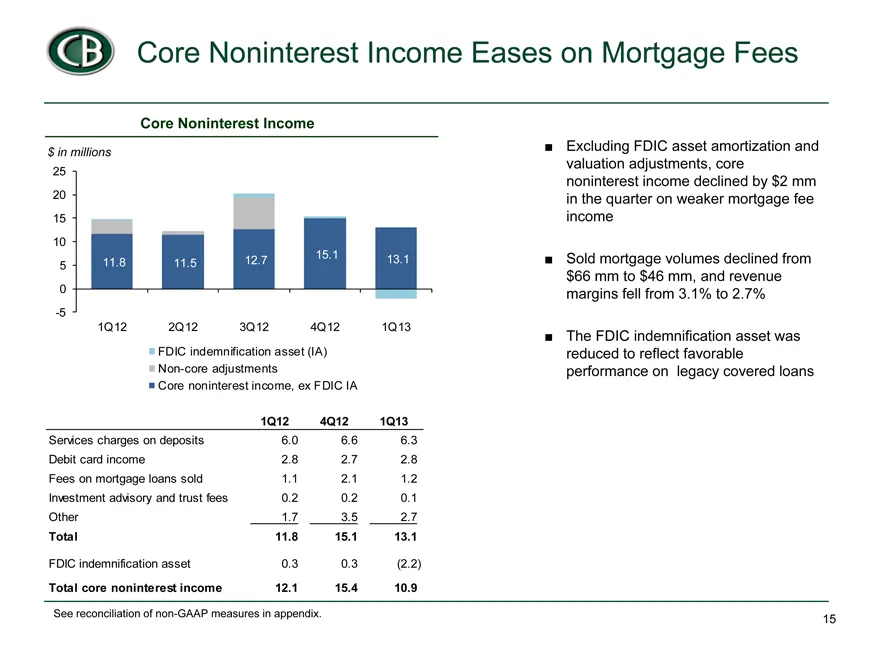
Slide 15: Noninterest income
$ in 25 20 15 10 5 0 -5 Services Debit Fees Other Excluding FDIC asset amortization and valuation adjustments, core noninterest income declined by $2 mm in the quarter on weaker mortgage fee income Sold mortgage volumes declined from $66 mm to $46 mm, and revenue margins fell from 3.1% to 2.7% The F
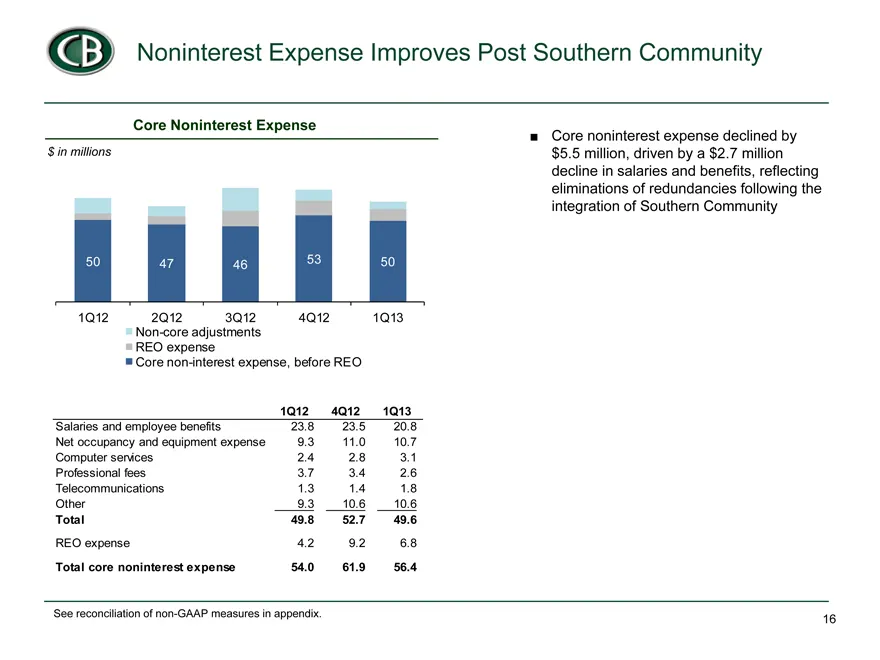
Slide 16: Noninterest expense
$ in Net Other Total fees 50 47 46 53 50 1Q12 2Q12 3Q12 4Q12 1Q13 Non-core adjustments REO expense Core non-interest expense, before REO Core noninterest expense declined by $5.5 million, driven by a $2.7 million decline in salaries and benefits, reflecting eliminations of redundancies following the
Slide 17: Investments, liquidity and capital
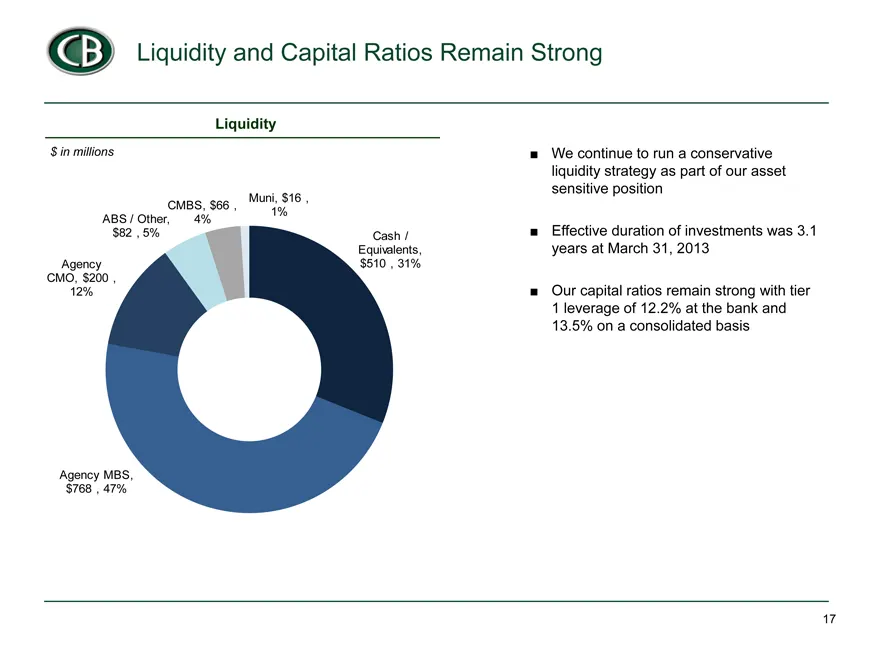
$ in CMO, $ We continue to run a conservative liquidity strategy as part of our asset sensitive position Effective duration of investments was 3.1 years at March 31, 2013 Our capital ratios remain strong with tier 1 leverage of 12.2% at the bank and 13.5% on a consolidated basis
Slide 18: Criticized / Classified loans
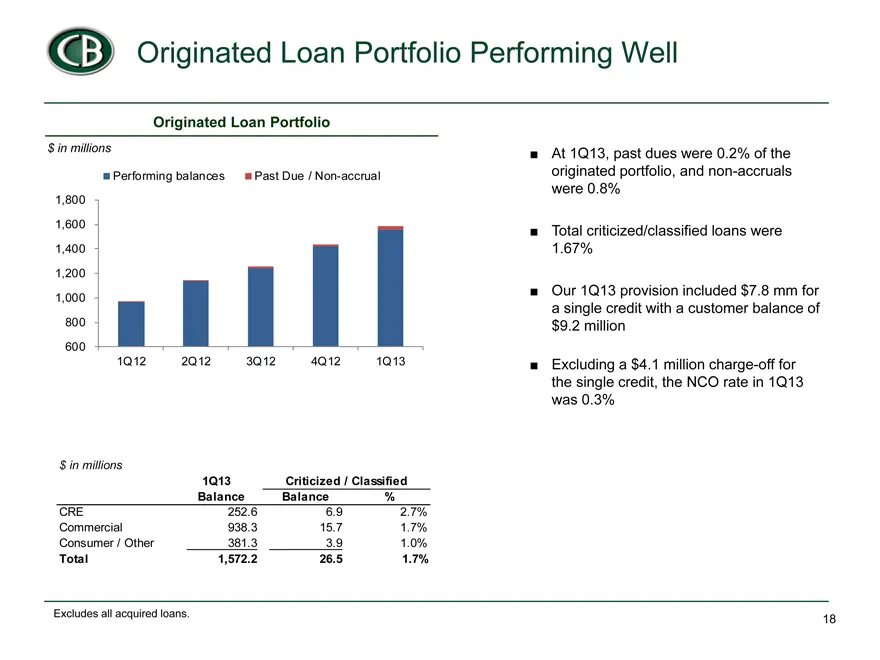
$ in millions 1Q13 Criticized / Classified Balance Balance % CRE 252.6 6.9 2.7% Commercial 938.3 15.7 1.7% Consumer / Other 381.3 3.9 1.0% Total 1,572.2 26.5 1.7%
Slide 19: Legacy credit expense
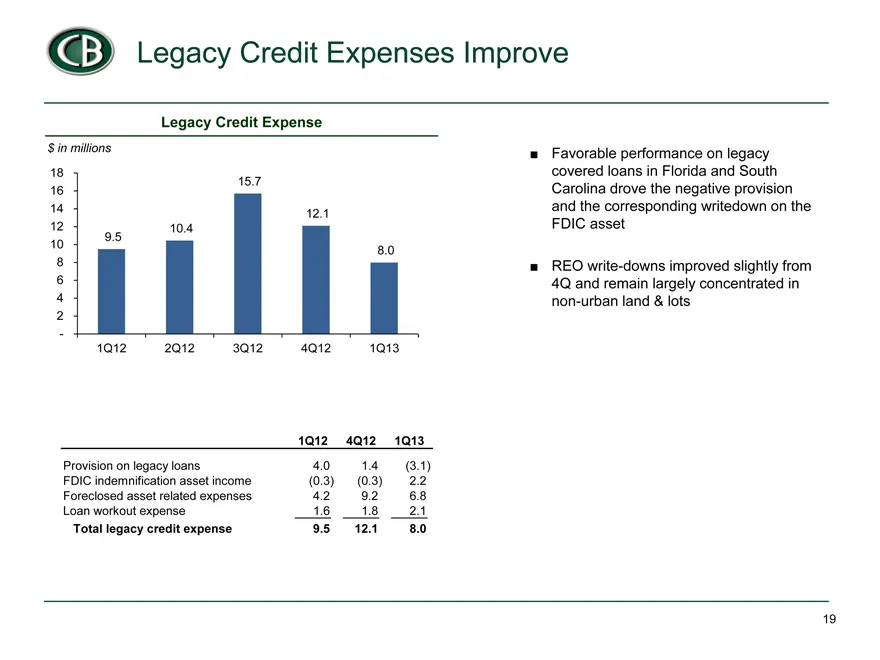
$ in 18 16 14 12 10 8 6 4 2 - 1Q12 4Q12 1Q13 Provision on legacy loans 4.0 1.4 (3.1) FDIC indemnification asset income (0.3) (0.3) 2.2 Foreclosed asset related expenses 4.2 9.2 6.8 Loan workout expense 1.6 1.8 2.1 Total legacy credit expense 9.5 12.1 8.0 Favorable performance on legacy covered loans
Slide 20: Special assets portfolio
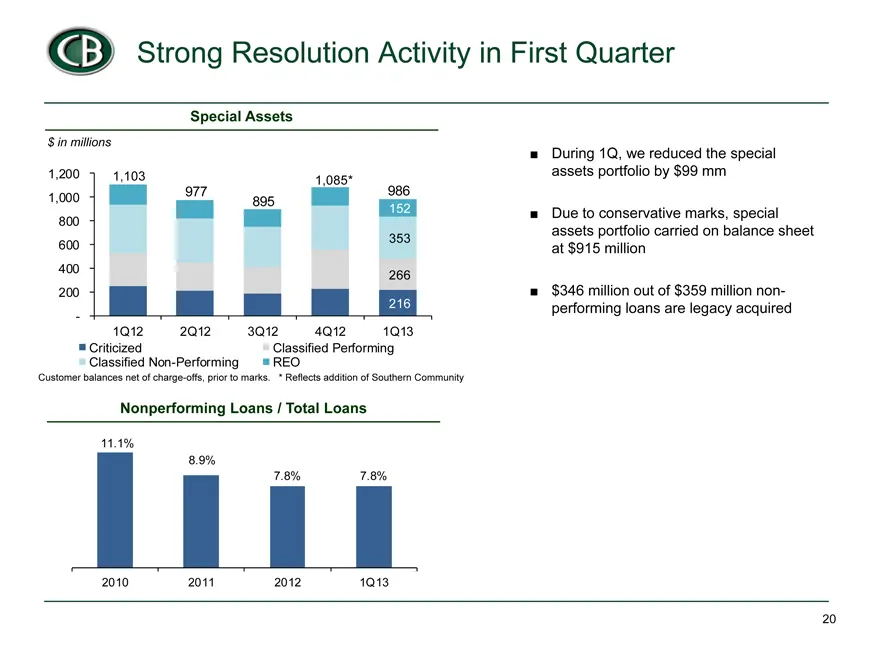
$ in 1,200 1,000 800 600 400 200 Customer During 1Q, we reduced the special assets portfolio by $99 mm Due to conservative marks, special assets portfolio carried on balance sheet at $915 million $346 million out of $359 million non- performing loans are legacy acquired
Slide 21: Appendix
Appendix
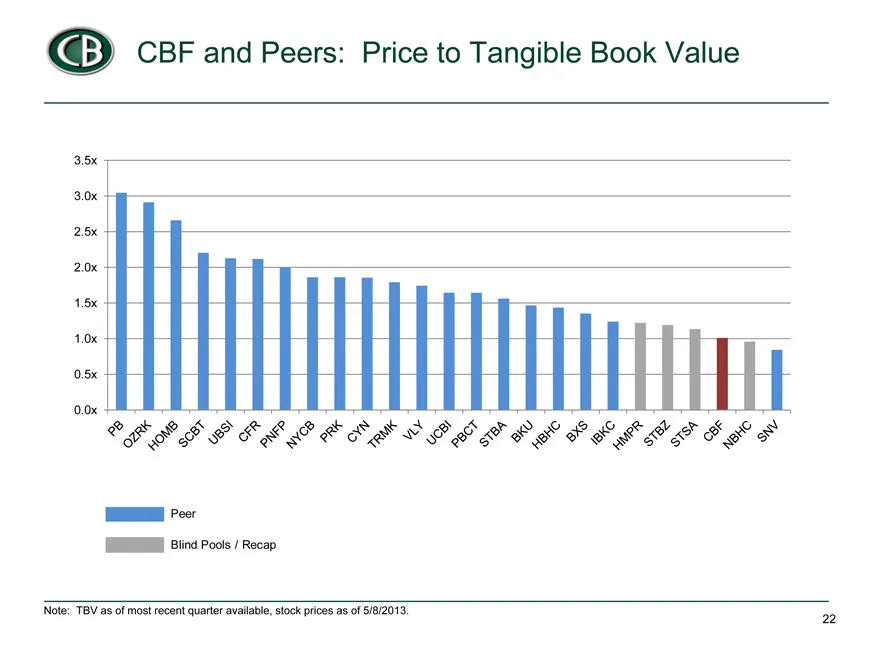
Slide 22: CBF and Peers: Price to Tangible Book Value
@© CBF and Peers: Price to Tangible Book Value SPE EE ELSES EE PELL E ES [EINE Bina Pools / Recap 3s ‘Note: TBV as of most recent quarter available, stock prices as of 18/2013. 22
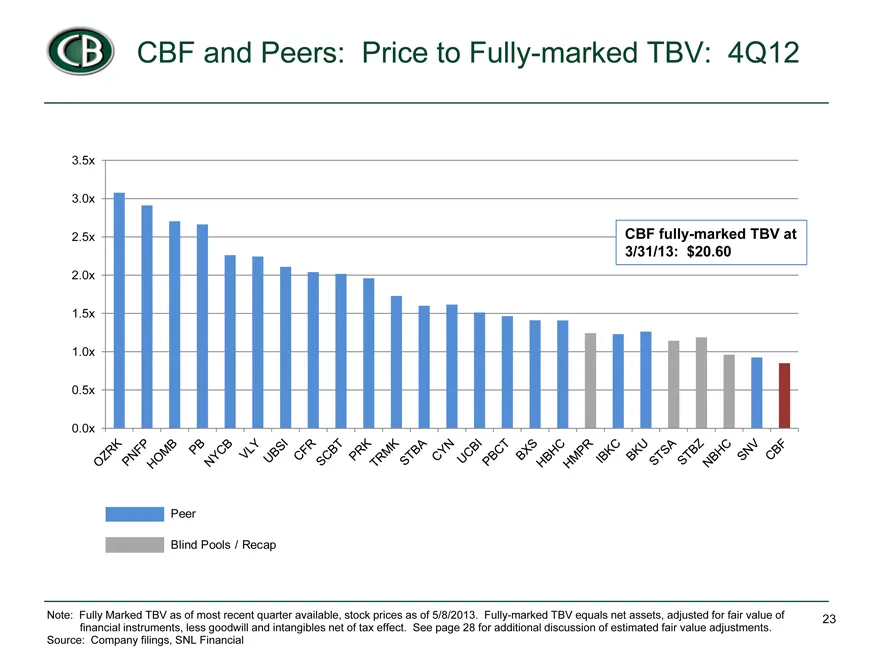
Slide 23: CBF fully-marked TBV multiple vs peers
3.5x 3.0x 2.5x CBF fully-marked TBV at 3/31/13: $20.60 2.0x 1.5x 1.0x 0.5x 0.0x Note: Fully Marked TBV as of most recent quarter available, stock prices as of 5/8/2013. Fully-marked TBV equals net assets, adjusted for fair value of 23 financial instruments, less goodwill and intangibles net of tax e
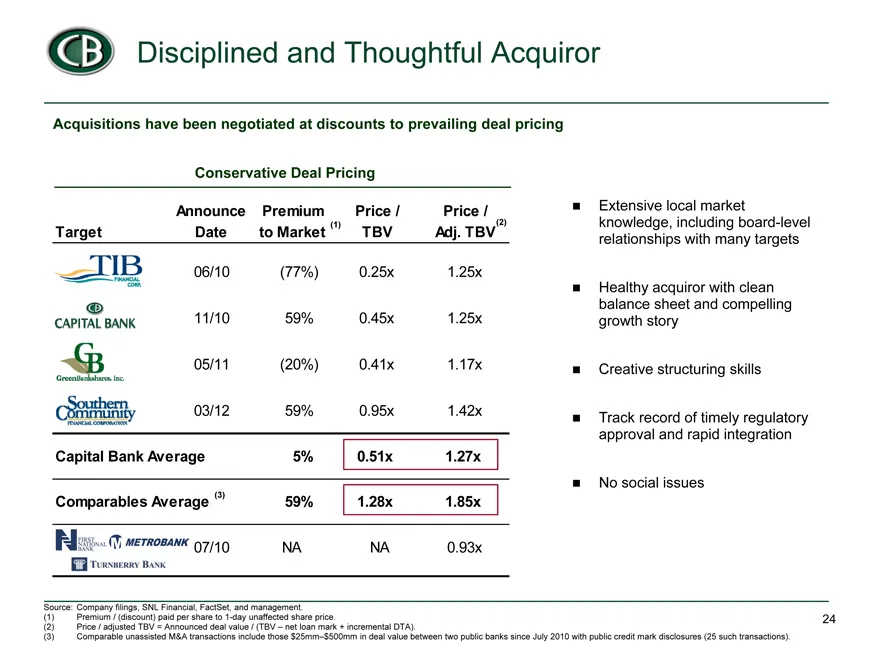
Slide 24: Conservative Deal Pricing
filings, Conservative Deal Pricing Announce Premium Price / Price / Target Date to Market (1) TBV Adj. TBV (2) 06/10 (77%) 0.25x 1.25x 11/10 59% 0.45x 1.25x 05/11 (20%) 0.41x 1.17x 03/12 59% 0.95x 142x. Capital Bank Average 5% 0.51x 1.27x Comparables Average (3) 59% 1.28x 1.85x 07/10 NA NA 0.93x Ext
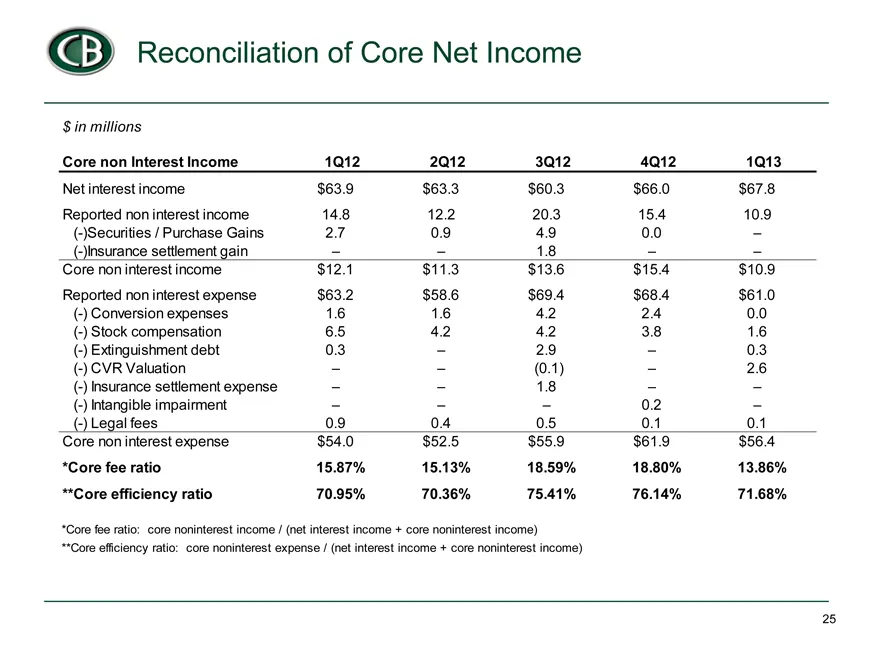
Slide 25: Core noninterest income and expense reconciliation
$ ** $ in millions Core non Interest Income 1Q12 2Q12 3Q12 4Q12 1Q13 Net interest income $63.9 $63.3 $60.3 $66.0 $67.8 Reported non interest income 14.8 12.2 20.3 15.4 10.9 (-)Securities / Purchase Gains 2.7 0.9 4.9 0.0 – (-)Insurance settlement gain – – 1.8 – – Core non interest income $12.1 $11.3
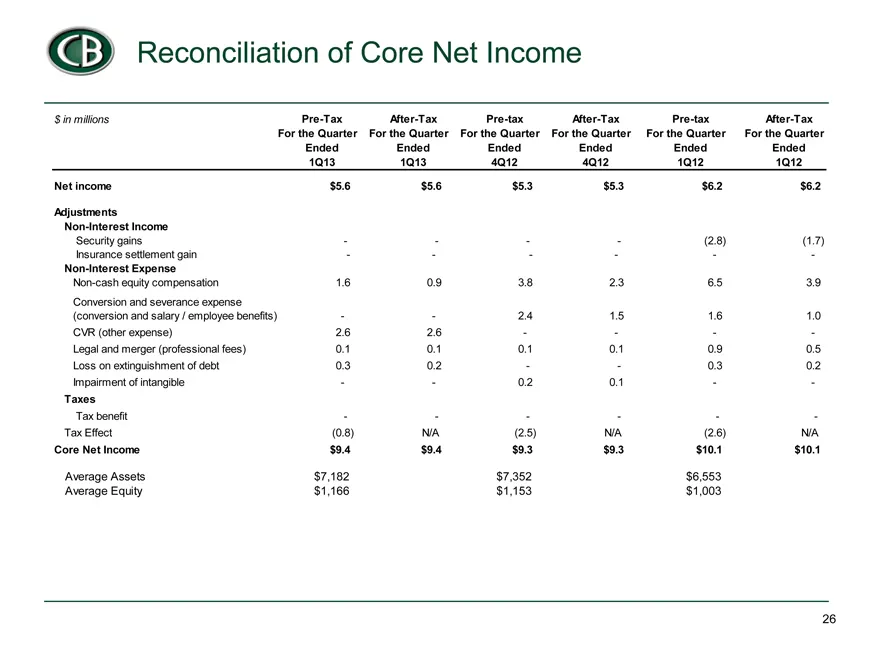
Slide 26: Core net income reconciliation
$ in Net Core $ in millions Pre-Tax After-Tax Pre-tax After-Tax Pre-tax After-Tax For the Quarter For the Quarter For the Quarter For the Quarter For the Quarter For the Quarter Ended Ended Ended Ended Ended Ended 1Q13 1Q13 4Q12 4Q12 1Q12 1Q12 Net income $5.6 $5.6 $5.3 $5.3 $6.2 $6.2 Adjustments Non
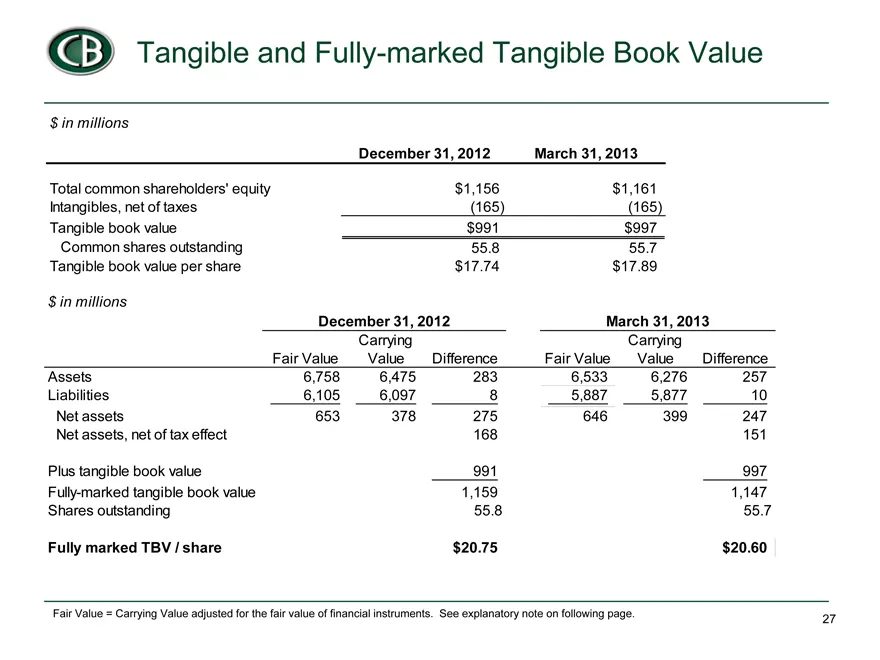
Slide 27: Tangible and fully-marked book value
$ in Total $ in Assets Net Net Plus Shares $ in millions December 31, 2012 March 31, 2013 Total common shareholders’ equity $1,156 $1,161 Intangibles, net of taxes (165) (165) Tangible book value $991 $997 Common shares outstanding 55.8 55.7 Tangible book value per share $17.74 $17.89 $ in millions
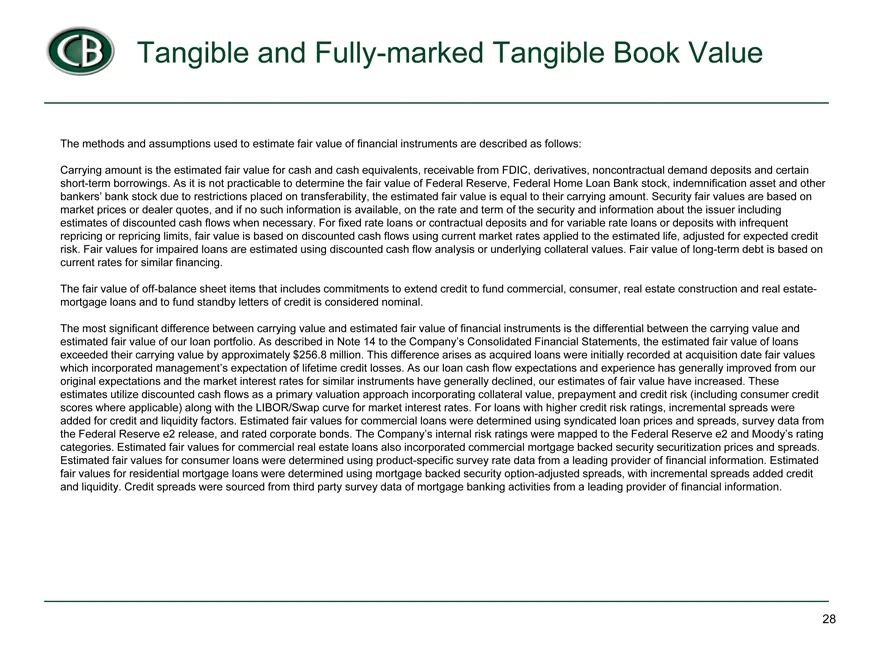
Slide 28: Fair value estimate assumptions
The risk. The The the fair and Tangible and Fully-marked assumptions used to estimate fair value of financial instruments are is the estimated fair value for cash and cash equivalents, receivable from As it is not practicable to determine the fair value of Federal Reserve, due to restrictions placed
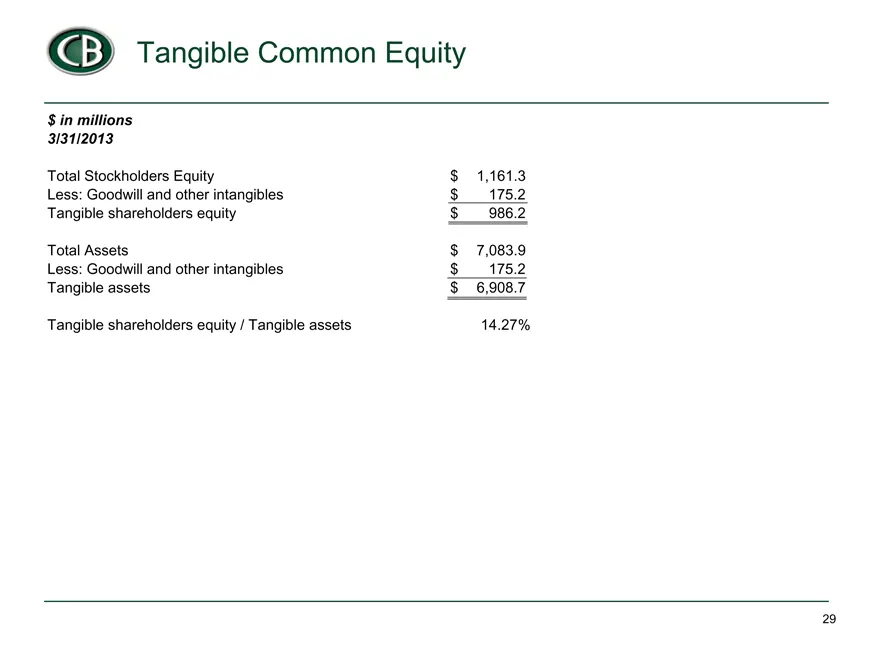
Slide 29: Tangible equity to tangible assets
Total Less: $ in millions 3/31/2013 Total Stockholders Equity $ 1,161.3 Less: Goodwill and other intangibles $ 175.2 Tangible shareholders equity $ 986.2 Total Assets $ 7,083.9 Less: Goodwill and other intangibles $ 175.2 Tangible assets $ 6,908.7 Tangible shareholders equity / Tangible assets 14.27
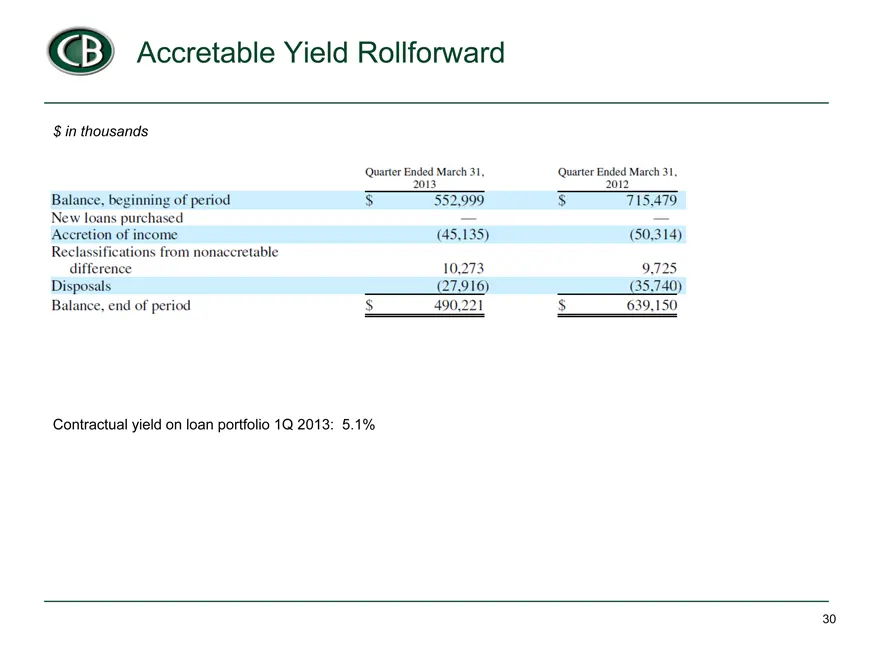
Slide 30: Accretable Yield Rollforward
© Accretable Yield Rollforward $ in thousands uate End March, usted Mach 3, 201 012 Balance, beginning of period 5 352,999 5 715.479 New loans purchased Accretion of income. (45,135) (50,314) Reclassifications from nonaccretable difference 10,273 9,725 Disposals 27.916) (35,740) Balance, end of peri
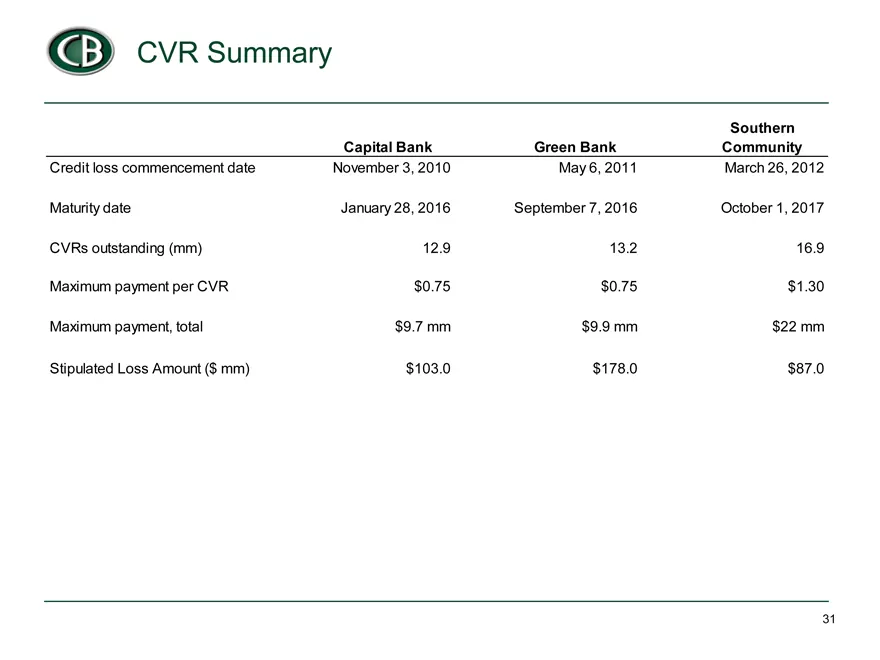
Slide 31: Acquisition summary
Southern Capital Bank Green Bank Community November 3, 2010 May 6, 2011 March 26, 2012 January 28, 2016 September 7, 2016 October 1, 2017 12.9 13.2 16.9 $0.75 $0.75 $1.30 $9.7 mm $9.9 mm $22 mm $103.0 $178.0 $87.0
Source: SEC EDGAR · 8-K filed May 14, 2013
More decks from Capital Bank Financial Corp
 Q2 2017 Earnings Presentation22 slides · Jul 14, 2017
 Morgan Stanley Financial Services Conference 201715 slides · Jun 13, 2017
 Merger or Acquisition (June 2017)27 slides · Jun 6, 2017
 Merger or Acquisition (May 2017)17 slides · May 4, 2017
 Q1 2017 Earnings Presentation21 slides · Apr 21, 2017
 Q4 2016 Earnings Presentation25 slides · Jan 26, 2017