Old Mutual Ltd. · JSE:OMU
Old Mutual — H1 2017 Earnings Presentation
40 slides from Old Mutual's earnings presentation, Aug 11, 2017
Slide 1: Interim Results 2017
INTERIM RESULTS 2017 11 August 2017 INVESTMENT | SAVINGS | INSURANCE | BANKING
Slide 2: Disclaimer
DISCLAIMER This presentation may contain certain forward-looking statements with respect to certain of Old Mutual plc’s plans and its current goals and expectations relating to its future financial condition, performance and results and, in particular, estimates of future cash flows and costs. By th
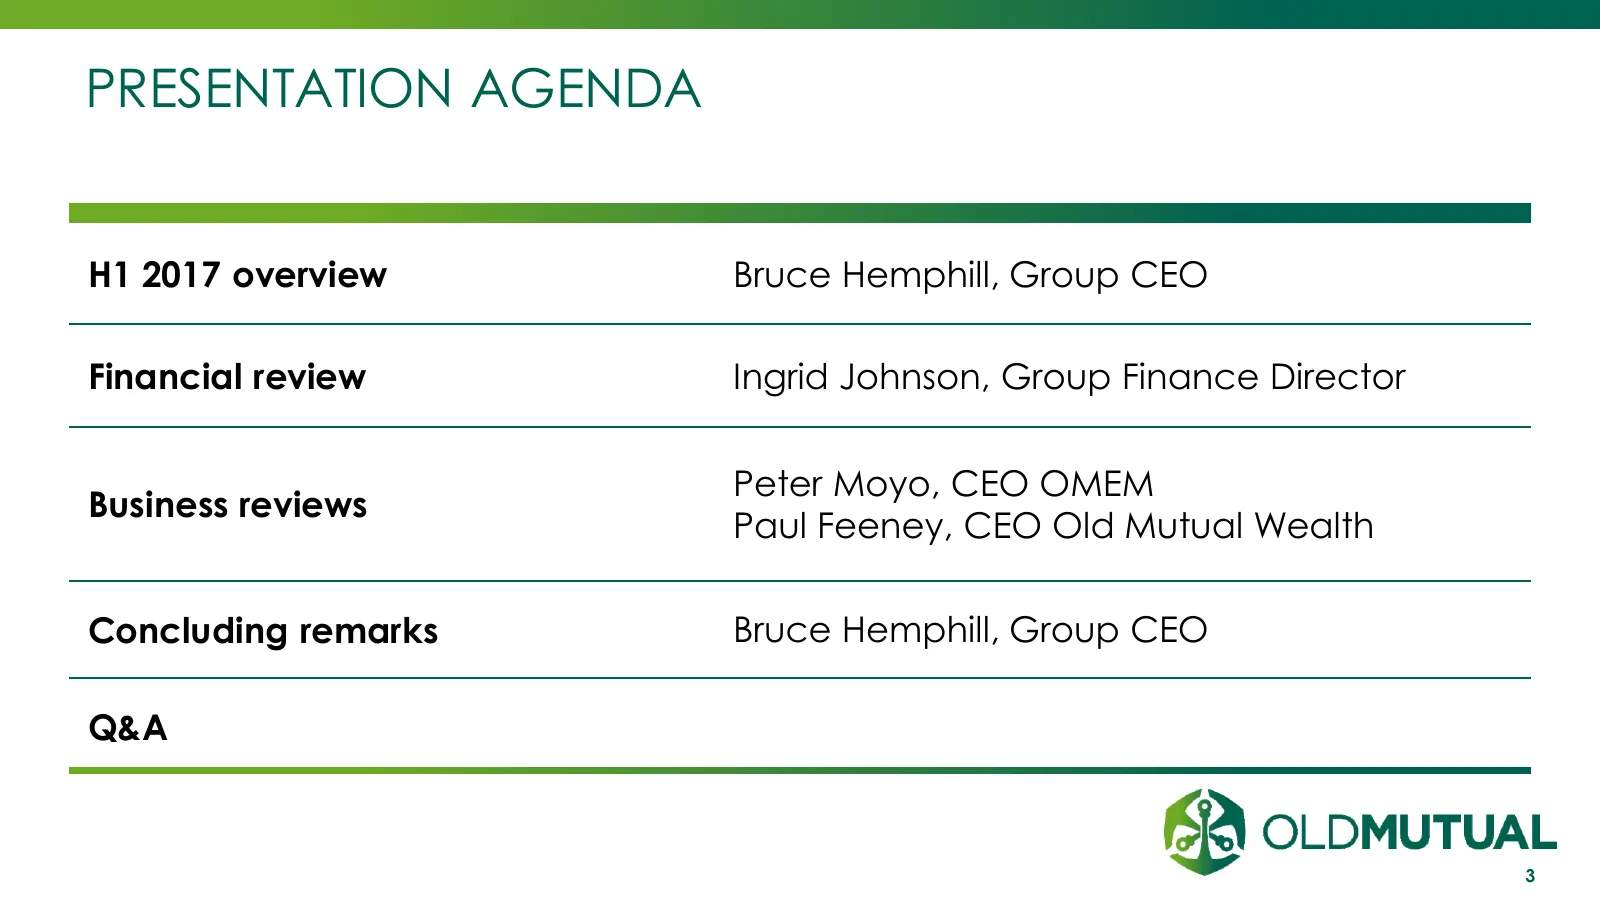
Slide 3: Presentation Agenda
PRESENTATION AGENDA H1 2017 overview Bruce Hemphill, Group CEO Financial review Ingrid Johnson, Group Finance Director Peter Moyo, CEO OMEM Business reviews Paul Feeney, CEO Old Mutual Wealth Concluding remarks Bruce Hemphill, Group CEO Q&A 3
Slide 4: Resilient financial performance in line with expectations
Resilient financial On track with delivery of the performance in line with managed separation expectations 4
Slide 5: Financial performance in line with expectations
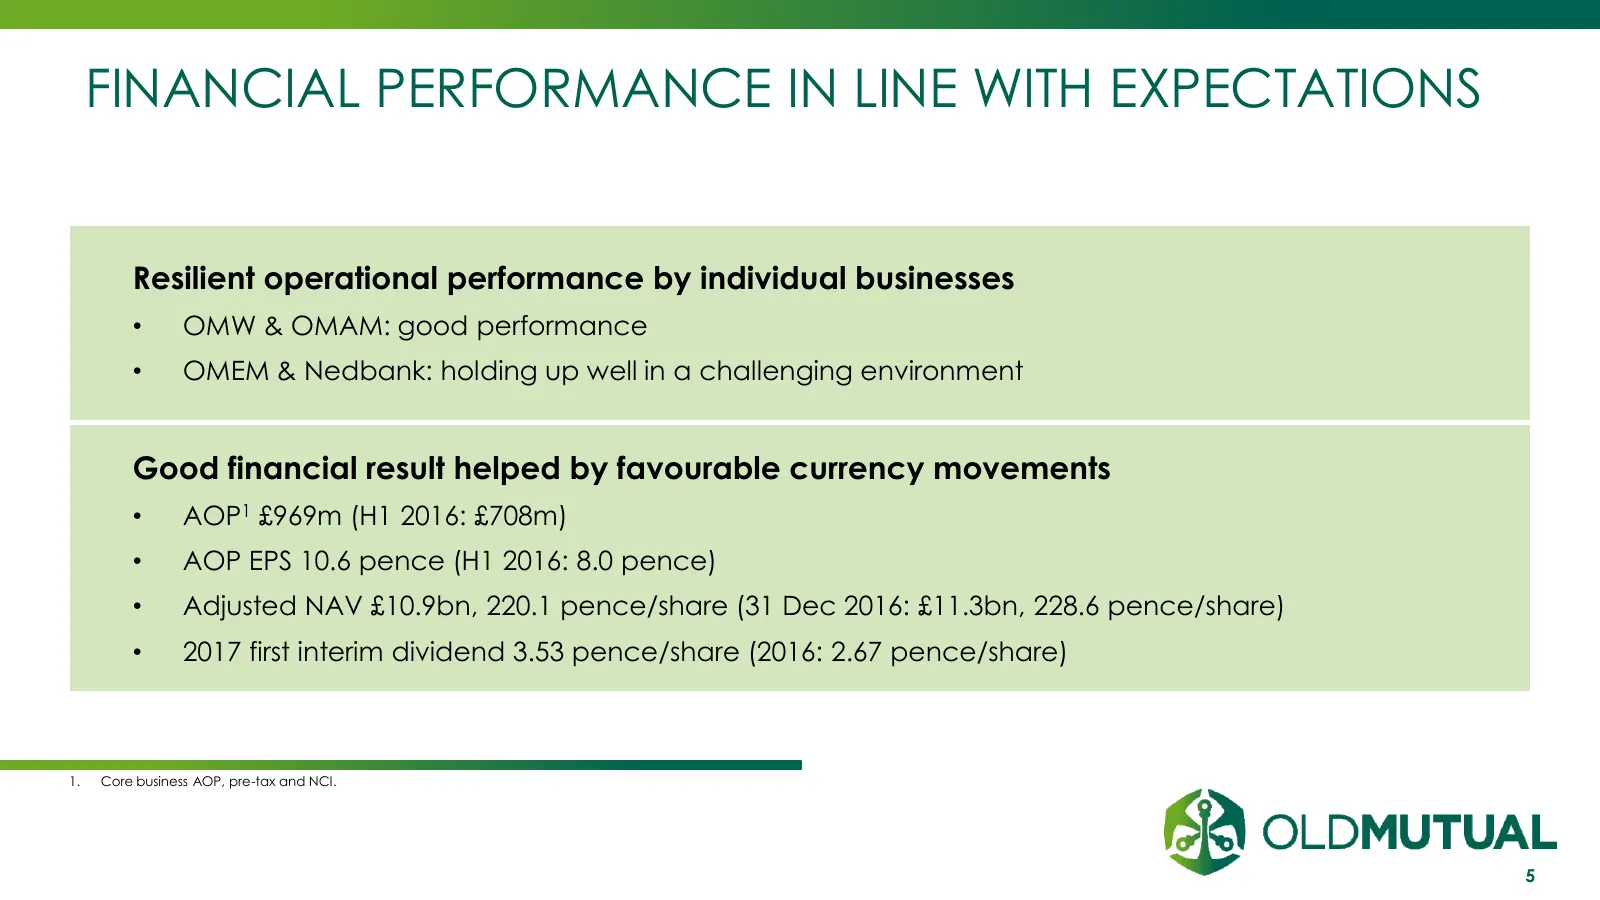
FINANCIAL PERFORMANCE IN LINE WITH EXPECTATIONS Resilient operational performance by individual businesses • OMW & OMAM: good performance • OMEM & Nedbank: holding up well in a challenging environment Good financial result helped by favourable currency movements • AOP1 £969m (H1 2016: £708m) • AOP E
Slide 6: On track with delivery of the managed separation
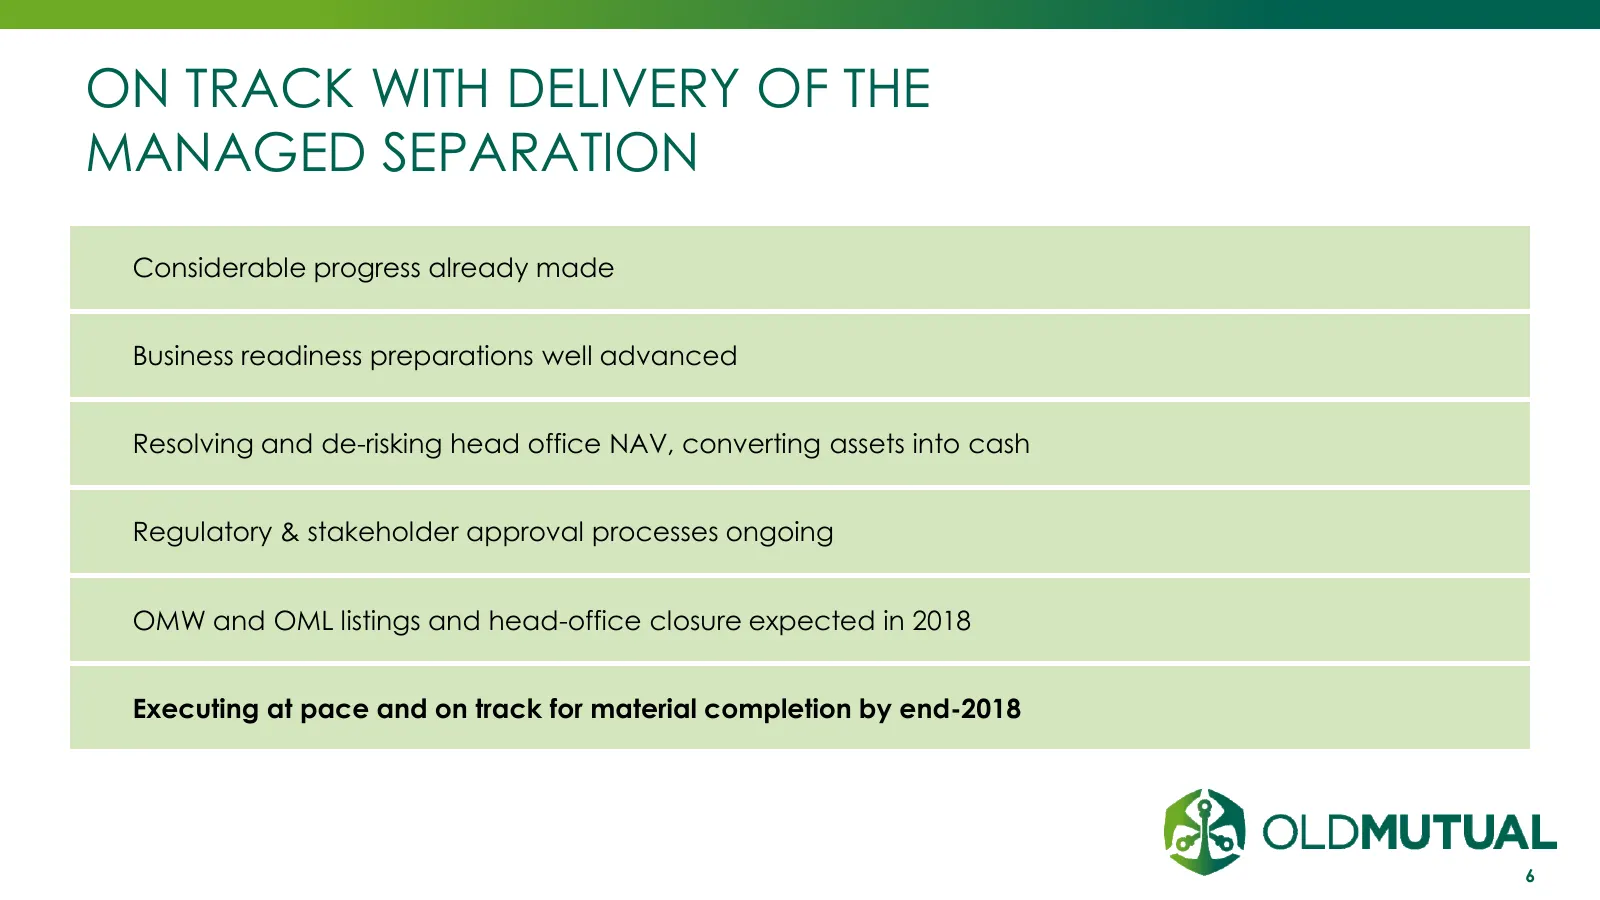
ON TRACK WITH DELIVERY OF THE MANAGED SEPARATION Considerable progress already made Business readiness preparations well advanced Resolving and de-risking head office NAV, converting assets into cash Regulatory & stakeholder approval processes ongoing OMW and OML listings and head-office closure exp
Slide 7: Financial Review
FINANCIAL REVIEW Ingrid Johnson 11 August 2017 INVESTMENT | SAVINGS | INSURANCE | BANKING
Slide 8: Agenda
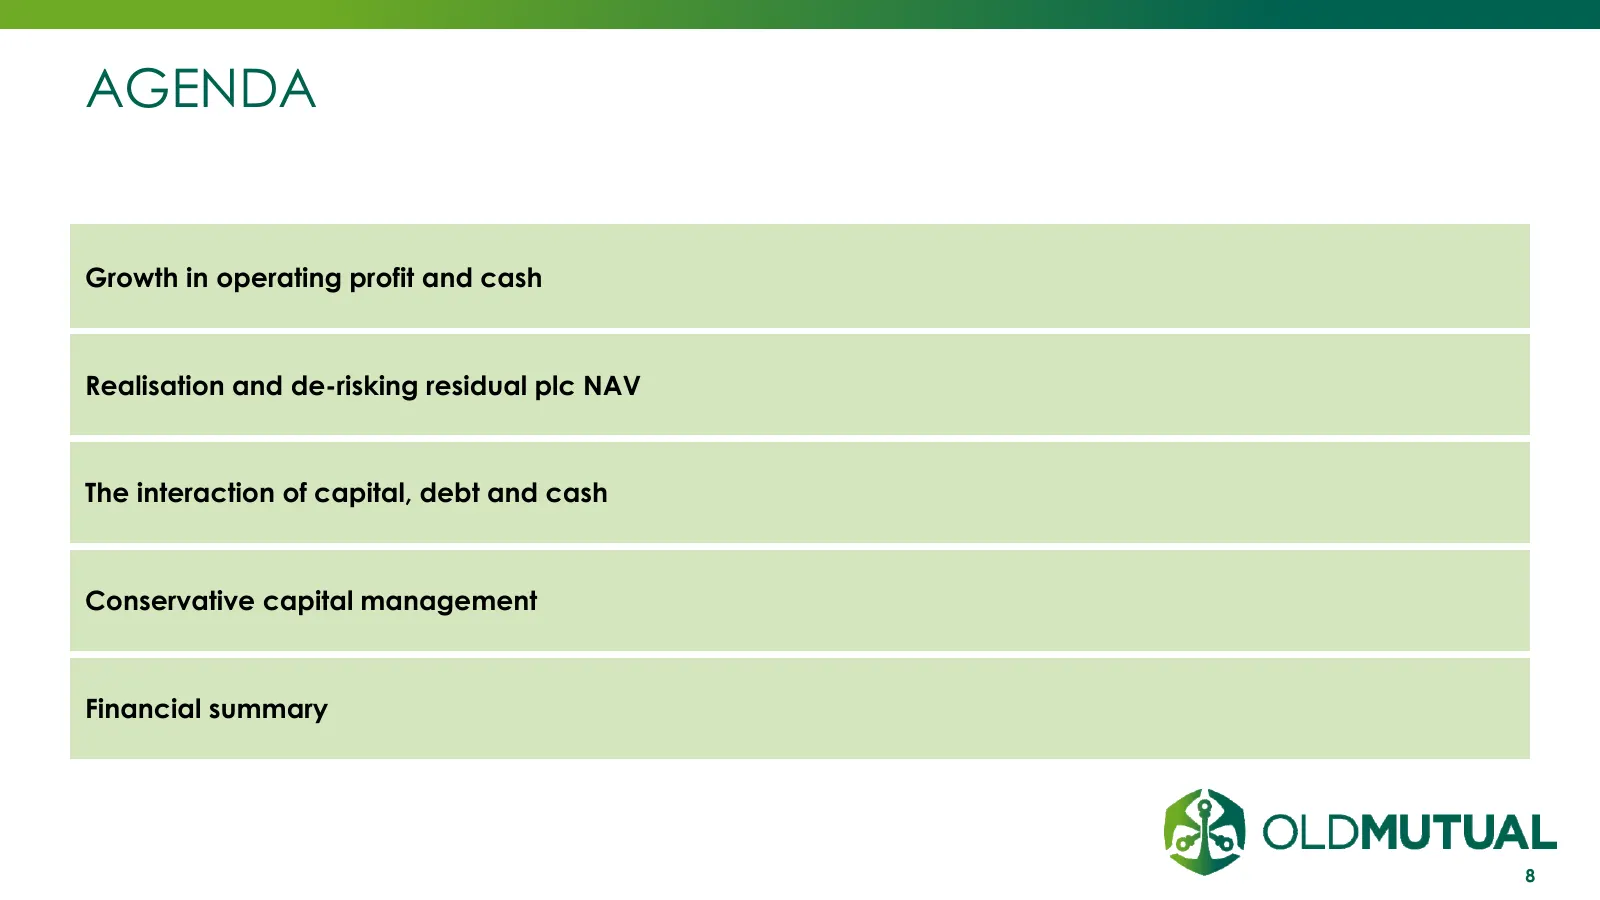
AGENDA Growth in operating profit and cash Realisation and de-risking residual plc NAV The interaction of capital, debt and cash Conservative capital management Financial summary 8
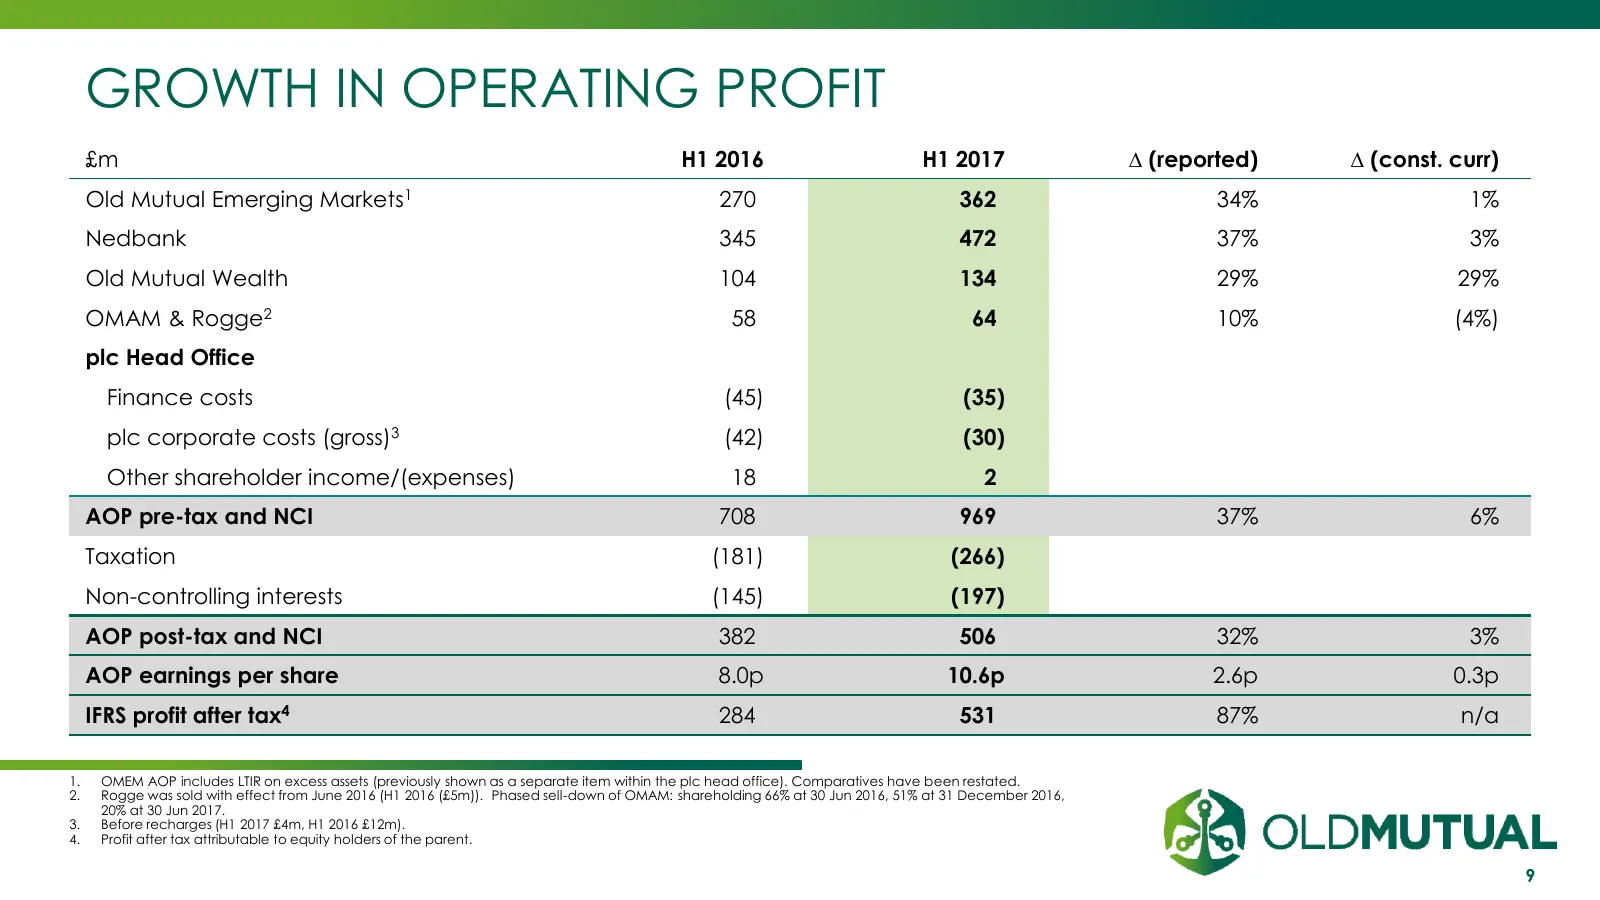
Slide 9: Growth in operating profit
GROWTH IN OPERATING PROFIT £m H1 2016 H1 2017 ∆ (reported) ∆ (const. curr) Old Mutual Emerging Markets1 270) 362) 34% 1% Nedbank 345) 472) 37% 3% Old Mutual Wealth 104) 134) 29% 29% OMAM & Rogge2 58) 64) 10% (4%) plc Head Office Finance costs (45) (35) plc corporate costs (gross)3 (42) (30) Other sh
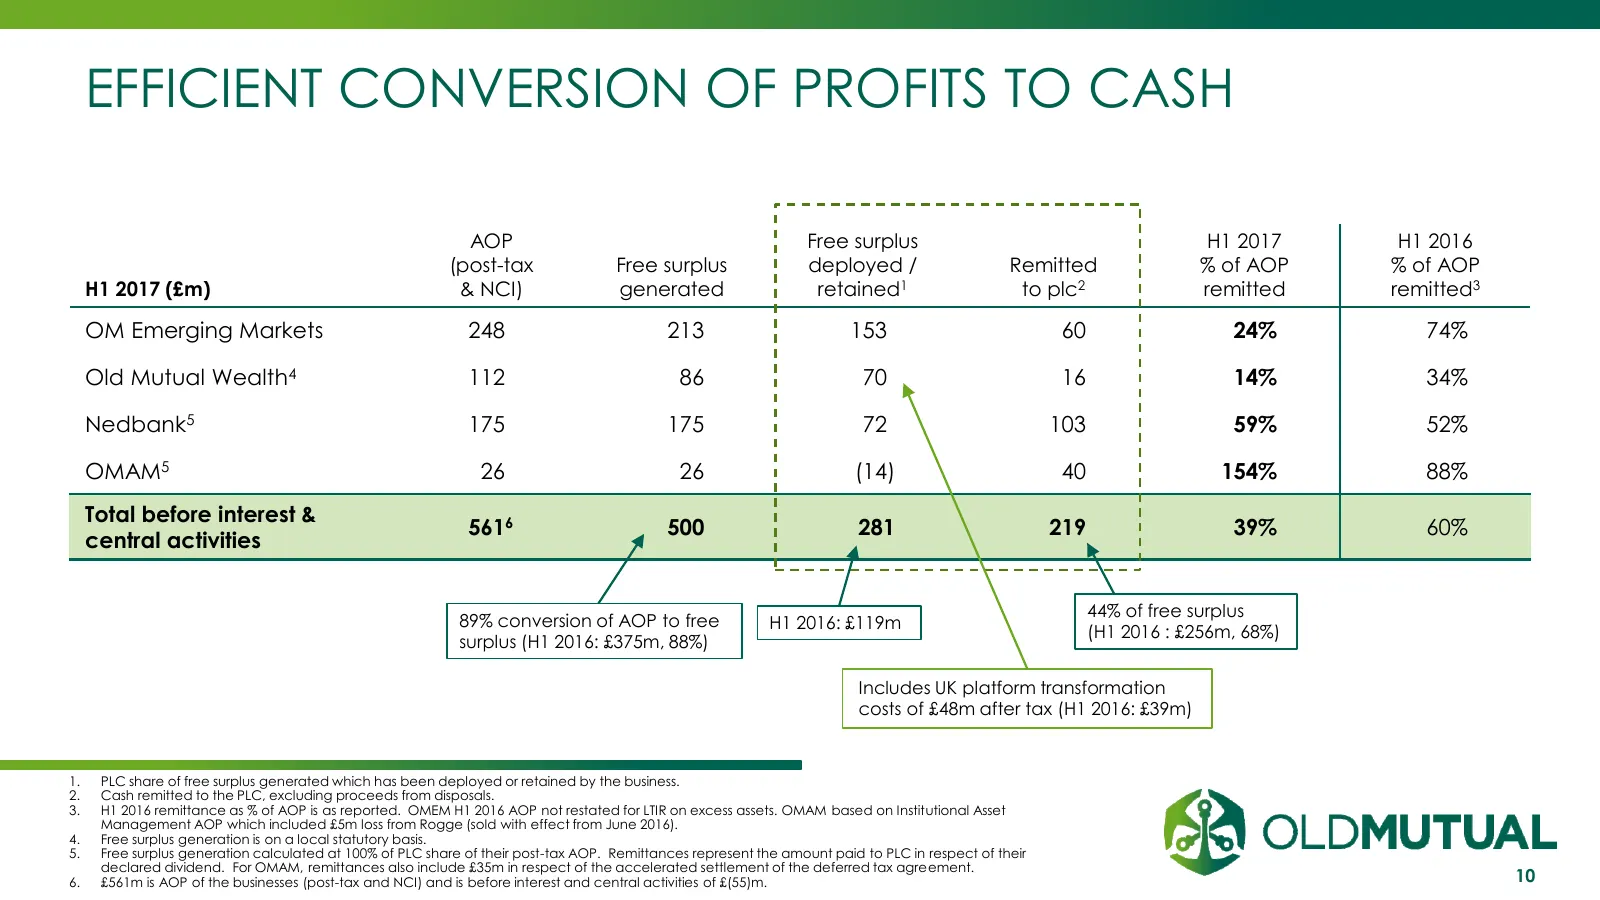
Slide 10: Efficient conversion of profits to cash
EFFICIENT CONVERSION OF PROFITS TO CASH AOP Free surplus H1 2017 H1 2016 (post-tax Free surplus deployed / Remitted % of AOP % of AOP H1 2017 (£m) & NCI) generated retained1 to plc2 remitted remitted3 OM Emerging Markets 2485 213 153) 60 24% 74% Old Mutual Wealth4 1125 86 70) 16 14% 34% Nedbank5 175
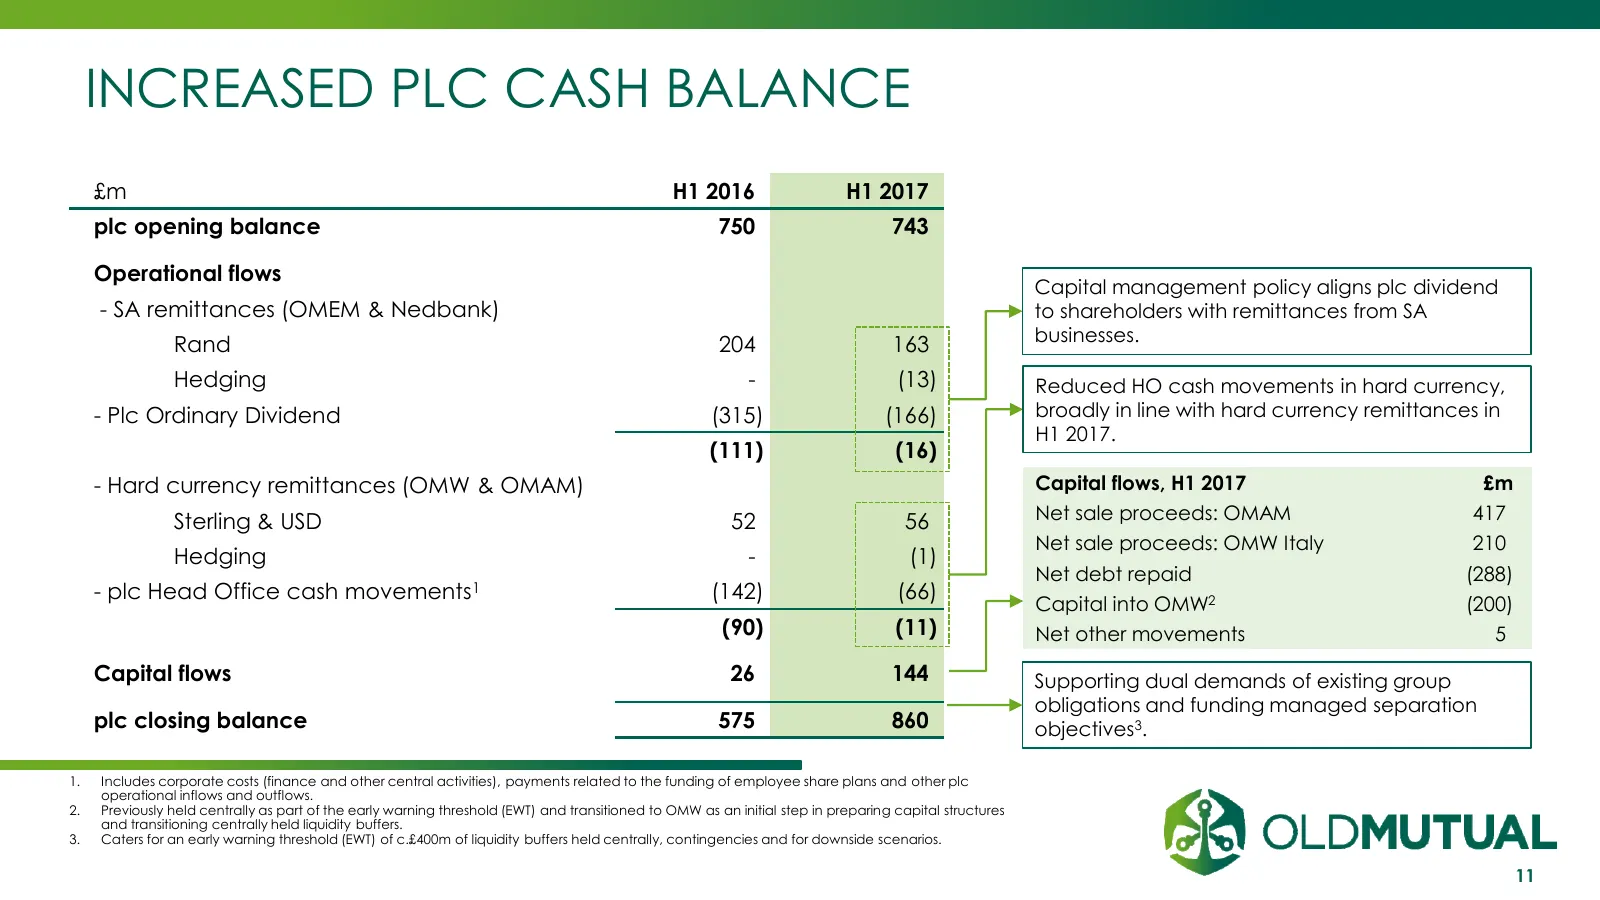
Slide 11: Increased plc cash balance
INCREASED PLC CASH BALANCE £m H1 2016) H1 2017) plc opening balance 750) 743) Operational flows Capital management policy aligns plc dividend - SA remittances (OMEM & Nedbank) to shareholders with remittances from SA Rand 204) 163) businesses. Hedging -) (13) Reduced HO cash movements in hard curren
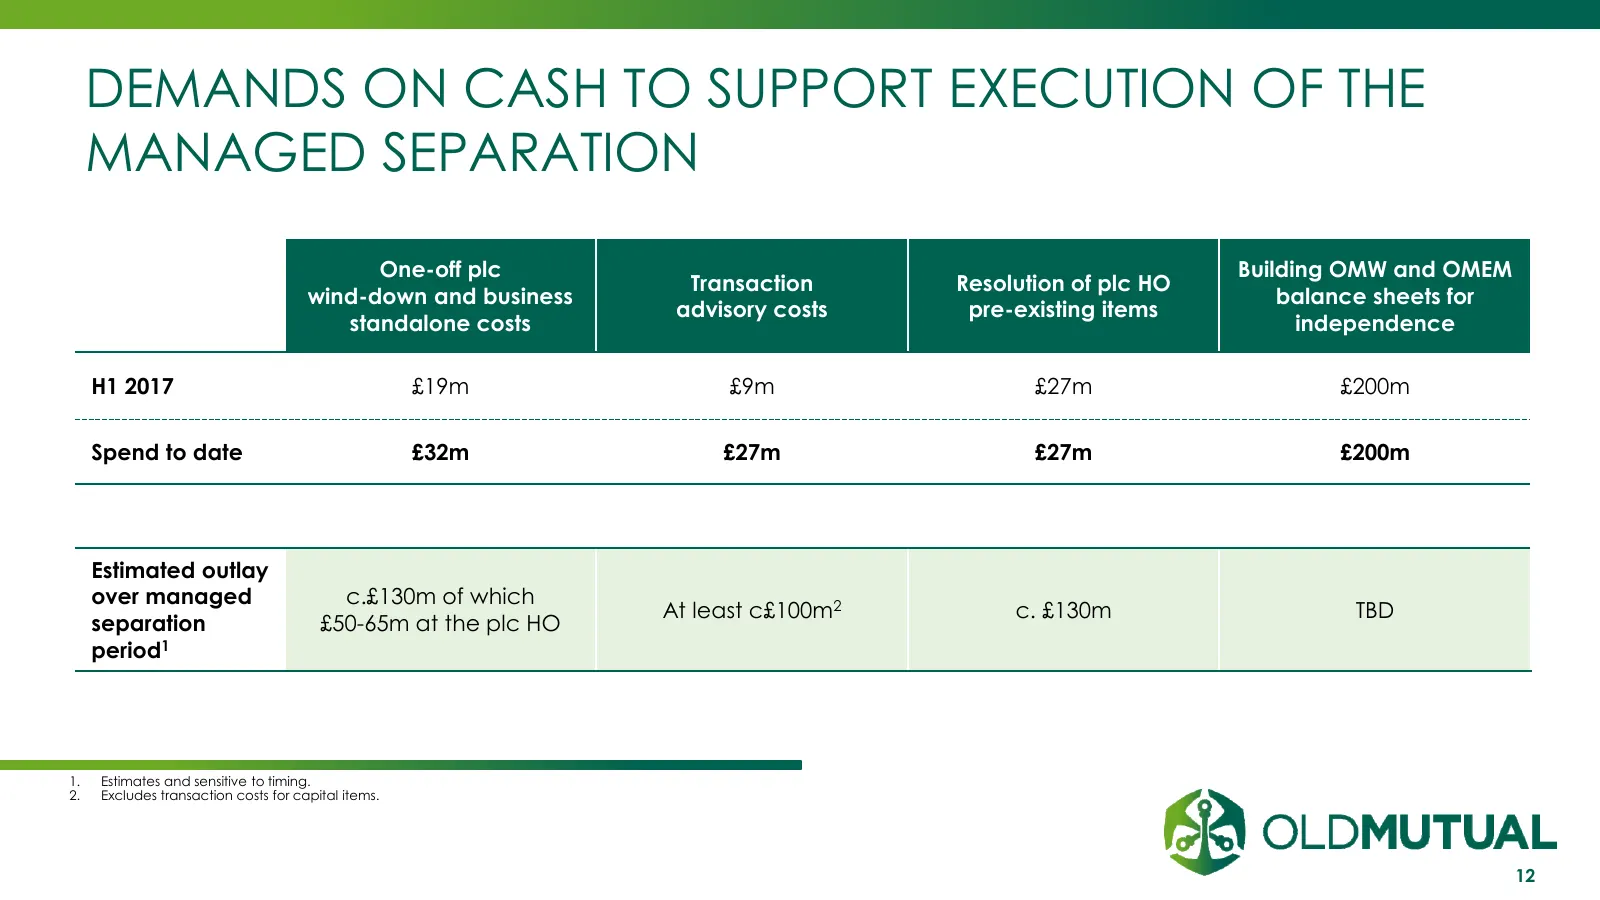
Slide 12: Demands on cash to support execution of the managed separation
DEMANDS ON CASH TO SUPPORT EXECUTION OF THE MANAGED SEPARATION One-off plc Building OMW and OMEM Transaction Resolution of plc HO wind-down and business balance sheets for advisory costs pre-existing items standalone costs independence H1 2017 £19m £9m £27m £200m Spend to date £32m £27m £27m £200m E
Slide 13: Unlocking value for shareholders
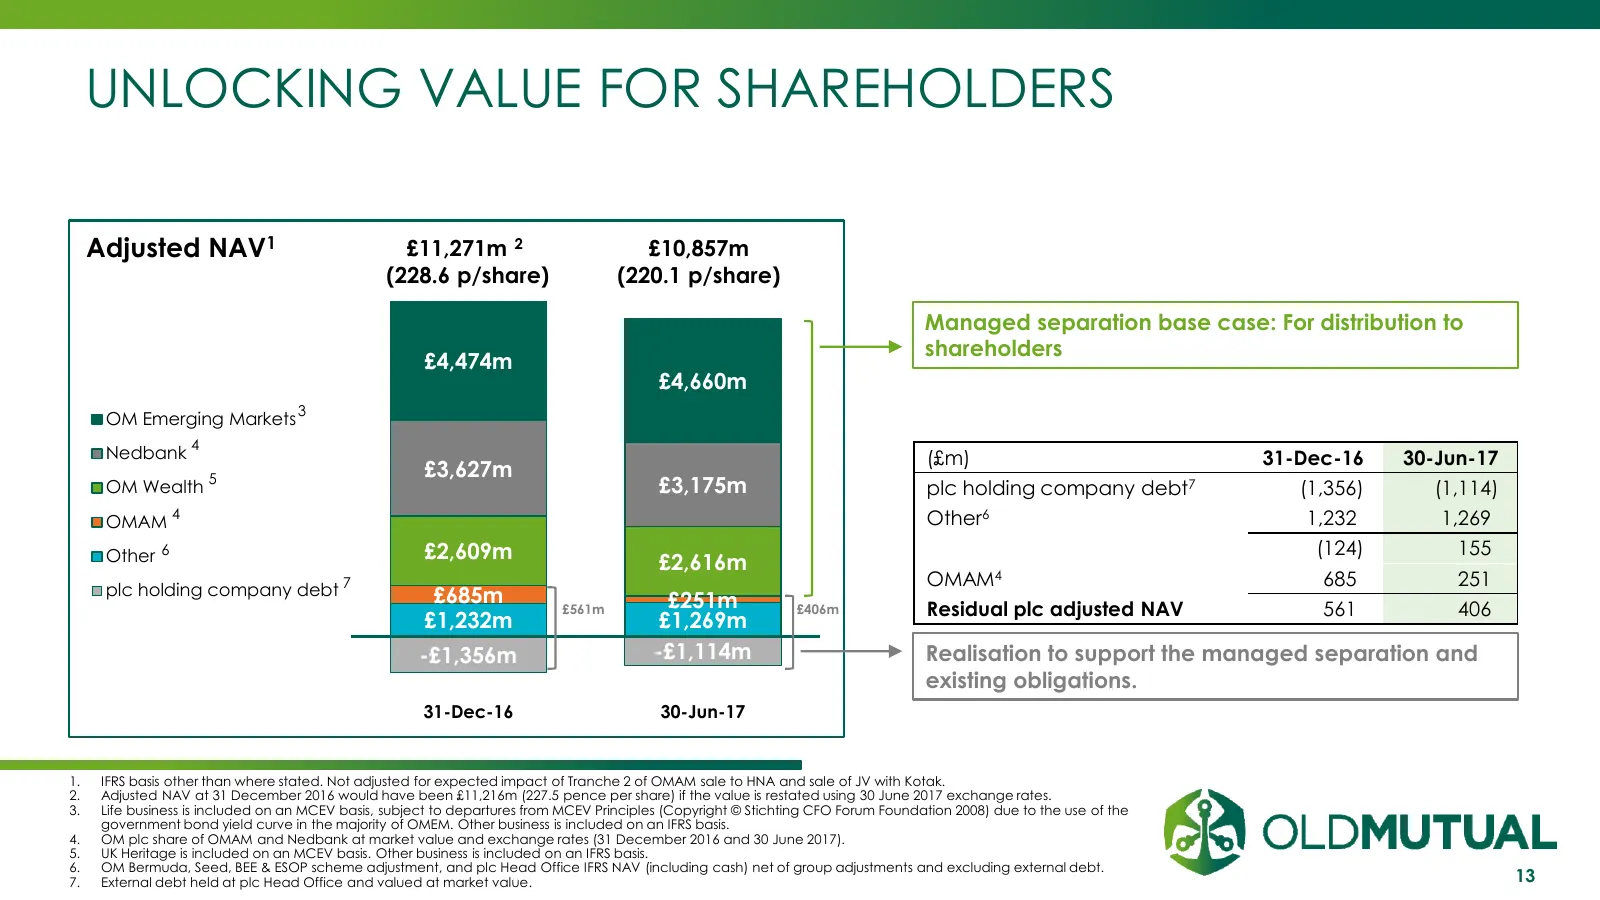
UNLOCKING VALUE FOR SHAREHOLDERS Adjusted NAV1 £11,271m 2 £10,857m (228.6 p/share) (220.1 p/share) Managed separation base case: For distribution to shareholders £4,474m £4,660m 3 OM Emerging Markets Nedbank 4 (£m) 31-Dec-16 30-Jun-17 5 £3,627m OM Wealth £3,175m plc holding company debt7 (1,356) (1,
Slide 14: Increased cash certainty of residual plc assets
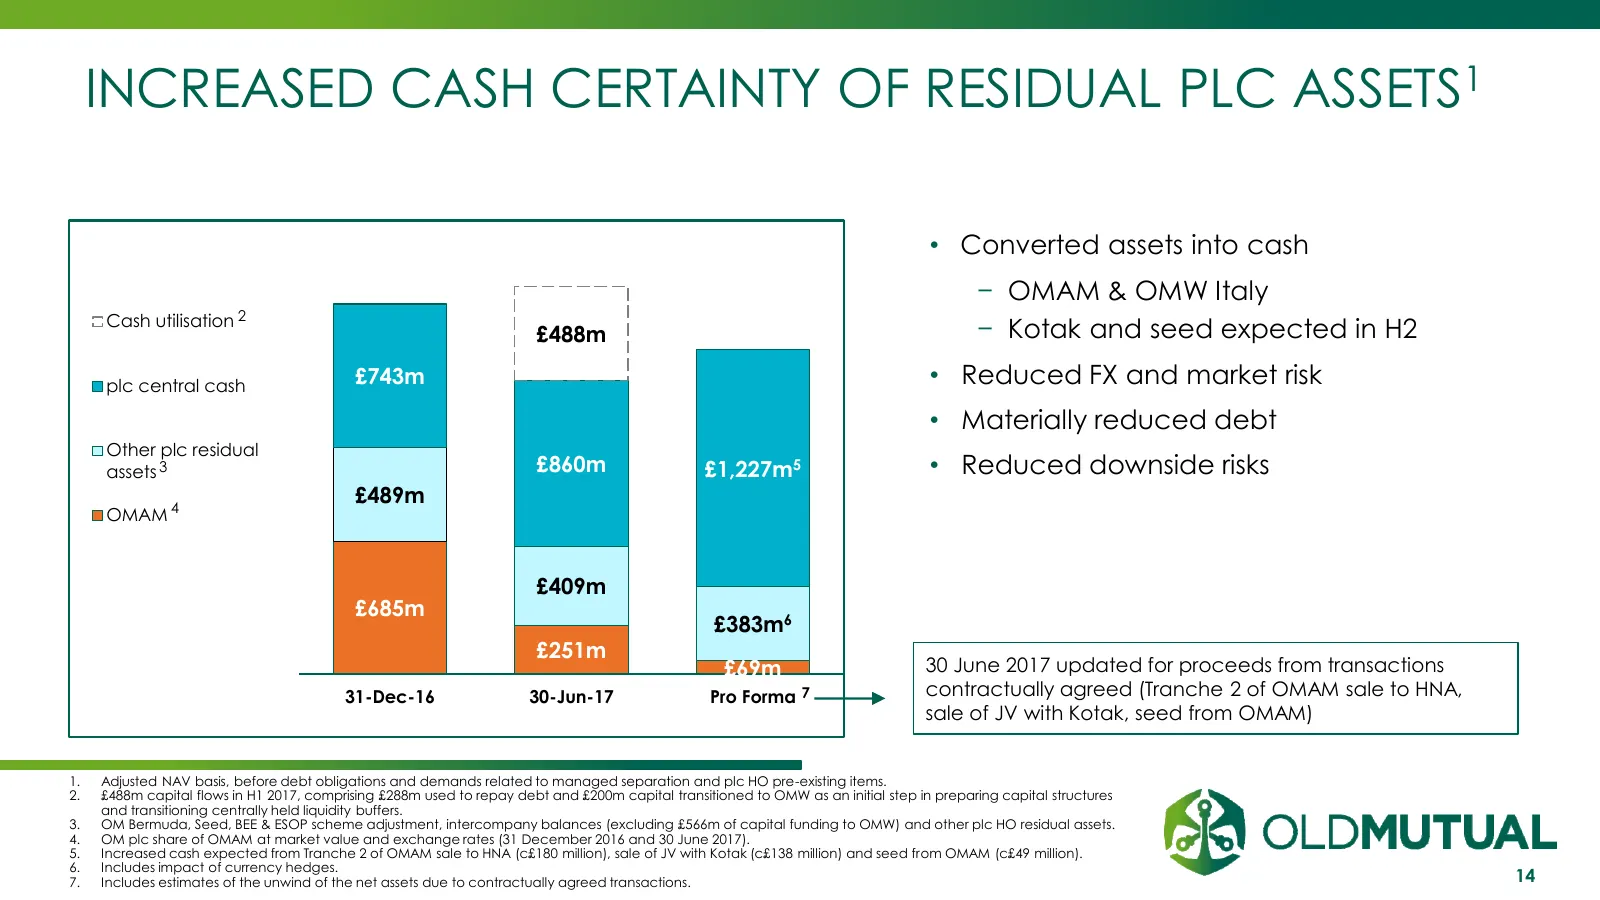
INCREASED CASH CERTAINTY OF RESIDUAL PLC ASSETS1 • Converted assets into cash − OMAM & OMW Italy Cash utilisation 2 £488m − Kotak and seed expected in H2 plc central cash £743m • Reduced FX and market risk • Materially reduced debt Other plc residual assets 3 £860m £1,227m5 • Reduced downside risks
Slide 15: T2 debt underpins plc Solvency II surplus
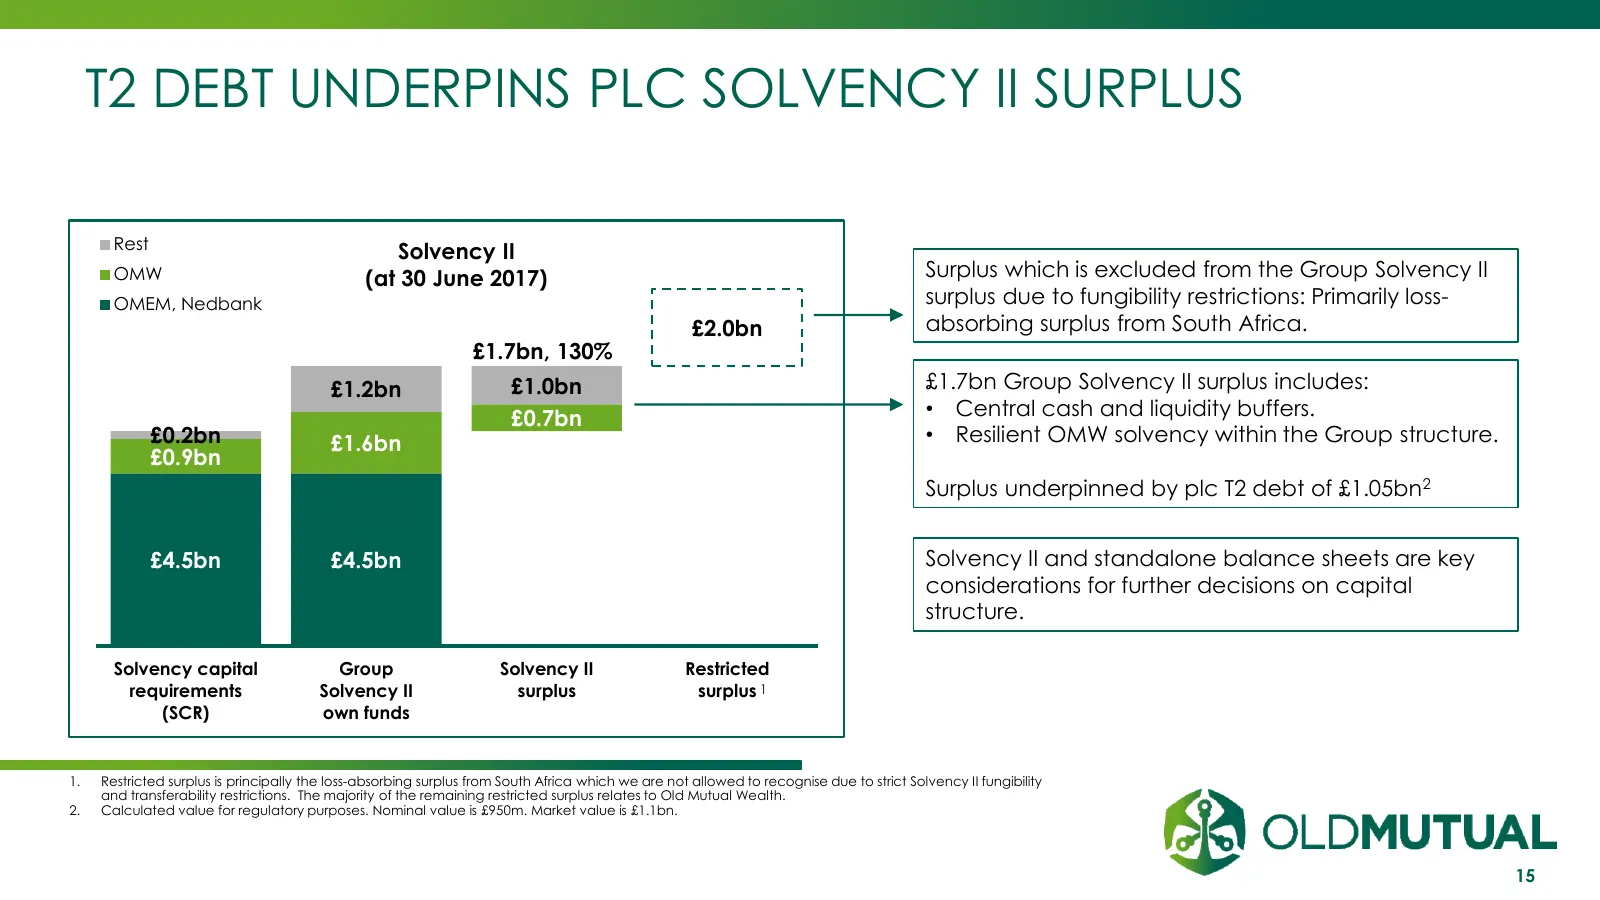
T2 DEBT UNDERPINS PLC SOLVENCY II SURPLUS Rest Solvency II OMW (at 30 June 2017) Surplus which is excluded from the Group Solvency II OMEM, Nedbank surplus due to fungibility restrictions: Primarily loss- £2.0bn absorbing surplus from South Africa. £1.7bn, 130% £1.2bn £1.0bn £1.7bn Group Solvency II
Slide 16: Conservative capital management
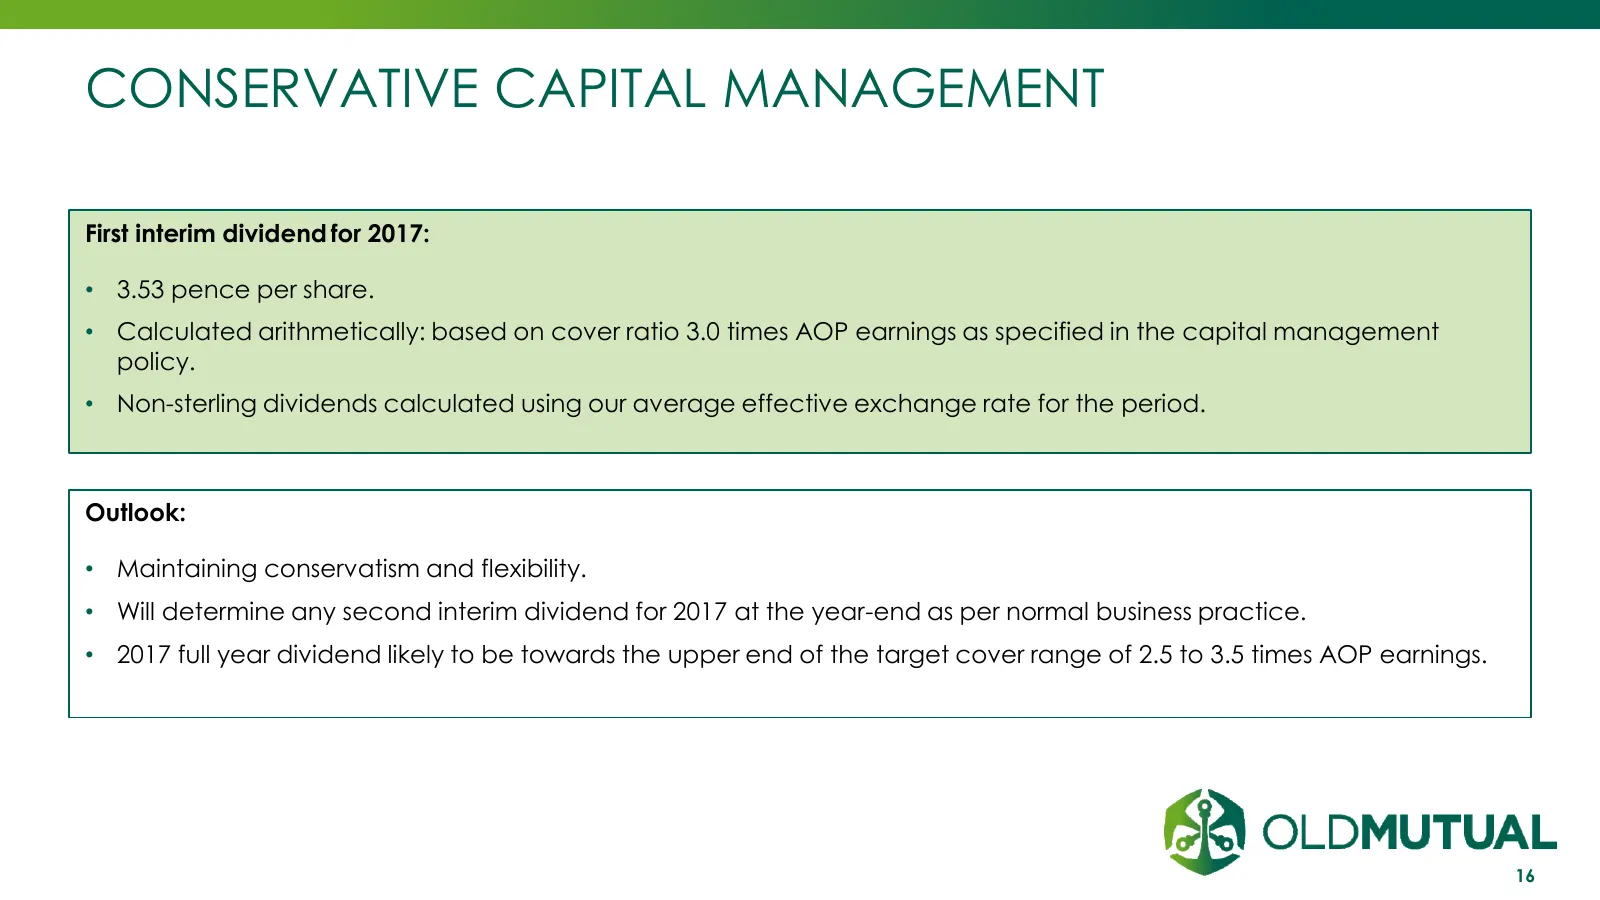
CONSERVATIVE CAPITAL MANAGEMENT First interim dividend for 2017: • 3.53 pence per share. • Calculated arithmetically: based on cover ratio 3.0 times AOP earnings as specified in the capital management policy. • Non-sterling dividends calculated using our average effective exchange rate for the perio
Slide 17: Financial summary
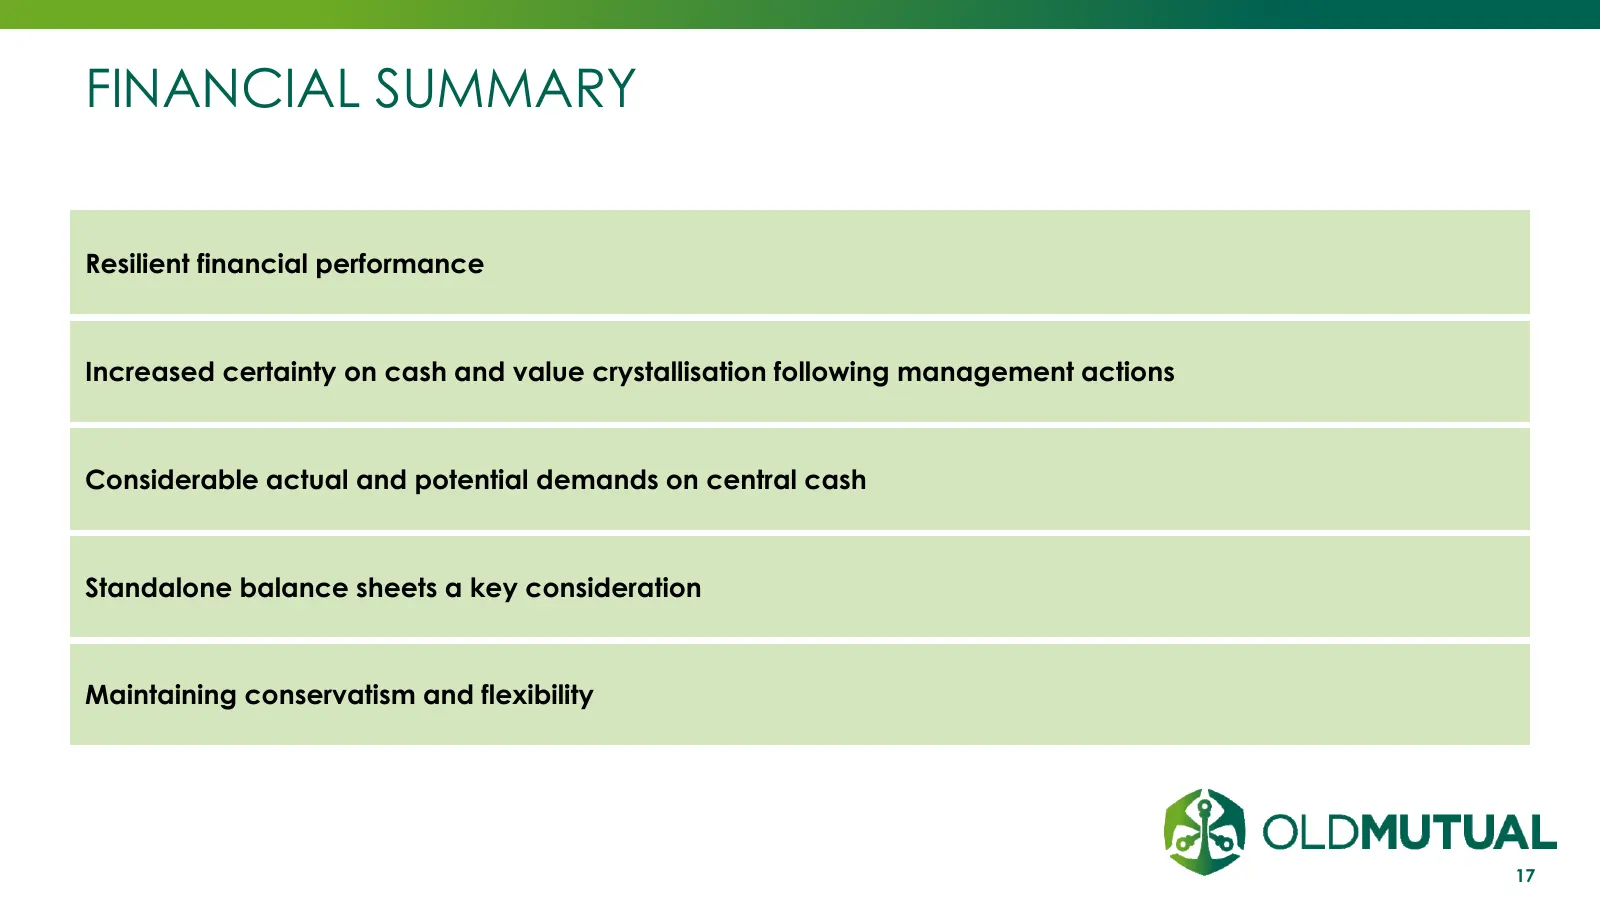
FINANCIAL SUMMARY Resilient financial performance Increased certainty on cash and value crystallisation following management actions Considerable actual and potential demands on central cash Standalone balance sheets a key consideration Maintaining conservatism and flexibility 17

Slide 18: Old Mutual Emerging Markets
OLD MUTUAL EMERGING MARKETS Peter Moyo – Chief Executive Officer 11 August 2017 INVESTMENT | SAVINGS | INSURANCE | BANKING
Slide 19: "Second" impressions of OMEM
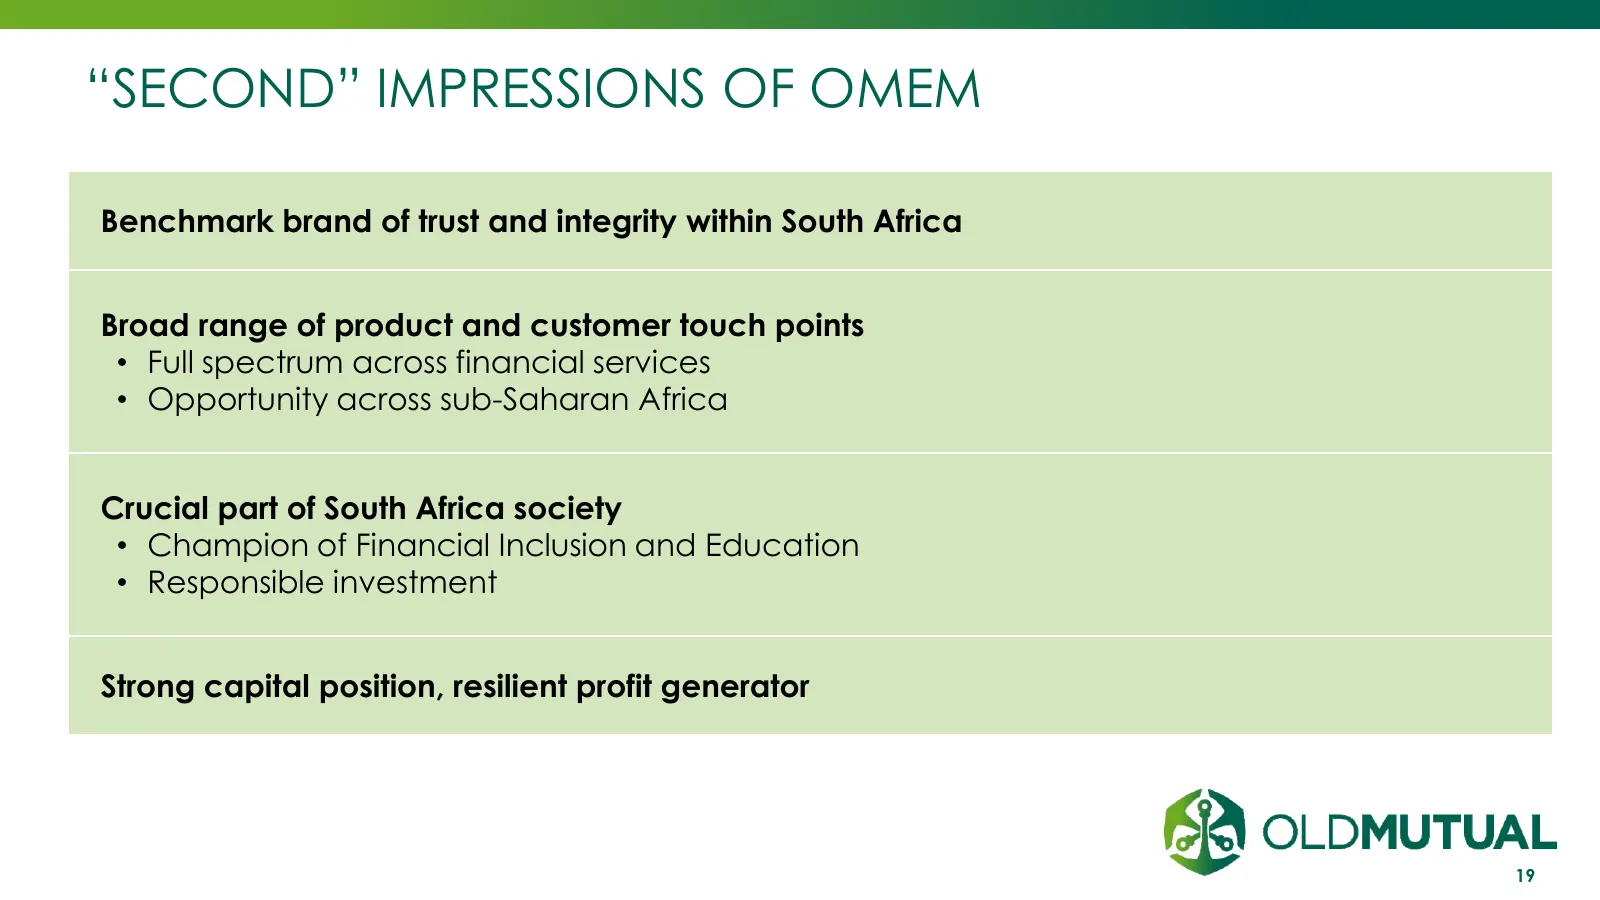
“SECOND” IMPRESSIONS OF OMEM Benchmark brand of trust and integrity within South Africa Broad range of product and customer touch points • Full spectrum across financial services • Opportunity across sub-Saharan Africa Crucial part of South Africa society • Champion of Financial Inclusion and Educat
Slide 20: Operational performance
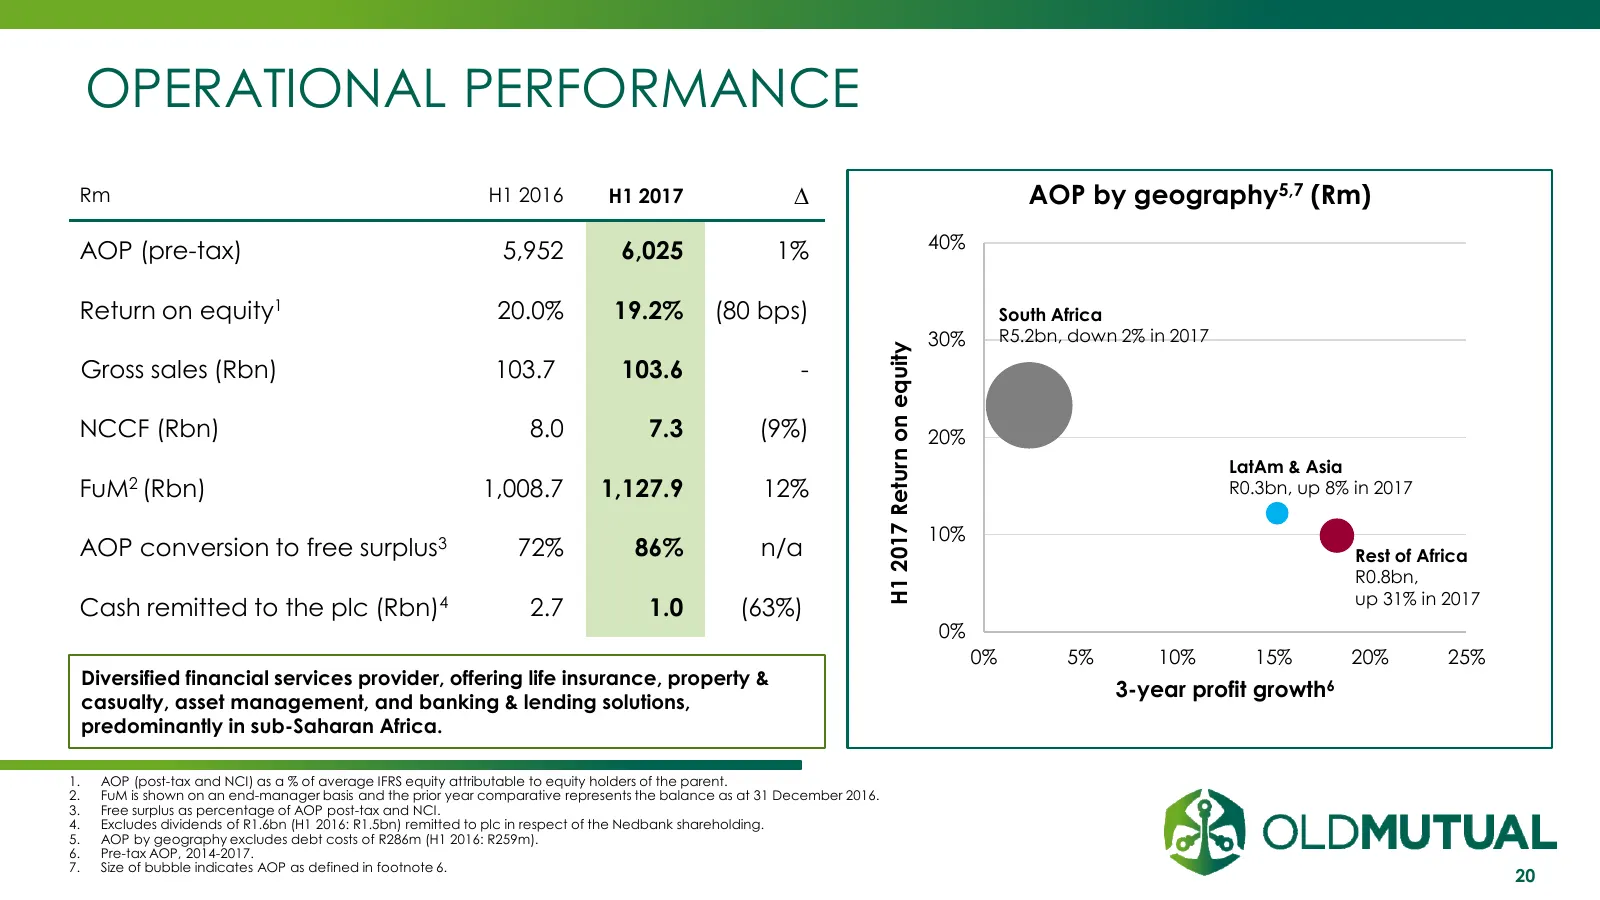
OPERATIONAL PERFORMANCE Rm H1 2016 H1 2017 ∆ AOP by geography5,7 (Rm) AOP (pre-tax) 5,952 6,025 1% 40% Return on equity1 20.0% 19.2% (80 bps) South Africa 30% R5.2bn, down 2% in 2017 H1 2017 Return on equity Gross sales (Rbn) 103.7 103.6 - NCCF (Rbn) 8.0 7.3 (9%) 20% LatAm & Asia FuM2 (Rbn) 1,008.7
Slide 21: South Africa review
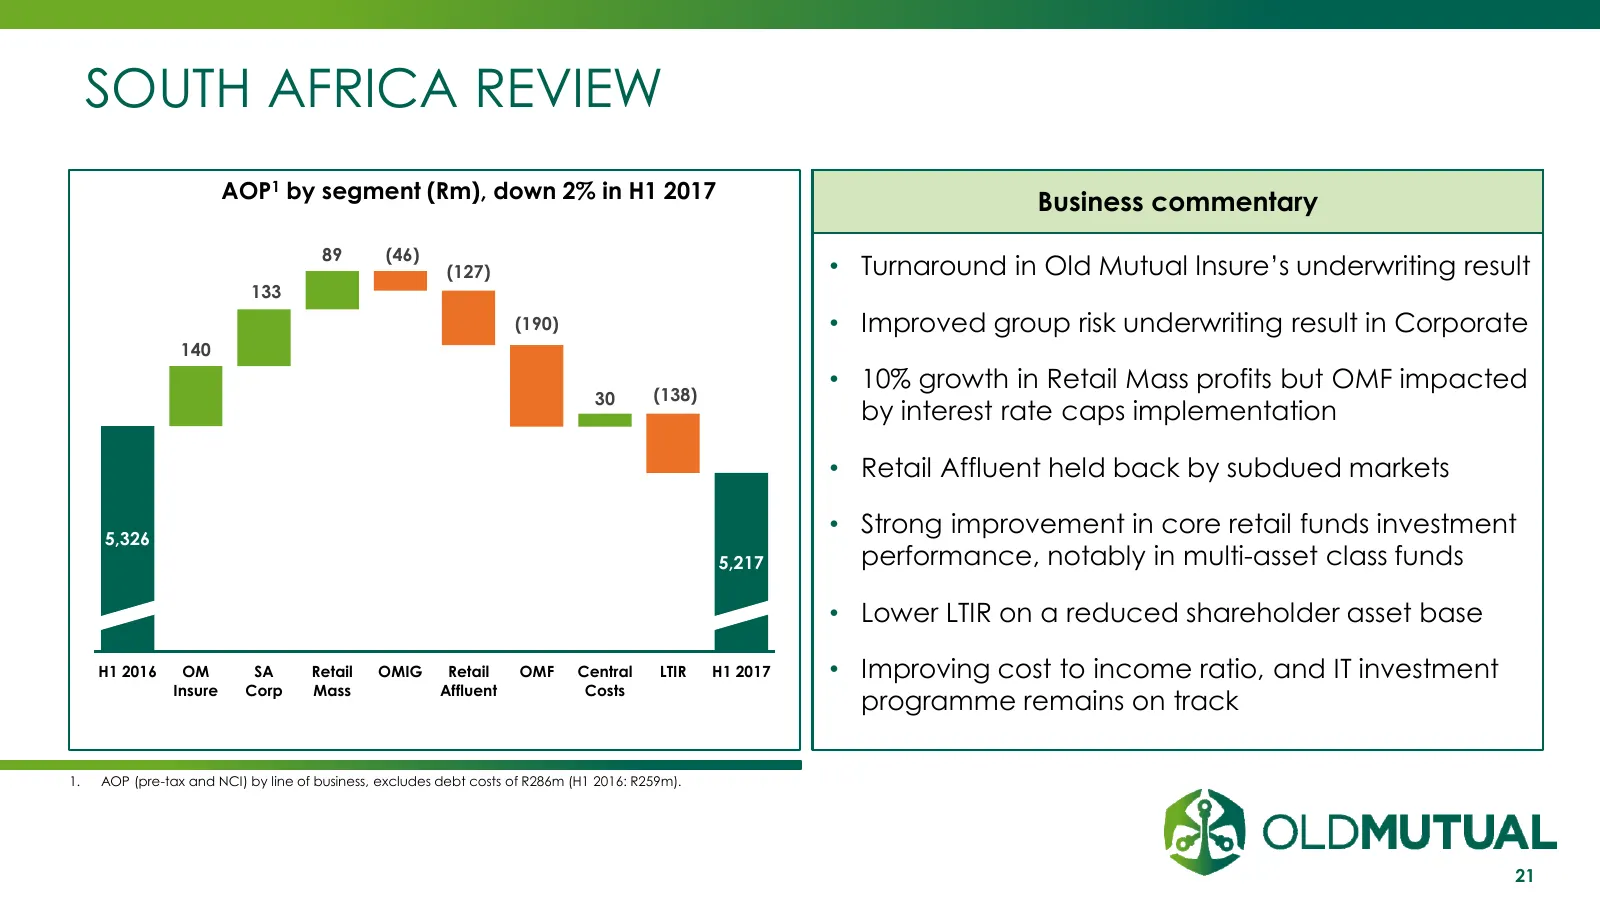
SOUTH AFRICA REVIEW AOP1 by segment (Rm), down 2% in H1 2017 Business commentary 89 (46) 0 (127) • Turnaround in Old Mutual lnsure’s underwriting result 133 (190) • Improved group risk underwriting result in Corporate 140 (138) • 10% growth in Retail Mass profits but OMF impacted 30 by interest rate
Slide 22: OMEM ex. South Africa review
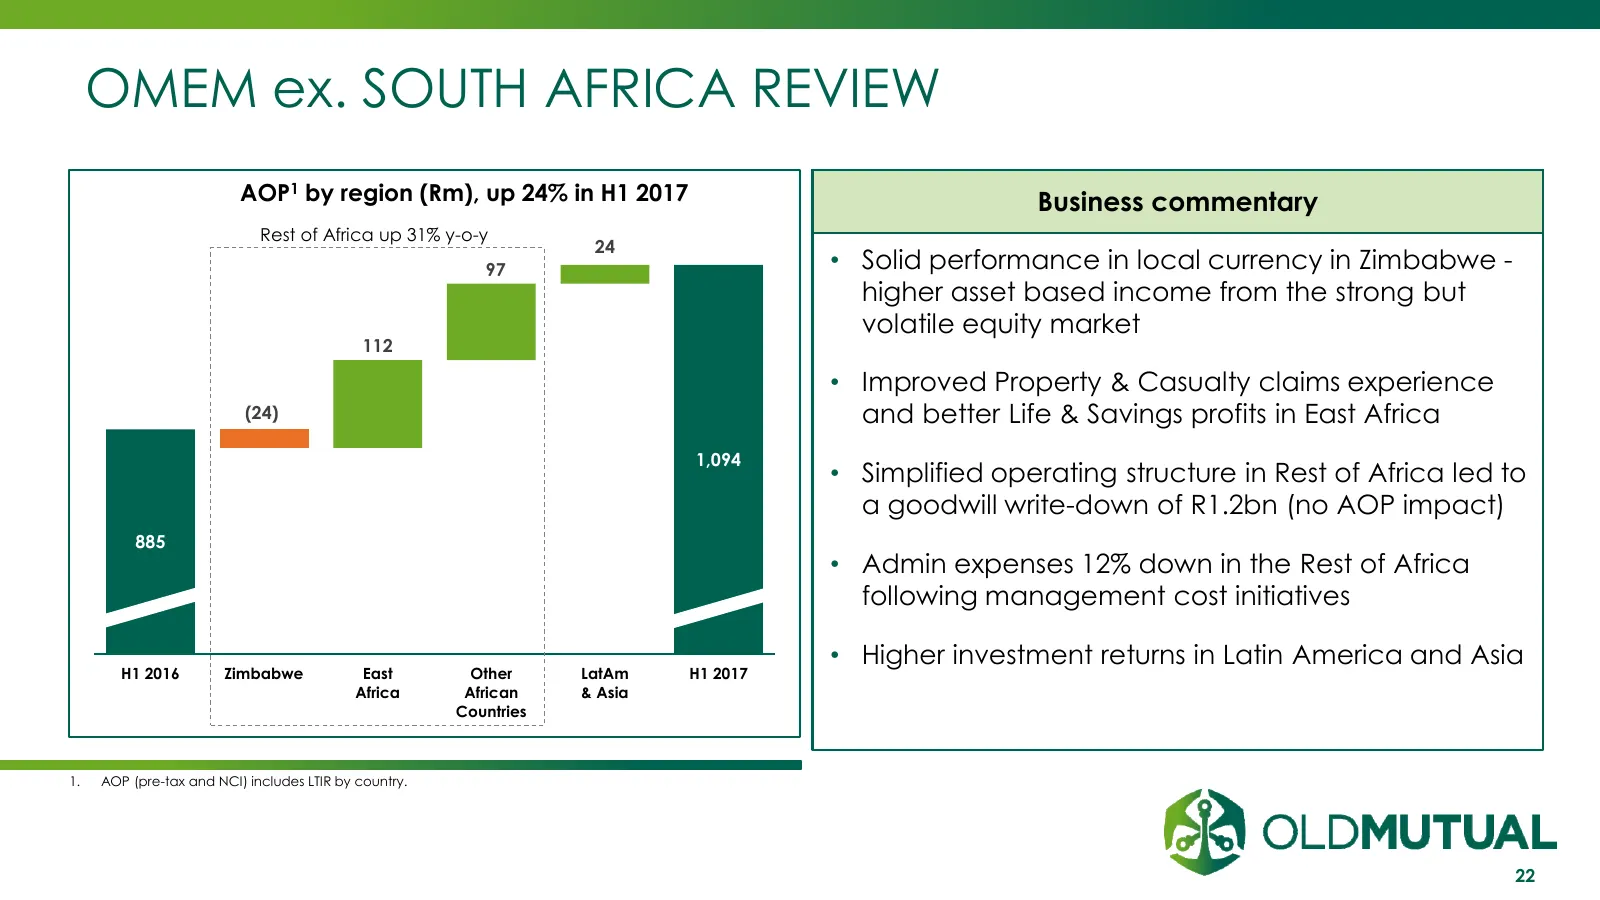
OMEM ex. SOUTH AFRICA REVIEW AOP1 by region (Rm), up 24% in H1 2017 Business commentary Rest of Africa up 31% y-o-y 24 0 currency in Zimbabwe - • Solid performance in local 97 higher asset based income from the strong but volatile equity market 112 • Improved Property & Casualty claims experience (2
Slide 23: Emerging Markets MCEV results
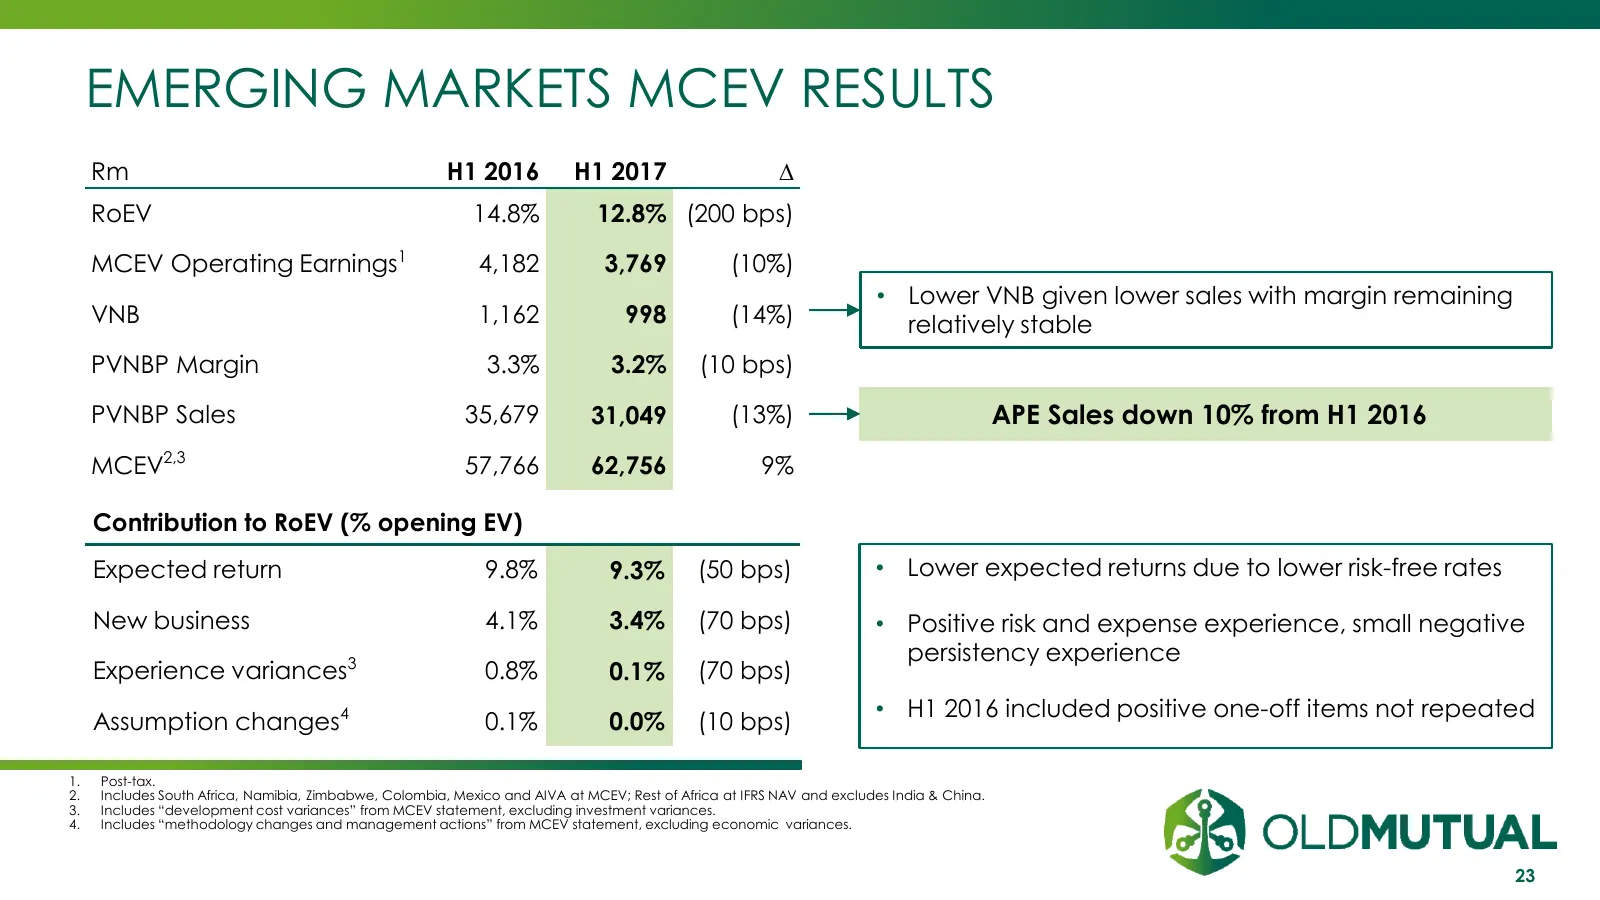
EMERGING MARKETS MCEV RESULTS Rm H1 2016 H1 2017 ∆ RoEV 14.8% 12.8% (200 bps) MCEV Operating Earnings1 4,182 3,769 (10%) • Lower VNB given lower sales with margin remaining VNB 1,162 998 (14%) relatively stable PVNBP Margin 3.3% 3.2% (10 bps) PVNBP Sales 35,679 31,049 (13%) APE Sales down 10% from H
Slide 24: OMEM battlegrounds
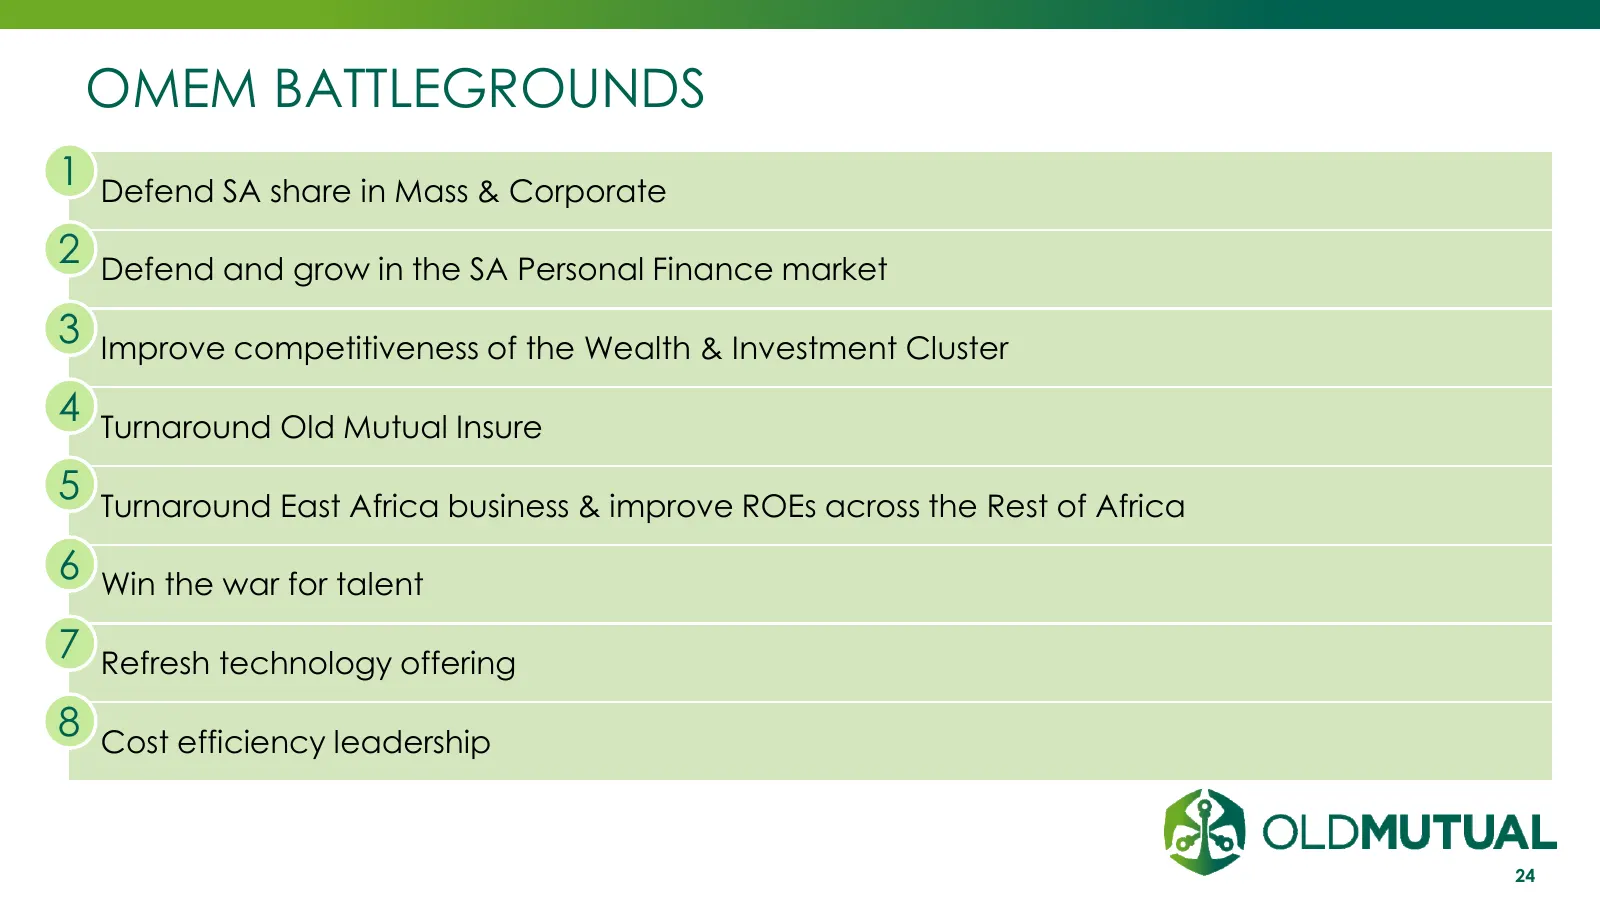
OMEM BATTLEGROUNDS 1 Defend SA share in Mass & Corporate 2 Defend and grow in the SA Personal Finance market 3 Improve competitiveness of the Wealth & Investment Cluster 4 Turnaround Old Mutual Insure 5 Turnaround East Africa business & improve ROEs across the Rest of Africa 6 Win the war for talent

Slide 25: Old Mutual Wealth
OLD MUTUAL WEALTH Paul Feeney - CEO 11 August 2017 INVESTMENT | SAVINGS | INSURANCE | BANKING
Slide 26: Old Mutual Wealth: strong results and good progress
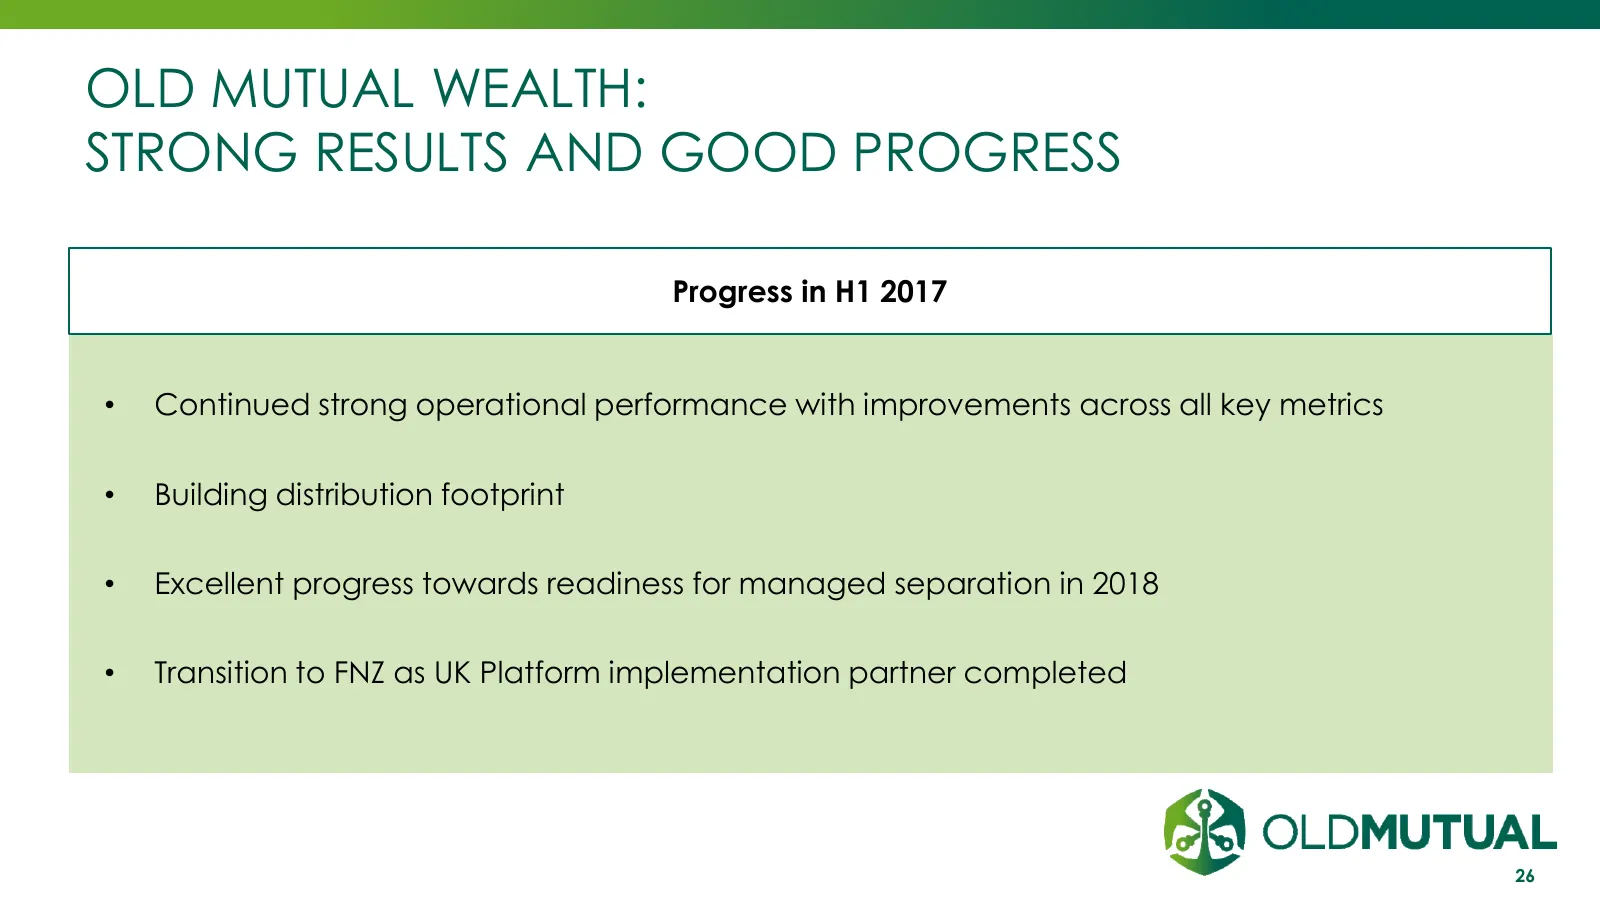
OLD MUTUAL WEALTH: STRONG RESULTS AND GOOD PROGRESS Progress in H1 2017 • Continued strong operational performance with improvements across all key metrics • Building distribution footprint • Excellent progress towards readiness for managed separation in 2018 • Transition to FNZ as UK Platform imple
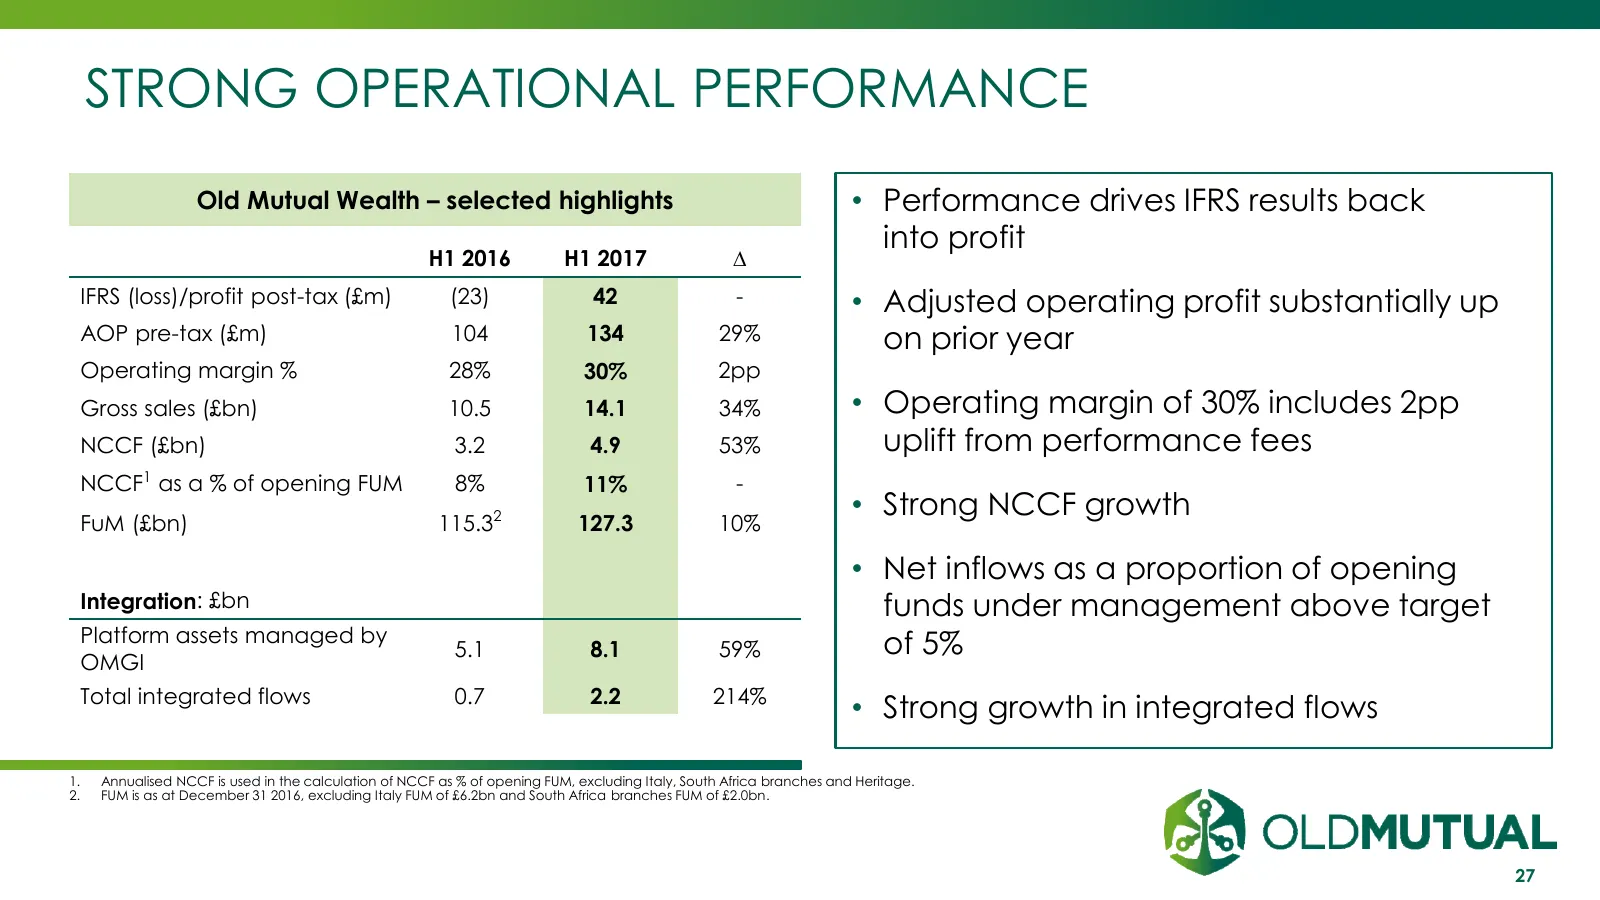
Slide 27: Strong operational performance
STRONG OPERATIONAL PERFORMANCE Old Mutual Wealth – selected highlights • Performance drives IFRS results back into profit H1 2016 H1 2017 ∆ IFRS (loss)/profit post-tax (£m) (23) 42 - • Adjusted operating profit substantially up AOP pre-tax (£m) 104 134 29% on prior year Operating margin % 28% 30% 2p
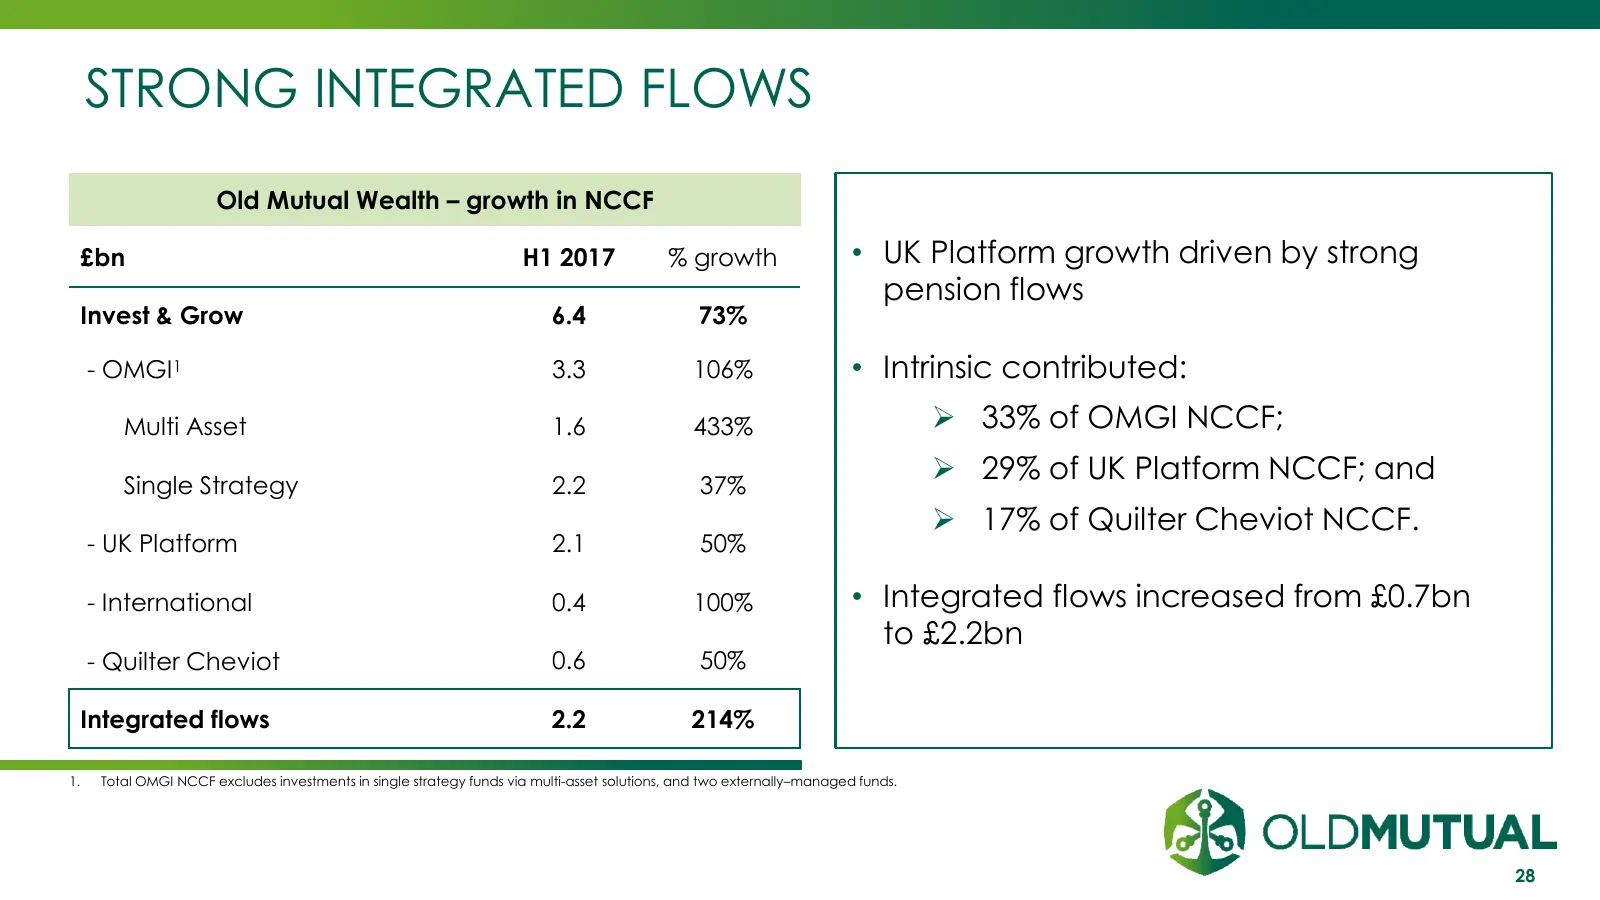
Slide 28: Strong integrated flows
STRONG INTEGRATED FLOWS Old Mutual Wealth – growth in NCCF £bn H1 2017 % growth • UK Platform growth driven by strong pension flows Invest & Grow 6.4 73% - OMGI1 3.3 106% • Intrinsic contributed: Multi Asset 1.6 433% 33% of OMGI NCCF; Single Strategy 2.2 37% 29% of UK Platform NCCF; and 17% of
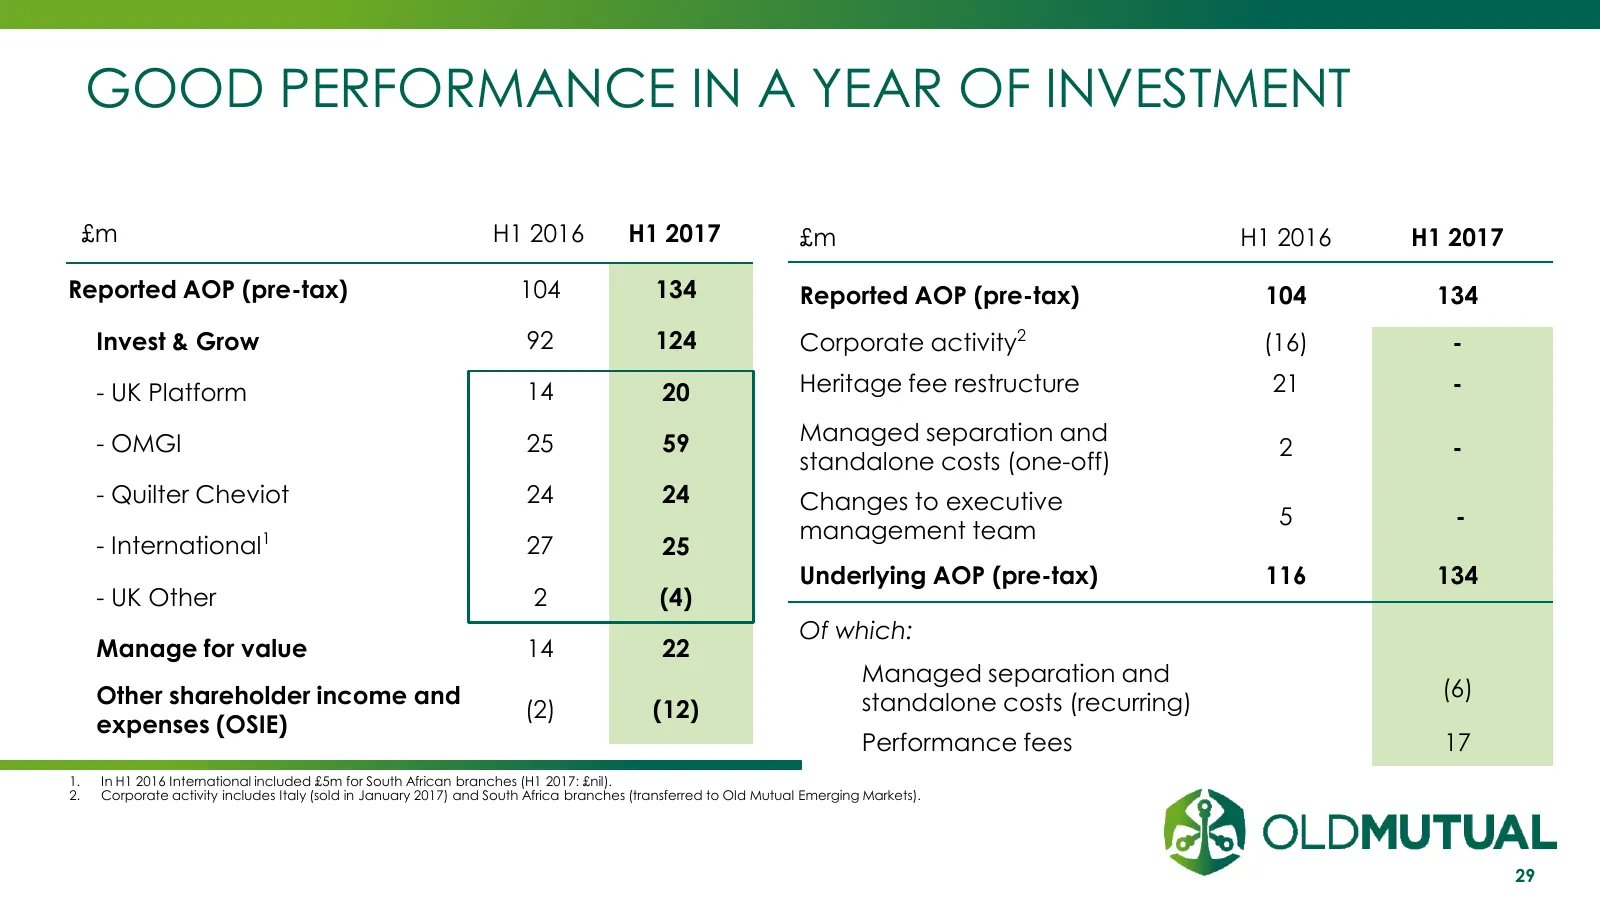
Slide 29: Good performance in a year of investment
GOOD PERFORMANCE IN A YEAR OF INVESTMENT £m H1 2016 H1 2017 £m H1 2016 H1 2017 Reported AOP (pre-tax) 104 134 Reported AOP (pre-tax) 104 134 Invest & Grow 92 124 Corporate activity2 (16) - - UK Platform 14 20 Heritage fee restructure 21 - - OMGI 25 59 Managed separation and 2 - standalone costs (one
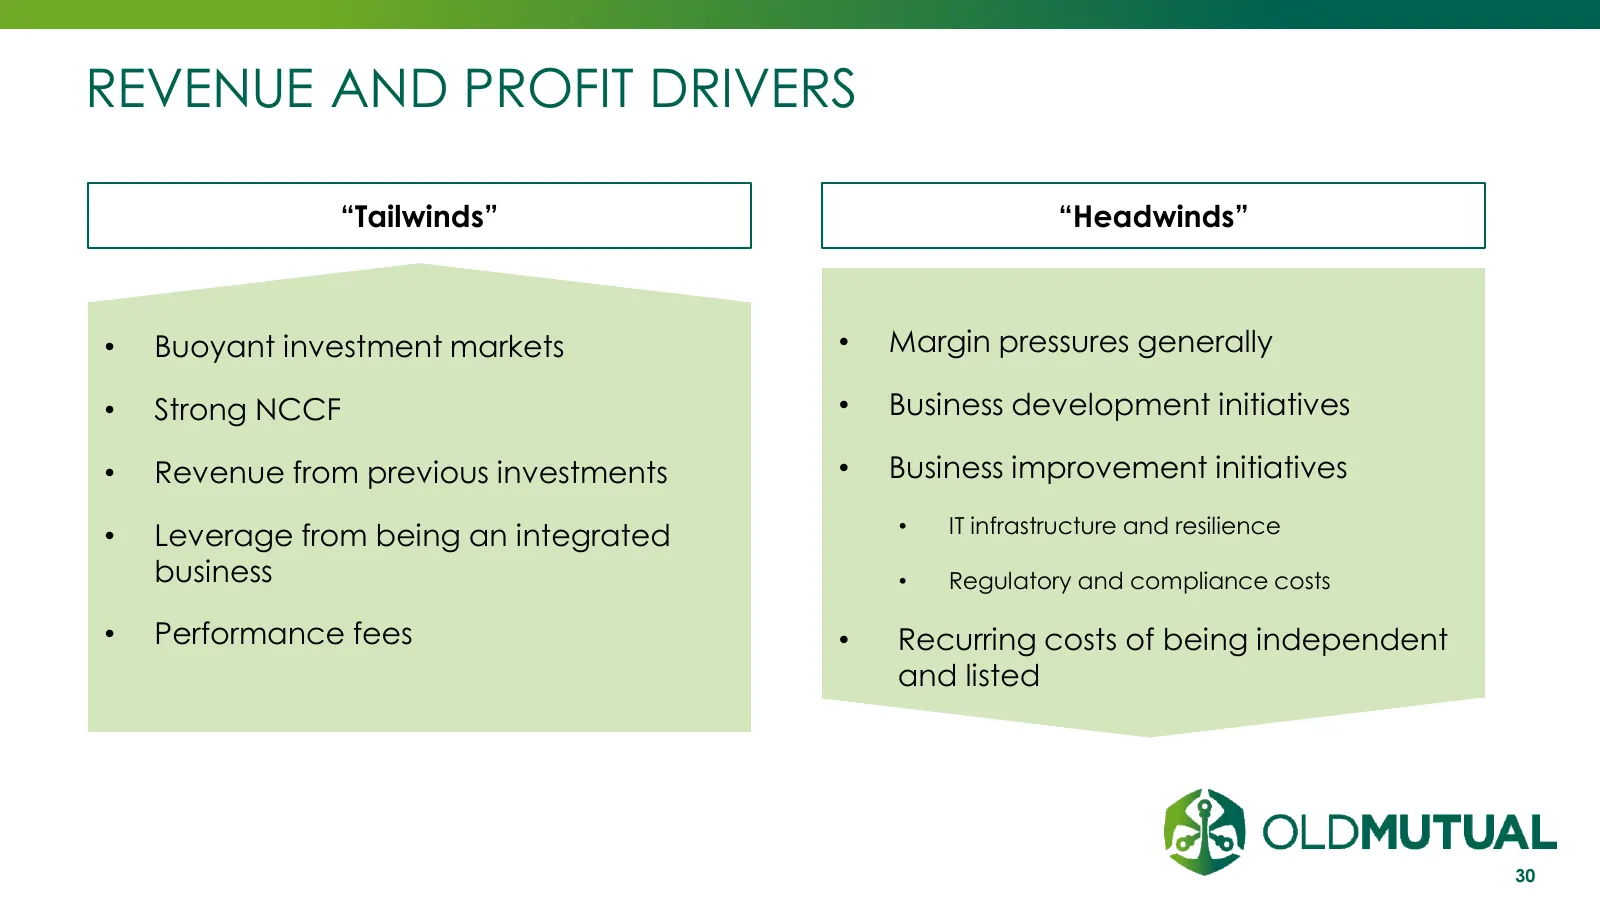
Slide 30: Revenue and profit drivers
REVENUE AND PROFIT DRIVERS “Tailwinds” “Headwinds” • Buoyant investment markets • Margin pressures generally • Strong NCCF • Business development initiatives • Revenue from previous investments • Business improvement initiatives • Leverage from being an integrated • IT infrastructure and resilience
Slide 31: Old Mutual Wealth: significant strategic progress
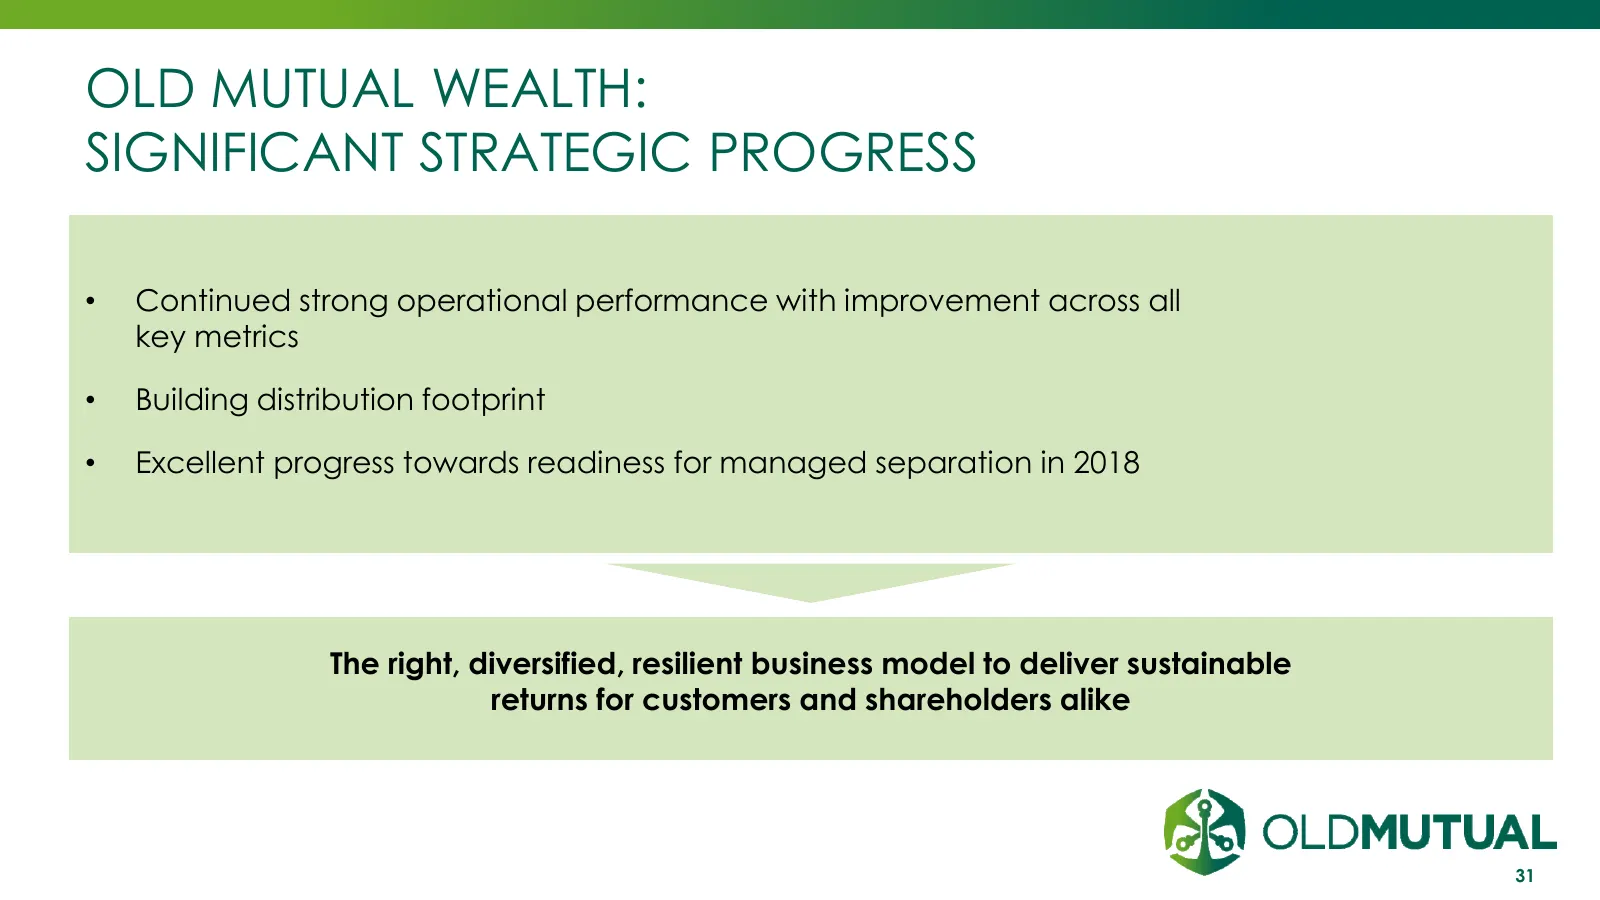
OLD MUTUAL WEALTH: SIGNIFICANT STRATEGIC PROGRESS • Continued strong operational performance with improvement across all key metrics • Building distribution footprint • Excellent progress towards readiness for managed separation in 2018 The right, diversified, resilient business model to deliver sus
Slide 32: Business Reviews
BUSINESS REVIEWS Bruce Hemphill 11 August 2017 INVESTMENT | SAVINGS | INSURANCE | BANKING
Slide 33: OMEM: strong franchise in South Africa and positioned for growth
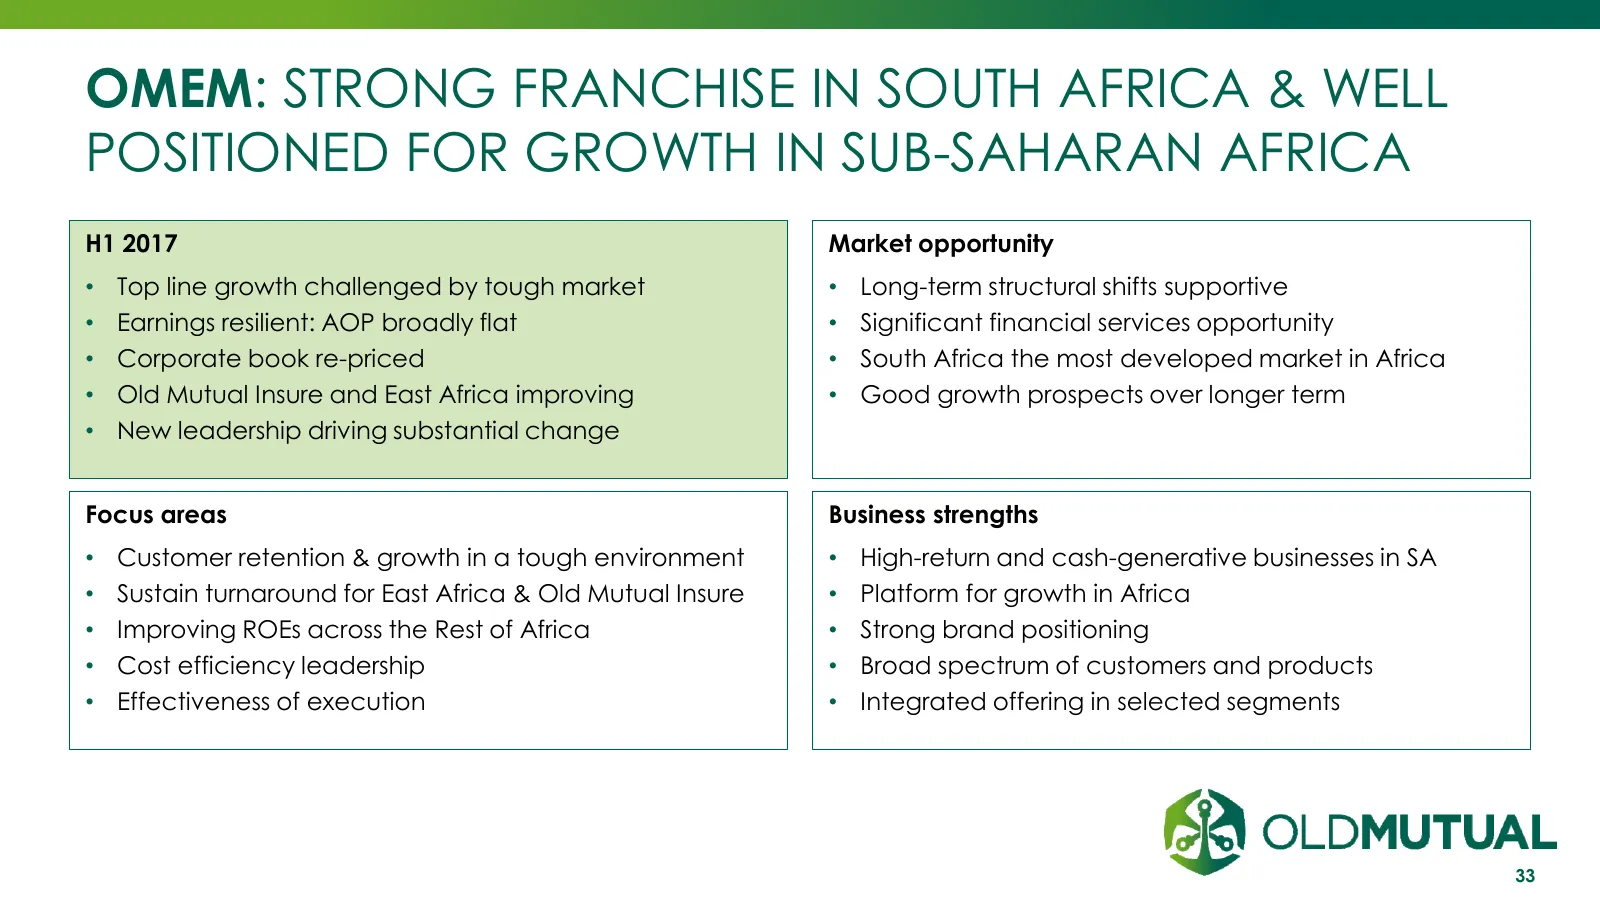
OMEM: STRONG FRANCHISE IN SOUTH AFRICA & WELL POSITIONED FOR GROWTH IN SUB-SAHARAN AFRICA H1 2017 Market opportunity • Top line growth challenged by tough market • Long-term structural shifts supportive • Earnings resilient: AOP broadly flat • Significant financial services opportunity • Corporate b
Slide 34: Old Mutual Wealth: well placed to capitalise on opportunities
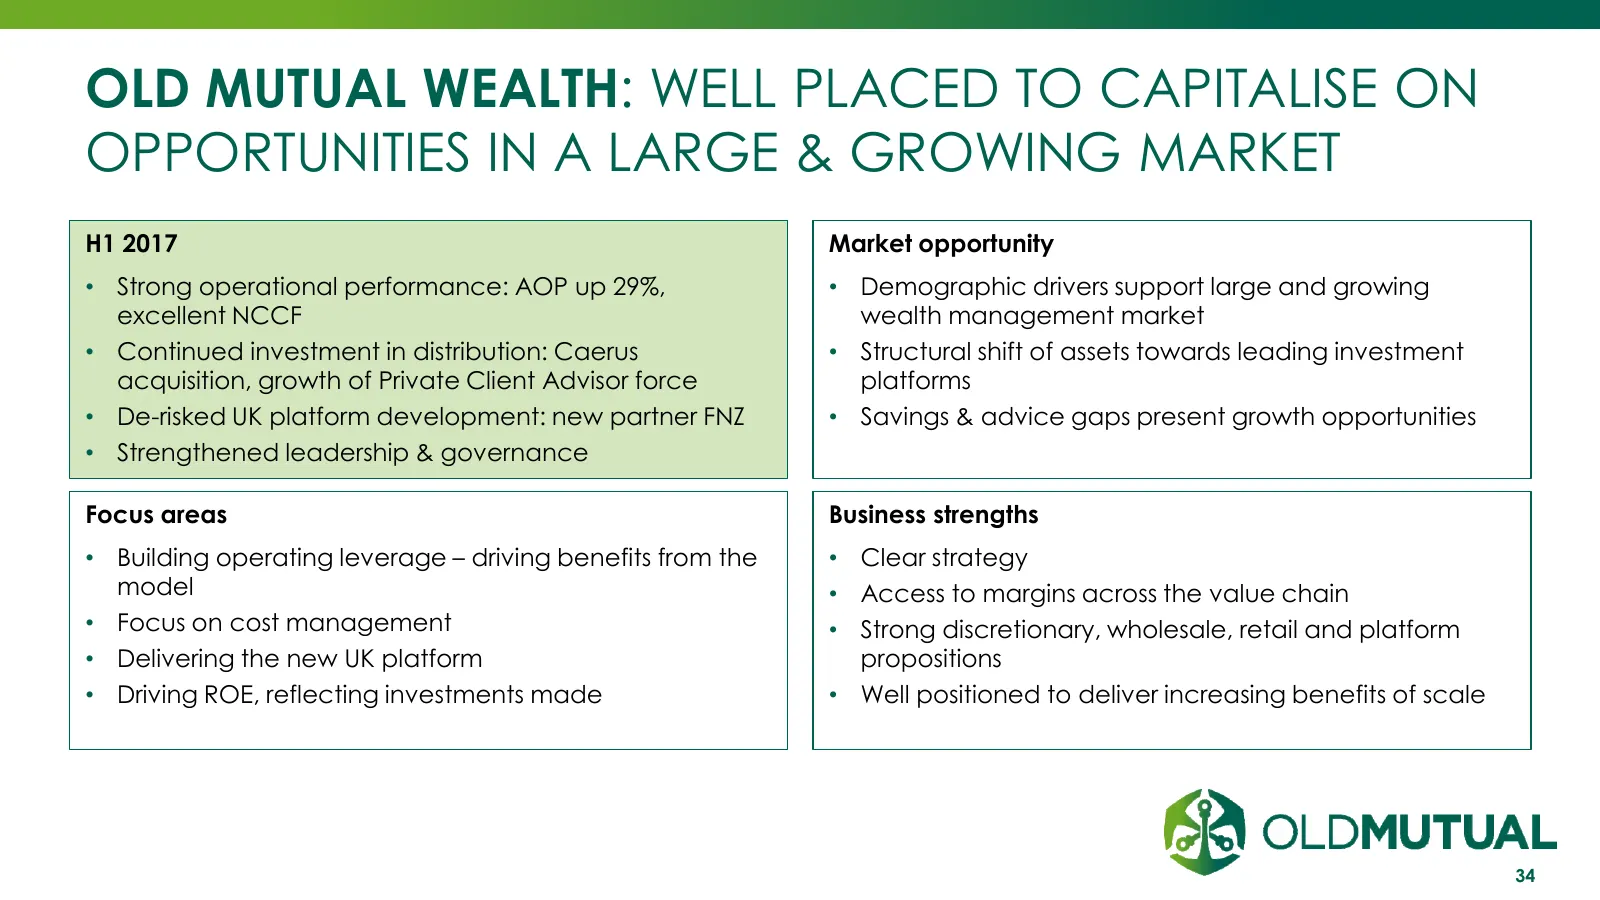
OLD MUTUAL WEALTH: WELL PLACED TO CAPITALISE ON OPPORTUNITIES IN A LARGE & GROWING MARKET H1 2017 Market opportunity • Strong operational performance: AOP up 29%, • Demographic drivers support large and growing excellent NCCF wealth management market • Continued investment in distribution: Caerus •
Slide 35: Nedbank: good returns in South Africa and strongly capitalised
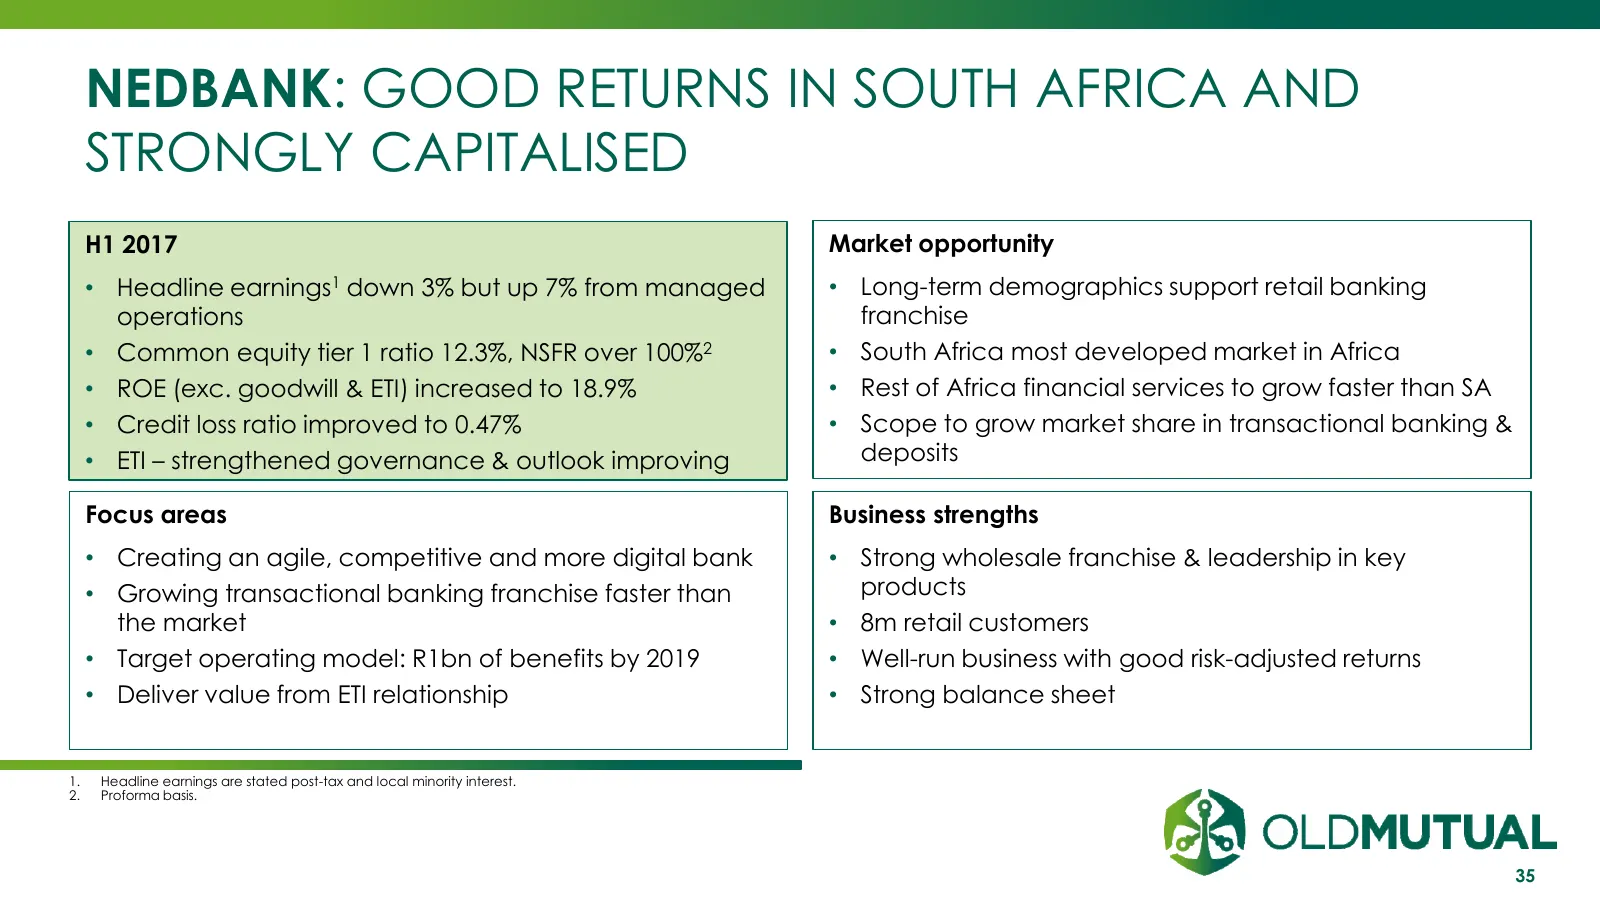
NEDBANK: GOOD RETURNS IN SOUTH AFRICA AND STRONGLY CAPITALISED H1 2017 Market opportunity • Headline earnings1 down 3% but up 7% from managed • Long-term demographics support retail banking operations franchise • Common equity tier 1 ratio 12.3%, NSFR over 100%2 • South Africa most developed market
Slide 36: OMAM: well positioned for growth with multi-boutique model
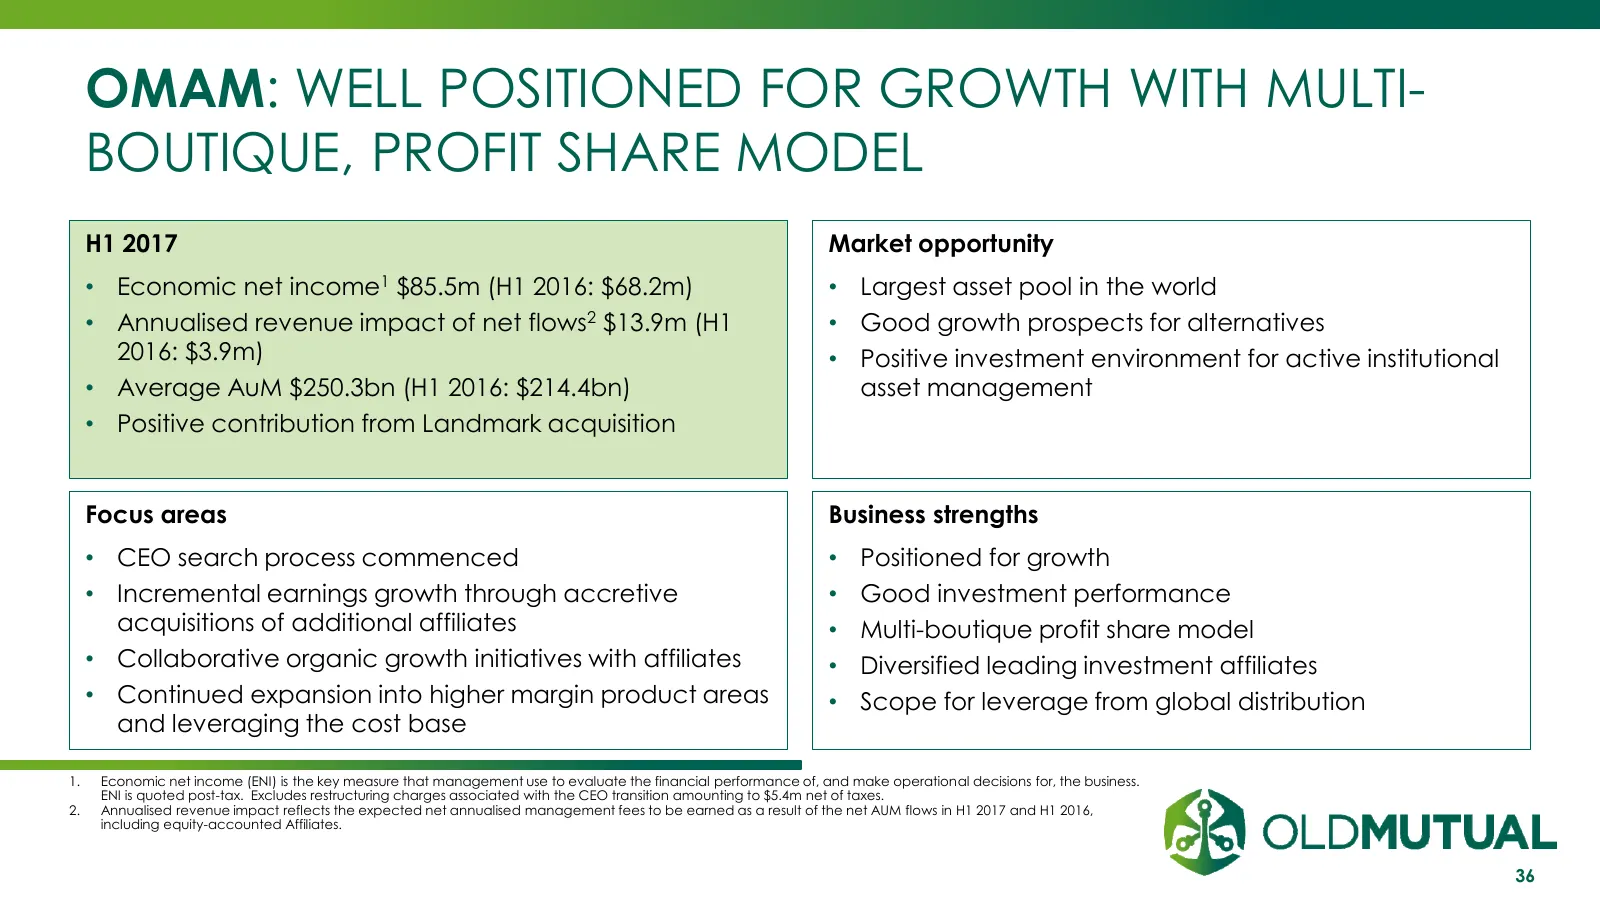
OMAM: WELL POSITIONED FOR GROWTH WITH MULTI- BOUTIQUE, PROFIT SHARE MODEL H1 2017 Market opportunity • Economic net income1 $85.5m (H1 2016: $68.2m) • Largest asset pool in the world • Annualised revenue impact of net flows2 $13.9m (H1 • Good growth prospects for alternatives 2016: $3.9m) • Positive

Slide 37: Concluding Remarks
CONCLUDING REMARKS Bruce Hemphill 11 August 2017 INVESTMENT | SAVINGS | INSURANCE | BANKING
Slide 38: Managed separation is the optimal strategy for delivering future value
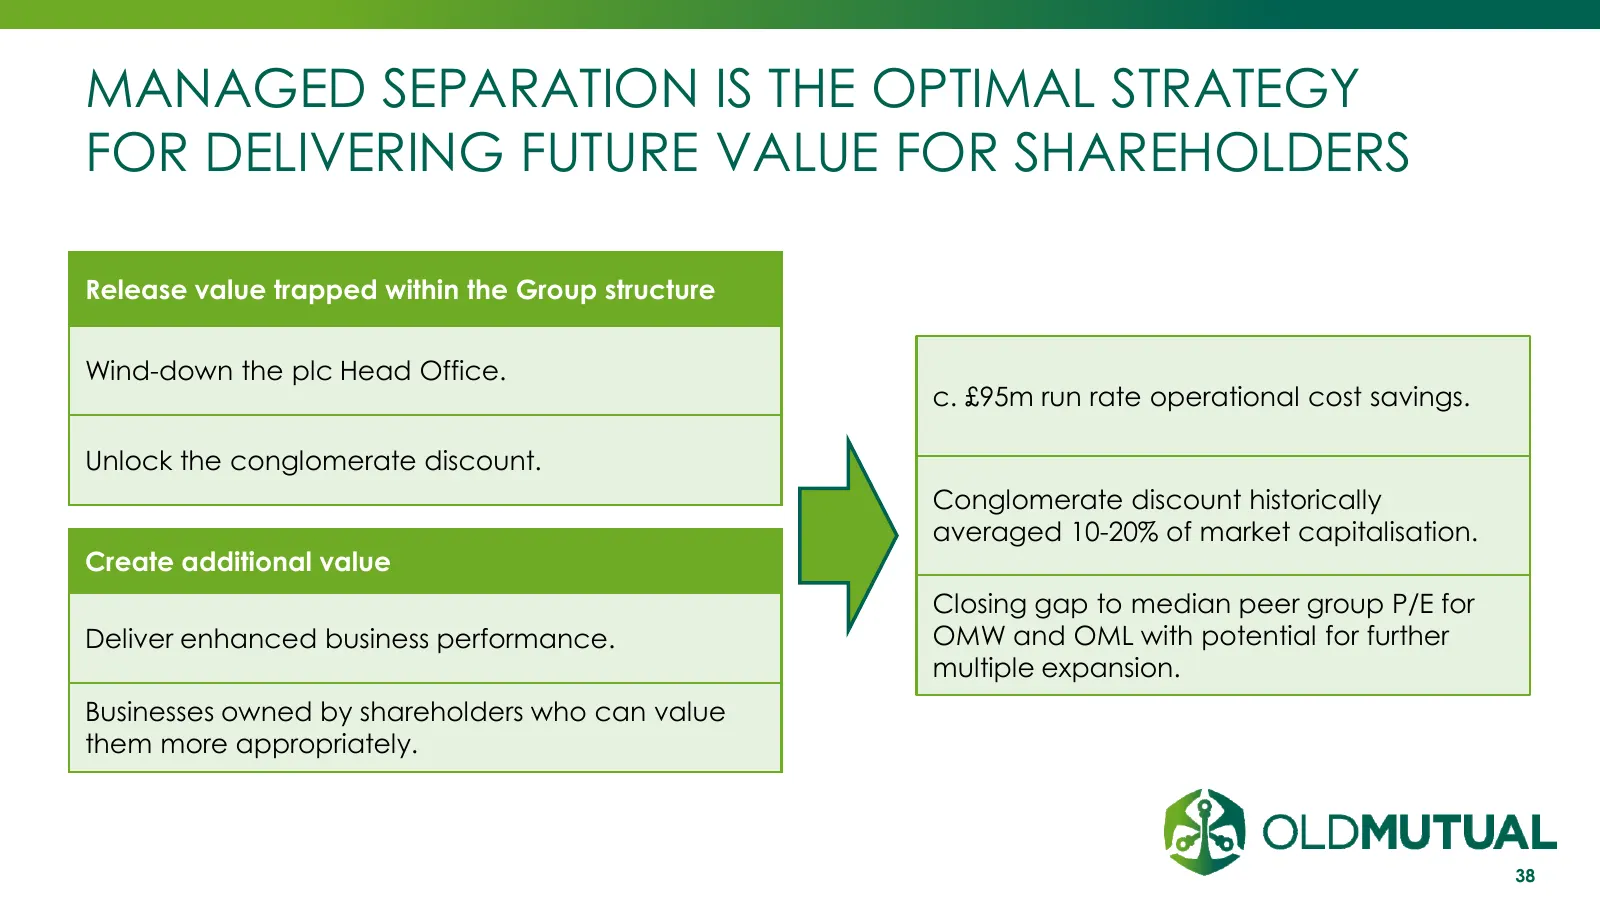
MANAGED SEPARATION IS THE OPTIMAL STRATEGY FOR DELIVERING FUTURE VALUE FOR SHAREHOLDERS Release value trapped within the Group structure Wind-down the plc Head Office. c. £95m run rate operational cost savings. Unlock the conglomerate discount. Conglomerate discount historically averaged 10-20% of m
Slide 39: Summary
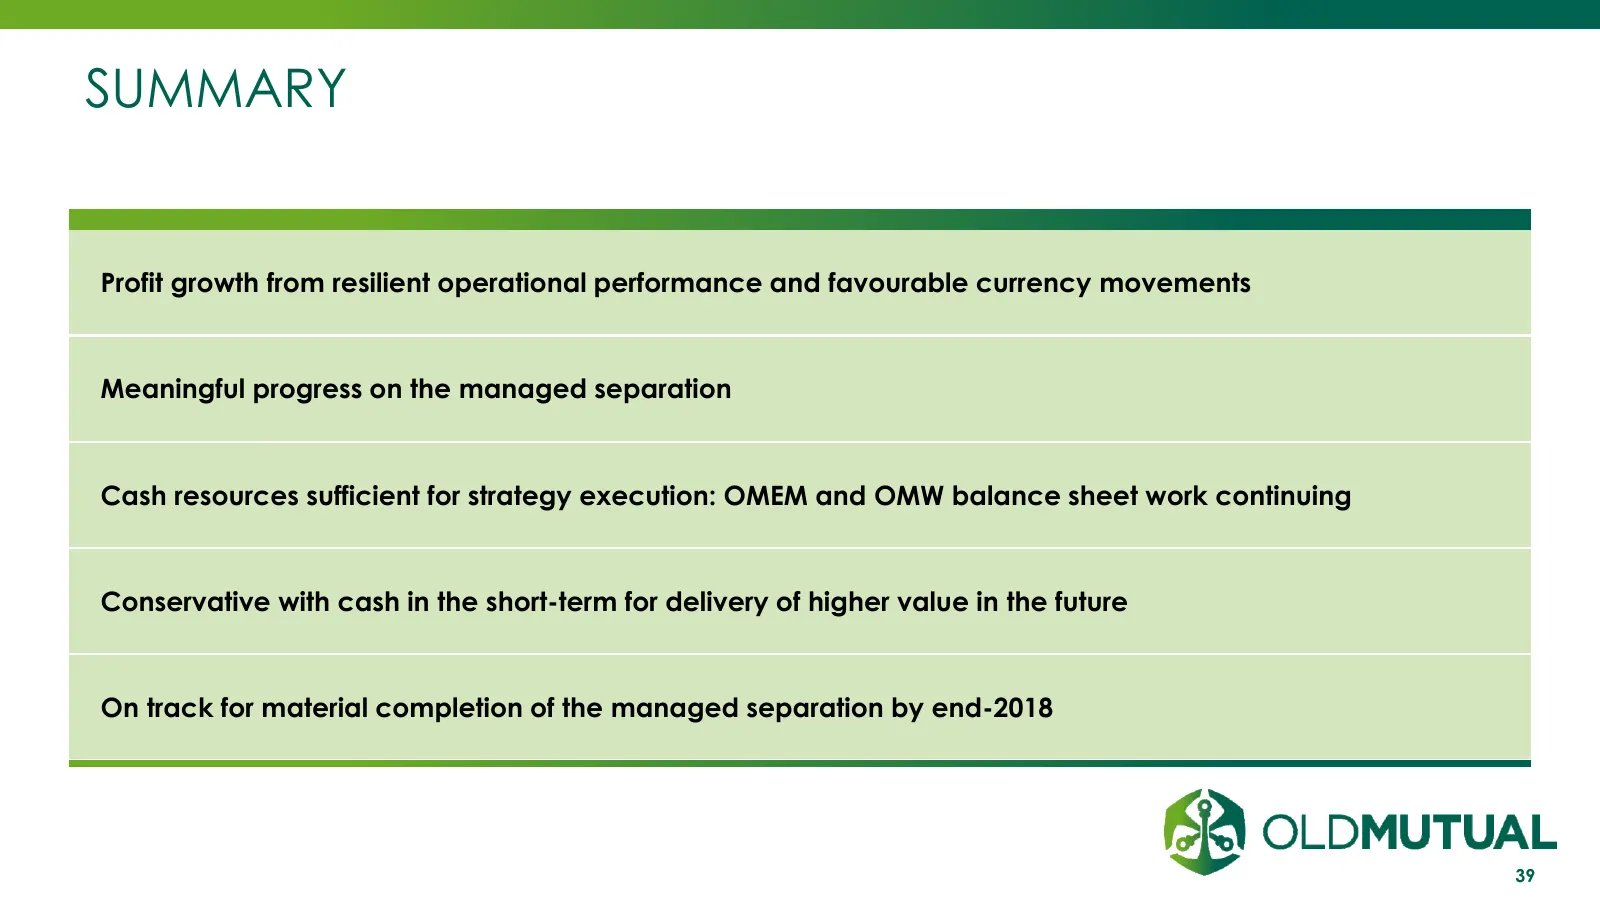
SUMMARY Profit growth from resilient operational performance and favourable currency movements Meaningful progress on the managed separation Cash resources sufficient for strategy execution: OMEM and OMW balance sheet work continuing Conservative with cash in the short-term for delivery of higher va

Slide 40: Q&A
Q&A 11 August 2017 INVESTMENT | SAVINGS | INSURANCE | BANKING
Source: Internet Archive copy of oldmutual.com
More decks from Old Mutual Ltd.
 FY2025 Earnings Presentation46 slides · Oct 12, 2026
 Q2 2026 Earnings Presentation48 slides · Sep 8, 2026
 H1 2025 Earnings Presentation45 slides · Sep 10, 2025
 FY2024 Earnings Presentation40 slides · Mar 18, 2025
 FY2023 Earnings Presentation39 slides · Mar 27, 2024
 H1 2024 Earnings Presentation33 slides · 2024