LAMDA Development S.A. · ATHEX:LAMDA
LAMDA Development — H1 2021 Earnings Presentation
28 slides from LAMDA Development's earnings presentation, 2021
Slide 1: H1 2021 Results Presentation
H1 2021 Results Presentation
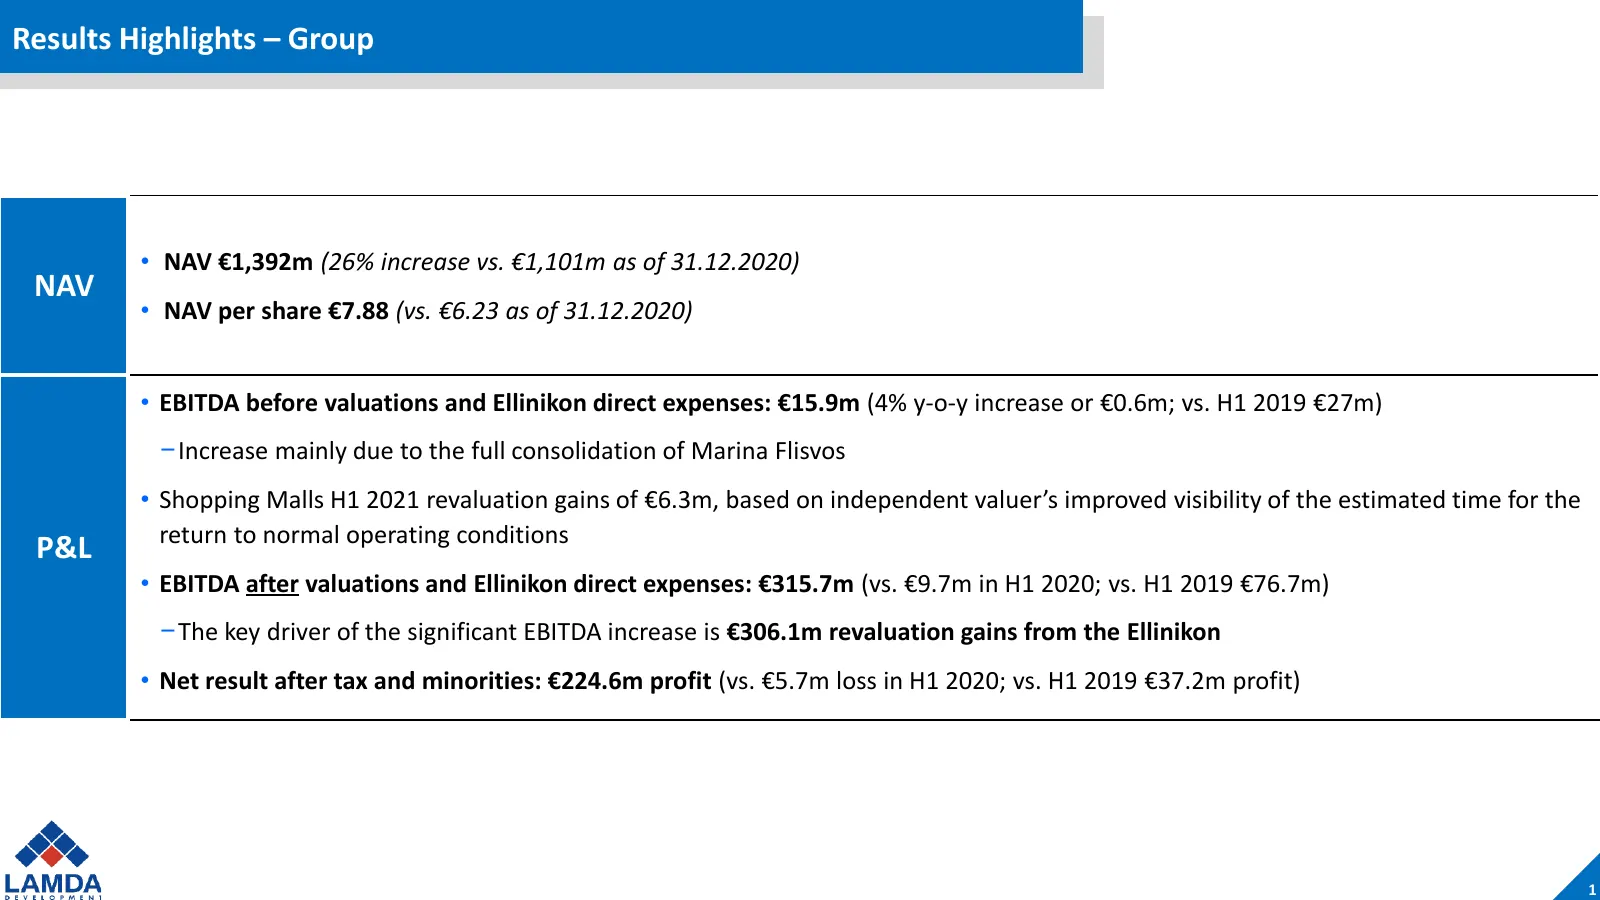
Slide 2: Results Highlights – Group
Results Highlights – Group • NAV €1,392m (26% increase vs. €1,101m as of 31.12.2020) NAV • NAV per share €7.88 (vs. €6.23 as of 31.12.2020) • EBITDA before valuations and Ellinikon direct expenses: €15.9m (4% y-o-y increase or €0.6m; vs. H1 2019 €27m) –Increase mainly due to the full consolidation o
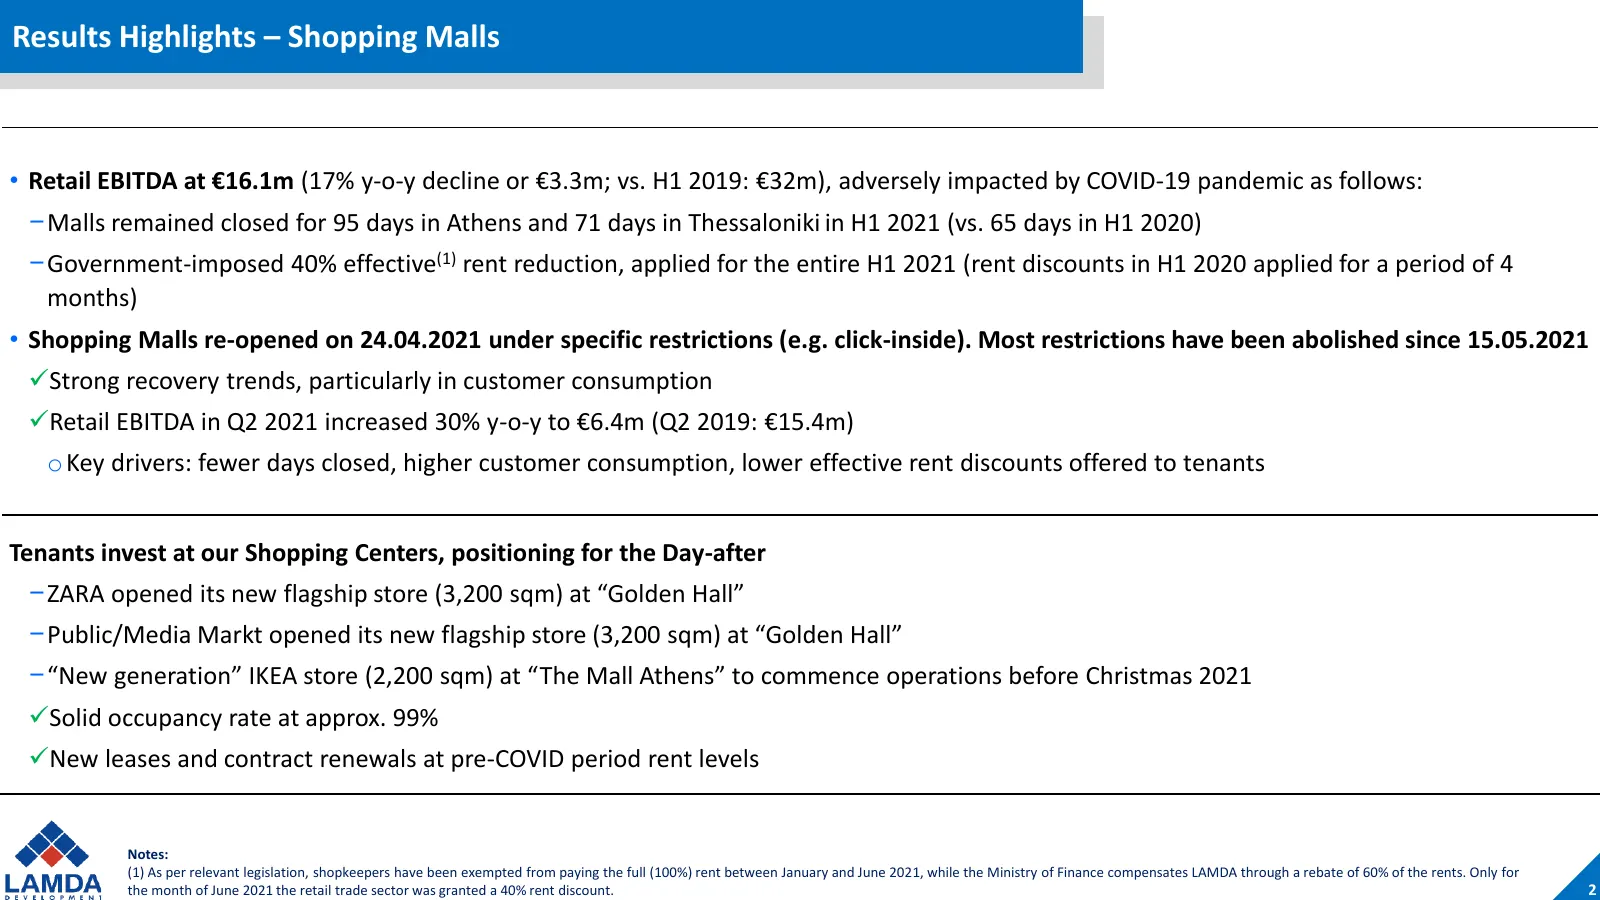
Slide 3: Results Highlights – Shopping Malls
Results Highlights – Shopping Malls • Retail EBITDA at €16.1m (17% y-o-y decline or €3.3m; vs. H1 2019: €32m), adversely impacted by COVID-19 pandemic as follows: –Malls remained closed for 95 days in Athens and 71 days in Thessaloniki in H1 2021 (vs. 65 days in H1 2020) –Government-imposed 40% effe
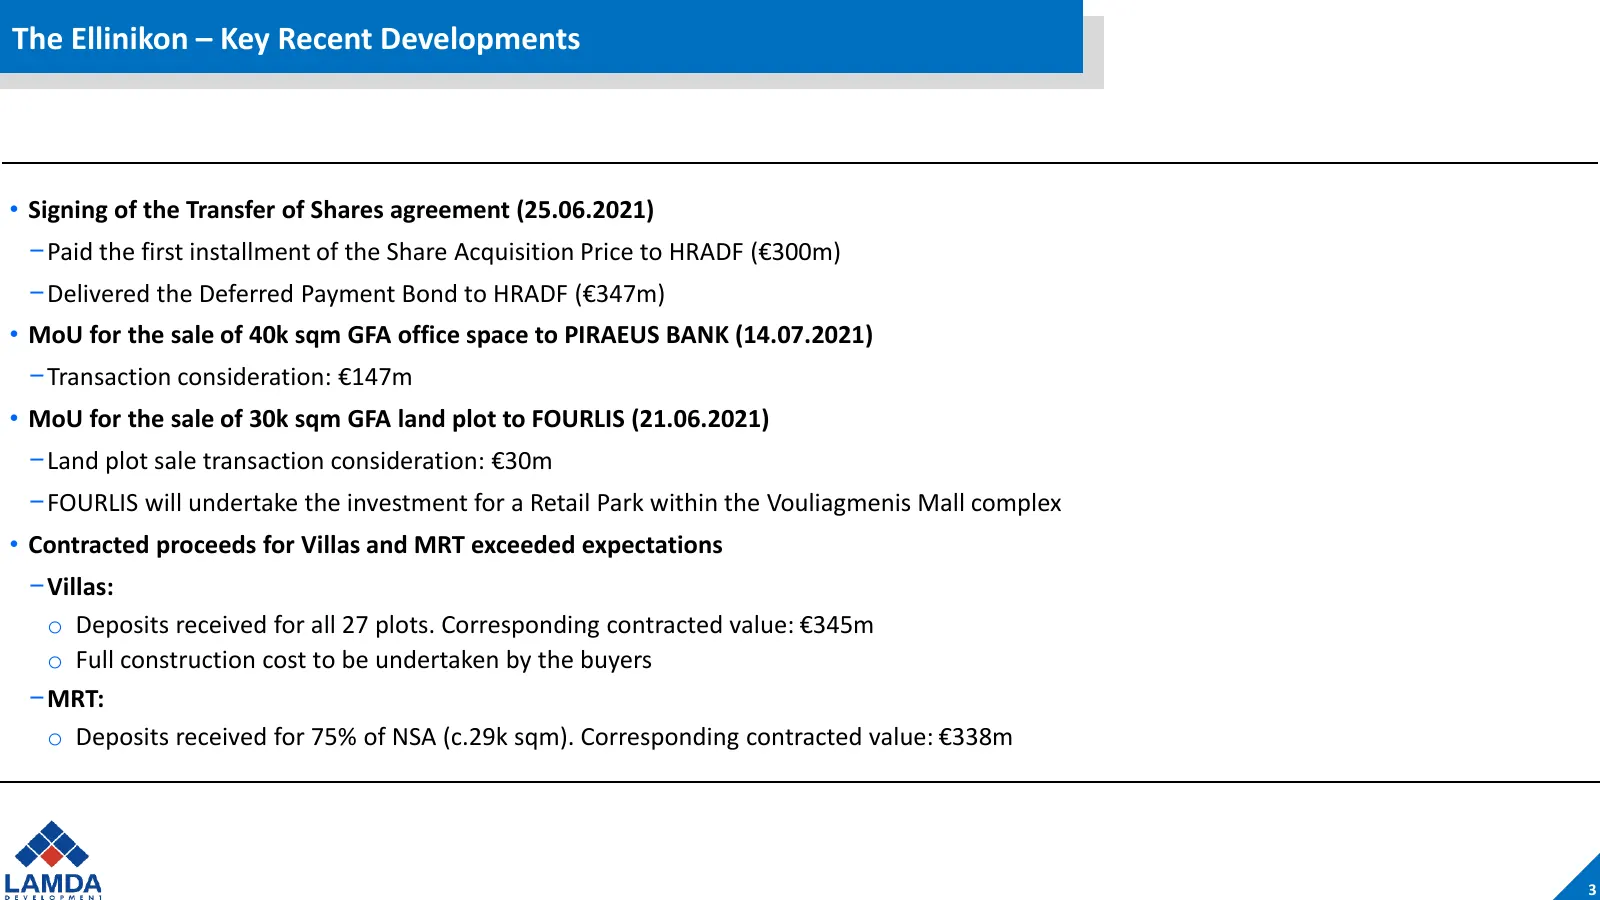
Slide 4: The Ellinikon – Key Recent Developments
The Ellinikon – Key Recent Developments • Signing of the Transfer of Shares agreement (25.06.2021) –Paid the first installment of the Share Acquisition Price to HRADF (€300m) –Delivered the Deferred Payment Bond to HRADF (€347m) • MoU for the sale of 40k sqm GFA office space to PIRAEUS BANK (14.07.2
Slide 5: H1 2021 Results Commentary – Ellinikon
H1 2021 Results Commentary – Ellinikon
Slide 6: Ellinikon Land & Infrastructure Nominal Value
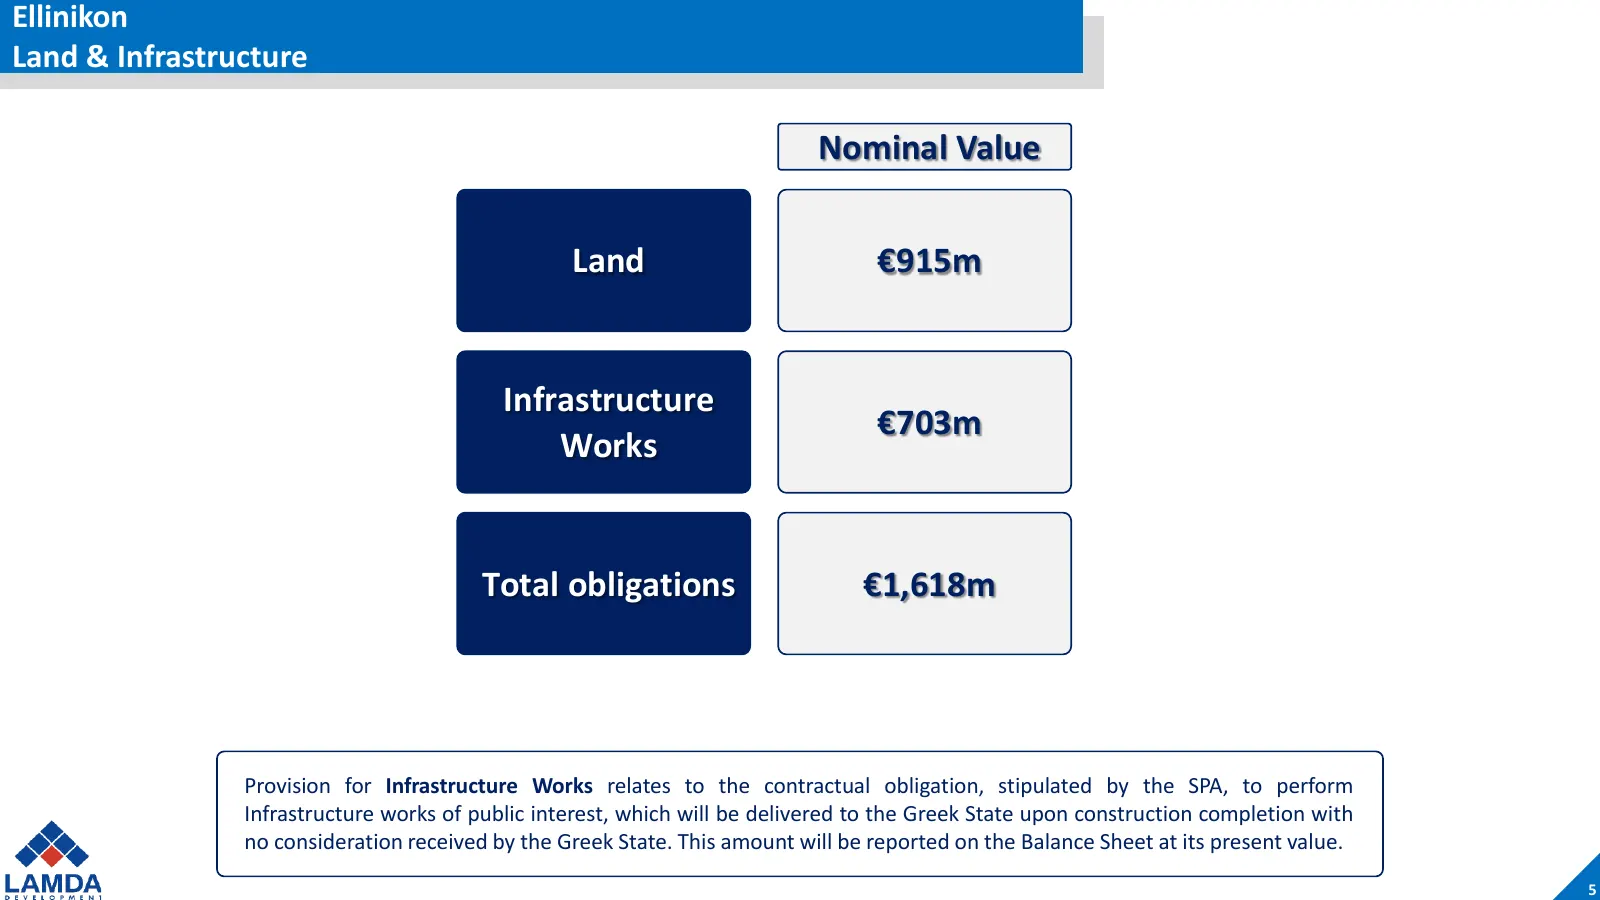
Ellinikon Land & Infrastructure Nominal Value Land €915m Infrastructure €703m Works Total obligations €1,618m Provision for Infrastructure Works relates to the contractual obligation, stipulated by the SPA, to perform Infrastructure works of public interest, which will be delivered to the Greek Stat
Slide 7: Ellinikon Land & Infrastructure based on IFRS Framework
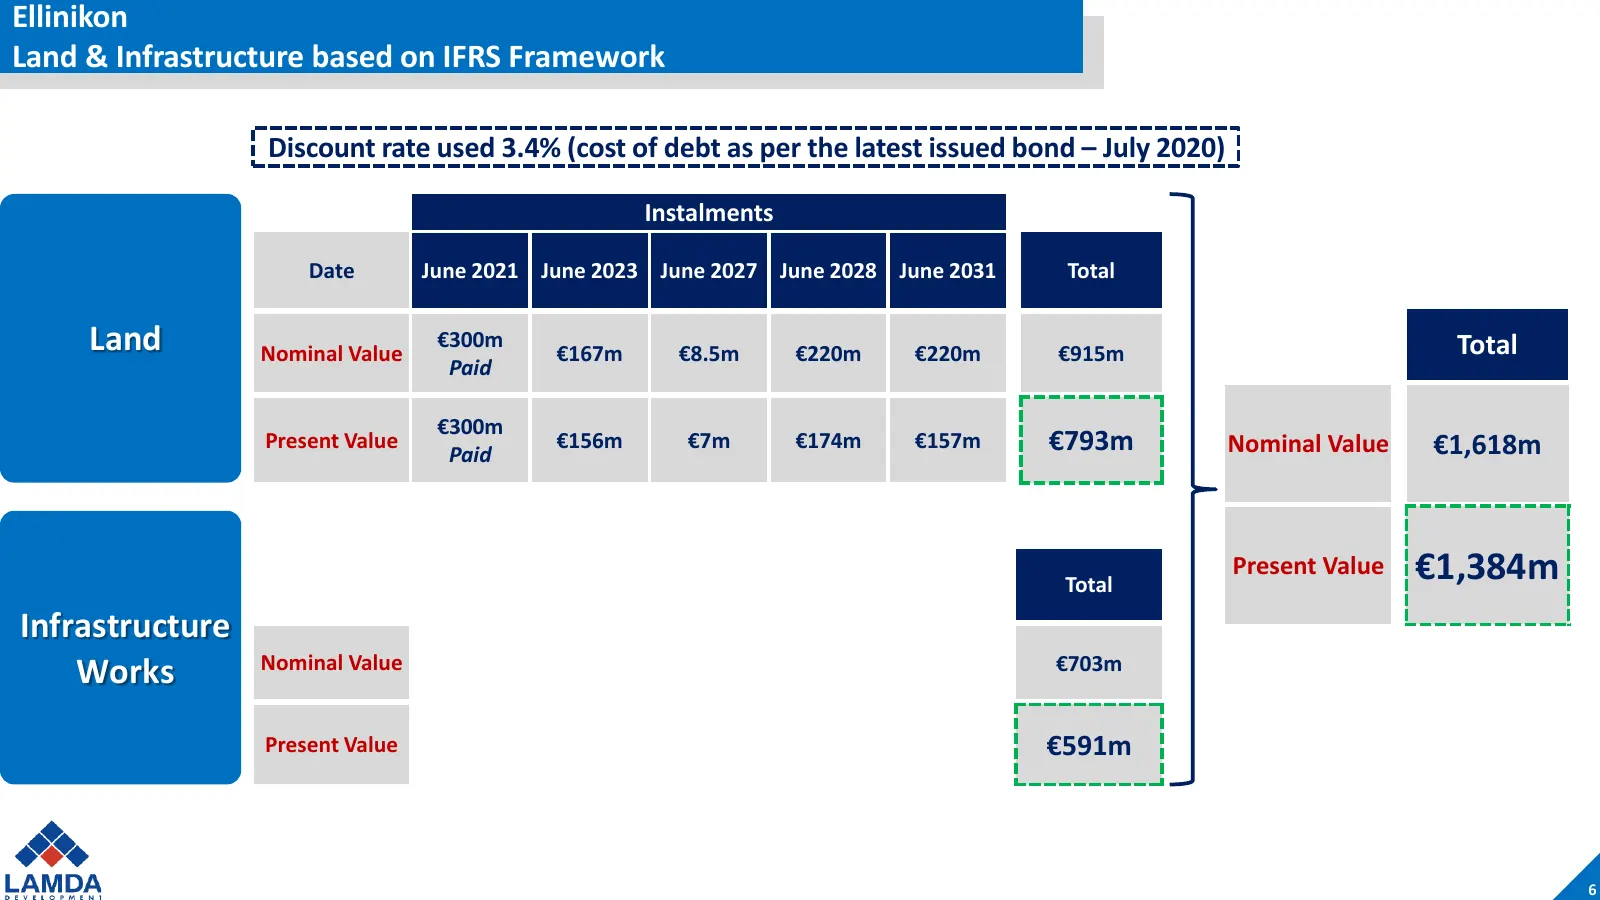
Ellinikon Land & Infrastructure based on IFRS Framework Discount rate used 3.4% (cost of debt as per the latest issued bond – July 2020) Instalments Date June 2021 June 2023 June 2027 June 2028 June 2031 Total Land Nominal Value €300m €167m €8.5m €220m €220m €915m Total Paid €300m Present Value Paid
Slide 8: Ellinikon How Assets are classified on the Balance Sheet
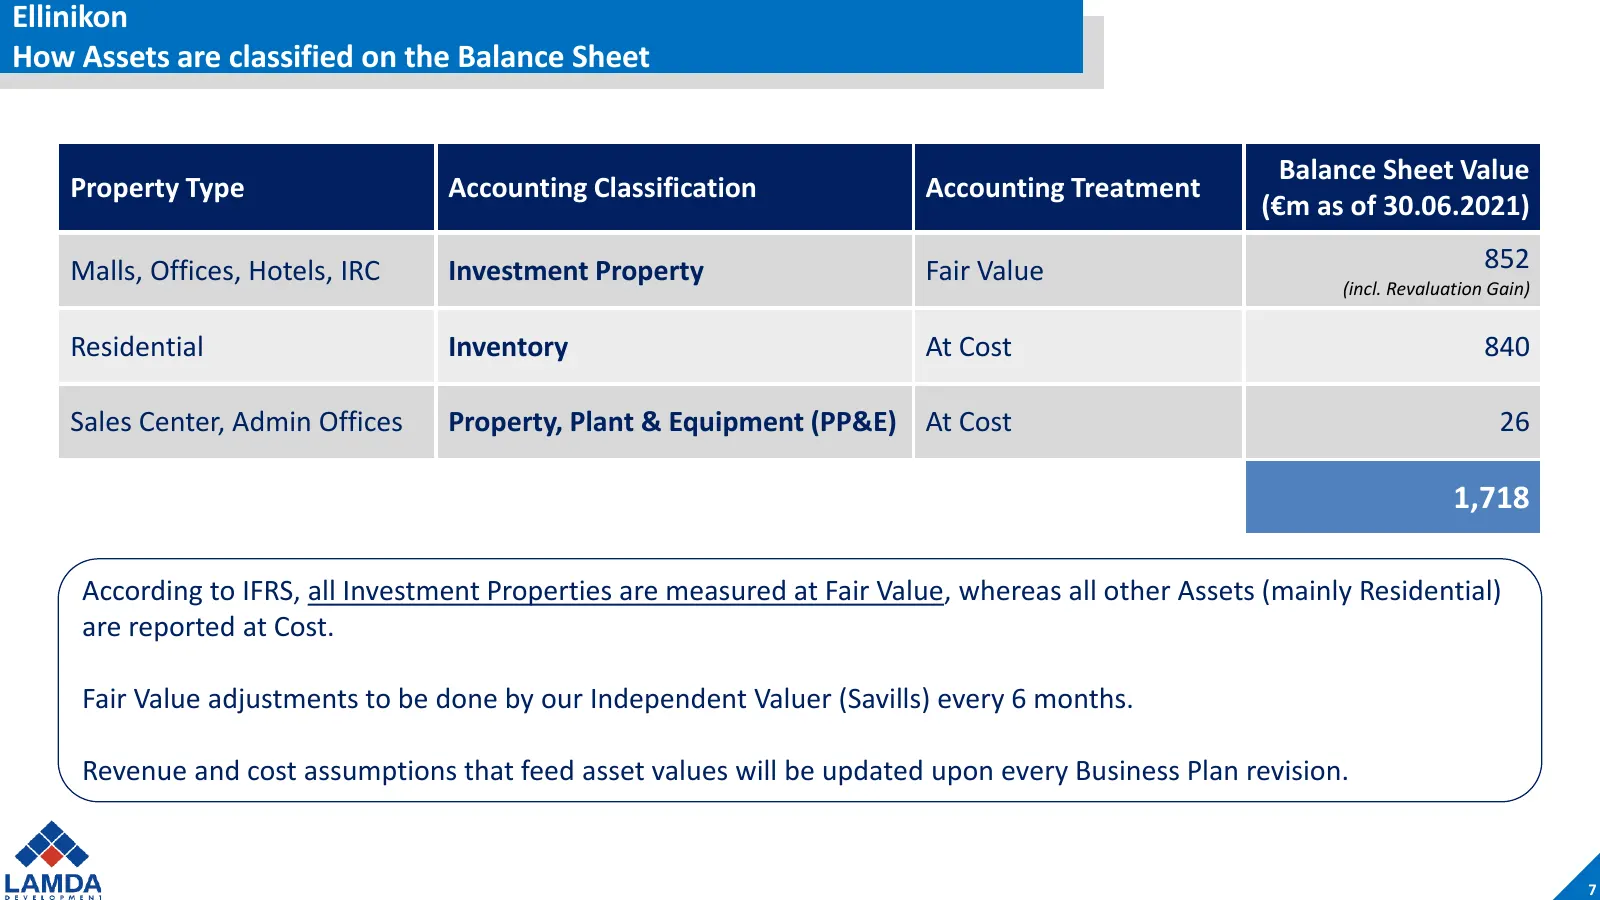
Ellinikon How Assets are classified on the Balance Sheet Balance Sheet Value Property Type Accounting Classification Accounting Treatment (€m as of 30.06.2021) Malls, Offices, Hotels, IRC Investment Property Fair Value 852 (incl. Revaluation Gain) Residential Inventory At Cost 840 Sales Center, Admi
Slide 9: Ellinikon Investment Property upside based on IFRS Framework
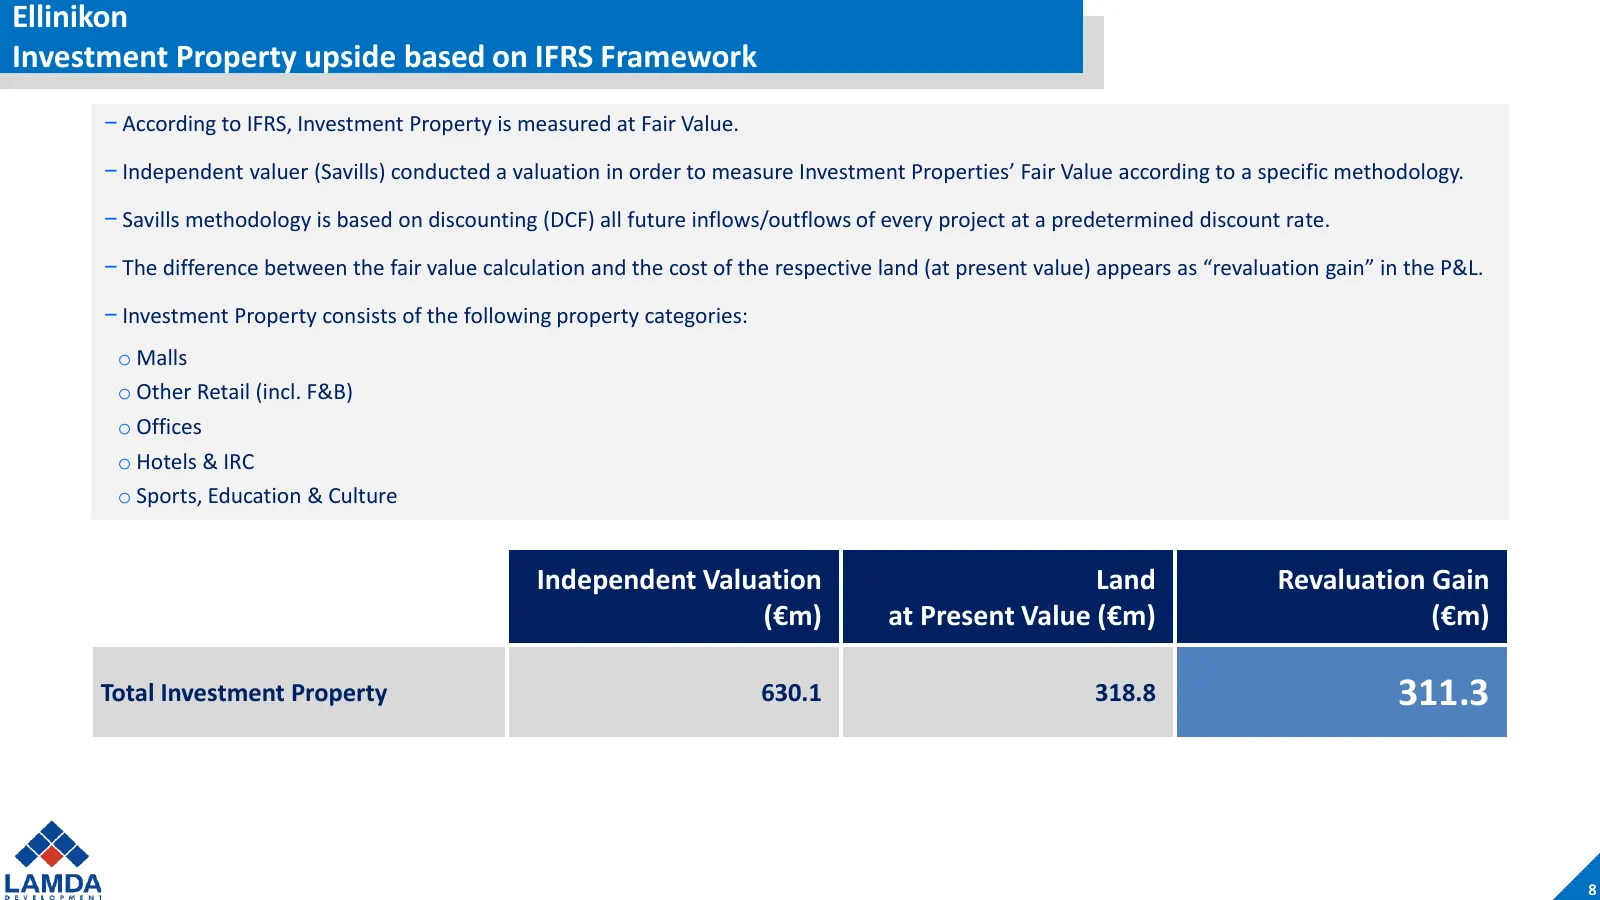
Ellinikon Investment Property upside based on IFRS Framework – According to IFRS, Investment Property is measured at Fair Value. – Independent valuer (Savills) conducted a valuation in order to measure Investment Properties’ Fair Value according to a specific methodology. – Savills methodology is ba
Slide 10: Ellinikon Net Impact on Balance Sheet / NAV
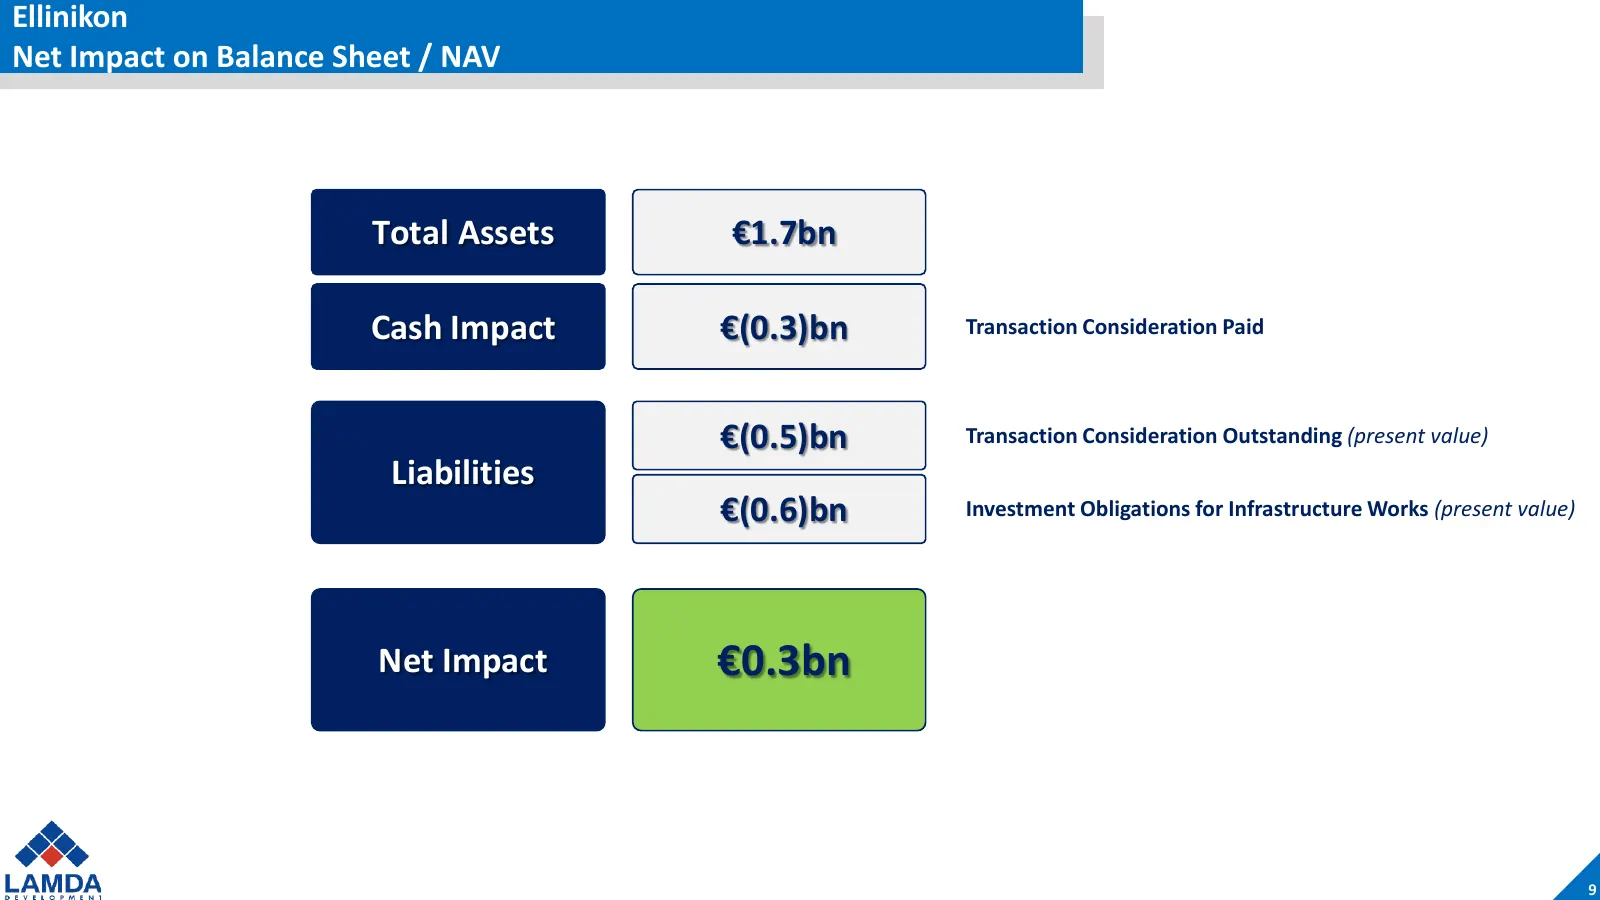
Ellinikon Net Impact on Balance Sheet / NAV Total Assets €1.7bn Cash Impact €(0.3)bn Transaction Consideration Paid €(0.5)bn Transaction Consideration Outstanding (present value) Liabilities €(0.6)bn Investment Obligations for Infrastructure Works (present value) Net Impact €0.3bn 9
Slide 11: H1 2021 Results Commentary – Shopping Malls
H1 2021 Results Commentary – Shopping Malls
Slide 12: Shopping Malls H1 2021 Financial Performance
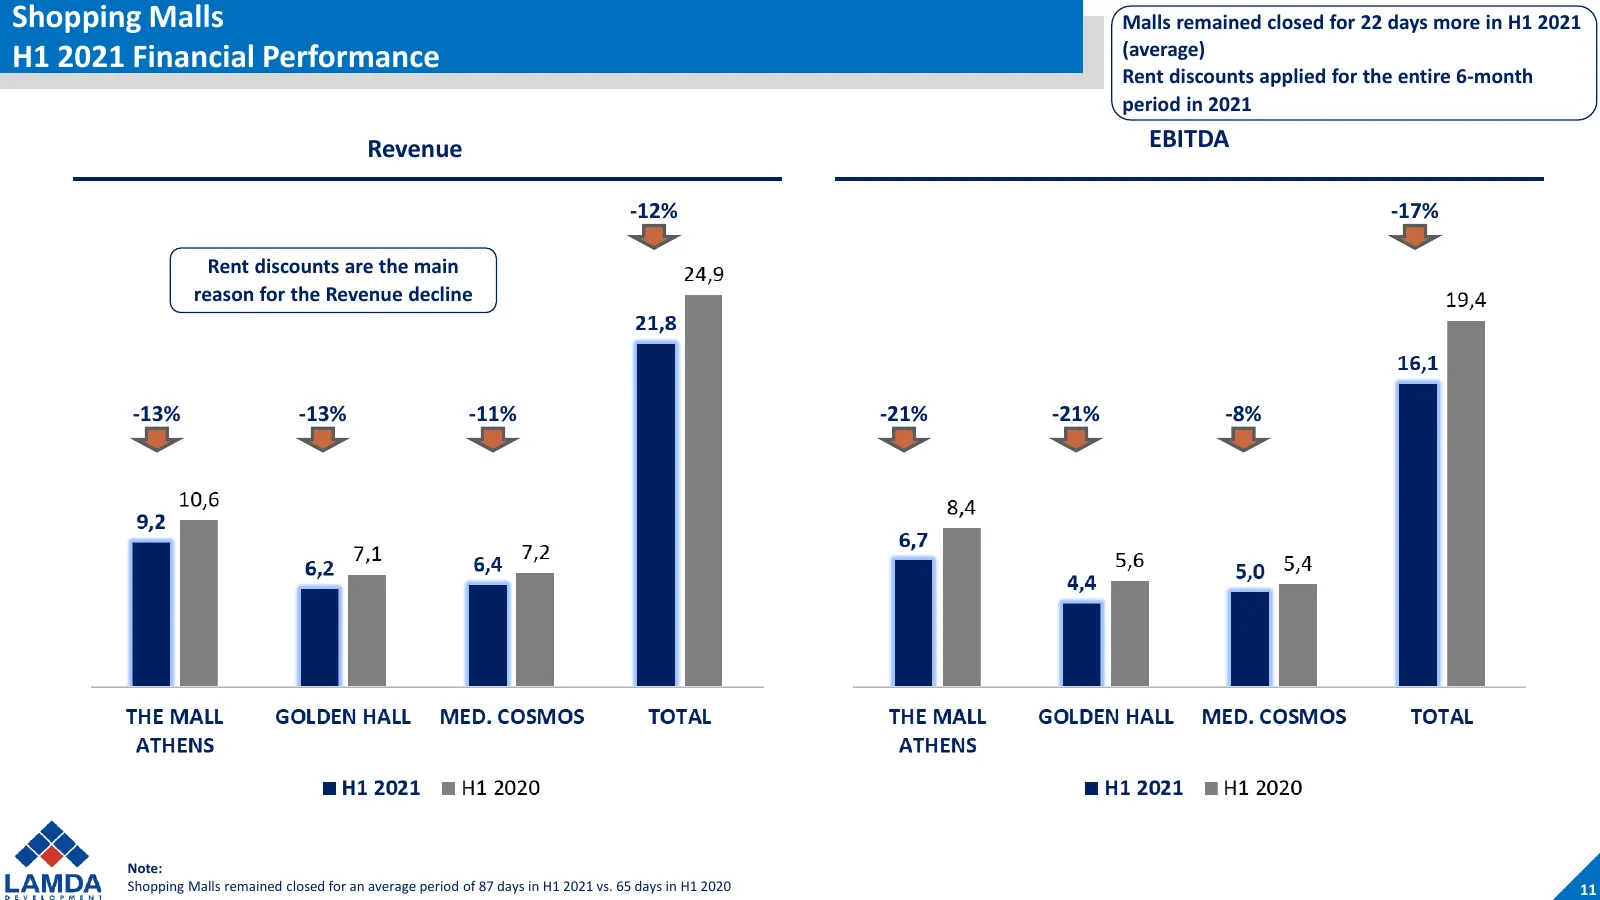
Shopping Malls Malls remained closed for 22 days more in H1 2021 (average) H1 2021 Financial Performance Rent discounts applied for the entire 6-month period in 2021 Revenue EBITDA -12% -17% Rent discounts are the main reason for the Revenue decline -13% -13% -11% -21% -21% -8% Note: Shopping Malls
Slide 13: The Mall Athens Performance Drivers
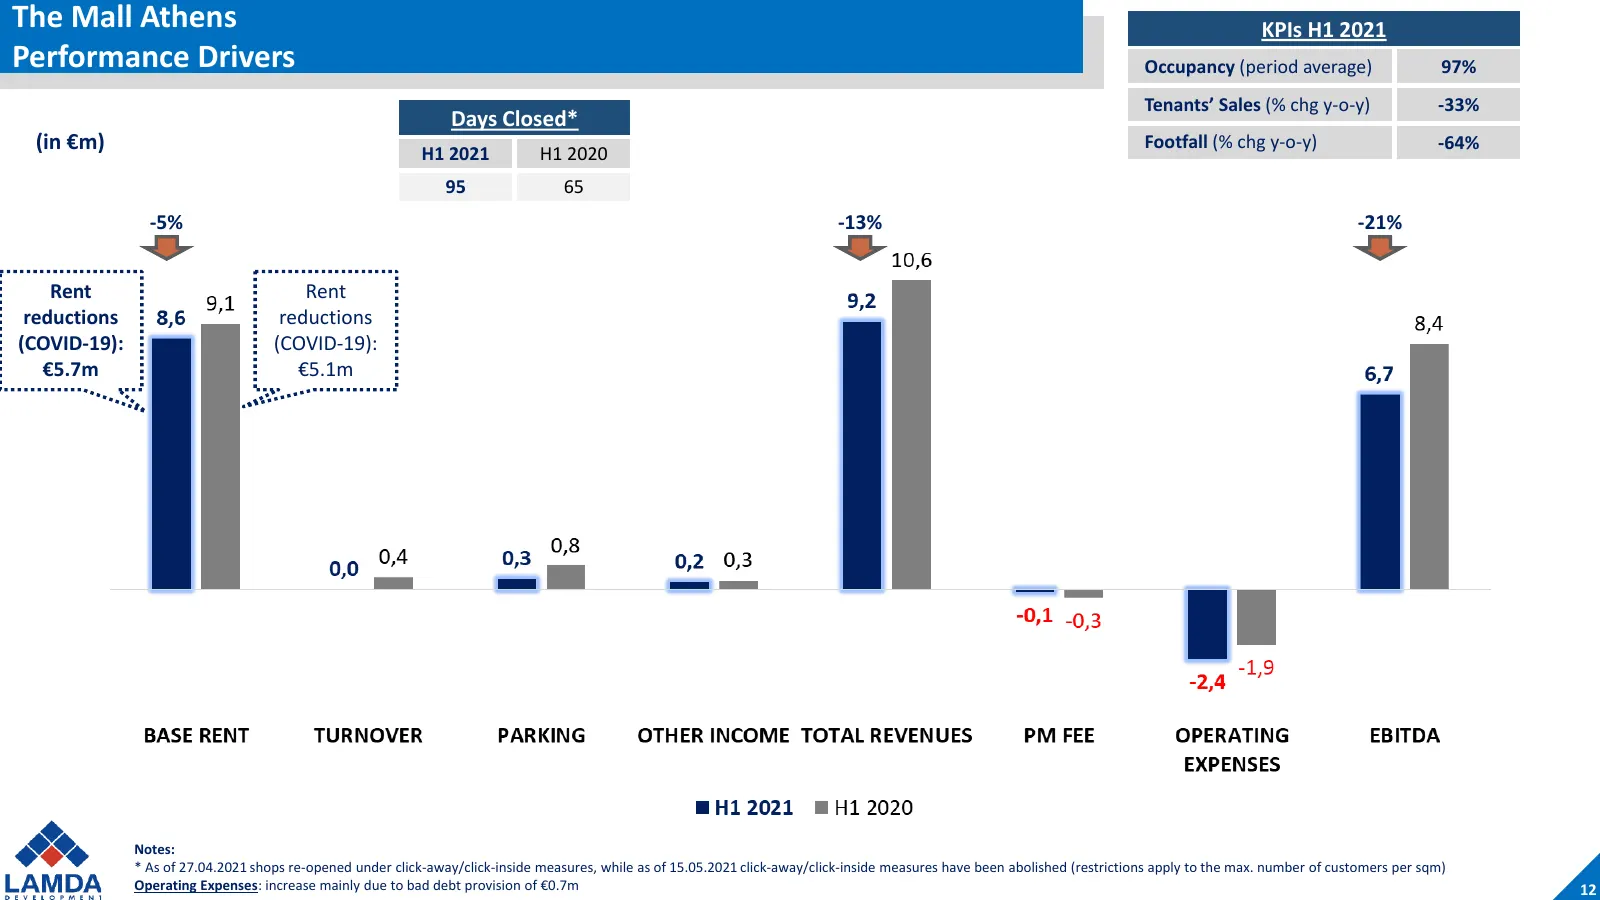
The Mall Athens KPIs H1 2021 Performance Drivers Occupancy (period average) 97% Tenants’ Sales (% chg y-o-y) -33% Days Closed* (in €m) H1 2021 H1 2020 Footfall (% chg y-o-y) -64% 95 65 -5% -13% -21% Rent Rent reductions reductions (COVID-19): (COVID-19): €5.7m €5.1m Notes: * As of 27.04.2021 shops r
Slide 14: Golden Hall Performance Drivers
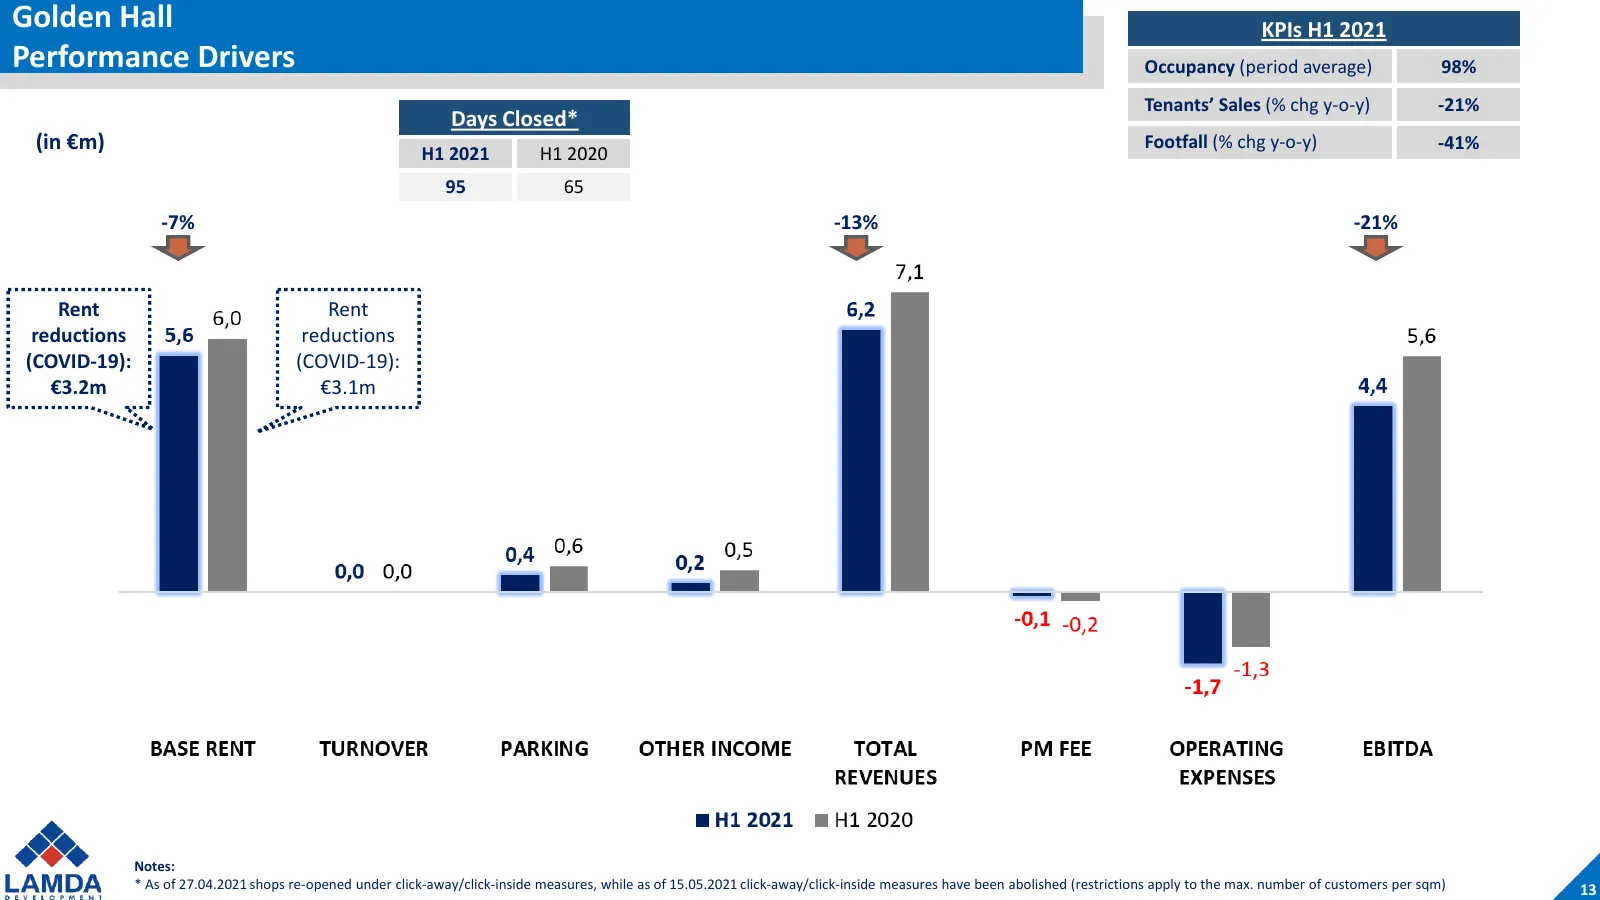
Golden Hall KPIs H1 2021 Performance Drivers Occupancy (period average) 98% Tenants’ Sales (% chg y-o-y) -21% Days Closed* (in €m) H1 2021 H1 2020 Footfall (% chg y-o-y) -41% 95 65 -7% -13% -21% Rent Rent reductions reductions (COVID-19): (COVID-19): €3.2m €3.1m Notes: * As of 27.04.2021 shops re-op
Slide 15: Mediterranean Cosmos Performance Drivers
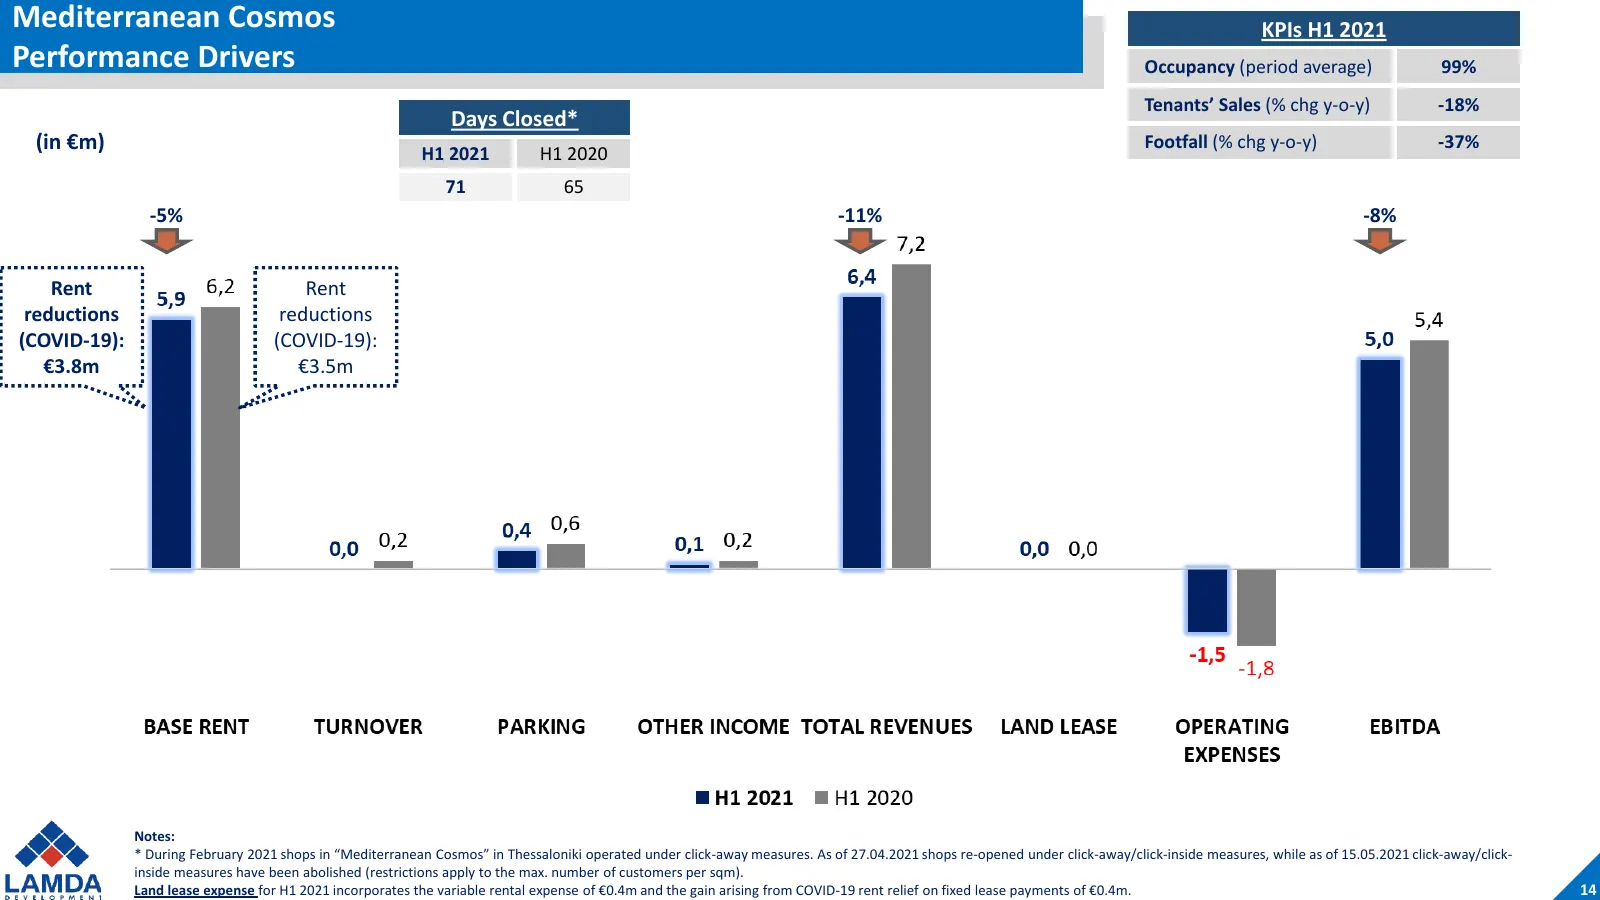
Mediterranean Cosmos KPIs H1 2021 Performance Drivers Occupancy (period average) 99% Tenants’ Sales (% chg y-o-y) -18% Days Closed* (in €m) H1 2021 H1 2020 Footfall (% chg y-o-y) -37% 71 65 -5% -11% -8% Rent Rent reductions reductions (COVID-19): (COVID-19): €3.8m €3.5m Notes: * During February 2021
Slide 16: COVID-19 Impact to Shopping Malls
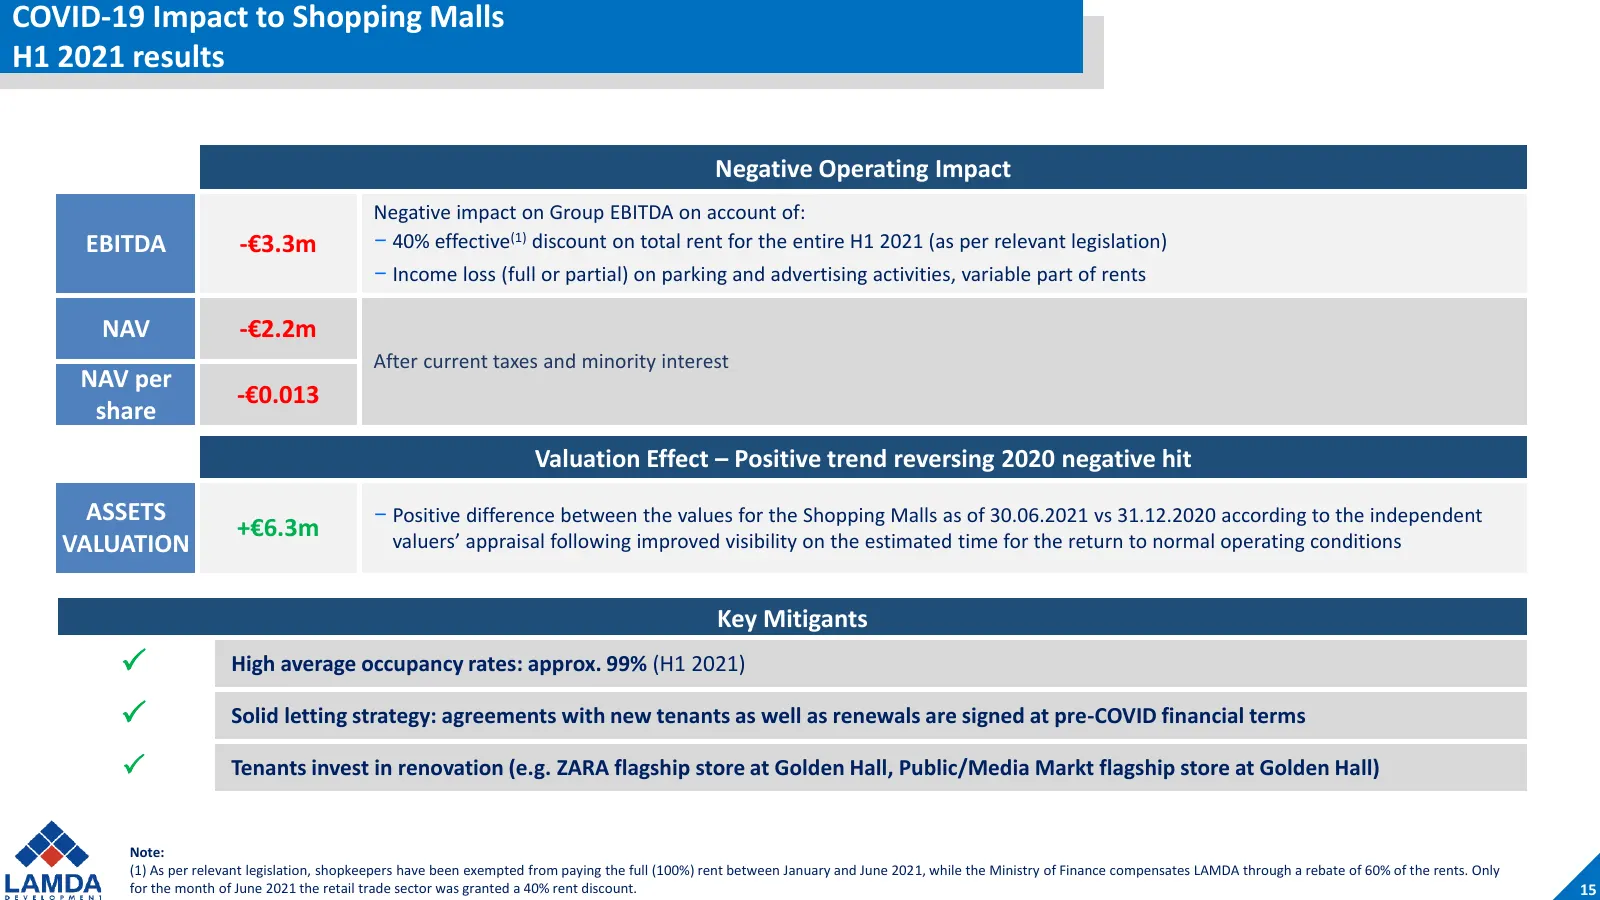
COVID-19 Impact to Shopping Malls H1 2021 results Negative Operating Impact Negative impact on Group EBITDA on account of: EBITDA -€3.3m – 40% effective(1) discount on total rent for the entire H1 2021 (as per relevant legislation) – Income loss (full or partial) on parking and advertising activitie
Slide 17: Shopping Malls – KPIs vs. 2020
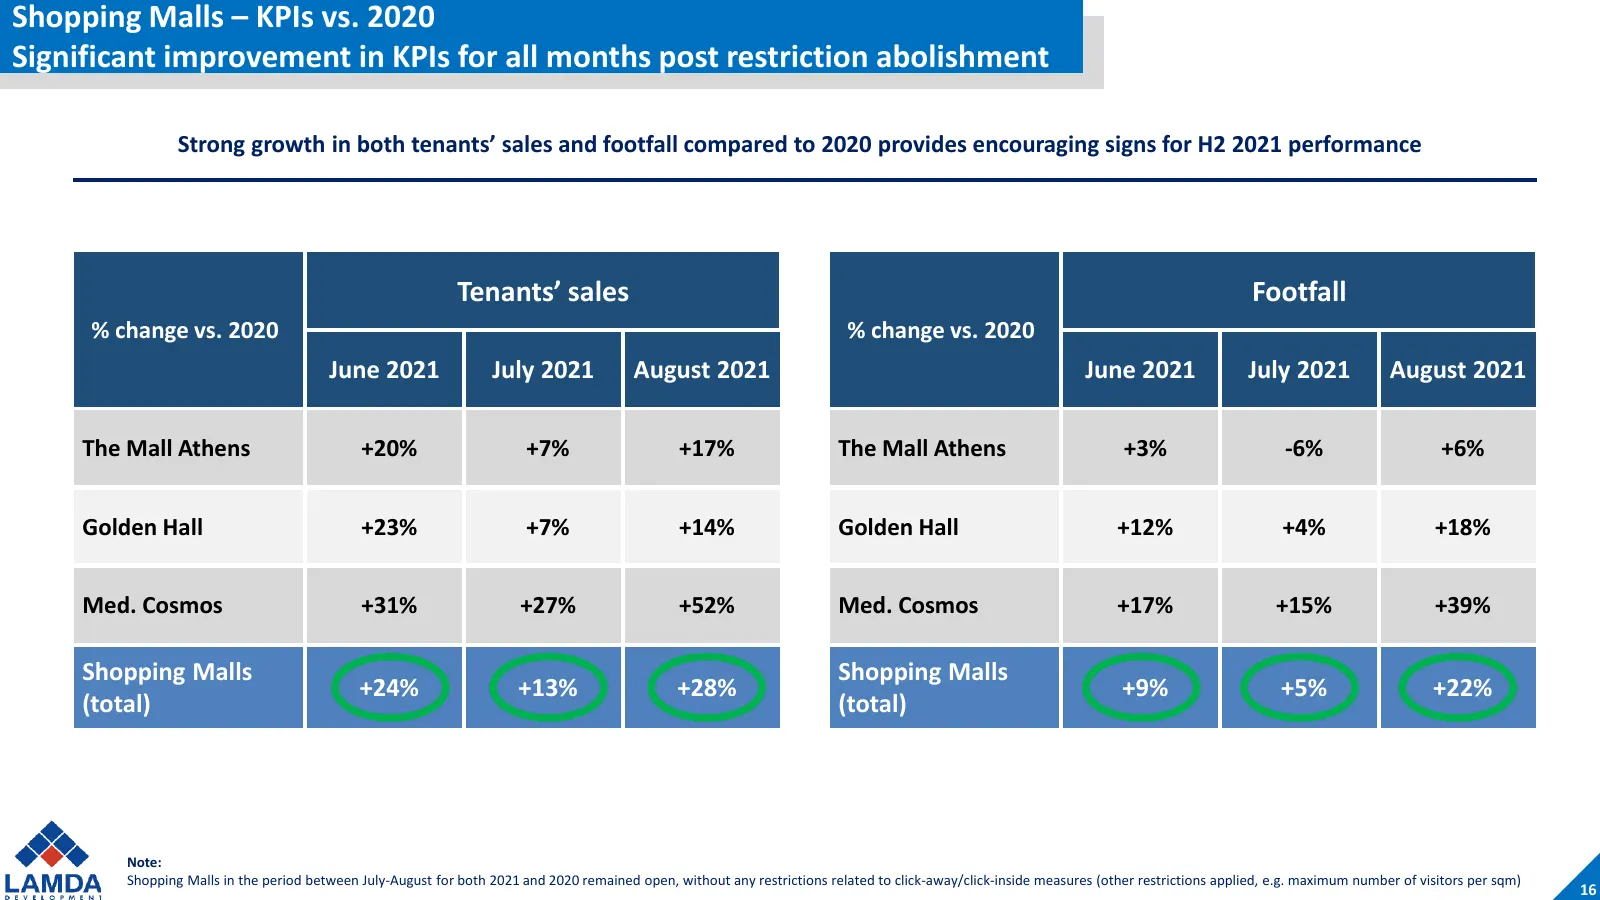
Shopping Malls – KPIs vs. 2020 Significant improvement in KPIs for all months post restriction abolishment Strong growth in both tenants’ sales and footfall compared to 2020 provides encouraging signs for H2 2021 performance Tenants’ sales Footfall % change vs. 2020 % change vs. 2020 June 2021 July
Slide 18: Shopping Malls – KPIs vs. 2019
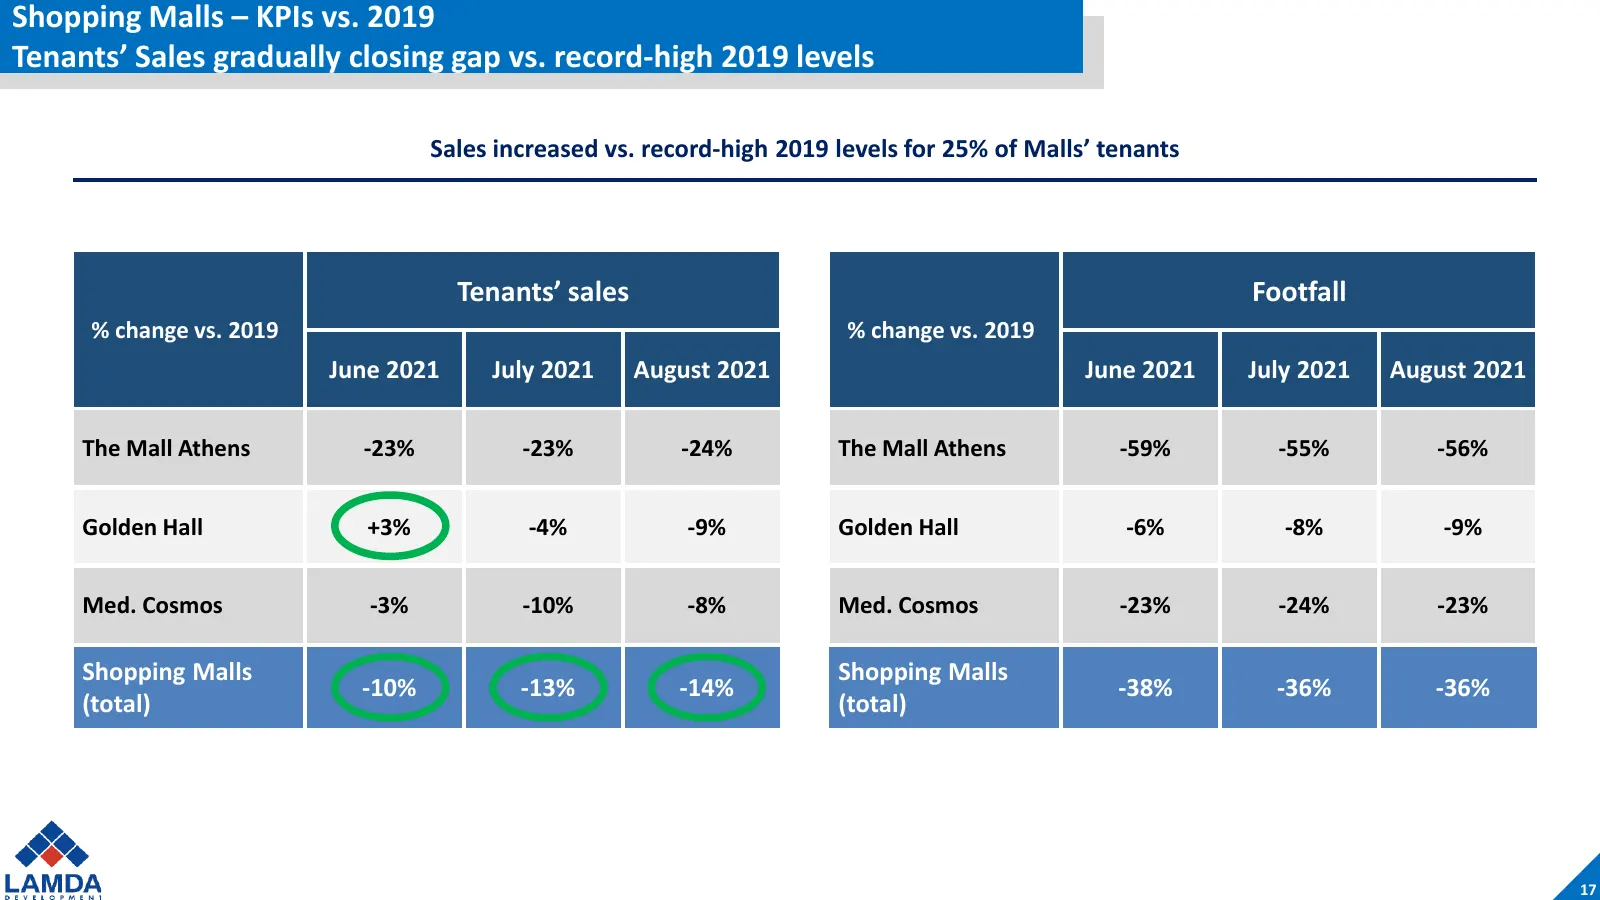
Shopping Malls – KPIs vs. 2019 Tenants’ Sales gradually closing gap vs. record-high 2019 levels Sales increased vs. record-high 2019 levels for 25% of Malls’ tenants Tenants’ sales Footfall % change vs. 2019 % change vs. 2019 June 2021 July 2021 August 2021 June 2021 July 2021 August 2021 The Mall A
Slide 19: H1 2021 Results Commentary – Group
H1 2021 Results Commentary – Group
Slide 20: Total EBITDA
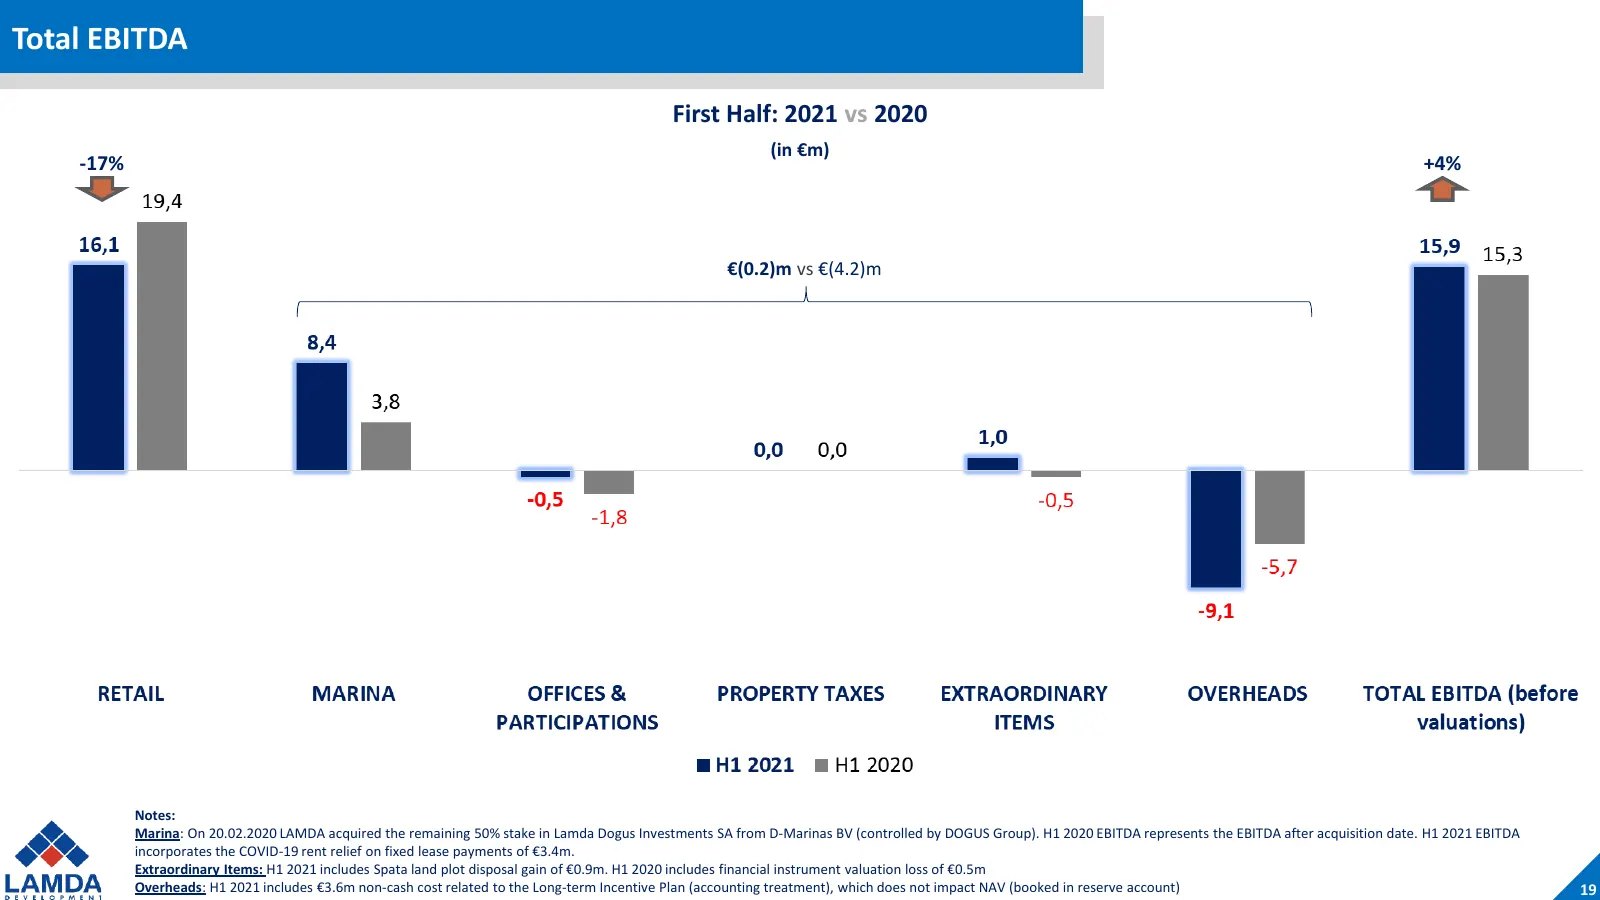
Total EBITDA First Half: 2021 vs 2020 (in €m) -17% +4% €(0.2)m vs €(4.2)m Notes: Marina: On 20.02.2020 LAMDA acquired the remaining 50% stake in Lamda Dogus Investments SA from D-Marinas BV (controlled by DOGUS Group). H1 2020 EBITDA represents the EBITDA after acquisition date. H1 2021 EBITDA incor
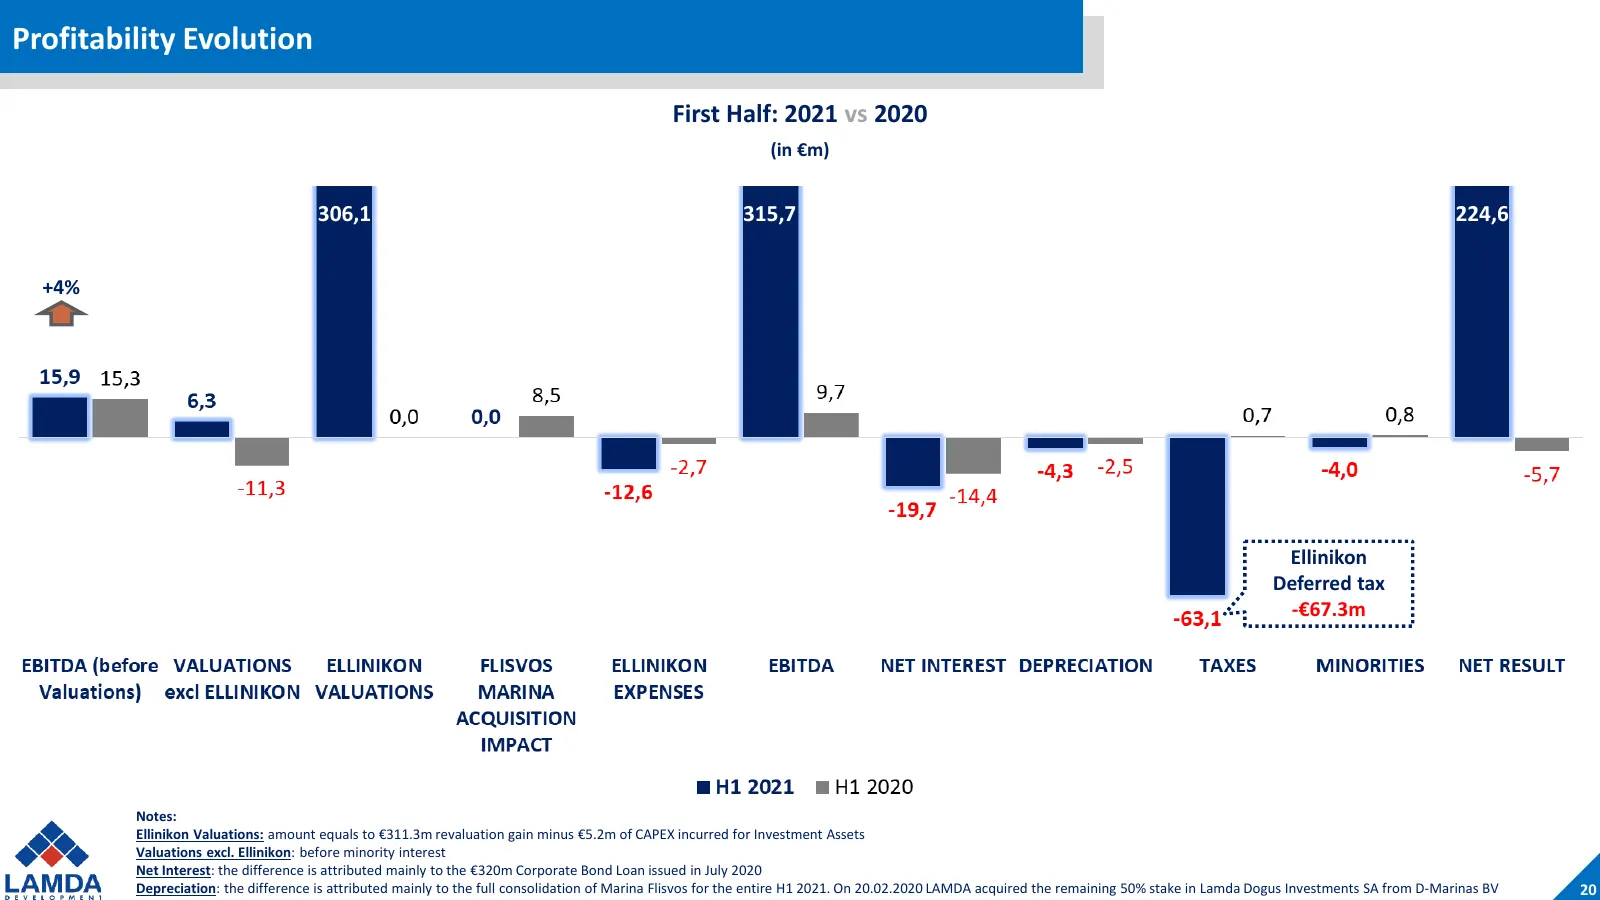
Slide 21: Profitability Evolution
Profitability Evolution First Half: 2021 vs 2020 (in €m) 306,1 315,7 224,6 +4% Ellinikon Deferred tax -€67.3m Notes: Ellinikon Valuations: amount equals to €311.3m revaluation gain minus €5.2m of CAPEX incurred for Investment Assets Valuations excl. Ellinikon: before minority interest Net Interest:
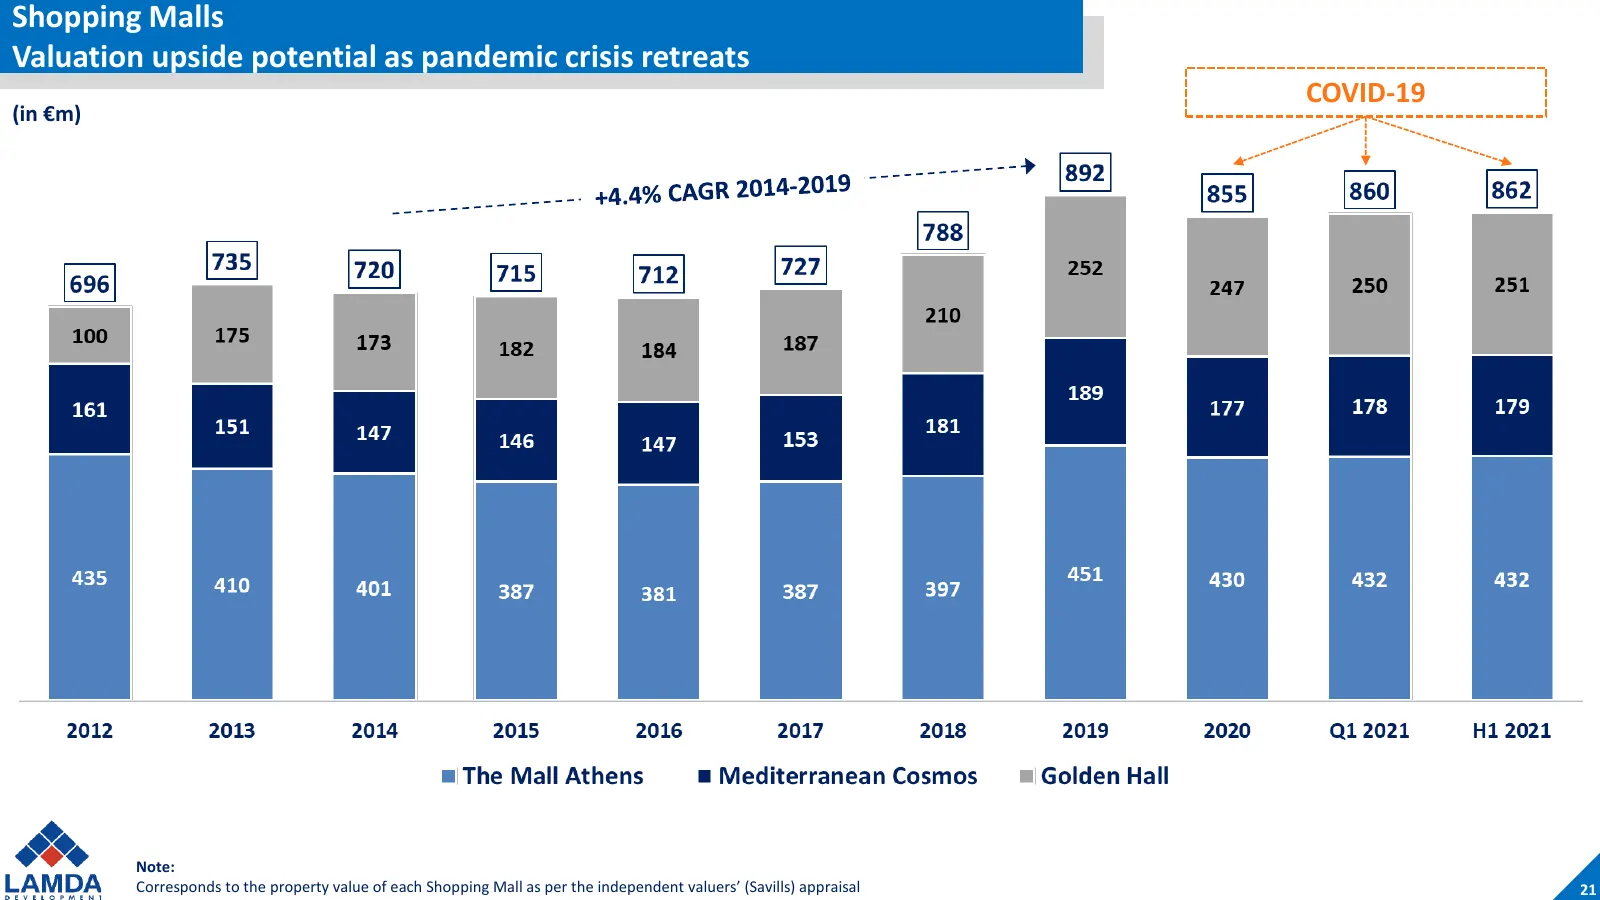
Slide 22: Shopping Malls Valuation upside potential as pandemic crisis retreats
Shopping Malls Valuation upside potential as pandemic crisis retreats COVID-19 (in €m) Note: Corresponds to the property value of each Shopping Mall as per the independent valuers’ (Savills) appraisal 21
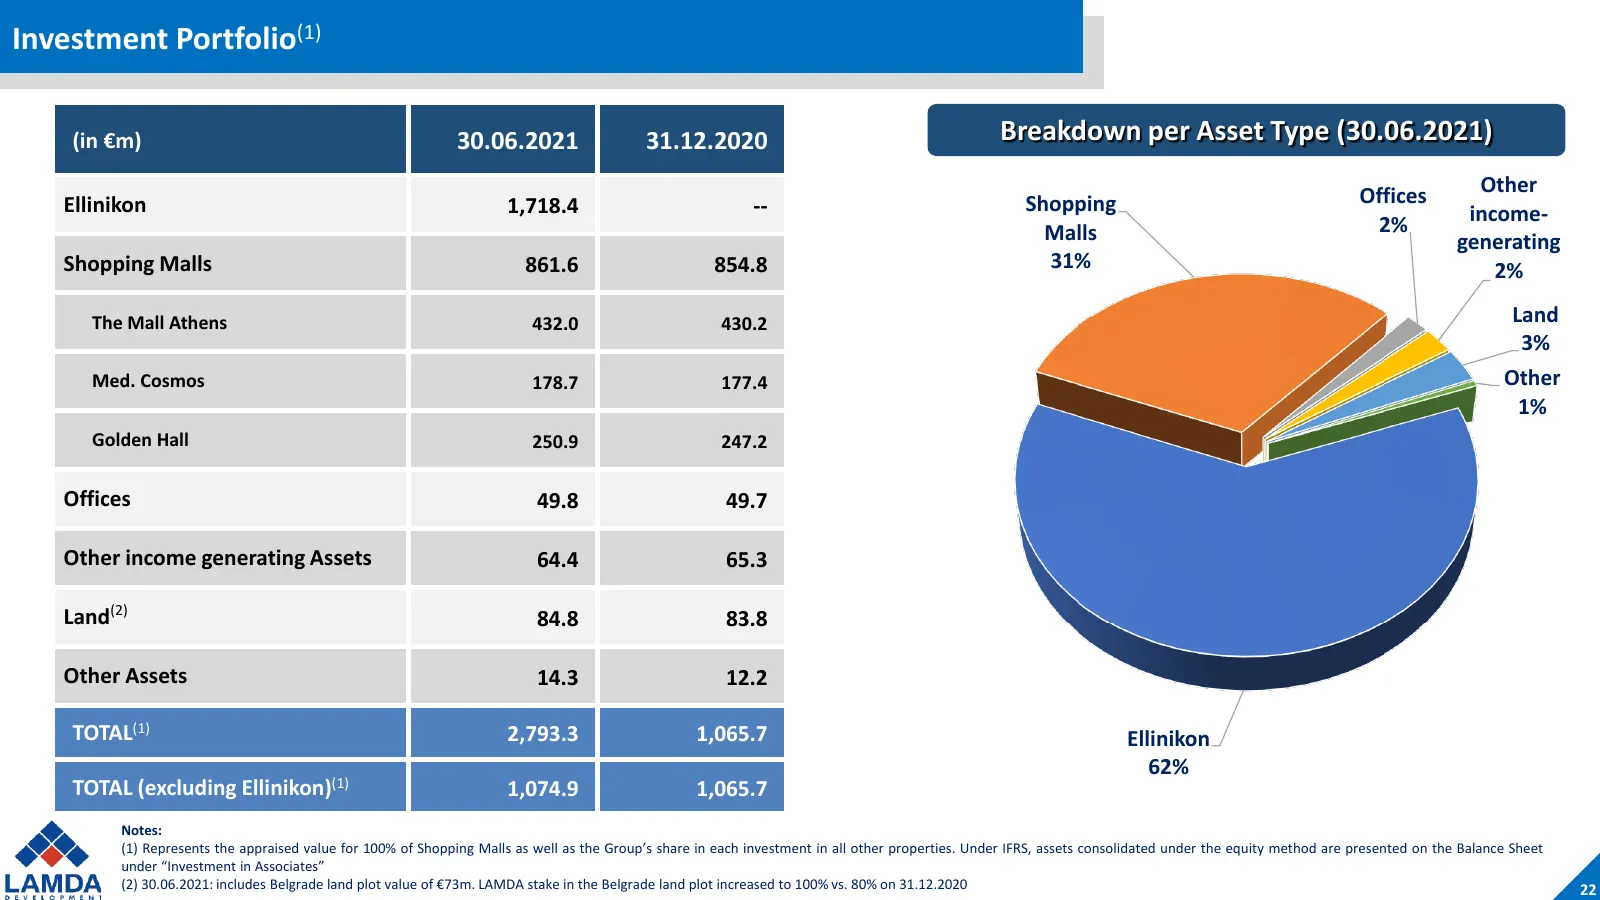
Slide 23: Investment Portfolio
Investment Portfolio(1) (in €m) 30.06.2021 31.12.2020 Breakdown per Asset Type (30.06.2021) Offices Other Ellinikon 1,718.4 -- Shopping income- Malls 2% generating Shopping Malls 861.6 854.8 31% 2% The Mall Athens 432.0 430.2 Land 3% Med. Cosmos 178.7 177.4 Other 1% Golden Hall 250.9 247.2 Offices 4
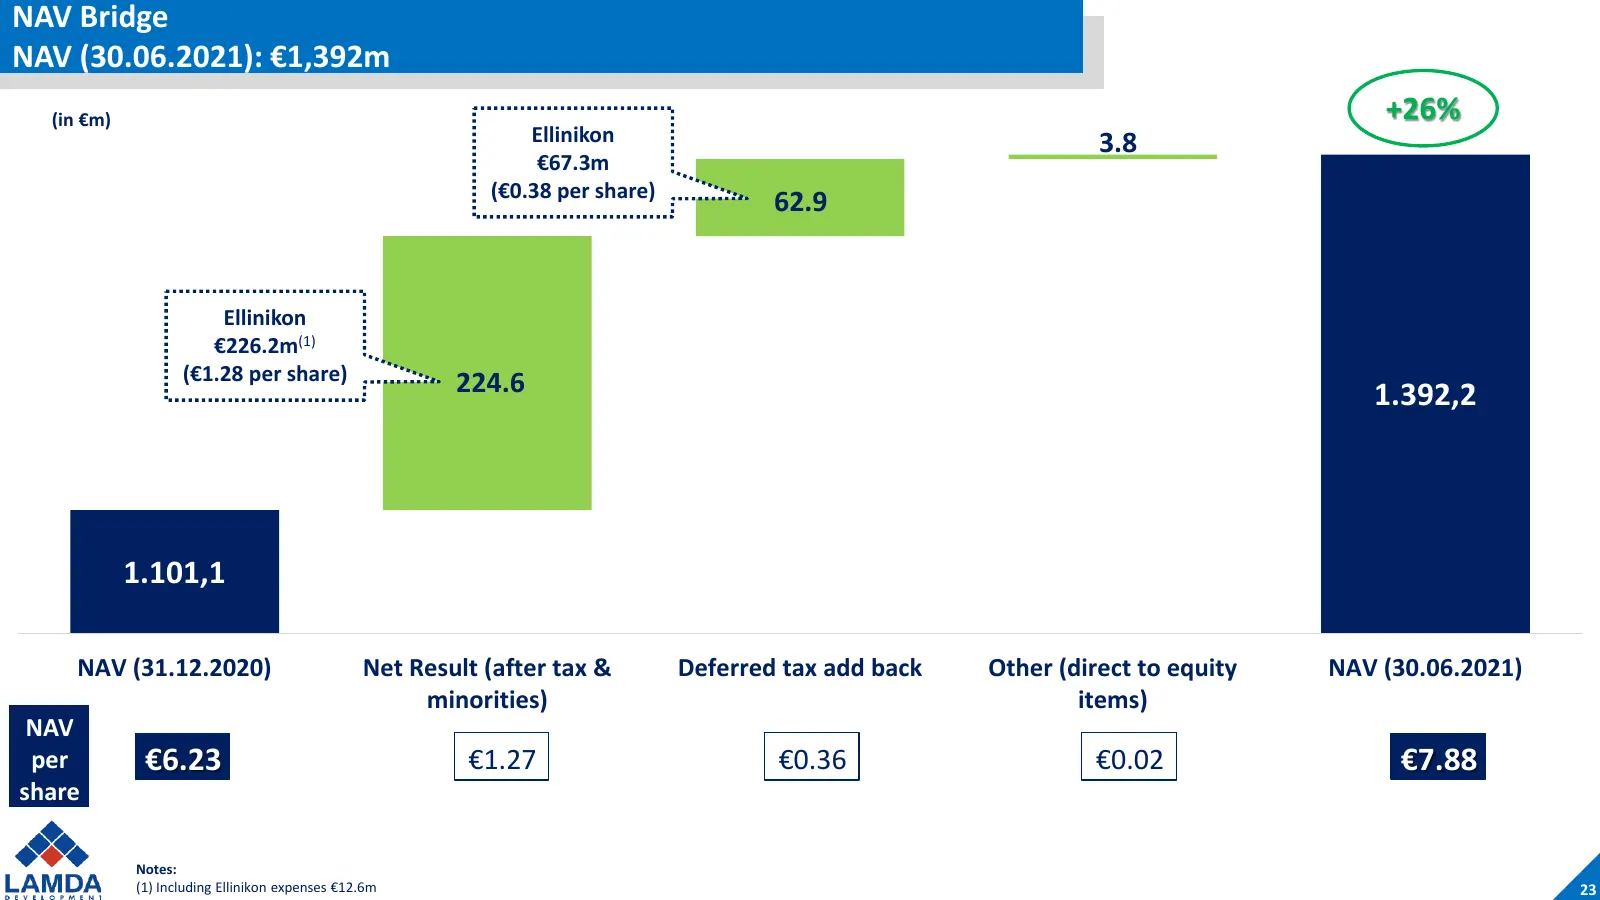
Slide 24: NAV Bridge
NAV Bridge NAV (30.06.2021): €1,392m (in €m) +26% Ellinikon 3.8 €67.3m (€0.38 per share) 62.9 Ellinikon €226.2m(1) (€1.28 per share) 224.6 1.392,2 1.101,1 NAV (31.12.2020) Net Result (after tax & Deferred tax add back Other (direct to equity NAV (30.06.2021) minorities) items) NAV per €6.23 €1.27 €0
Slide 25: Consolidated Balance Sheet Summary
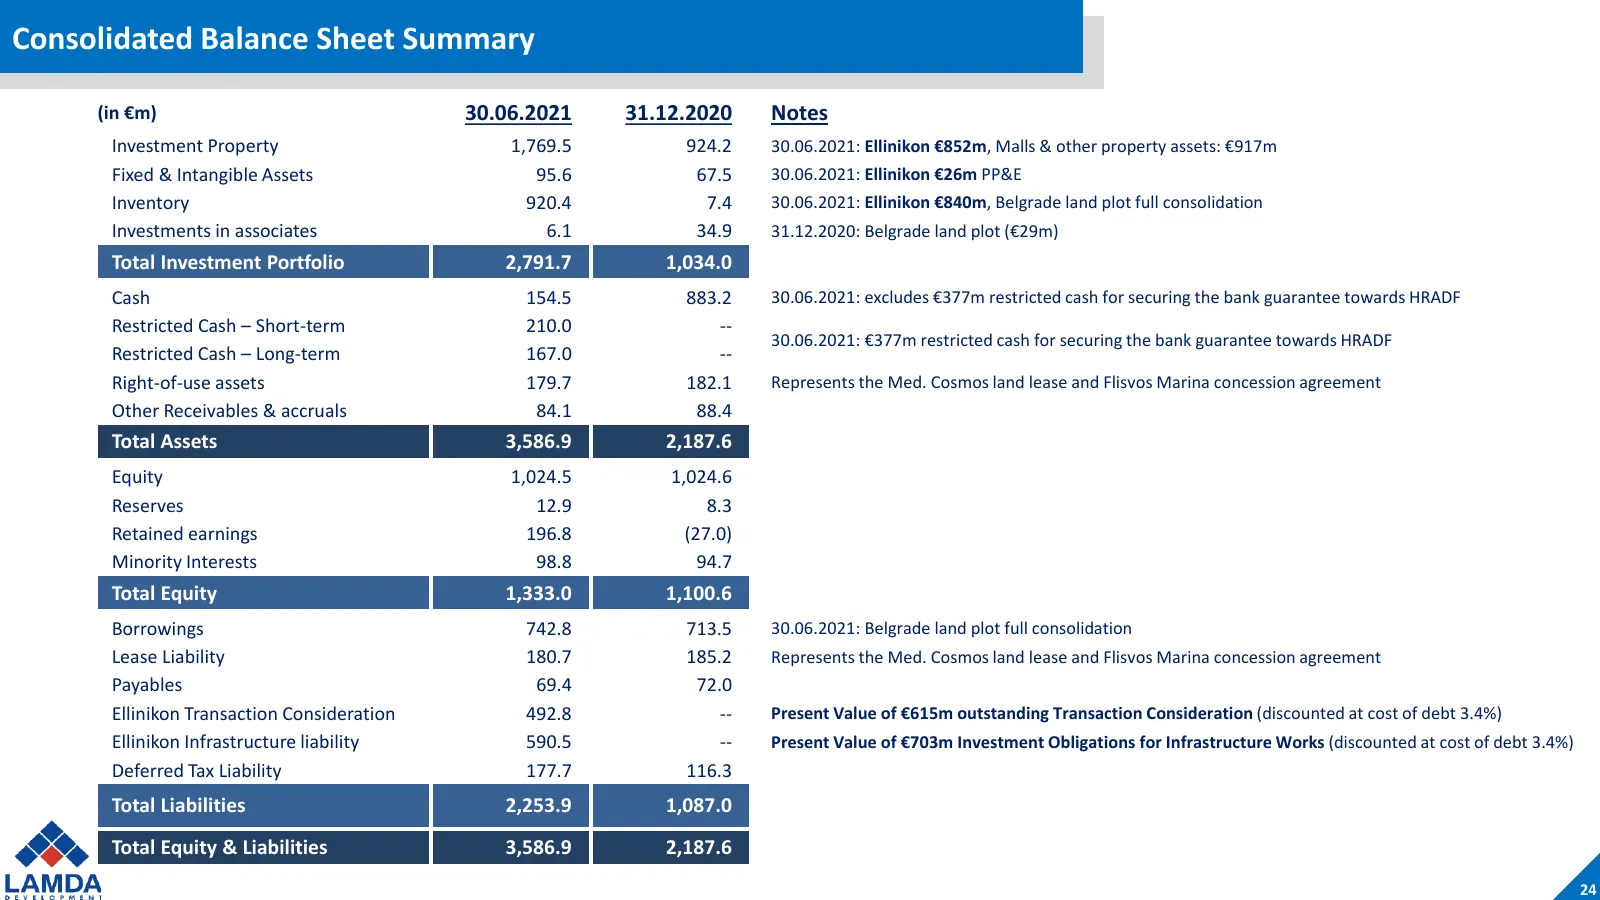
Consolidated Balance Sheet Summary (in €m) 30.06.2021 31.12.2020 Notes Investment Property 1,769.5 924.2 30.06.2021: Ellinikon €852m, Malls & other property assets: €917m Fixed & Intangible Assets 95.6 67.5 30.06.2021: Ellinikon €26m PP&E Inventory 920.4 7.4 30.06.2021: Ellinikon €840m, Belgrade lan
Slide 26: Key Financial Metrics (Group)
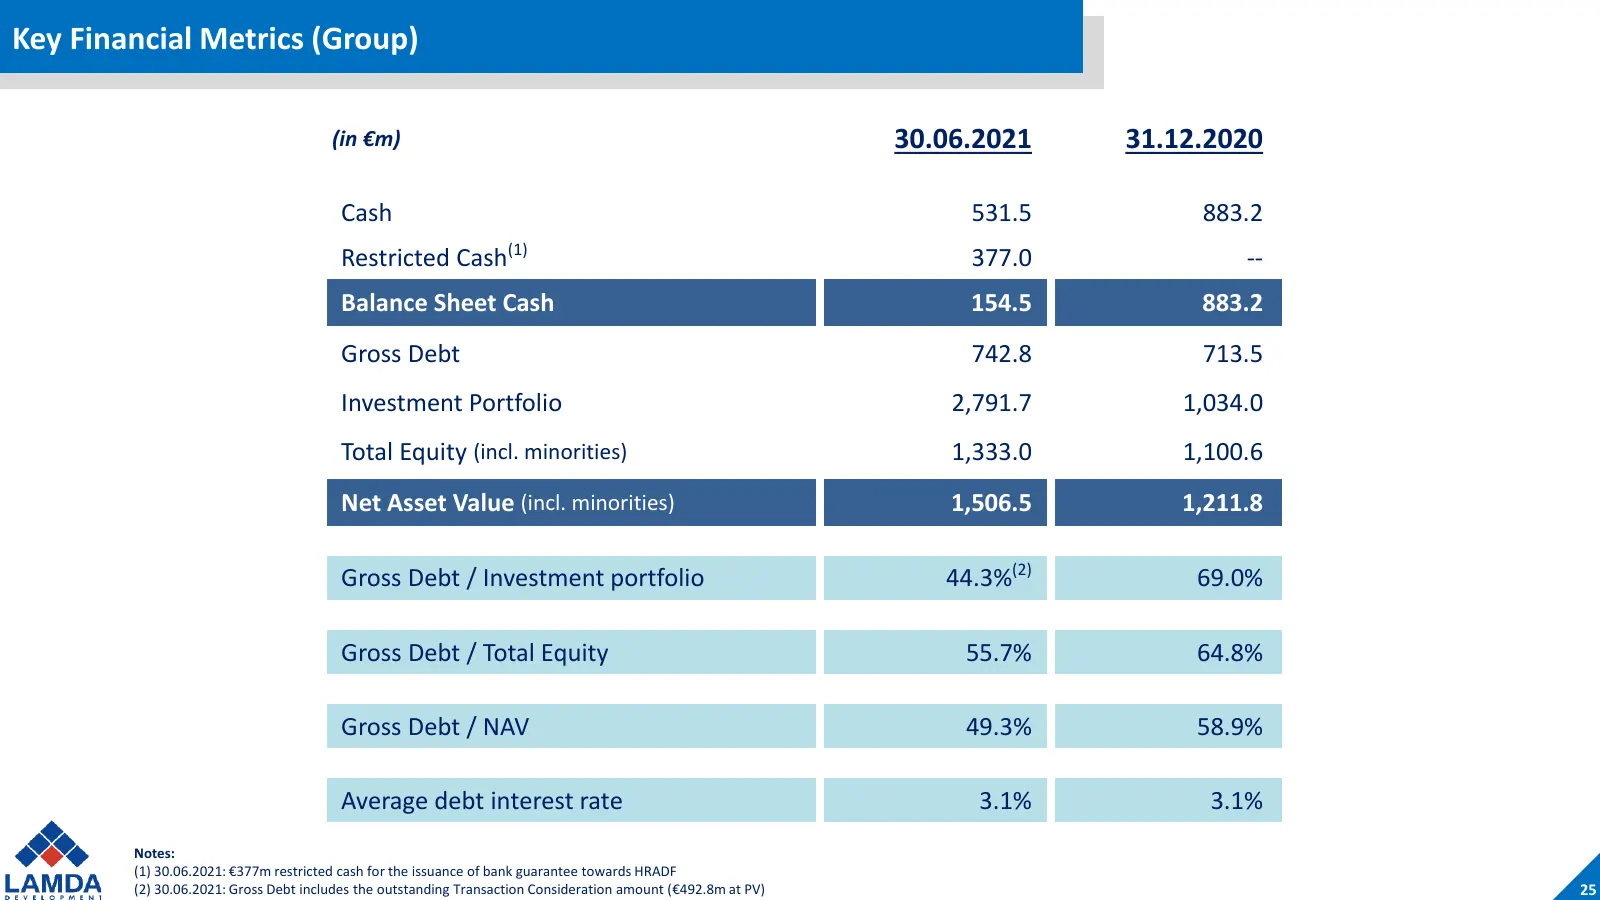
Key Financial Metrics (Group) (in €m) 30.06.2021 31.12.2020 Cash 531.5 883.2 Restricted Cash(1) 377.0 -- Balance Sheet Cash 154.5 883.2 Gross Debt 742.8 713.5 Investment Portfolio 2,791.7 1,034.0 Total Equity (incl. minorities) 1,333.0 1,100.6 Net Asset Value (incl. minorities) 1,506.5 1,211.8 Gross
Slide 27: Disclaimer
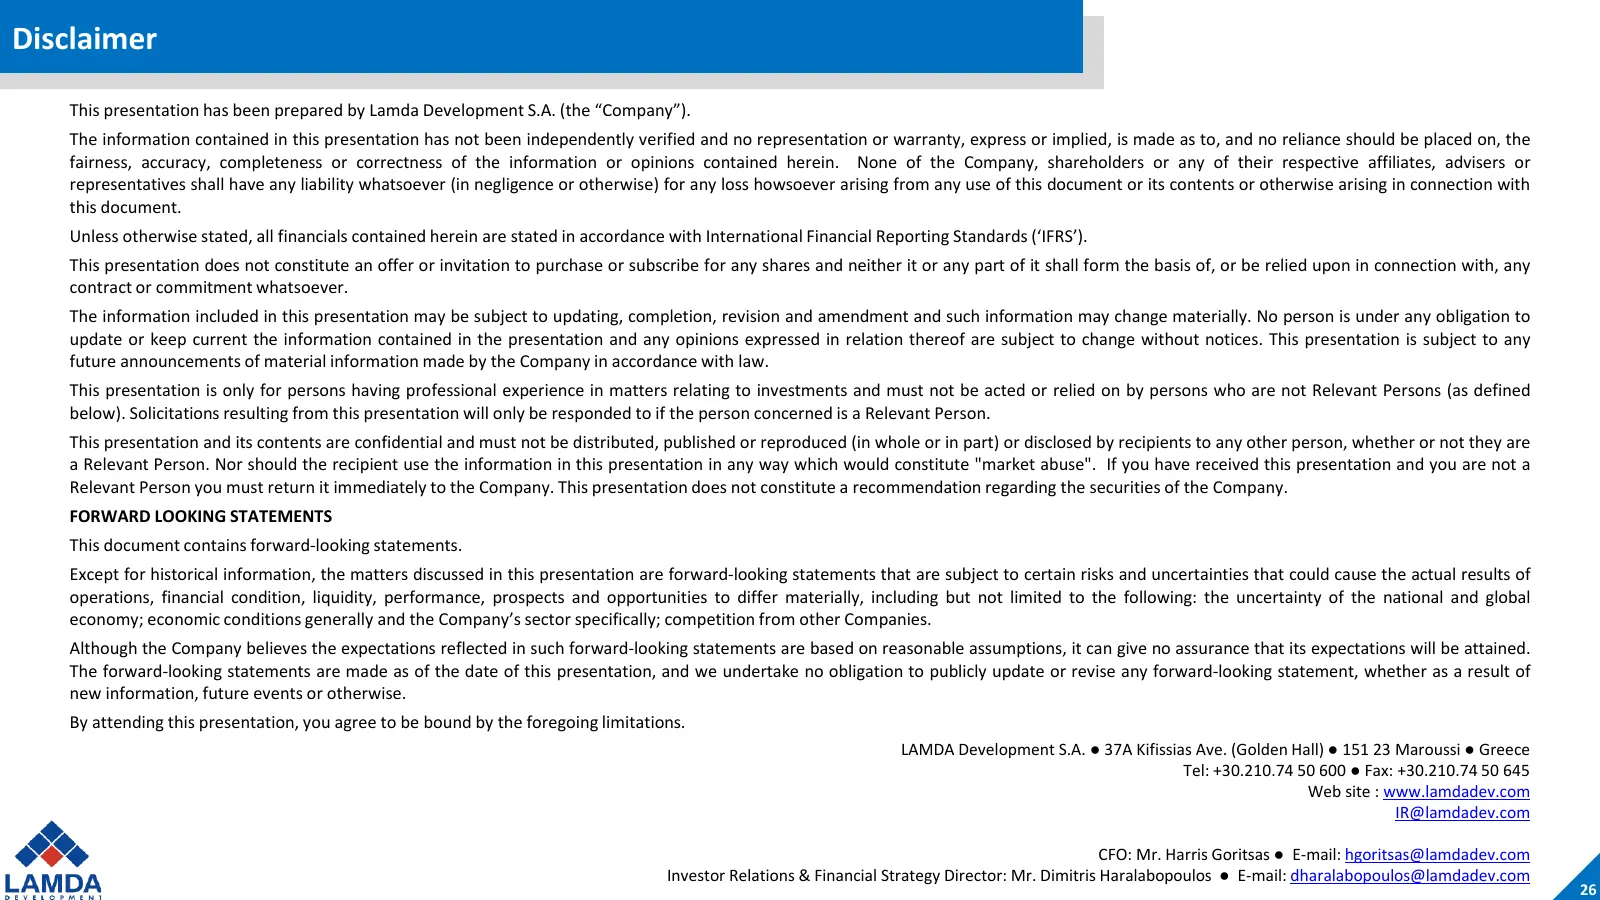
Disclaimer This presentation has been prepared by Lamda Development S.A. (the “Company”). The information contained in this presentation has not been independently verified and no representation or warranty, express or implied, is made as to, and no reliance should be placed on, the fairness, accura
Slide 28: A New Era for Greece
DEVELOPMENT A New Era for Greece
Source: Internet Archive copy of lamdadev.com
More decks from LAMDA Development S.A.
 H1 2026 Earnings Presentation37 slides · Sep 17, 2026
 Q1 2026 Earnings Presentation37 slides · Jul 8, 2026
 Shareholder Meeting (June 2026)50 slides · Jun 23, 2026
 Investor Presentation (May 2026)41 slides · May 2026
 FY2025 Earnings Presentation38 slides · Mar 5, 2026
 Investor Presentation (January 2026)46 slides · January 2026