Bravura Solutions Limited · ASX:BVS
Bravura Solutions — H1 FY2011 Earnings Presentation
13 slides from Bravura Solutions's earnings presentation, Feb 24, 2011
Slide 1: Investor Presentation – 2011 Half Year Financial Results
Investor Presentation – 2011 Half Year Financial Results Half Year ended 31 December 2010 Simon Woodfull, Group Chief Executive Officer Rebecca Norton, Chief Financial Officer 24 February 2011
Slide 2: Agenda
BRAVURA SOLUTIONS INVESTOR PRESENTATION AGENDA Group Highlights 1H11 Financial Results Outlook Question & Answers 2 2

Slide 3: Group Highlights
Group Highlights
Slide 4: Key Points
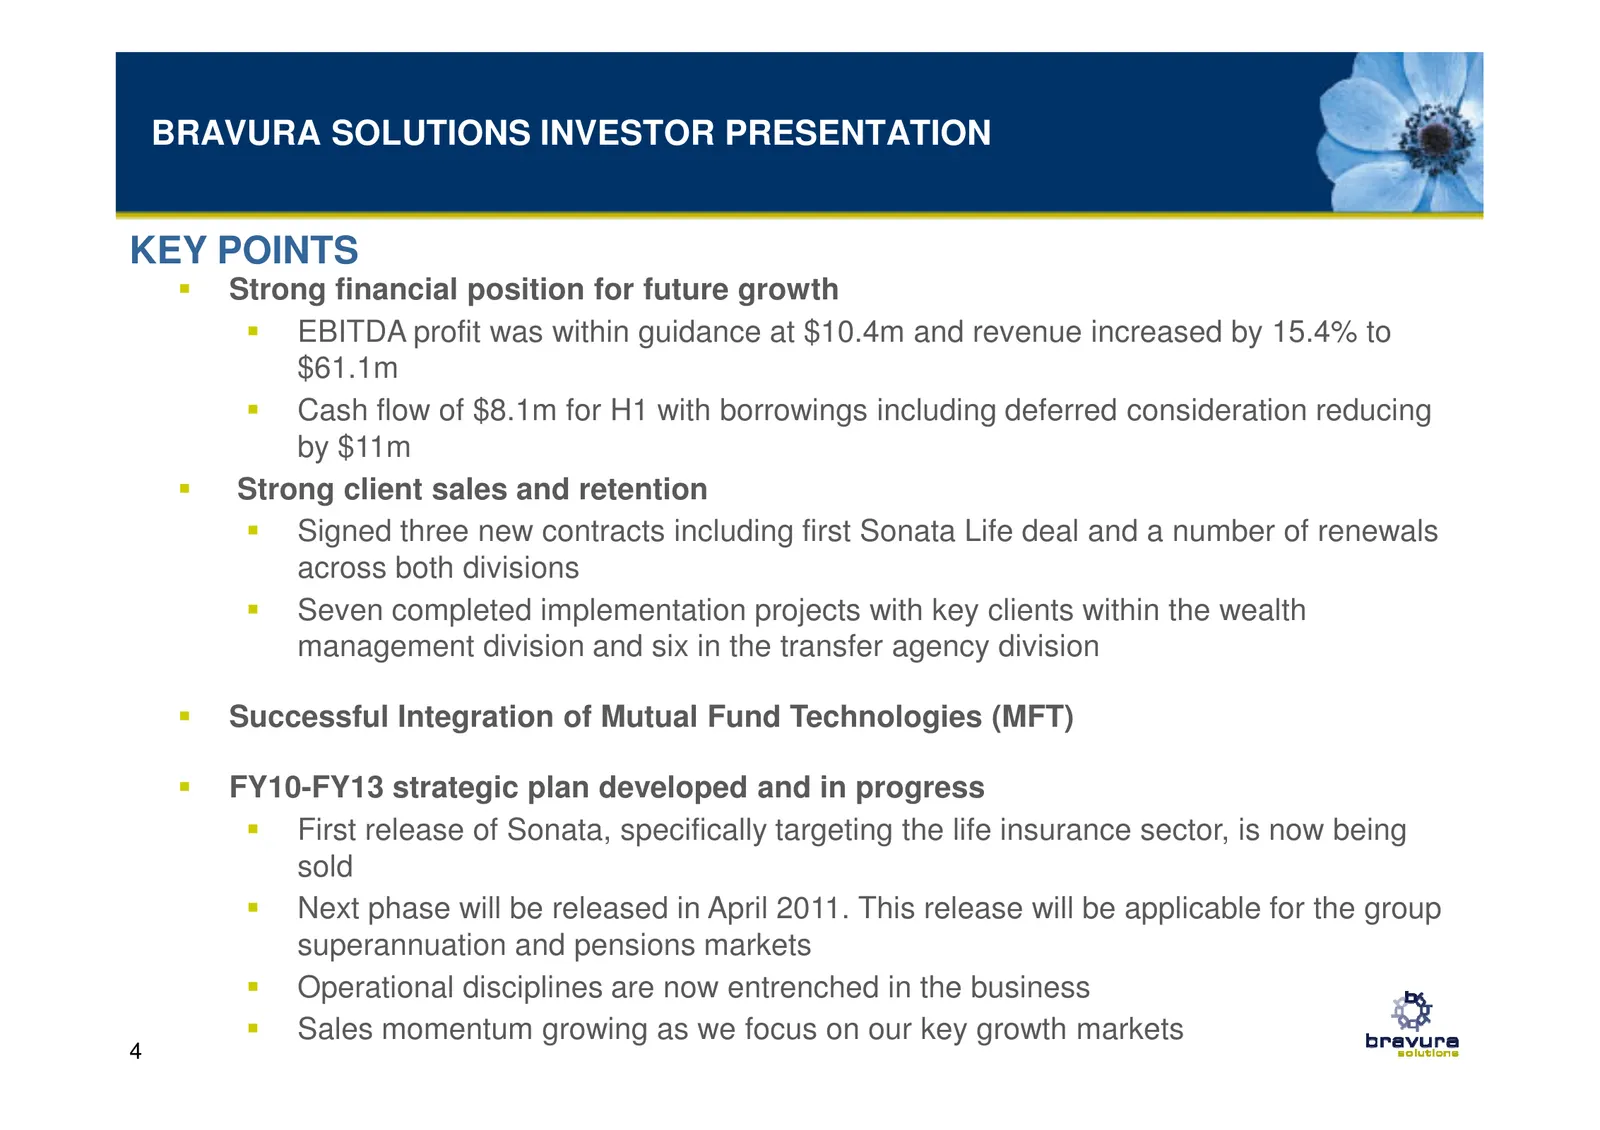
BRAVURA SOLUTIONS INVESTOR PRESENTATION KEY POINTS Strong financial position for future growth EBITDA profit was within guidance at $10.4m and revenue increased by 15.4% to $61.1m Cash flow of $8.1m for H1 with borrowings including deferred consideration reducing by $11m Strong client sales and rete
Slide 5: H1 FY11 Financial Results
H1 FY11 Financial Results
Slide 6: 1H11 Financial Performance
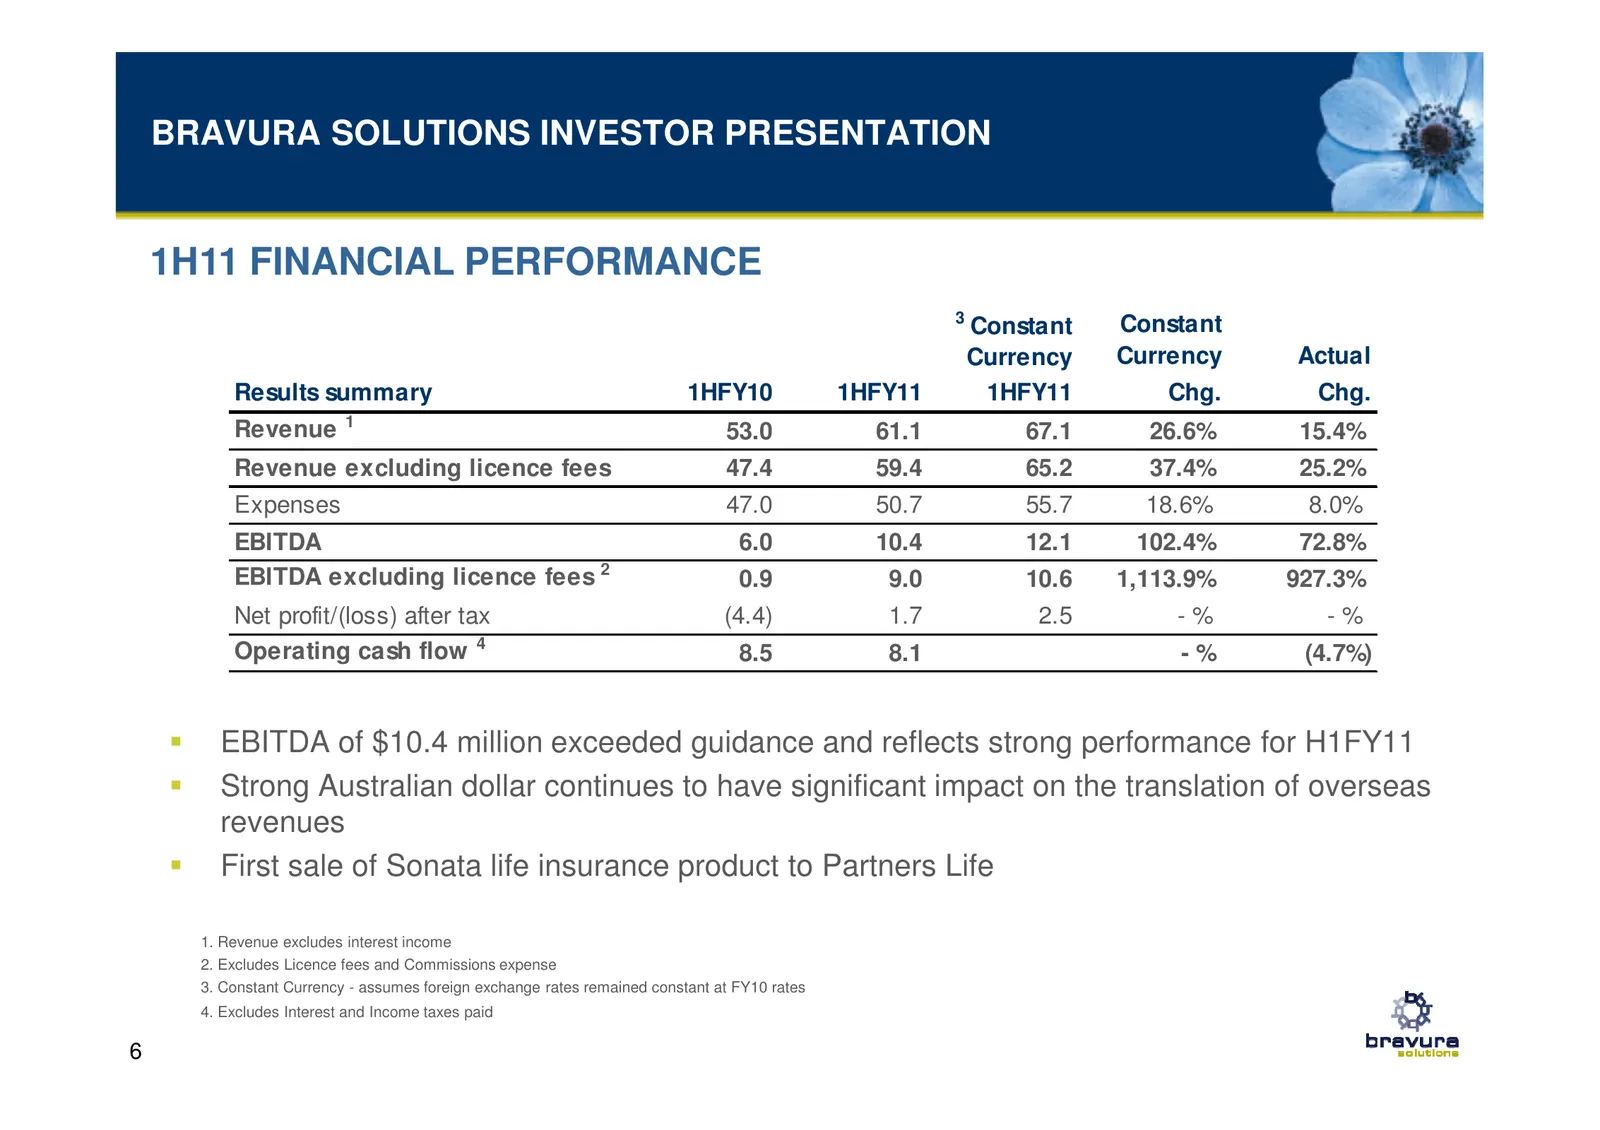
BRAVURA SOLUTIONS INVESTOR PRESENTATION 1H11 FINANCIAL PERFORMANCE 3 Constant Constant Currency Currency Actual Results summary 1HFY10 1HFY11 1HFY11 Chg. Chg. Revenue 1 53.0 61.1 67.1 26.6% 15.4% Revenue excluding licence fees 47.4 59.4 65.2 37.4% 25.2% Expenses 47.0 50.7 55.7 18.6% 8.0% EBITDA 6.0
Slide 7: Continued Improvement in Underlying Performance
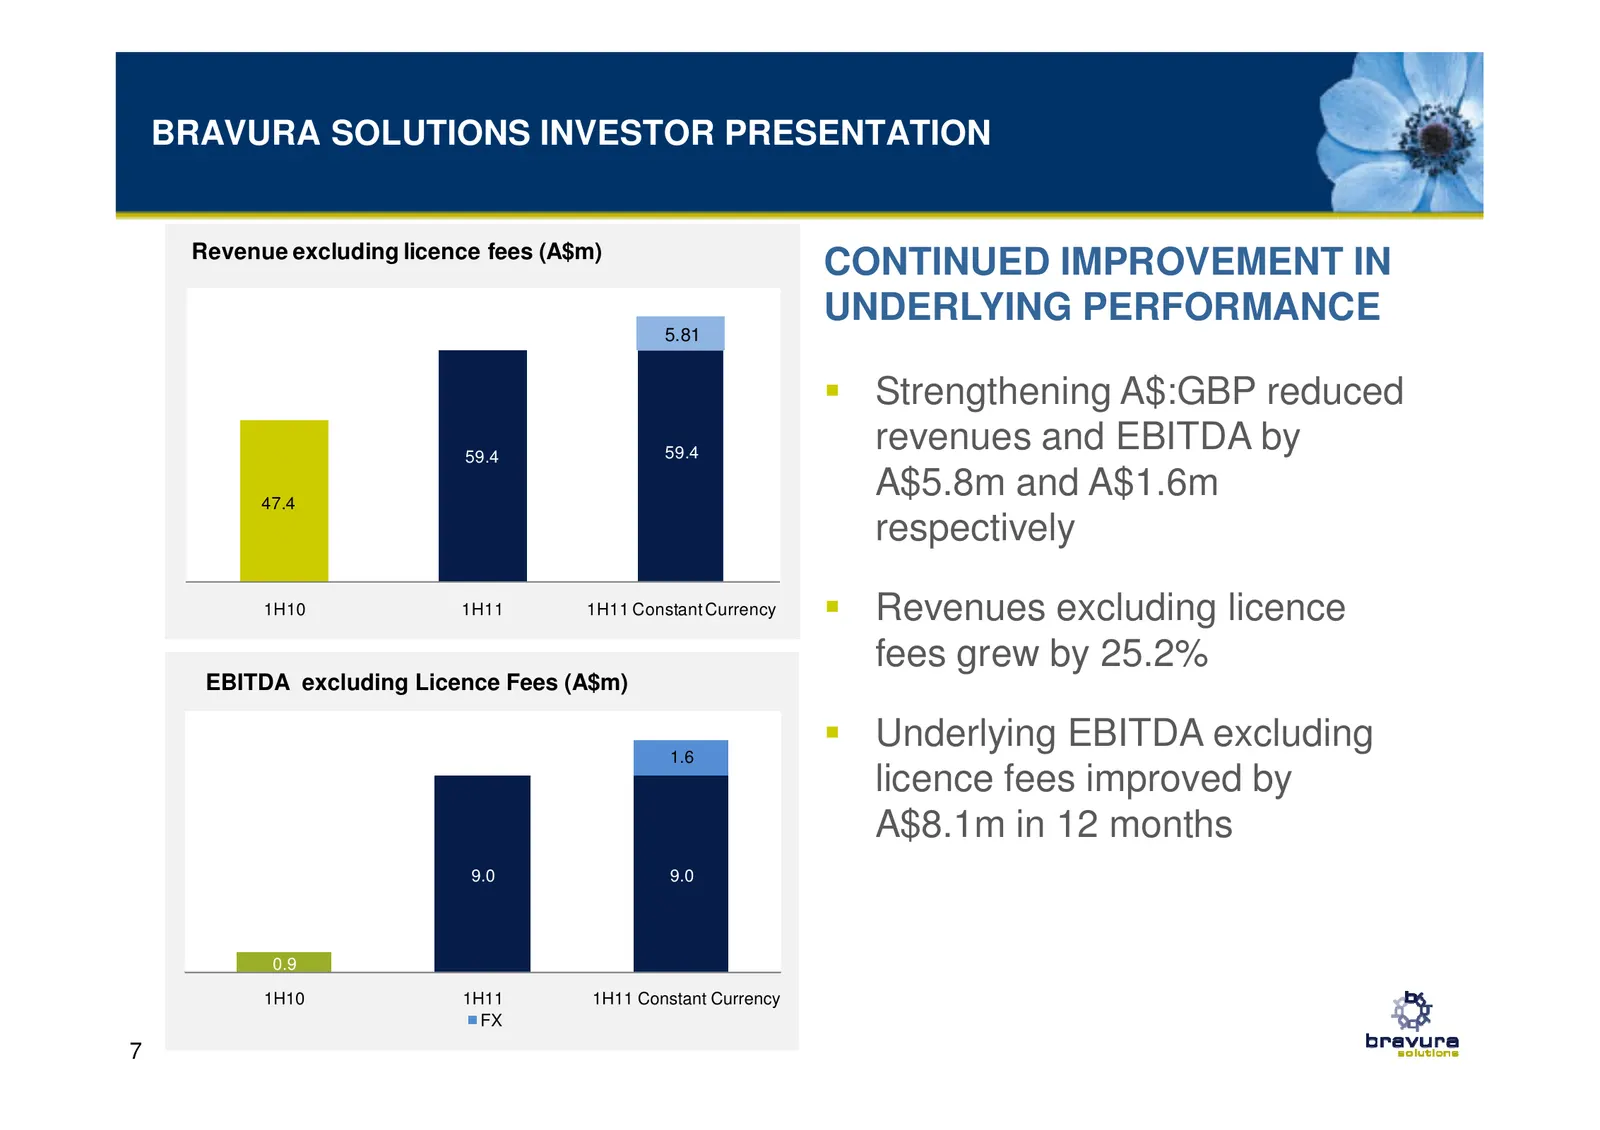
BRAVURA SOLUTIONS INVESTOR PRESENTATION Revenue excluding licence fees (A$m) CONTINUED IMPROVEMENT IN UNDERLYING PERFORMANCE 5.81 Strengthening A$:GBP reduced 59.4 59.4 revenues and EBITDA by 47.4 A$5.8m and A$1.6m respectively 1H10 1H11 1H11 Constant Currency Revenues excluding licence fees grew by
Slide 8: 1H11 Revenue Summary (A$m)
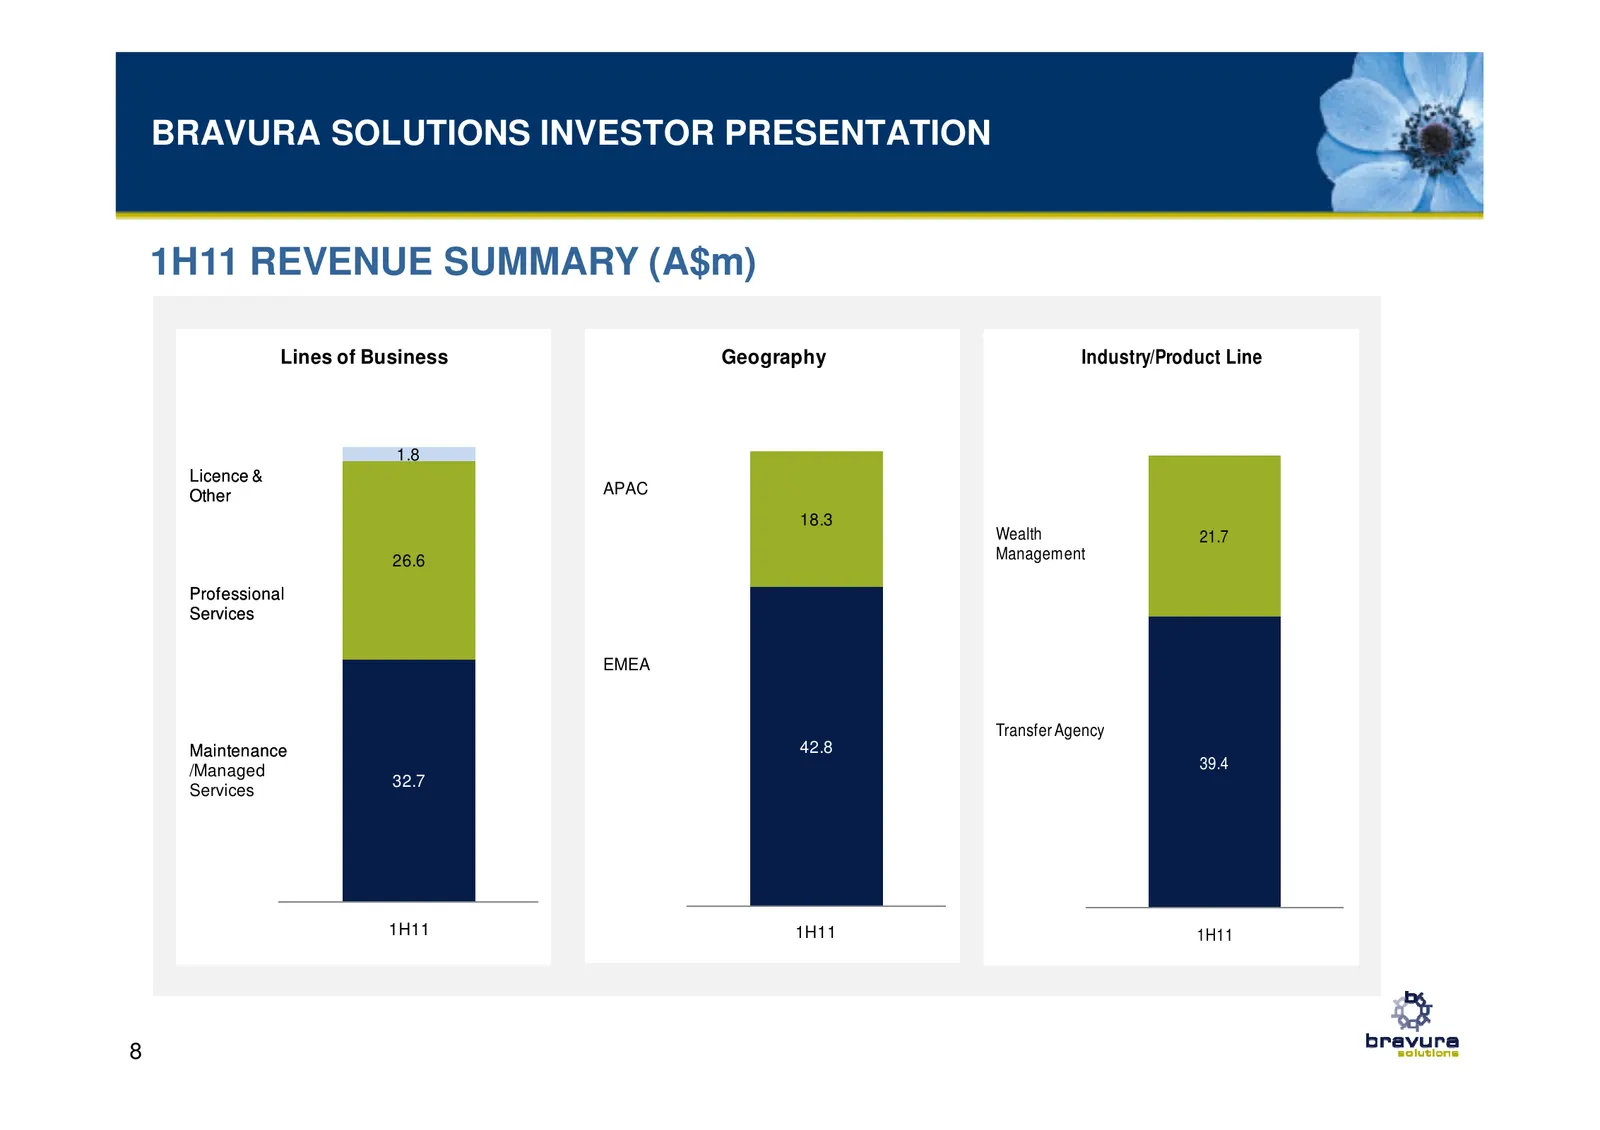
BRAVURA SOLUTIONS INVESTOR PRESENTATION 1H11 REVENUE SUMMARY (A$m) Lines of Business Geography Industry/Product Line 1.8 Licence & Other APAC 18.3 Wealth 21.7 26.6 Management Professional Services EMEA Transfer Agency Maintenance 42.8 /Managed 39.4 32.7 Services 1H11 1H11 1H11 8
Slide 9: Operating Cost Management
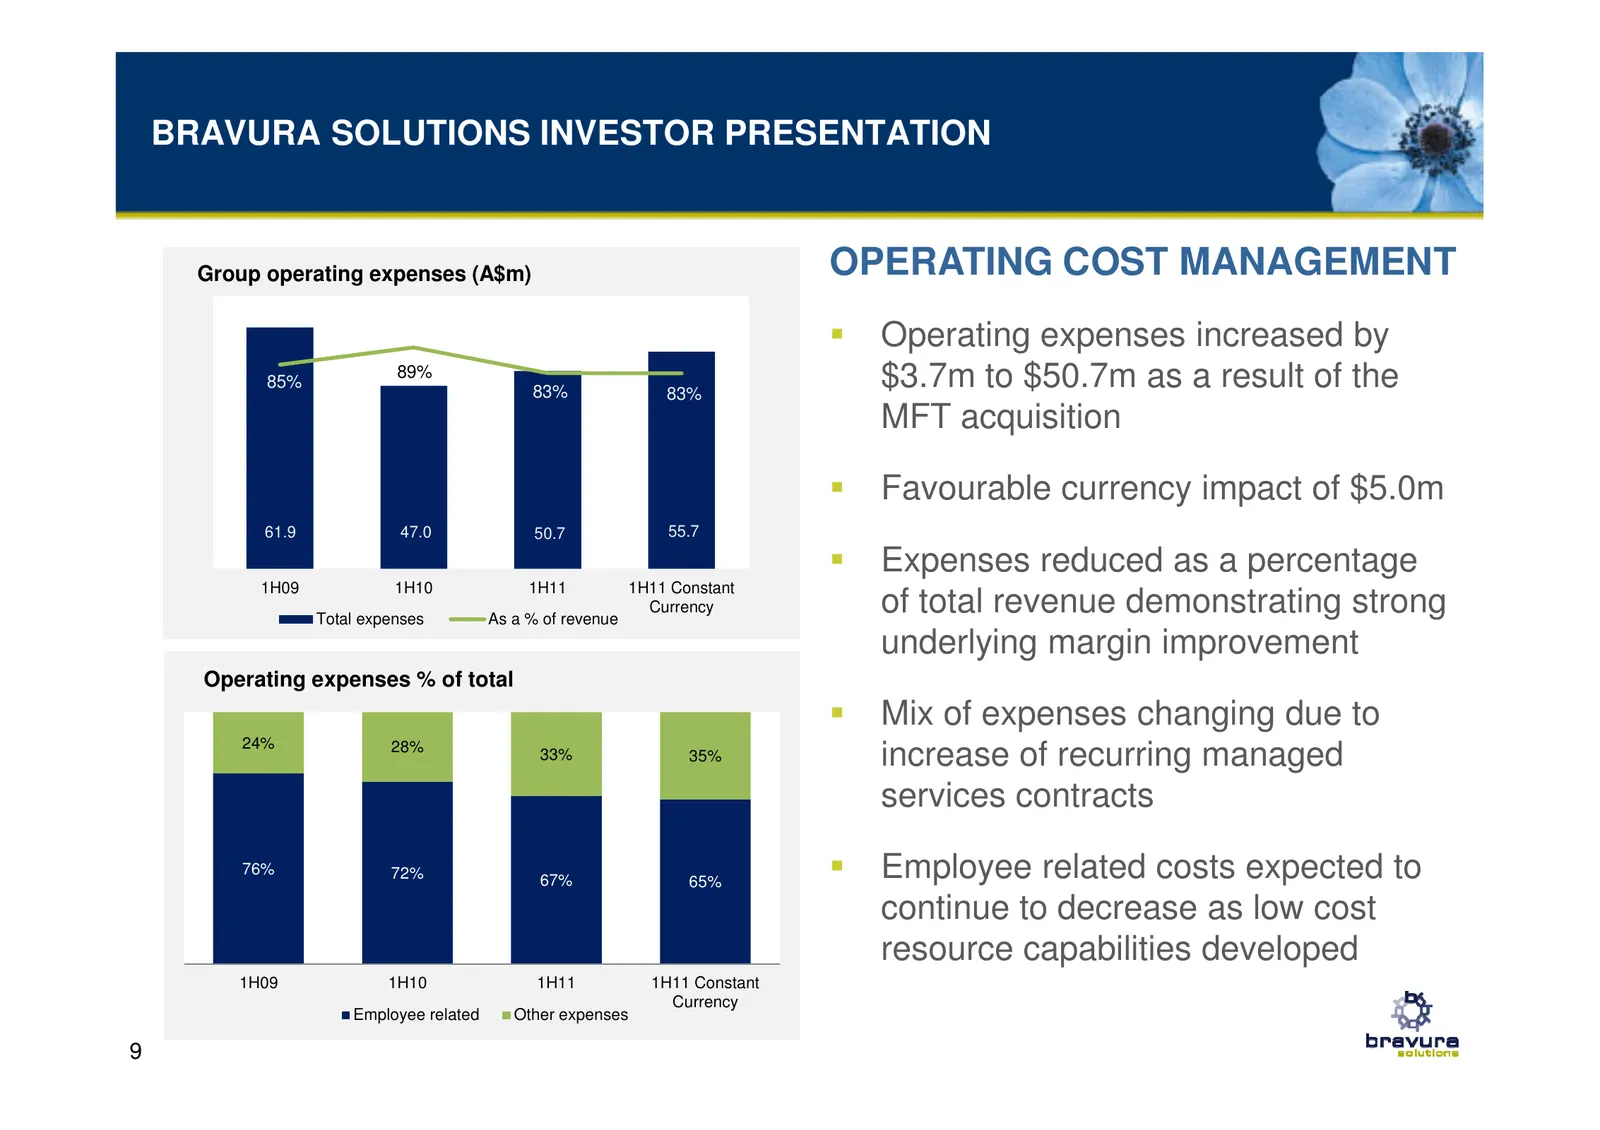
BRAVURA SOLUTIONS INVESTOR PRESENTATION Group operating expenses (A$m) OPERATING COST MANAGEMENT 70.0 100% 60.0 90% Operating expenses increased by 50.0 85% 89% 83% 83% 80% $3.7m to $50.7m as a result of the 40.0 70% MFT acquisition 30.0 60% 20.0 Favourable currency impact of $5.0m 10.0 50% 61.9 47.
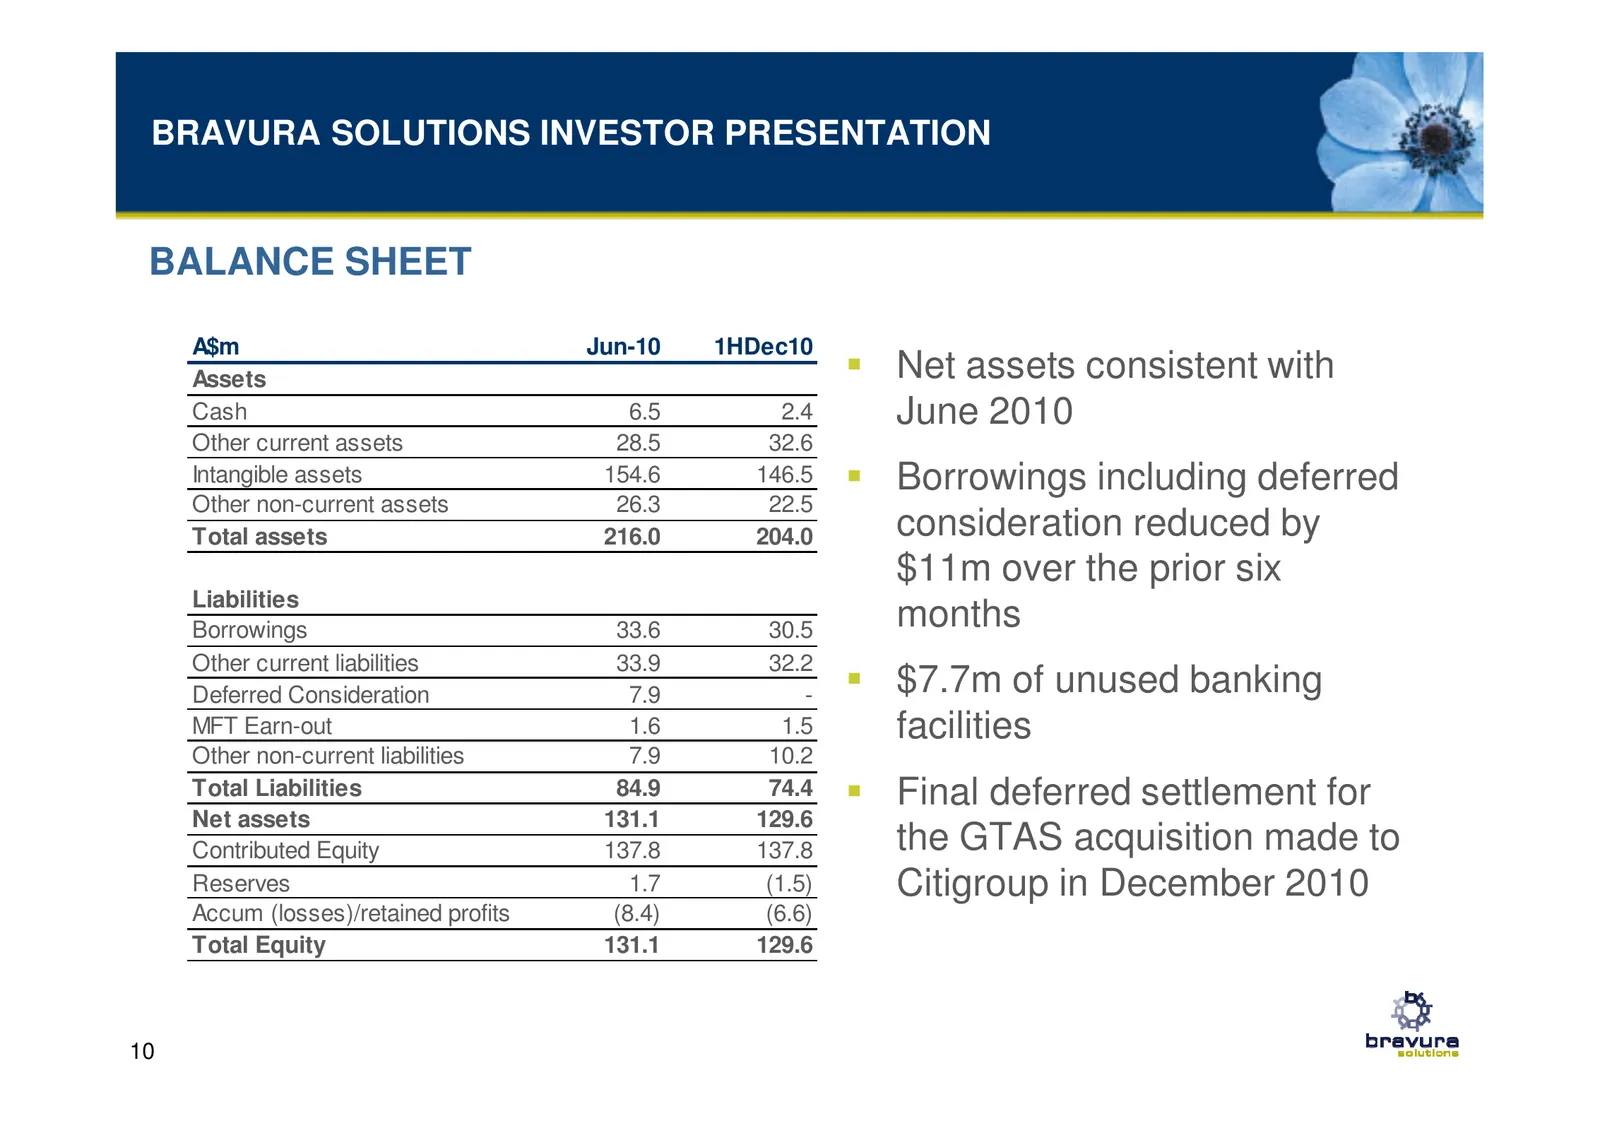
Slide 10: Balance Sheet
BRAVURA SOLUTIONS INVESTOR PRESENTATION BALANCE SHEET A$m Jun-10 1HDec10 Assets Net assets consistent with Cash 6.5 2.4 June 2010 Other current assets 28.5 32.6 Intangible assets 154.6 146.5 Borrowings including deferred Other non-current assets 26.3 22.5 Total assets 216.0 204.0 consideration reduc
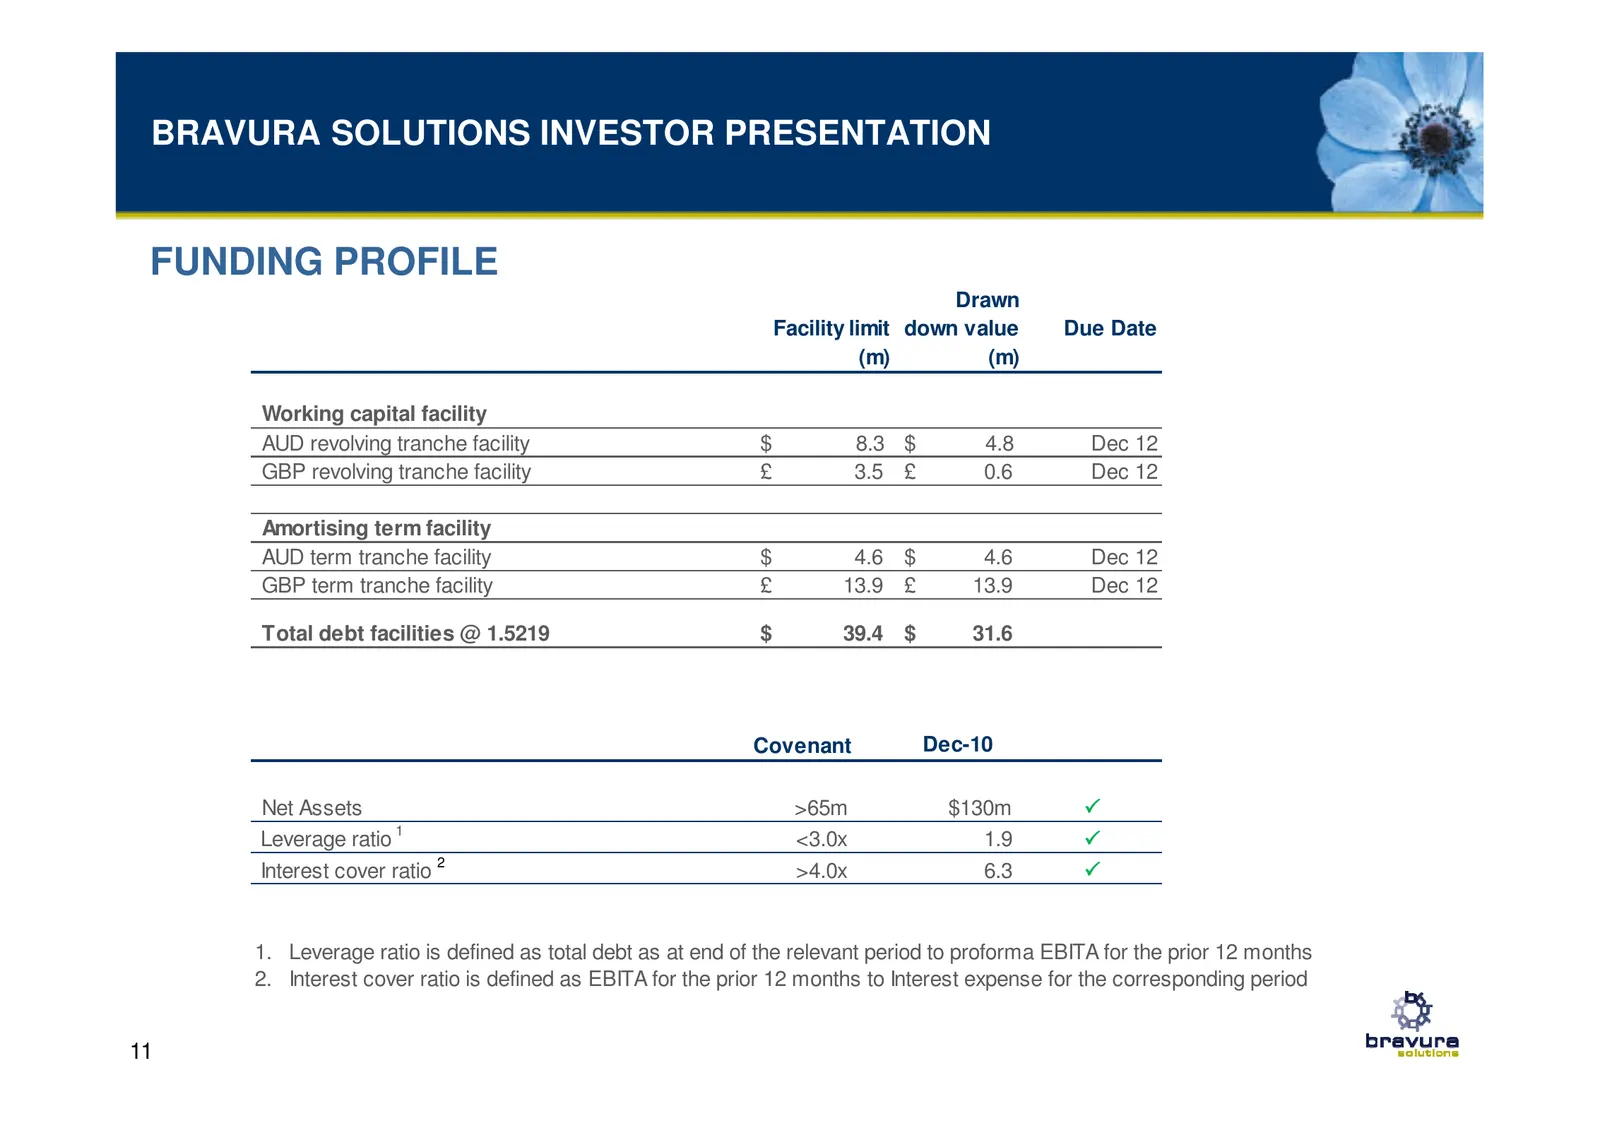
Slide 11: Funding Profile
BRAVURA SOLUTIONS INVESTOR PRESENTATION FUNDING PROFILE Drawn Facility limit down value Due Date (m) (m) Working capital facility AUD revolving tranche facility $ 8.3 $ 4.8 Dec 12 GBP revolving tranche facility £ 3.5 £ 0.6 Dec 12 Amortising term facility AUD term tranche facility $ 4.6 $ 4.6 Dec 12

Slide 12: Strategic Outlook
Strategic Outlook
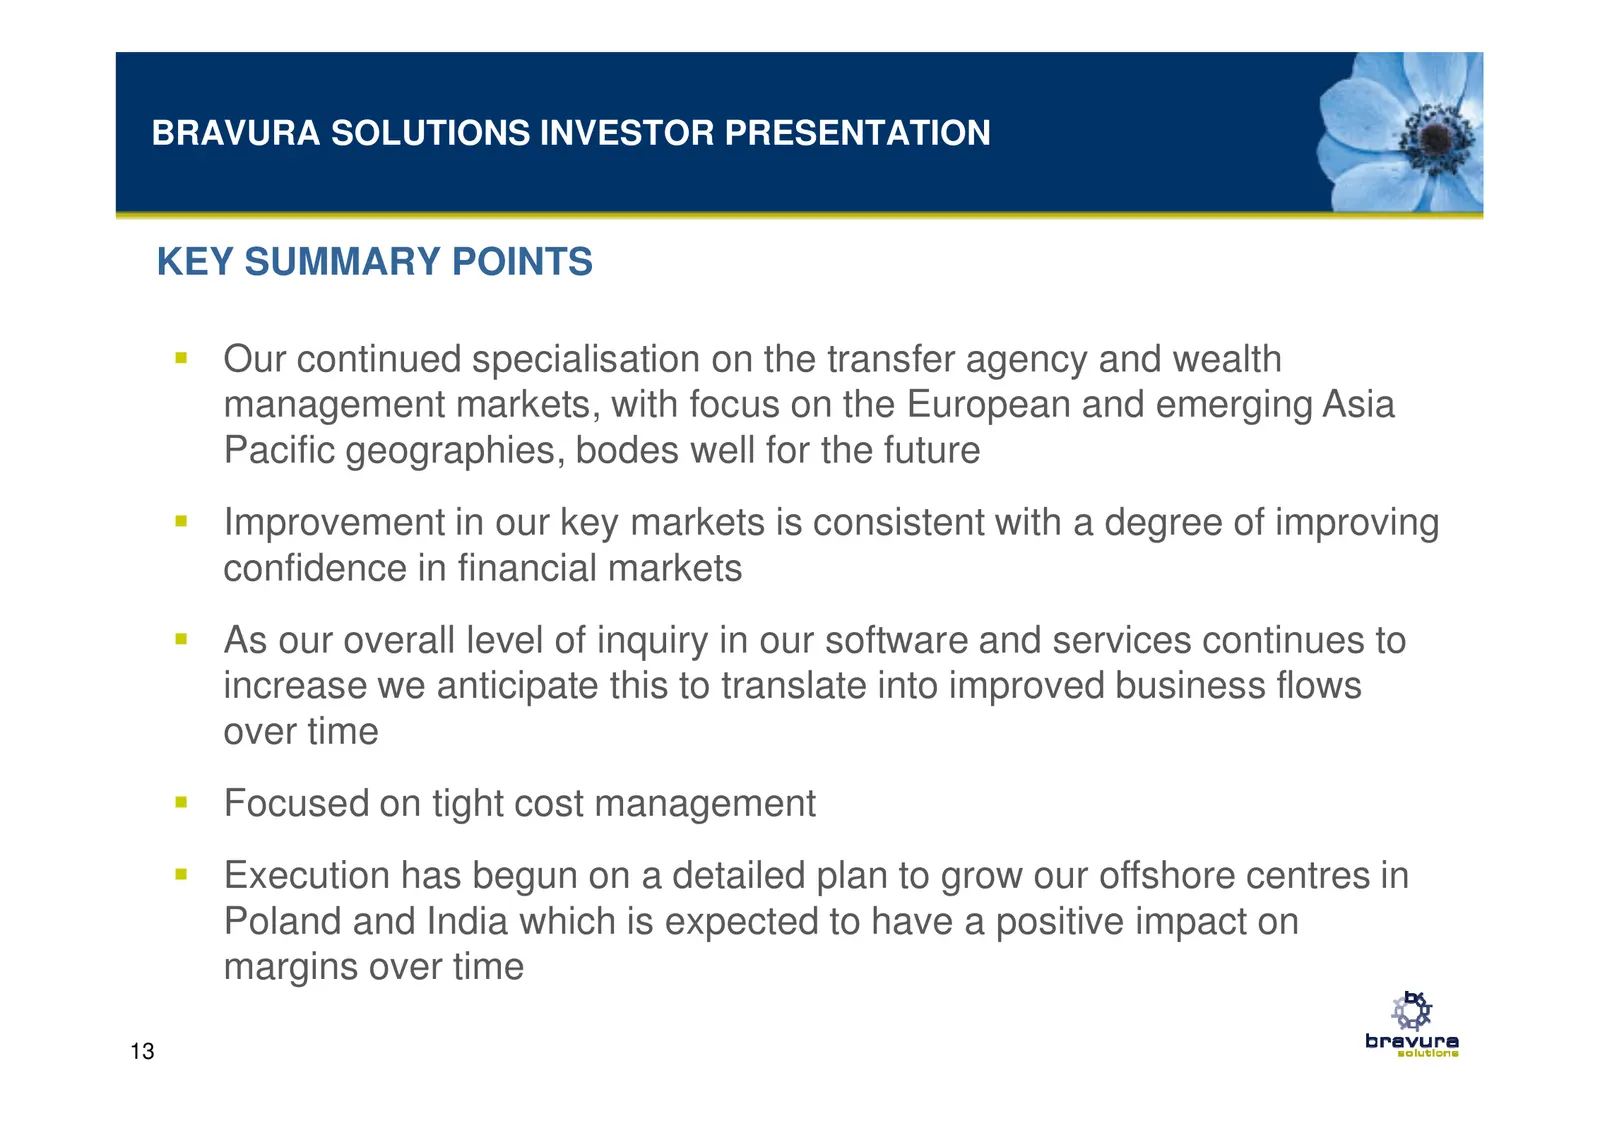
Slide 13: Key Summary Points
BRAVURA SOLUTIONS INVESTOR PRESENTATION KEY SUMMARY POINTS Our continued specialisation on the transfer agency and wealth management markets, with focus on the European and emerging Asia Pacific geographies, bodes well for the future Improvement in our key markets is consistent with a degree of impr
Source: Internet Archive copy of bravurasolutions.com
More decks from Bravura Solutions Limited
 FY2026 Earnings Presentation25 slides · Aug 12, 2026
 H1 2026 Earnings Presentation24 slides · Feb 11, 2026
 Shareholder Meeting (October 2025)13 slides · Oct 15, 2025
 FY2025 Earnings Presentation25 slides · Aug 13, 2025
 H1 2025 Earnings Presentation28 slides · Feb 12, 2025
 Shareholder Meeting (October 2024)18 slides · Oct 30, 2024