HKT Trust and HKT Ltd · HKEX:6823
HKT Trust and HKT — HKT — H1 2020 Earnings Presentation
29 slides from HKT Trust and HKT's earnings presentation, Aug 5, 2020
Slide 1: 2020 Interim Results
2020 Interim Results For the six months ended June 30, 2020 August 5, 2020 Hong Kong
Slide 2: Forward Looking Statements
Forward Looking Statements This presentation may contain "forward-looking statements" that are not historical in nature. These forward-looking statements, which include, without limitation, statements regarding HKT’s future results of operations, financial condition or business prospects, are based

Slide 3: Business Review
Business Review Susanna Hui Group Managing Director 3
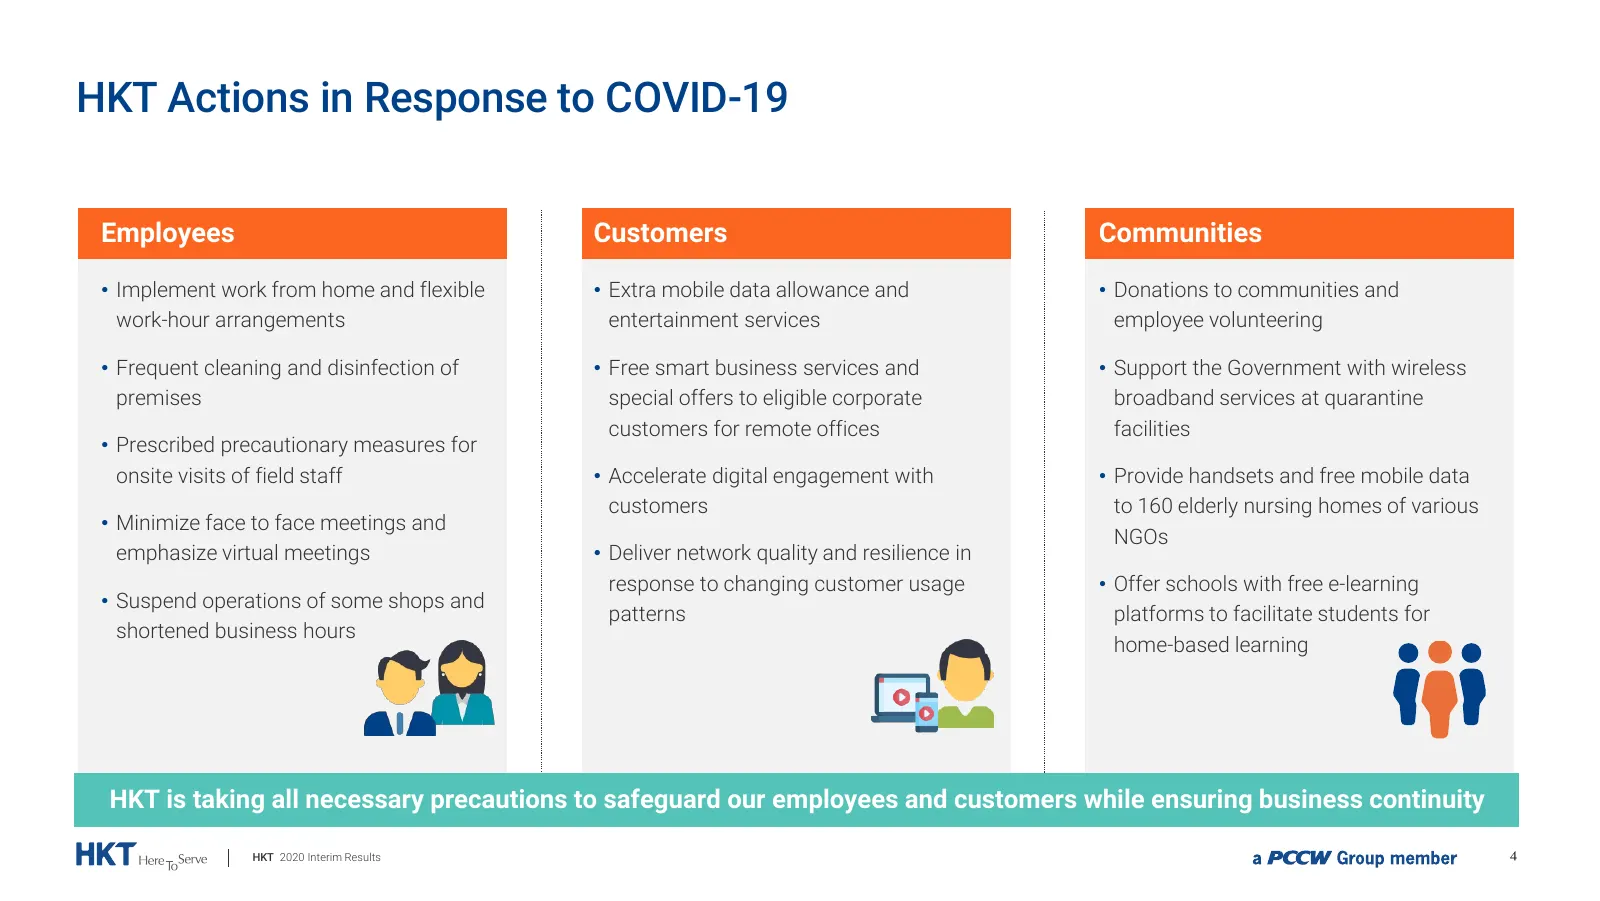
Slide 4: HKT Actions in Response to COVID-19
HKT Actions in Response to COVID-19 Employees Customers Communities • Implement work from home and flexible • Extra mobile data allowance and • Donations to communities and work-hour arrangements entertainment services employee volunteering • Frequent cleaning and disinfection of • Free smart busine
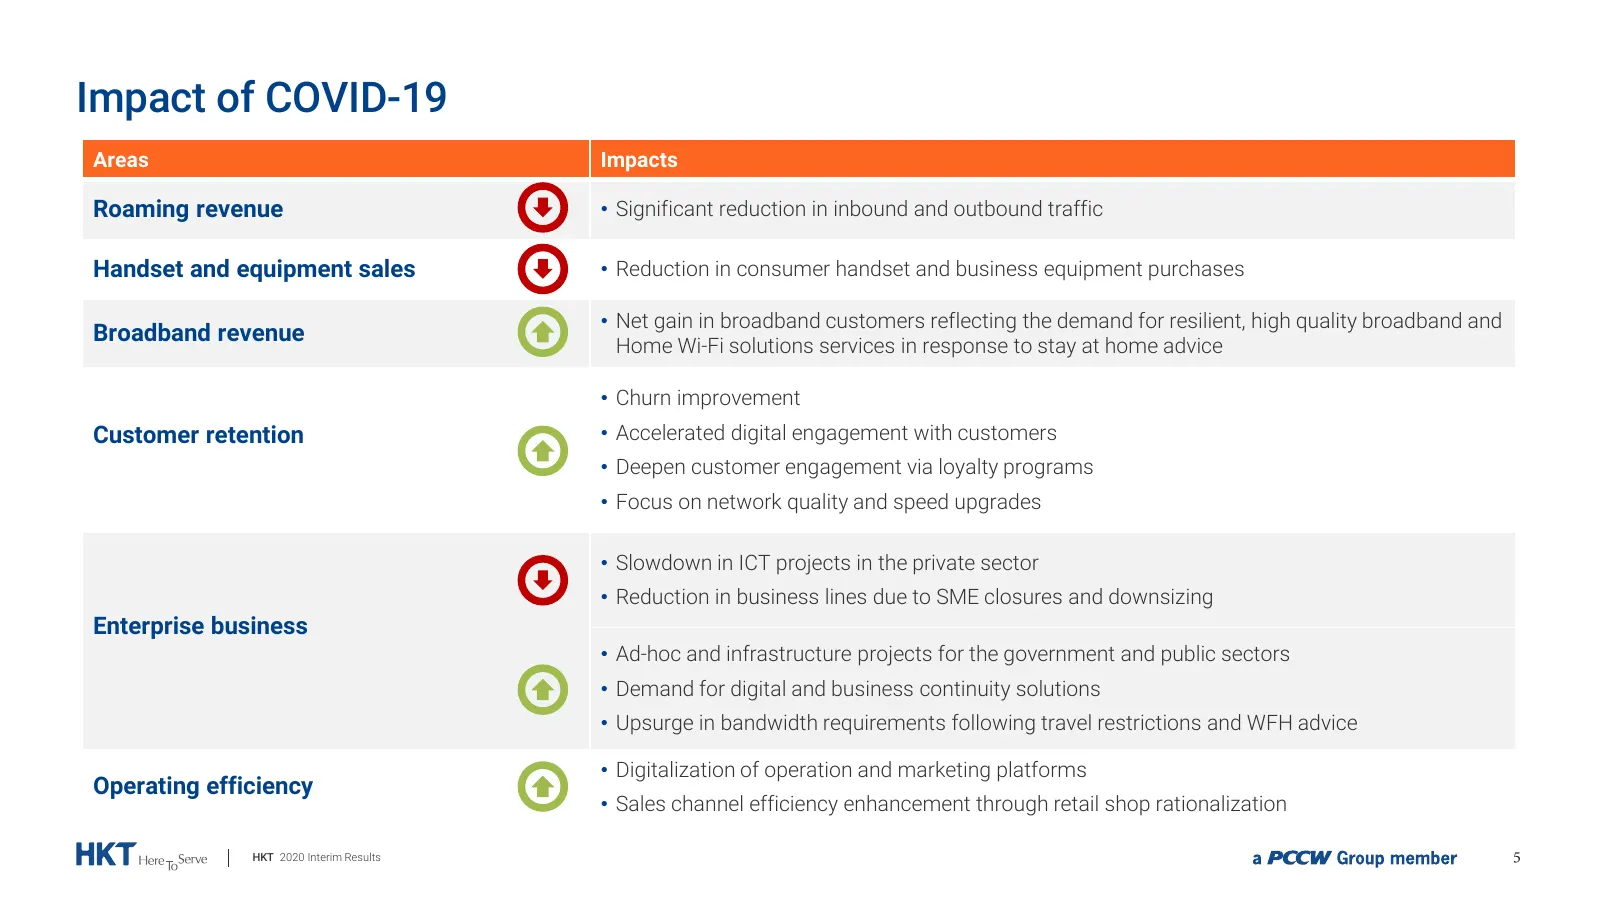
Slide 5: Impact of COVID-19
Impact of COVID-19 Areas Impacts Roaming revenue • Significant reduction in inbound and outbound traffic Handset and equipment sales • Reduction in consumer handset and business equipment purchases • Net gain in broadband customers reflecting the demand for resilient, high quality broadband and Broa
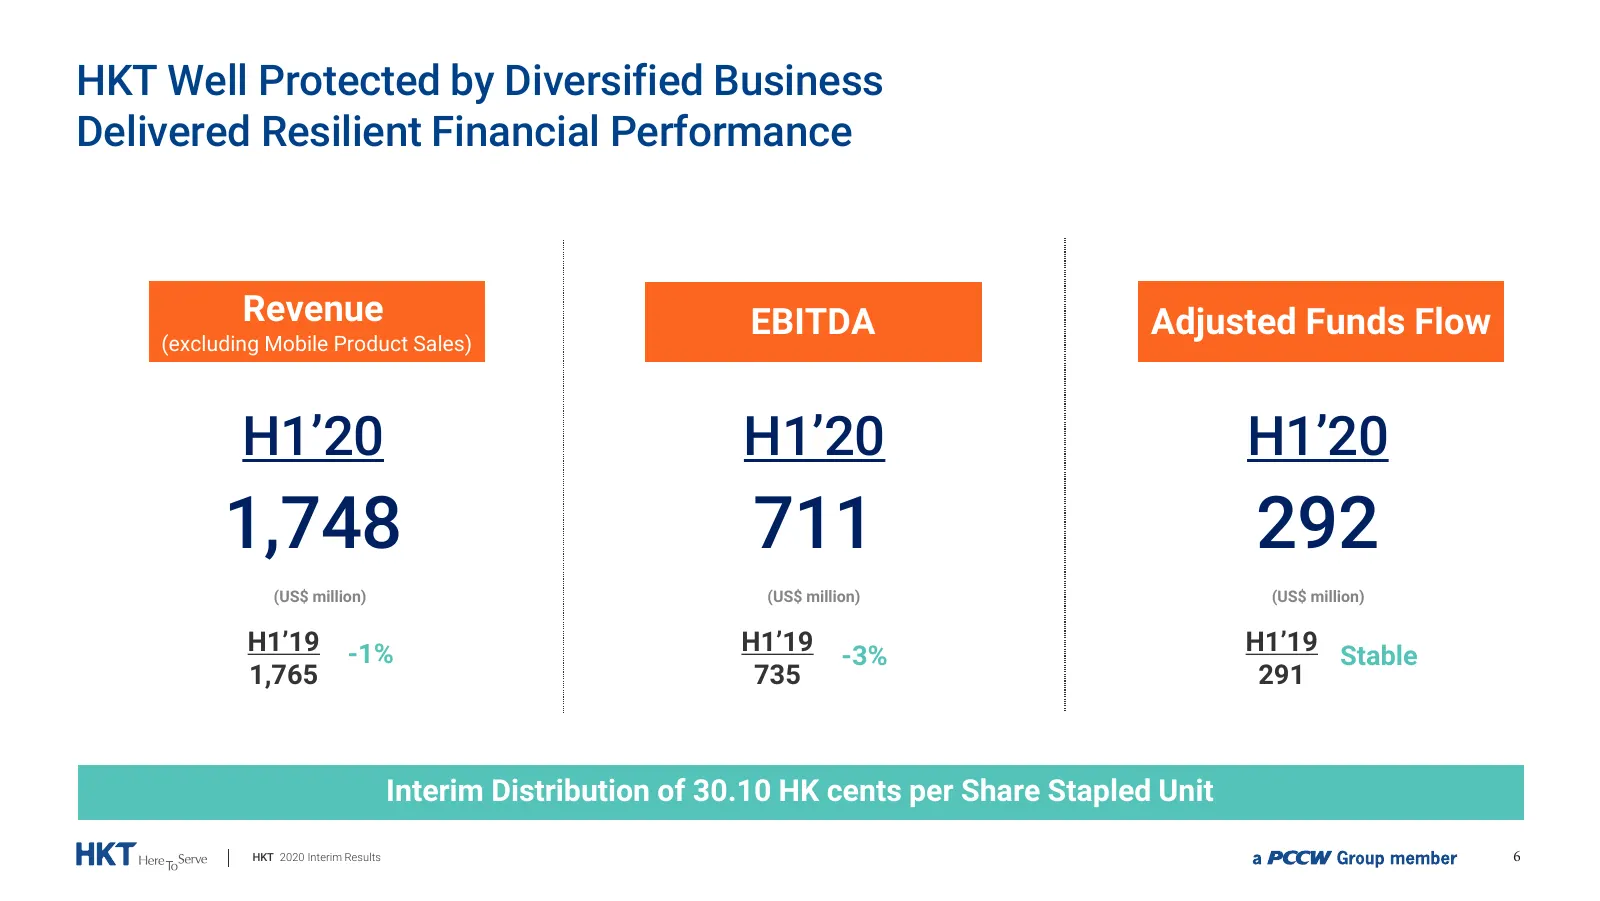
Slide 6: HKT Well Protected by Diversified Business Delivered Resilient Financial Performance
HKT Well Protected by Diversified Business Delivered Resilient Financial Performance Revenue EBITDA Adjusted Funds Flow (excluding Mobile Product Sales) H1’20 H1’20 H1’20 1,748 711 292 (US$ million) (US$ million) (US$ million) H1’19 -1% H1’19 H1’19 -3% Stable 1,765 735 291 Interim Distribution of 30
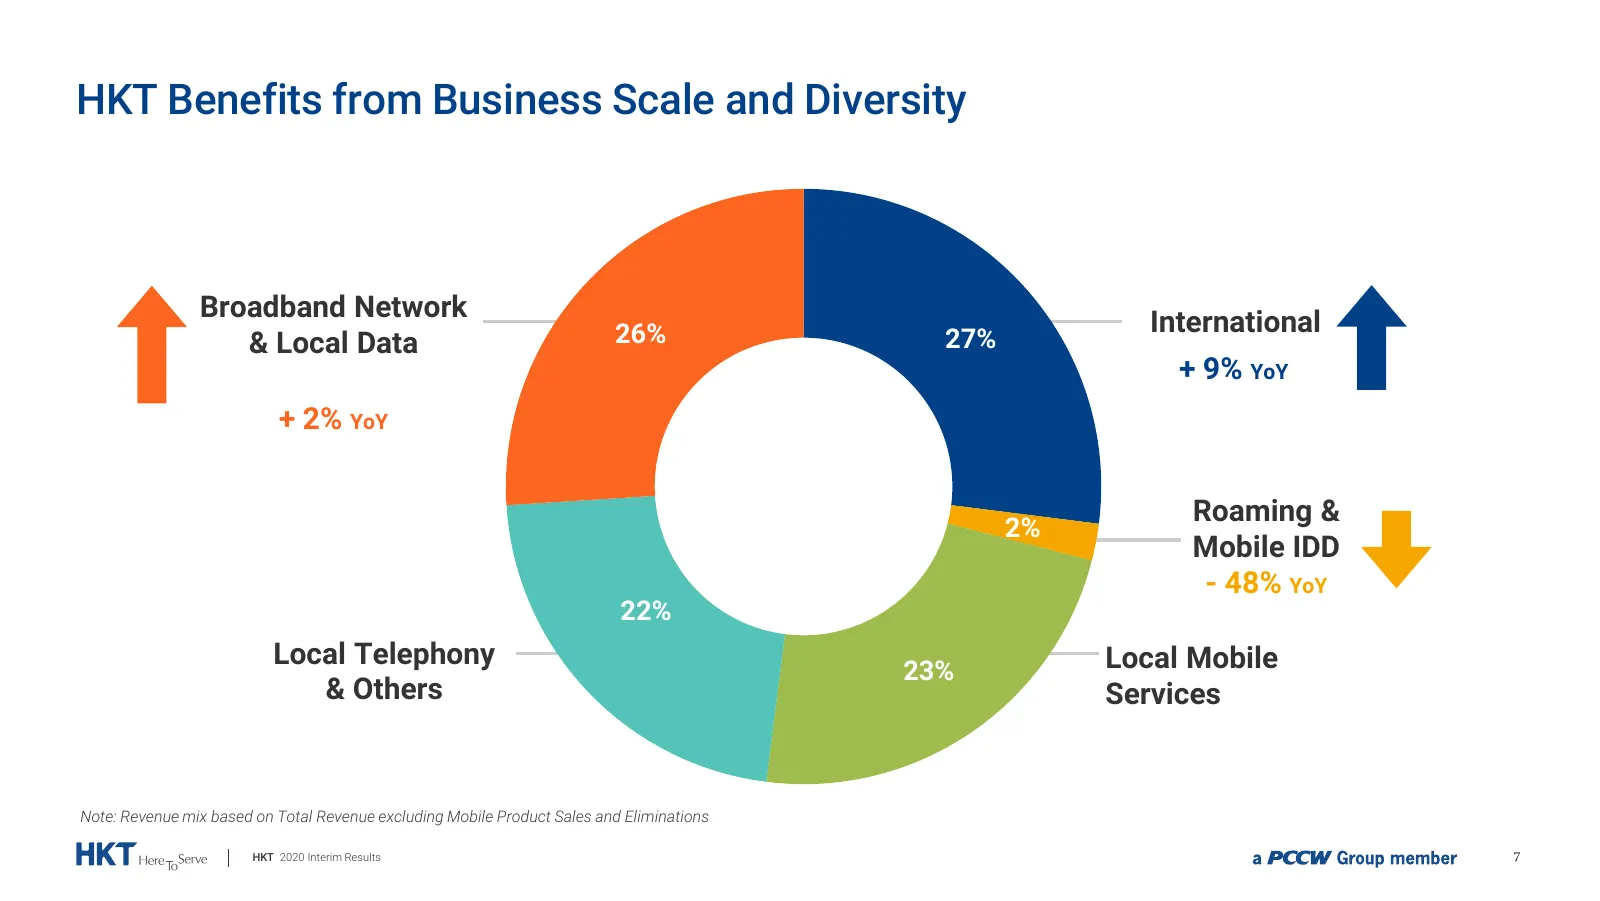
Slide 7: HKT Benefits from Business Scale and Diversity
HKT Benefits from Business Scale and Diversity Broadband Network International & Local Data 26% 27% + 9% YoY + 2% YoY Roaming & 2% Mobile IDD - 48% YoY 22% Local Telephony Local Mobile 23% & Others Services Note: Revenue mix based on Total Revenue excluding Mobile Product Sales and Eliminations HKT
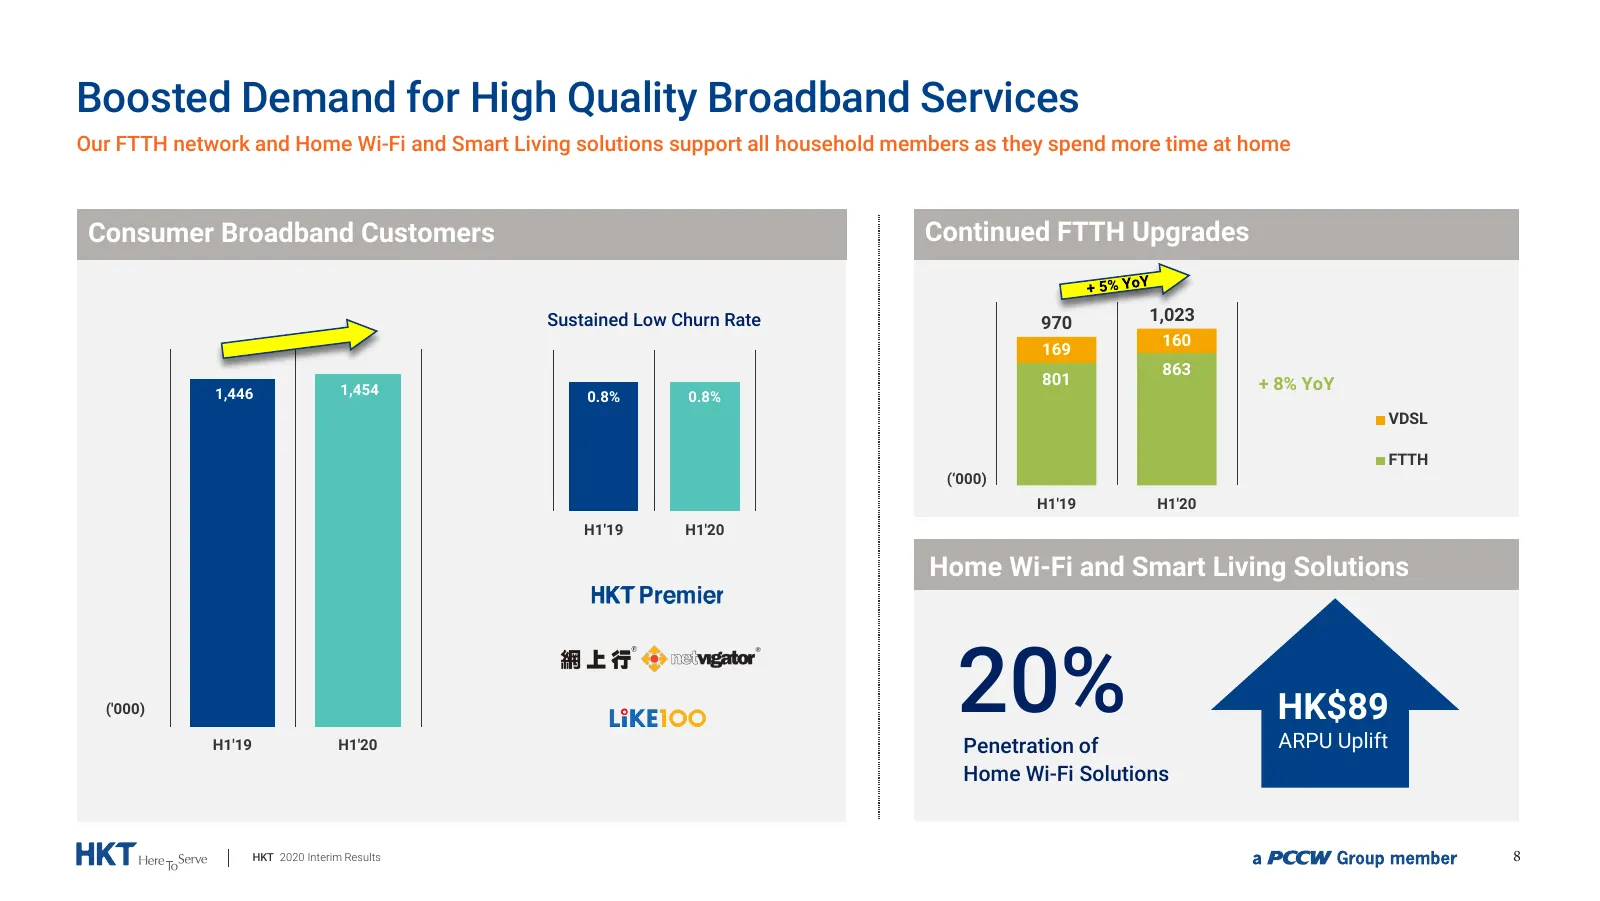
Slide 8: Boosted Demand for High Quality Broadband Services
Boosted Demand for High Quality Broadband Services Our FTTH network and Home Wi-Fi and Smart Living solutions support all household members as they spend more time at home Consumer Broadband Customers Continued FTTH Upgrades Sustained Low Churn Rate 970 1,023 160 169 863 801 + 8% YoY 1,446 1,454 0.8
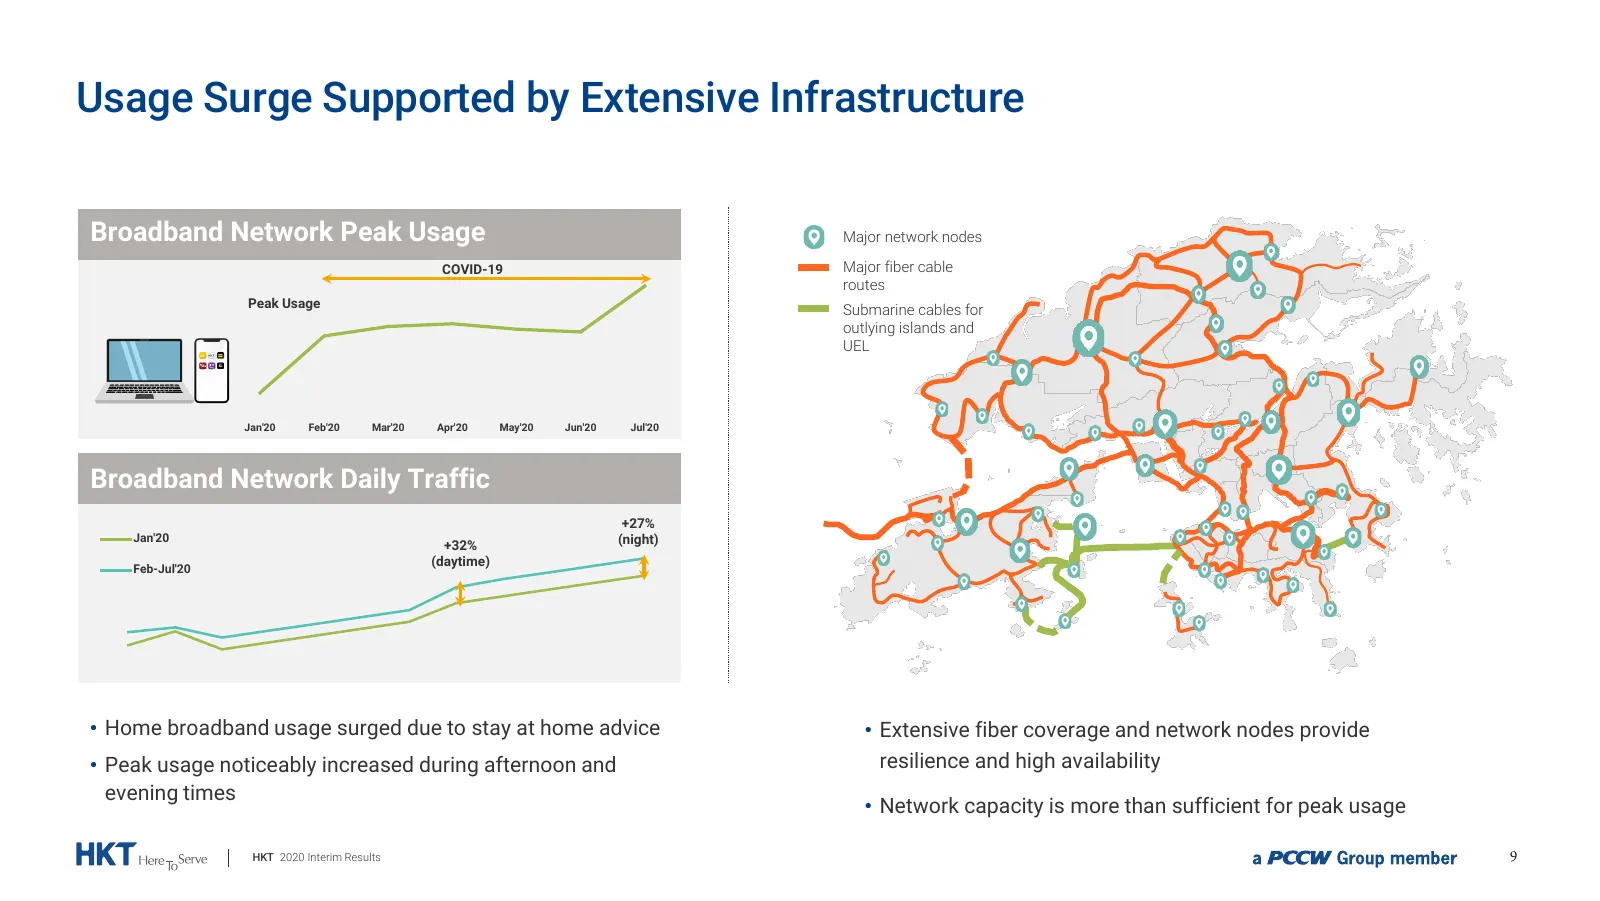
Slide 9: Usage Surge Supported by Extensive Infrastructure
Usage Surge Supported by Extensive Infrastructure Broadband Network Peak Usage Major network nodes COVID-19 Major fiber cable routes Peak Usage Submarine cables for outlying islands and UEL Jan'20 Feb'20 Mar'20 Apr'20 May'20 Jun'20 Jul'20 Broadband Network Daily Traffic +27% Jan'20 (night) +32% (day
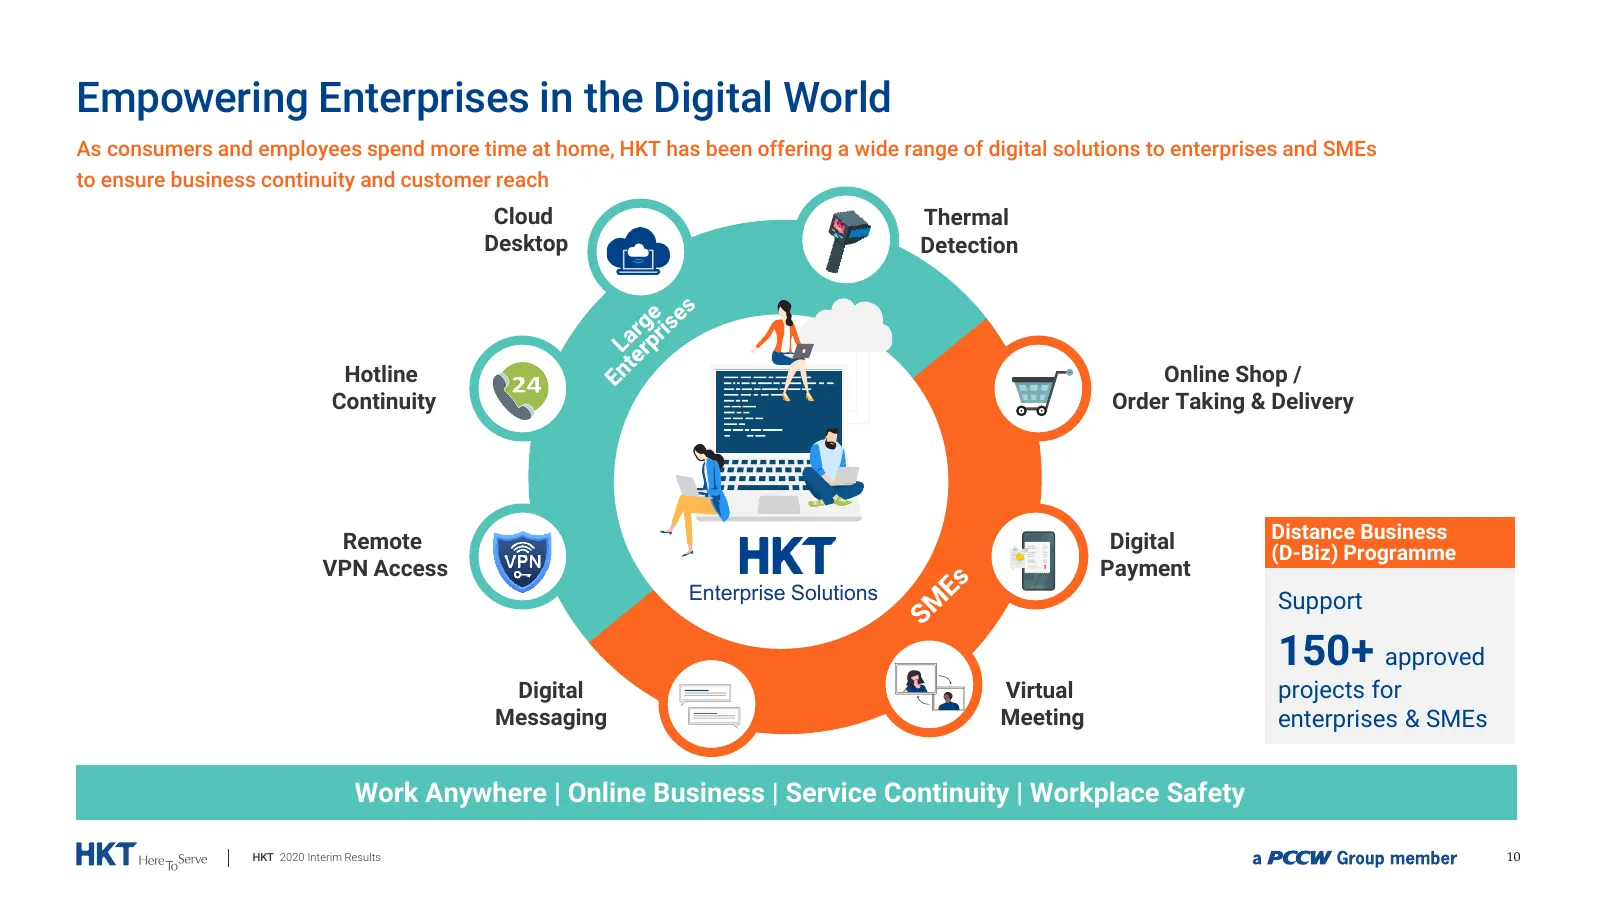
Slide 10: Empowering Enterprises in the Digital World
Empowering Enterprises in the Digital World As consumers and employees spend more time at home, HKT has been offering a wide range of digital solutions to enterprises and SMEs to ensure business continuity and customer reach Cloud Thermal Desktop Detection Hotline Online Shop / Continuity Order Taki
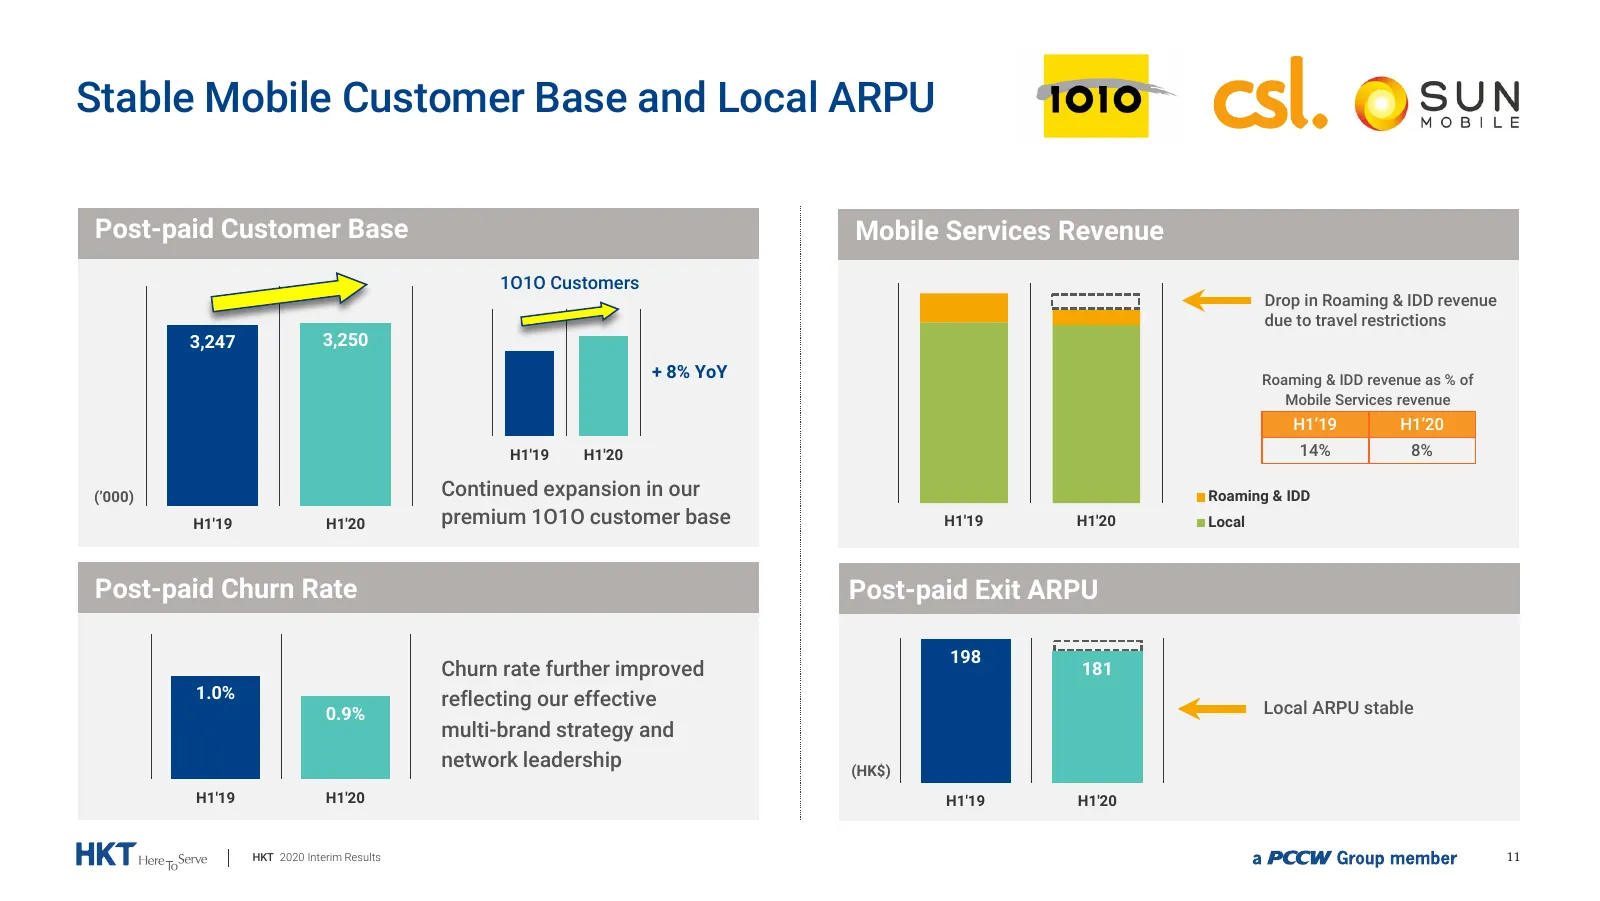
Slide 11: Stable Mobile Customer Base and Local ARPU
Stable Mobile Customer Base and Local ARPU Post-paid Customer Base Mobile Services Revenue 1O1O Customers Drop in Roaming & IDD revenue due to travel restrictions 3,247 3,250 + 8% YoY Roaming & IDD revenue as % of Mobile Services revenue H1’19 H1’20 H1'19 H1'20 14% 8% (’000) Continued expansion in o
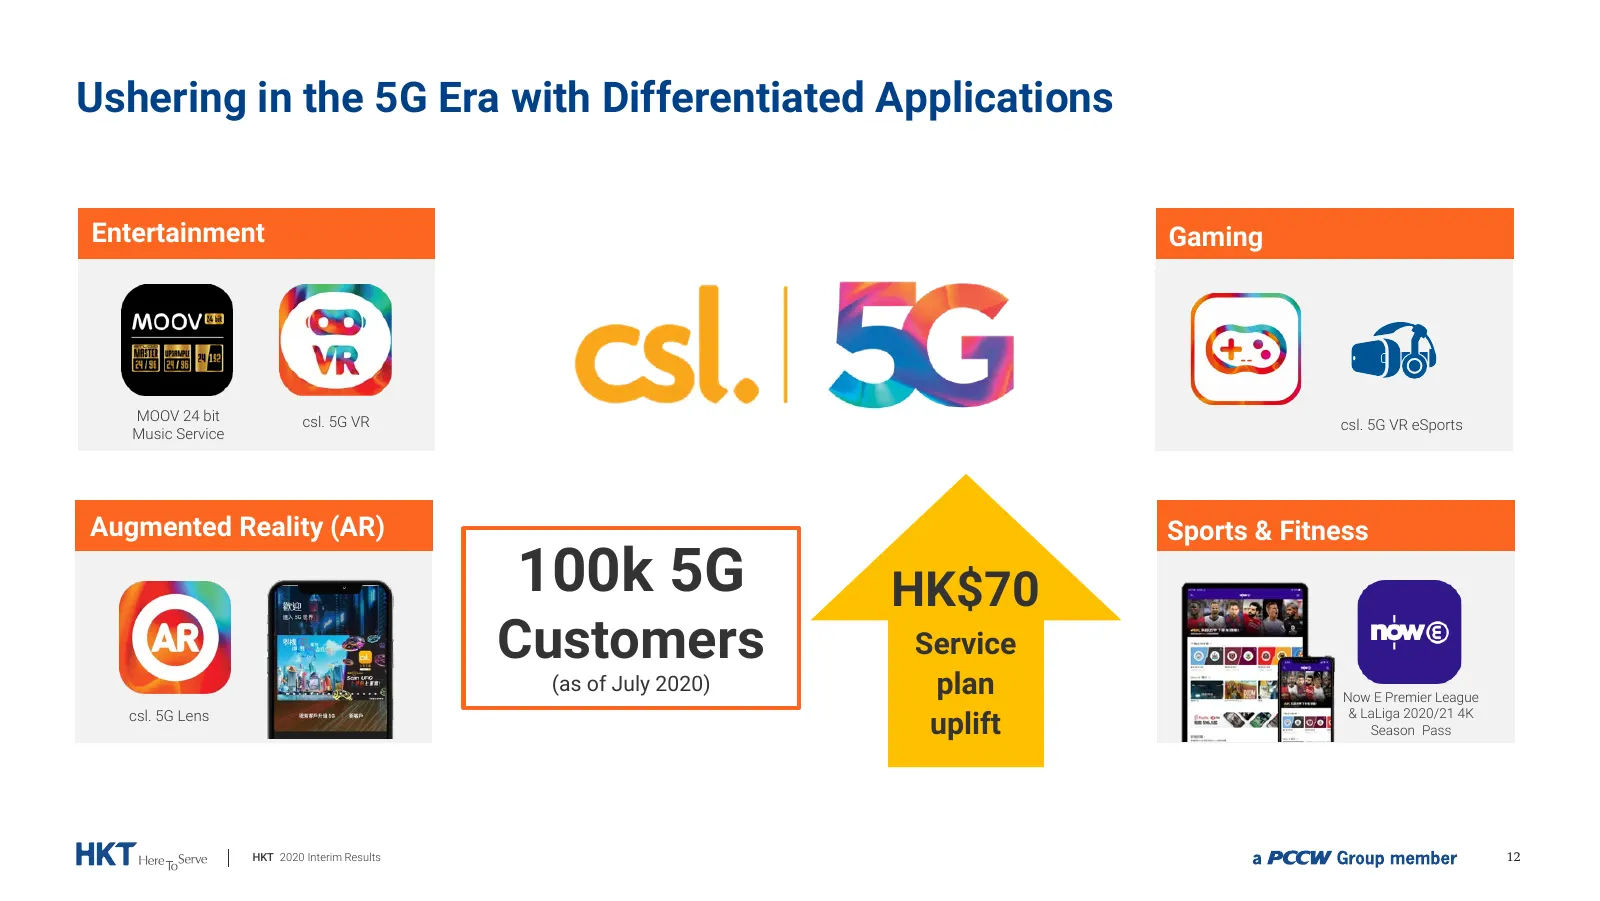
Slide 12: Ushering in the 5G Era with Differentiated Applications
Ushering in the 5G Era with Differentiated Applications Entertainment Gaming MOOV 24 bit csl. 5G VR csl. 5G VR eSports Music Service Augmented Reality (AR) Sports & Fitness 100k 5G HK$70 Customers Service (as of July 2020) plan Now E Premier League uplift csl. 5G Lens & LaLiga 2020/21 4K Season Pass
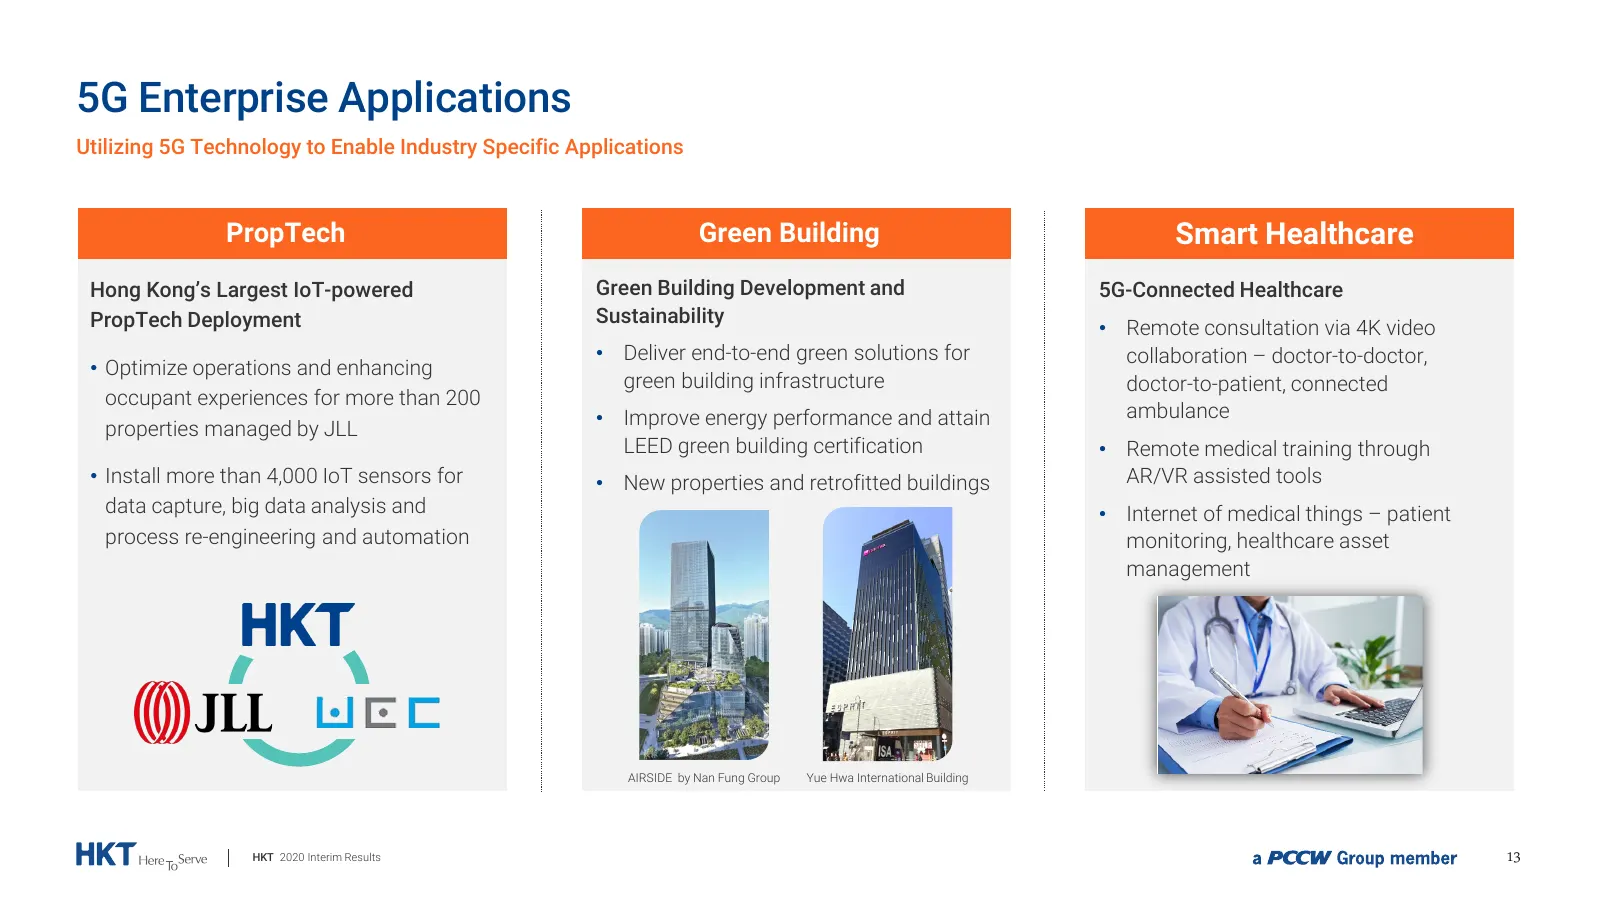
Slide 13: 5G Enterprise Applications
5G Enterprise Applications Utilizing 5G Technology to Enable Industry Specific Applications PropTech Green Building Smart Healthcare Hong Kong’s Largest IoT-powered Green Building Development and 5G-Connected Healthcare PropTech Deployment Sustainability • Remote consultation via 4K video • Deliver
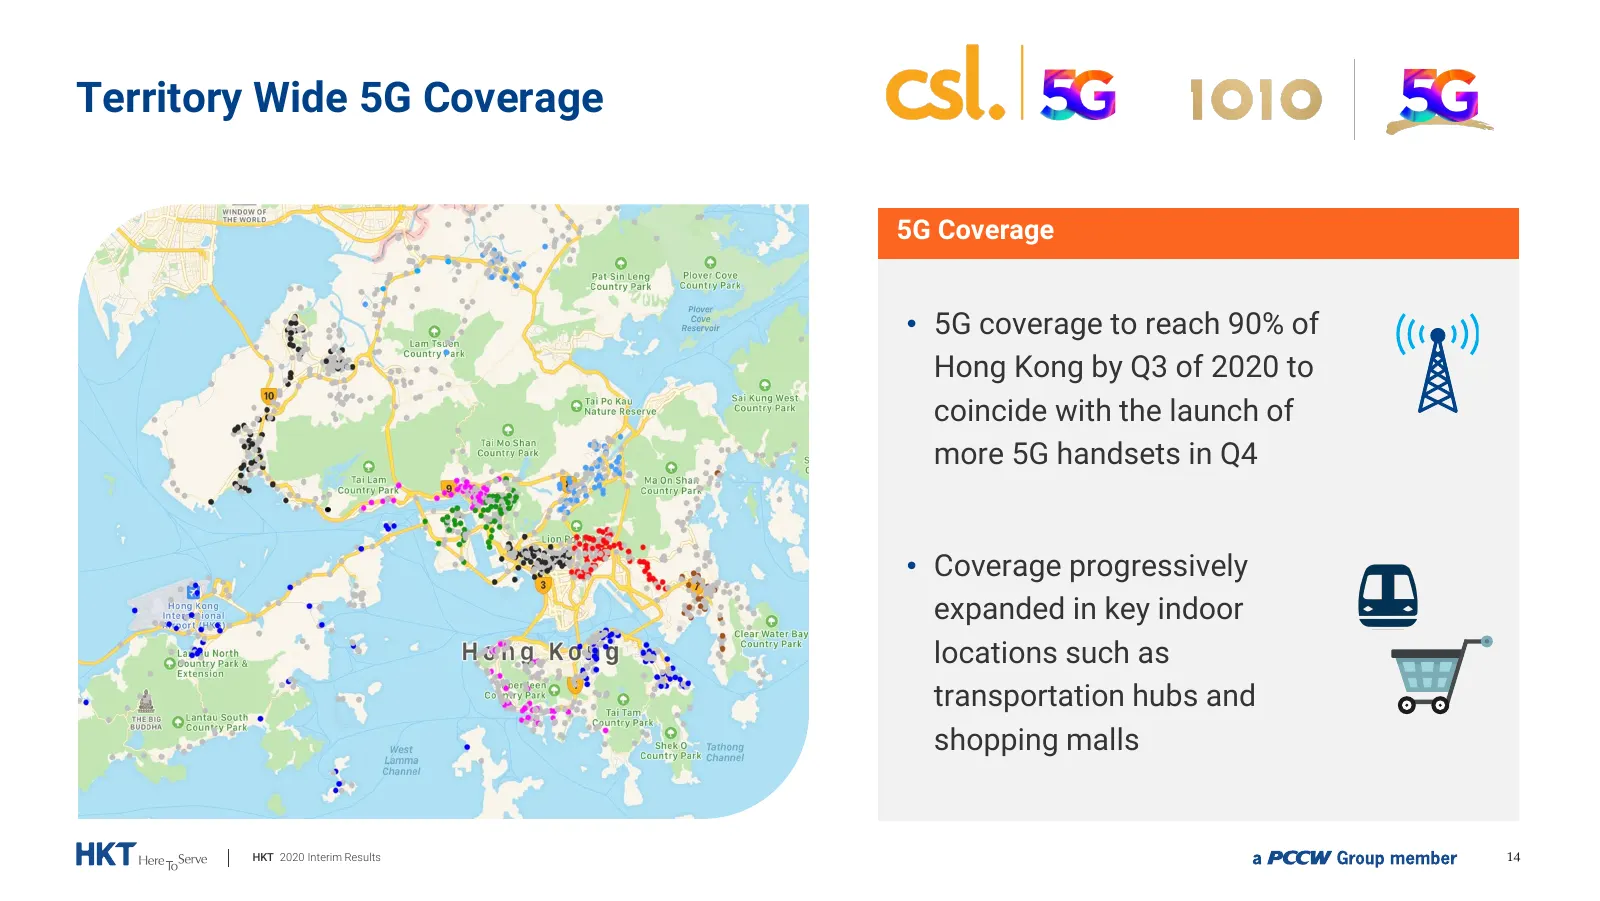
Slide 14: Territory Wide 5G Coverage
Territory Wide 5G Coverage 5G Coverage • 5G coverage to reach 90% of Hong Kong by Q3 of 2020 to coincide with the launch of more 5G handsets in Q4 • Coverage progressively expanded in key indoor locations such as transportation hubs and shopping malls HKT 2020 Interim Results 14
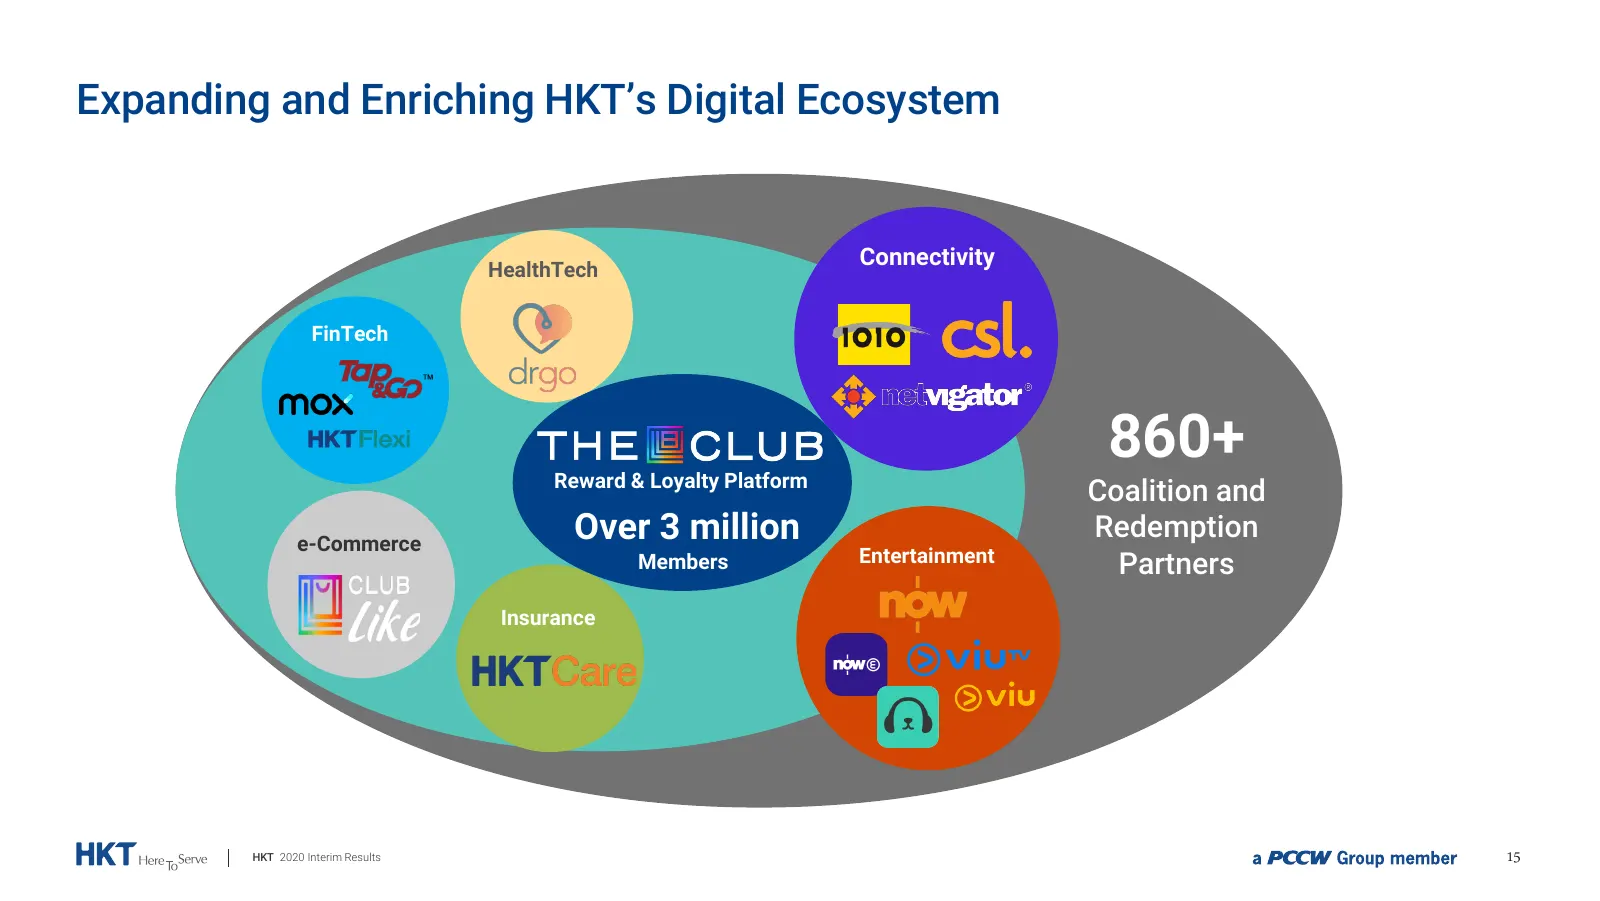
Slide 15: Expanding and Enriching HKT's Digital Ecosystem
Expanding and Enriching HKT’s Digital Ecosystem HealthTech Connectivity FinTech 860+ Reward & Loyalty Platform Coalition and e-Commerce Over 3 million Redemption Members Entertainment Partners Insurance HKT 2020 Interim Results 15
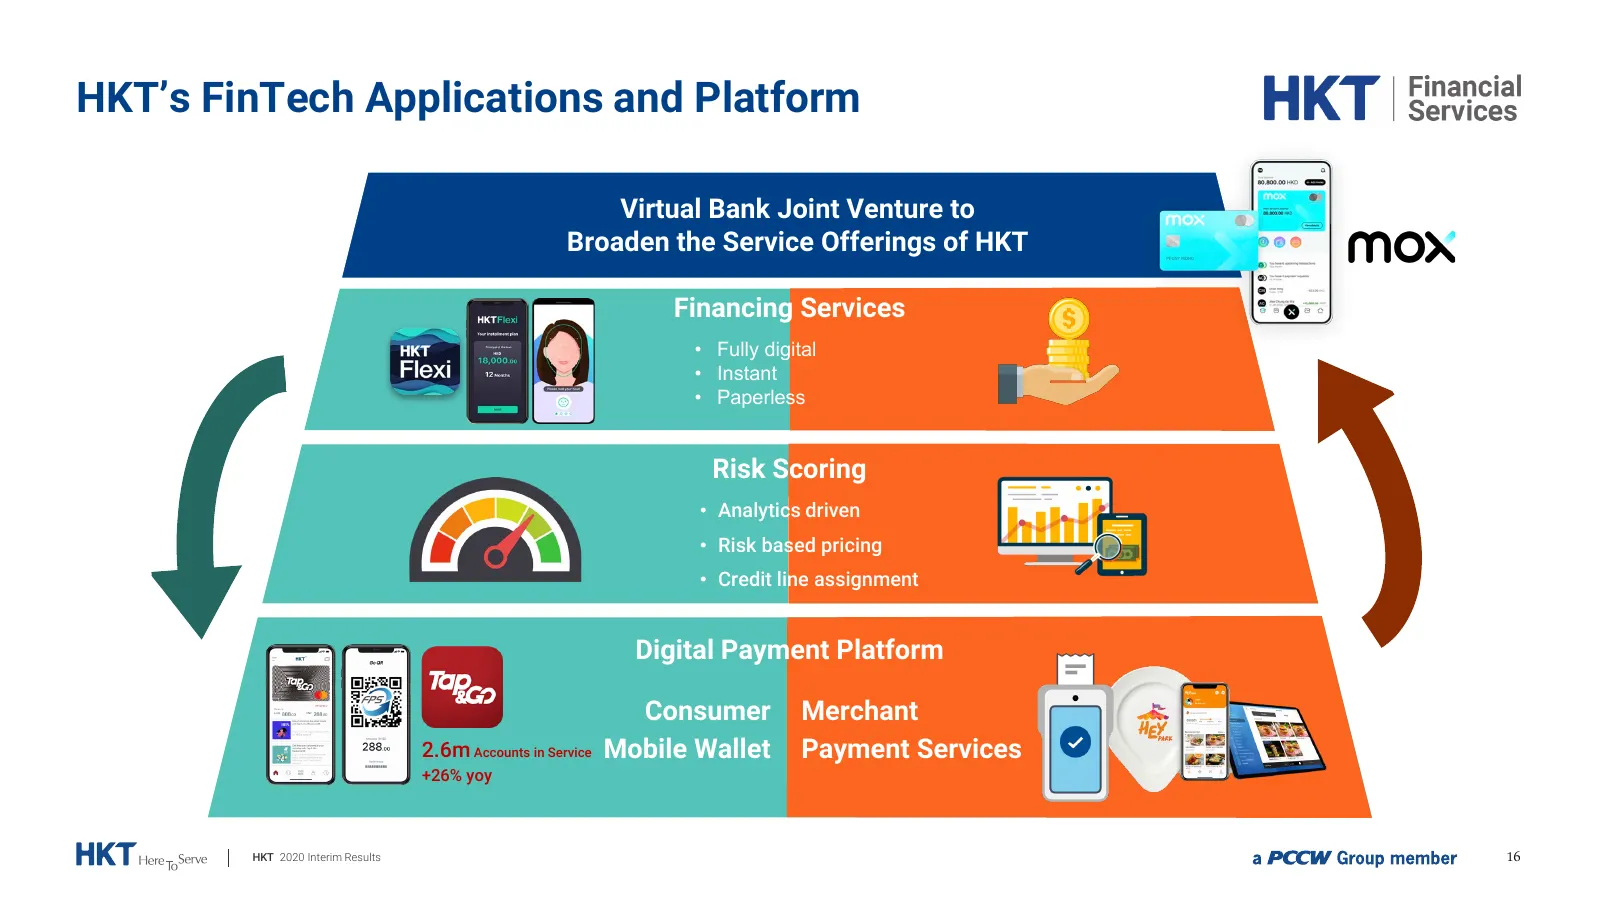
Slide 16: HKT's FinTech Applications and Platform
HKT’s FinTech Applications and Platform Virtual Bank Joint Venture to Broaden the Service Offerings of HKT Financing Services • Fully digital • Instant • Paperless Risk Scoring • Analytics driven • Risk based pricing • Credit line assignment Digital Payment Platform Consumer Merchant 2.6m Accounts i
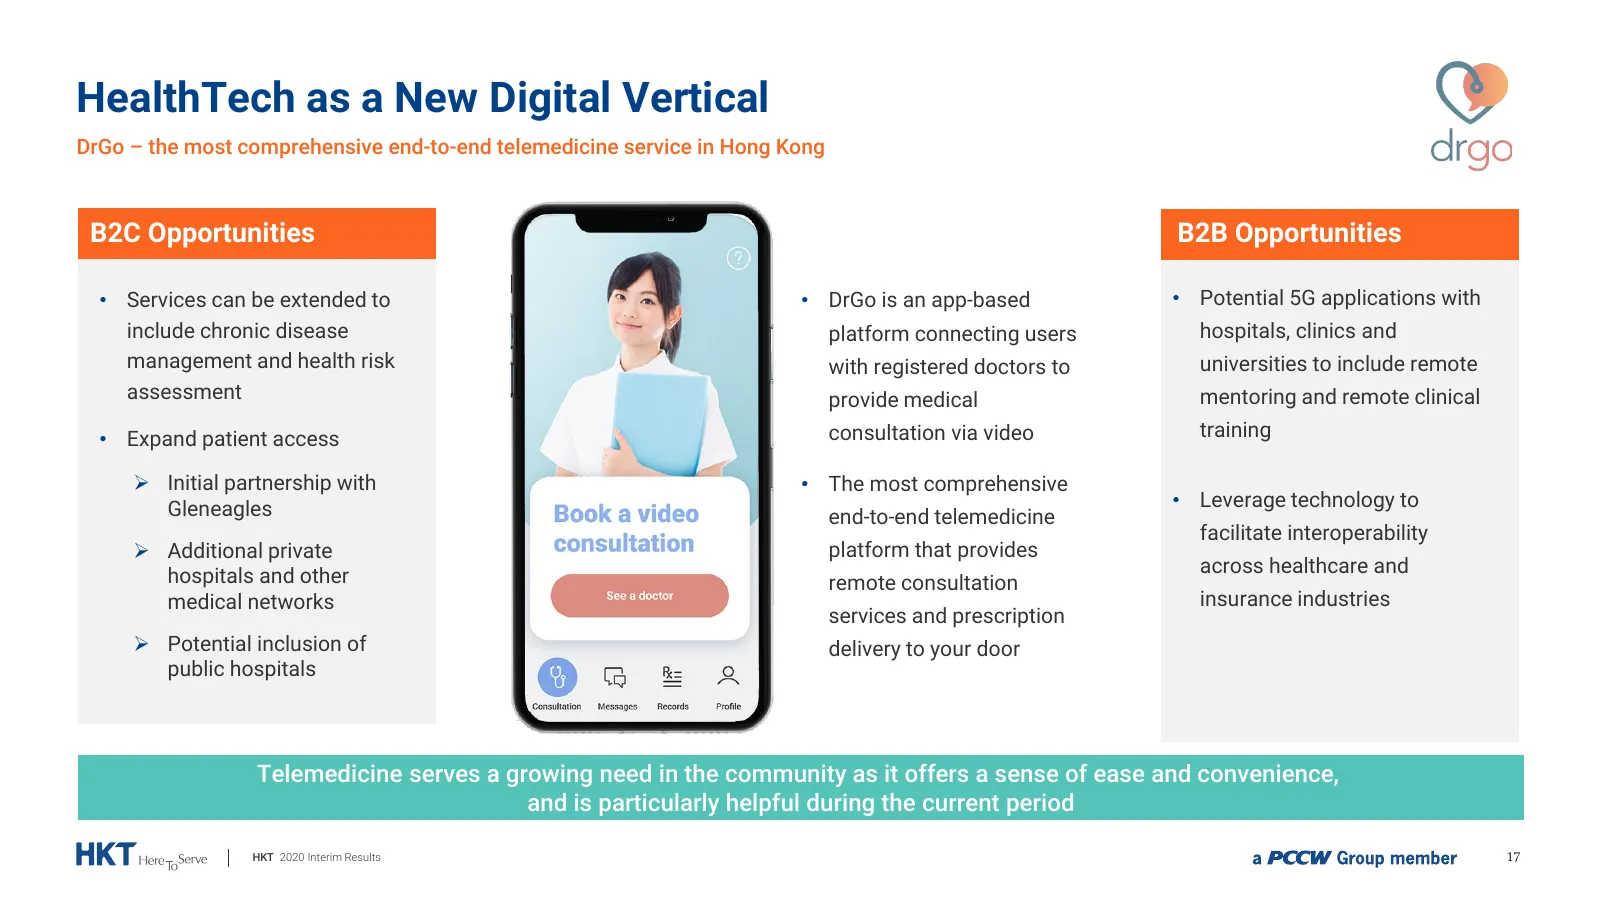
Slide 17: HealthTech as a New Digital Vertical
HealthTech as a New Digital Vertical DrGo – the most comprehensive end-to-end telemedicine service in Hong Kong B2C Opportunities B2B Opportunities • Services can be extended to • DrGo is an app-based • Potential 5G applications with include chronic disease platform connecting users hospitals, clini
Slide 18: Highlights
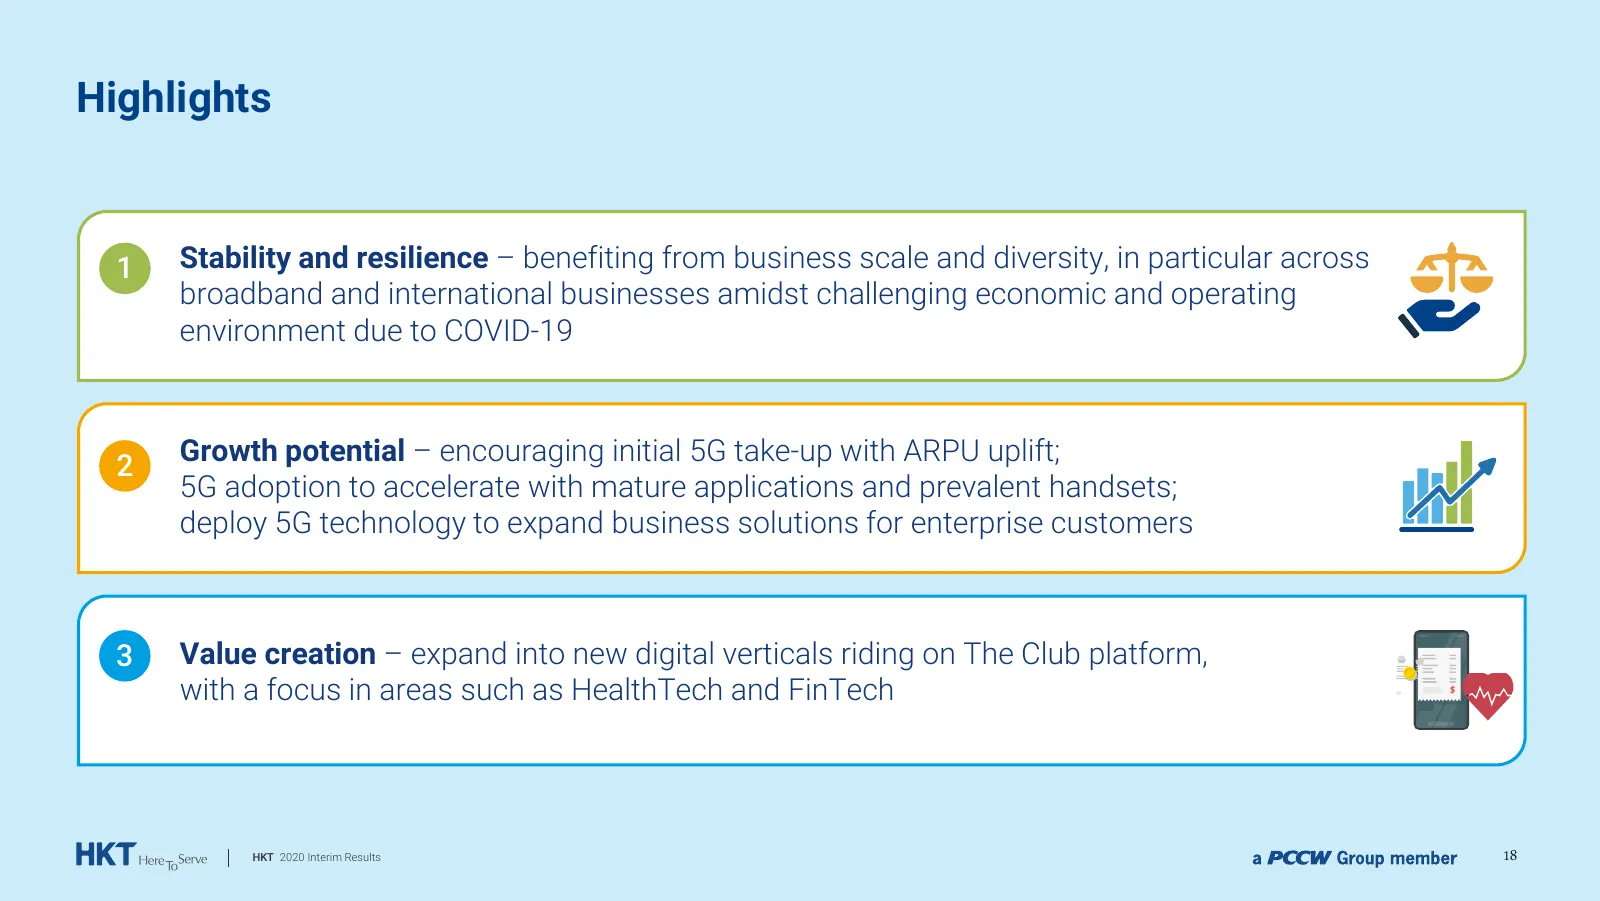
Highlights 1 Stability and resilience – benefiting from business scale and diversity, in particular across broadband and international businesses amidst challenging economic and operating environment due to COVID-19 Growth potential – encouraging initial 5G take-up with ARPU uplift; 2 5G adoption to
Slide 19: Financial Review
Financial Review Evan Wong Chief Financial Officer 19
Slide 20: HKT Well Protected by Diversified Business Delivered Resilient Financial Performance
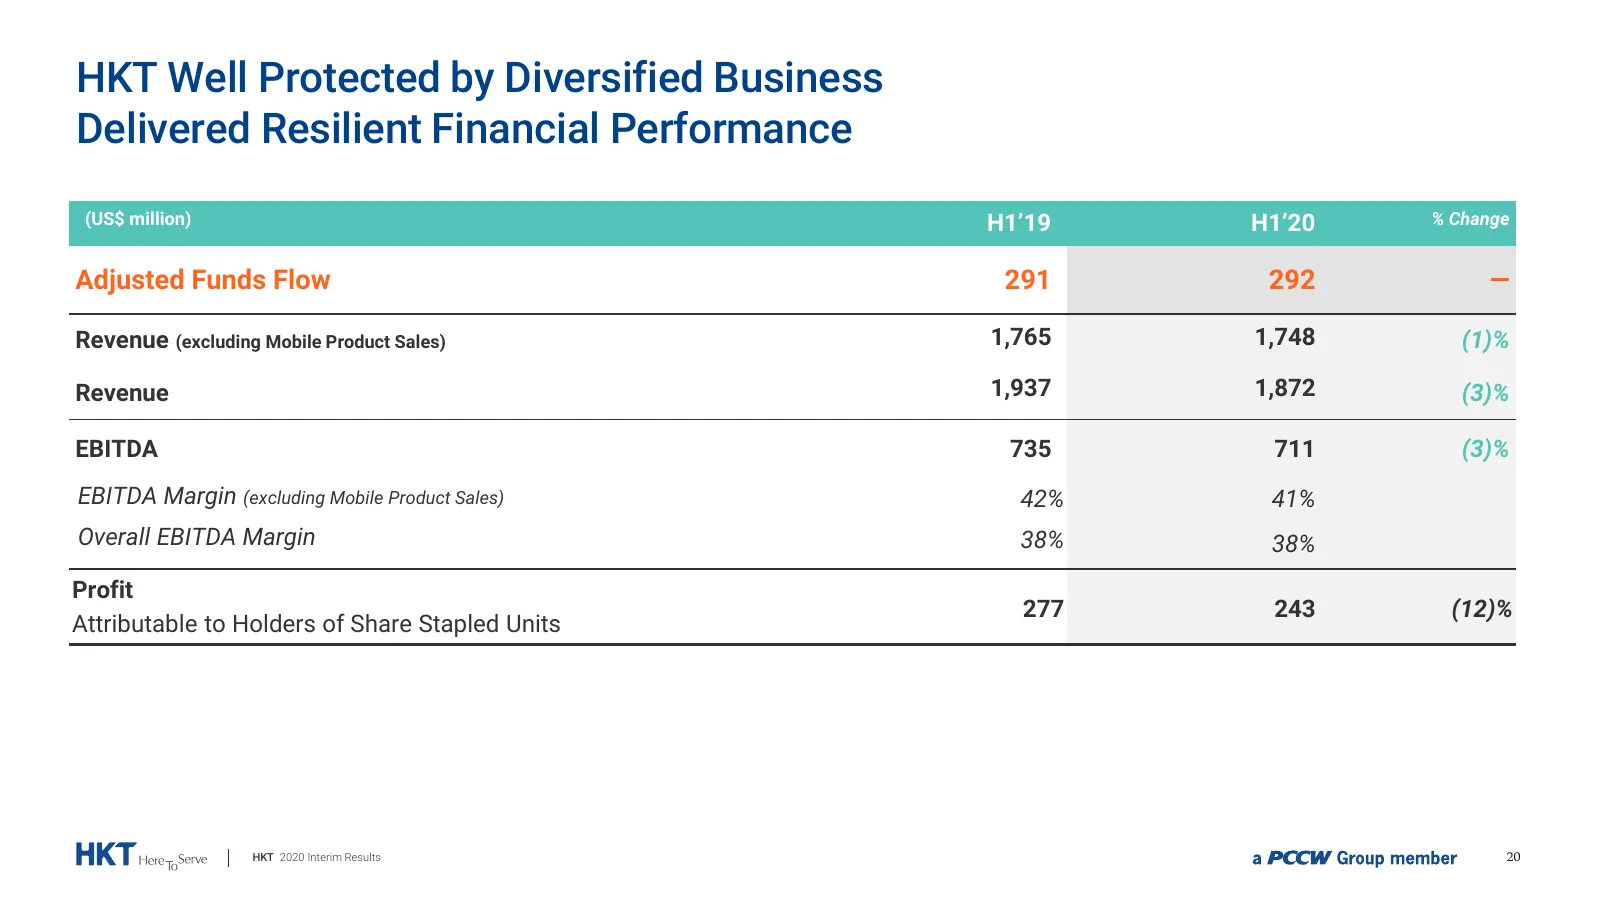
HKT Well Protected by Diversified Business Delivered Resilient Financial Performance (US$ million) H1’19 H1’20 % Change Adjusted Funds Flow 291 292 ― Revenue (excluding Mobile Product Sales) 1,765 1,748 (1)% Revenue 1,937 1,872 (3)% EBITDA 735 711 (3)% EBITDA Margin (excluding Mobile Product Sales)
Slide 21: TSS Benefits from Business Resilience and Diversity
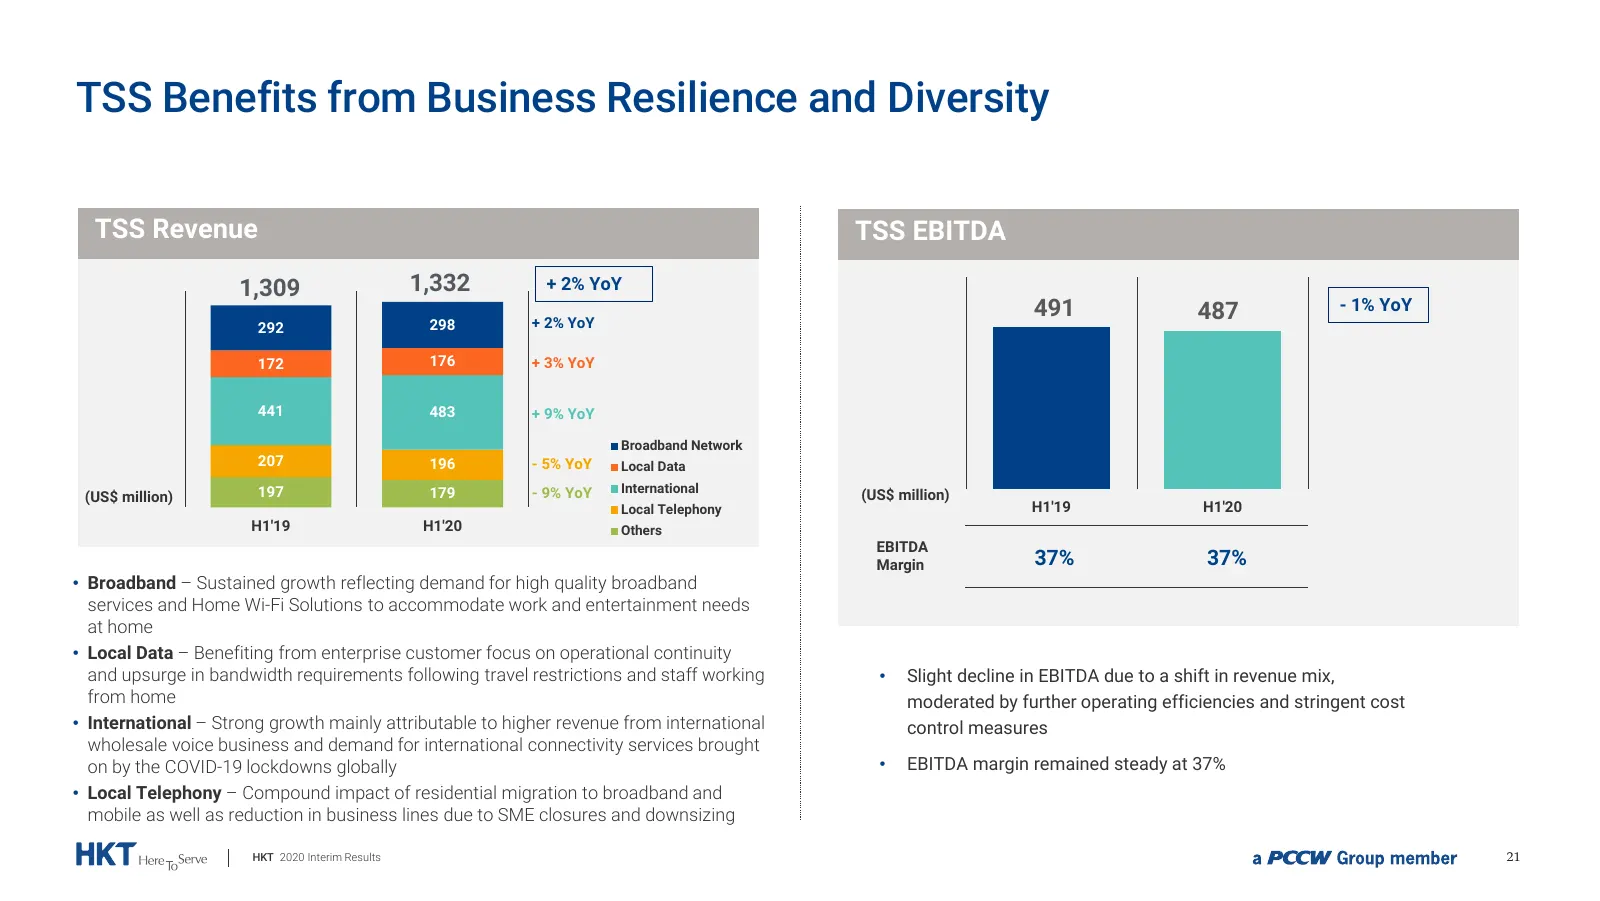
TSS Benefits from Business Resilience and Diversity TSS Revenue TSS EBITDA 1,309 1,332 + 2% YoY 491 487 - 1% YoY 292 298 + 2% YoY 172 176 + 3% YoY 441 483 + 9% YoY Broadband Network 207 196 - 5% YoY Local Data 197 179 - 9% YoY International (US$ million) (US$ million) Local Telephony H1'19 H1'20 H1'
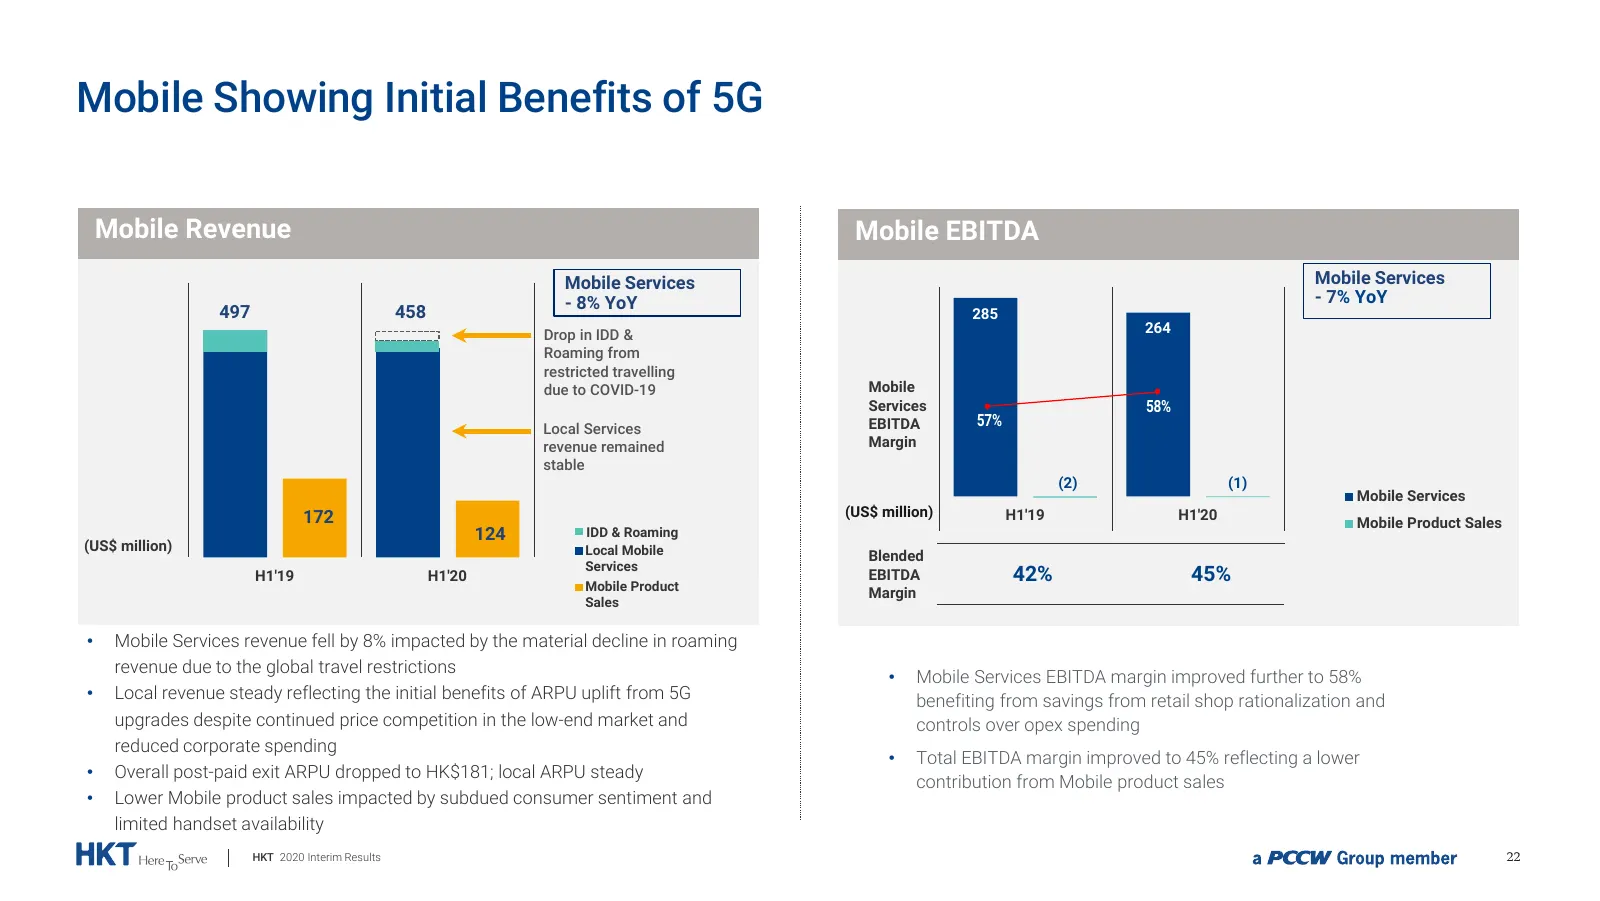
Slide 22: Mobile Showing Initial Benefits of 5G
Mobile Showing Initial Benefits of 5G Mobile Revenue Mobile EBITDA Mobile Services Mobile Services - 8% YoY - 7% YoY 497 458 285 Drop in IDD & 264 Roaming from restricted travelling due to COVID-19 Mobile Services 58% Local Services EBITDA 57% revenue remained Margin stable (2) (1) Mobile Services 1
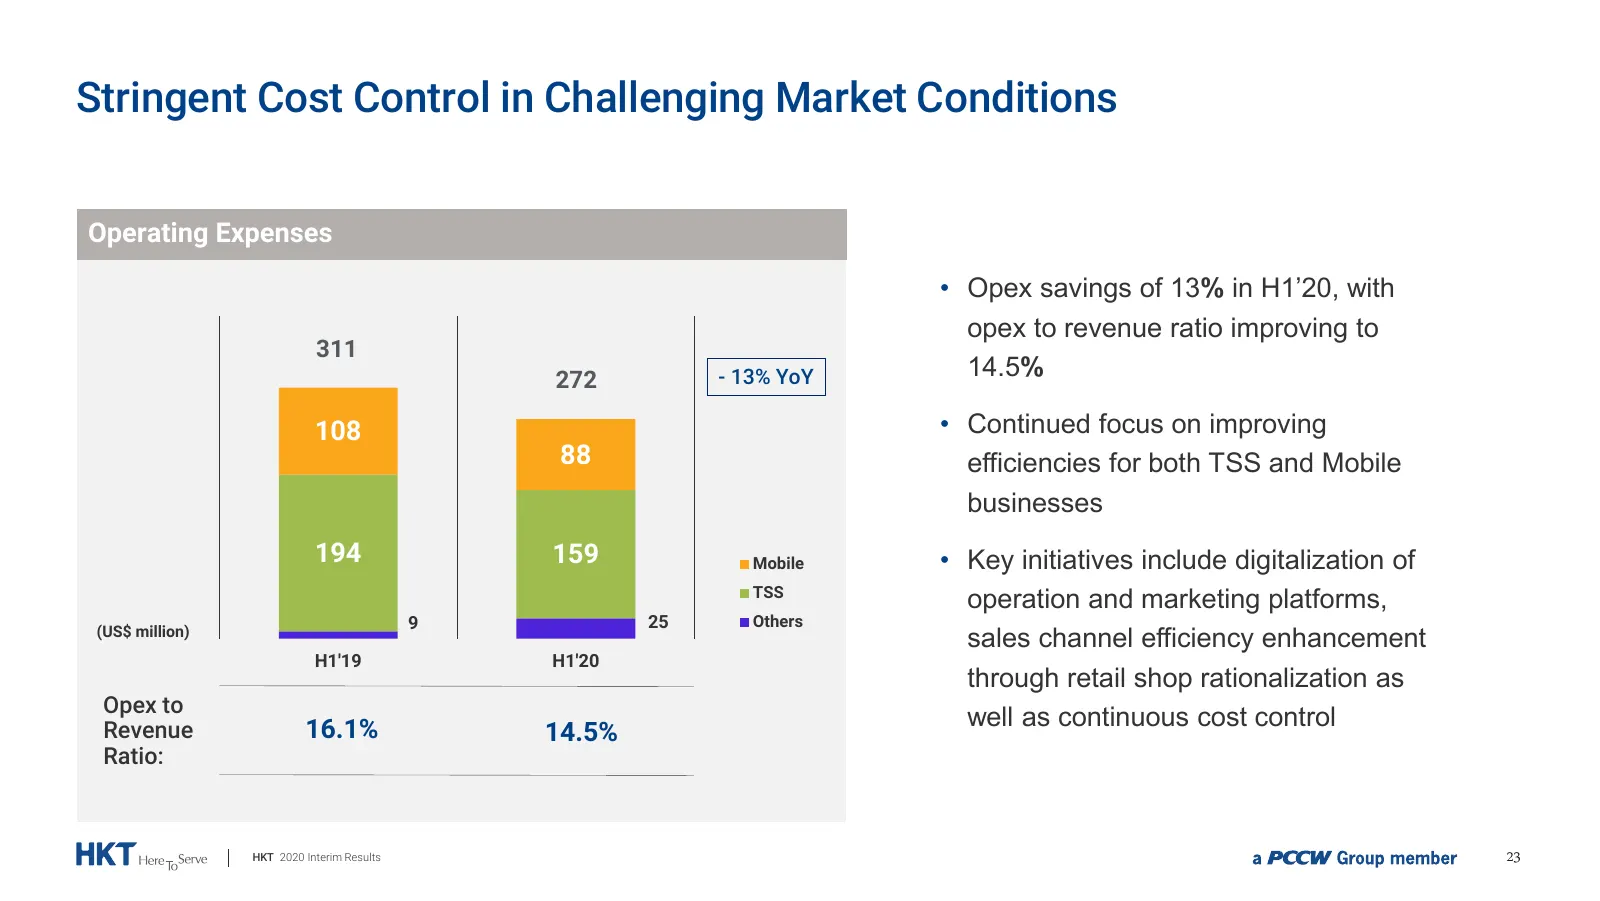
Slide 23: Stringent Cost Control in Challenging Market Conditions
Stringent Cost Control in Challenging Market Conditions Operating Expenses • Opex savings of 13% in H1’20, with opex to revenue ratio improving to 311 272 - 13% YoY 14.5% 108 • Continued focus on improving 88 efficiencies for both TSS and Mobile businesses 194 159 Mobile • Key initiatives include di
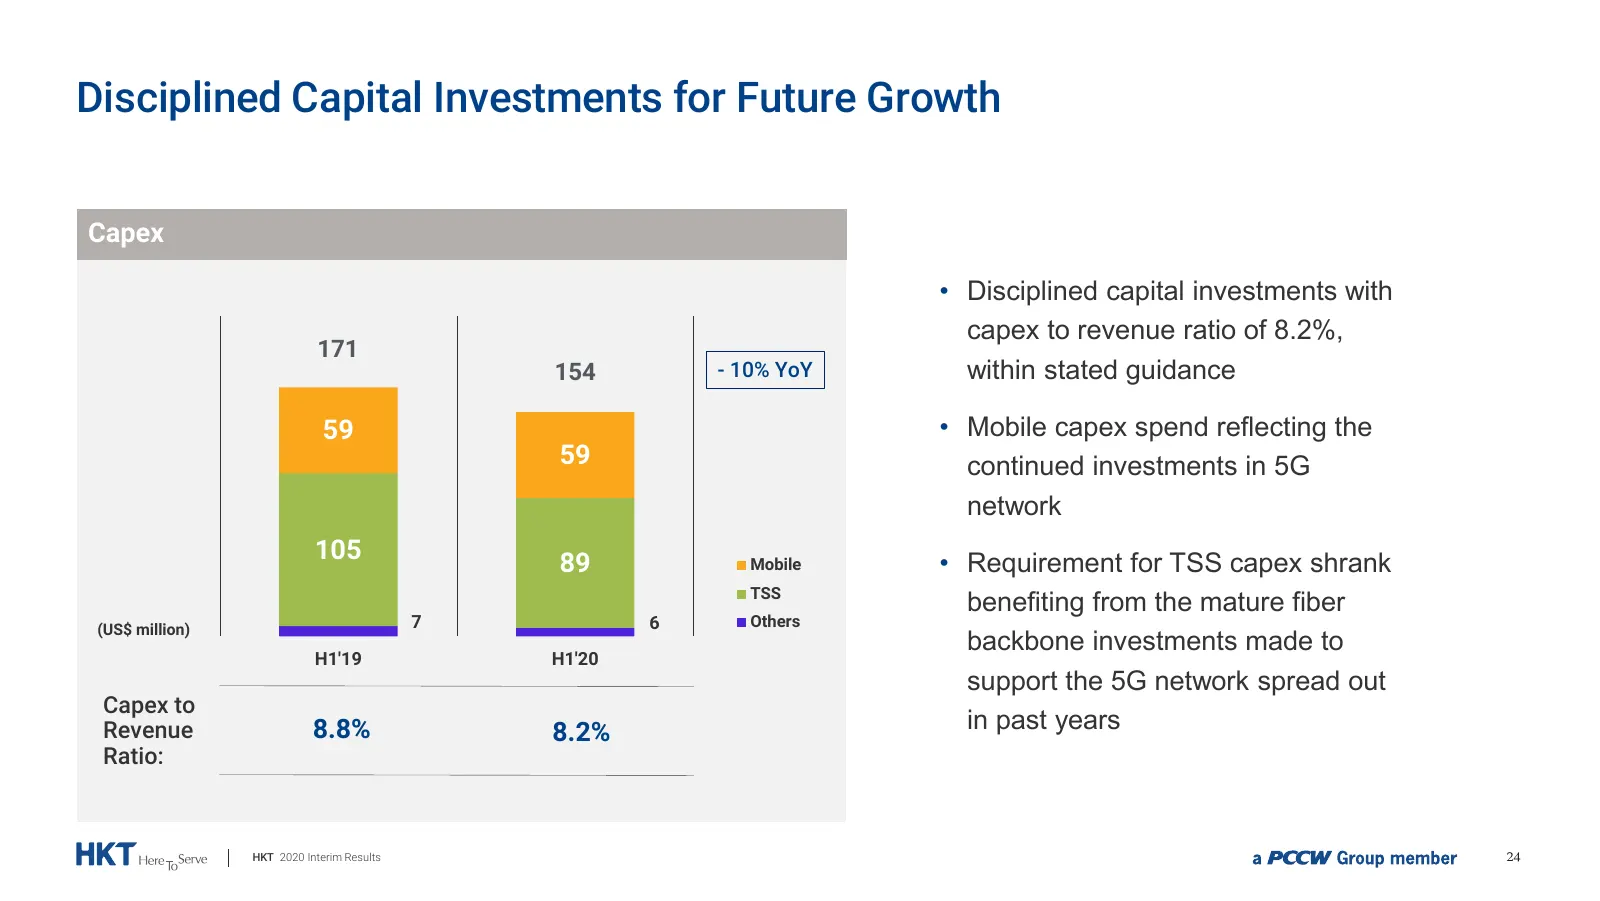
Slide 24: Disciplined Capital Investments for Future Growth
Disciplined Capital Investments for Future Growth Capex • Disciplined capital investments with capex to revenue ratio of 8.2%, 171 154 - 10% YoY within stated guidance 59 • Mobile capex spend reflecting the 59 continued investments in 5G network 105 89 Mobile • Requirement for TSS capex shrank TSS b
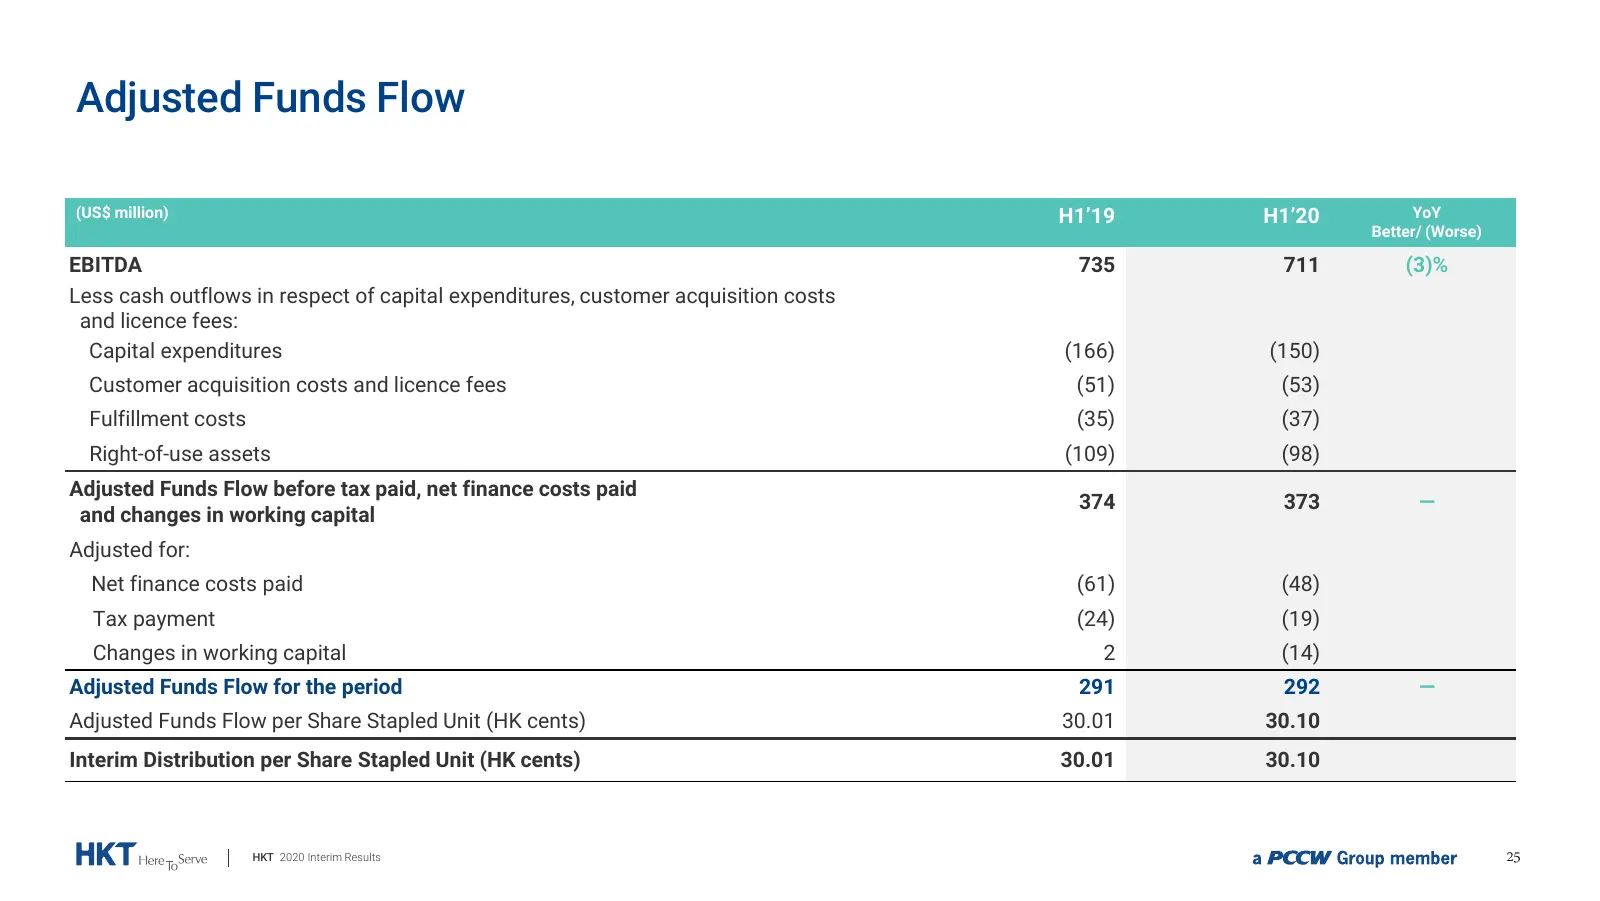
Slide 25: Adjusted Funds Flow
Adjusted Funds Flow (US$ million) H1’19 H1’20 YoY Better/ (Worse) EBITDA 735 711 (3)% Less cash outflows in respect of capital expenditures, customer acquisition costs and licence fees: Capital expenditures (166) (150) Customer acquisition costs and licence fees (51) (53) Fulfillment costs (35) (37)
Slide 26: Income Statement
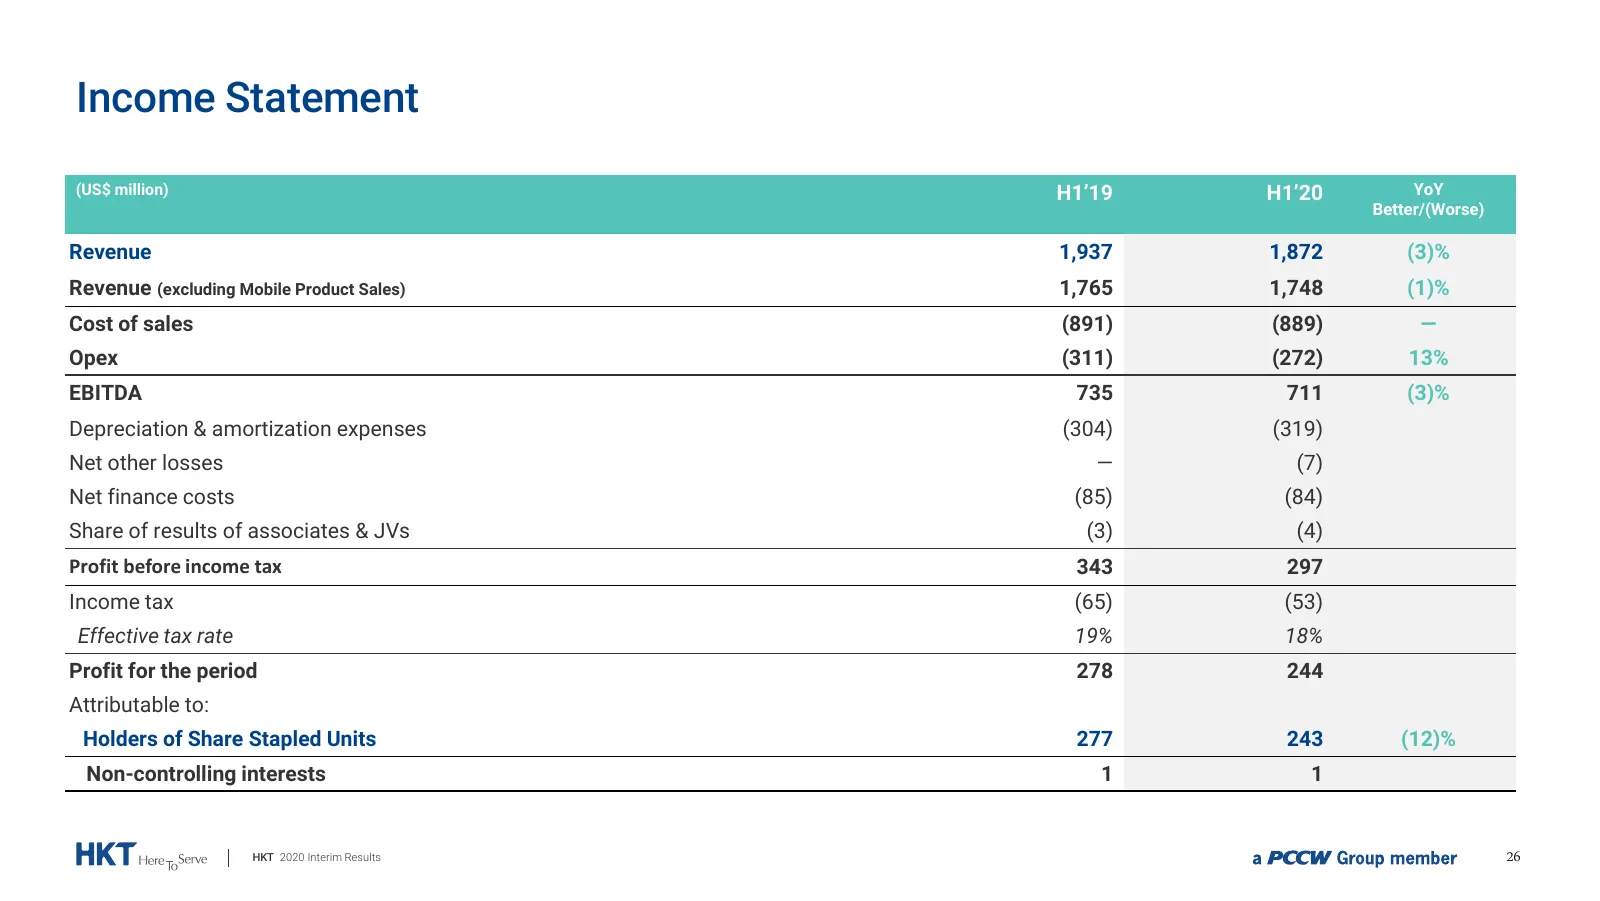
Income Statement (US$ million) H1’19 H1’20 YoY Better/(Worse) Revenue 1,937 1,872 (3)% Revenue (excluding Mobile Product Sales) 1,765 1,748 (1)% Cost of sales (891) (889) ― Opex (311) (272) 13% EBITDA 735 711 (3)% Depreciation & amortization expenses (304) (319) Net other losses ― (7) Net finance co
Slide 27: Solid Financial Position Investment Grade Credit Ratings
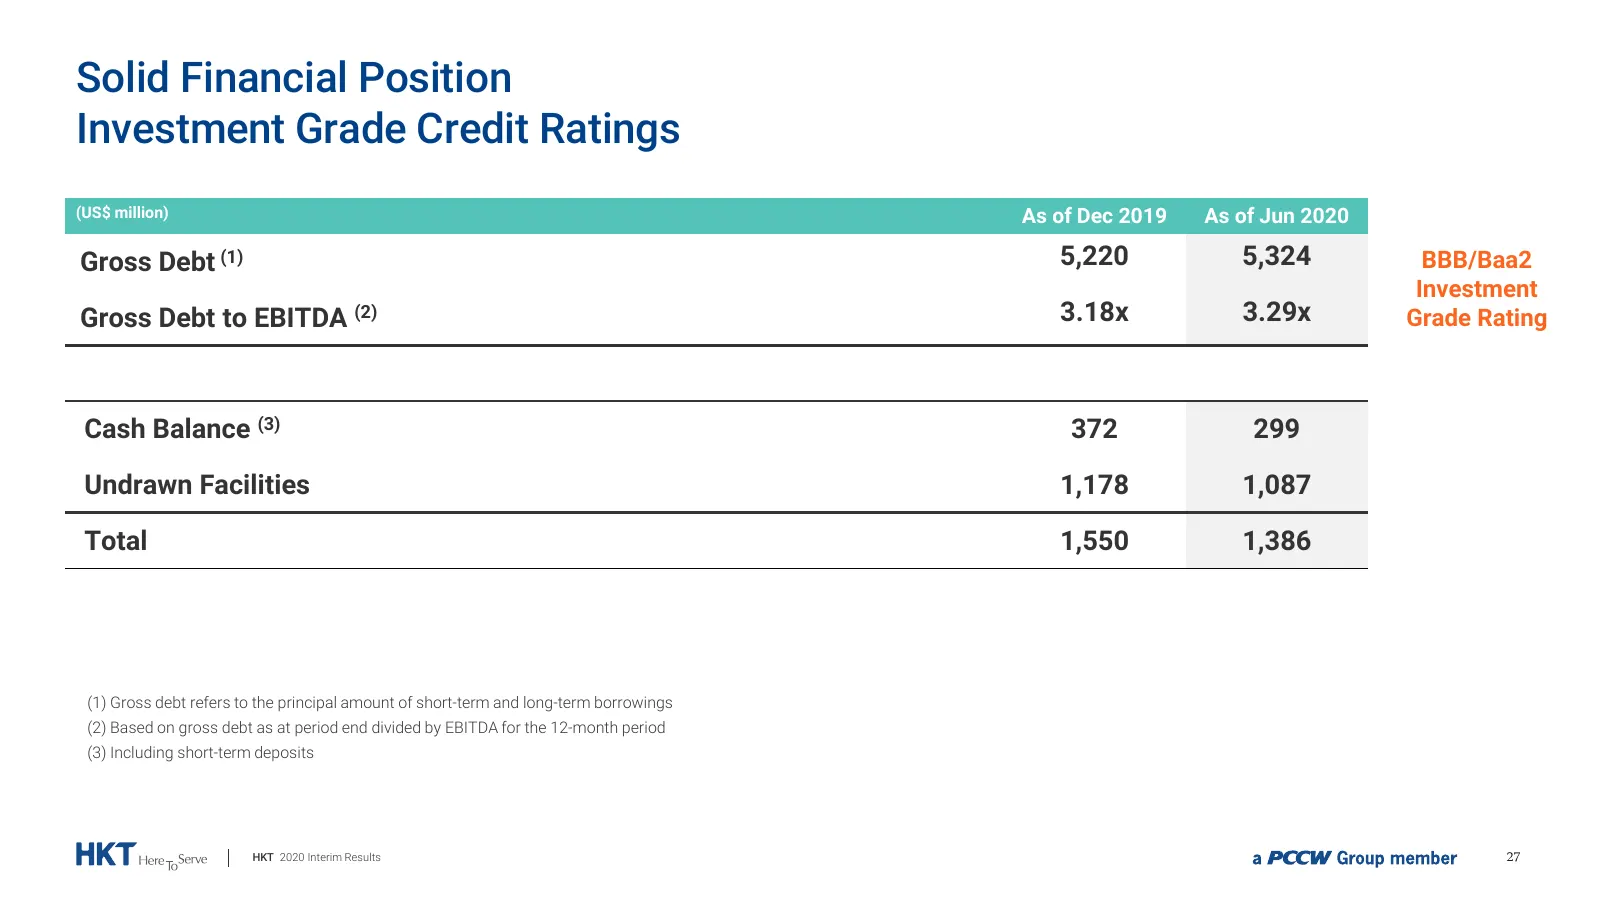
Solid Financial Position Investment Grade Credit Ratings (US$ million) As of Dec 2019 As of Jun 2020 Gross Debt (1) 5,220 5,324 BBB/Baa2 Investment Gross Debt to EBITDA (2) 3.18x 3.29x Grade Rating Cash Balance (3) 372 299 Undrawn Facilities 1,178 1,087 Total 1,550 1,386 (1) Gross debt refers to the
Slide 28: Debt Maturity Profile
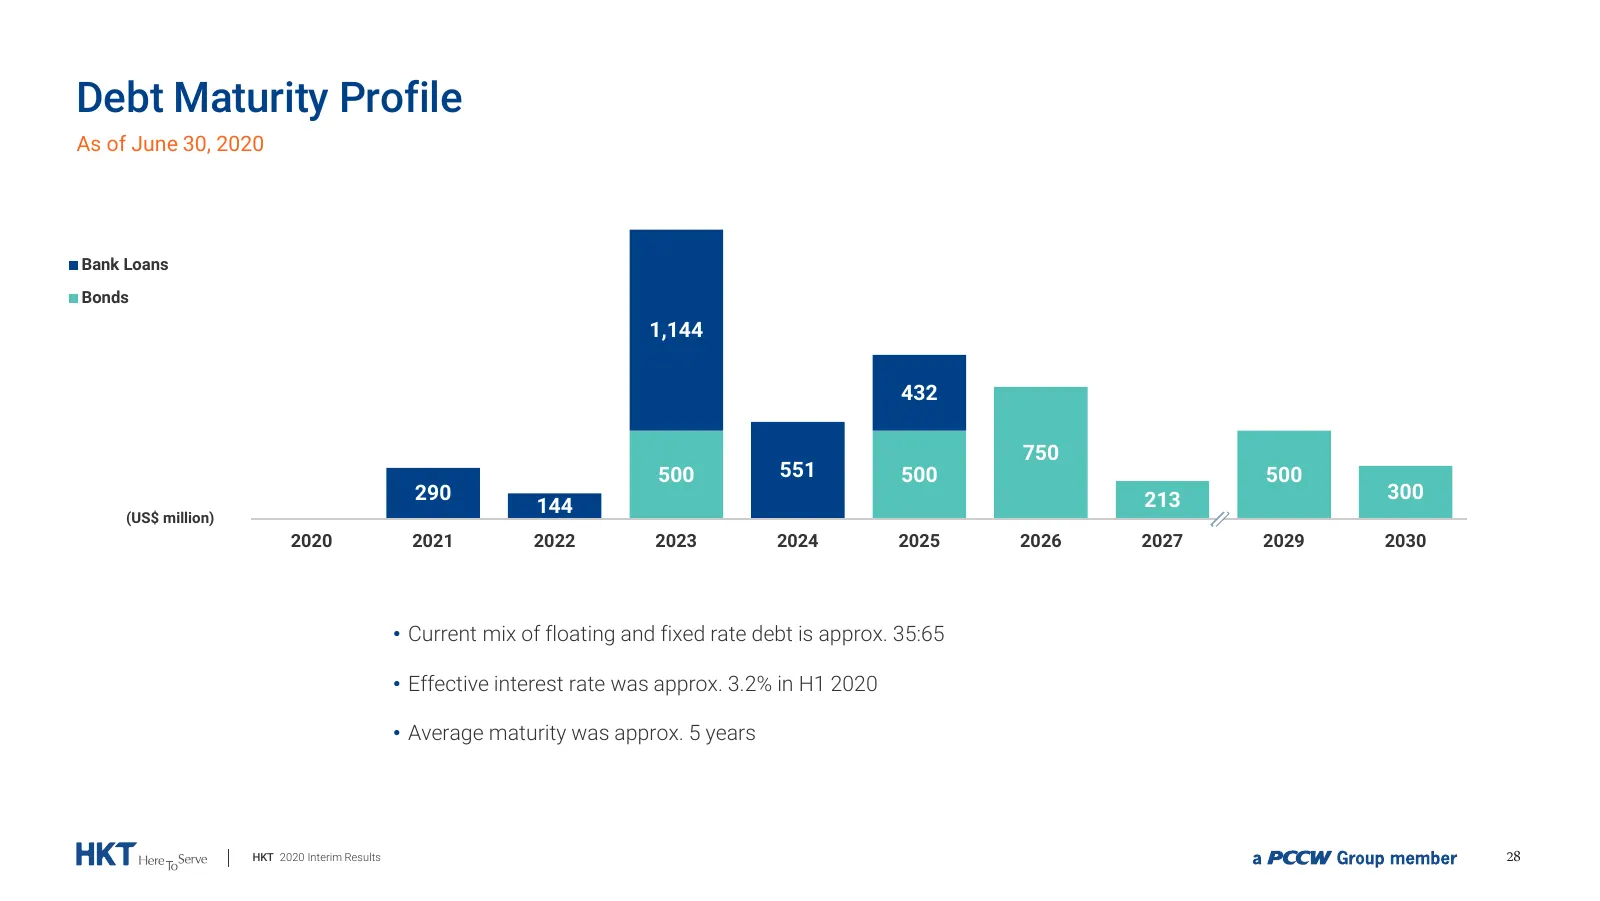
Debt Maturity Profile As of June 30, 2020 Bank Loans Bonds 1,144 432 750 500 551 500 500 290 213 300 (US$ million) 144 2020 2021 2022 2023 2024 2025 2026 2027 2029 2030 • Current mix of floating and fixed rate debt is approx. 35:65 • Effective interest rate was approx. 3.2% in H1 2020 • Average matu
Slide 29: Highlights
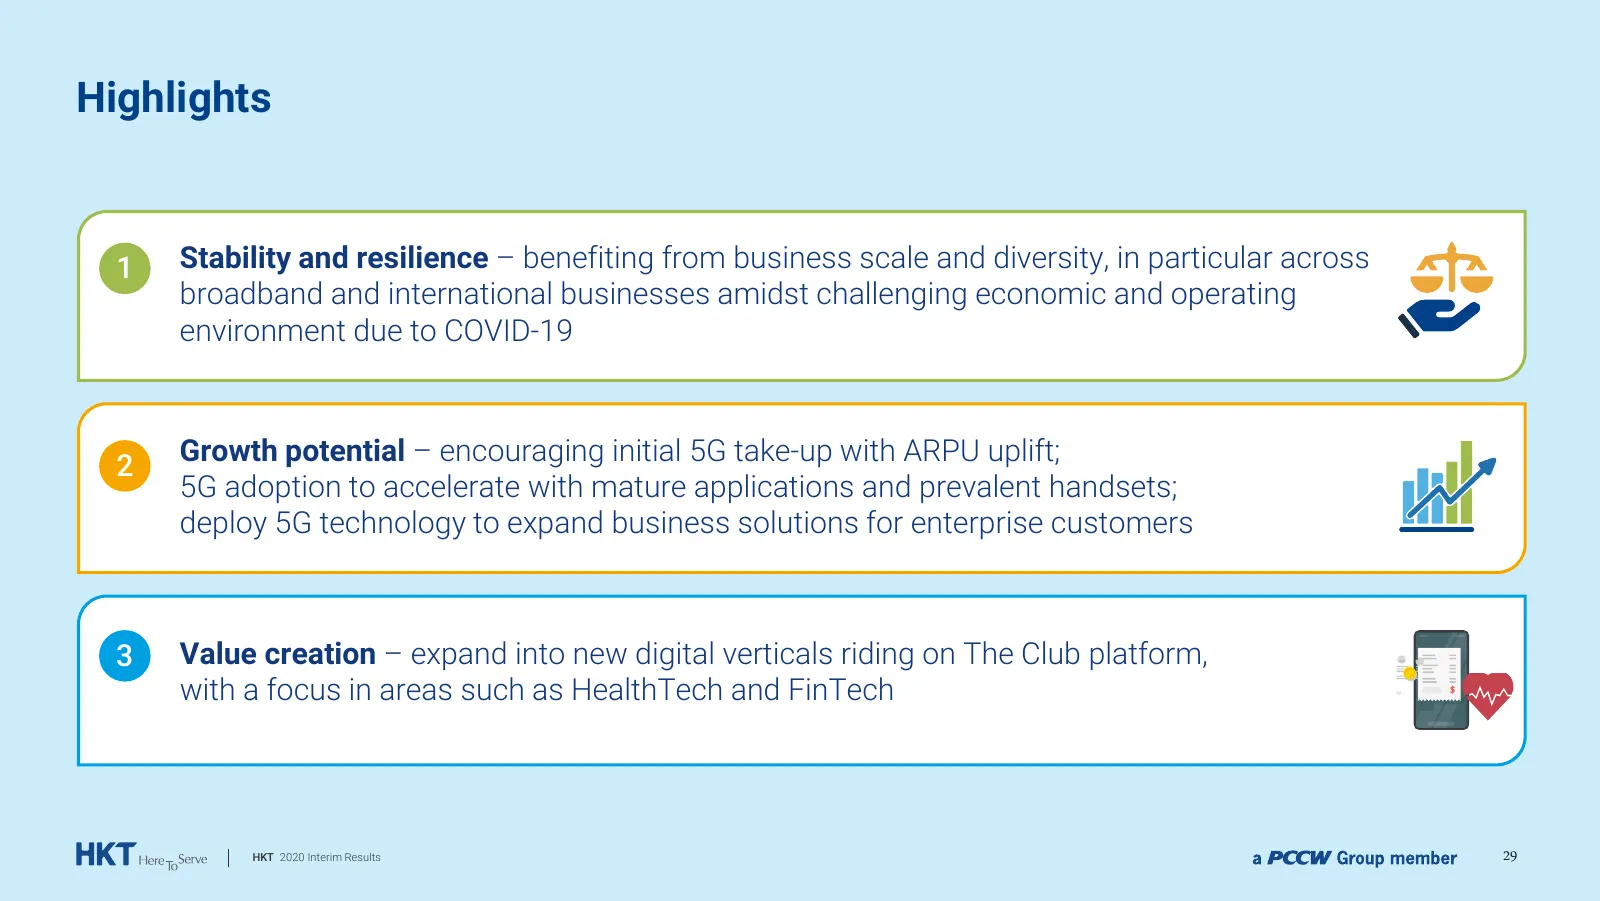
Highlights 1 Stability and resilience – benefiting from business scale and diversity, in particular across broadband and international businesses amidst challenging economic and operating environment due to COVID-19 Growth potential – encouraging initial 5G take-up with ARPU uplift; 2 5G adoption to
Source: Internet Archive copy of hkt.com
More decks from HKT Trust and HKT Ltd
 HKT — H1 2025 Earnings Presentation35 slides · Jul 31, 2025
 FY2024 Earnings Presentation35 slides · Feb 20, 2025
 H1 2024 Earnings Presentation34 slides · Jul 25, 2024
 FY2023 Earnings Presentation36 slides · Feb 22, 2024
 H1 2023 Earnings Presentation32 slides · Aug 2, 2023
 HKT — FY2022 Earnings Presentation32 slides · Feb 23, 2023