CareMax — Deerfield Healthcare Technology Acquisitions — SPAC Merger (December 2020)
47 slides from CareMax's SPAC merger presentation, Dec 18, 2020
Slide 1: Tech-Enabled Senior Care Platform
TECH-ENABLED SENIOR CARE PLATFORM December 2020
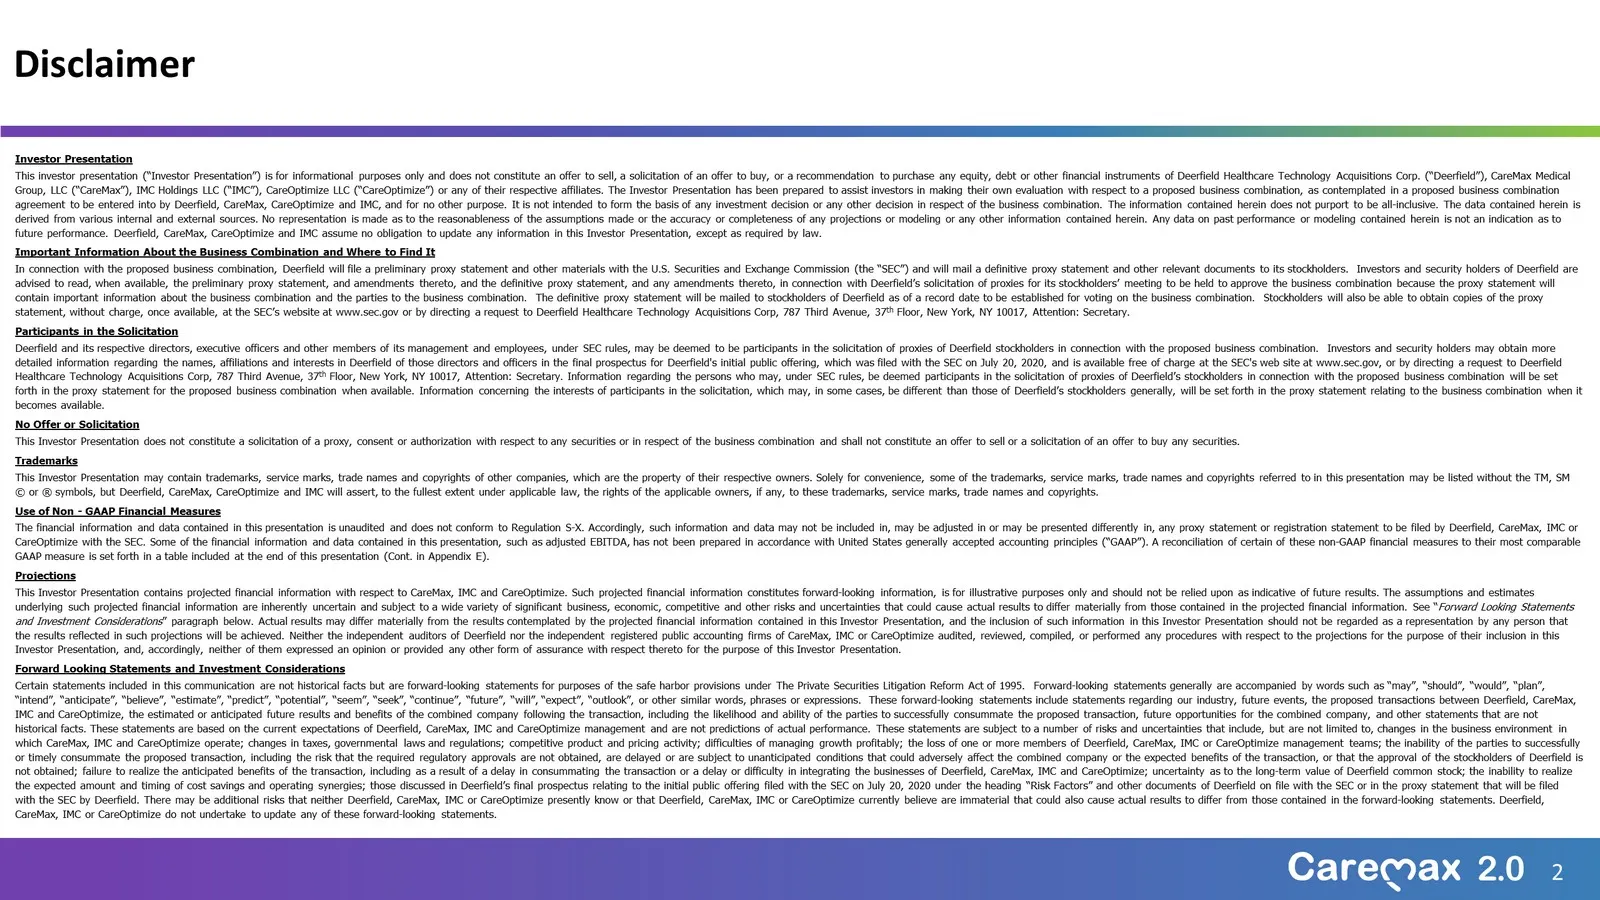
Slide 2: Investor Presentation Disclaimer
Investor Presentation This investor presentation (“Investor Presentation”) is for informational purposes only and does not constitute an offer to sell, a solicitation of an offer to buy, or a recommendation to purchase any equity, debt or other financial instruments of Deerfield Healthcare Technolog
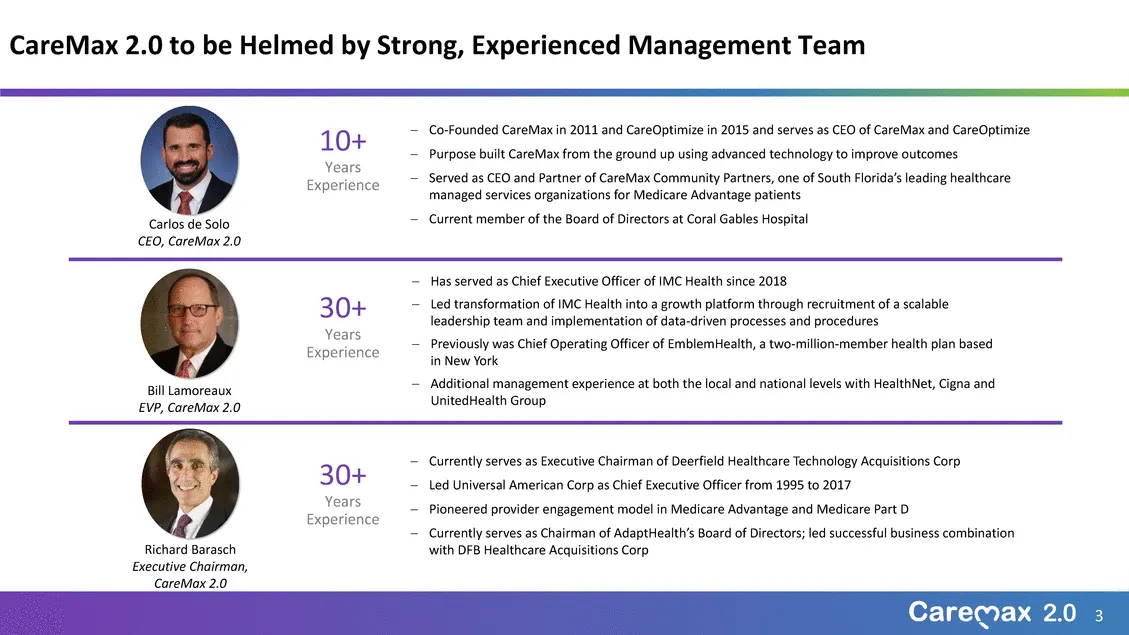
Slide 3: Management team
Carlos de Solo CEO, CareMax 2.0 Bill Lamoreaux EVP, CareMax 2.0 Richard Barasch Executive Chairman, CareMax 2.0 10+ Years Experience 30+ Years Experience 30+ Years Experience −Co-Founded CareMax in 2011 and CareOptimize in 2015 and serves as CEO of CareMax and CareOptimize −Purpose built CareMax fro

Slide 4: 1. Introduction and Proposed Transaction
1. Introduction and Proposed Transaction
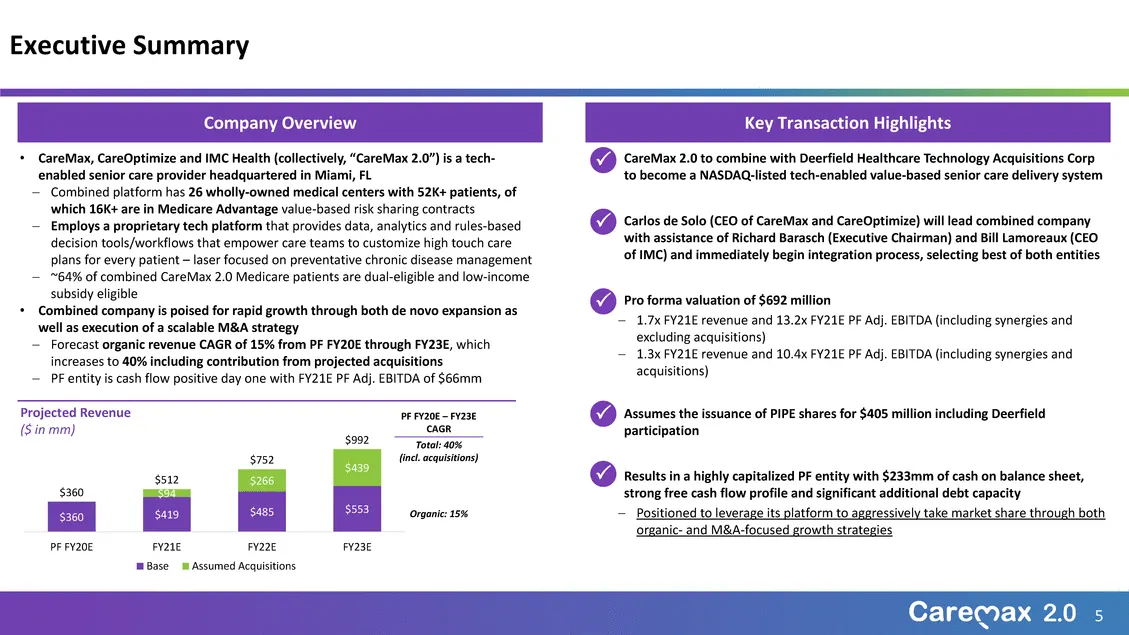
Slide 5: Company Overview and Key Transaction Highlights
Company OverviewKey Transaction Highlights • CareMax, CareOptimize and IMC Health (collectively, “CareMax 2.0”) is a tech-enabled senior care provider headquartered in Miami, FL −Combined platform has 26 wholly-owned medical centers with 52K+ patients, of which 16K+ are in Medicare Advantage value-b
Slide 6: Seniors Expected to Represent 20%+ of Population in 2030
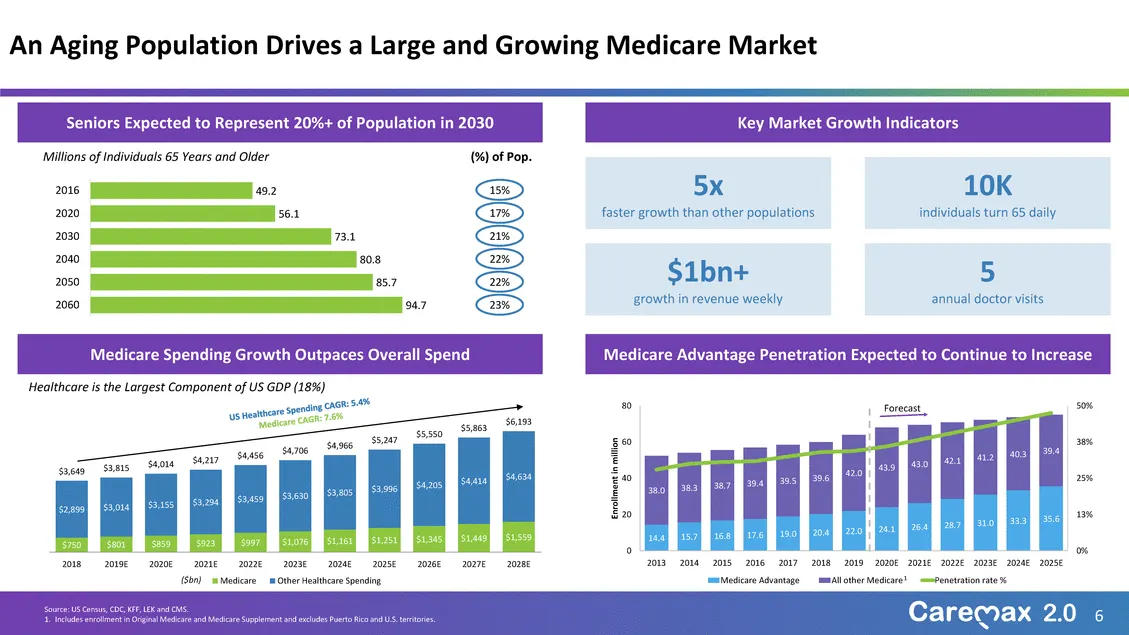
Seniors Expected to Represent 20%+ of Population in 2030Key Market Growth Indicators Millions of Individuals 65 Years and Older (%) of Pop. 2016 2020 2030 2040 2050 2060 49.2 56.1 73.1 80.8 85.7 94.7 15% 17% 21% 22% 22% 23% 5x faster growth than other populations $1bn+ growth in revenue weekly 10K i
Slide 7: Seniors Represent the Most Significant Opportunity to Lower Spend in Healthcare
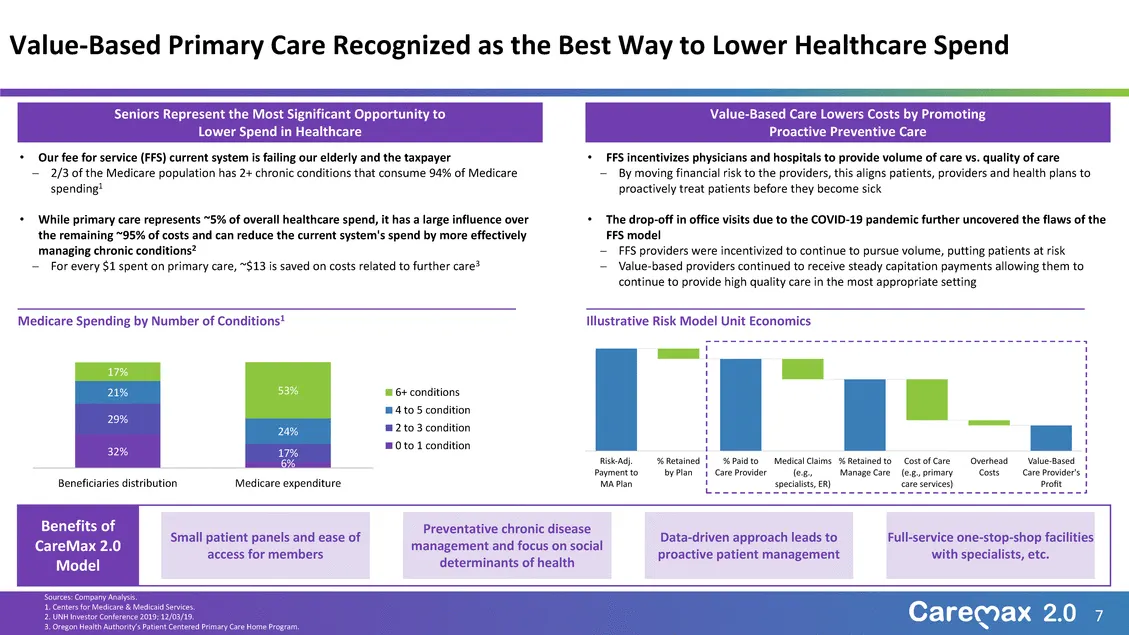
Seniors Represent the Most Significant Opportunity to Lower Spend in Healthcare •Our fee for service (FFS) current system is failing our elderly and the taxpayer −2/3 of the Medicare population has 2+ chronic conditions that consume 94% of Medicare spending1 •While primary care represents ~5% of ove
Slide 8: Combination creates a foundational platform for high-performing care delivery
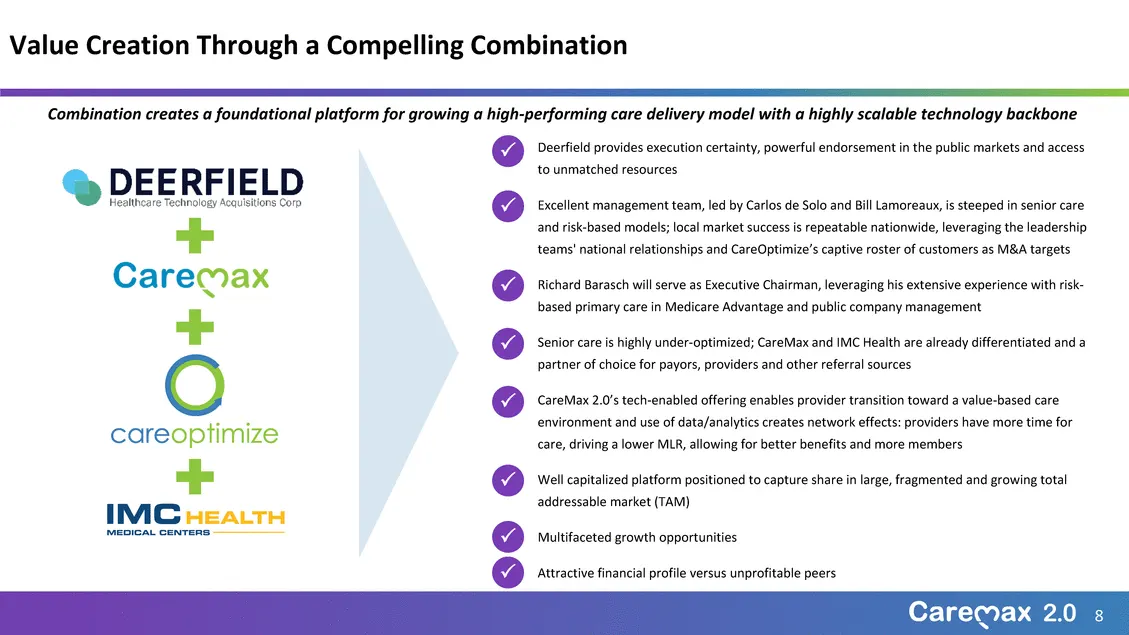
Combination creates a foundational platform for growing a high-performing care delivery model with a highly scalable technology backbone PDeerfield provides execution certainty, powerful endorsement in the public markets and access to unmatched resources PExcellent management team, led by Carlos de
Slide 9: Deerfield + Richard Barasch partnership and AdaptHealth
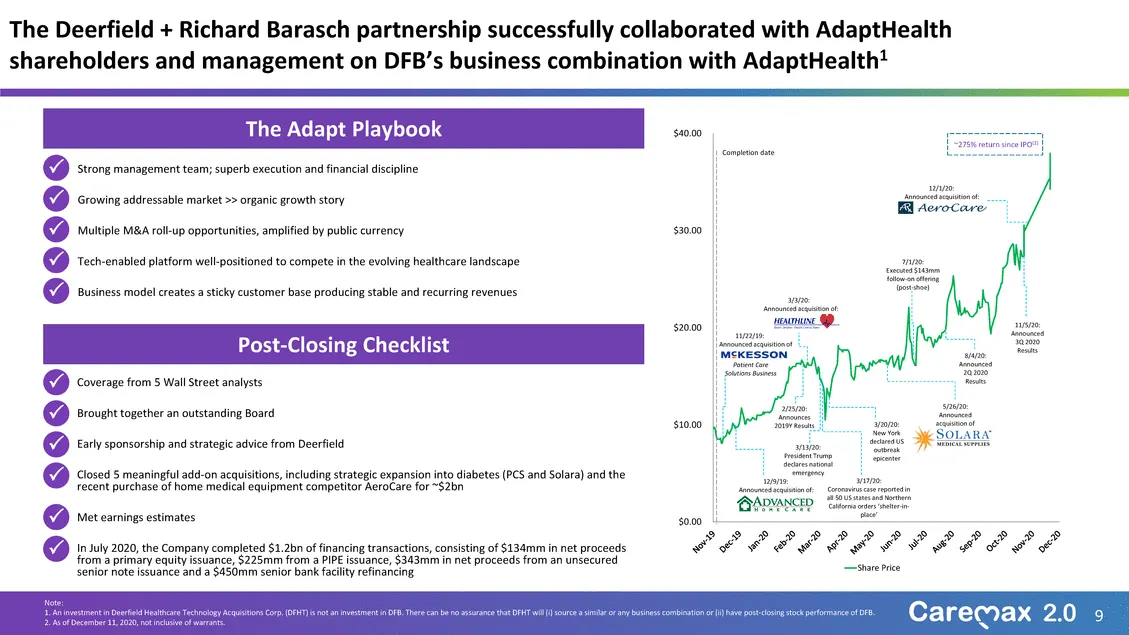
The Deerfield + Richard Barasch partnership successfully collaborated with AdaptHealth shareholders and management on DFB’s business combination with AdaptHealth1 The Adapt Playbook PStrong management team; superb execution and financial discipline PGrowing addressable market >> organic growth story
Slide 10: 2. Introduction to CareMax 2.0
2. Introduction to CareMax 2.0
Slide 11: By the Numbers
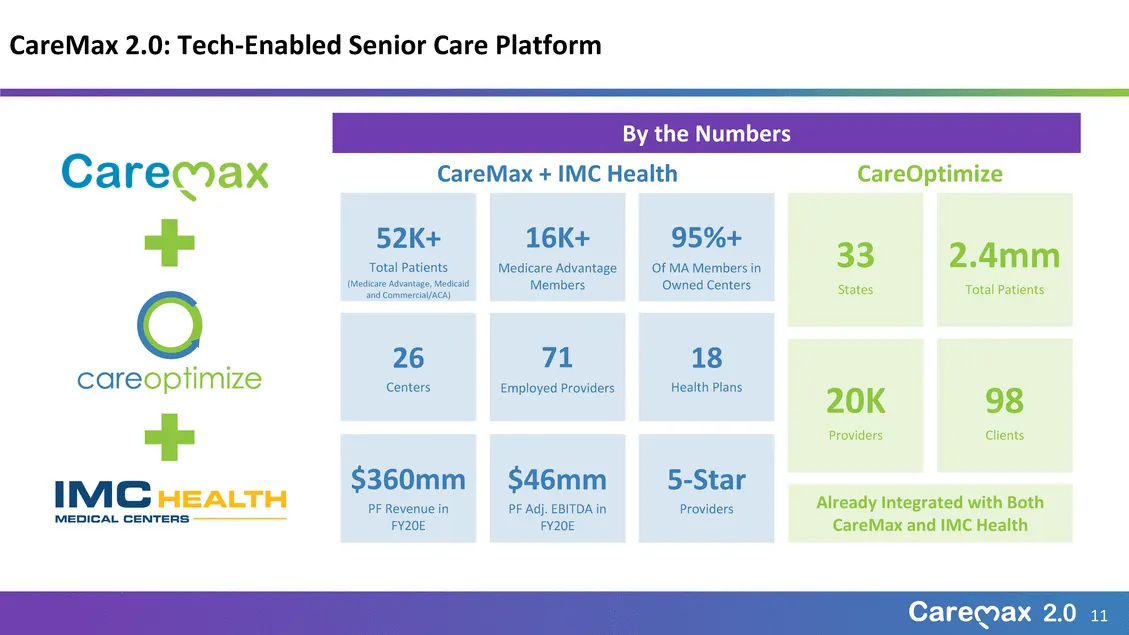
By the Numbers CareMax + IMC Health CareOptimize 52K+ Total Patients (Medicare Advantage, Medicaid and Commercial/ACA) 16K+ Medicare Advantage Members 95%+ Of MA Members in Owned Centers 33 States 2.4mm Total Patients 26 Centers $360mm 71 Employed Providers $46mm 18 Health Plans 5-Star 20K Providers
Slide 12: Dominant Regional Presence in South Florida
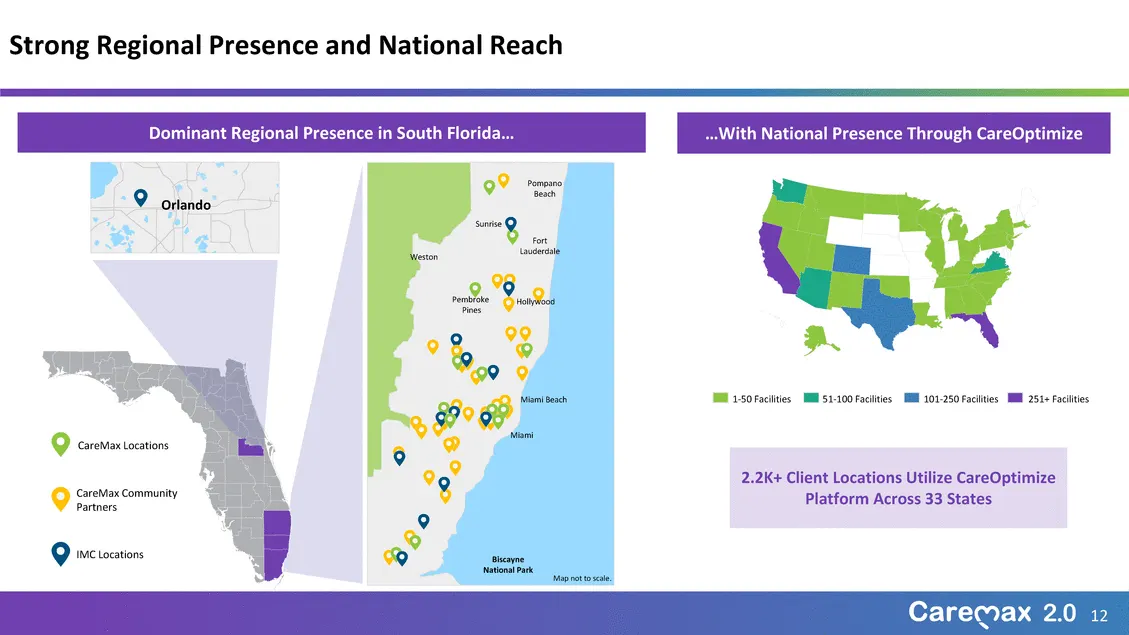
Dominant Regional Presence in South Florida……With National Presence Through CareOptimize Orlando Weston Sunrise Pompano Beach Fort Lauderdale Pembroke Pines Hollywood CareMax Locations CareMax Community Partners Miami Beach Miami 1-50 Facilities 51-100 Facilities 101-250 Facilities 251+ Facilities 2
Slide 13: Care services offered
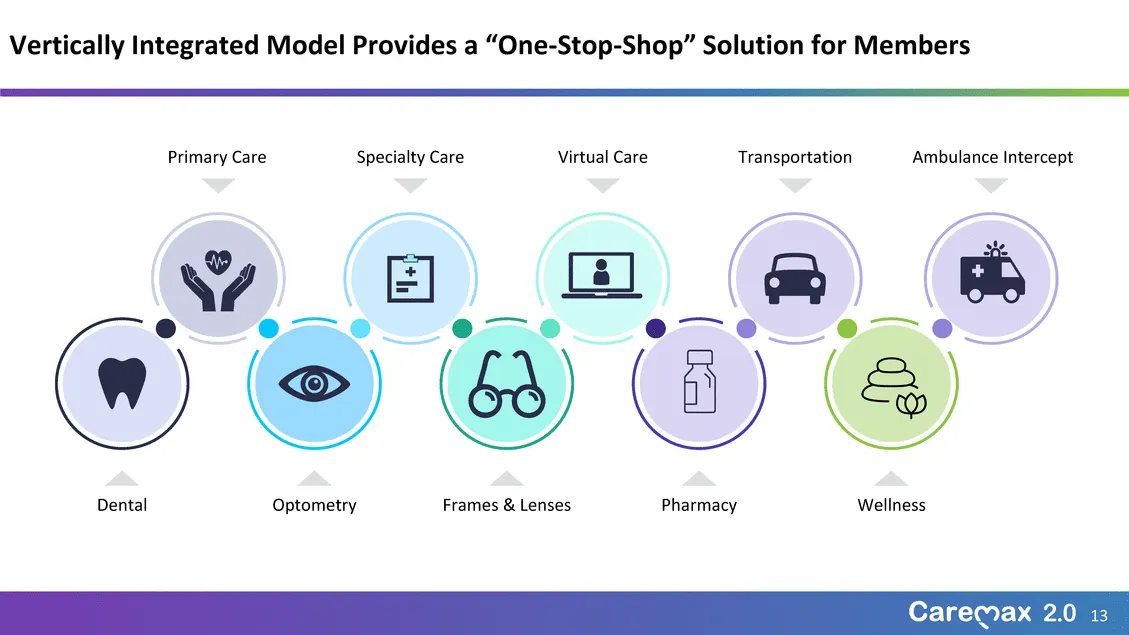
Primary CareSpecialty CareVirtual CareTransportationAmbulance Intercept DentalOptometryFrames & LensesPharmacy Wellness
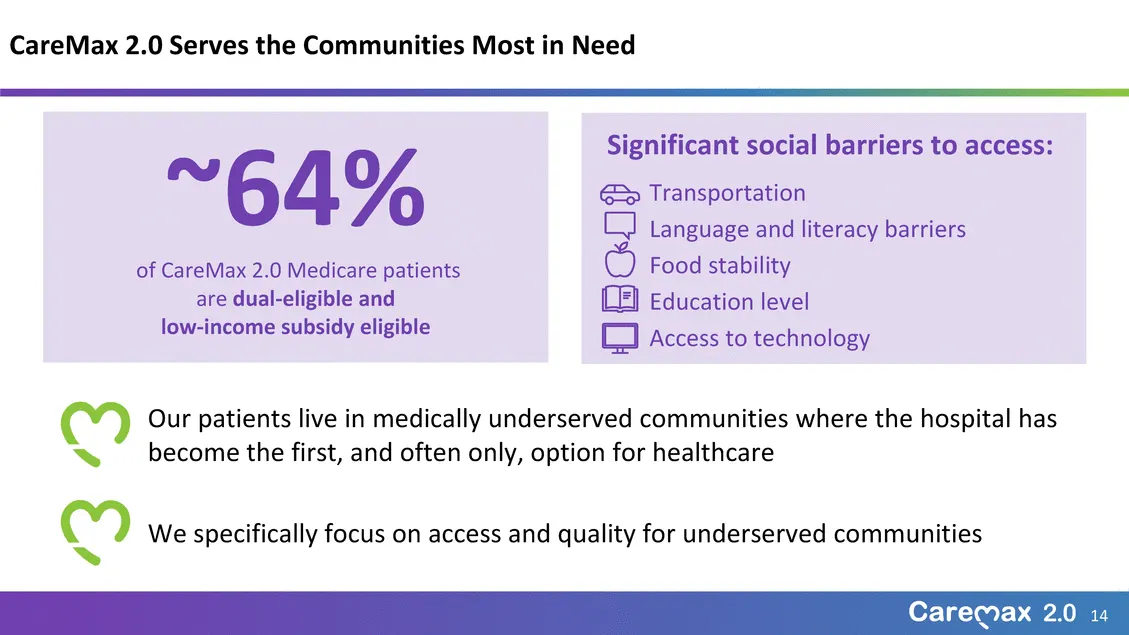
Slide 14: ~64% of Medicare patients are dual-eligible and low-income subsidy eligible
~64% of CareMax 2.0 Medicare patients are dual-eligible and low-income subsidy eligible Significant social barriers to access: Transportation Language and literacy barriers Food stability Education level Access to technology Our patients live in medically underserved communities where the hospital h
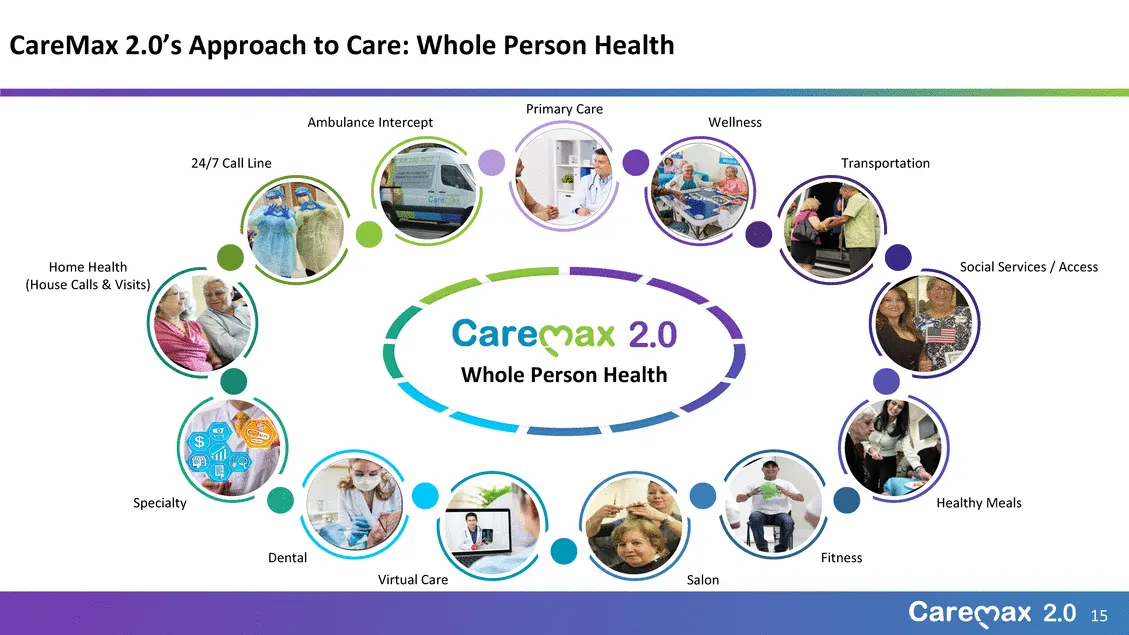
Slide 15: Whole person health services
Ambulance Intercept Primary Care Wellness 24/7 Call Line Transportation Home Health (House Calls & Visits) Social Services / Access Whole Person Health Specialty Healthy Meals Dental Virtual Care Salon Fitness
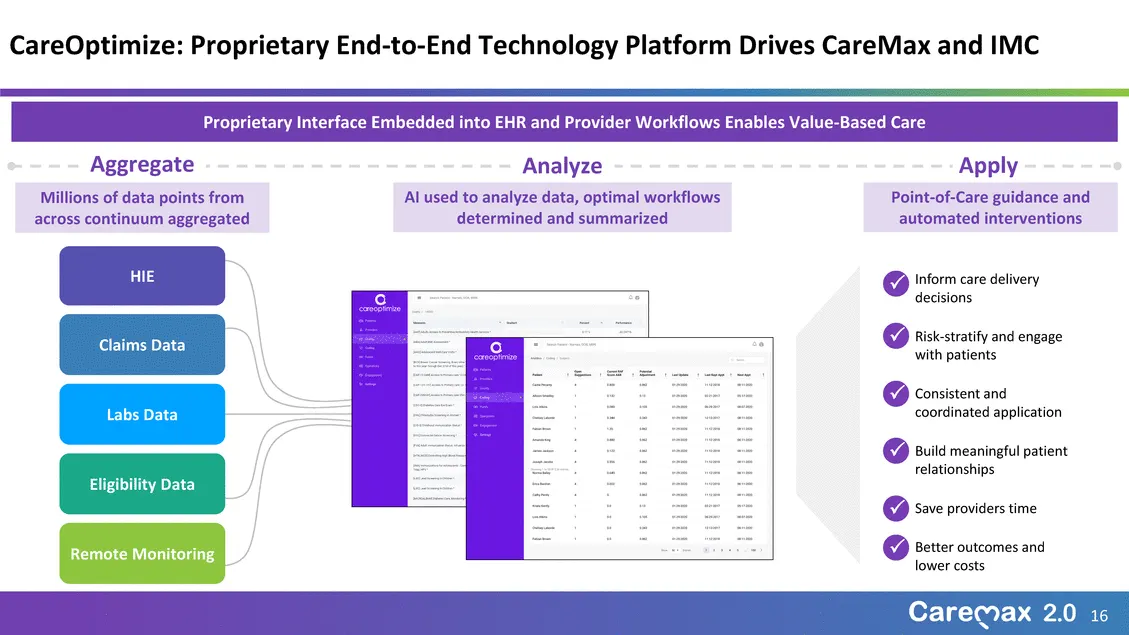
Slide 16: Proprietary Interface Embedded into EHR and Provider Workflows
Proprietary Interface Embedded into EHR and Provider Workflows Enables Value-Based Care AggregateAnalyzeApply Millions of data points from across continuum aggregated AI used to analyze data, optimal workflows determined and summarized Point-of-Care guidance and automated interventions HIE Claims Da
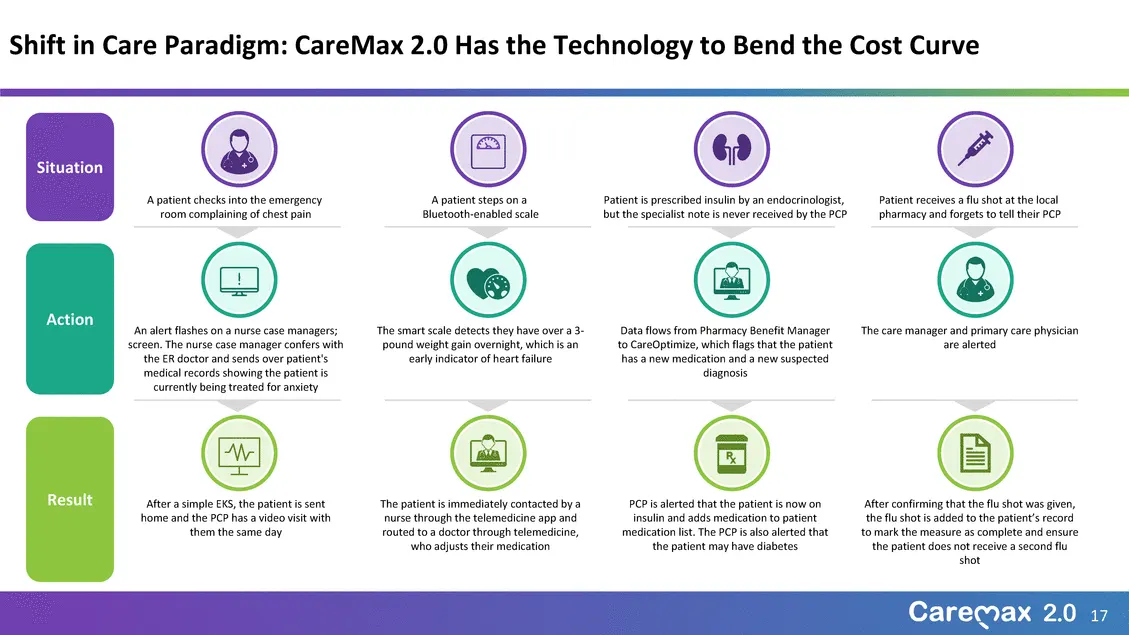
Slide 17: CareOptimize patient scenarios
Situation A patient checks into the emergency room complaining of chest pain A patient steps on a Bluetooth-enabled scale Patient is prescribed insulin by an endocrinologist, but the specialist note is never received by the PCP Patient receives a flu shot at the local pharmacy and forgets to tell th
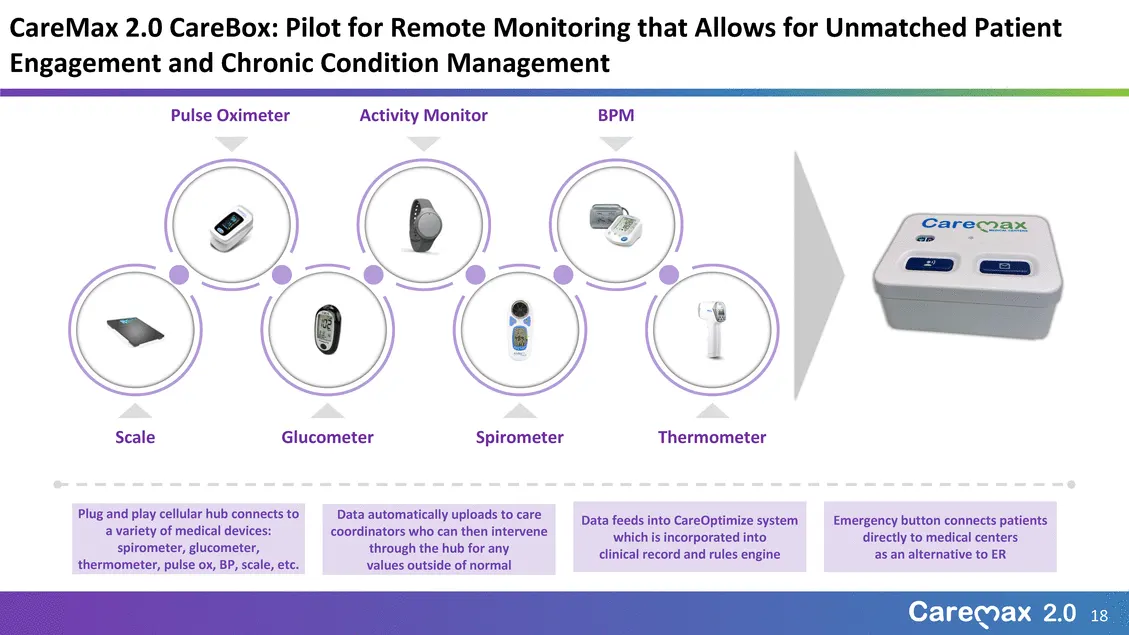
Slide 18: Remote patient monitoring devices
Pulse OximeterActivity MonitorBPM ScaleGlucometerSpirometerThermometer Plug and play cellular hub connects to a variety of medical devices: spirometer, glucometer, thermometer, pulse ox, BP, scale, etc. Data automatically uploads to care coordinators who can then intervene through the hub for any va
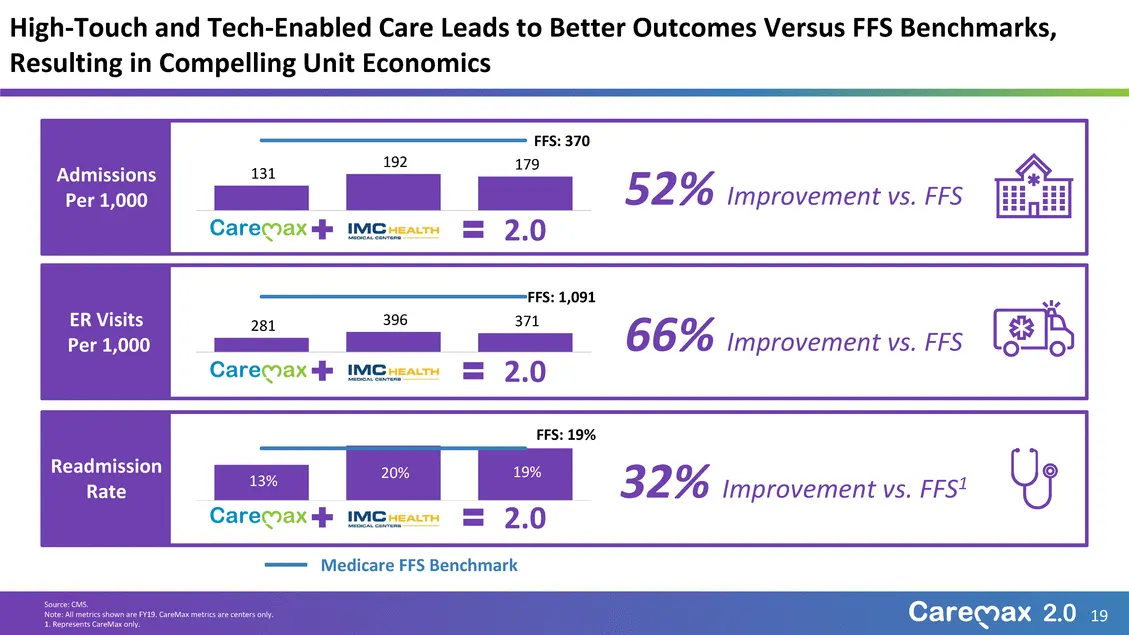
Slide 19: Clinical outcomes vs. Medicare FFS benchmark
Admissions Per 1,000 131 FFS: 370 192179 2.0 52%Improvement vs. FFS ER Visits Per 1,000 281 FFS: 1,091 396371 2.0 66%Improvement vs. FFS Readmission Rate FFS: 19% 13%20%19% 2.0 32%Improvement vs. FFS1 Medicare FFS Benchmark 19 Note: All metrics shown are FY19. CareMax metrics are centers only. 1. Re
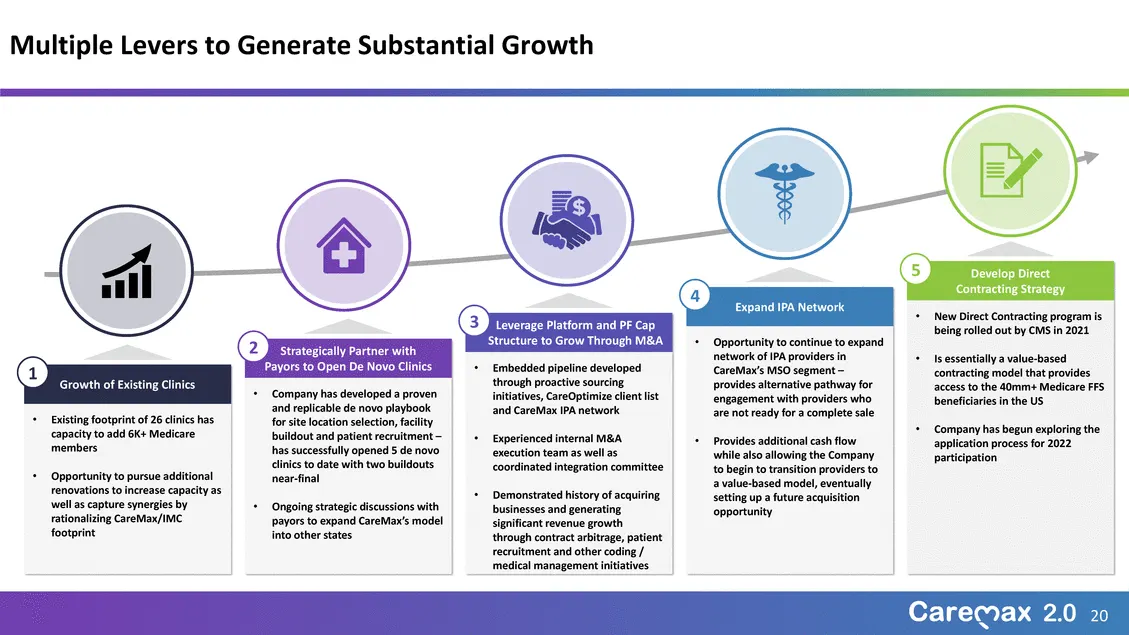
Slide 20: Growth strategy
4 Expand IPA Network 5Develop Direct Contracting Strategy 2Strategically Partner with 3Leverage Platform and PF Cap Structure to Grow Through M&A •Opportunity to continue to expand network of IPA providers in •New Direct Contracting program is being rolled out by CMS in 2021 •Is essentially a value-
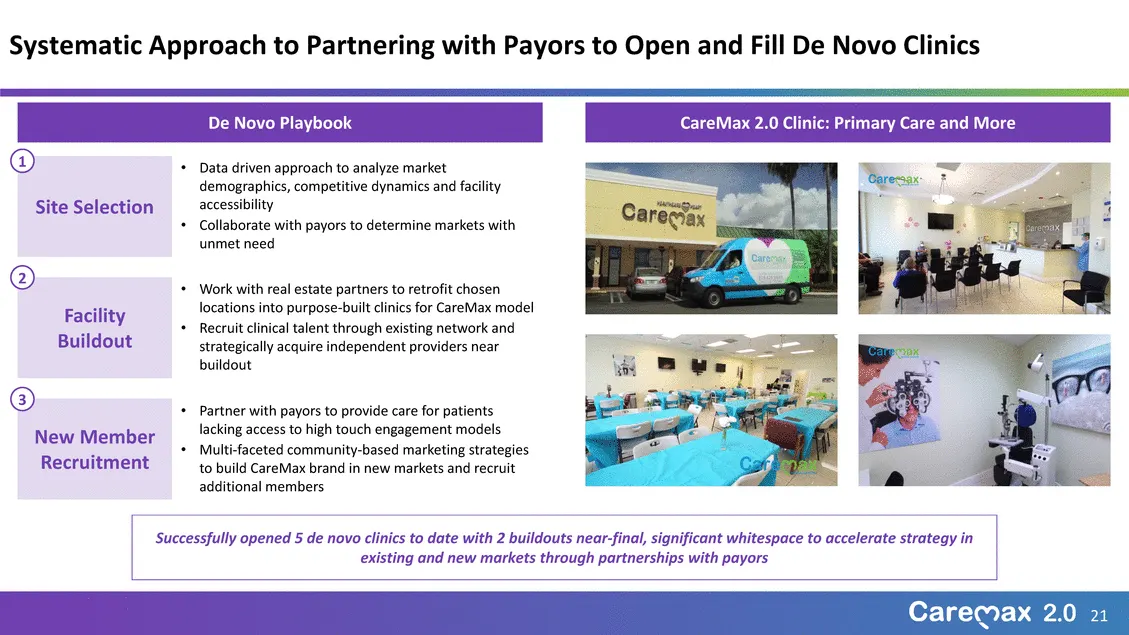
Slide 21: De Novo Playbook
1 Site Selection 2 Facility Buildout 3 New Member Recruitment De Novo PlaybookCareMax 2.0 Clinic: Primary Care and More •Data driven approach to analyze market demographics, competitive dynamics and facility accessibility •Collaborate with payors to determine markets with unmet need •Work with real
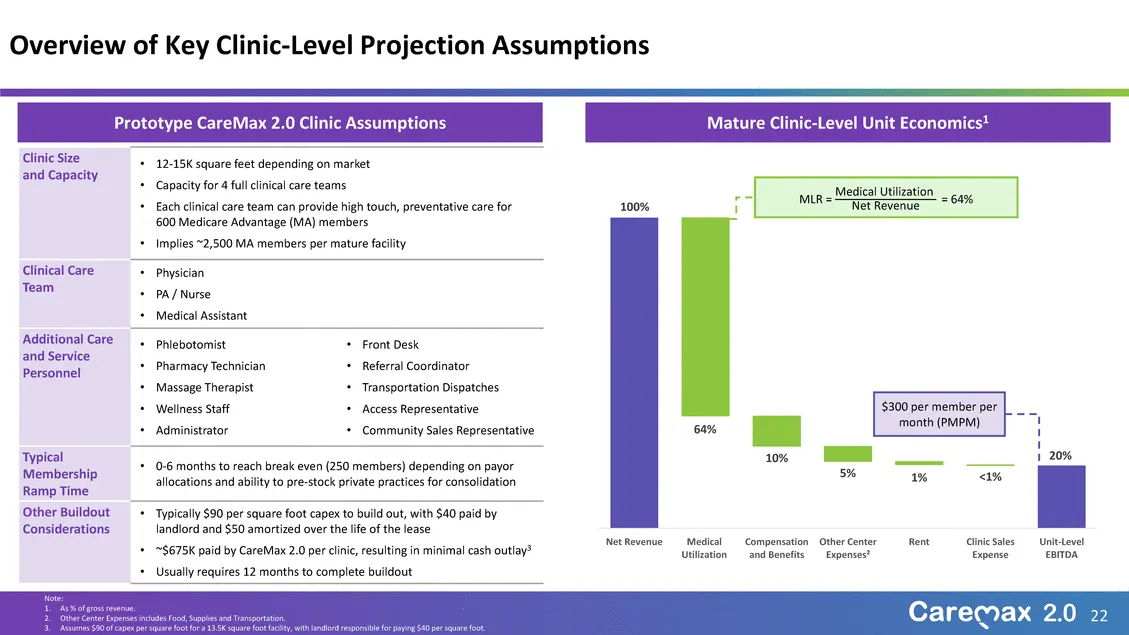
Slide 22: Prototype Clinic Assumptions and Mature Clinic Unit Economics
Prototype CareMax 2.0 Clinic AssumptionsMature Clinic-Level Unit Economics1 Clinic Size and Capacity •12-15K square feet depending on market •Capacity for 4 full clinical care teams •Each clinical care team can provide high touch, preventative care for 600 Medicare Advantage (MA) members •Implies ~2
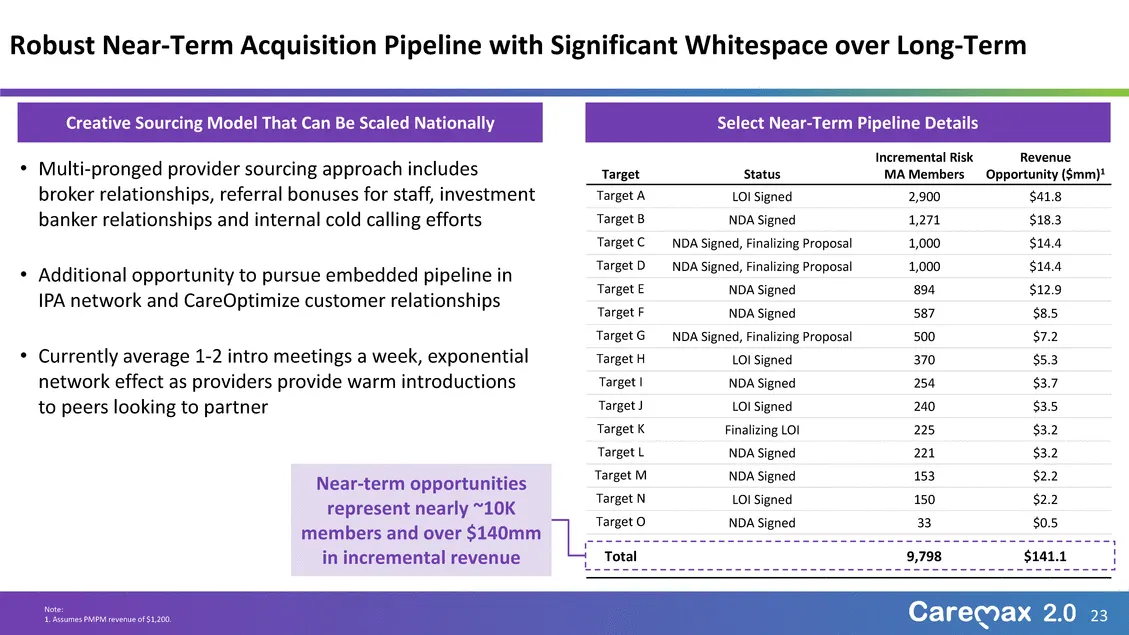
Slide 23: Acquisition pipeline
Target Status Incremental Risk MA Members Revenue Opportunity ($mm)1 Target A LOI Signed 2,900 $41.8 Target B NDA Signed 1,271 $18.3 Target C NDA Signed, Finalizing Proposal 1,000 $14.4 Target D NDA Signed, Finalizing Proposal 1,000 $14.4 Target E NDA Signed 894 $12.9 Target F NDA Signed 587 $8.5 Ta
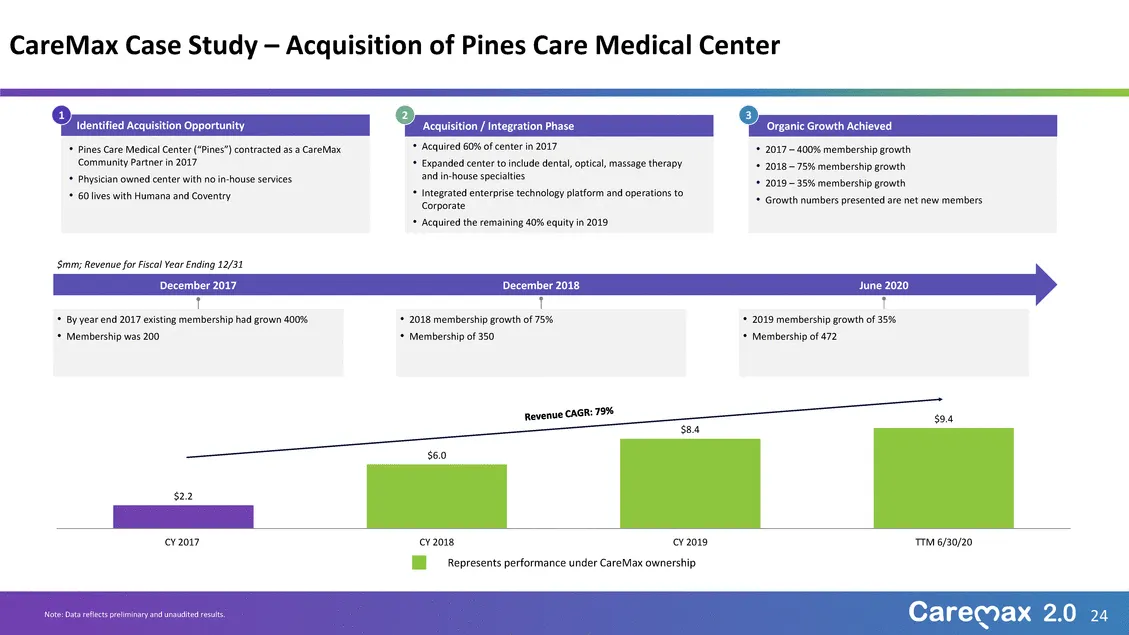
Slide 24: Acquisition case study: Pines Care Medical Center
1 Identified Acquisition Opportunity • Pines Care Medical Center (“Pines”) contracted as a CareMax Community Partner in 2017 • Physician owned center with no in-house services • 60 lives with Humana and Coventry 2 Acquisition / Integration Phase • Acquired 60% of center in 2017 • Expanded center to
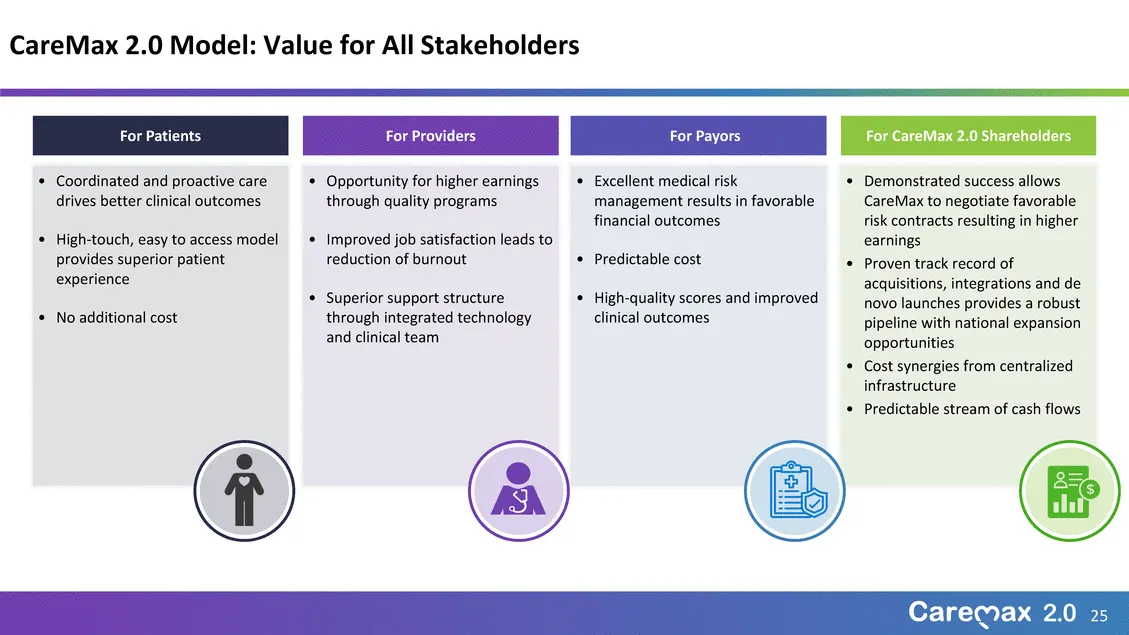
Slide 25: Benefits for patients, providers, payors and shareholders
For PatientsFor ProvidersFor PayorsFor CareMax 2.0 Shareholders •Coordinated and proactive care drives better clinical outcomes •High-touch, easy to access model provides superior patient experience •No additional cost •Opportunity for higher earnings through quality programs •Improved job satisfact

Slide 26: 3. Transaction Structure and Financial Overview
3. Transaction Structure and Financial Overview
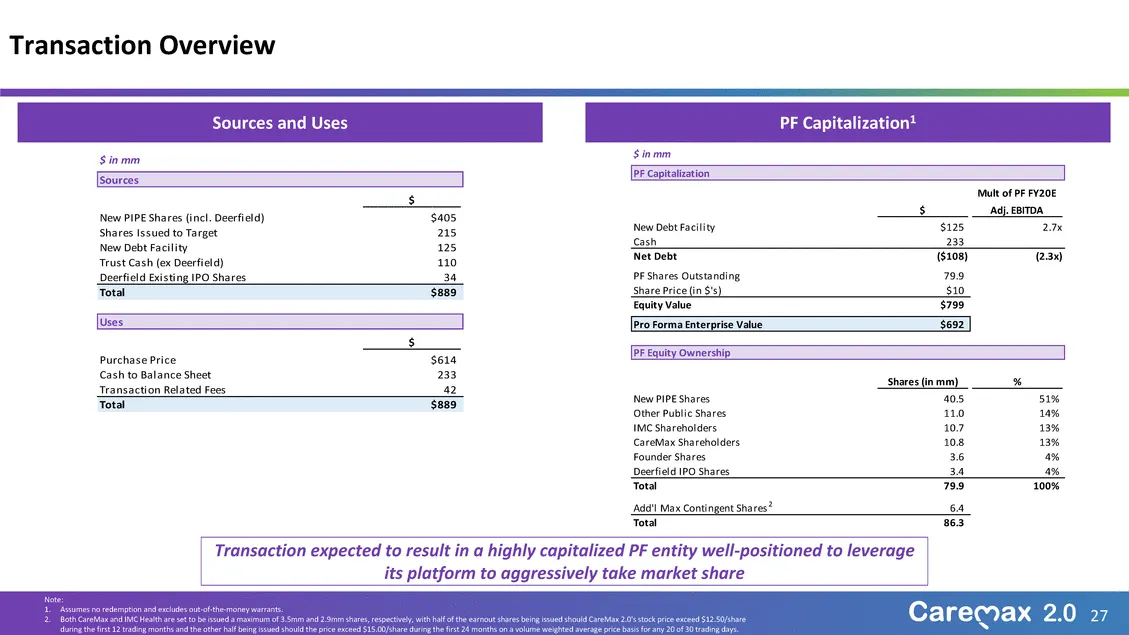
Slide 27: Sources and Uses and PF Capitalization
$ in mm Sources Sources and UsesPF Capitalization1 $ in mm PF Capitalization $ $ Mult of PF FY20E Adj. EBITDA New PI PE Sha res (i ncl . Deerfi el d) $405 Sha res I s s ued to Ta rget 215 New Debt Fa ci l i ty 125 Trus t Ca s h (ex Deerfi el d) 110 Deerfi el d Exi s ti ng I PO Sha res 34 Total $889
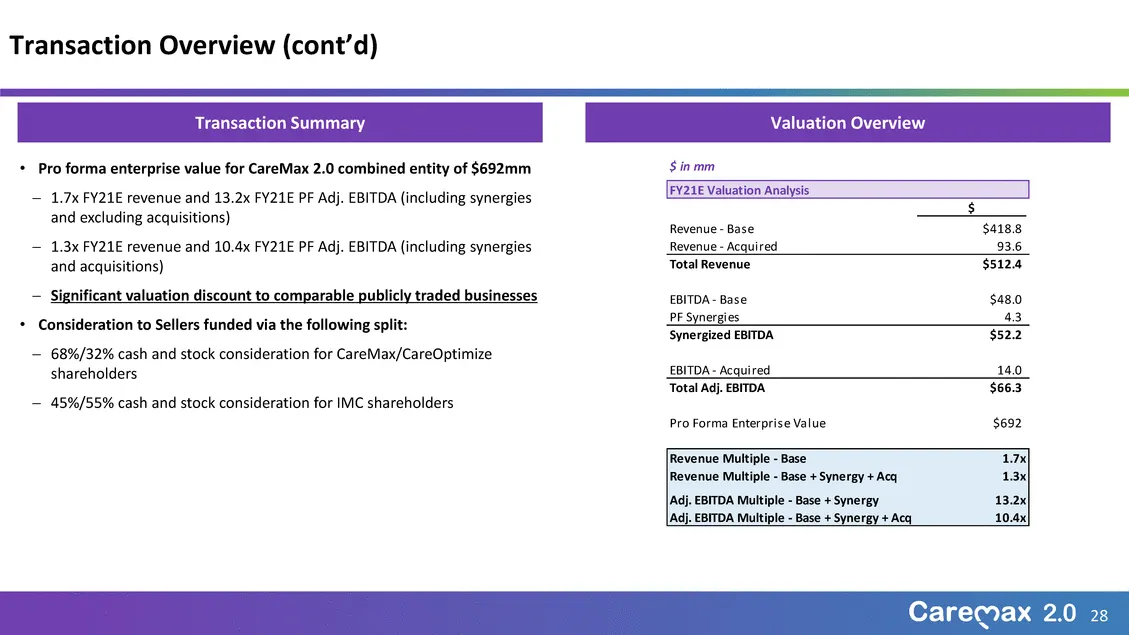
Slide 28: Transaction Summary and Valuation Overview
Transaction SummaryValuation Overview •Pro forma enterprise value for CareMax 2.0 combined entity of $692mm −1.7x FY21E revenue and 13.2x FY21E PF Adj. EBITDA (including synergies and excluding acquisitions) $ in mm FY21E Valuation Analysis $ −1.3x FY21E revenue and 10.4x FY21E PF Adj. EBITDA (inclu
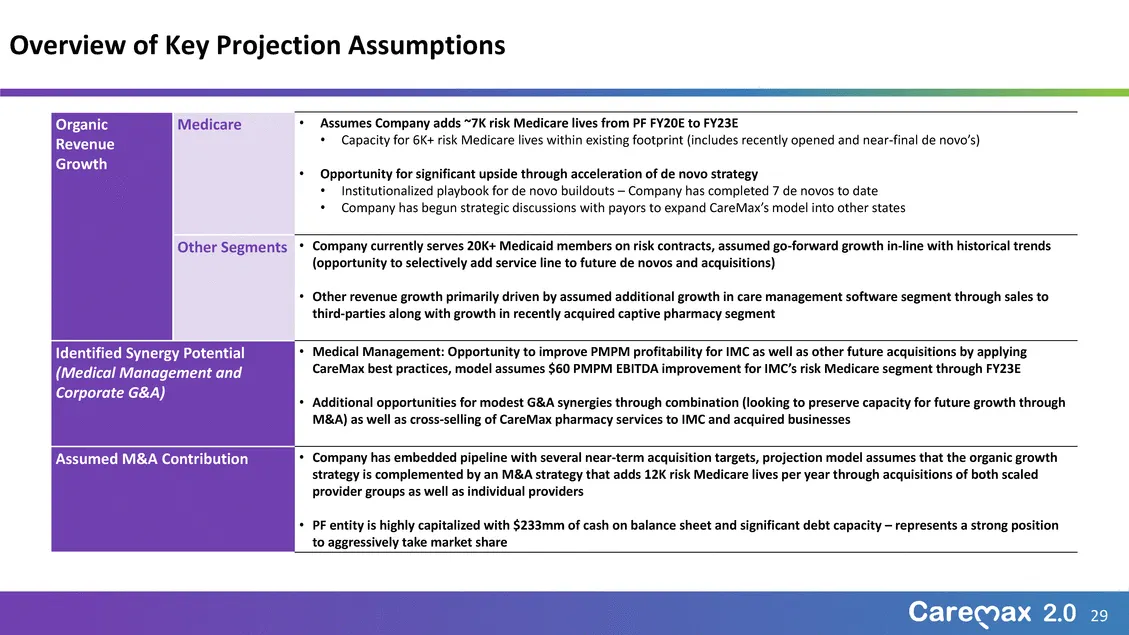
Slide 29: Overview of Key Projection Assumptions
Overview of Key Projection Assumptions Organic ‘Assumes Company adds ~7K risk Medicare lives from PF FY20E to FY23E Revenue + Capacity for 6K+ risk Medicare lives within existing footprint (includes recently opened and near-final de novo's) Growth Opportunity for significant upside through accelerat
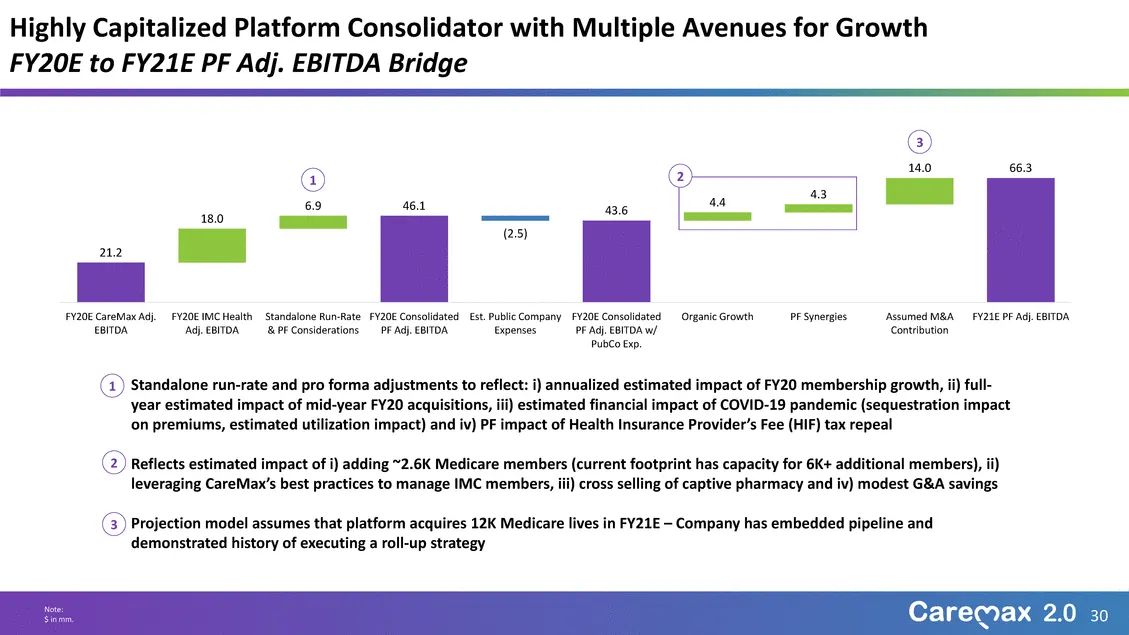
Slide 30: FY21E Adj. EBITDA build and notes
21.2 18.0 1 6.9 46.143.6 (2.5) 2 4.4 4.3 3 14.0 66.3 1• Standalone run-rate and pro forma adjustments to reflect: i) annualized estimated impact of FY20 membership growth, ii) full-year estimated impact of mid-year FY20 acquisitions, iii) estimated financial impact of COVID-19 pandemic (sequestratio
Slide 31: Financial Summary
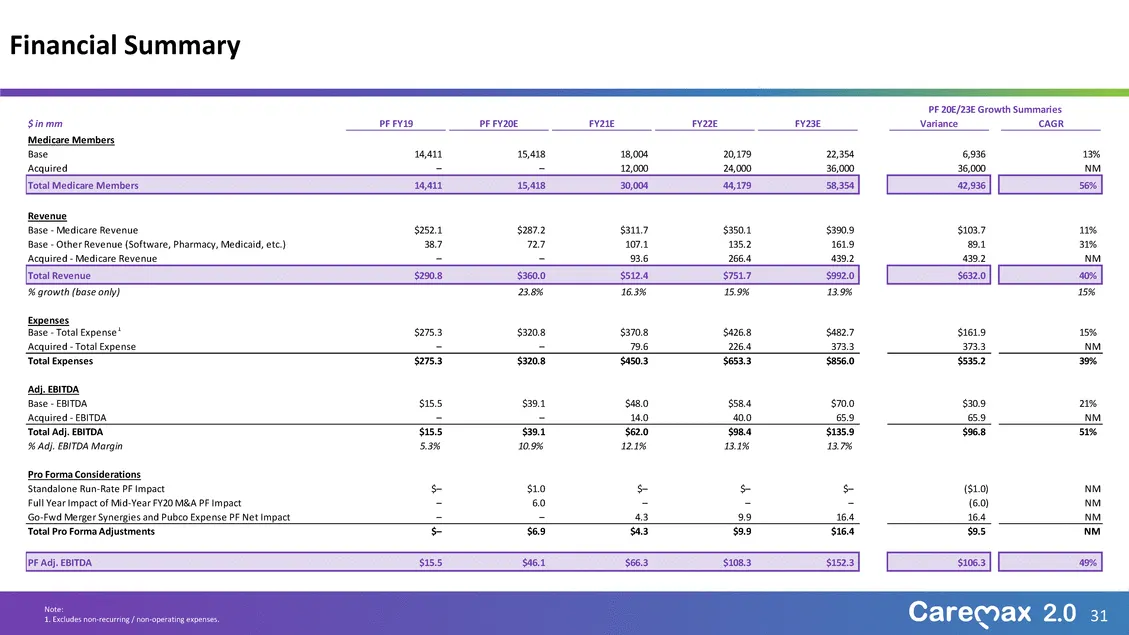
Financial Summary PF 20€/23€ Growth Summaries Sinmm Pr EVO Pr FY20€ rae rae rox Variance cAGR ‘Medicare Members Base ant 15418, 18,008 20.178 22,354 6.936 13% Acquired = = 32,000, 24,000 35,000, 36,000 NM [Total Medicare Members ian 35418 30,008 44379 53.354 22,536 30% Revenue ‘ase - Medicare Revenu
Slide 32: Peer comparison
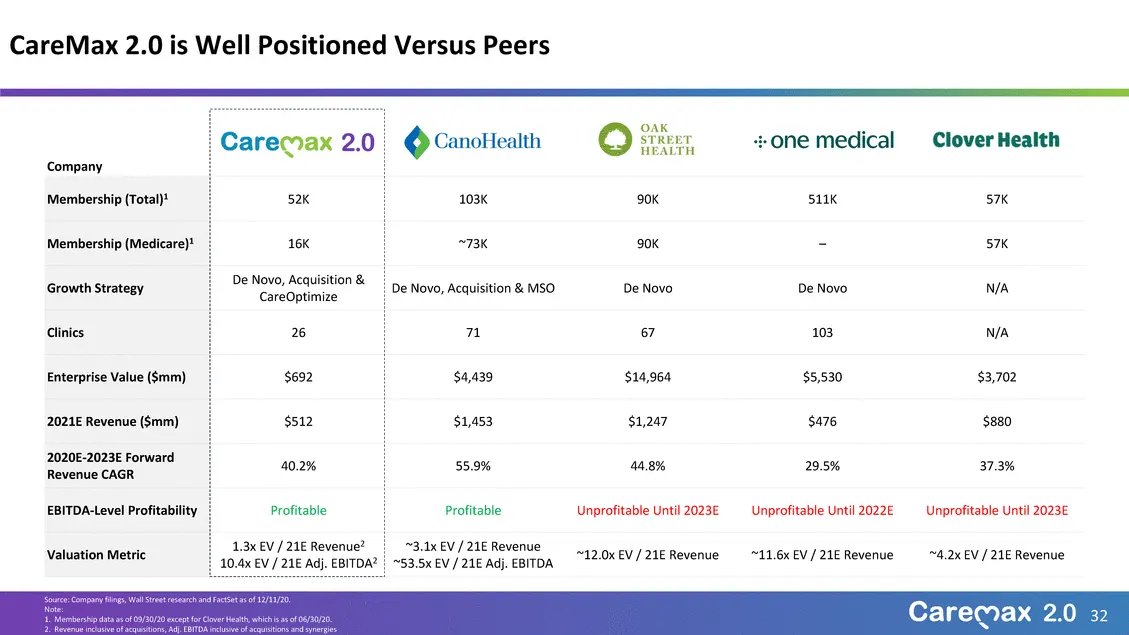
Company Membership (Total)1 52K 103K 90K 511K 57K Membership (Medicare)1 16K ~73K 90K – 57K Growth Strategy De Novo, Acquisition & CareOptimize De Novo, Acquisition & MSO De Novo De Novo N/A Clinics 26 71 67 103 N/A Enterprise Value ($mm) $692 $4,439 $14,964 $5,530 $3,702 2021E Revenue ($mm) $512 $1
Slide 33: Thank You / Q&A
ThankYou/Q&A

Slide 34: Appendix A: Proven Ability to Execute Roll-up Strategy
Appendix A: Proven Ability to Execute Roll-up Strategy – Additional Case Study 34
Slide 35: Acquisition case study: New Life Medical Centers
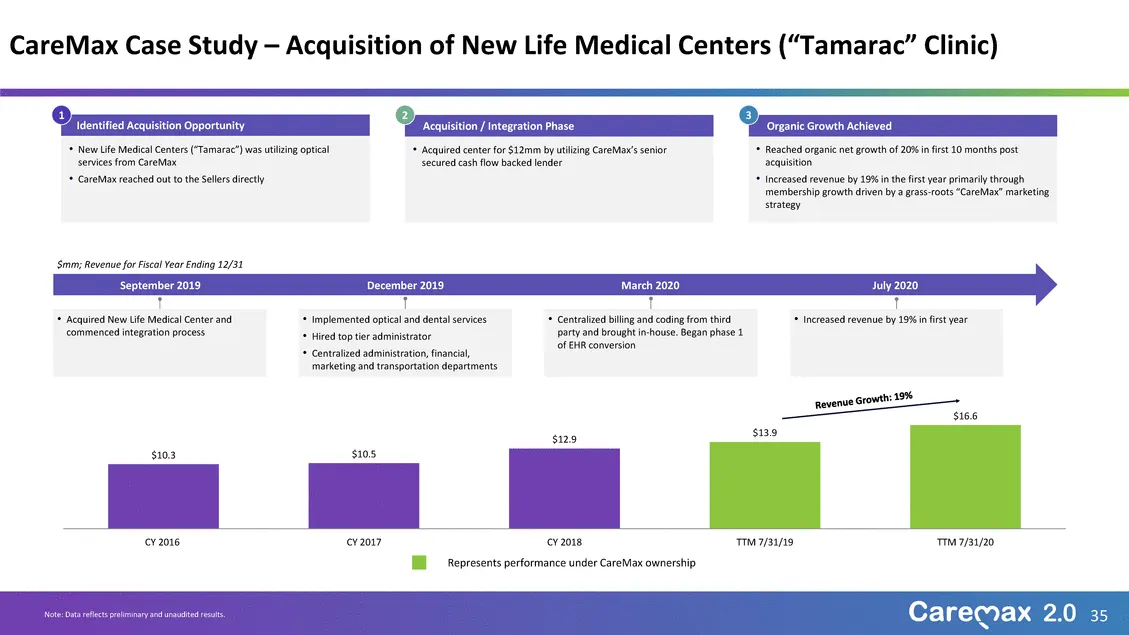
1 Identified Acquisition Opportunity • New Life Medical Centers (“Tamarac”) was utilizing optical services from CareMax • CareMax reached out to the Sellers directly 2 Acquisition / Integration Phase • Acquired center for $12mm by utilizing CareMax’s senior secured cash flow backed lender 3 Organic
Slide 36: Appendix B: COVID Response
Appendix B: COVID Response 36
Slide 37: COVID response initiatives
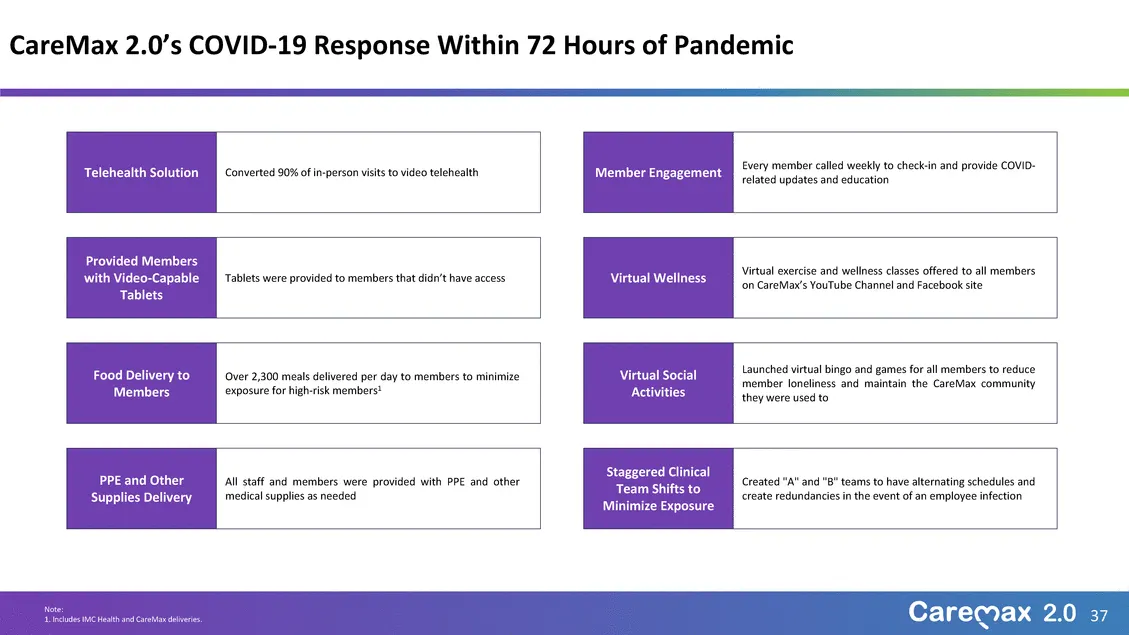
Telehealth Solution Converted 90% of in-person visits to video telehealth Every member called weekly to check-in and provide COVID-Member Engagement Provided Members with Video-Capable Tablets Tablets were provided to members that didn’t have access Virtual Wellness Food Delivery to Members Over 2,3
Slide 38: Appendix C: Market Comparables
Appendix C: Market Comparables 38
Slide 39: EV / CY+1 Revenue and EBITDA multiples
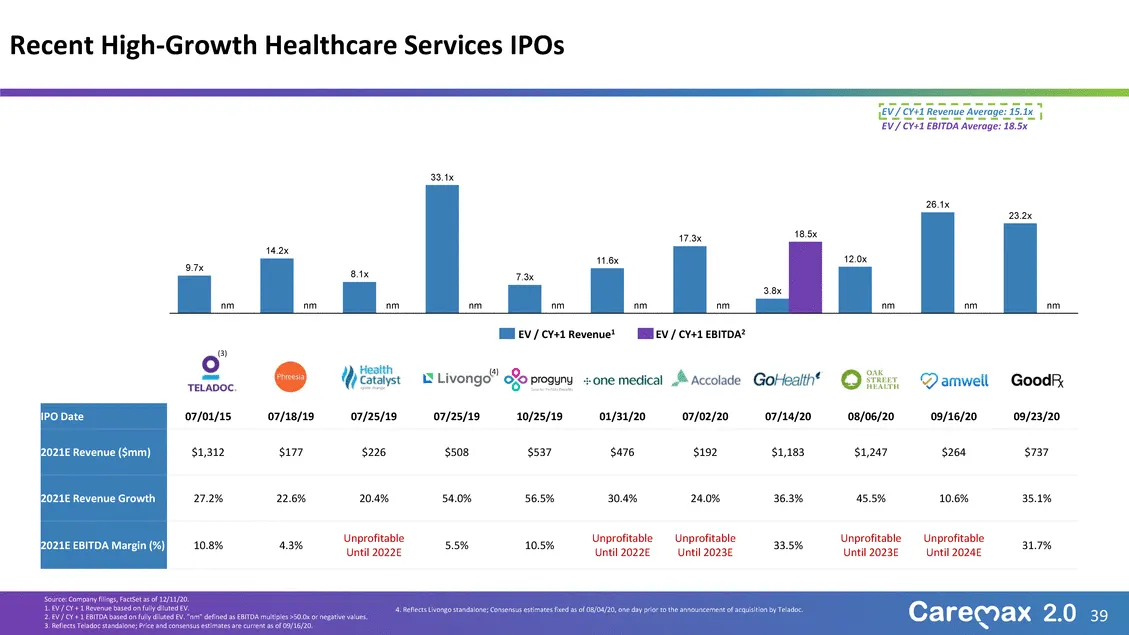
EV / CY+1 Revenue Average: 15.1x EV / CY+1 EBITDA Average: 18.5x 33.1x 9.7x 14.2x 8.1x 7.3x 11.6x 17.3x 3.8x 18.5x 12.0x 26.1x 23.2x nm nm nm nm nm nm nm nm nm nm EV / CY+1 Revenue1 EV / CY+1 EBITDA2 (3) (4) Source: Company filings, FactSet as of 12/11/20. 1. EV / CY + 1 Revenue based on fully dilut

Slide 40: Appendix D: Business Overviews
Appendix D: Business Overviews 40
Slide 41: CareMax Company Overview
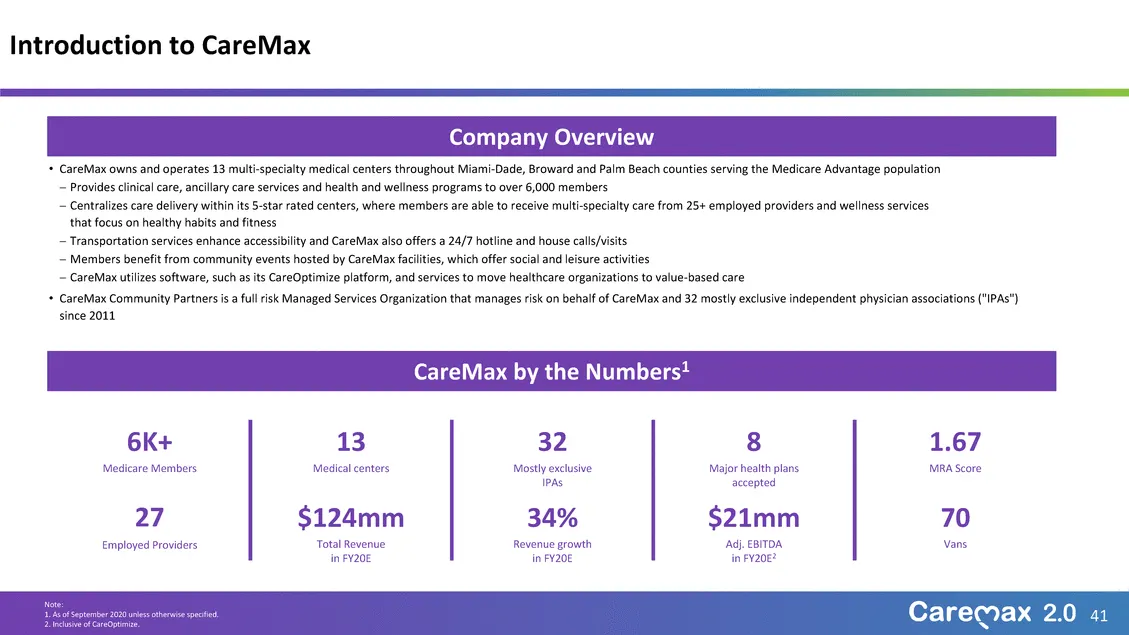
Company Overview • CareMax owns and operates 13 multi-specialty medical centers throughout Miami-Dade, Broward and Palm Beach counties serving the Medicare Advantage population − Provides clinical care, ancillary care services and health and wellness programs to over 6,000 members − Centralizes care
Slide 42: CareOptimize Company Overview
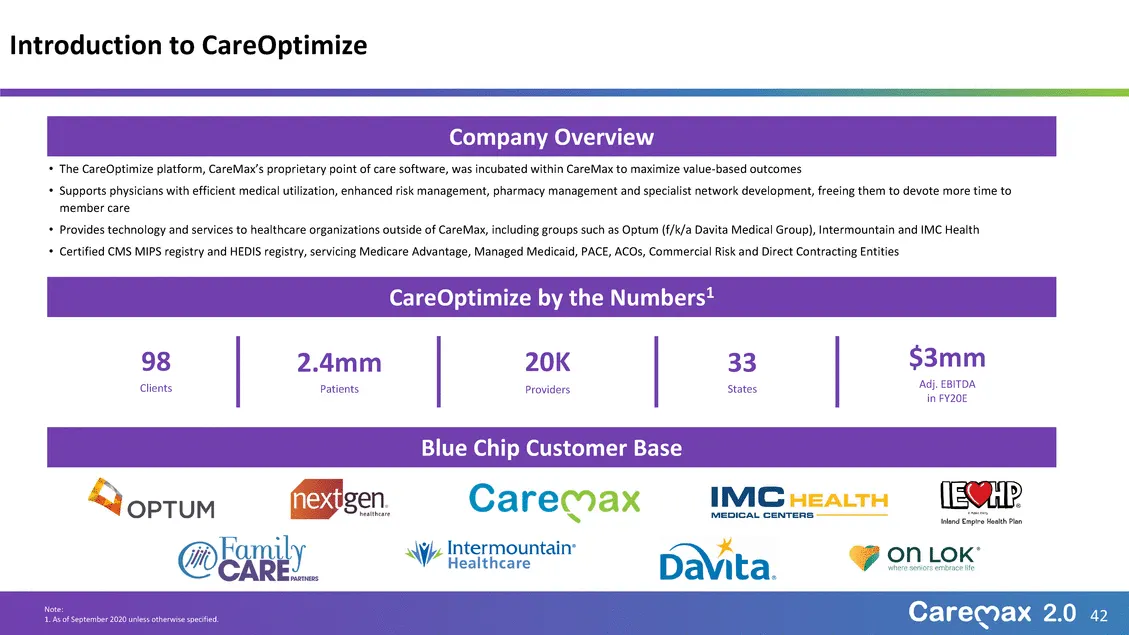
Company Overview • The CareOptimize platform, CareMax’s proprietary point of care software, was incubated within CareMax to maximize value-based outcomes • Supports physicians with efficient medical utilization, enhanced risk management, pharmacy management and specialist network development, freein
Slide 43: IMC Health Company Overview
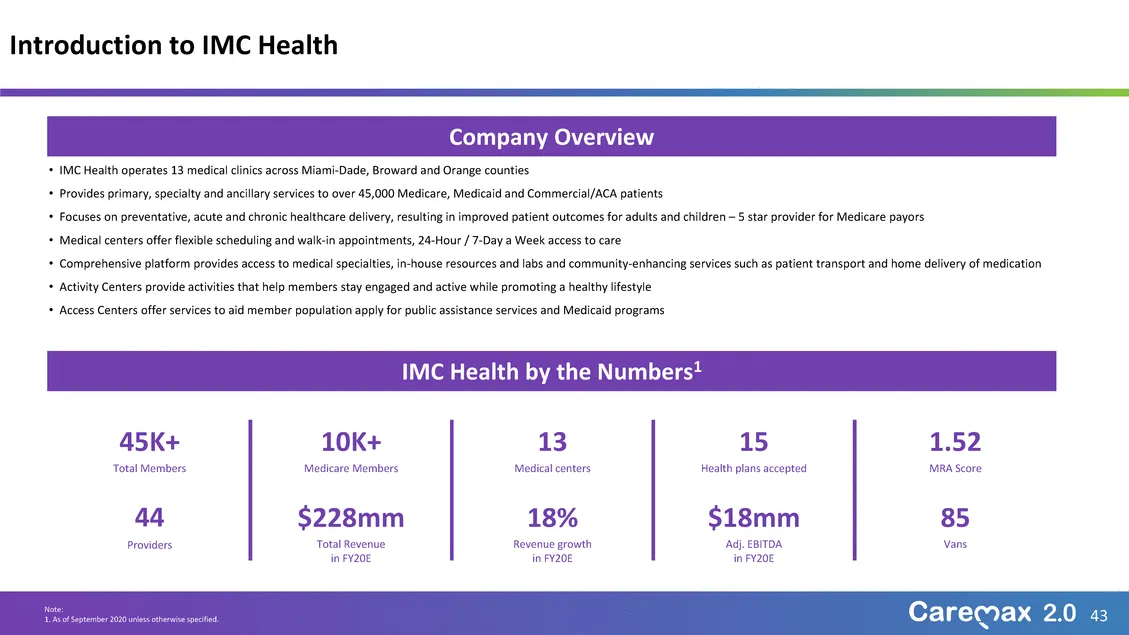
Company Overview • IMC Health operates 13 medical clinics across Miami-Dade, Broward and Orange counties • Provides primary, specialty and ancillary services to over 45,000 Medicare, Medicaid and Commercial/ACA patients • Focuses on preventative, acute and chronic healthcare delivery, resulting in i

Slide 44: Appendix E: Additional Information
Appendix E: Additional Information 44
Slide 45: PF Revenue by Line of Business and Membership
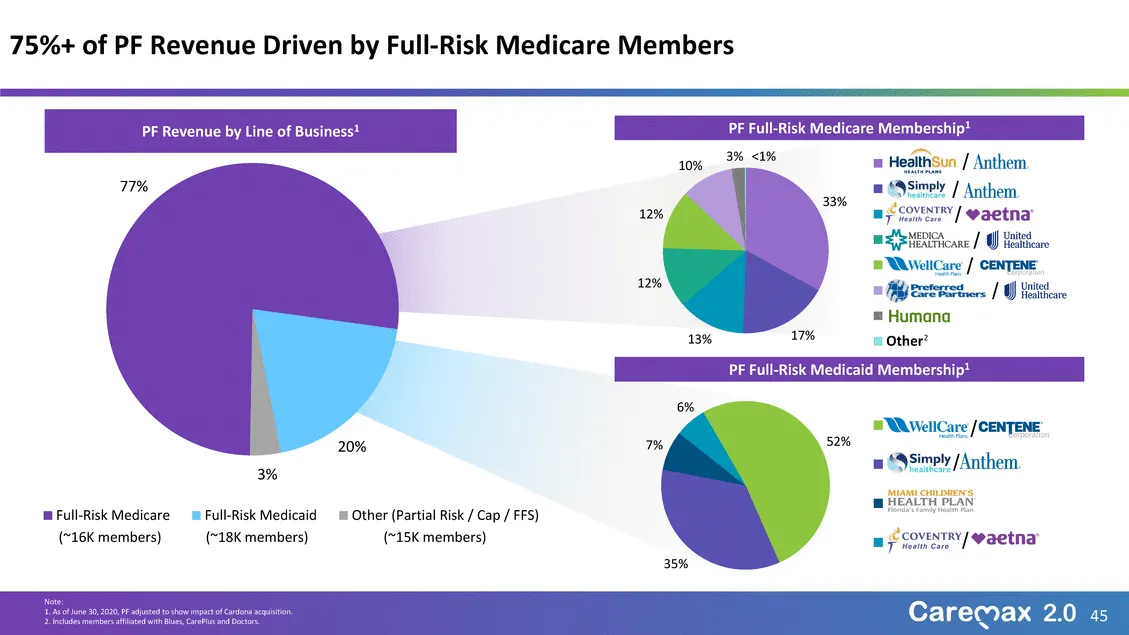
PF Revenue by Line of Business1 PF Full-Risk Medicare Membership1 77% 12% 12% 10% 3% <1% / / / / / / 13% 17% Other2 PF Full-Risk Medicaid Membership1 20% 3% Full-Risk MedicareFull-Risk MedicaidOther (Partial Risk / Cap / FFS) (~16K members) (~18K members)(~15K members) 6% / 7% 52% / / 35% Note: 45 2
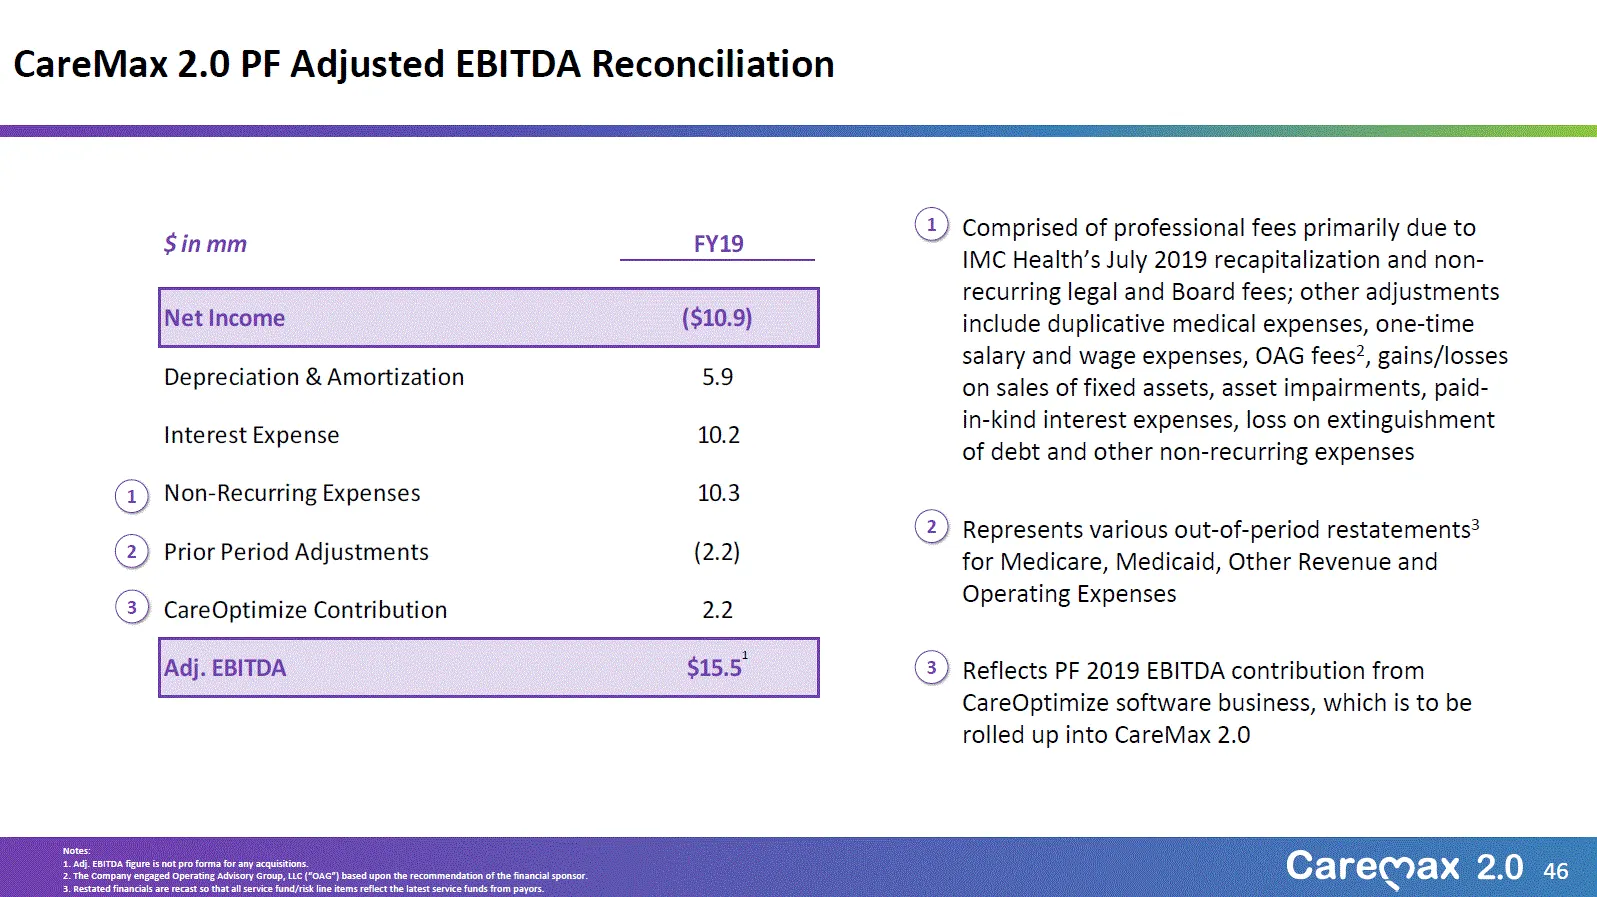
Slide 46: Adj. EBITDA reconciliation
$ in mm FY19 Net Income($10.5) Depreciation & Amortization5.9 Interest Expense9.8 1 Non-Recurring Expenses10.3 2 Prior Period Adjustments(2.2) 3 CareOptimize Contribution2.2 1 Comprised of professional fees primarily due to IMC Health’s July 2019 recapitalization and non-recurring legal and Board fe
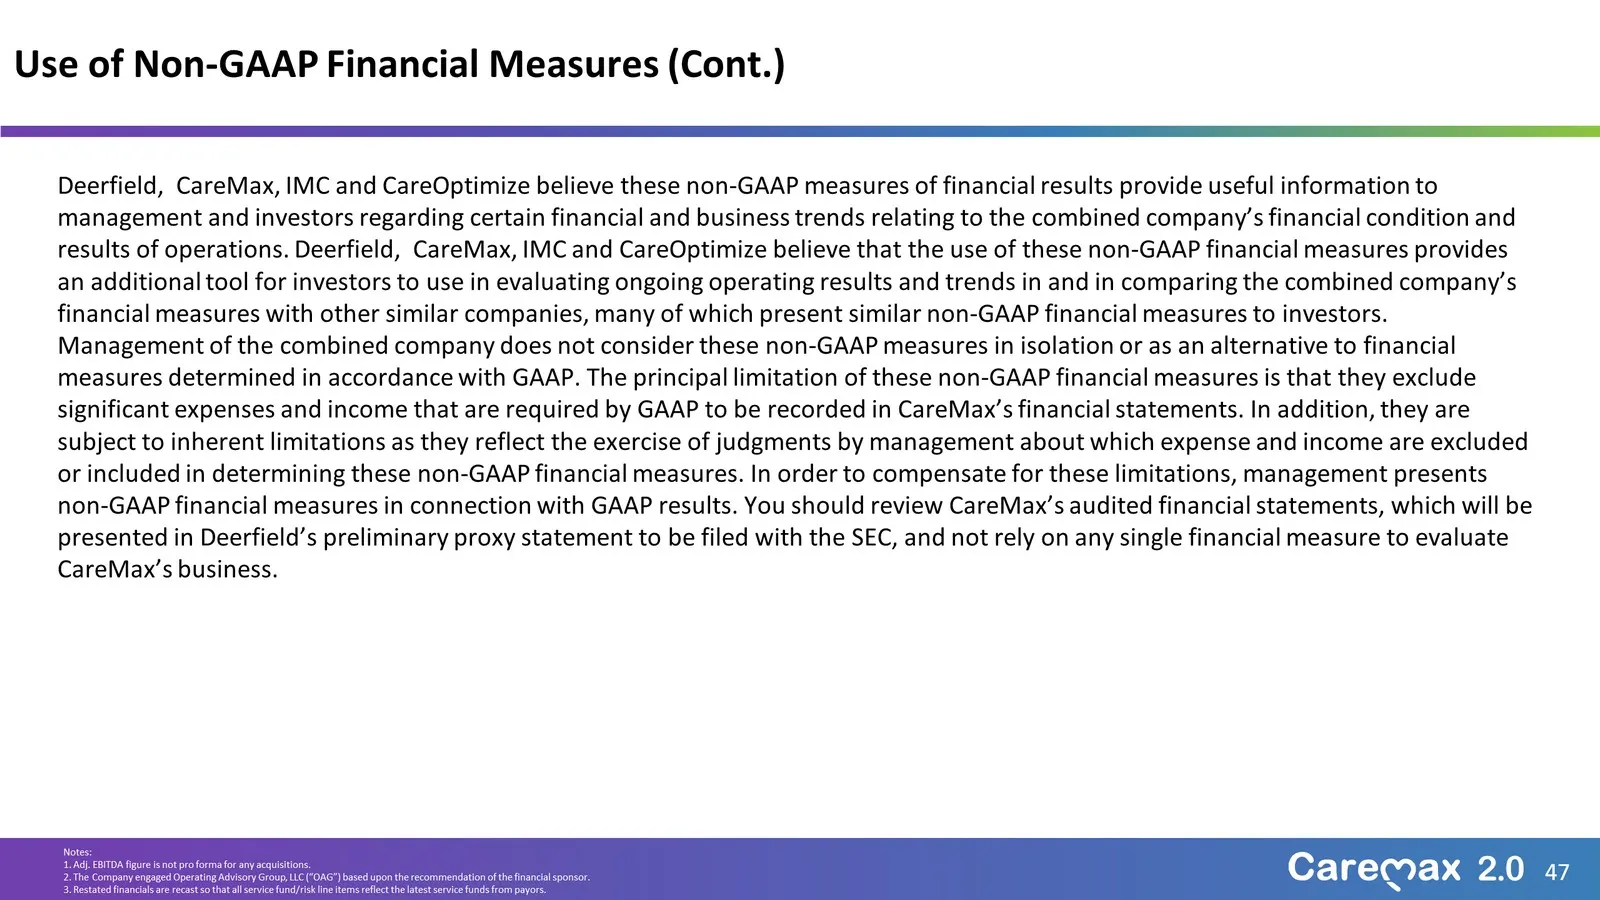
Slide 47: Use of Non-GAAP Financial Measures (Cont.)
47 Use of Non - GAAP Financial Measures (Cont.) 47 Notes: 1. Adj. EBITDA figure is not pro forma for any acquisitions. 2. The Company engaged Operating Advisory Group, LLC (“OAG”) based upon the recommendation of the financial sponsor. 3. Restated financials are recast so that all service fund/risk
Source: SEC EDGAR · 8-K filed Dec 18, 2020
More decks from CareMax Inc
 Presentation (January 2025)8 slides · Jan 3, 2025
 Q3 2023 Earnings Presentation15 slides · Nov 9, 2023
 Q2 2023 Earnings Presentation16 slides · Aug 9, 2023
 Q1 2023 Earnings Presentation14 slides · May 10, 2023
 Investor Day (March 2023)95 slides · Mar 13, 2023
 FY2022 Earnings Presentation14 slides · Mar 9, 2023