Capital Bank Financial — Q1 2014 Earnings Presentation
23 slides from Capital Bank Financial's earnings presentation, Apr 17, 2014
Slide 1: 2014 First Quarter Earnings
@® CAPITAL BANK FINANCIAL CORP 2014 First Quarter Earnings April 17, 2014
Slide 2: Safe Harbor Statement
@© Safe Harbor Statement Forward-Looking Statements Information in this presentation forward-looking Any statements about our expectations, beliefs, plans, predictions, forecasts, objectives, assumptions or future events or performance are not historical facts and may be forward- ints are often, but
Slide 3: Our Path to Investor Returns
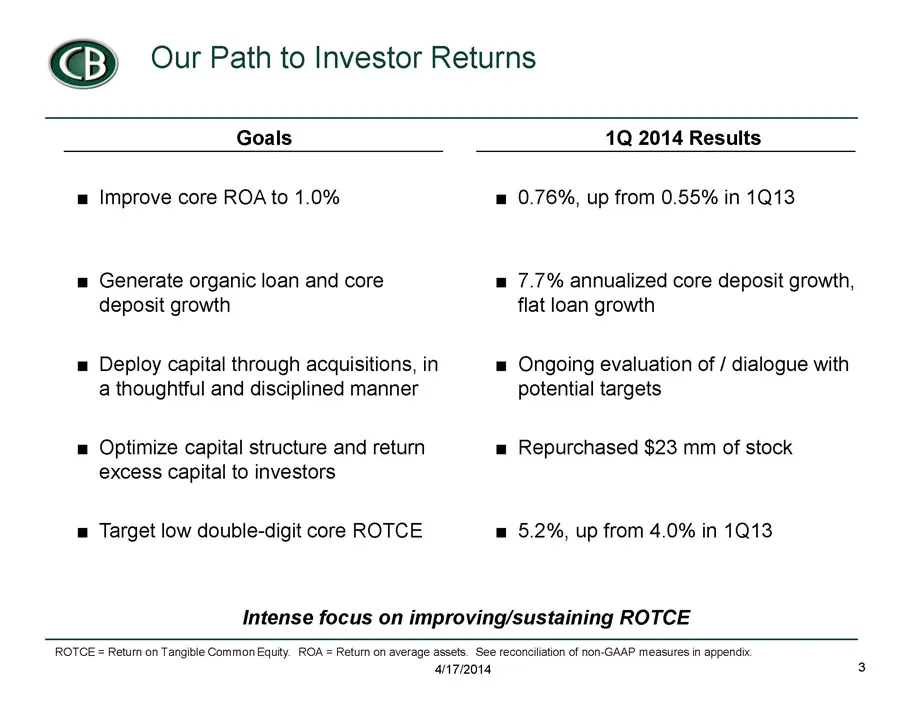
@© Our Path to Investor Returns Goals 1Q 2014 Results m Improve core ROA to 1.0% m 0.76%, up from 0.55% in 1Q13 m Generate organic loan and core = 7.7% annualized core deposit growth, deposit growth flat loan growth = Deploy capital through acquisitions, in m= Ongoing evaluation of / dialogue with a
Slide 4: The Capital Bank Story
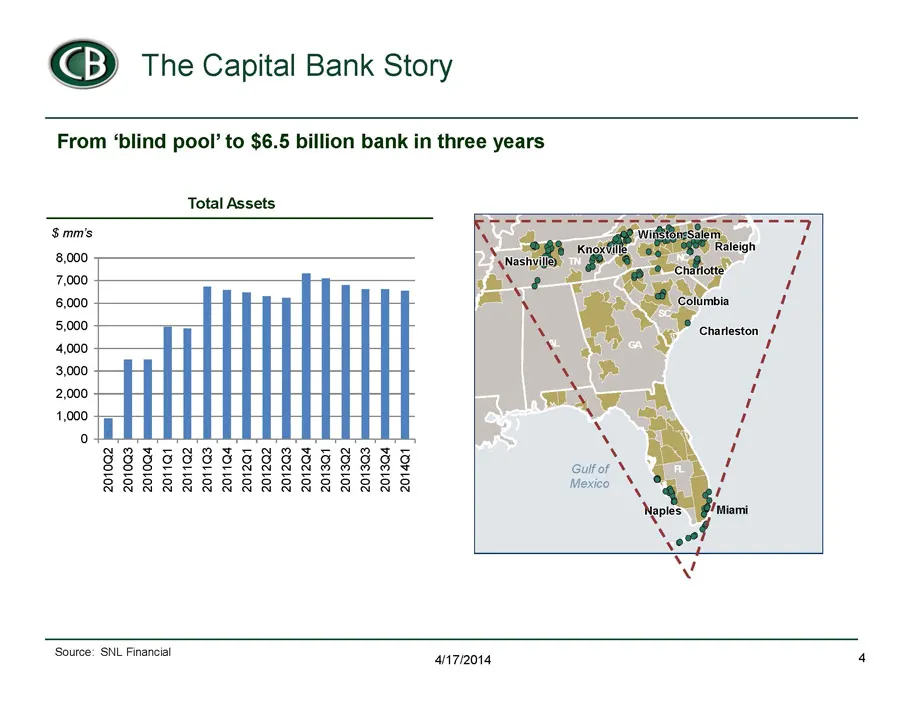
@© The Capital Bank Story From ‘blind pool’ to $6.5 billion bank in three years Total Assets 201002 jam 201003 201004 201101 201102 201103 201104 201201 201202 201203 201204 201301 201302 201303 201304 201401 a — = — Ss a leigh “ nasi i by ! she a ‘en: 2 Roe = ini \ Ul B.S + - Charleston / . ay 1 Ss
Slide 5: We've Built One Bank out of Seven Acquisitions
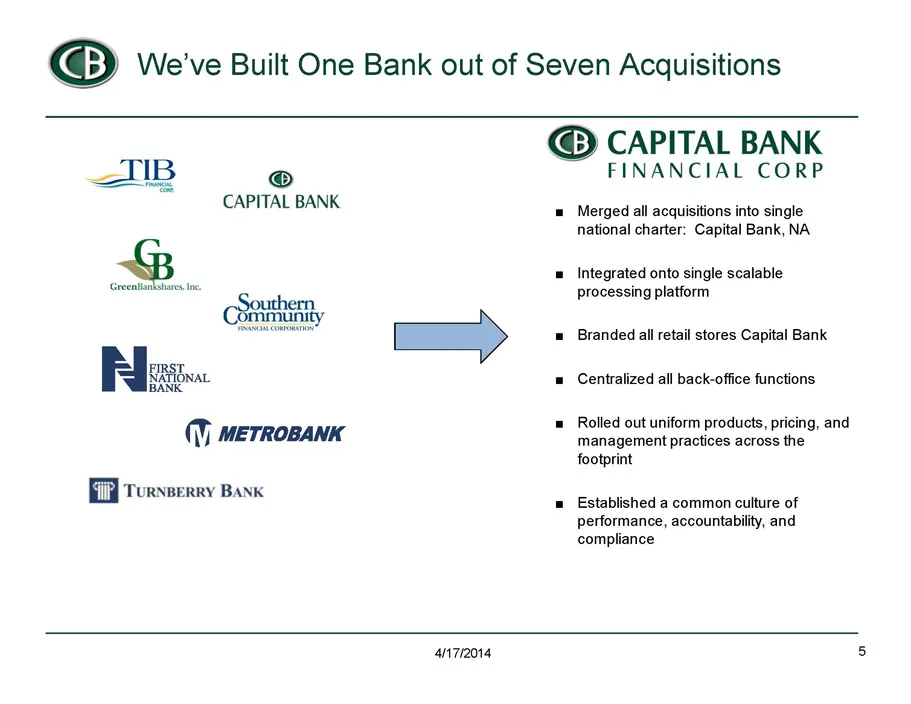
@© We've Built One Bank out of Seven Acquisitions @ CAPITAL BANK & shares. ne Ne NATIONAL BANK (\j METROBANK ‘i TURNBERRY BANK @ CAPITAL BANK FINANCIAL CORP Merged all acquisitions into single national charter: Capital Bank, NA Integrated onto single scalable processing platform Branded all retail s
Slide 6: First Quarter Highlights
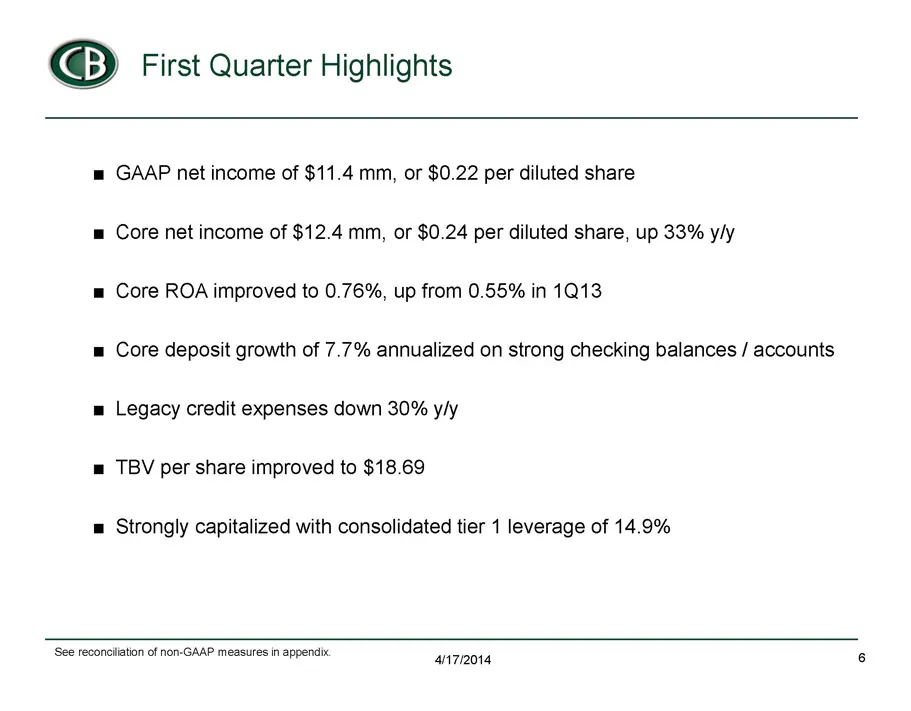
@© First Quarter Highlights m GAAP net income of $11.4 mm, or $0.22 per diluted share m Core net income of $12.4 mm, or $0.24 per diluted share, up 33% y/y m Core ROA improved to 0.76%, up from 0.55% in 1Q13 = Core deposit growth of 7.7% annualized on strong checking balances / accounts m Legacy cre
Slide 7: First Quarter Core Earnings Summary
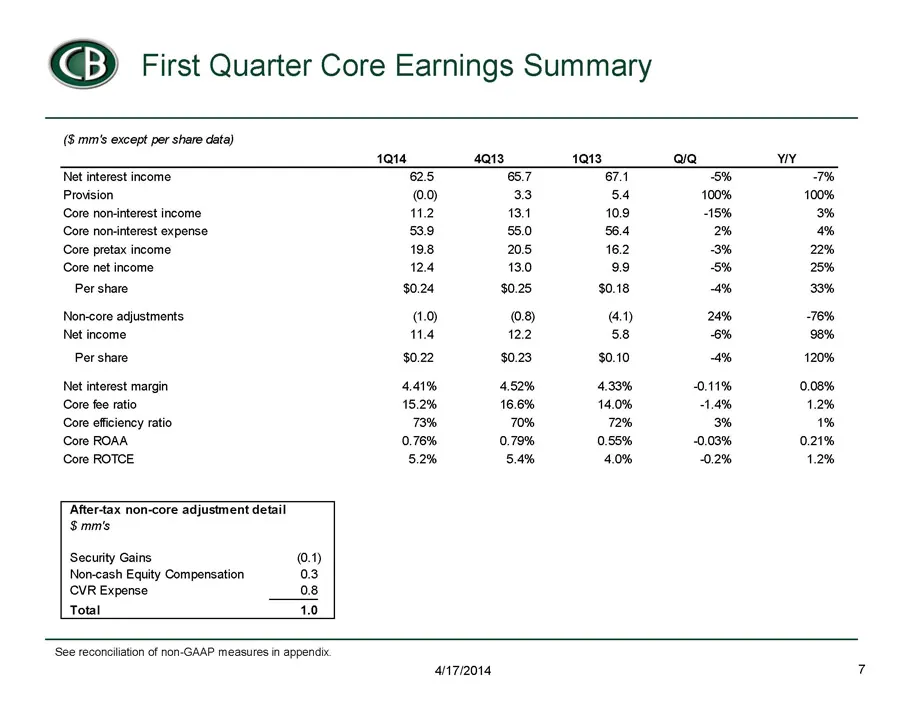
@© First Quarter Core Earnings Summary ($ mm’s except per share data) 1014 4a13 1013 aia yw Net interest income @25 7 Gal 5% 7% Provision 0.9) 33 54 100% 100% Core non-interest income 12 13.4 109 15% 3% Core non-interest expense 53.9 55.0 56.4 2% 4% Core pretax income 198 205 162 3% 22% Core net inc
Slide 8: New Loan Production Flat Y/Y
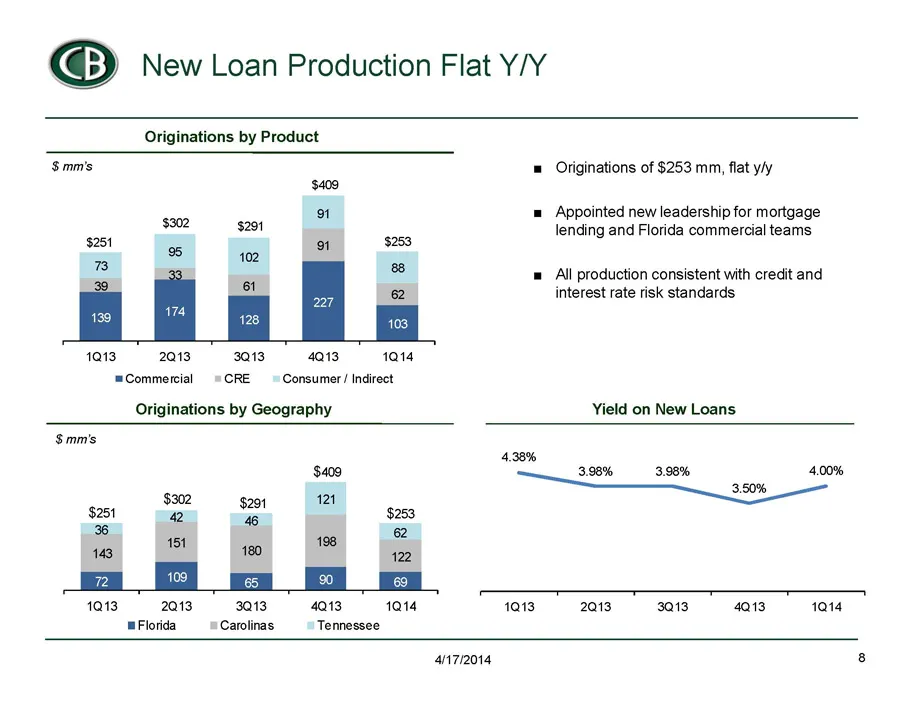
@© New Loan Production Flat Y/Y Originations by Product $ mms = Originations of $253 mm, flat y/y $409, 1 = Appointed new leadership for mortgage $302 $291 lending and Florida commercial teams $251 o $253 a oS 102 & = All production consistent with credit and 3% G @ interest rate risk standards fos,
Slide 9: Loan Portfolio Flat in 1Q
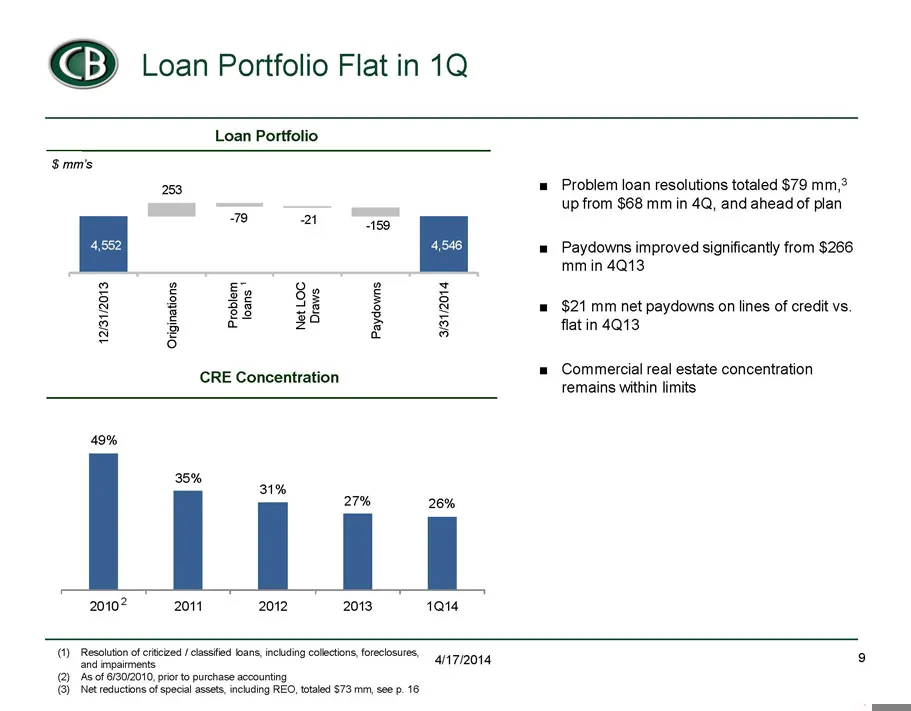
©@©) oan Portfolio Flat in 1a Loan Portfolio $mm's 20 = i 2 g Be Be & 3 < 2 = 6 CRE Concentration lita 20107 2011 2013 1014 Problem loan resolutions totaled $79 mm,> Up from $68 mm in 4Q, and ahead of plan Paydowns improved significantly from $266 mm in 413 $21 mm net paydowns on lines of credit vs.
Slide 10: Continued Improvement in Deposit Quality and Cost
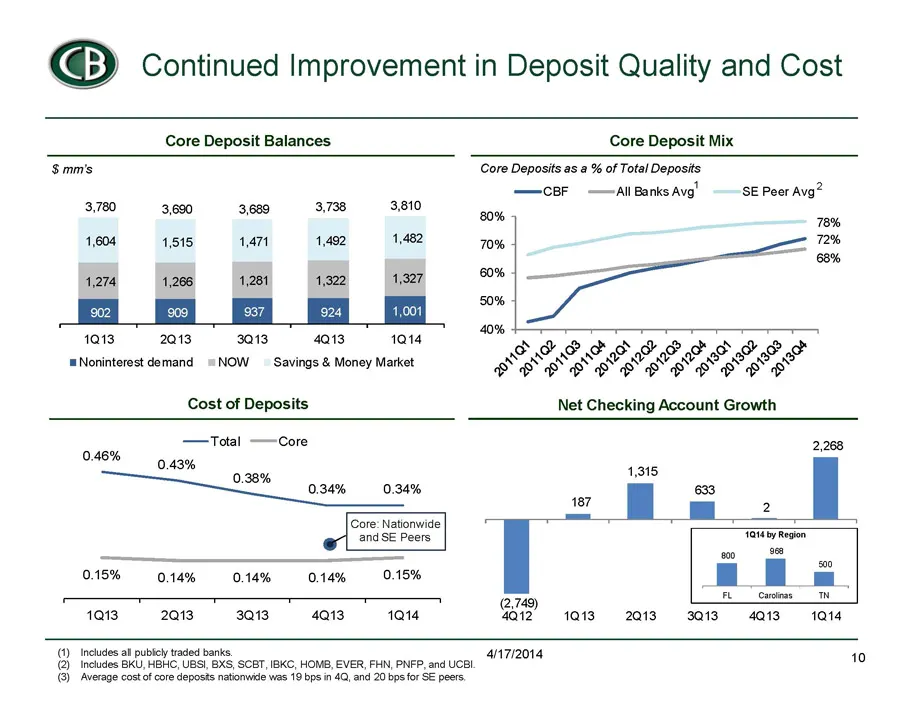
@© Continued Improvement in Deposit Quality and Cost Core Deposit Balances Core Deposit Mix $ mms Core Deposits as a % of Total Deposits —ceF =—AallBanks Avg’ SE Peer Avg? 3,780 3,738 3,810 i 3,690 3,689 om, 108% 1,604 1,515 4471 1,492 1,482 a ~ 68% 4,274 1,266 4,281 4,322 1,327 60%, 50% 1013 2013 3
Slide 11: NIM Declines on Lower Loan Yields
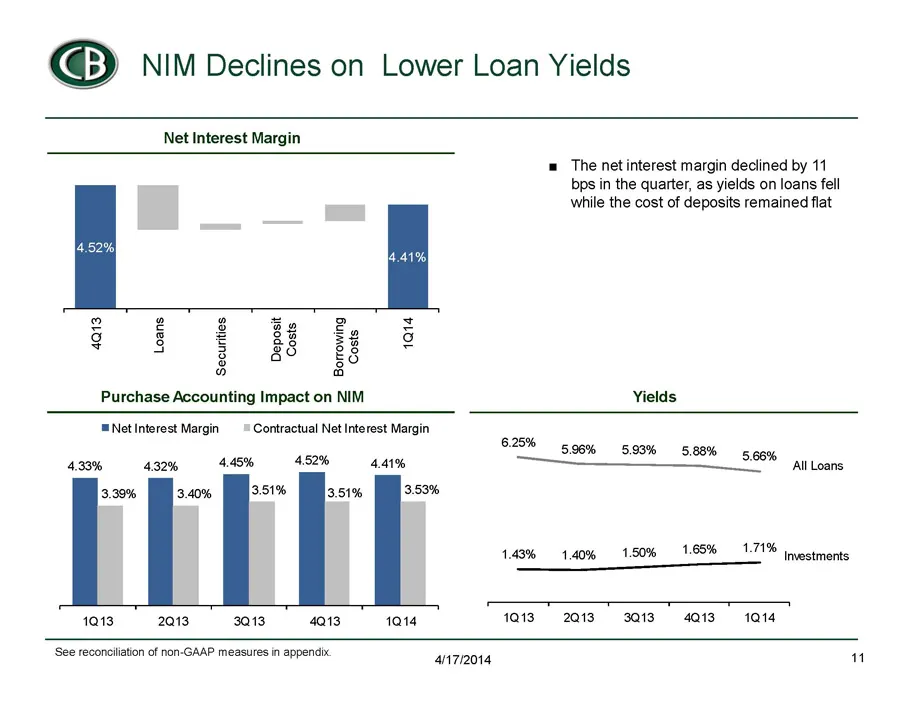
@© NIM Declines on Lower Loan Yields Net Interest Margin = The net interest margin declined by 11 bps in the quarter, as yields on loans fell while the cost of deposits remained flat 2 3 2 2 § & & 3¢ && & S$ S$ § gS gg © a 5° 3 8 Purchase Accounting Impact on NIM Yields ‘™ Net Interest Margin Contra
Slide 12: Core Noninterest Income Flat Y/Y
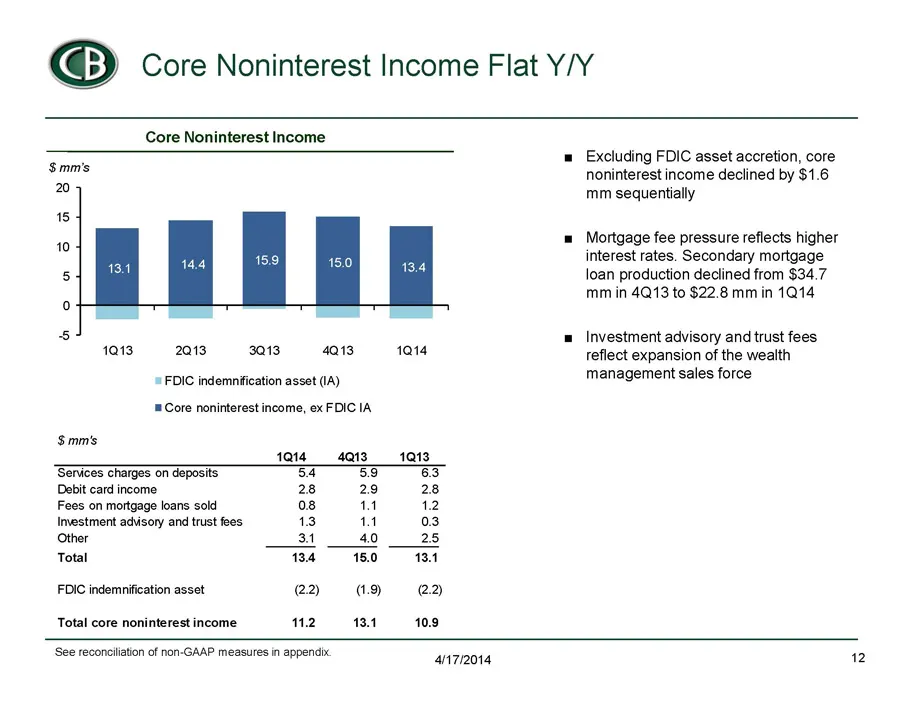
@© Core Noninterest Income Flat Y/Y Core Noninterest Income ; = Excluding FDIC asset accretion, core smas. noninterest income declined by $1.6 2 mm sequentially 15 10 = Mortgage fee pressure reflects higher interest rates. Secondary mortgage 5 loan production deciined from $34.7 mm in 4Q13 to $22.8
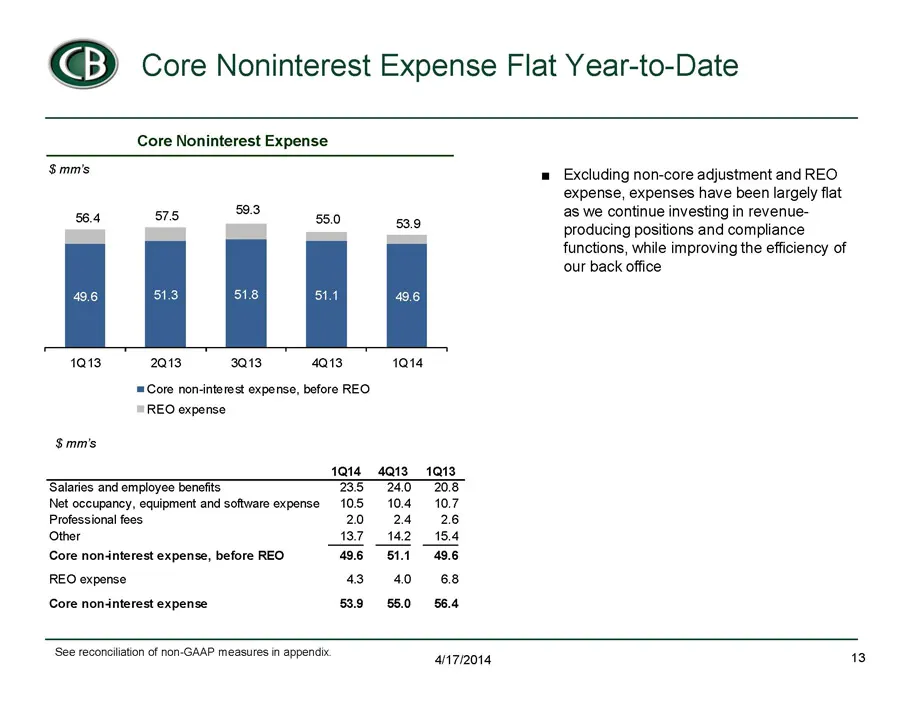
Slide 13: Core Noninterest Expense Flat Year-to-Date
@© Core Noninterest Expense Flat Year-to-Date Core Noninterest Expense $mm's 56.4 575 593 55.0 a0 fais” a1s QS aS ™Core non-interest expense, before REO REO expense $mm's 1014 4Q13 1013 Salaries and employee benefits 235° 24.0 20.8 Net occupancy, equipment and software expense 105 104 10.7 Professio
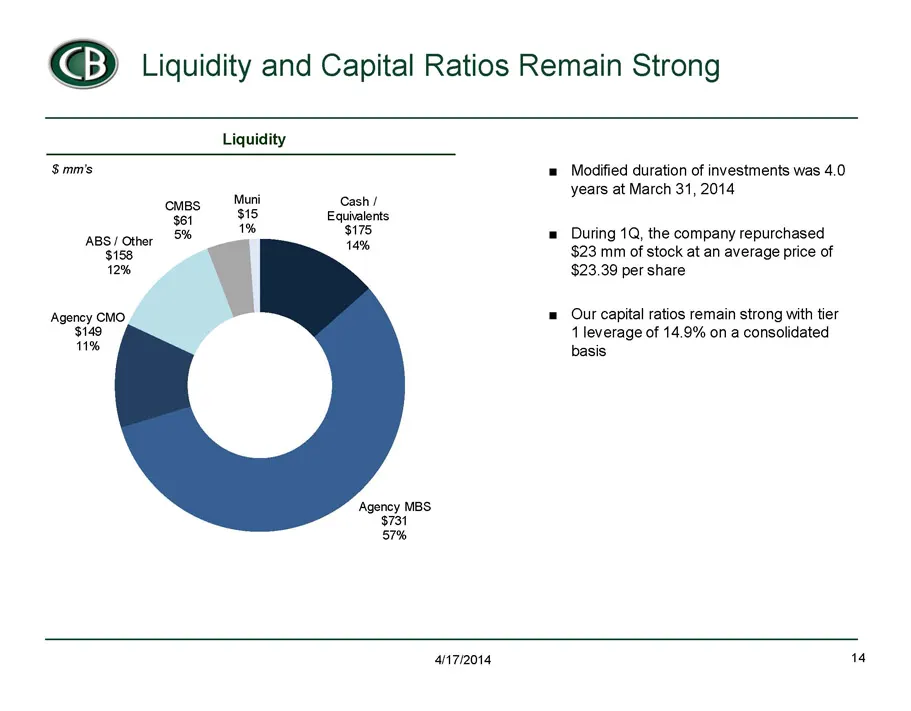
Slide 14: Liquidity and Capital Ratios Remain Strong
@© Liquidity and Capital Ratios Remain Strong Liquidity $mm's = Modified duration of investments was 4.0 years at March 31, 2014 1% $ = During 1Q, the company repurchased earl $23 mm of stock at an average price of $23.39 per share = Our capital ratios remain strong with tier 1 leverage of 14.9% on
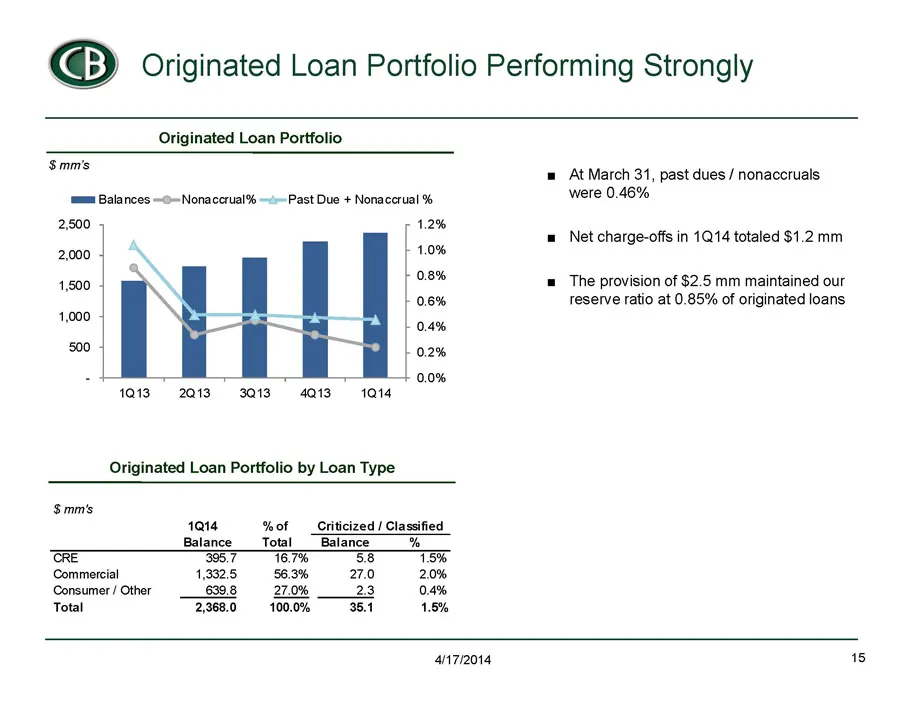
Slide 15: Originated Loan Portfolio Performing Strongly
@© Originated Loan Portfolio Performing Strongly Originated Loan Portfolio S$ mms ‘mms Balances ~©~Nonaccrual% ~~Past Due + Nonacerual % 2,500 1.2% 2000, © 1.0% 0.8% 1,500 0.6% 1,000 0.4% ed 0.2% : 0.0% 1013 2013-3013 4Q13- 1014 Originated Loan Portfolio by Loan Type $mm's 1014 of _Criticized / Clas
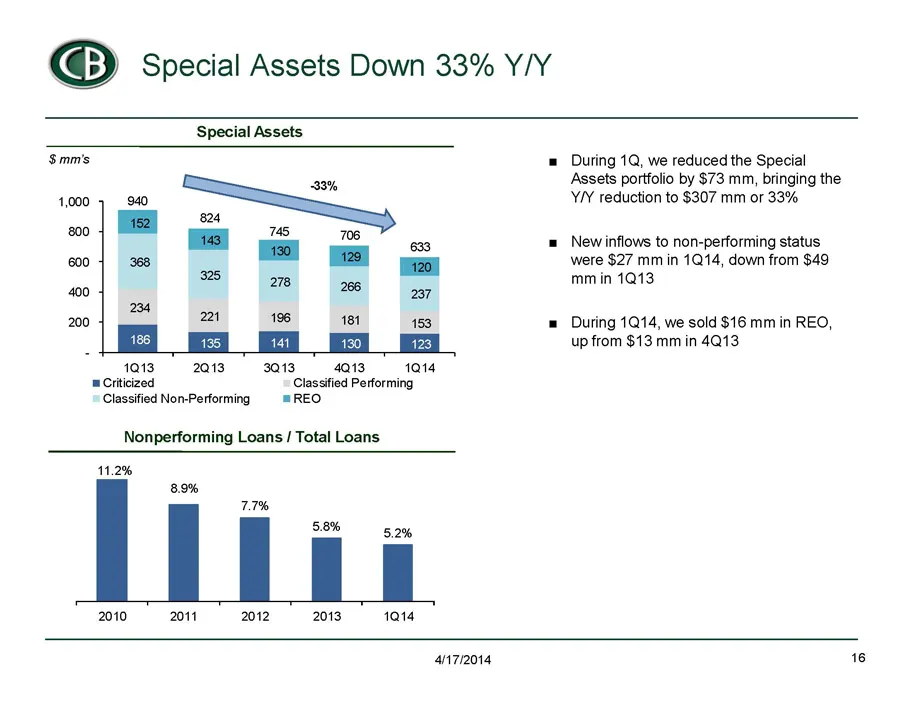
Slide 16: Special Assets Down 33% Y/Y
@© Special Assets Down 33% Y/Y Special Assets = During 1, we reduced the Special Assets portfolio by $73 mm, bringing the YY reduction to $307 mm or 33% = New inflows to non-performing status were $27 mm in 1Q14, down from $49 mm in 1013 = During 1Q14, we sold $16 mm in REO, up from $13 mm in 4013 1
Slide 17: Legacy Credit Expenses Declining
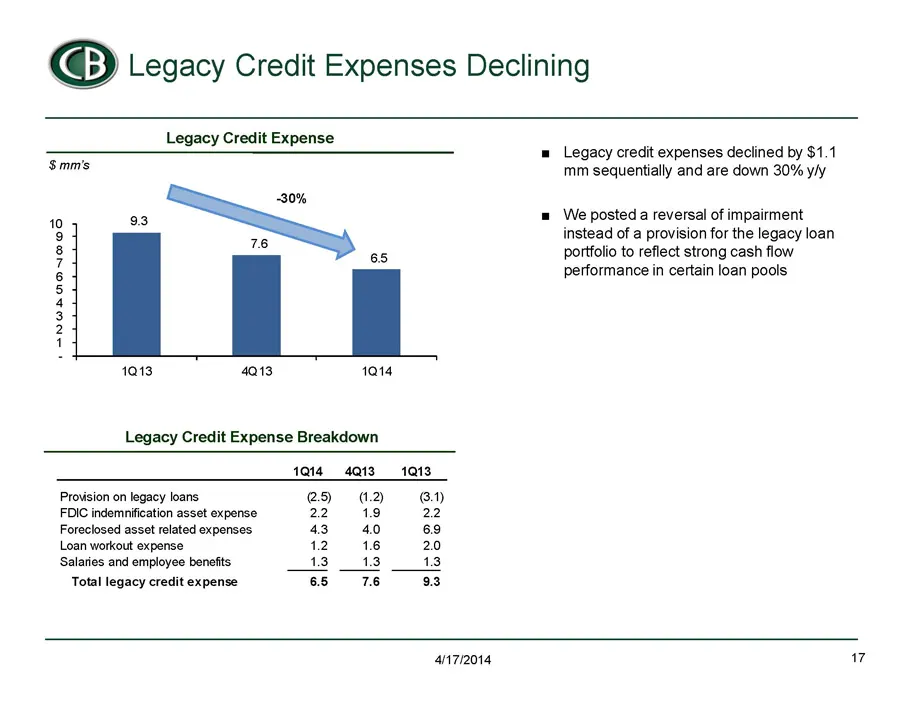
@© Legacy Credit Expenses Declining Legacy Credit Expense Smm's 30% 10 93 9 H 76 os § 6 5 4 3 2 1 1013 413 1014 Legacy Credit Expense Breakdown 1014 4013 Provision on legacy loans es) 1.2) FDIC indemnification asset expense 2219 Foreclosed asset related expenses 43 40 Loan workout expense 12 16 Sala
Slide 18: Our Path to Investor Returns
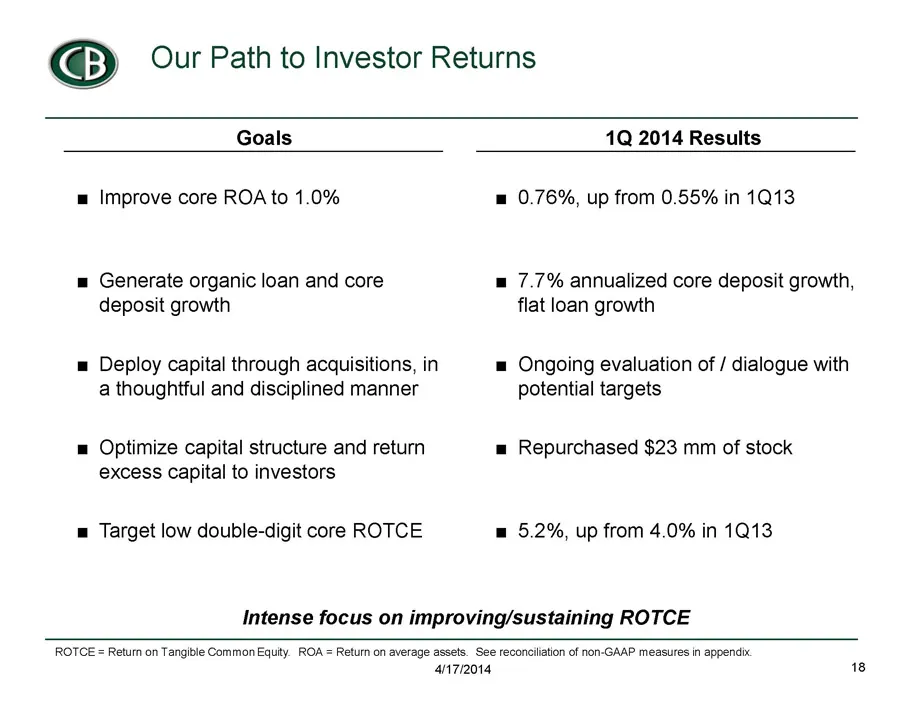
@© Our Path to Investor Returns Goals 1Q 2014 Results m Improve core ROA to 1.0% m 0.76%, up from 0.55% in 1Q13 m Generate organic loan and core = 7.7% annualized core deposit growth, deposit growth flat loan growth = Deploy capital through acquisitions, in m= Ongoing evaluation of / dialogue with a
Slide 19: Appendix
Appendix
Slide 20: Reconciliation of Core Noninterest Income / Expense
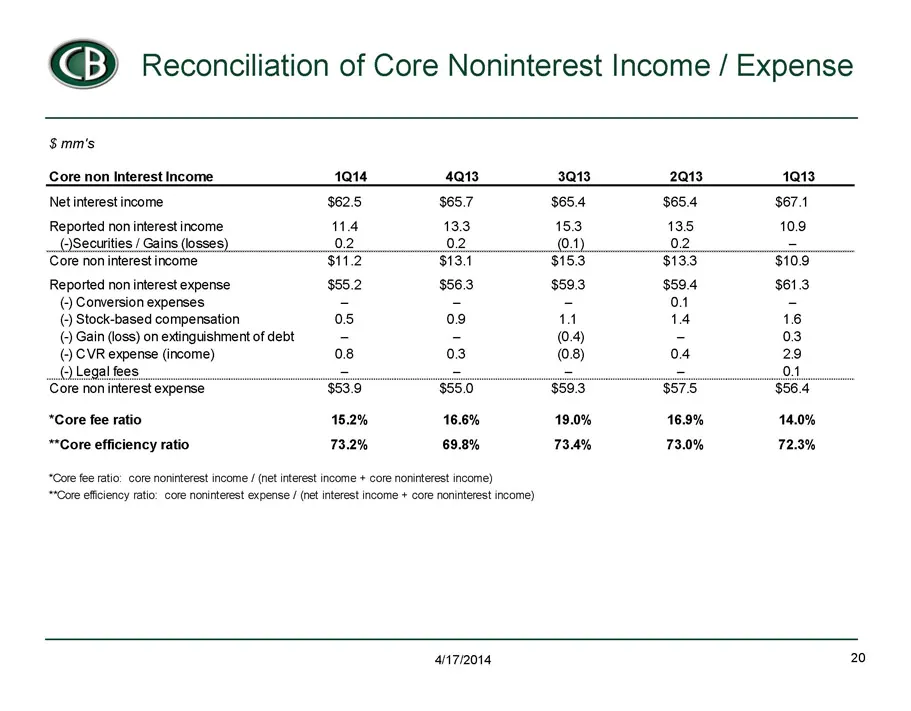
@© Reconciliation of Core Noninterest Income / Expense $mm's Core non Interest Income 1014 4013 3013 2013 1013 Net interest income $62.5 $65.7 $65.4 $65.4 $67.1 Reported non interest income 14 133 153 135 109 (Securities / Gains (losses) 02 02 (On 02 = ‘Core non interest income $112 313.1 $153 $133
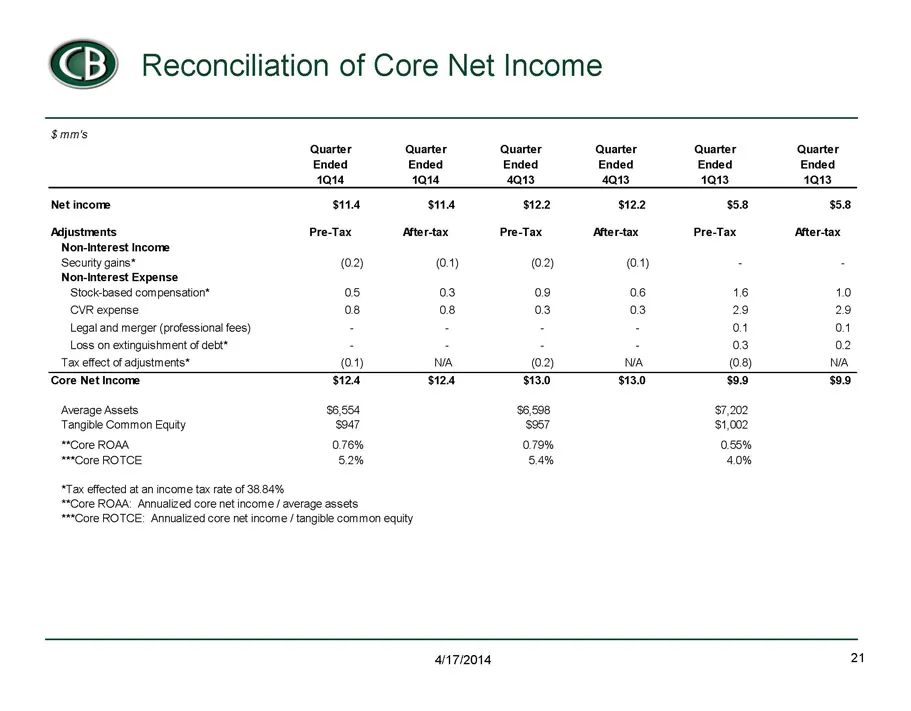
Slide 21: Reconciliation of Core Net Income
@© Reconciliation of Core Net Income $mm's Quarter Quarter Quarter Quarter Quarter Quarter Ended Ended Ended Ended Ended Ended 1014 1014 4013, 4013, 1013 4013 Net income sit st s122 $122 $58 $58 ‘Adjustments Pre-Tax Ater-tax Pre-Tax Attor-tax Ater-tax Non-Interest Income ‘Secunty gains* (02) (01) (0
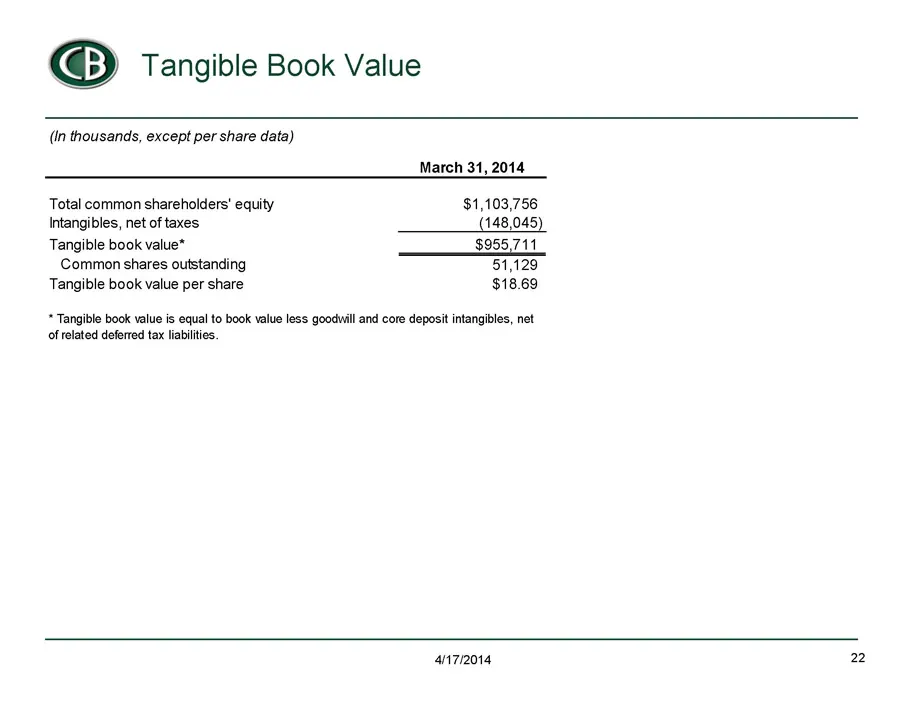
Slide 22: Tangible Book Value
@© Tangible Book Value (in thousands, except per share data) March 31, 2014 Total common shareholders’ equity $1,103,756 Intangibles, net of taxes 148,045) Tangible book value* $955,711 Common shares outstanding 51,129 Tangible book value per share $18.69 * Tangible book value is equal to book value
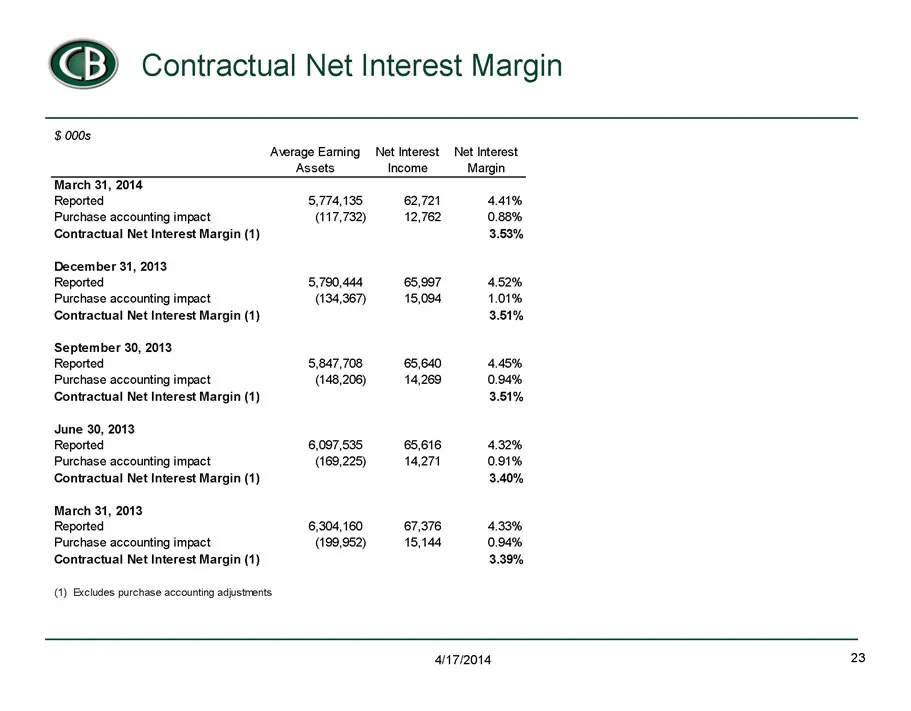
Slide 23: Contractual Net Interest Margin
@© Contractual Net Interest Margin $ 000s ‘Average Eaming Net Interest Net Interest Assets Income Margin March 31, 2014 Reported 5,774,195 62,721 41% Purchase accounting impact (117,732) 12,762 0.88% Contractual Net Interest Margin (1) 3.53% December 31, 2013 Reported 5,790,444 65,997 452% Purchase
Source: SEC EDGAR · 8-K filed Apr 17, 2014
More decks from Capital Bank Financial Corp
 Q2 2017 Earnings Presentation22 slides · Jul 14, 2017
 Morgan Stanley Financial Services Conference 201715 slides · Jun 13, 2017
 Merger or Acquisition (June 2017)27 slides · Jun 6, 2017
 Merger or Acquisition (May 2017)17 slides · May 4, 2017
 Q1 2017 Earnings Presentation21 slides · Apr 21, 2017
 Q4 2016 Earnings Presentation25 slides · Jan 26, 2017