Ellaktor SA · ATHEX:ELLAKTOR
Ellaktor SA — El.Tech. Anemos — FY2018 Earnings Presentation
14 slides from Ellaktor SA's earnings presentation, April 2019
Slide 1: FY 2018 Results
EL.TECH. ANEMOS MEMBER OF ELLAKTOR GROUP FY 2018 Results April 2019
Slide 2: Performance & main events
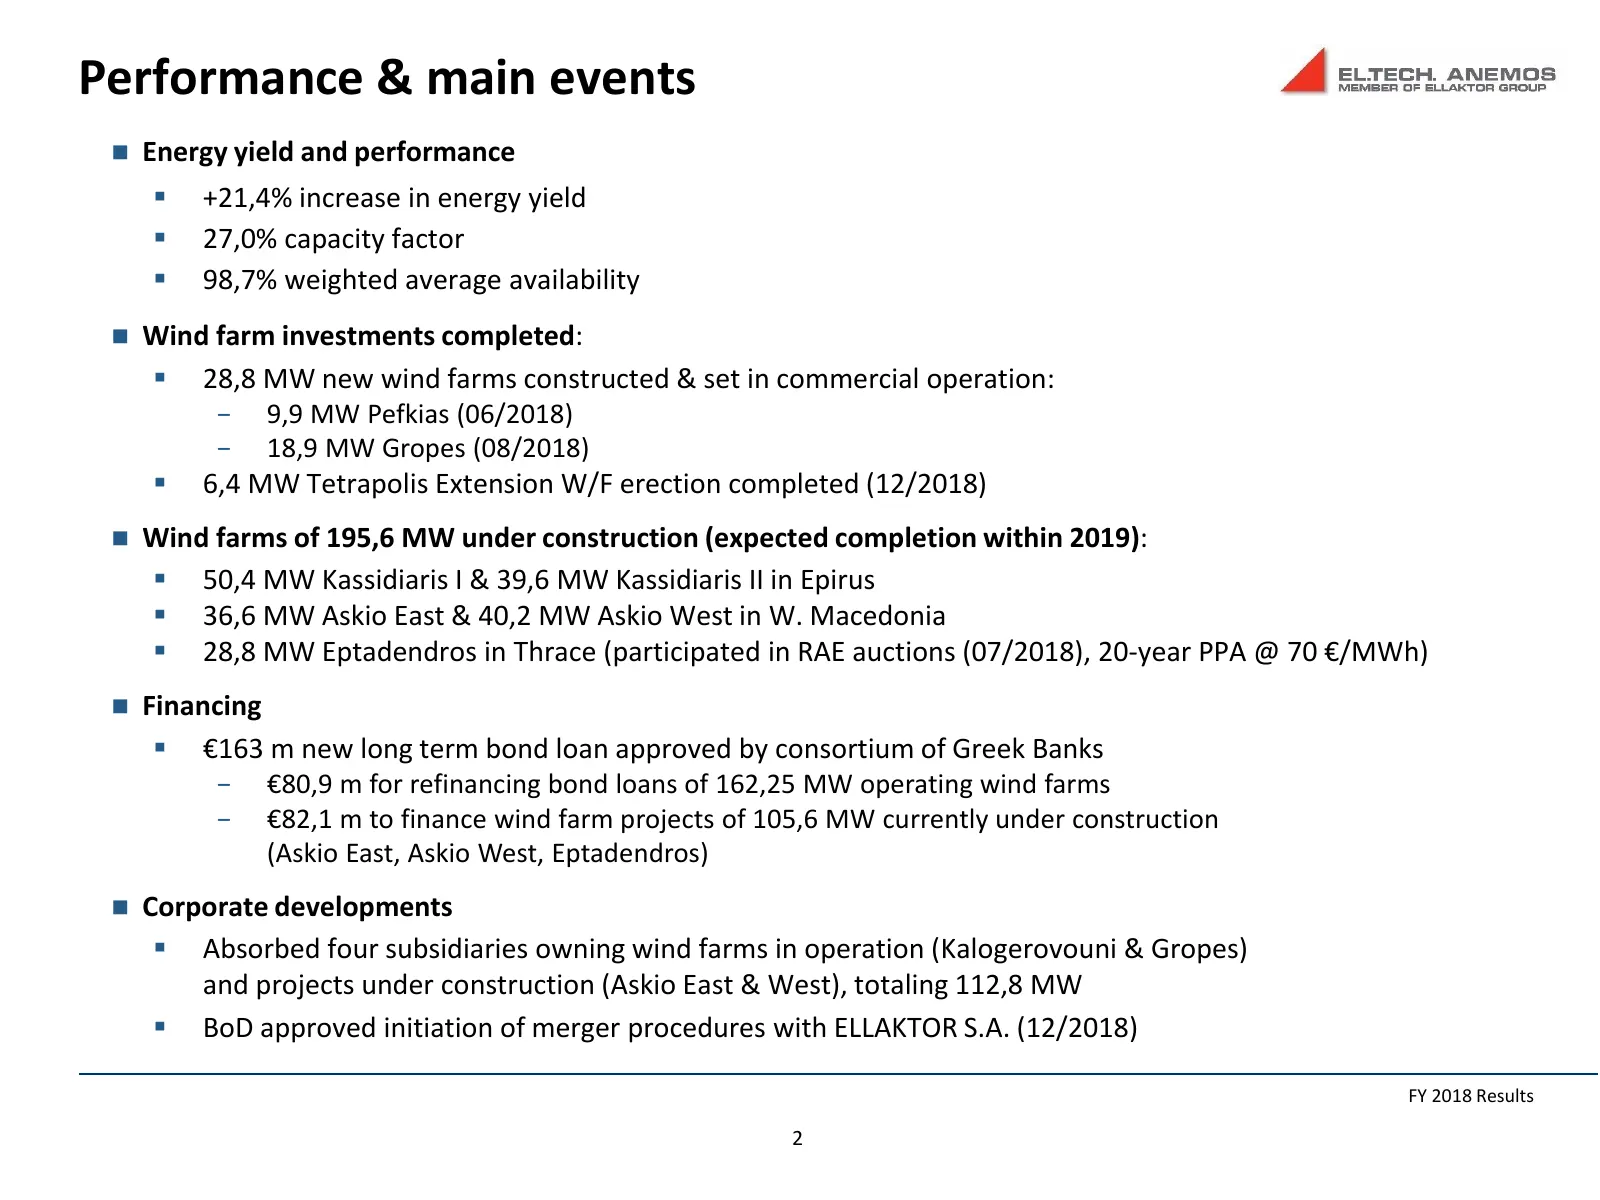
Performance & main events Energy yield and performance +21,4% increase in energy yield 27,0% capacity factor 98,7% weighted average availability Wind farm investments completed: 28,8 MW new wind farms constructed & set in commercial operation: − 9,9 MW Pefkias (06/2018) − 18,9 MW Gropes
Slide 3: Financial highlights
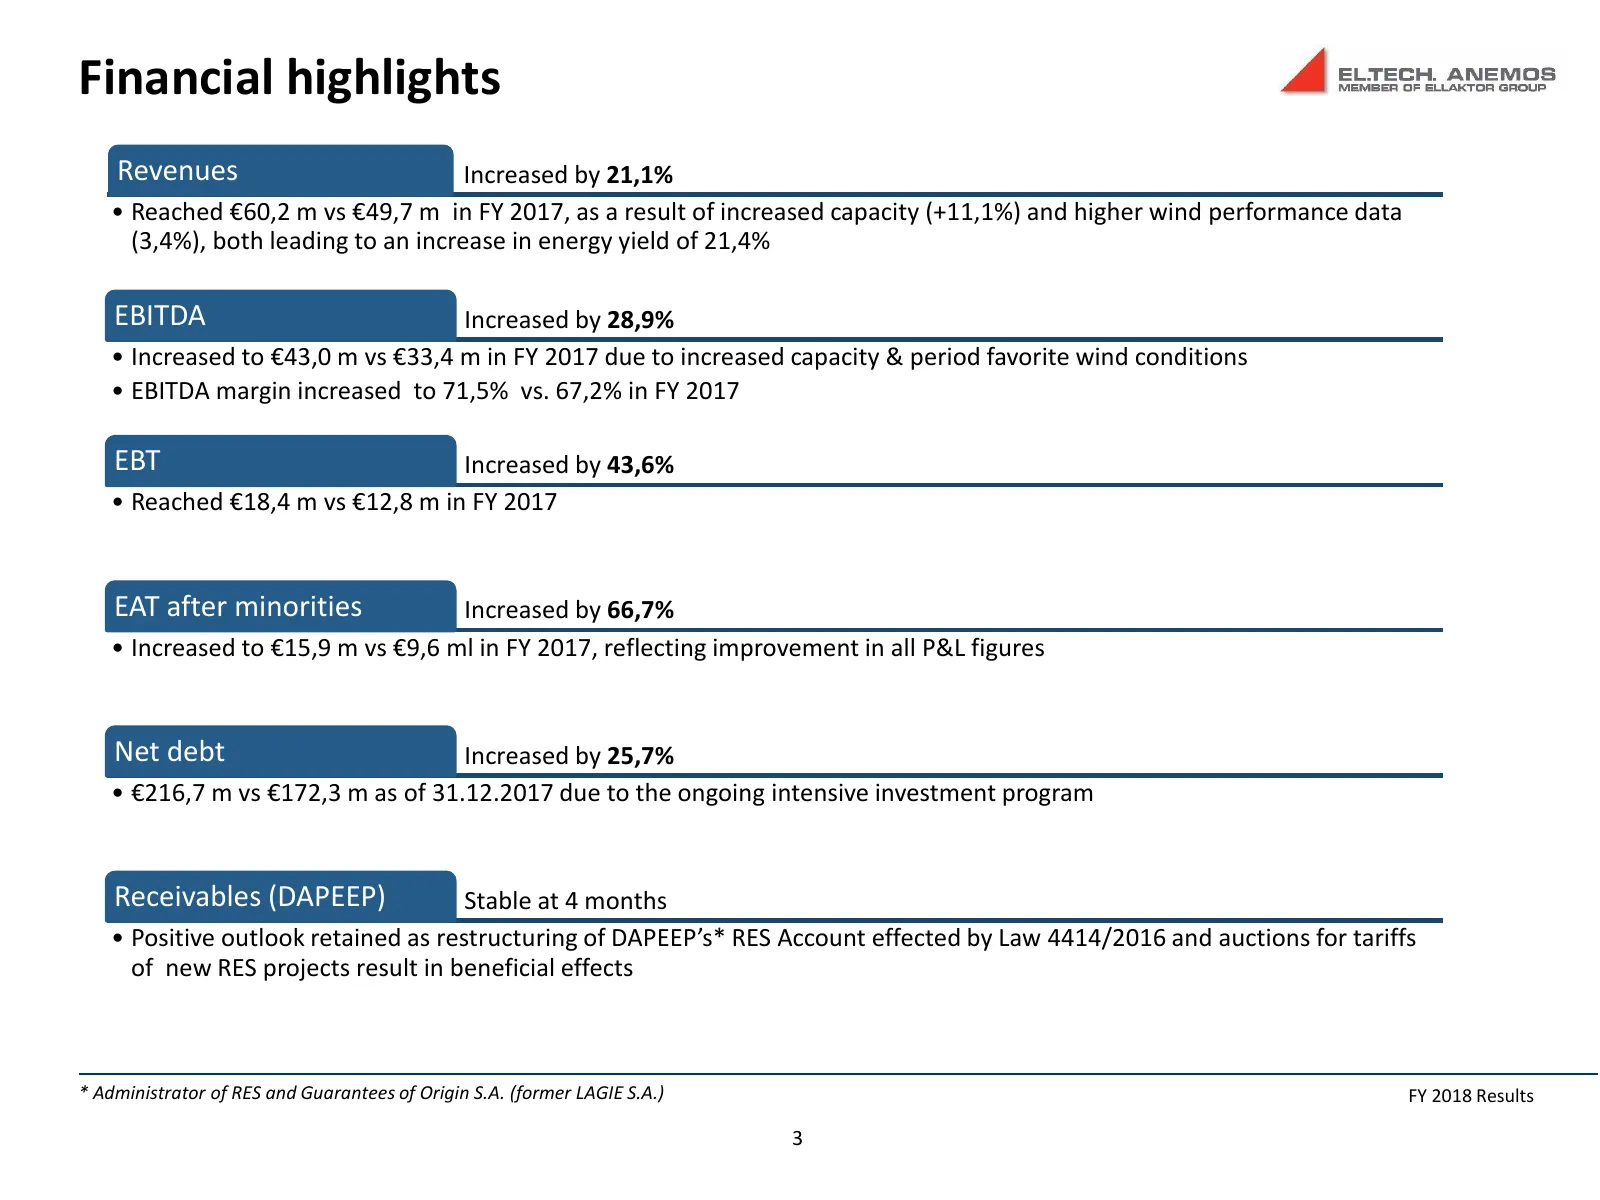
Financial highlights Revenues Increased by 21,1% • Reached €60,2 m vs €49,7 m in FY 2017, as a result of increased capacity (+11,1%) and higher wind performance data (3,4%), both leading to an increase in energy yield of 21,4% EBITDA Increased by 28,9% • Increased to €43,0 m vs €33,4 m in FY 2017 du
Slide 4: Evolution of key P&L figures (IFRS in € m)
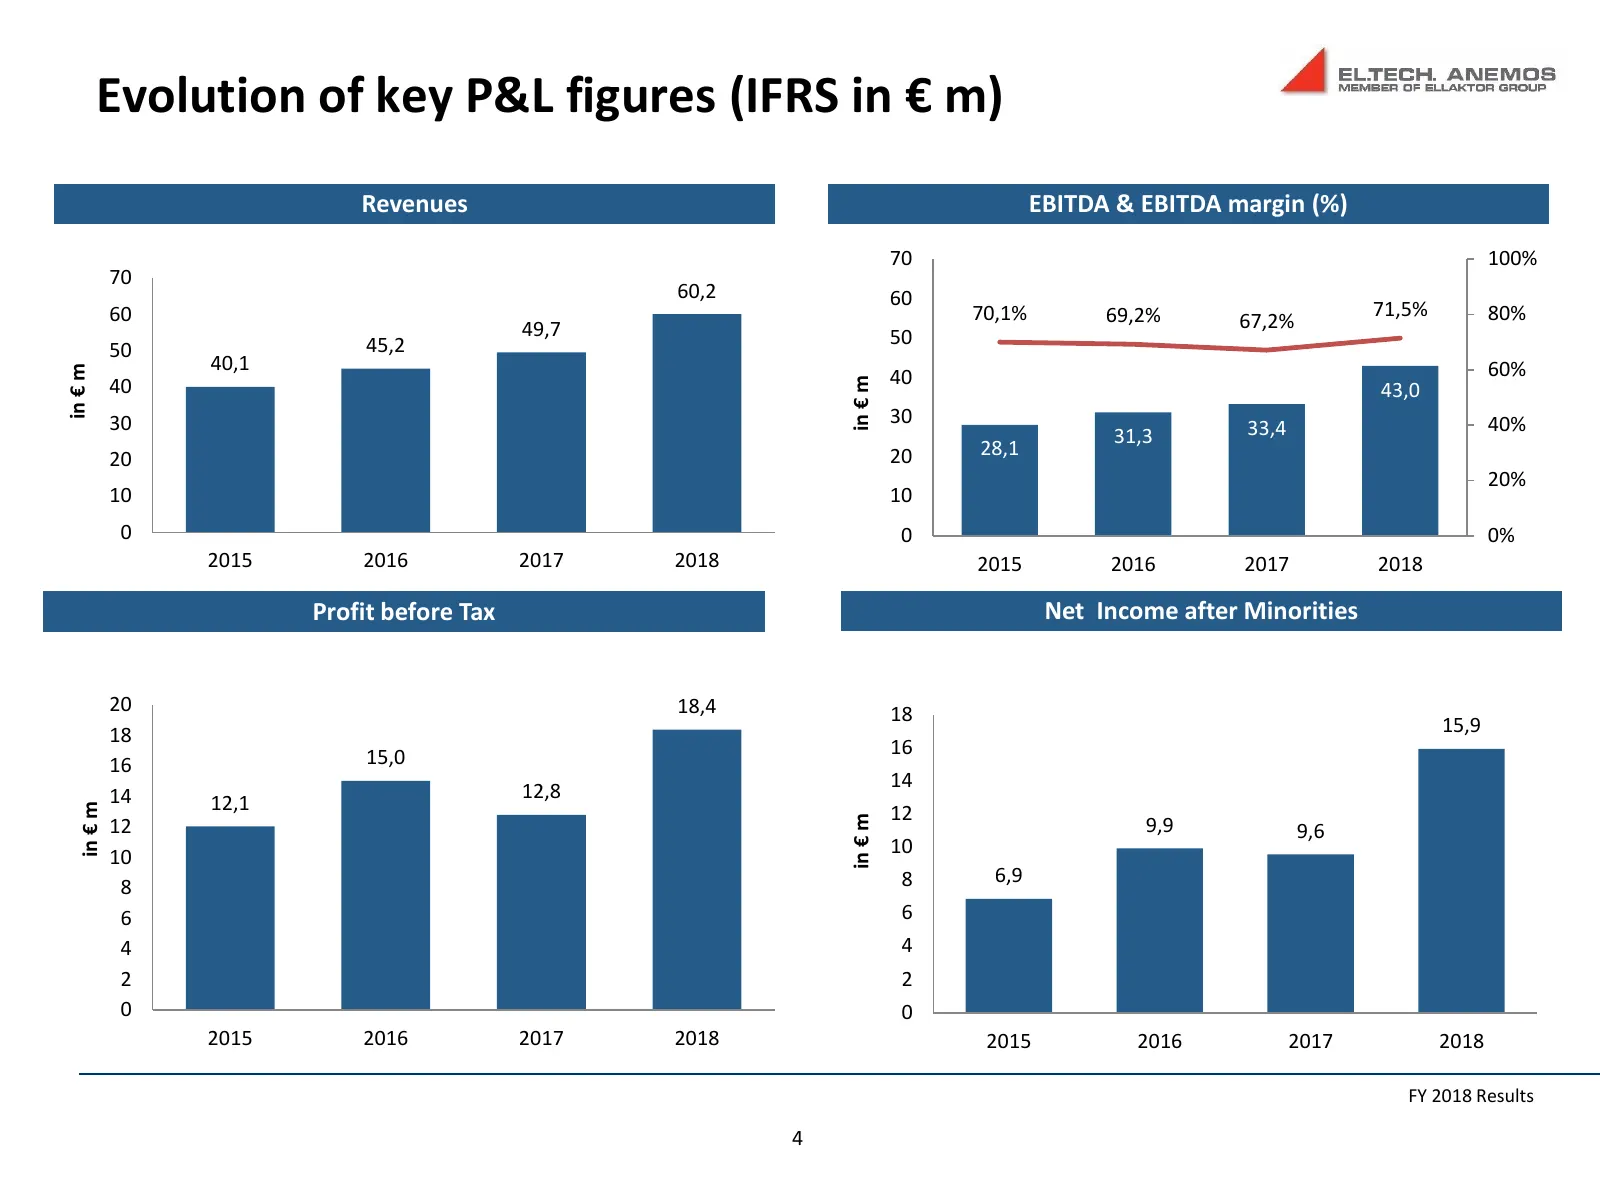
Evolution of key P&L figures (IFRS in € m) Revenues EBITDA & EBITDA margin (%) 70 100% 70 60,2 60 60 70,1% 69,2% 71,5% 80% 49,7 67,2% 45,2 50 50 40,1 60% in € m 40 in € m 40 43,0 30 30 40% 31,3 33,4 20 20 28,1 20% 10 10 0 0 0% 2015 2016 2017 2018 2015 2016 2017 2018 Profit before Tax Net Income afte
Slide 5: Evolution of key Balance Sheet figures (IFRS in € m)
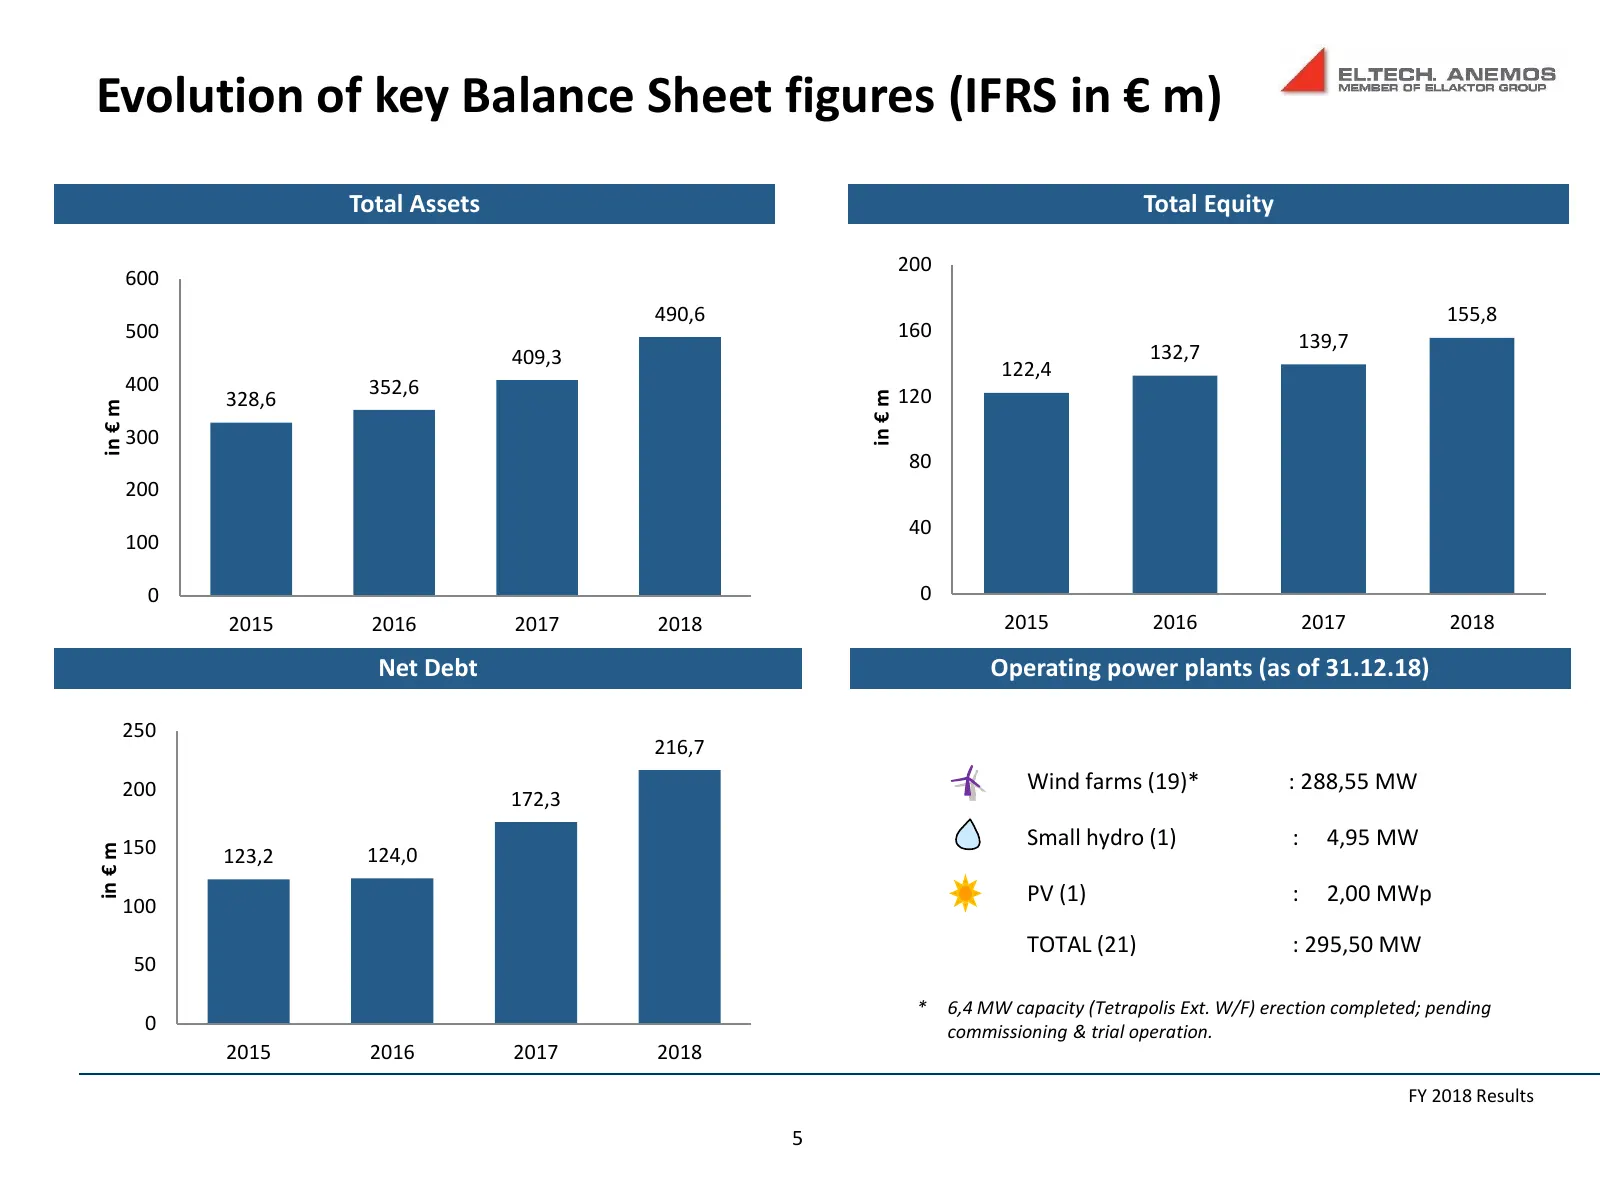
Evolution of key Balance Sheet figures (IFRS in € m) Total Assets Total Equity 200 600 490,6 155,8 500 160 139,7 409,3 132,7 122,4 400 352,6 120 in € m 328,6 in € m 300 80 200 40 100 0 0 2015 2016 2017 2018 2015 2016 2017 2018 Net Debt Operating power plants (as of 31.12.18) 250 216,7 200 Wind farms
Slide 6: RES Asset Portfolio
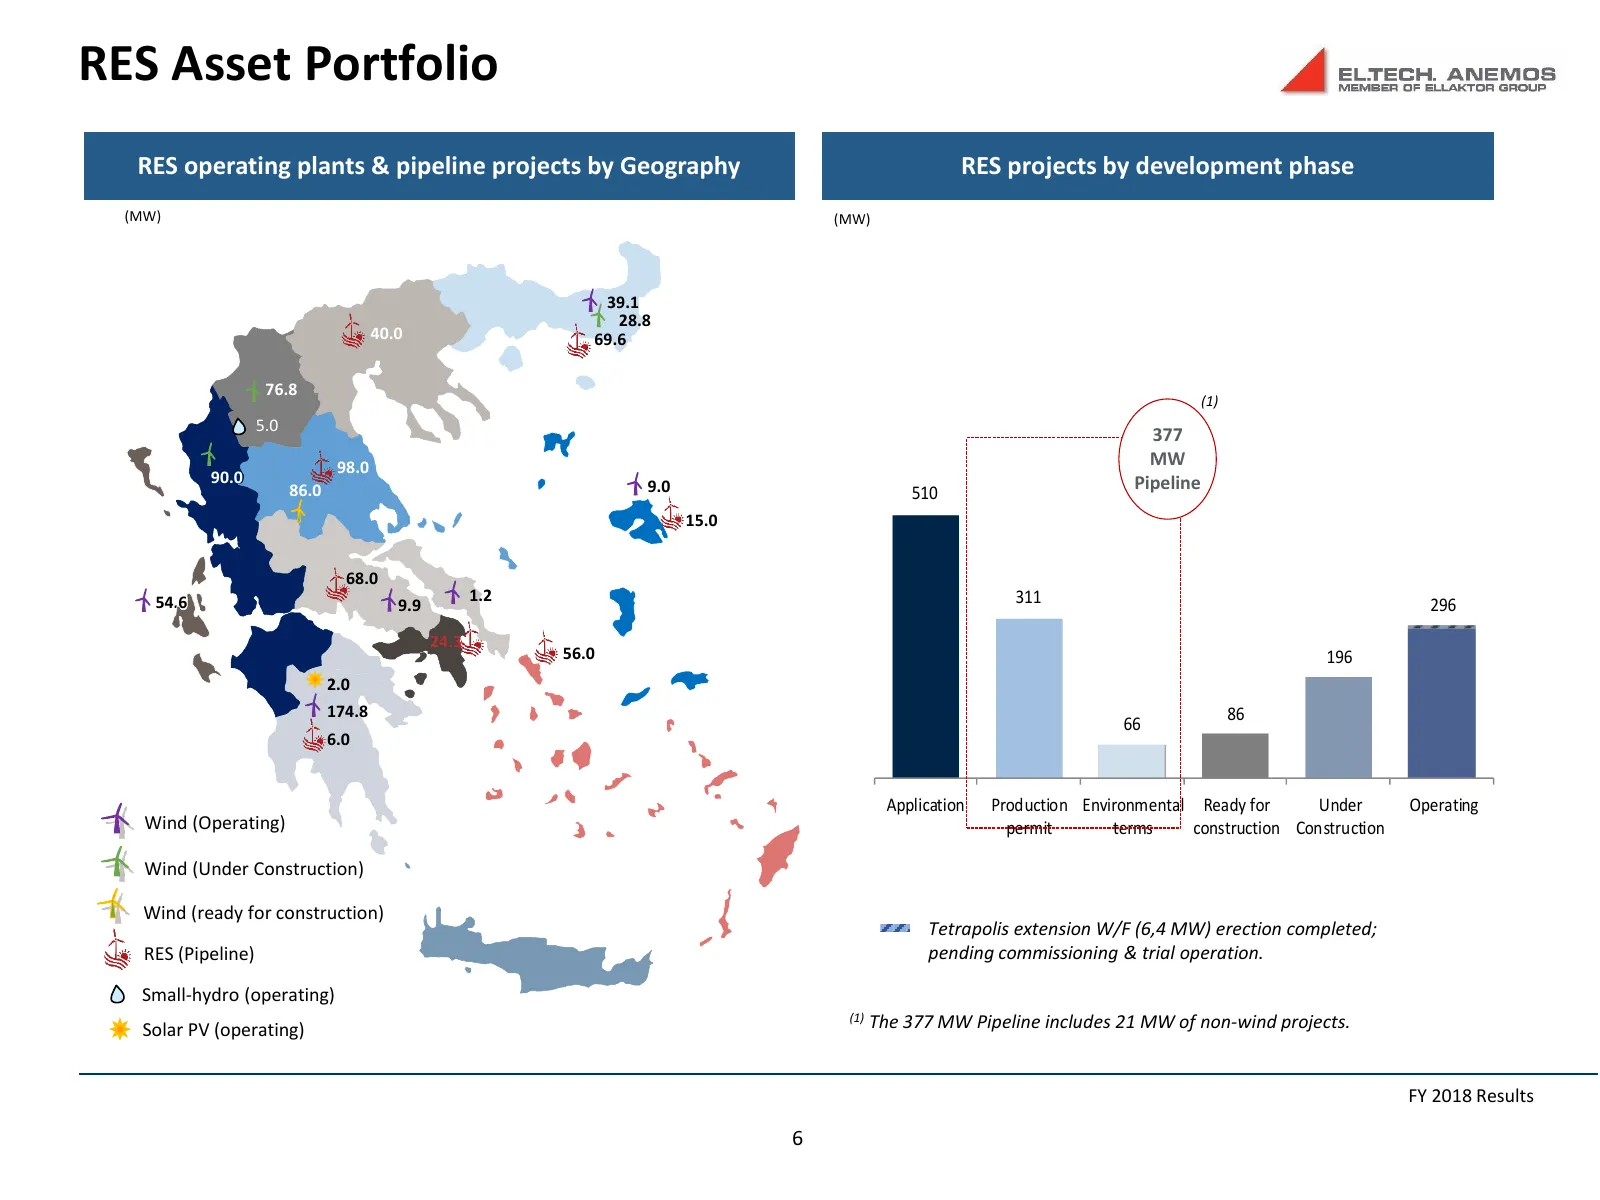
RES Asset Portfolio RES operating plants & pipeline projects by Geography RES projects by development phase (MW) (MW) 39.1 28.8 40.0 69.6 76.8 (1) 5.0 377 98.0 MW 90.0 9.0 Pipeline 86.0 510 15.0 68.0 54.6 1.2 311 9.9 296 24.3 56.0 196 2.0 174.8 86 66 6.0 Application Production Environmental Ready fo
Slide 7: Strategy Going Forward – Maintain Growth Profile
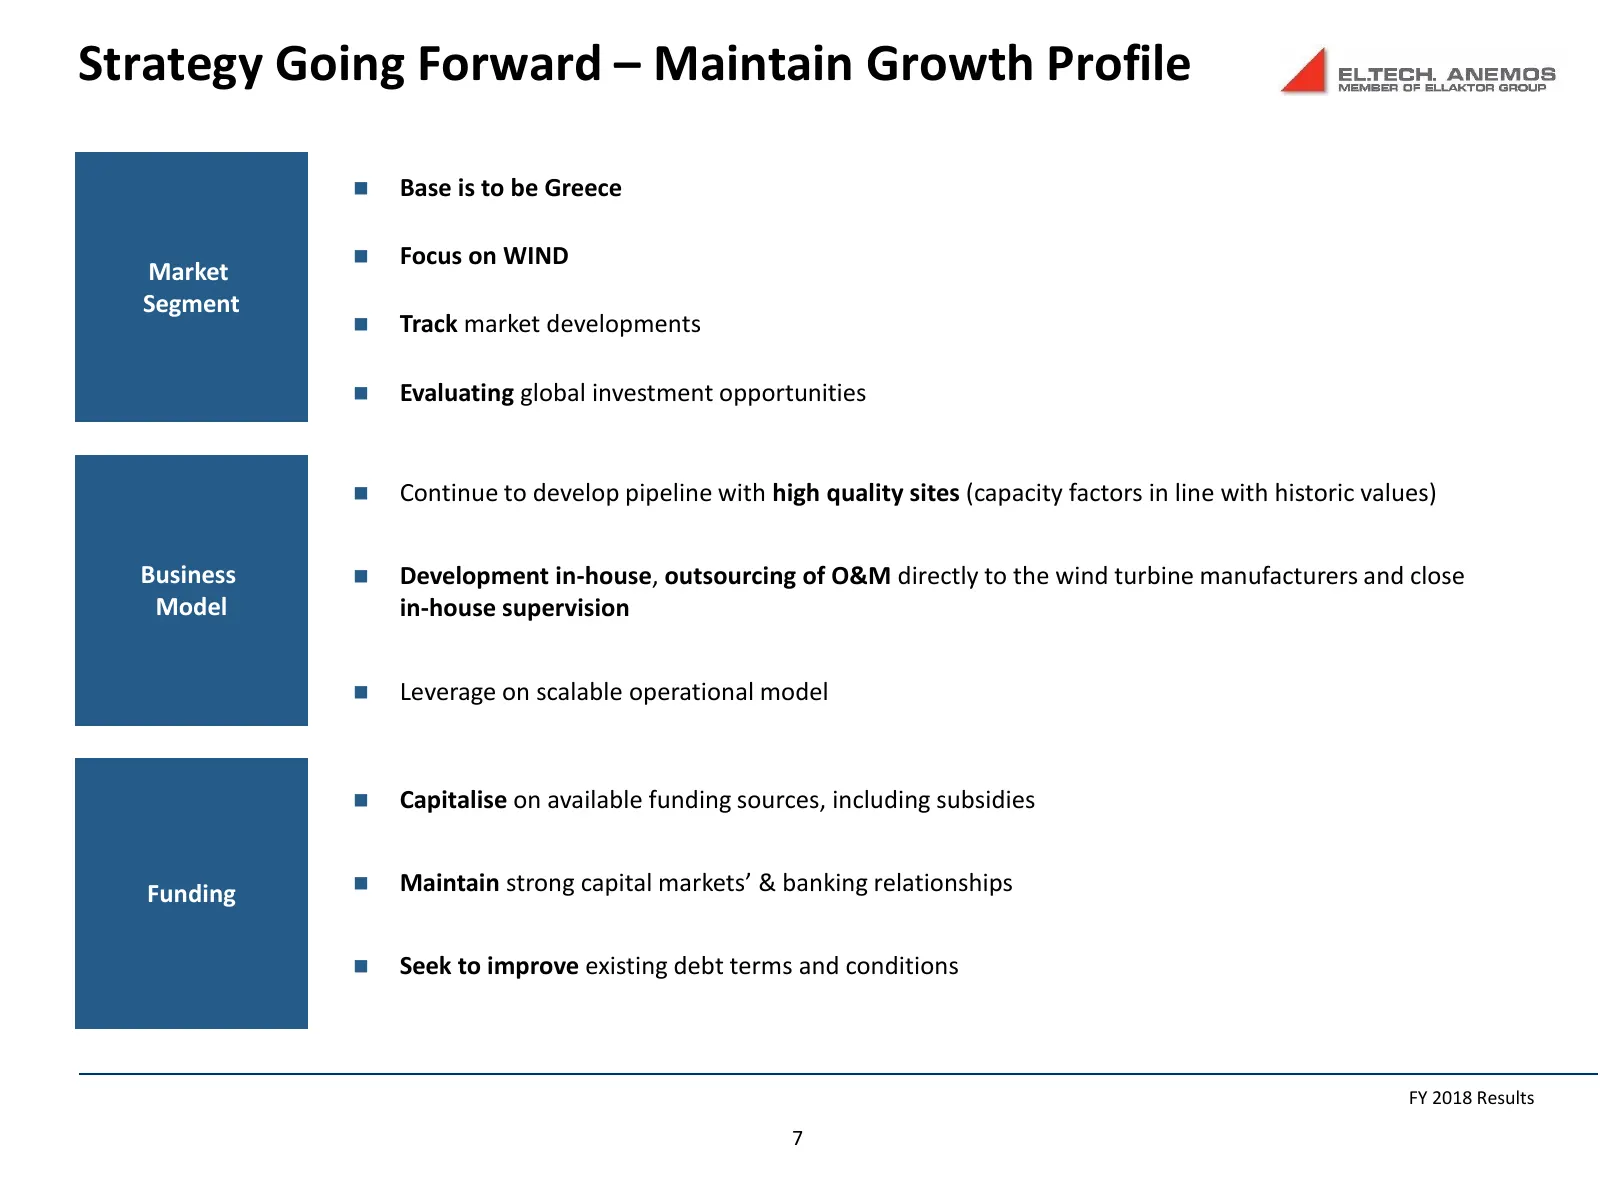
Strategy Going Forward – Maintain Growth Profile Base is to be Greece Focus on WIND Market Segment Track market developments Evaluating global investment opportunities Continue to develop pipeline with high quality sites (capacity factors in line with historic values) Business Developmen
Slide 8: New wind farm investment program
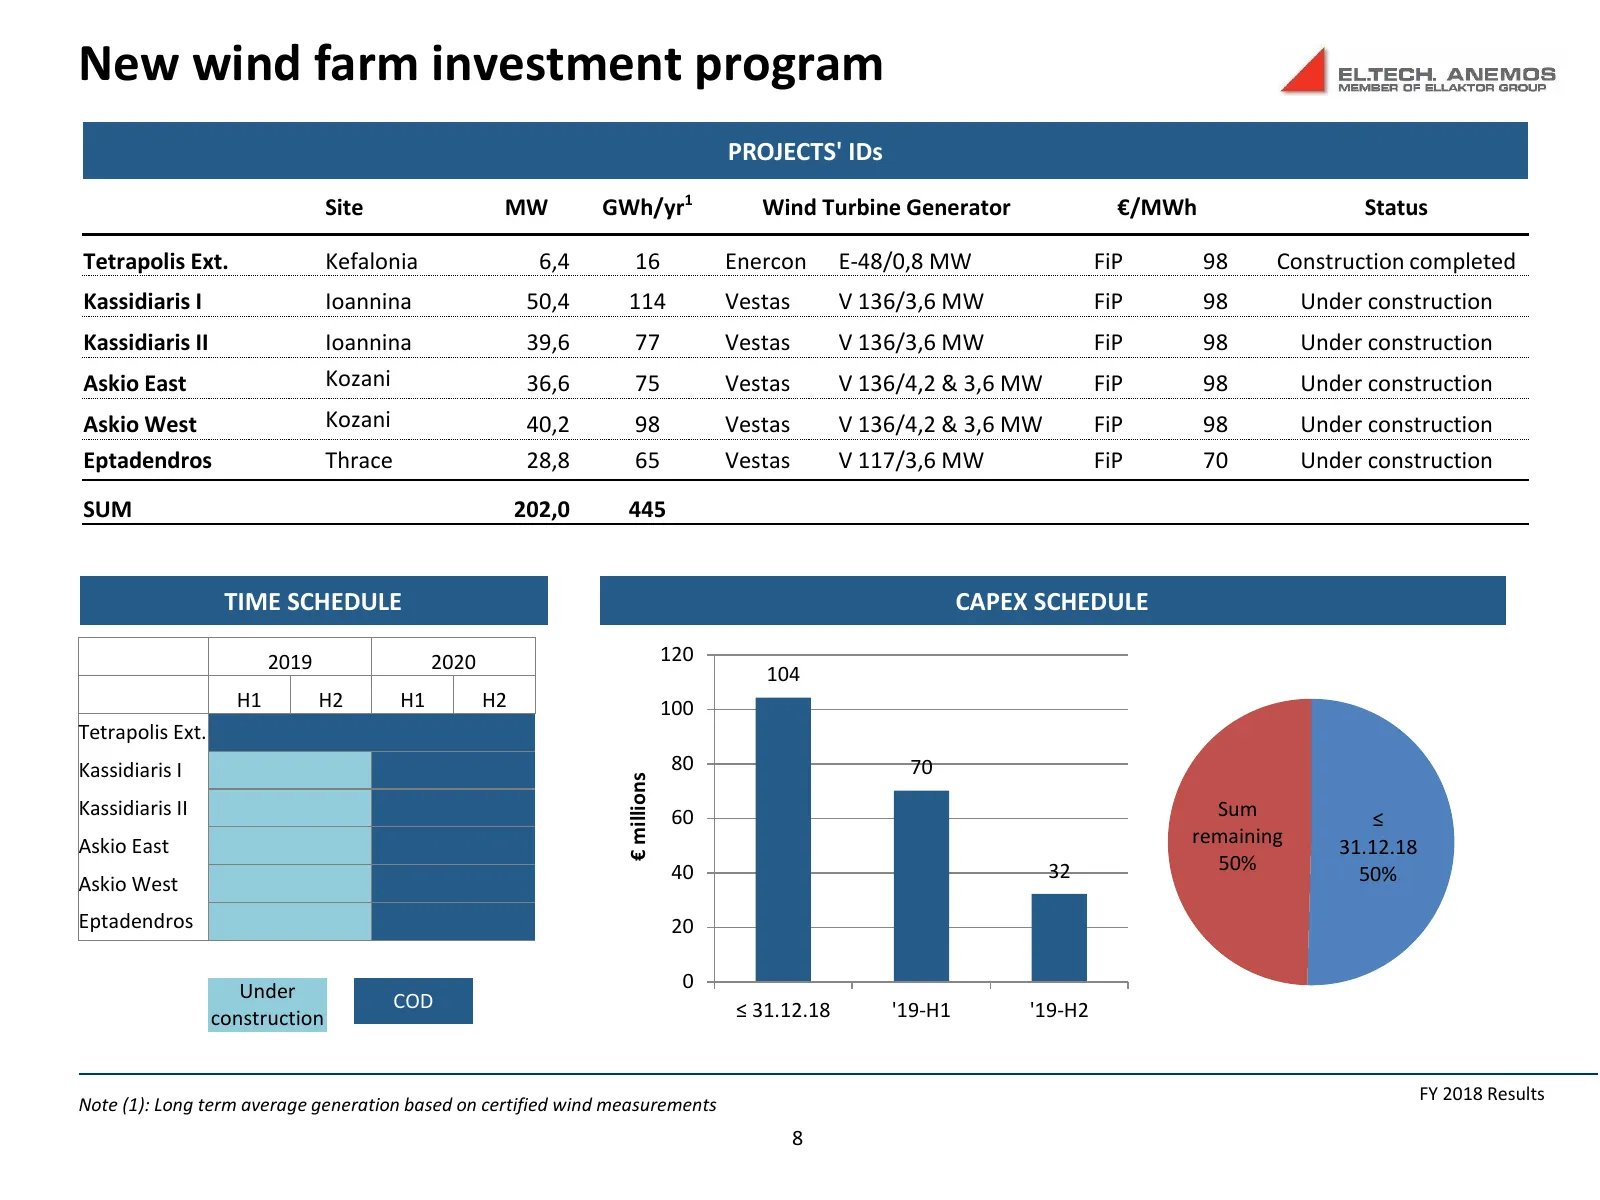
New wind farm investment program PROJECTS' IDs Site MW GWh/yr1 Wind Turbine Generator €/ΜWh Status Tetrapolis Ext. Kefalonia 6,4 16 Enercon E-48/0,8 MW FiP 98 Construction completed Kassidiaris I Ioannina 50,4 114 Vestas V 136/3,6 MW FiP 98 Under construction Kassidiaris II Ioannina 39,6 77 Vestas V
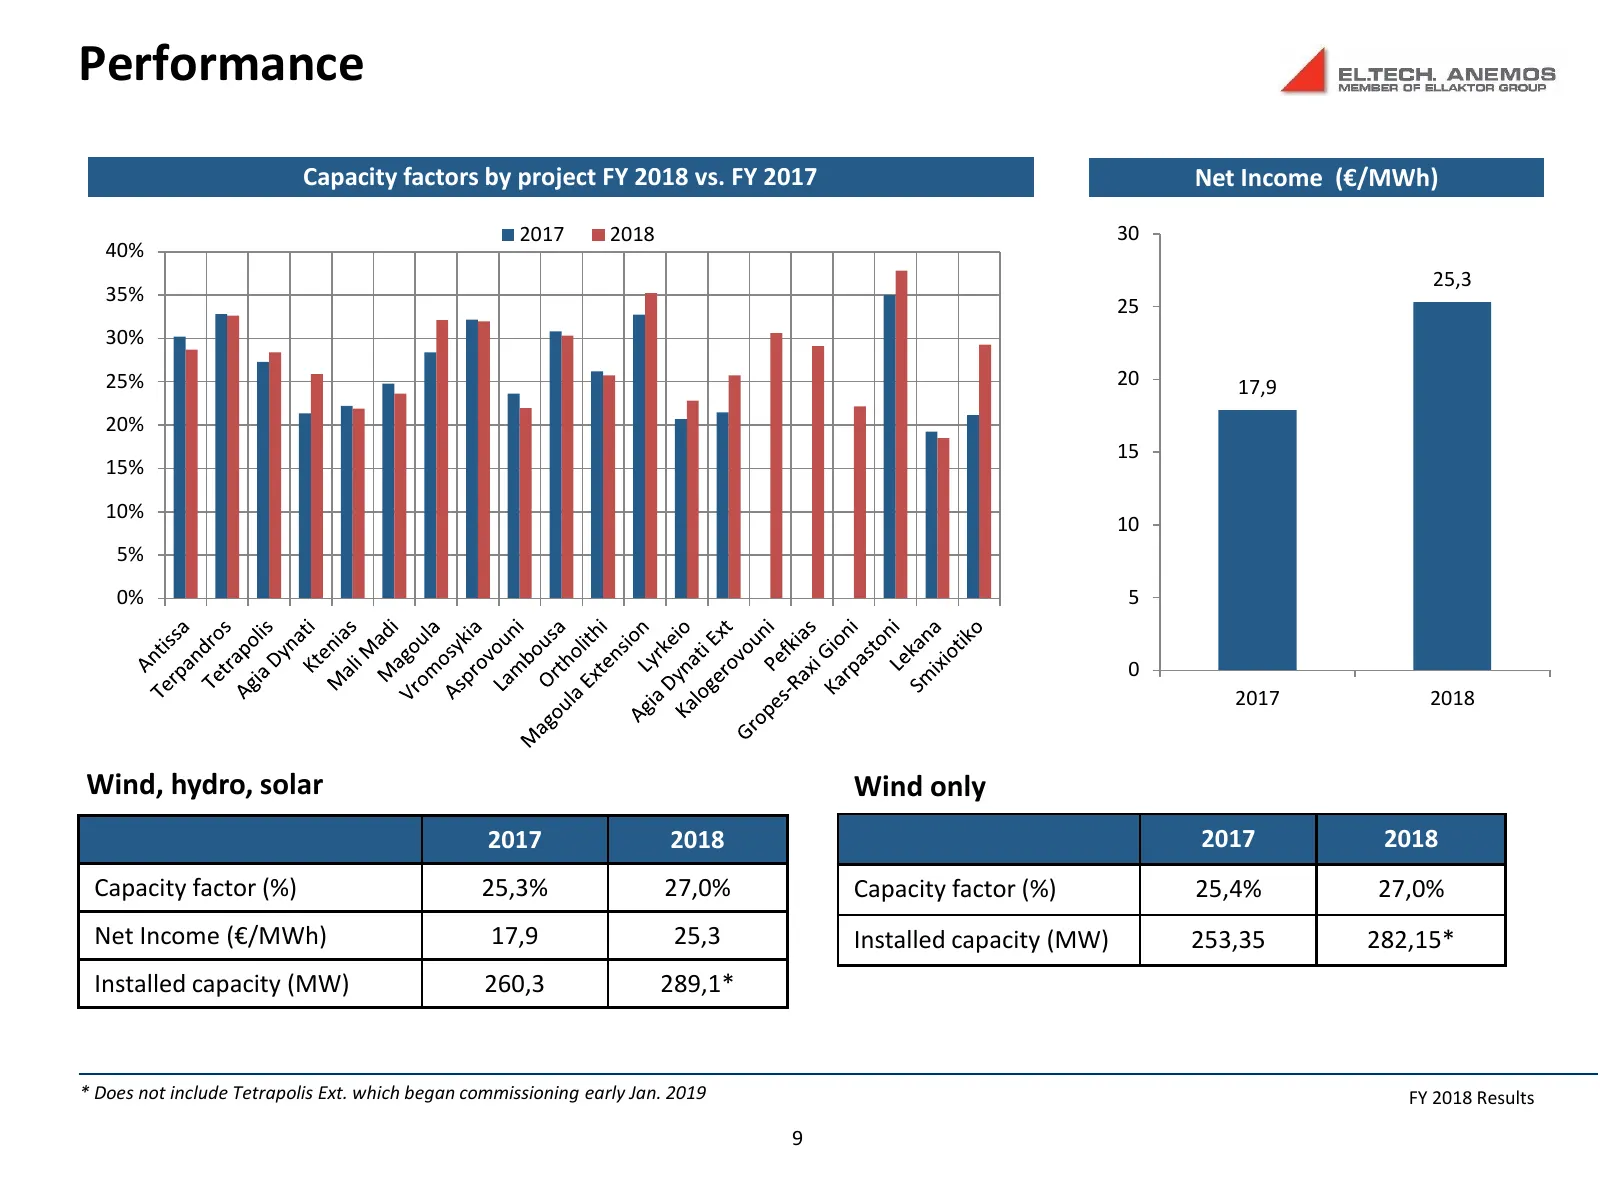
Slide 9: Performance
Performance Capacity factors by project FY 2018 vs. FY 2017 Net Income (€/MWh) 2017 2018 30 40% 25,3 35% 25 30% 25% 20 17,9 20% 15 15% 10% 10 5% 0% 5 0 2017 2018 Wind, hydro, solar Wind only 2017 2018 2017 2018 Capacity factor (%) 25,3% 27,0% Capacity factor (%) 25,4% 27,0% Net Income (€/MWh) 17,9 2
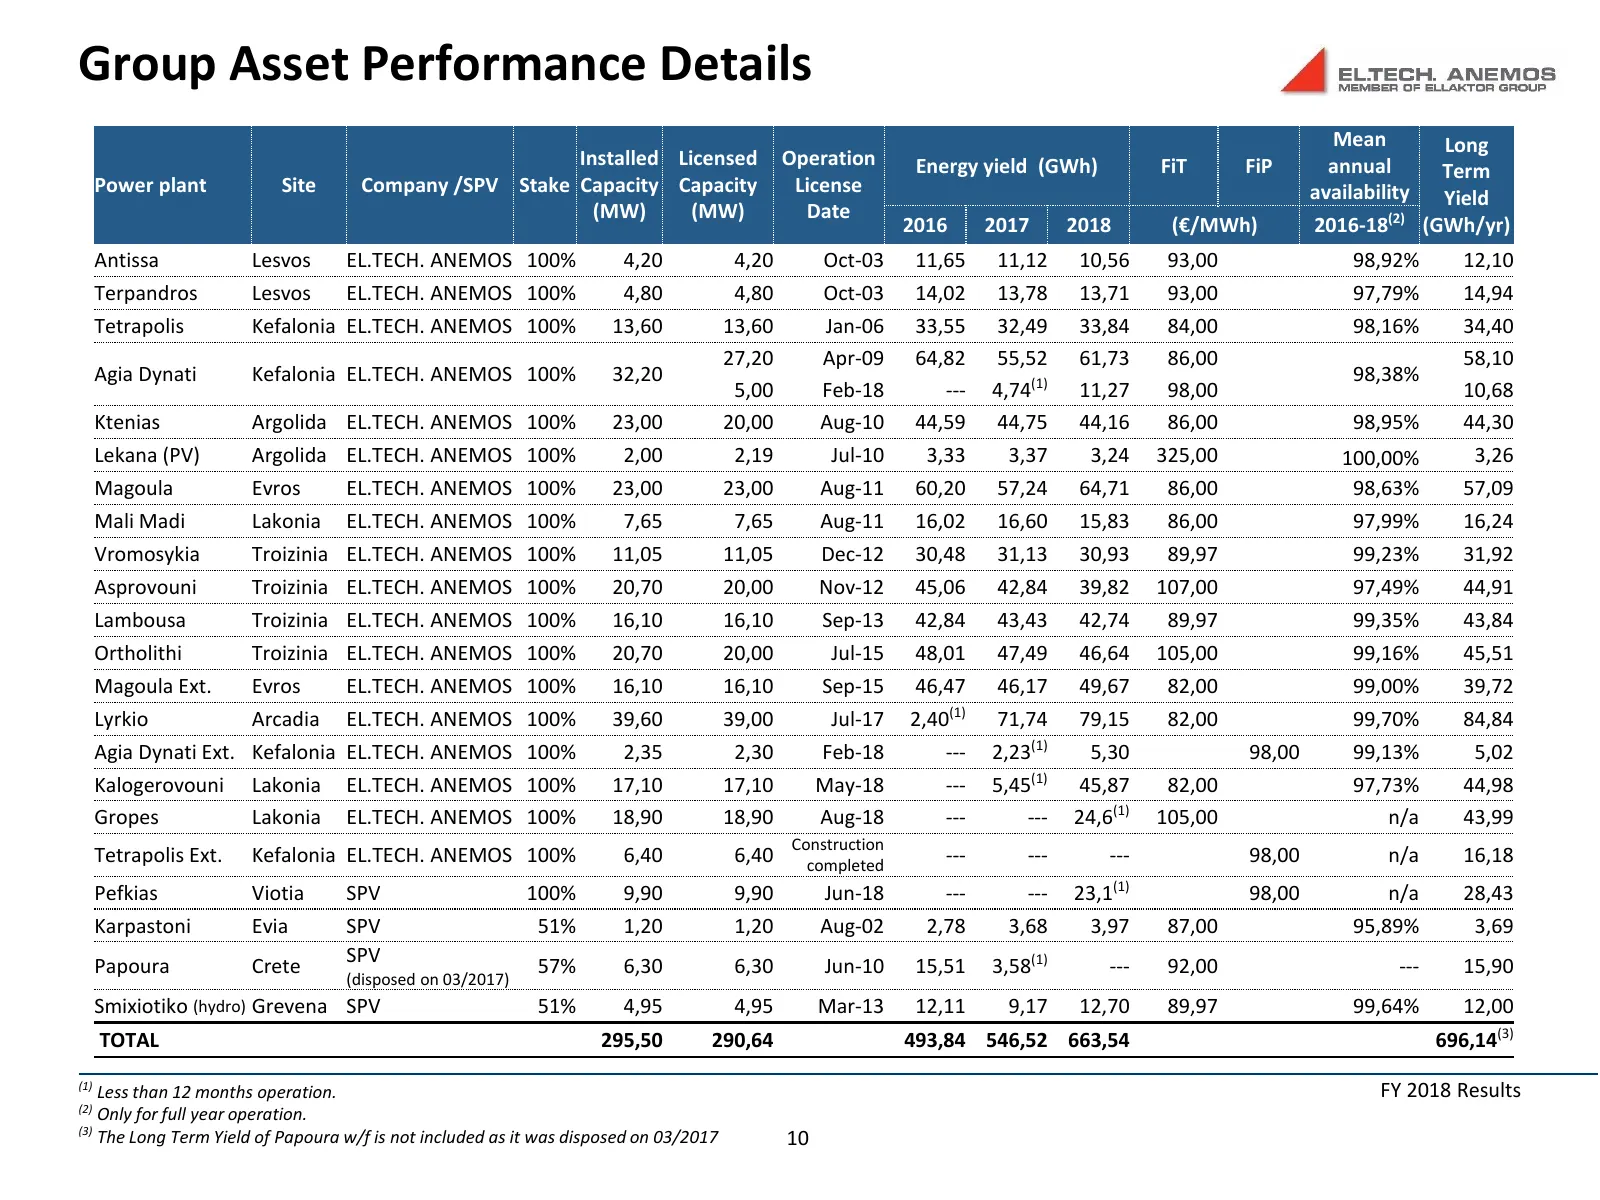
Slide 10: Group Asset Performance Details
Group Asset Performance Details Mean Long Installed Licensed Operation Energy yield (GWh) FiT FiP annual Term Power plant Site Company /SPV Stake Capacity Capacity License availability Yield (MW) (MW) Date 2016 2017 2018 (€/MWh) 2016-18(2) (GWh/yr) Antissa Lesvos EL.TECH. ANEMOS 100% 4,20 4,20 Oct-0
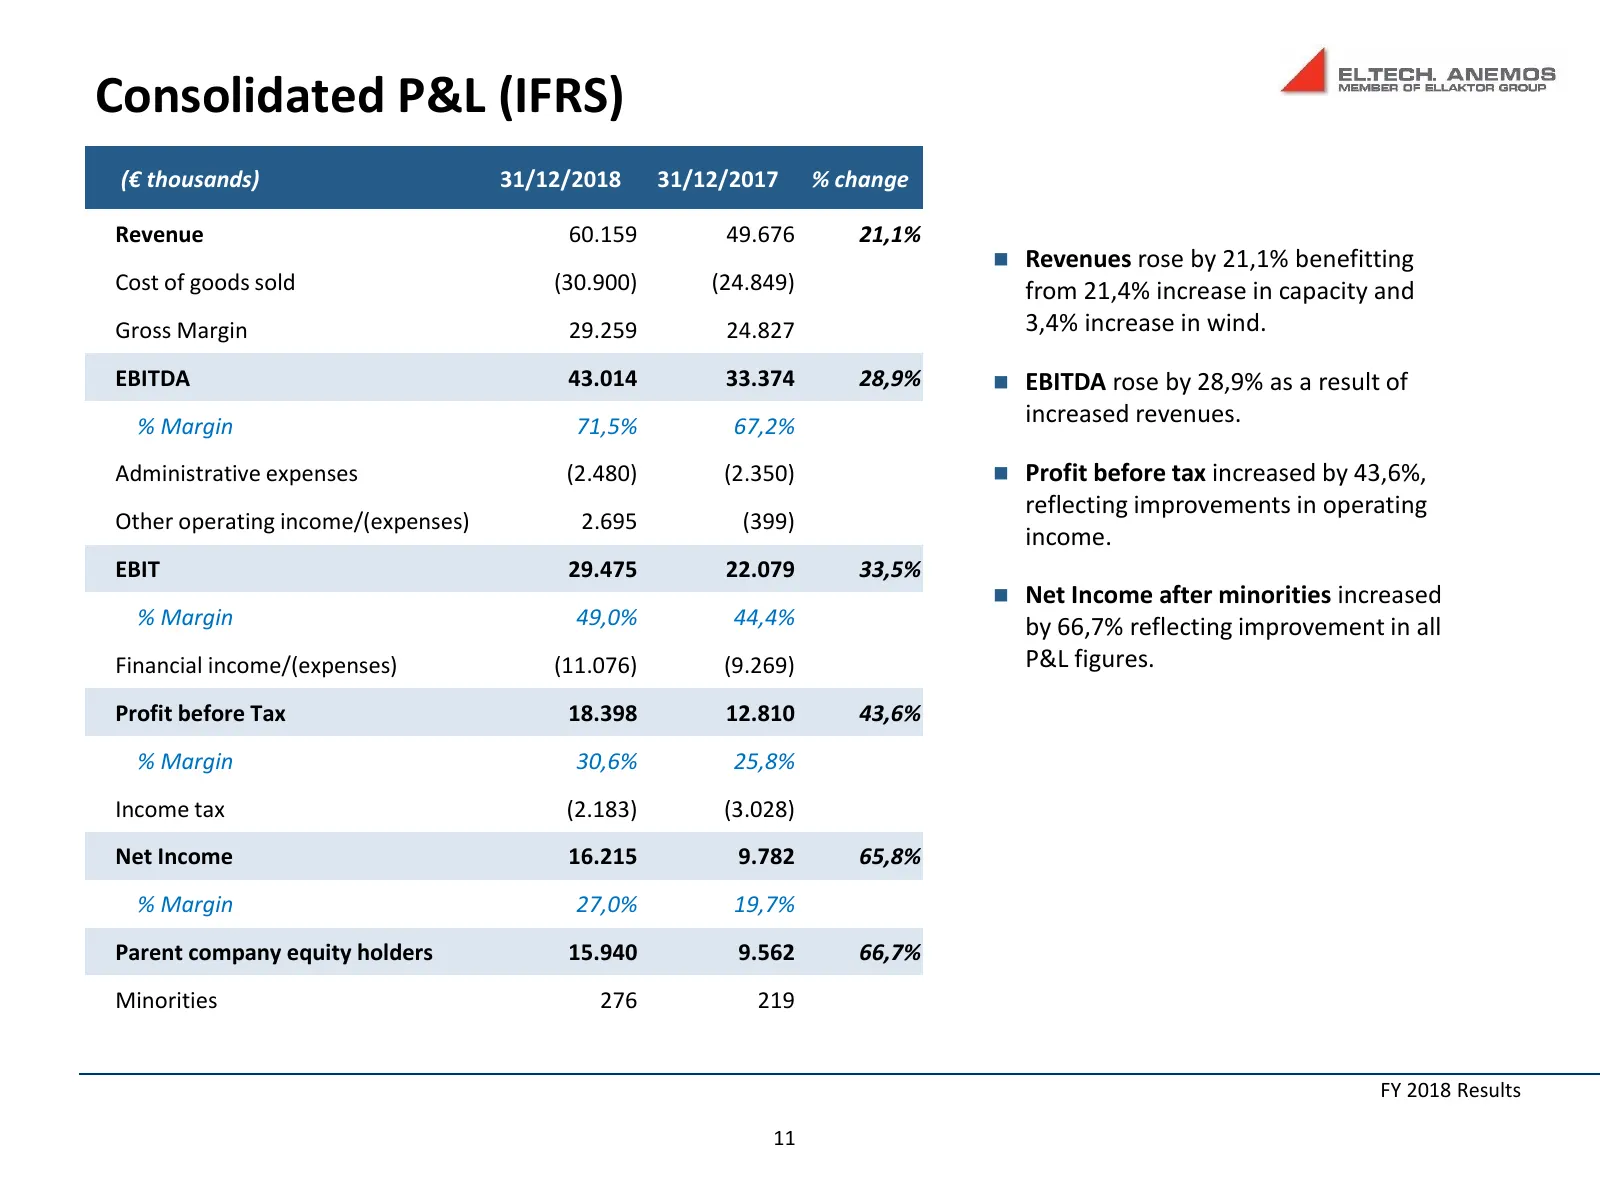
Slide 11: Consolidated P&L (IFRS)
Consolidated P&L (IFRS) (€ thousands) 31/12/2018 31/12/2017 % change Revenue 60.159 49.676 21,1% Revenues rose by 21,1% benefitting Cost of goods sold (30.900) (24.849) from 21,4% increase in capacity and Gross Margin 29.259 24.827 3,4% increase in wind. EBITDA 43.014 33.374 28,9% EBITDA rose by
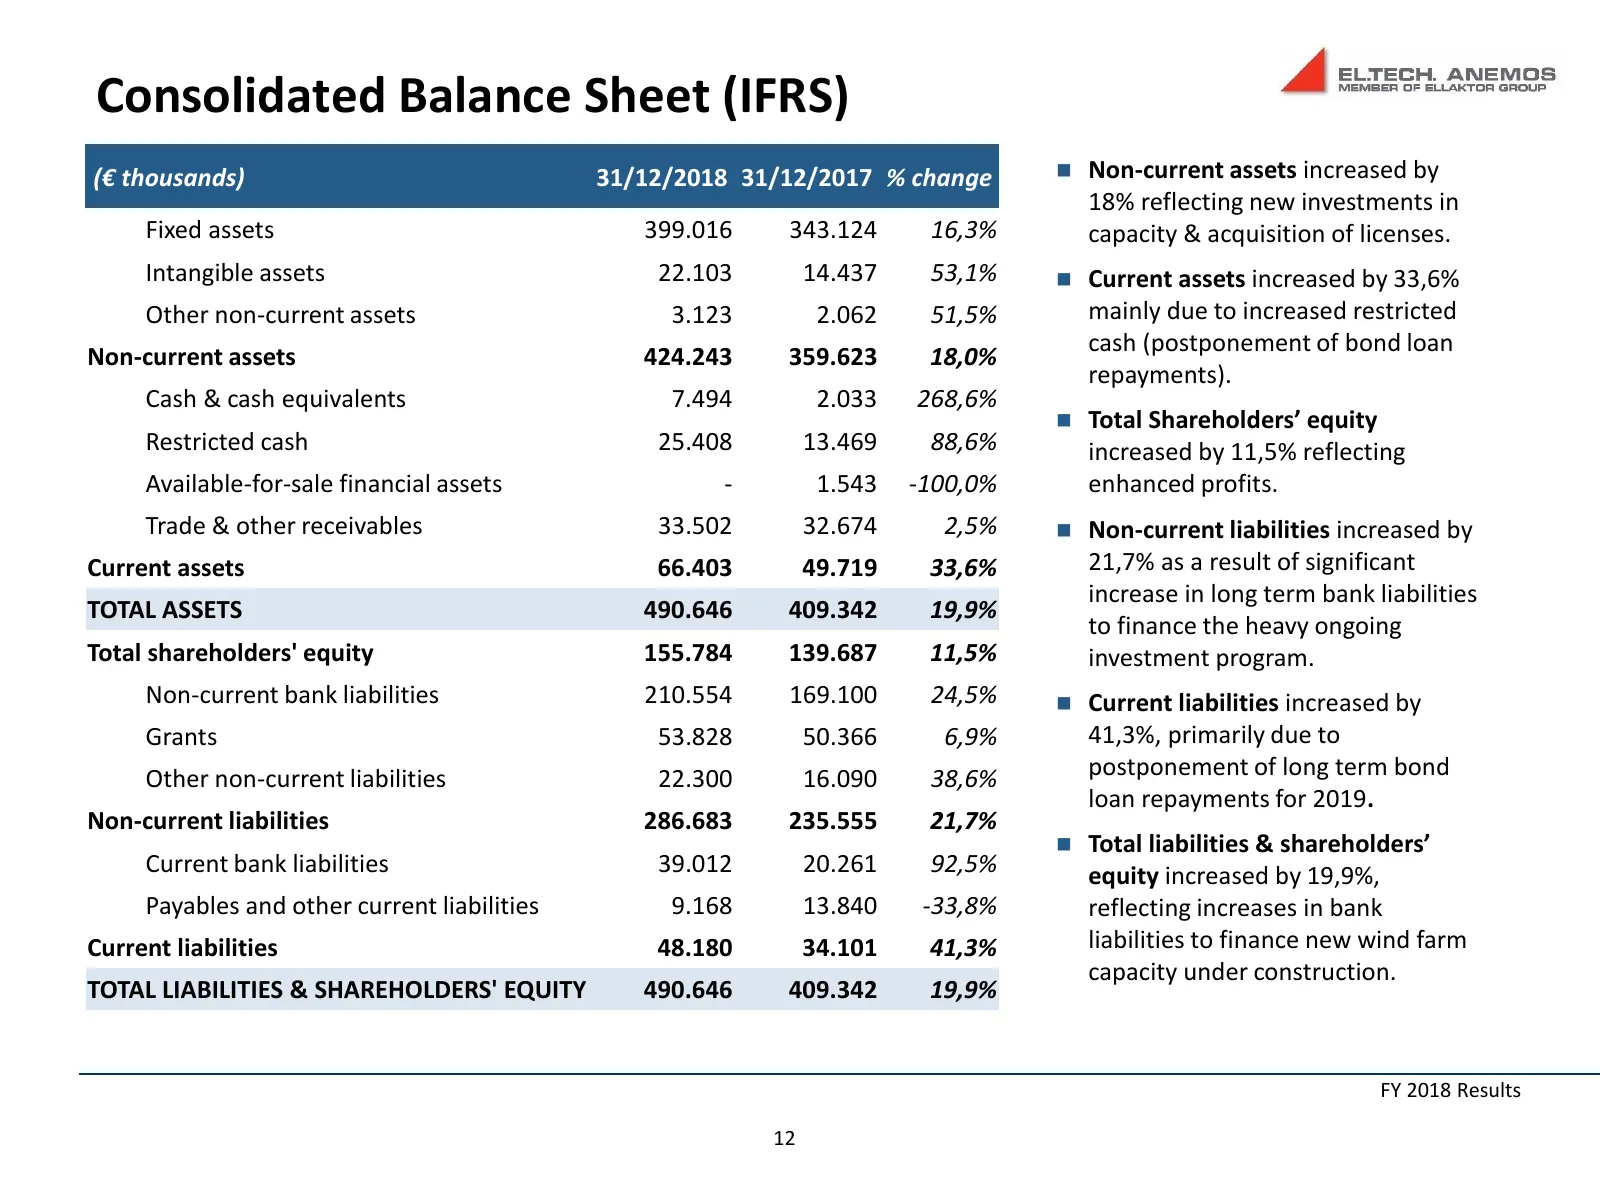
Slide 12: Consolidated Balance Sheet (IFRS)
Consolidated Balance Sheet (IFRS) (€ thousands) 31/12/2018 31/12/2017 % change Non-current assets increased by 18% reflecting new investments in Fixed assets 399.016 343.124 16,3% capacity & acquisition of licenses. Intangible assets 22.103 14.437 53,1% Current assets increased by 33,6% Other no
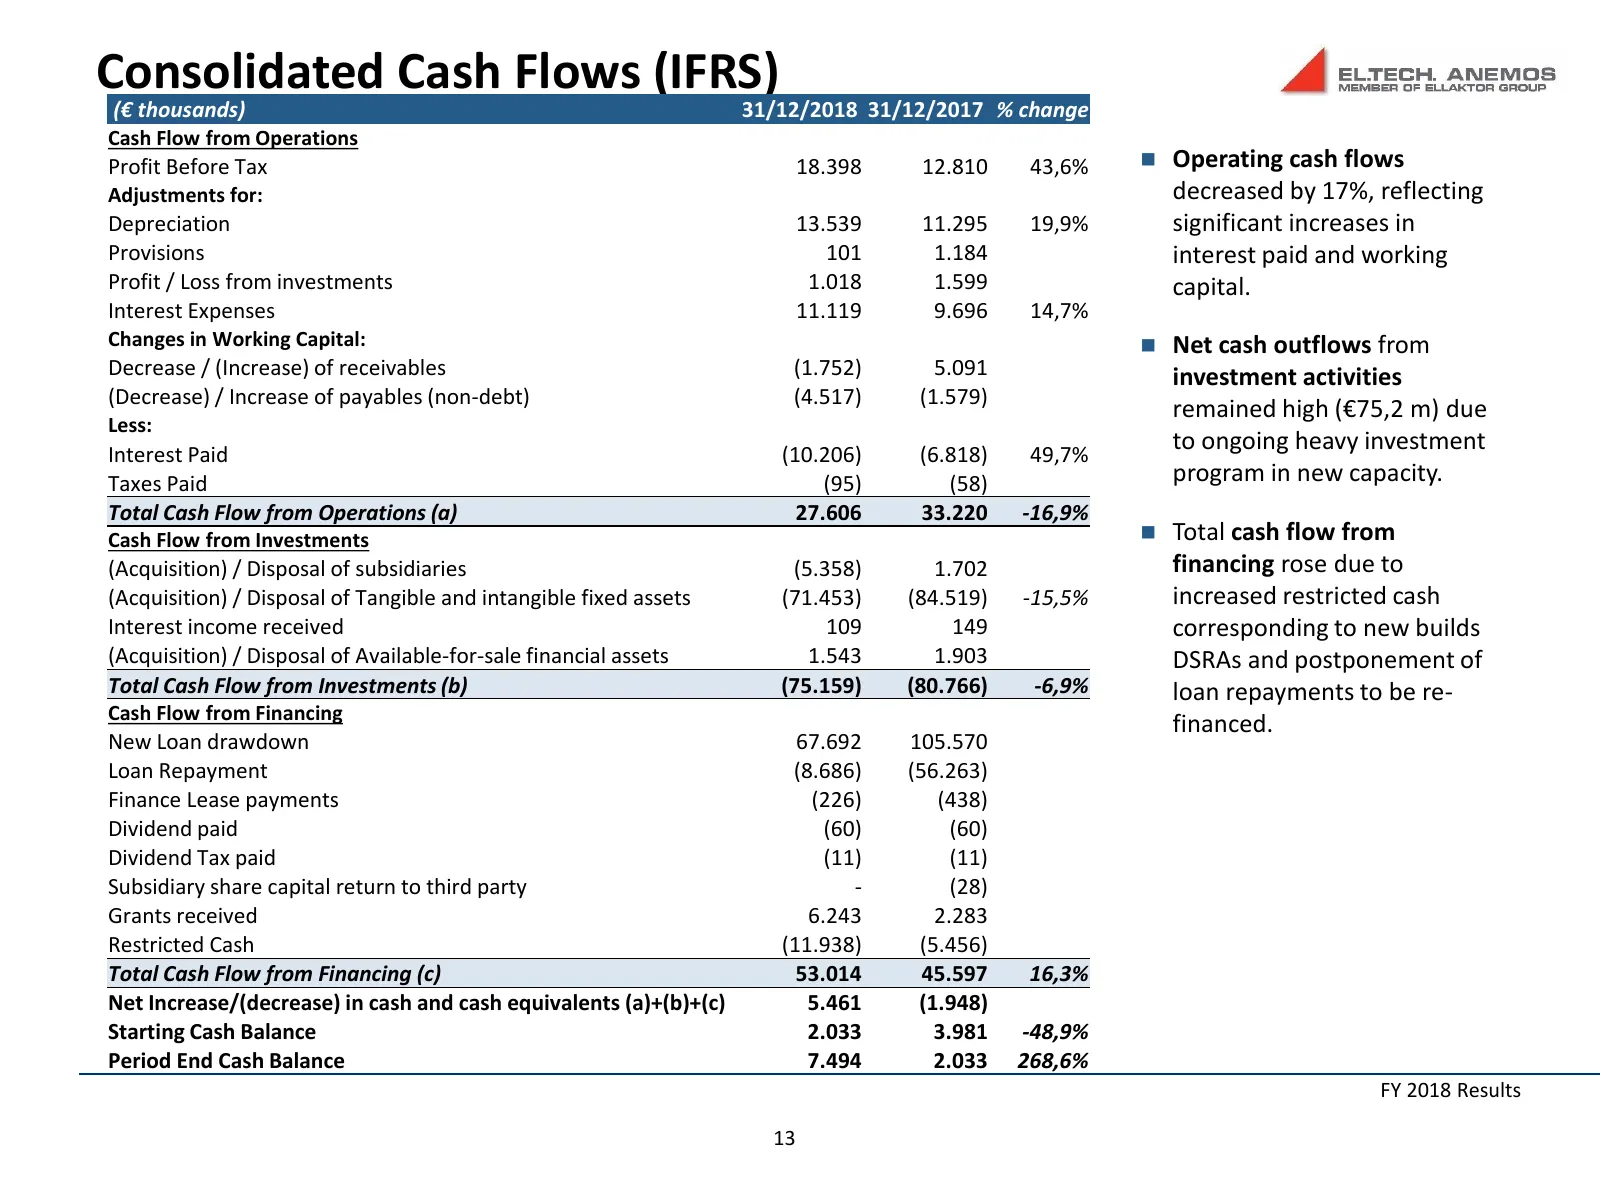
Slide 13: Consolidated Cash Flows (IFRS)
Consolidated Cash Flows (IFRS) (€ thousands) 31/12/2018 31/12/2017 % change Cash Flow from Operations Profit Before Tax 18.398 12.810 43,6% Operating cash flows Adjustments for: decreased by 17%, reflecting Depreciation 13.539 11.295 19,9% significant increases in Provisions 101 1.184 interest pai
Slide 14: Disclaimer
Disclaimer This presentation has been prepared by EL.TECH. ANEMOS S.A. (the “Company”). The information contained in this presentation has not been independently verified and no representation or warranty, express or implied, is made as to, and no reliance should be placed on, the fairness, accuracy
Source: Internet Archive copy of ellaktor.com
More decks from Ellaktor SA
 FY2025 Earnings Presentation23 slides · Apr 17, 2026
 FY2024 Earnings Presentation30 slides · Apr 24, 2025
 H1 2024 Earnings Presentation30 slides · Sep 12, 2024
 FY2023 Earnings Presentation32 slides · Apr 18, 2024
 9M 2023 Earnings Presentation31 slides · Nov 23, 2023
 9M 2023 Earnings Presentation48 slides · November 2023