EquipmentShare.com Inc · NASDAQ:EQPT
EquipmentShare.com — Q3 2026 Earnings Presentation
58 slides from EquipmentShare.com's earnings presentation, Nov 10, 2026
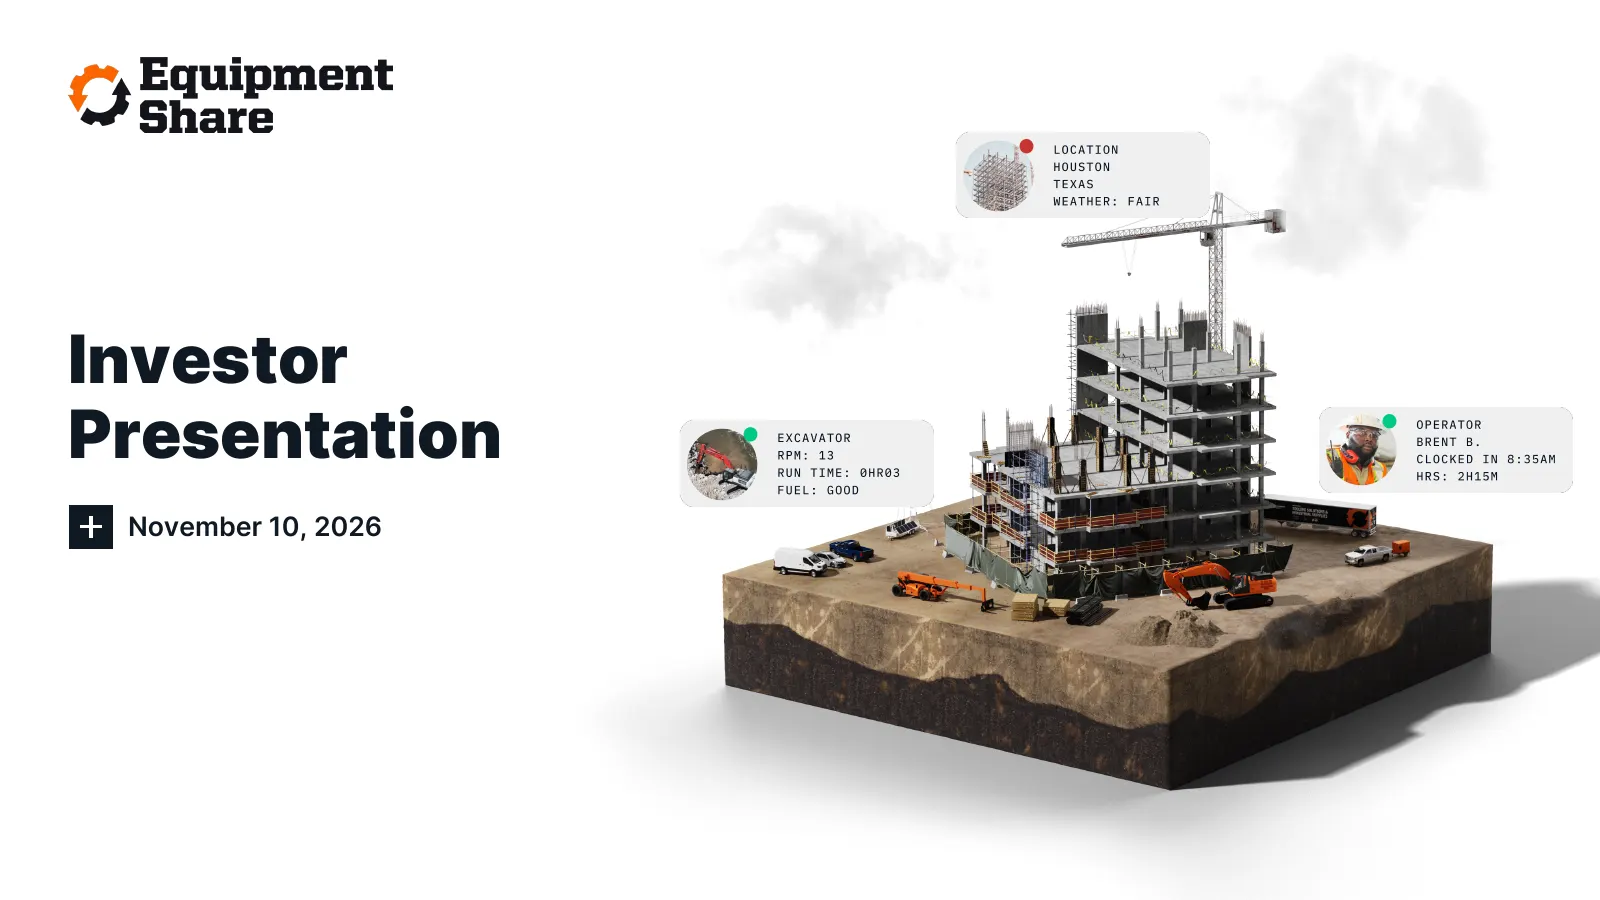
Slide 1: Investor Presentation
Investor Presentation November 10, 2026
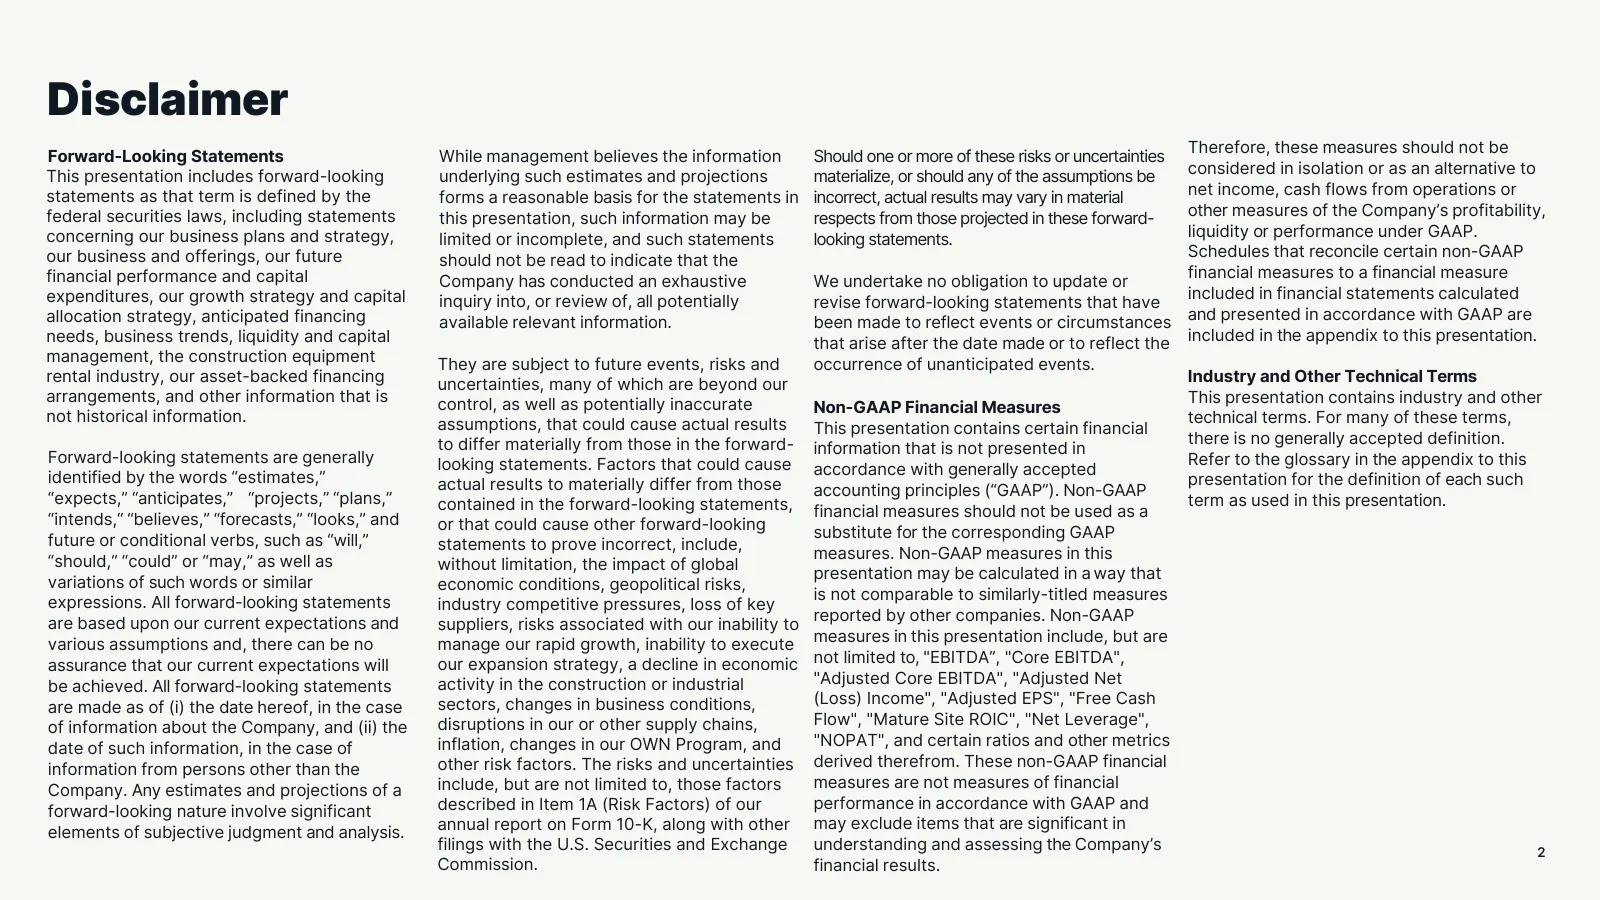
Slide 2: Disclaimer
Disclaimer Therefore, these measures should not be Forward-Looking Statements While management believes the information Should one or more of these risks or uncertainties This presentation includes forward-looking considered in isolation or as an alternative to underlying such estimates and projecti
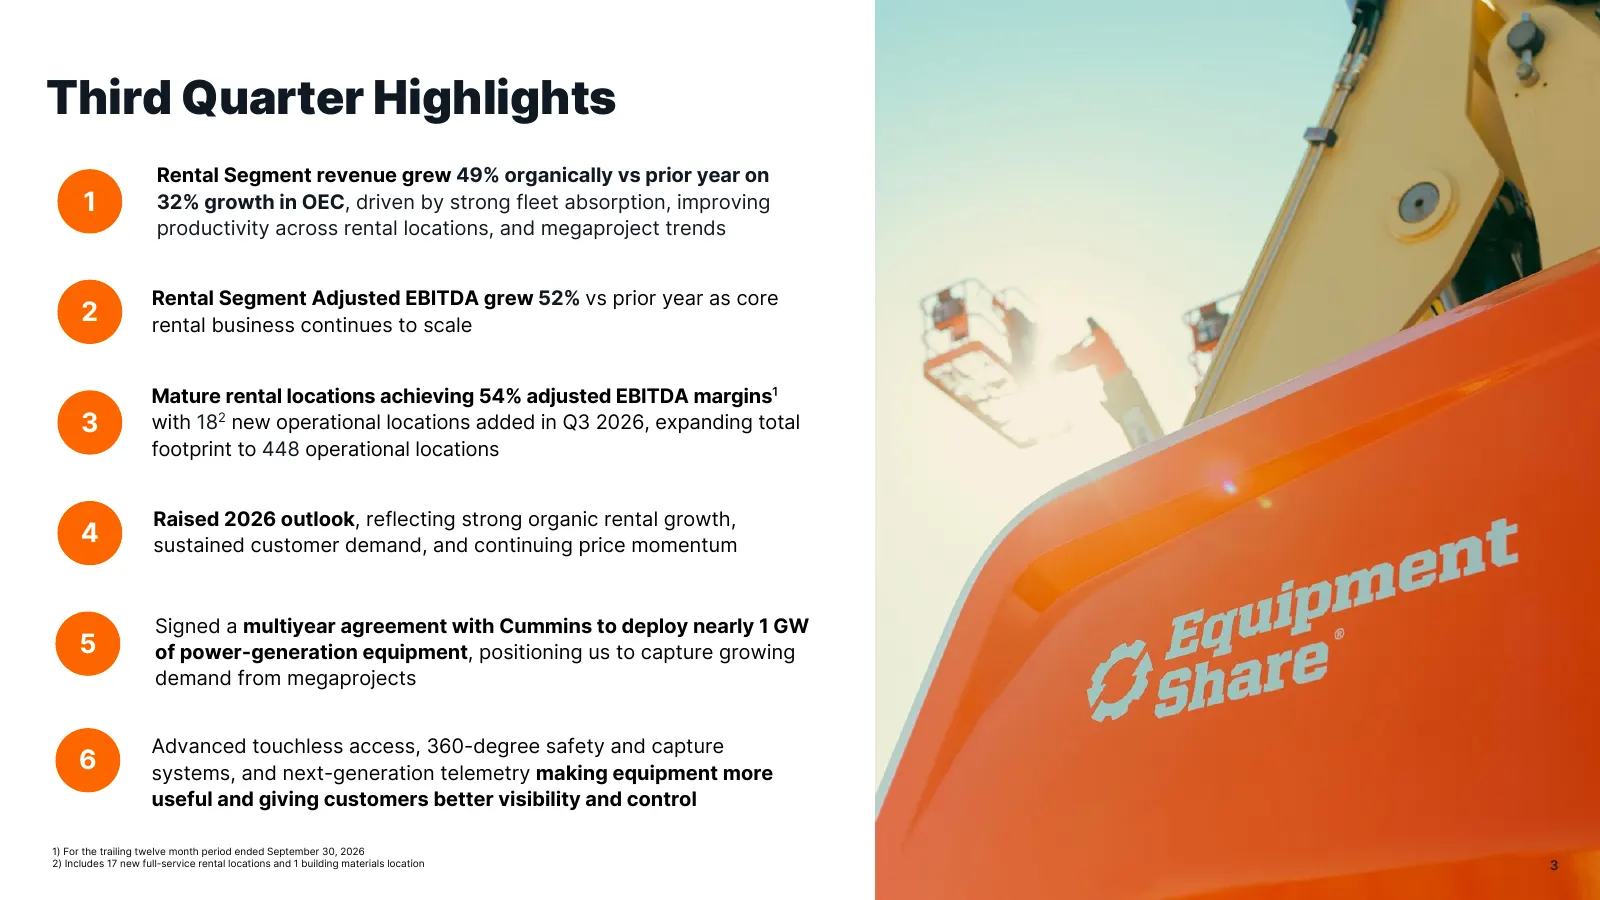
Slide 3: Third Quarter Highlights
Third Quarter Highlights Rental Segment revenue grew 49% organically vs prior year on 1 32% growth in OEC, driven by strong fleet absorption, improving productivity across rental locations, and megaproject trends Rental Segment Adjusted EBITDA grew 52% vs prior year as core 2 rental business continu
Slide 4: 2026 Outlook
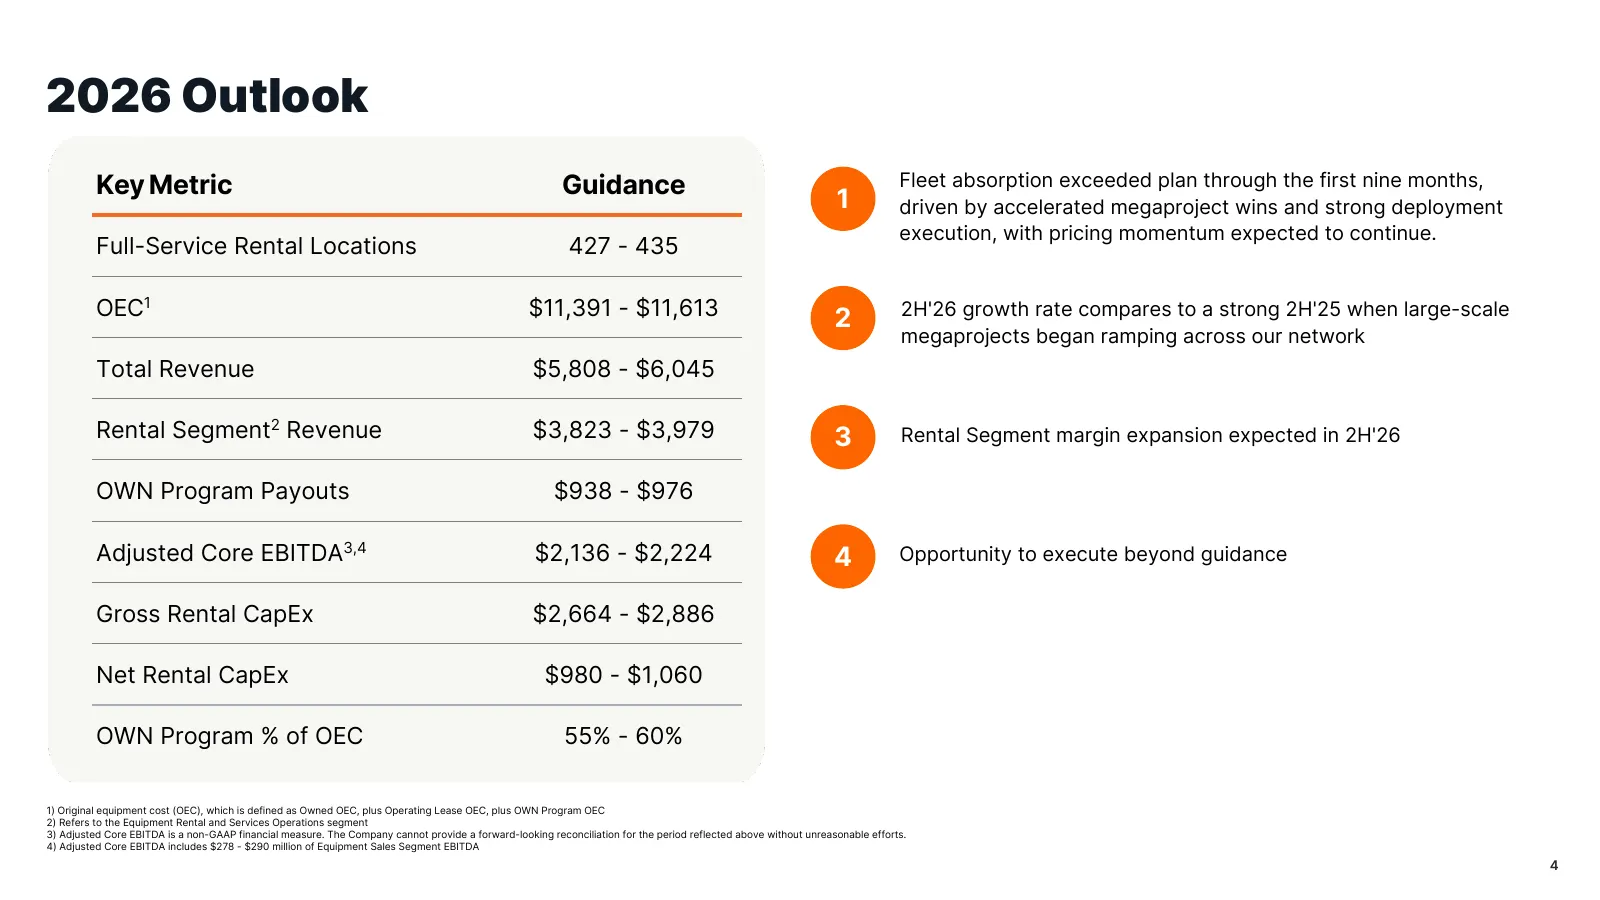
2026 Outlook Key Metric Guidance Fleet absorption exceeded plan through the first nine months, 1 driven by accelerated megaproject wins and strong deployment execution, with pricing momentum expected to continue. Full-Service Rental Locations 427 - 435 OEC1 $11,391 - $11,613 2 2H'26 growth rate comp
Slide 5: Premium Financial Profile at Scale
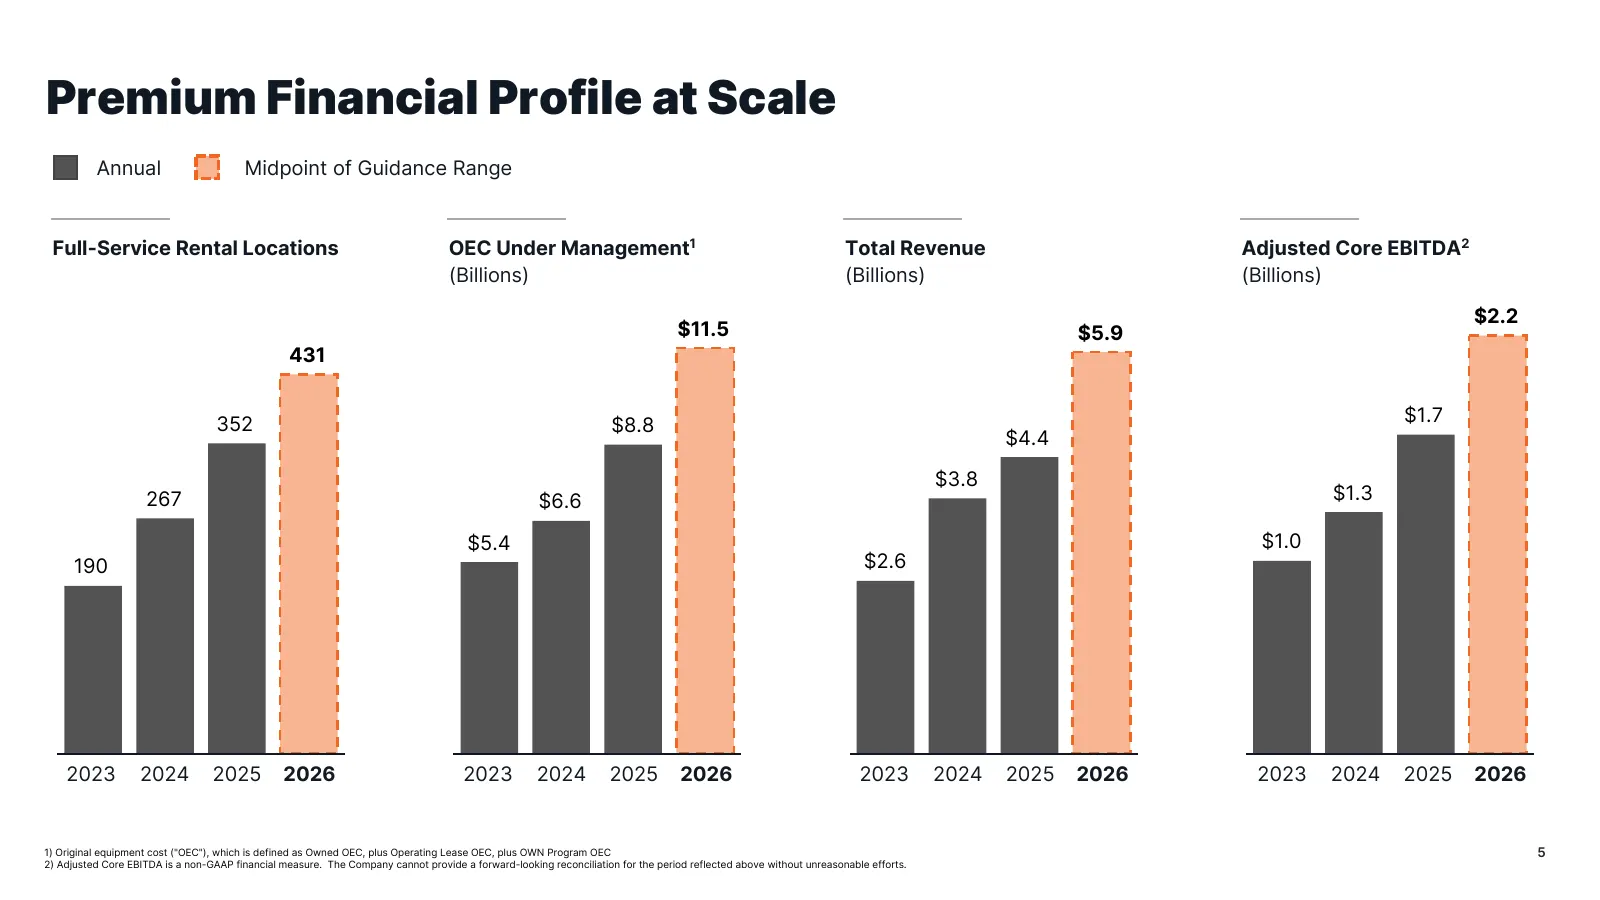
Premium Financial Profile at Scale Annual Midpoint of Guidance Range Full-Service Rental Locations OEC Under Management1 Total Revenue Adjusted Core EBITDA2 (Billions) (Billions) (Billions) $2.2 $11.5 $5.9 431 352 $8.8 $1.7 $4.4 $3.8 267 $6.6 $1.3 $5.4 $1.0 190 $2.6 2023 2024 2025 2026 2023 2024 202
Slide 6: Expansive and Growing National Footprint
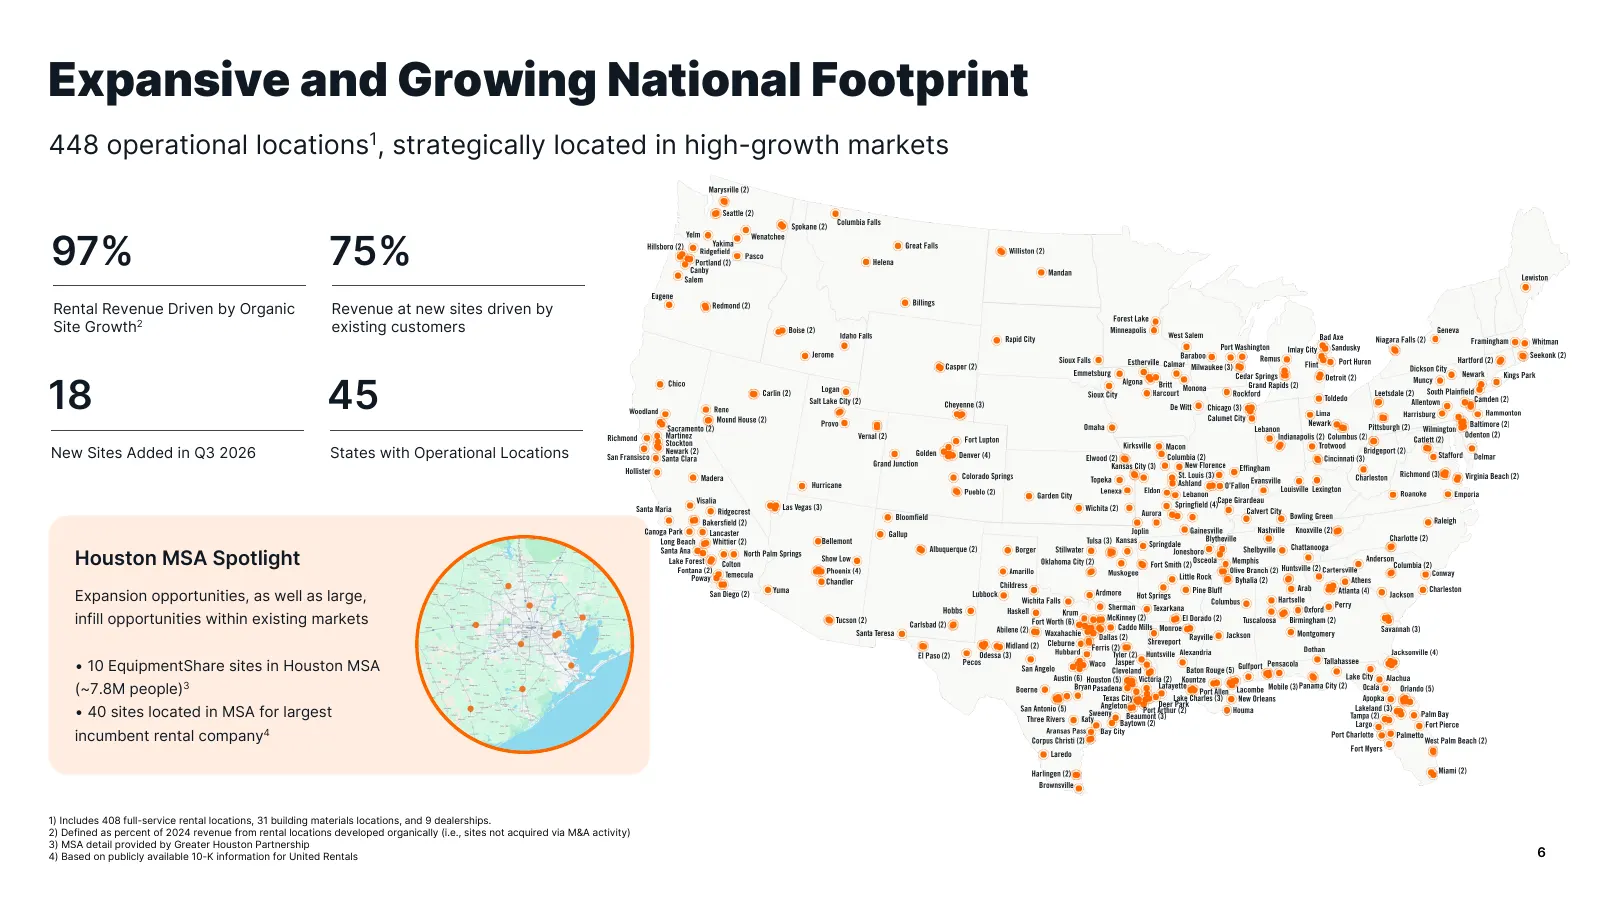
Expansive and Growing National Footprint 448 operational locations1, strategically located in high-growth markets 97% 75% Rental Revenue Driven by Organic Revenue at new sites driven by Site Growth2 existing customers 18 45 New Sites Added in Q3 2026 States with Operational Locations Houston MSA Spo
Slide 7: Value Embedded in the Rental Network
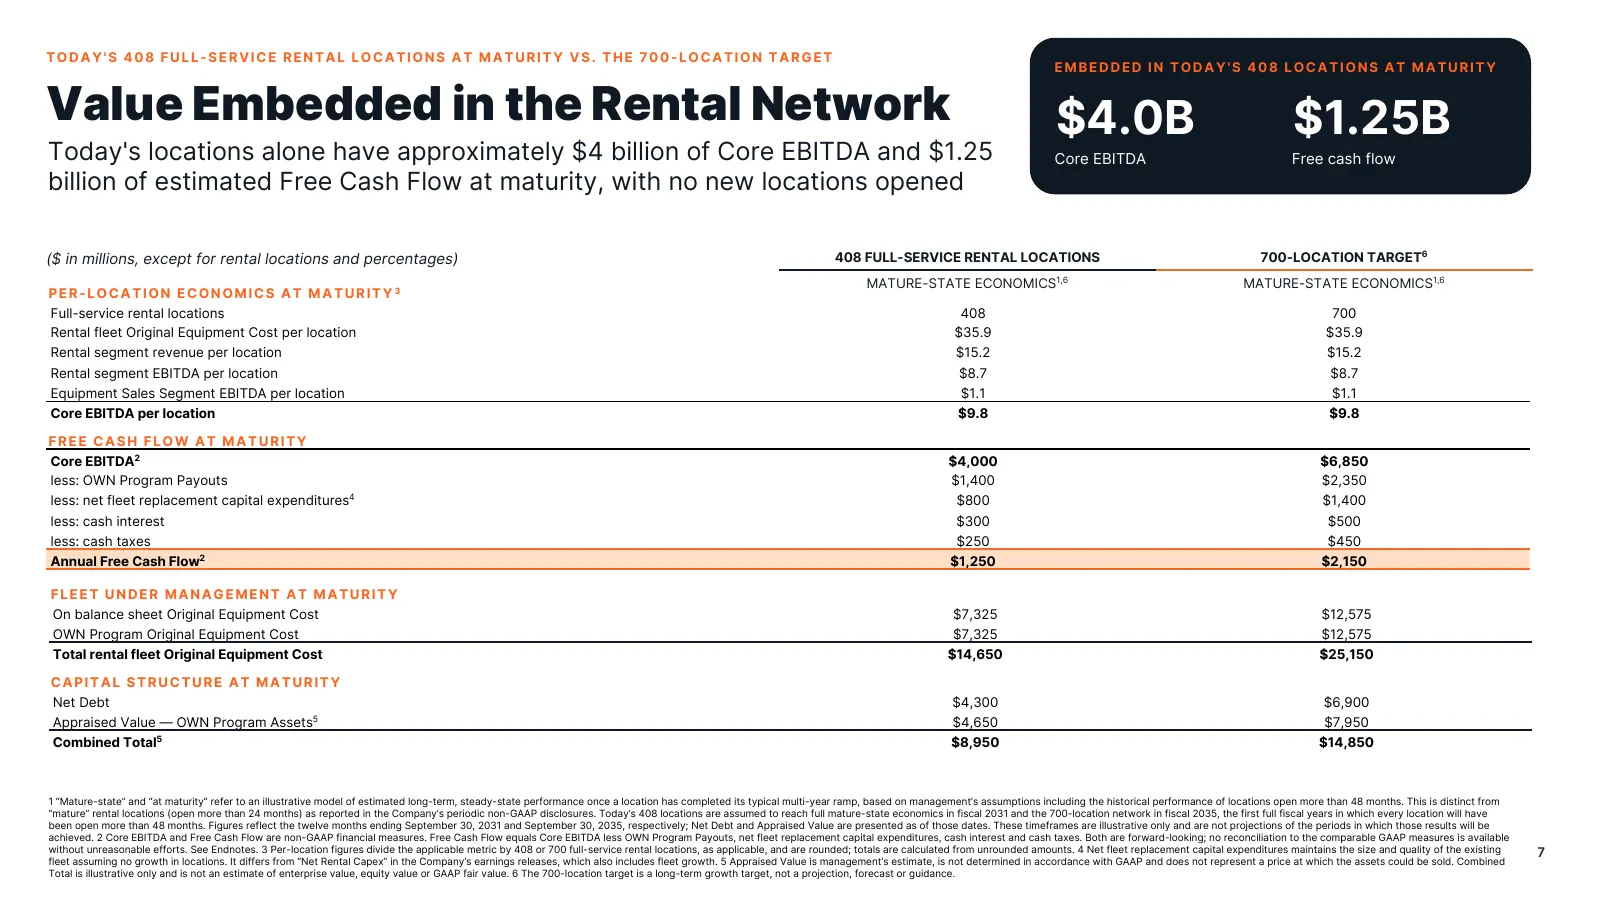
TODAY'S 408 FULL-SERVICE RENTAL LOCATIONS AT MATURITY VS. THE 700-LOCATION TARGET EMBEDDED IN TODAY'S 408 LOCATIONS AT MATURITY Value Embedded in the Rental Network $4.0B $1.25B Today's locations alone have approximately $4 billion of Core EBITDA and $1.25 Core EBITDA Free cash flow billion of estim
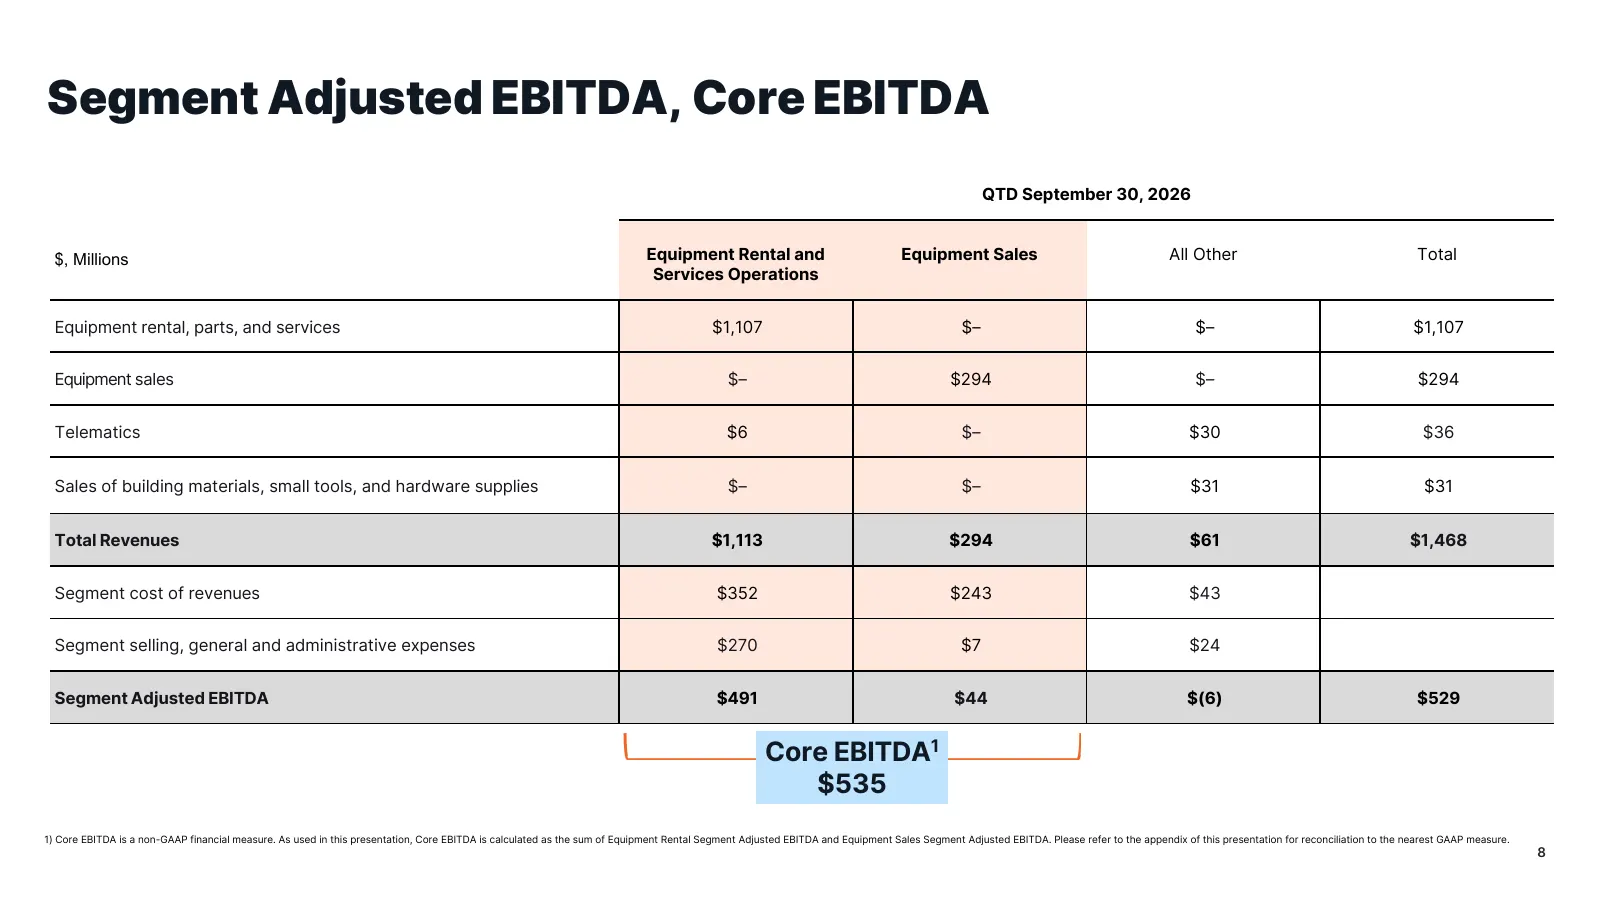
Slide 8: Segment Adjusted EBITDA, Core EBITDA
Segment Adjusted EBITDA, Core EBITDA QTD September 30, 2026 $, Millions Equipment Rental and Equipment Sales All Other Total Services Operations Equipment rental, parts, and services $1,107 $– $– $1,107 Equipment sales $– $294 $– $294 Telematics $6 $– $30 $36 Sales of building materials, small tools
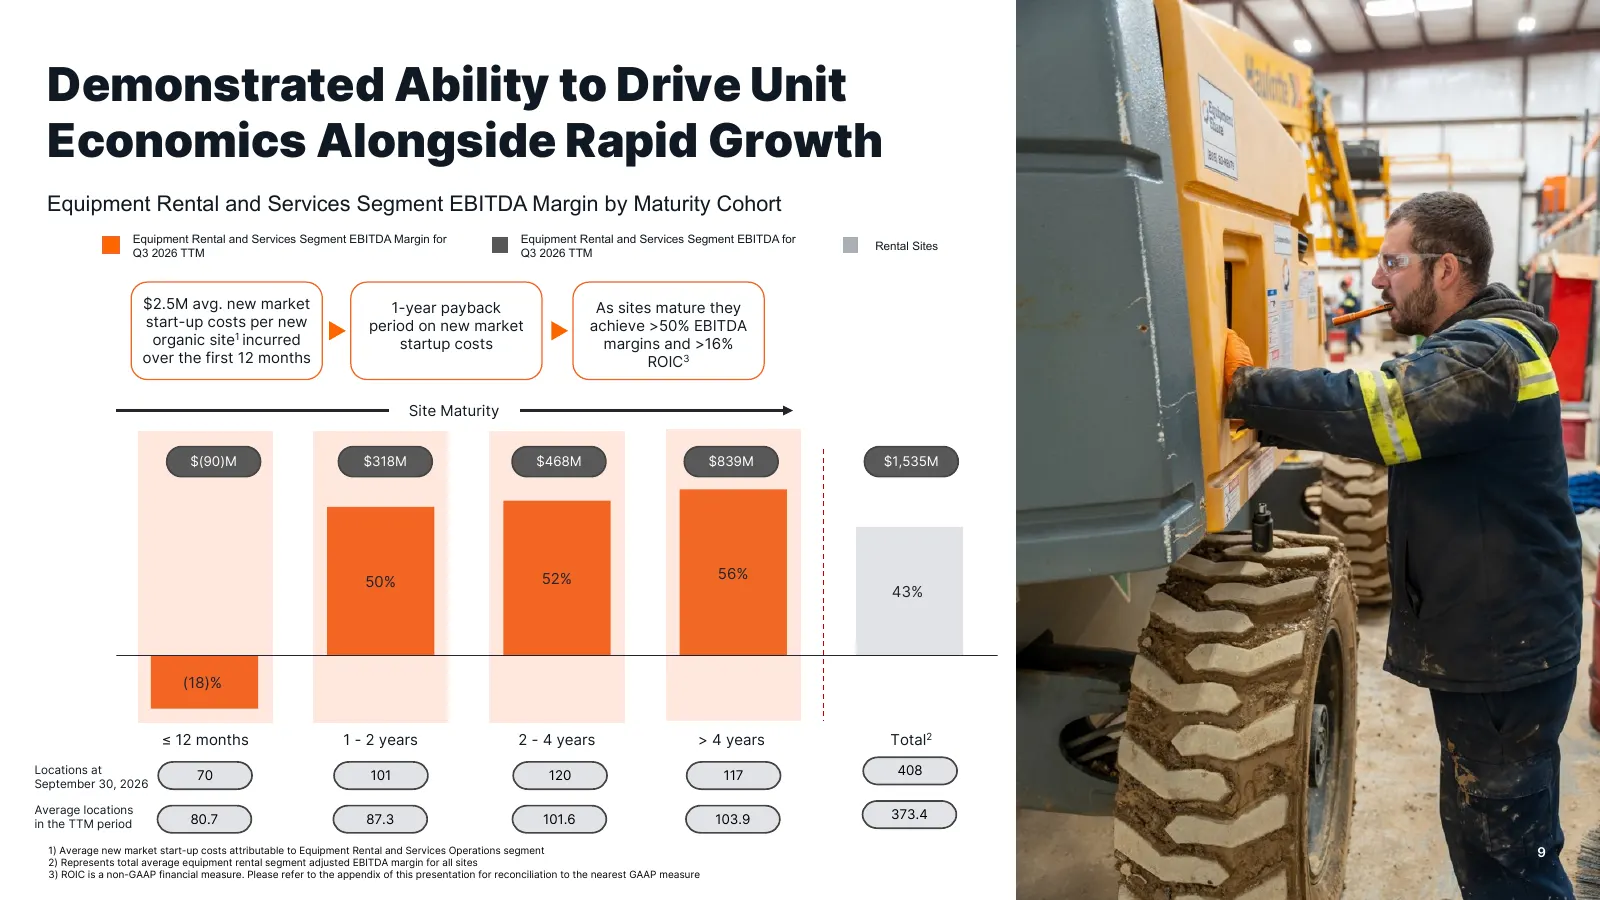
Slide 9: Demonstrated Ability to Drive Unit Economics Alongside Rapid Growth
Demonstrated Ability to Drive Unit Economics Alongside Rapid Growth Equipment Rental and Services Segment EBITDA Margin by Maturity Cohort Equipment Rental and Services Segment EBITDA Margin for Equipment Rental and Services Segment EBITDA for Rental Sites Q3 2026 TTM Q3 2026 TTM $2.5M avg. new mark
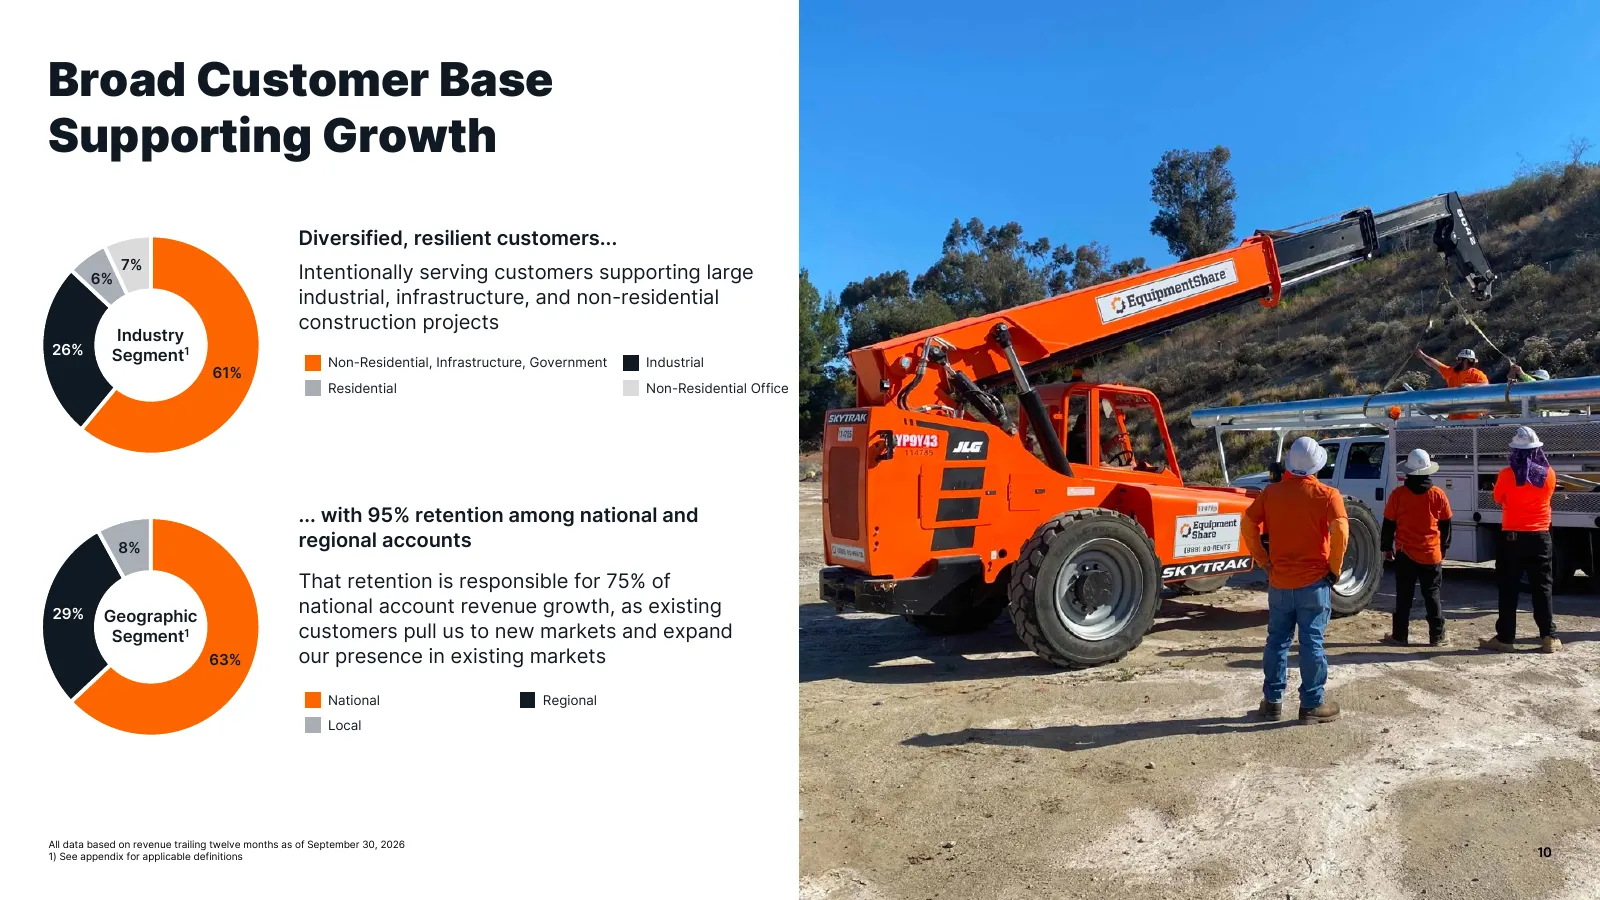
Slide 10: Broad Customer Base Supporting Growth
Broad Customer Base Supporting Growth Diversified, resilient customers... 7% 6% Intentionally serving customers supporting large industrial, infrastructure, and non-residential construction projects Industry 26% Segment1 Non-Residential, Infrastructure, Government Industrial 61% Residential Non-Resi
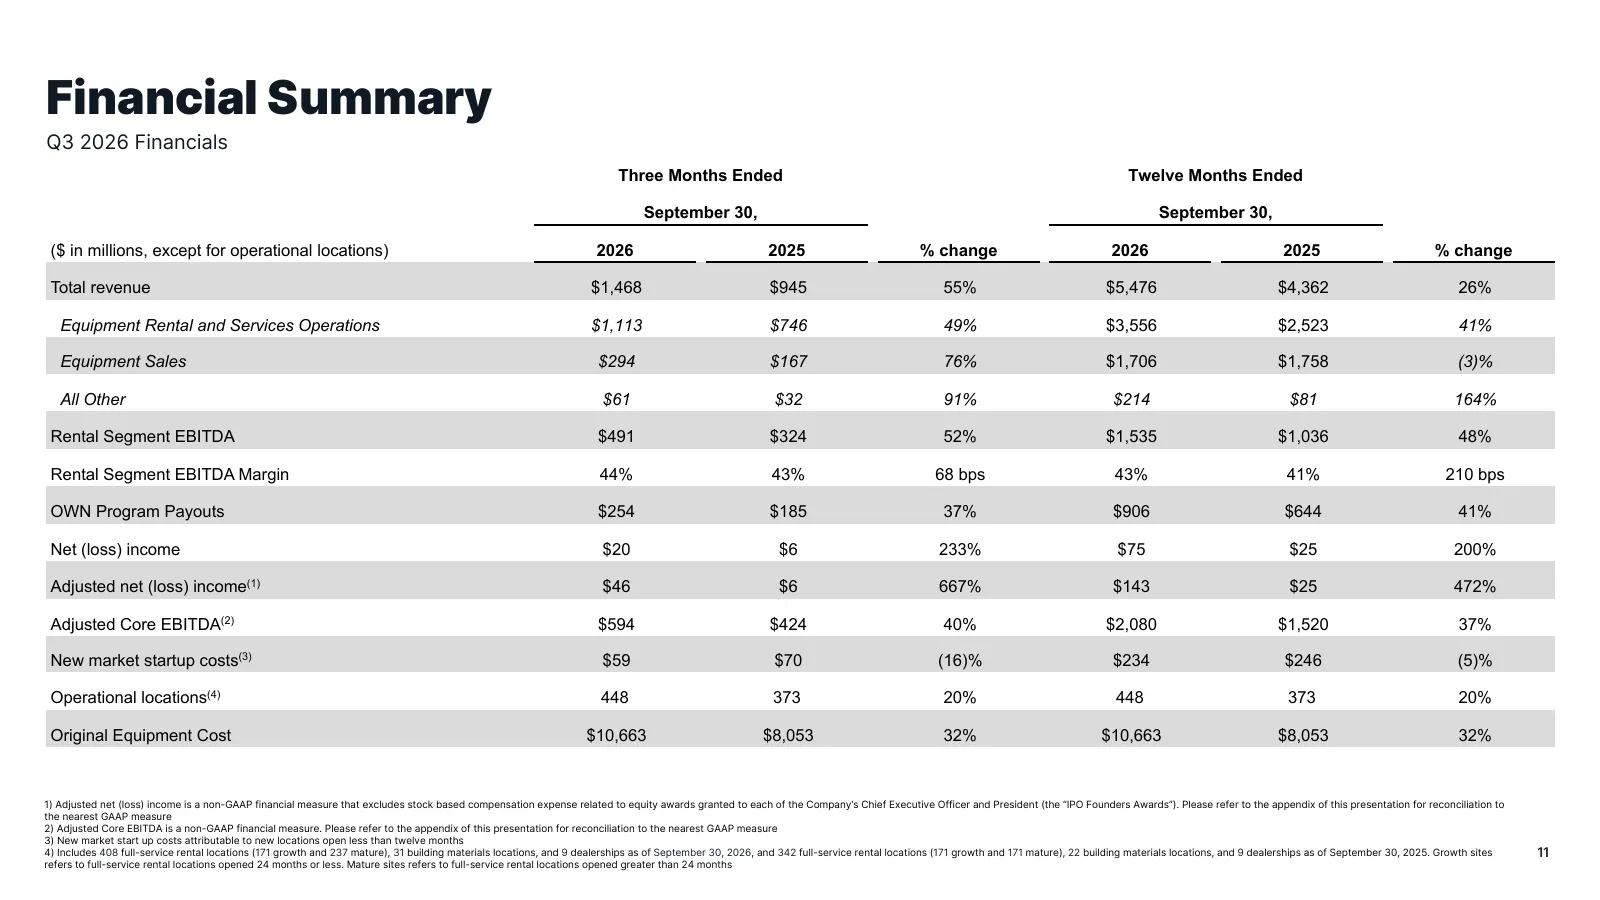
Slide 11: Financial Summary
Financial Summary Q3 2026 Financials Three Months Ended Twelve Months Ended September 30, September 30, ($ in millions, except for operational locations) 2026 2025 % change 2026 2025 % change Total revenue $1,468 $945 55% $5,476 $4,362 26% Equipment Rental and Services Operations $1,113 $746 49% $3,
Slide 12: Adjusted Core EBITDA
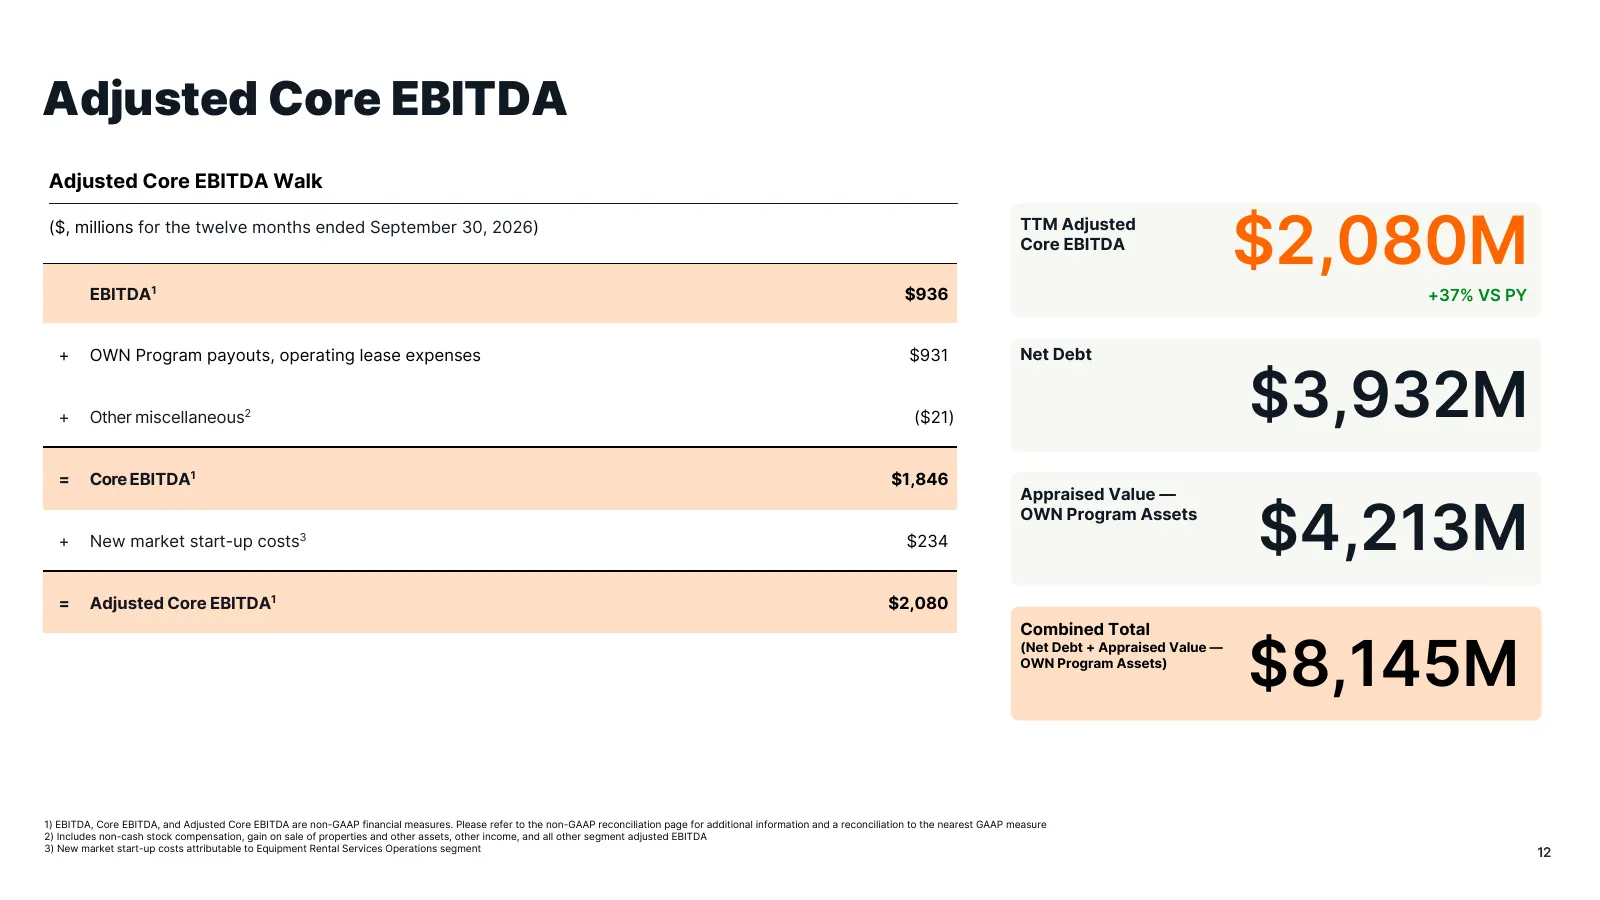
Adjusted Core EBITDA Adjusted Core EBITDA Walk $2,080M ($, millions for the twelve months ended September 30, 2026) TTM Adjusted Core EBITDA EBITDA1 $936 +37% VS PY + OWN Program payouts, operating lease expenses $931 Net Debt + Other miscellaneous2 ($21) $3,932M = Core EBITDA1 $1,846 Appraised Valu
Slide 13: Disciplined Debt Management
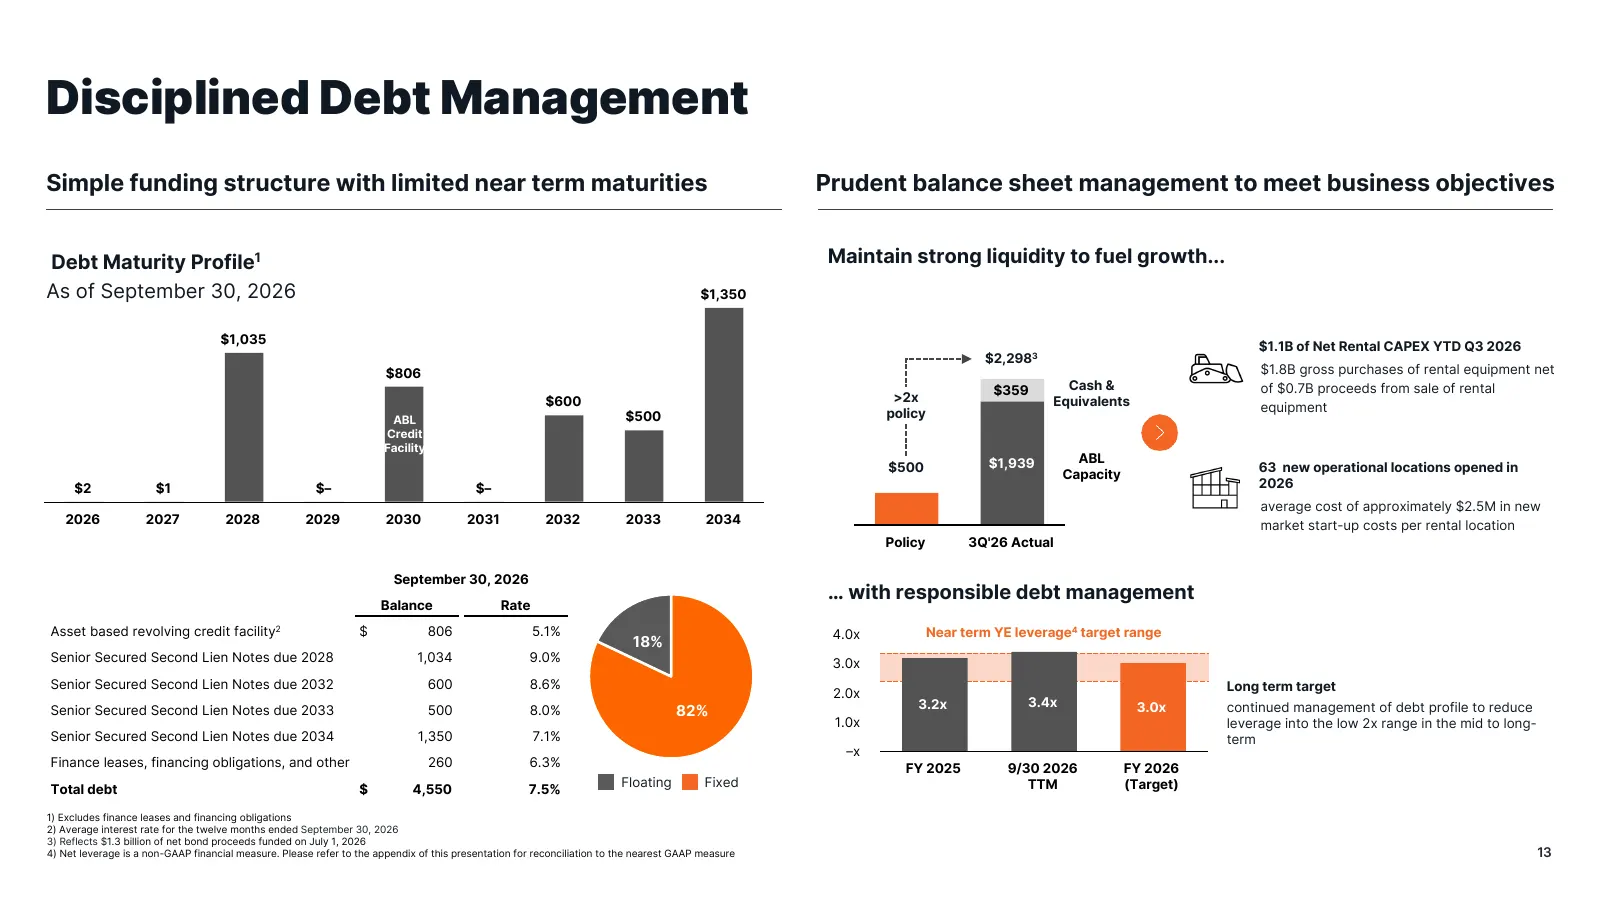
Disciplined Debt Management Simple funding structure with limited near term maturities Prudent balance sheet management to meet business objectives Debt Maturity Profile1 Maintain strong liquidity to fuel growth... As of September 30, 2026 $1,350 $1,035 $1.1B of Net Rental CAPEX YTD Q3 2026 $2,2983
Slide 14: Capital Allocation Strategy and Financial Framework
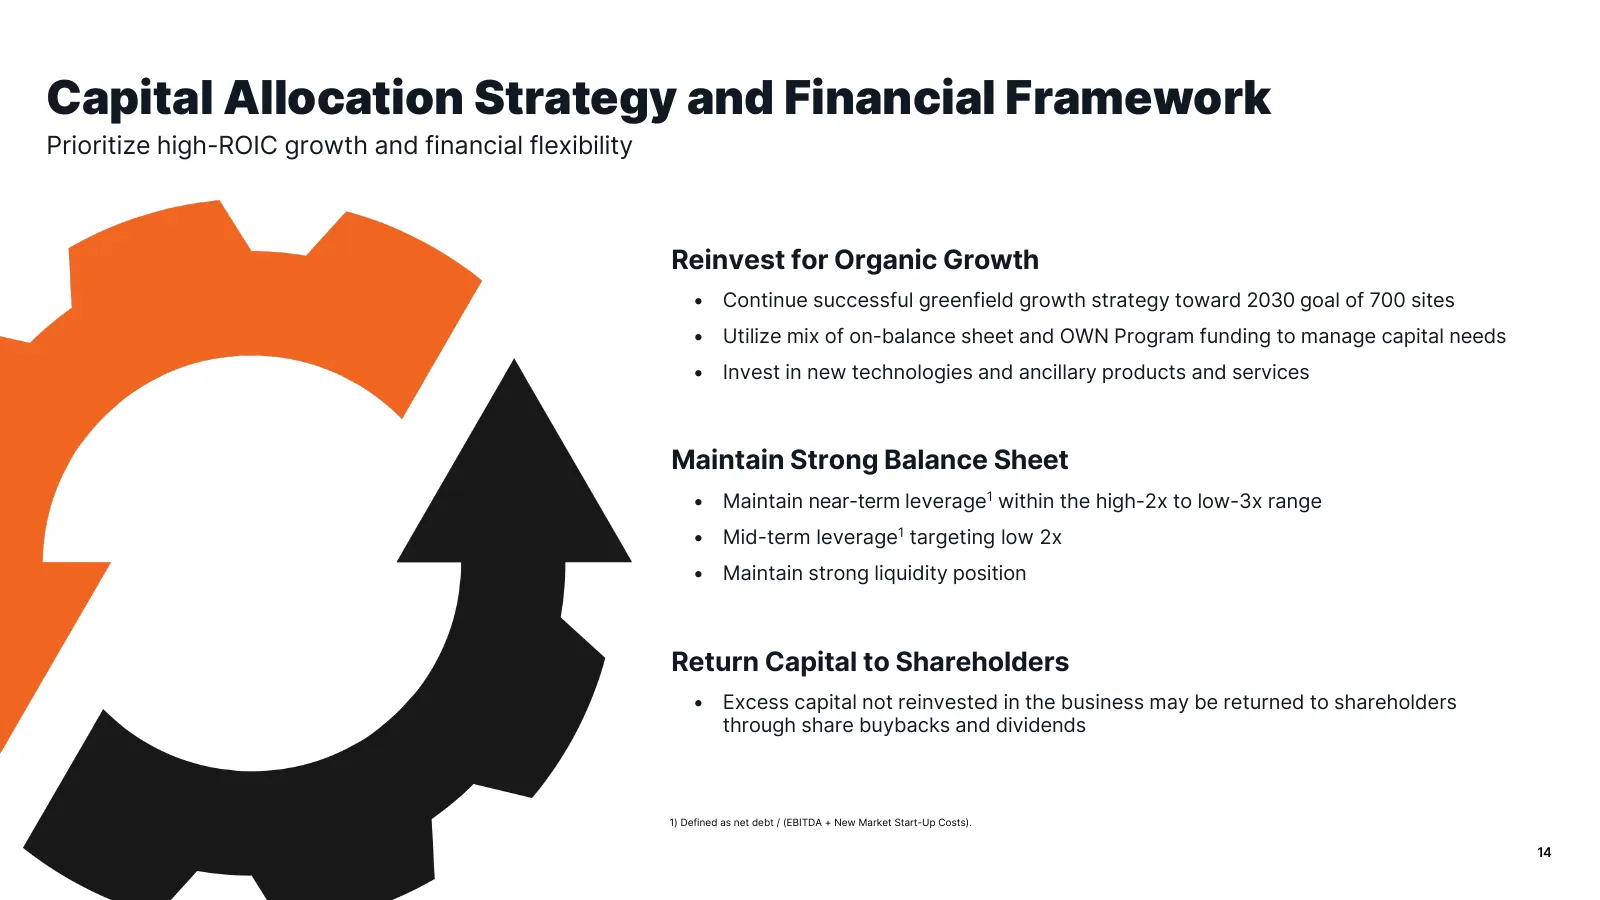
Capital Allocation Strategy and Financial Framework Prioritize high-ROIC growth and financial flexibility Reinvest for Organic Growth • Continue successful greenfield growth strategy toward 2030 goal of 700 sites • Utilize mix of on-balance sheet and OWN Program funding to manage capital needs • Inv
Slide 15: 2030 Targets
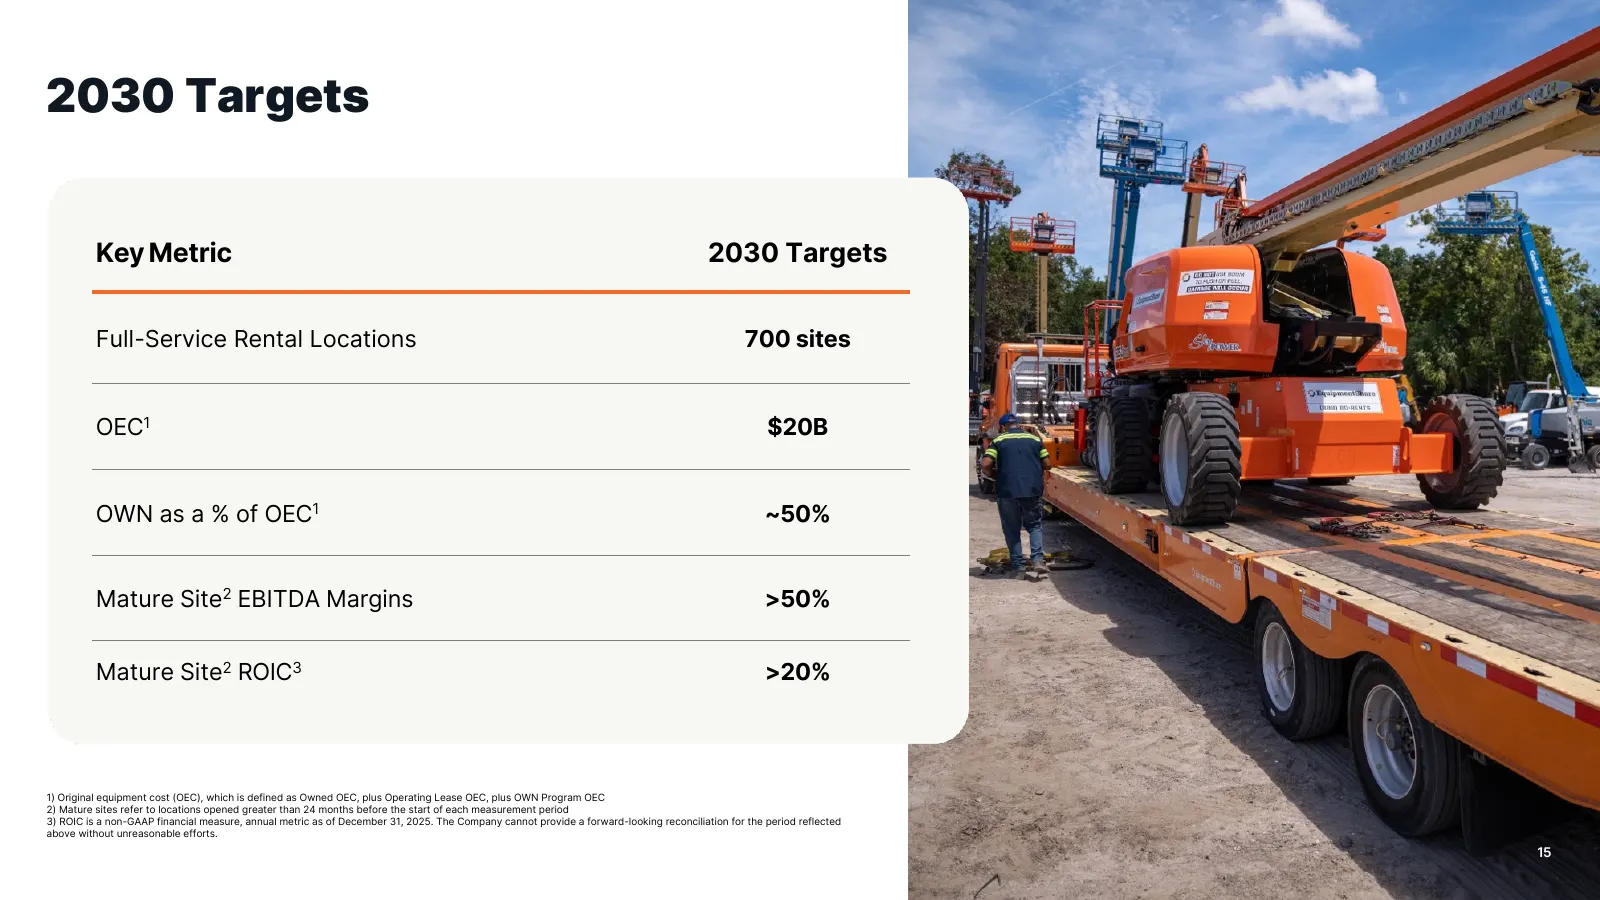
2030 Targets Key Metric 2030 Targets Full-Service Rental Locations 700 sites OEC1 $20B OWN as a % of OEC1 ~50% Mature Site2 EBITDA Margins >50% Mature Site2 ROIC3 >20% 1) Original equipment cost (OEC), which is defined as Owned OEC, plus Operating Lease OEC, plus OWN Program OEC 2) Mature sites refe

Slide 16: Appendix
Appendix 16
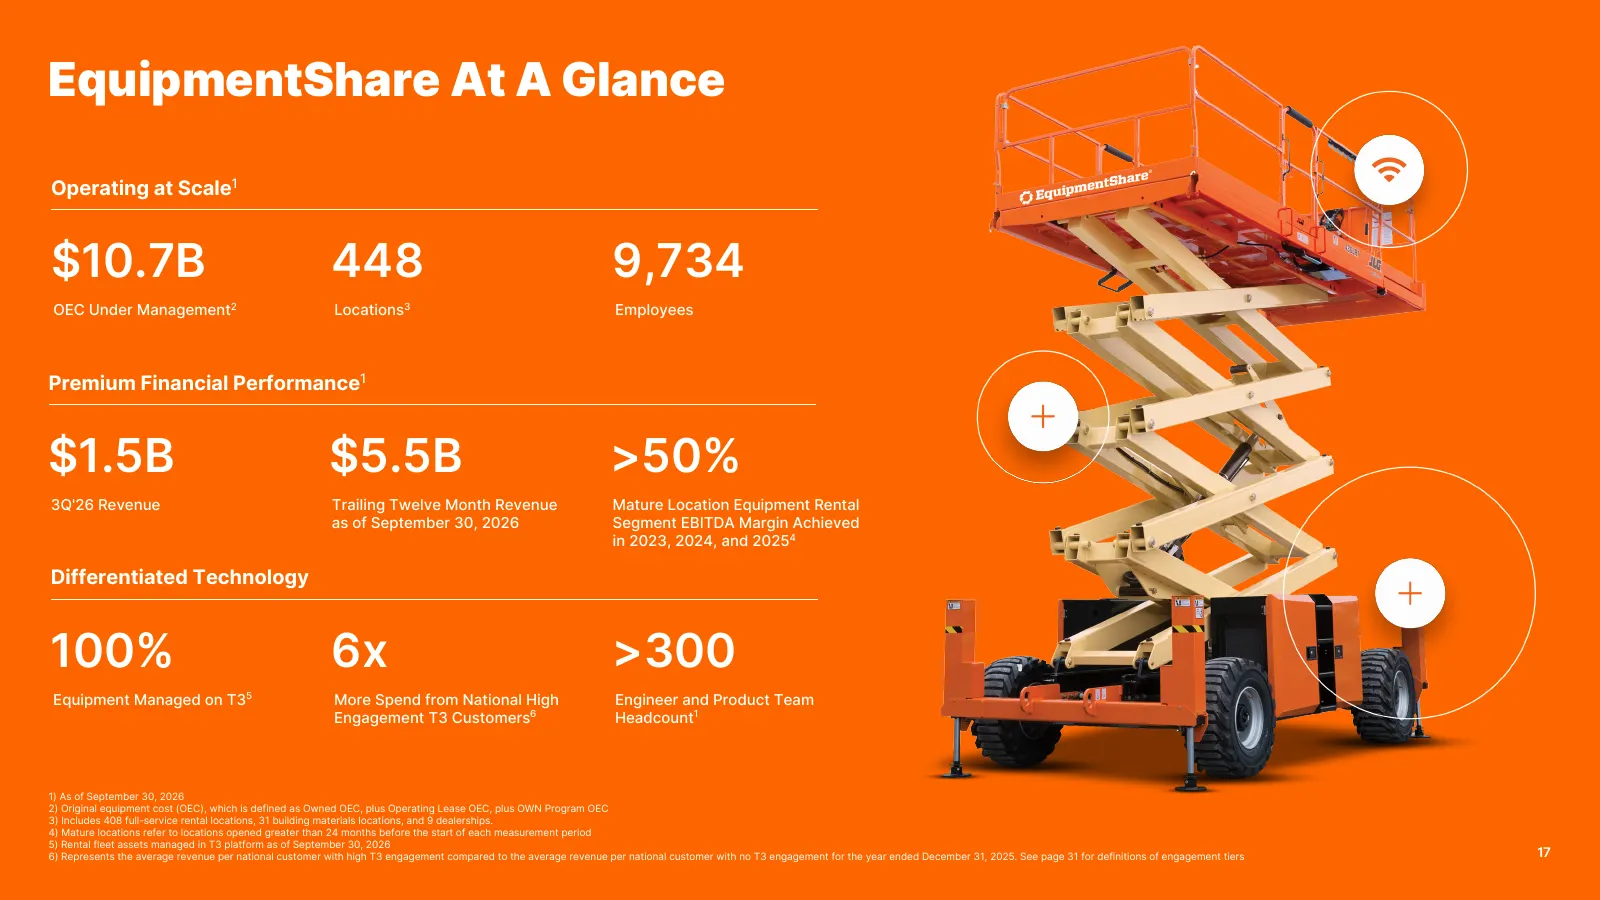
Slide 17: EquipmentShare At A Glance
EquipmentShare At A Glance Operating at Scale1 $10.7B 448 9,734 OEC Under Management2 Locations3 Employees Premium Financial Performance1 $1.5B $5.5B >50% 3Q'26 Revenue Trailing Twelve Month Revenue Mature Location Equipment Rental as of September 30, 2026 Segment EBITDA Margin Achieved in 2023, 202
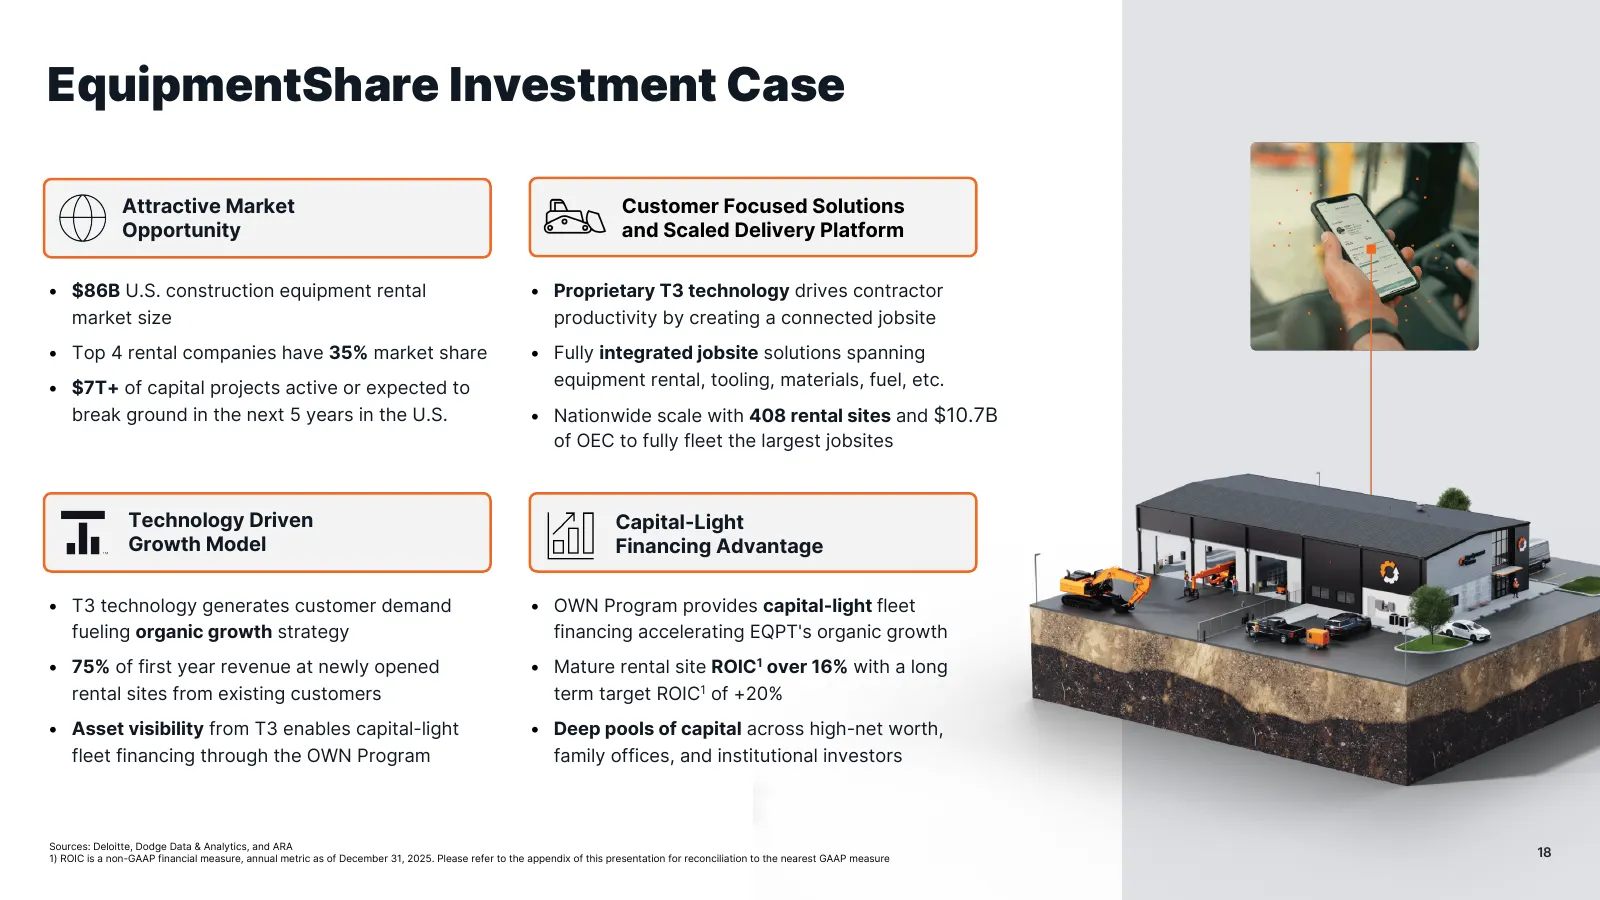
Slide 18: EquipmentShare Investment Case
EquipmentShare Investment Case Attractive Market Customer Focused Solutions Opportunity and Scaled Delivery Platform • $86B U.S. construction equipment rental • Proprietary T3 technology drives contractor market size productivity by creating a connected jobsite • Top 4 rental companies have 35% mark
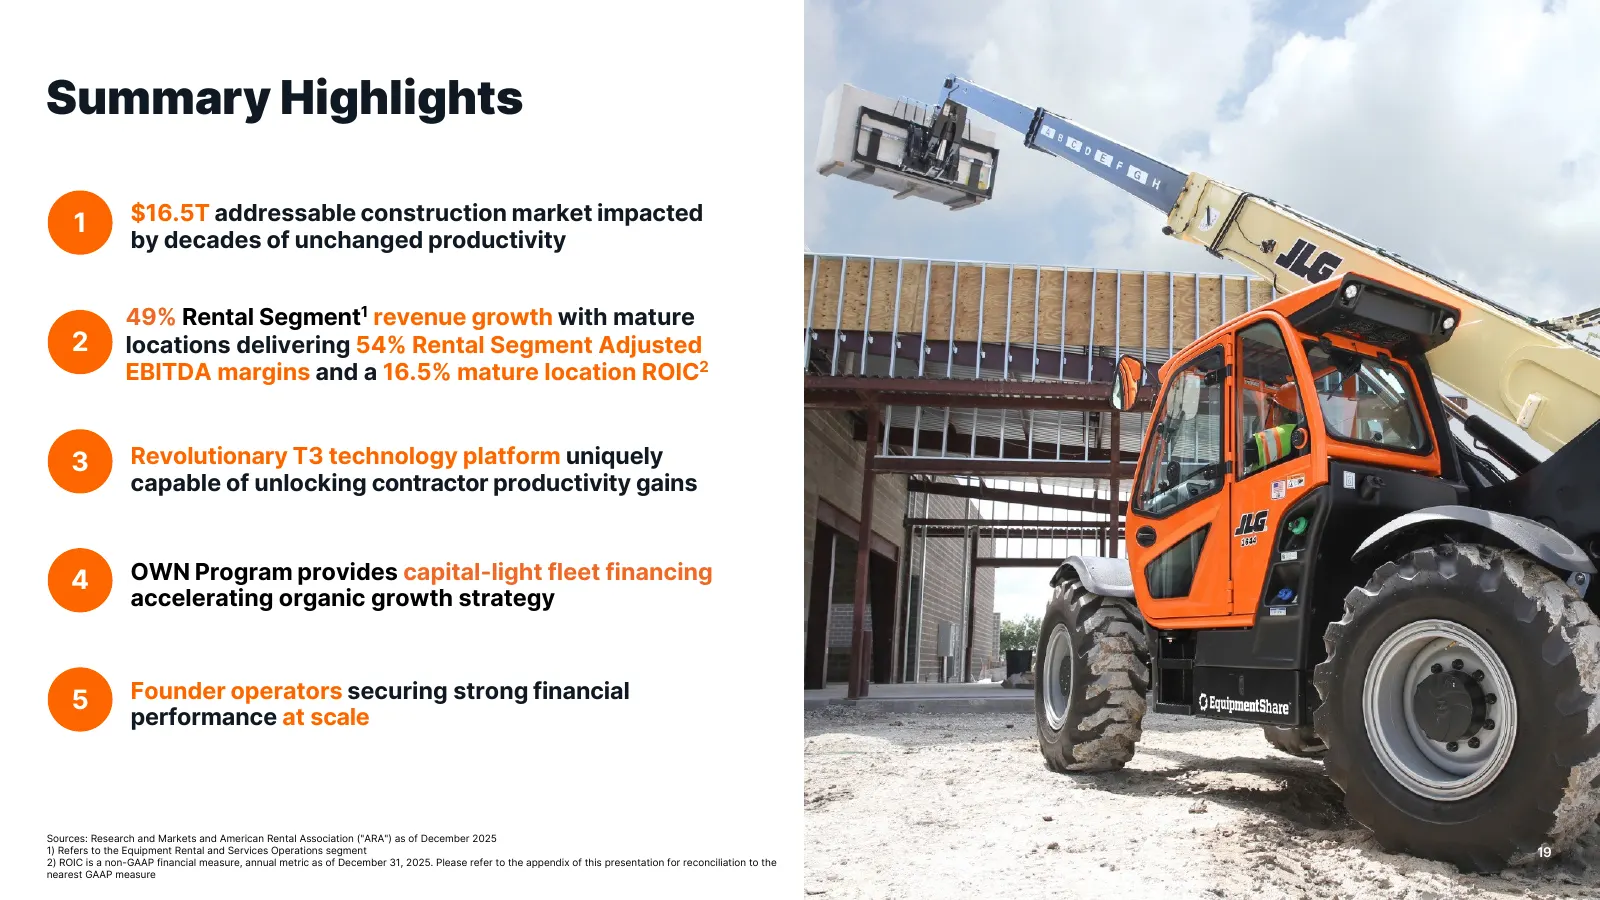
Slide 19: Summary Highlights
Summary Highlights 1 $16.5T addressable construction market impacted by decades of unchanged productivity 49% Rental Segment1 revenue growth with mature 2 locations delivering 54% Rental Segment Adjusted EBITDA margins and a 16.5% mature location ROIC2 3 Revolutionary T3 technology platform uniquely
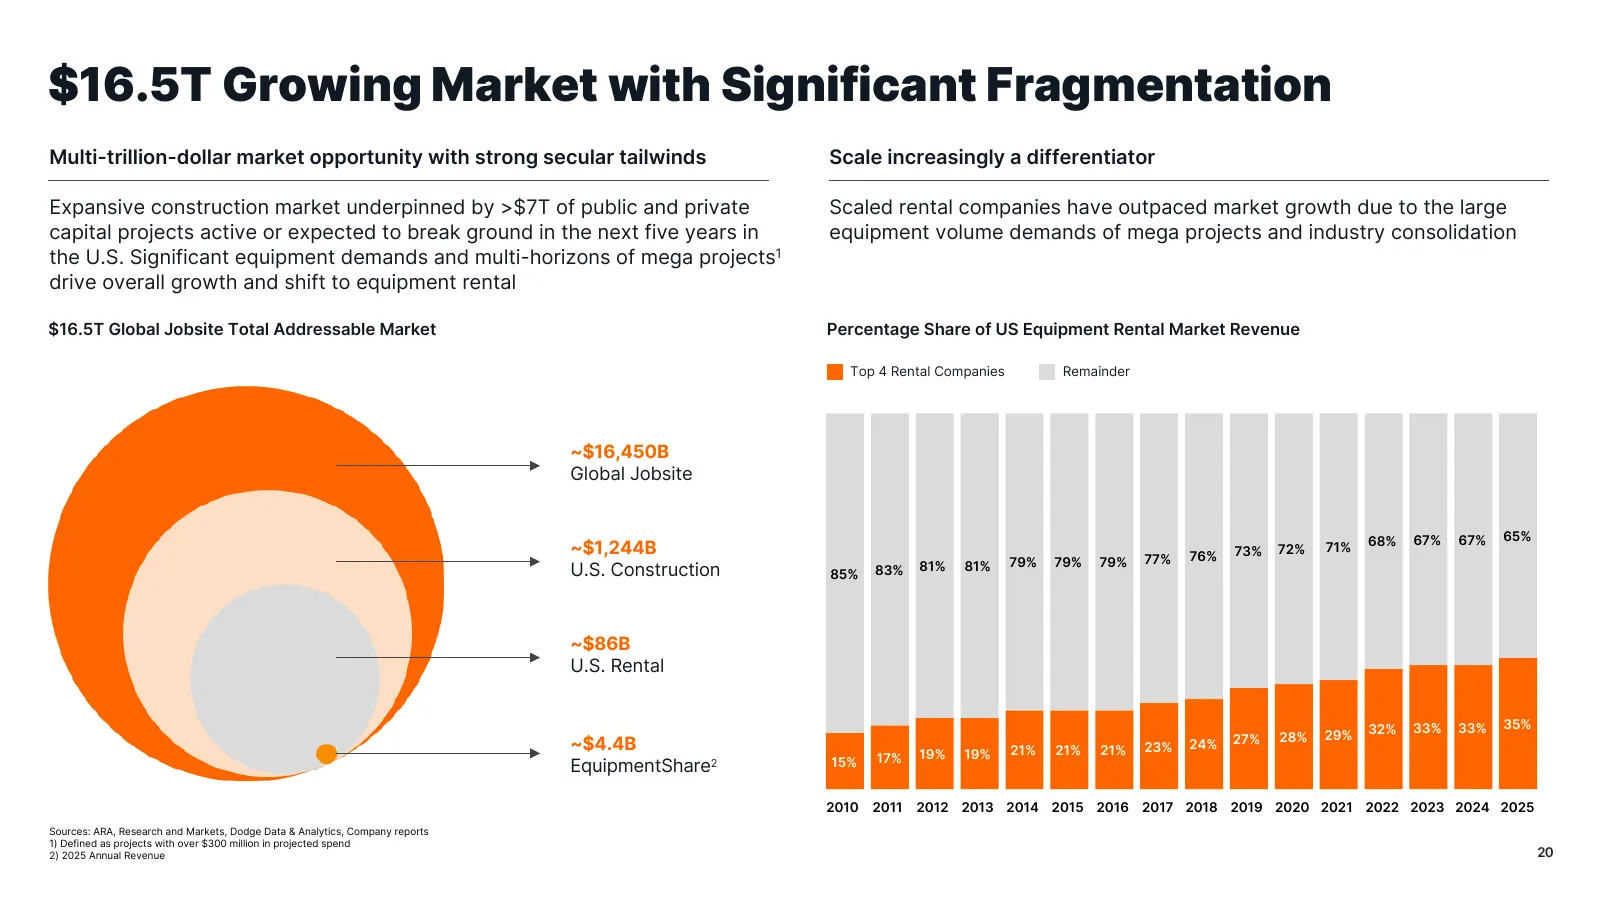
Slide 20: $16.5T Growing Market with Significant Fragmentation
$16.5T Growing Market with Significant Fragmentation Multi-trillion-dollar market opportunity with strong secular tailwinds Scale increasingly a differentiator Expansive construction market underpinned by >$7T of public and private Scaled rental companies have outpaced market growth due to the large
Slide 21: Persistent Inefficiency in Construction Drives High Costs
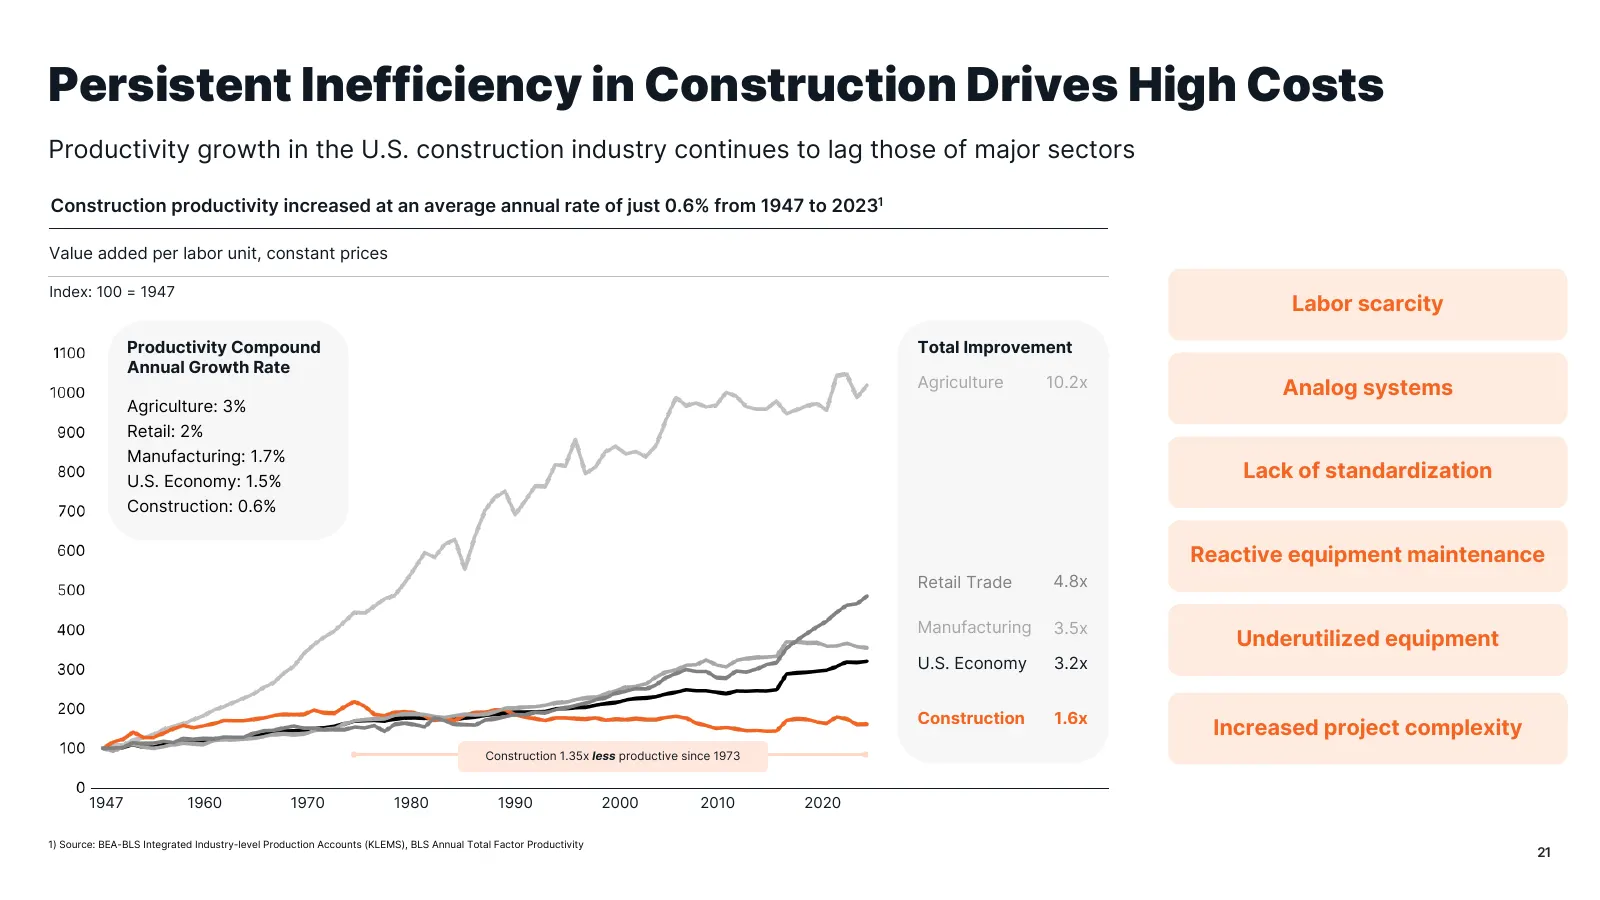
Persistent Inefficiency in Construction Drives High Costs Productivity growth in the U.S. construction industry continues to lag those of major sectors Construction productivity increased at an average annual rate of just 0.6% from 1947 to 20231 Value added per labor unit, constant prices Index: 100
Slide 22: Our Opportunity
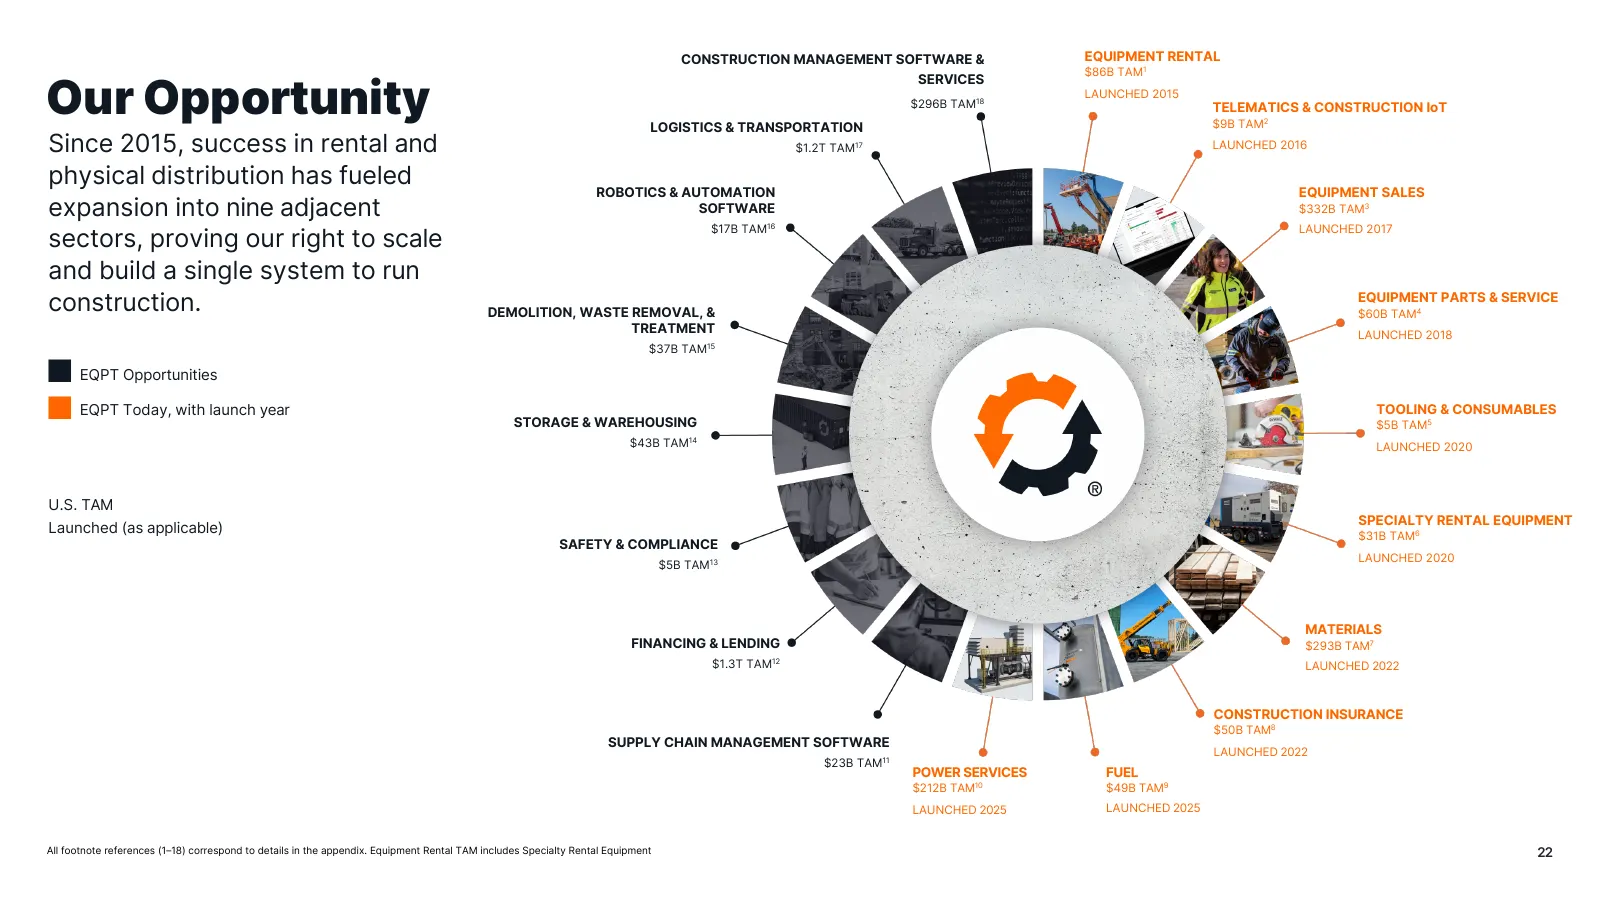
CONSTRUCTION MANAGEMENT SOFTWARE & EQUIPMENT RENTAL $86B TAM1 Our Opportunity SERVICES LAUNCHED 2015 $296B TAM18 TELEMATICS & CONSTRUCTION IoT LOGISTICS & TRANSPORTATION $9B TAM2 Since 2015, success in rental and $1.2T TAM17 LAUNCHED 2016 physical distribution has fueled ROBOTICS & AUTOMATION EQUIPM
Slide 23: EquipmentShare is Building the Future of Construction
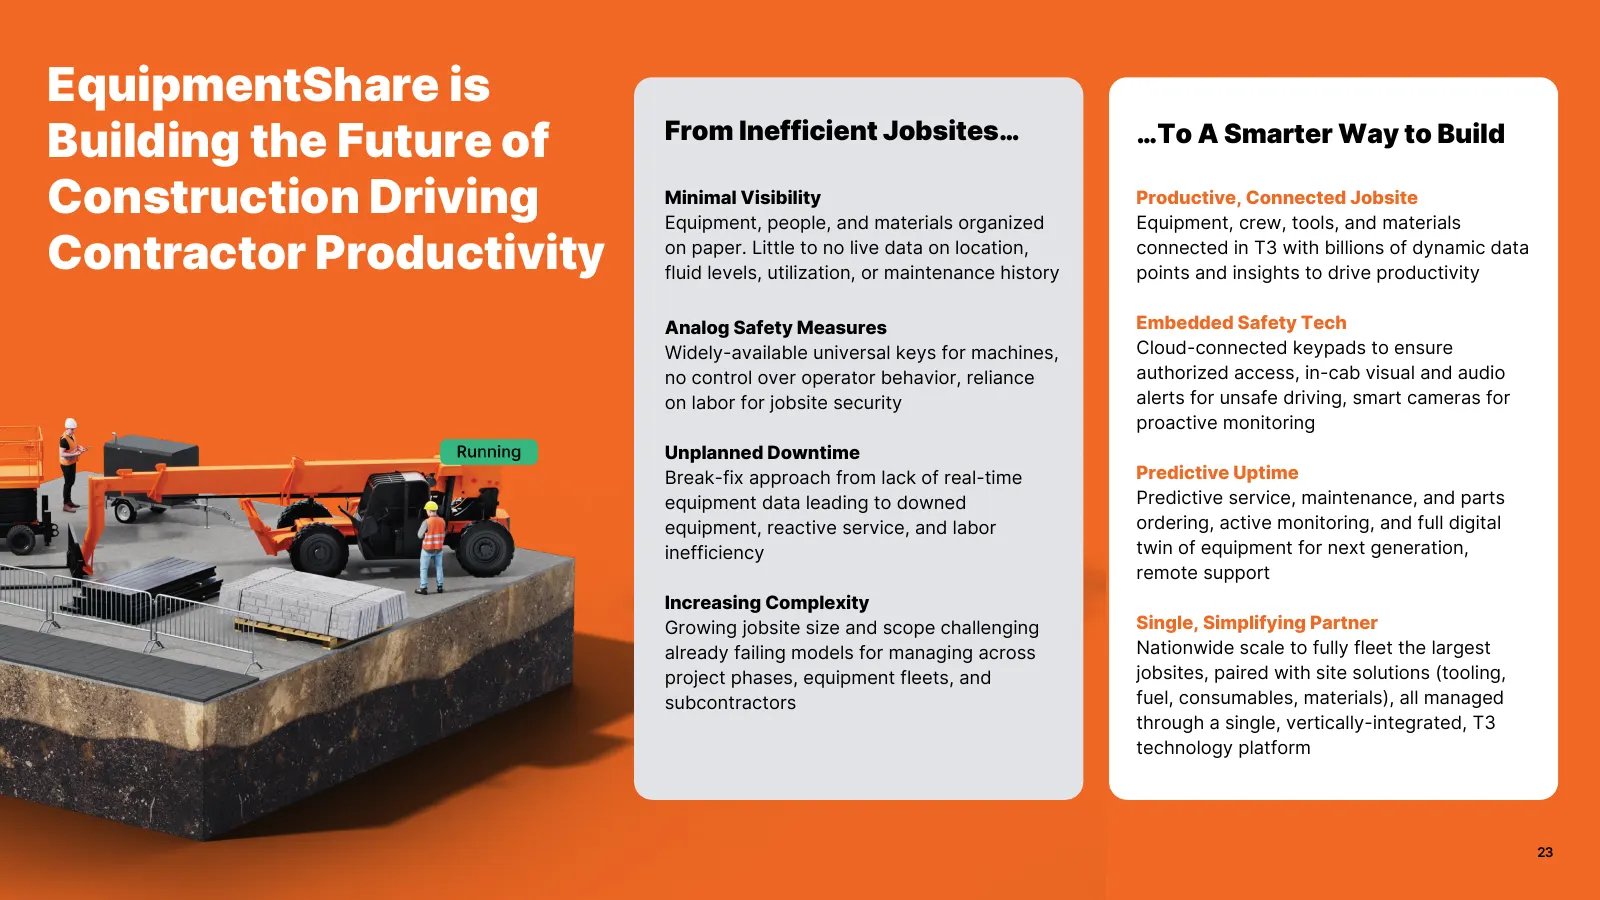
EquipmentShare is Building the Future of From Inefficient Jobsites… …To A Smarter Way to Build Construction Driving Minimal Visibility Equipment, people, and materials organized Productive, Connected Jobsite Equipment, crew, tools, and materials Contractor Productivity on paper. Little to no live da
Slide 24: EquipmentShare has a "First-of-Kind" Business Model
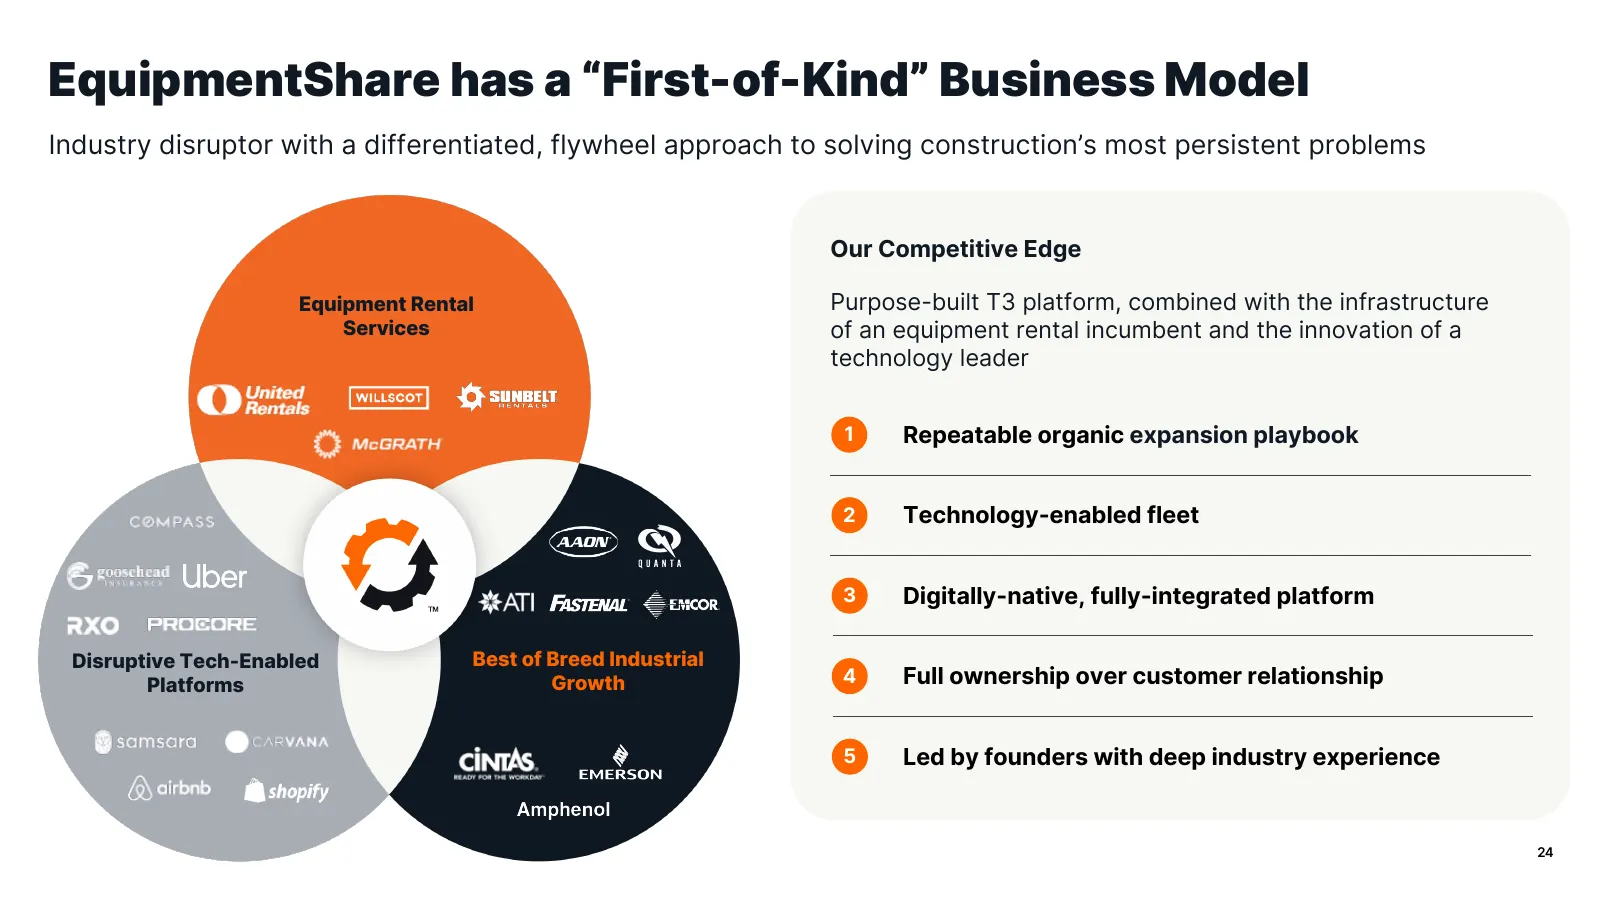
EquipmentShare has a “First-of-Kind” Business Model Industry disruptor with a differentiated, flywheel approach to solving construction’s most persistent problems Our Competitive Edge Equipment Rental Purpose-built T3 platform, combined with the infrastructure Services of an equipment rental incumbe
Slide 25: Model EquipmentShare Rental Site
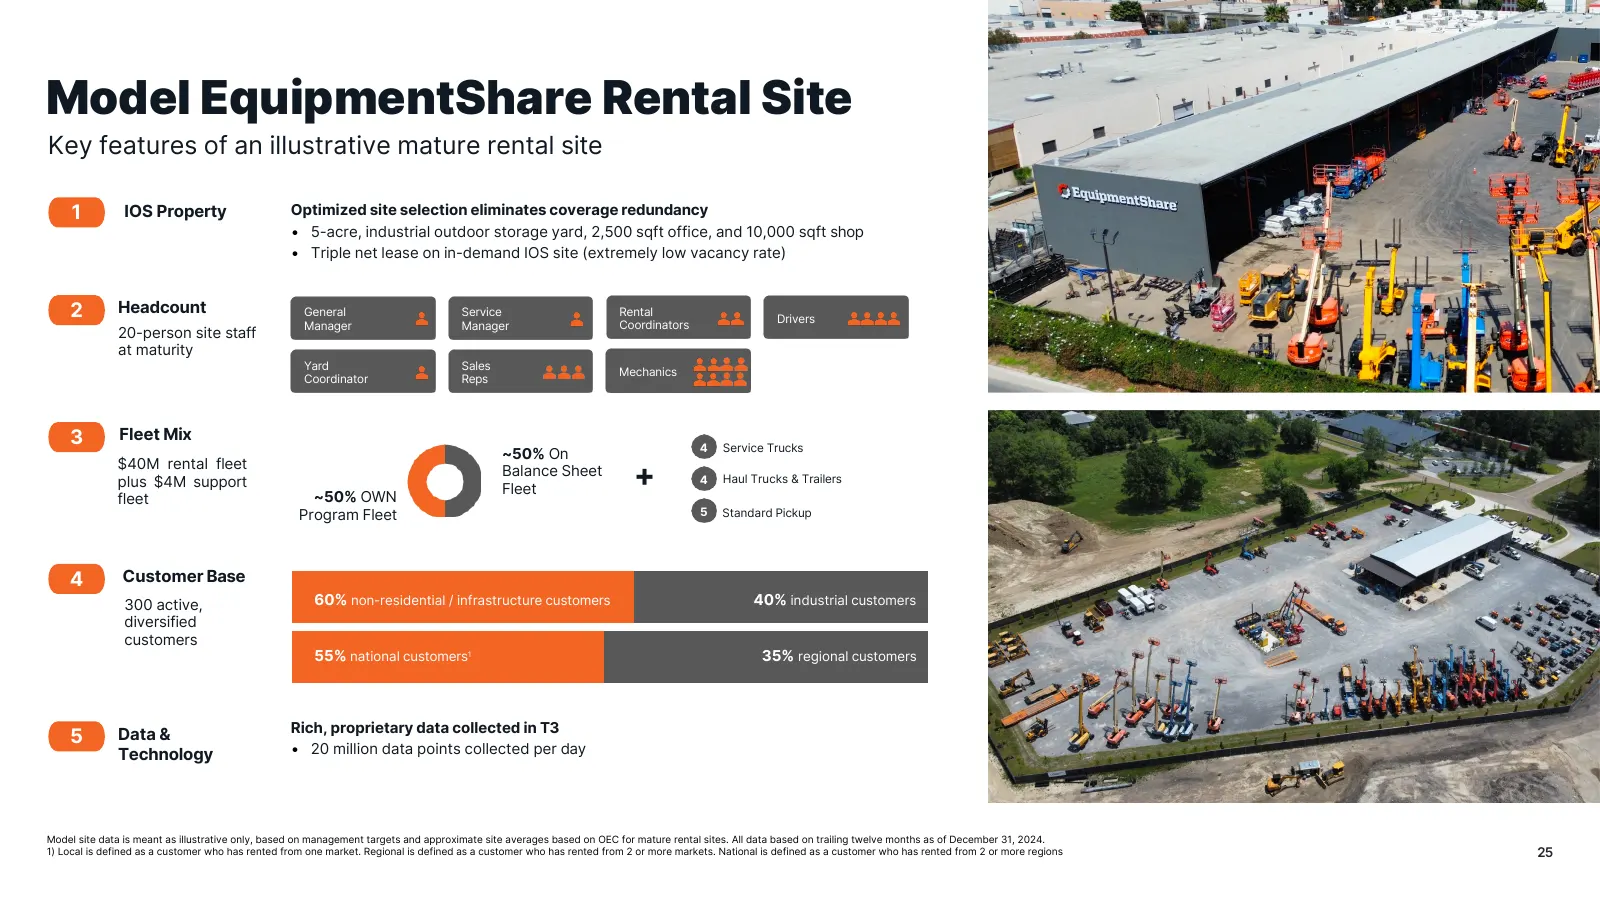
Model EquipmentShare Rental Site Key features of an illustrative mature rental site 1 IOS Property Optimized site selection eliminates coverage redundancy • 5-acre, industrial outdoor storage yard, 2,500 sqft office, and 10,000 sqft shop • Triple net lease on in-demand IOS site (extremely low vacanc
Slide 26: Organic Site Expansion Powered by Existing Customers
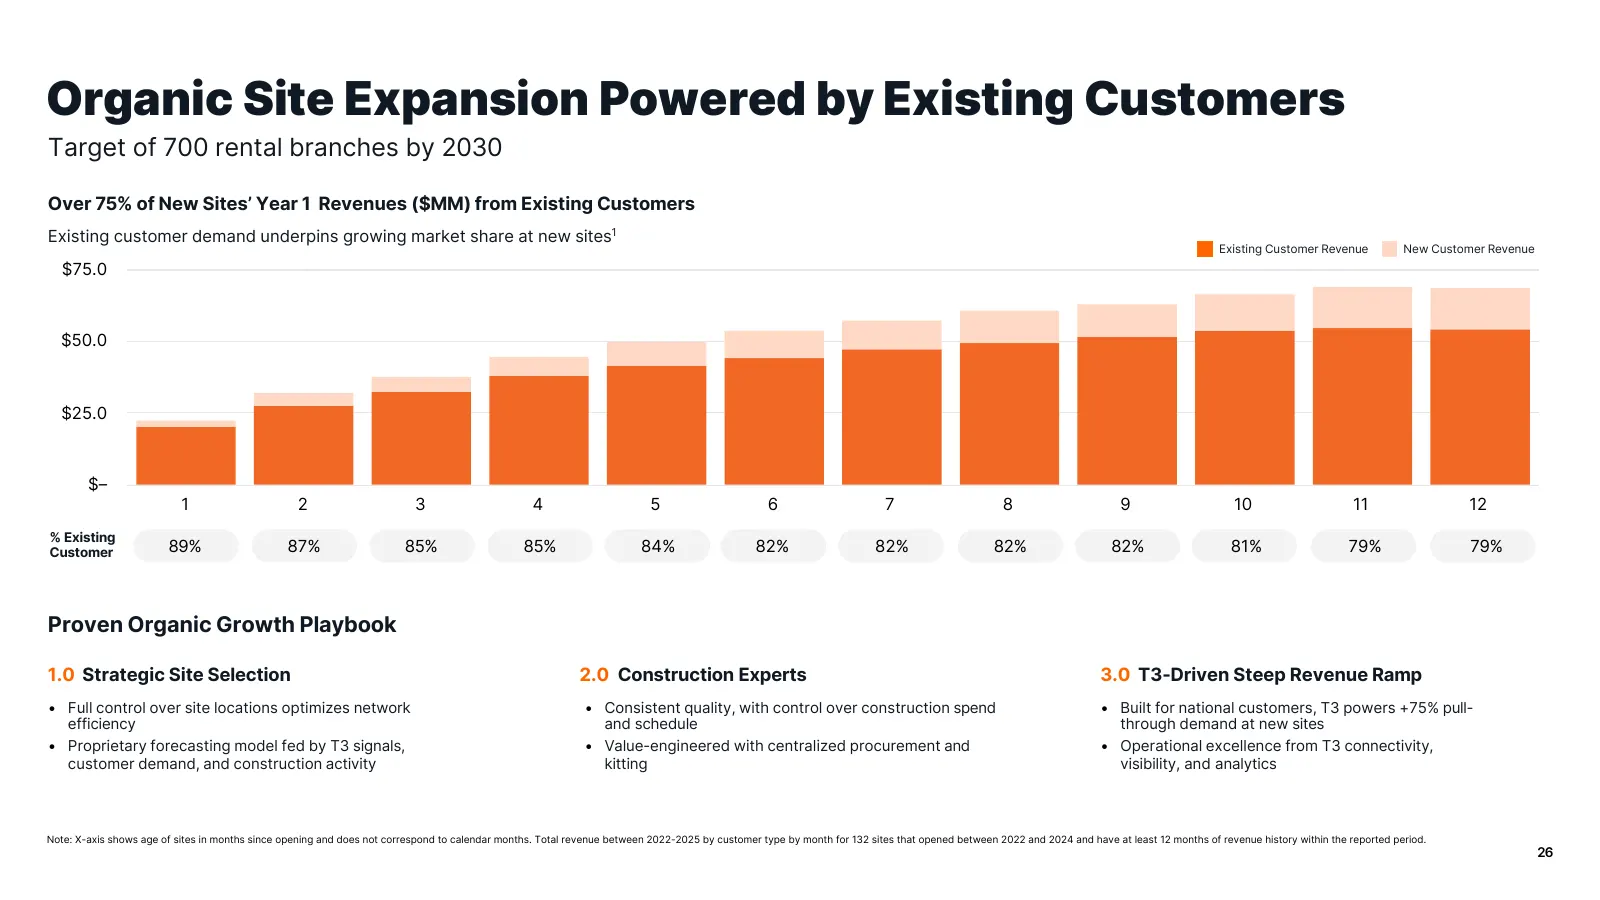
Organic Site Expansion Powered by Existing Customers Target of 700 rental branches by 2030 Over 75% of New Sites’ Year 1 Revenues ($MM) from Existing Customers Existing customer demand underpins growing market share at new sites1 Existing Customer Revenue New Customer Revenue $75.0 $50.0 $25.0 $– 1
Slide 27: On-Site Yards Redefine Efficiency for Complex Mega Projects
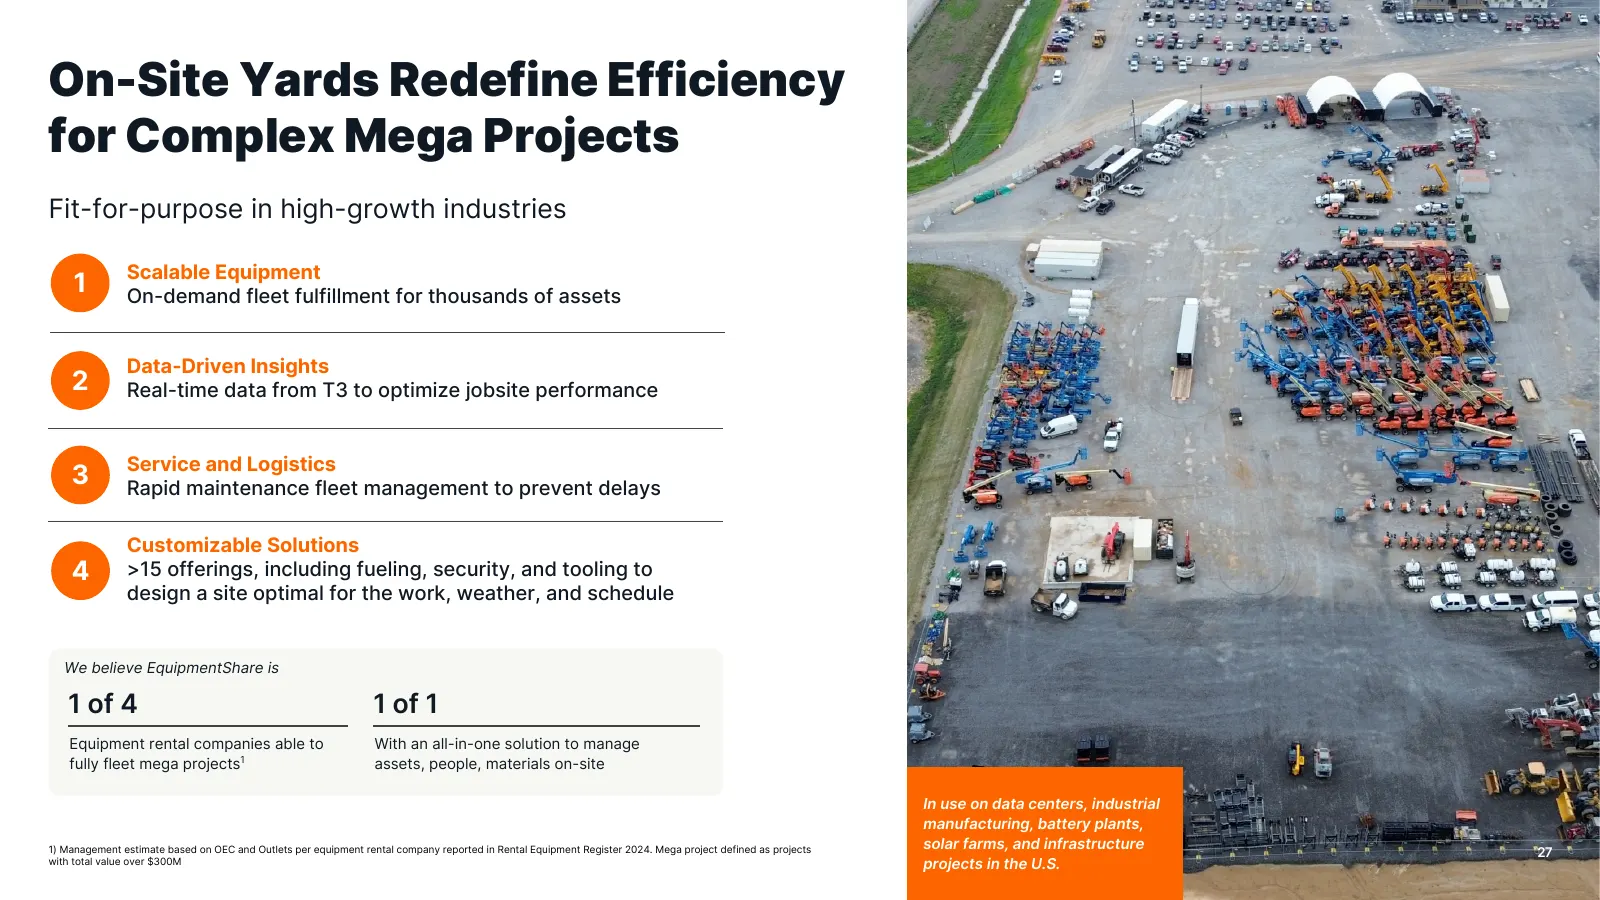
On-Site Yards Redefine Efficiency for Complex Mega Projects Fit-for-purpose in high-growth industries Scalable Equipment 1 On-demand fleet fulfillment for thousands of assets Data-Driven Insights 2 Real-time data from T3 to optimize jobsite performance Service and Logistics 3 Rapid maintenance fleet
Slide 28: Renting to 80% of Active Mega Projects in Serviceable Footprint
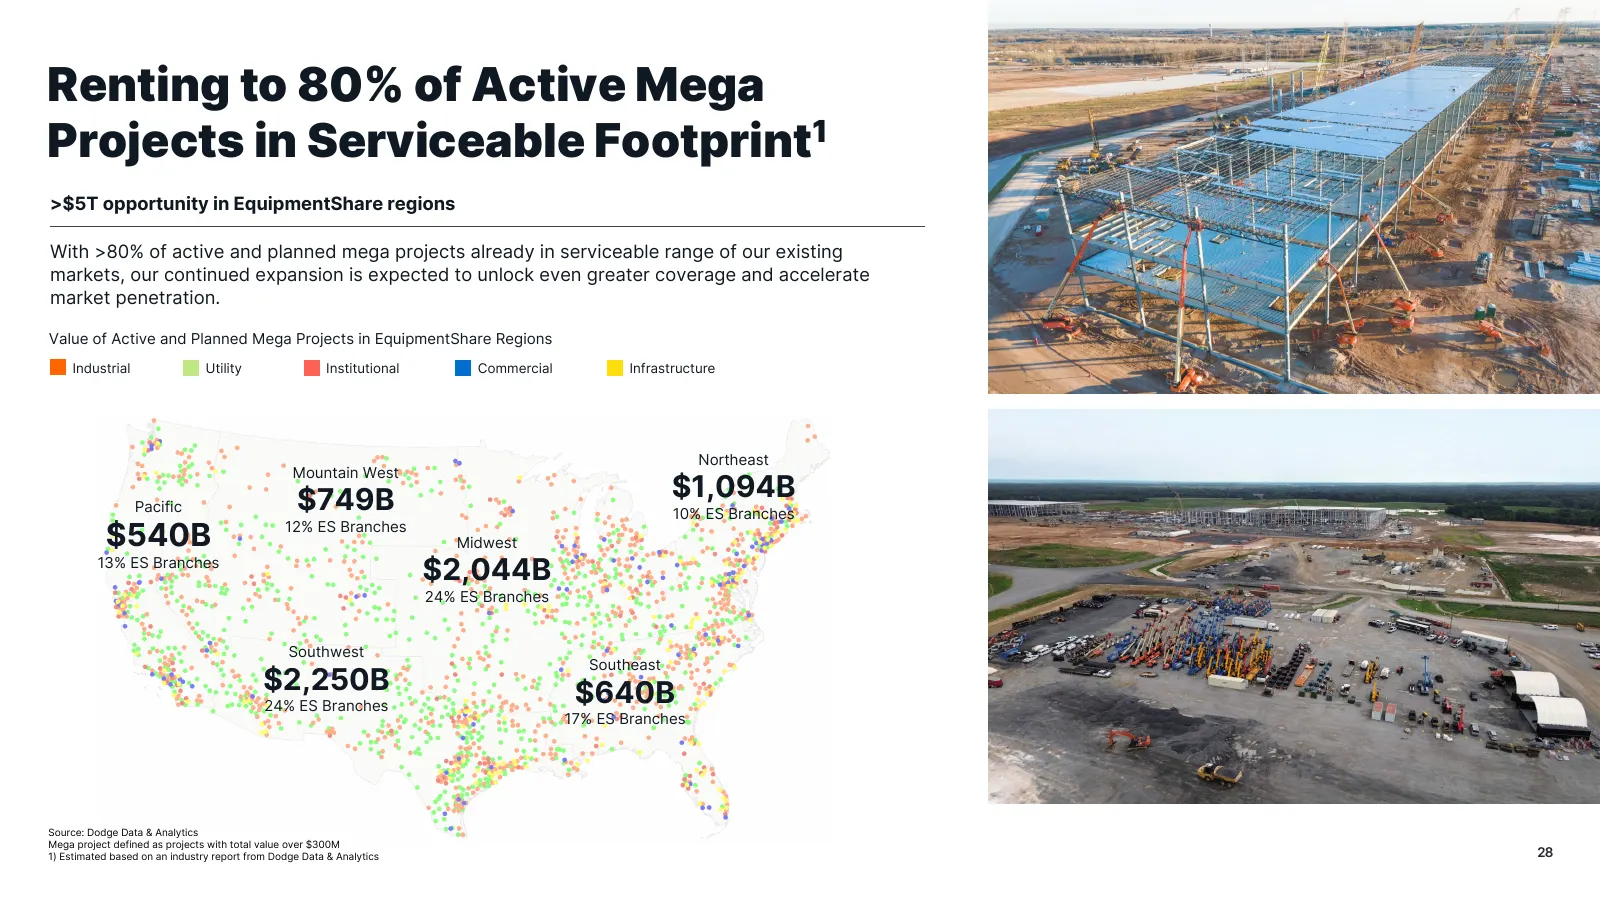
Renting to 80% of Active Mega Projects in Serviceable Footprint1 >$5T opportunity in EquipmentShare regions With >80% of active and planned mega projects already in serviceable range of our existing markets, our continued expansion is expected to unlock even greater coverage and accelerate market pe
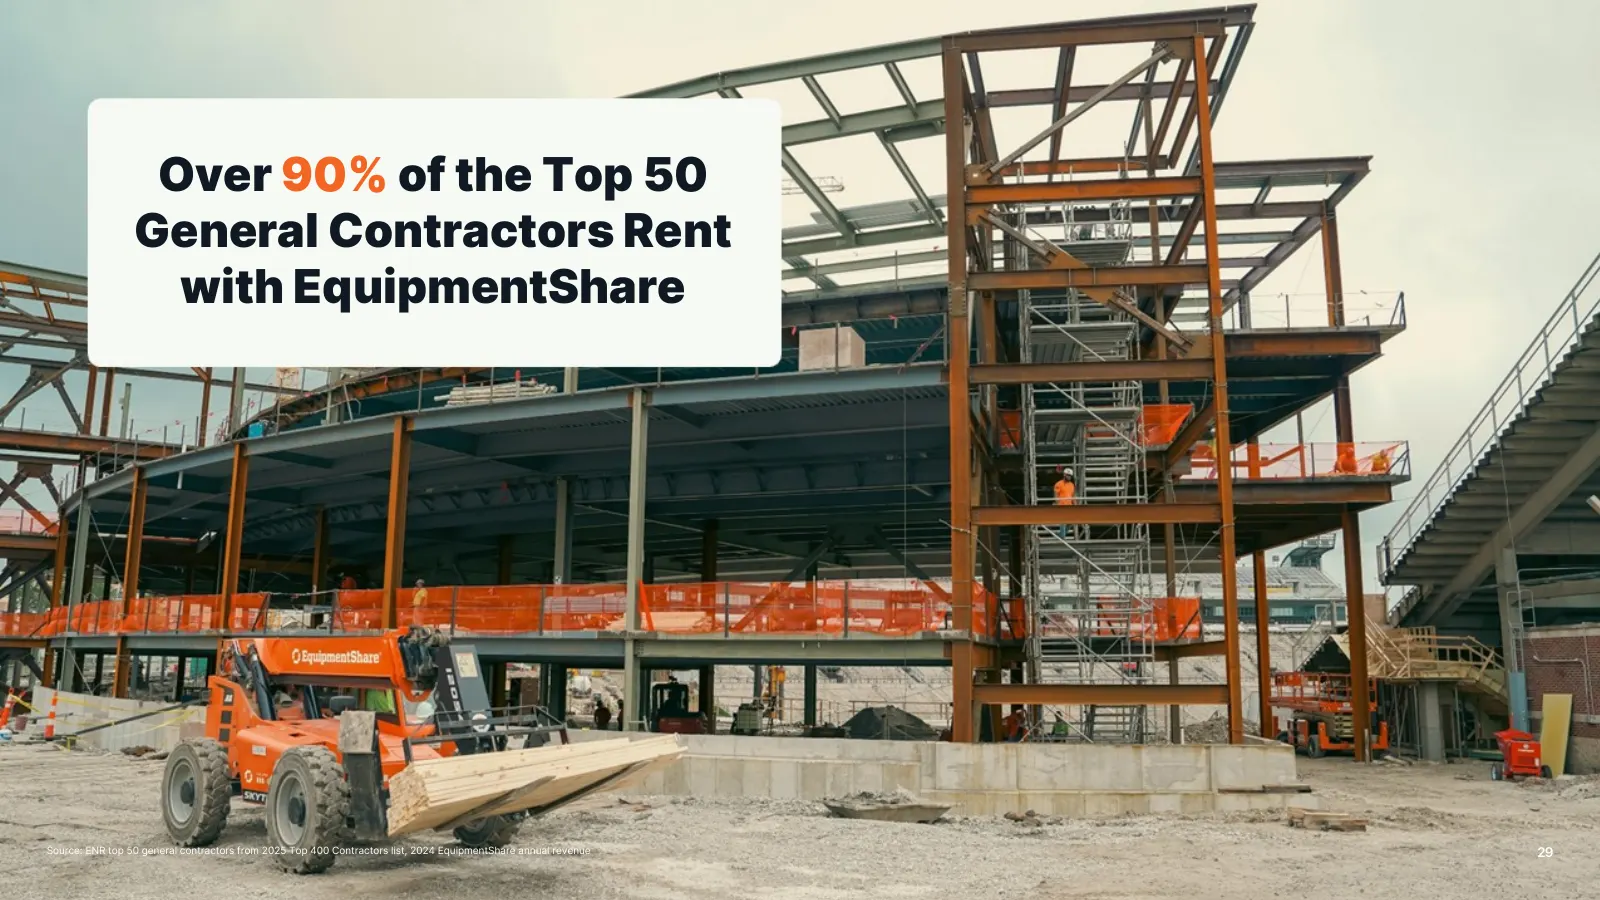
Slide 29: Over 90% of the Top 50 General Contractors Rent with EquipmentShare
Over 90% of the Top 50 General Contractors Rent with EquipmentShare Source: ENR top 50 general contractors from 2025 Top 400 Contractors list, 2024 EquipmentShare annual revenue 29
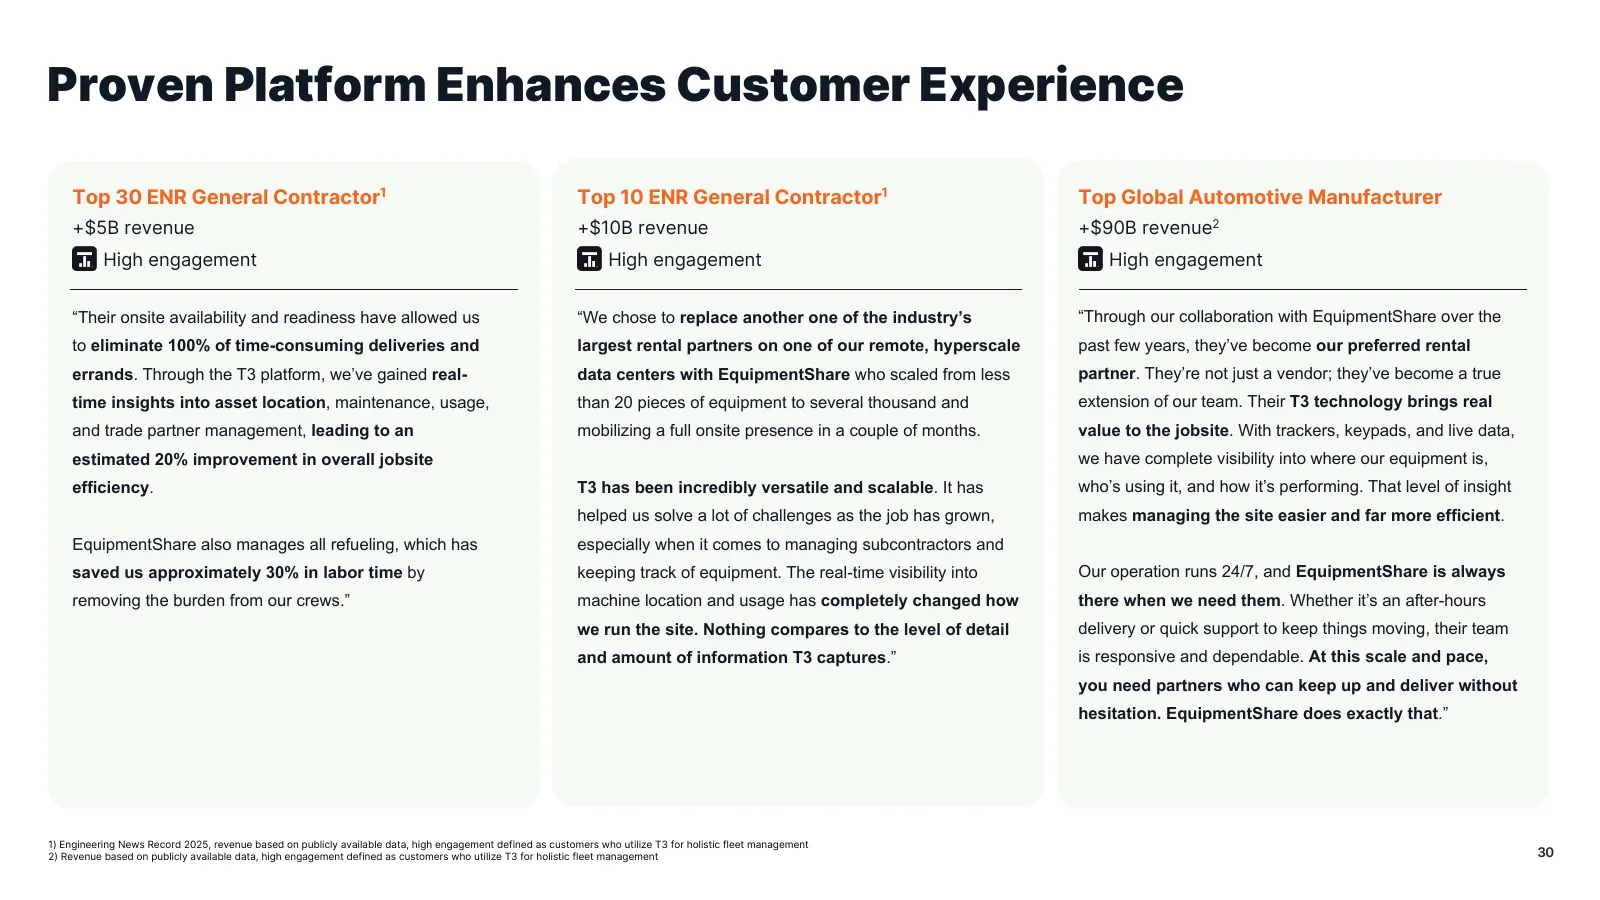
Slide 30: Proven Platform Enhances Customer Experience
Proven Platform Enhances Customer Experience Top 30 ENR General Contractor1 Top 10 ENR General Contractor1 Top Global Automotive Manufacturer +$5B revenue +$10B revenue +$90B revenue2 High engagement High engagement High engagement “Their onsite availability and readiness have allowed us “We chose t
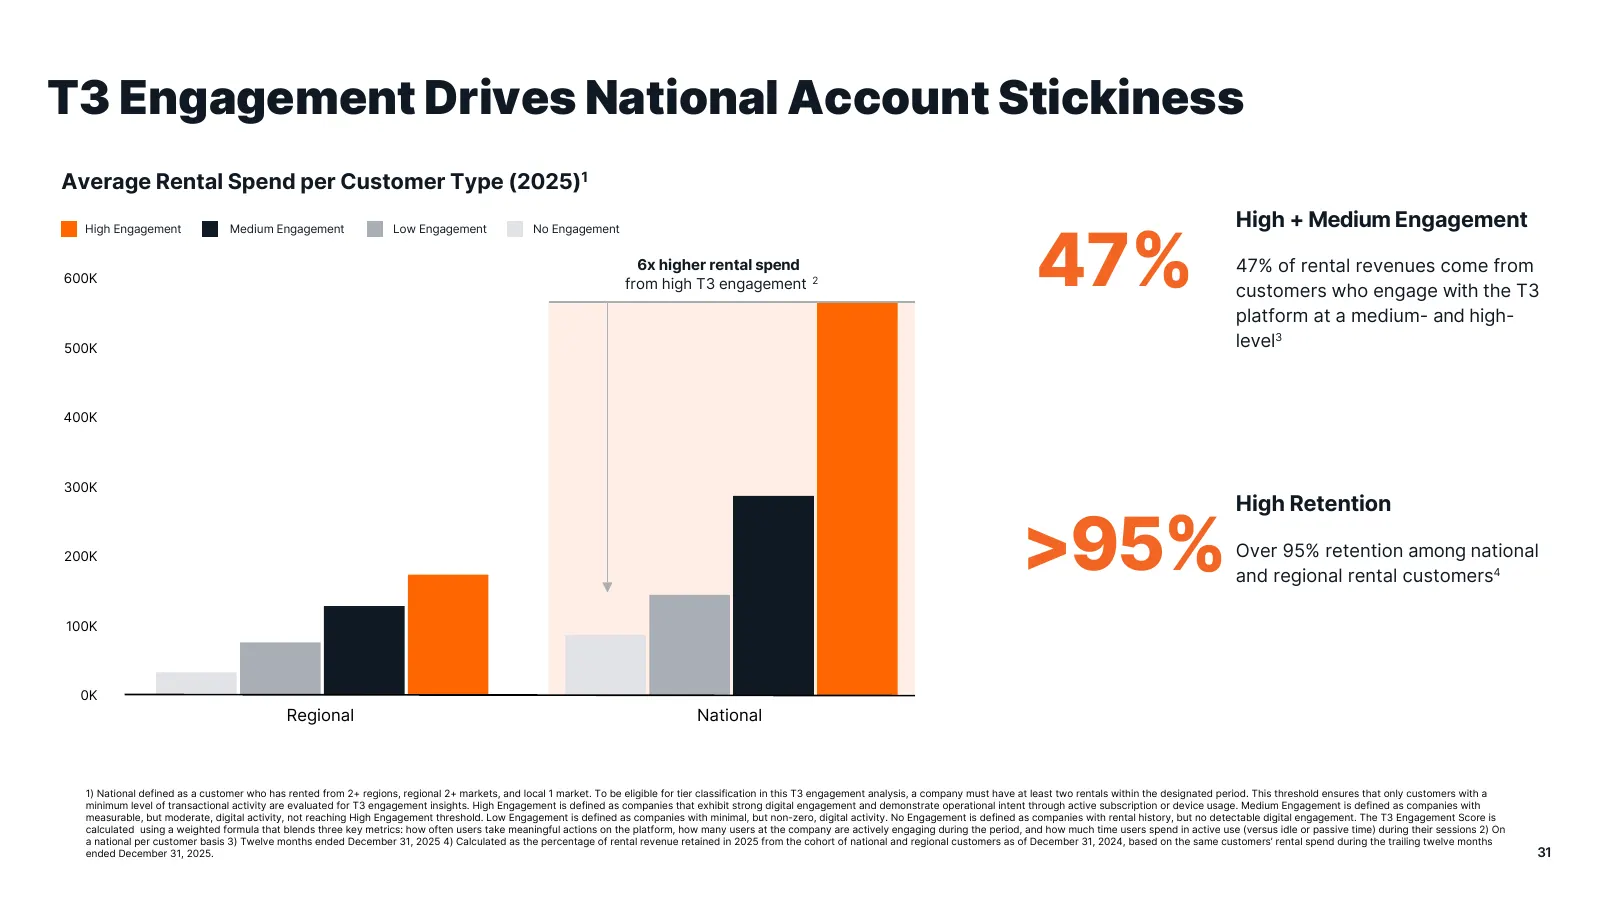
Slide 31: T3 Engagement Drives National Account Stickiness
T3 Engagement Drives National Account Stickiness Average Rental Spend per Customer Type (2025)1 High + Medium Engagement 47% High Engagement Medium Engagement Low Engagement No Engagement 6x higher rental spend 47% of rental revenues come from 600K from high T3 engagement 2 customers who engage with
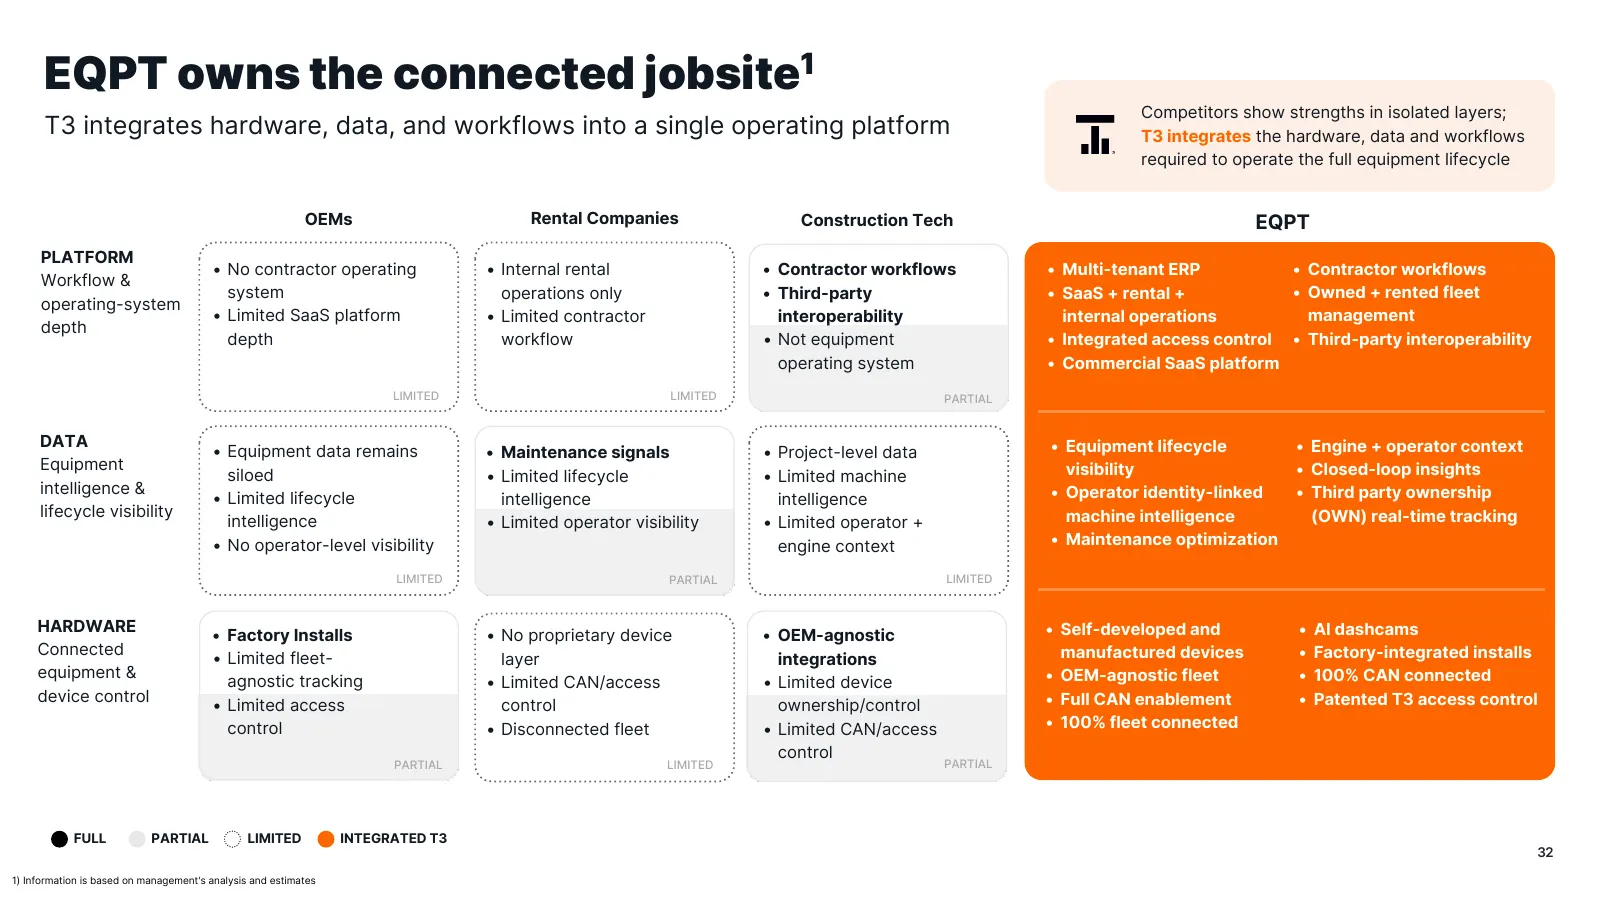
Slide 32: EQPT owns the connected jobsite
EQPT owns the connected jobsite1 Competitors show strengths in isolated layers; T3 integrates hardware, data, and workflows into a single operating platform T3 integrates the hardware, data and workflows required to operate the full equipment lifecycle OEMs Rental Companies Construction Tech EQPT PL
Slide 33: T3 Platform is a Differentiator
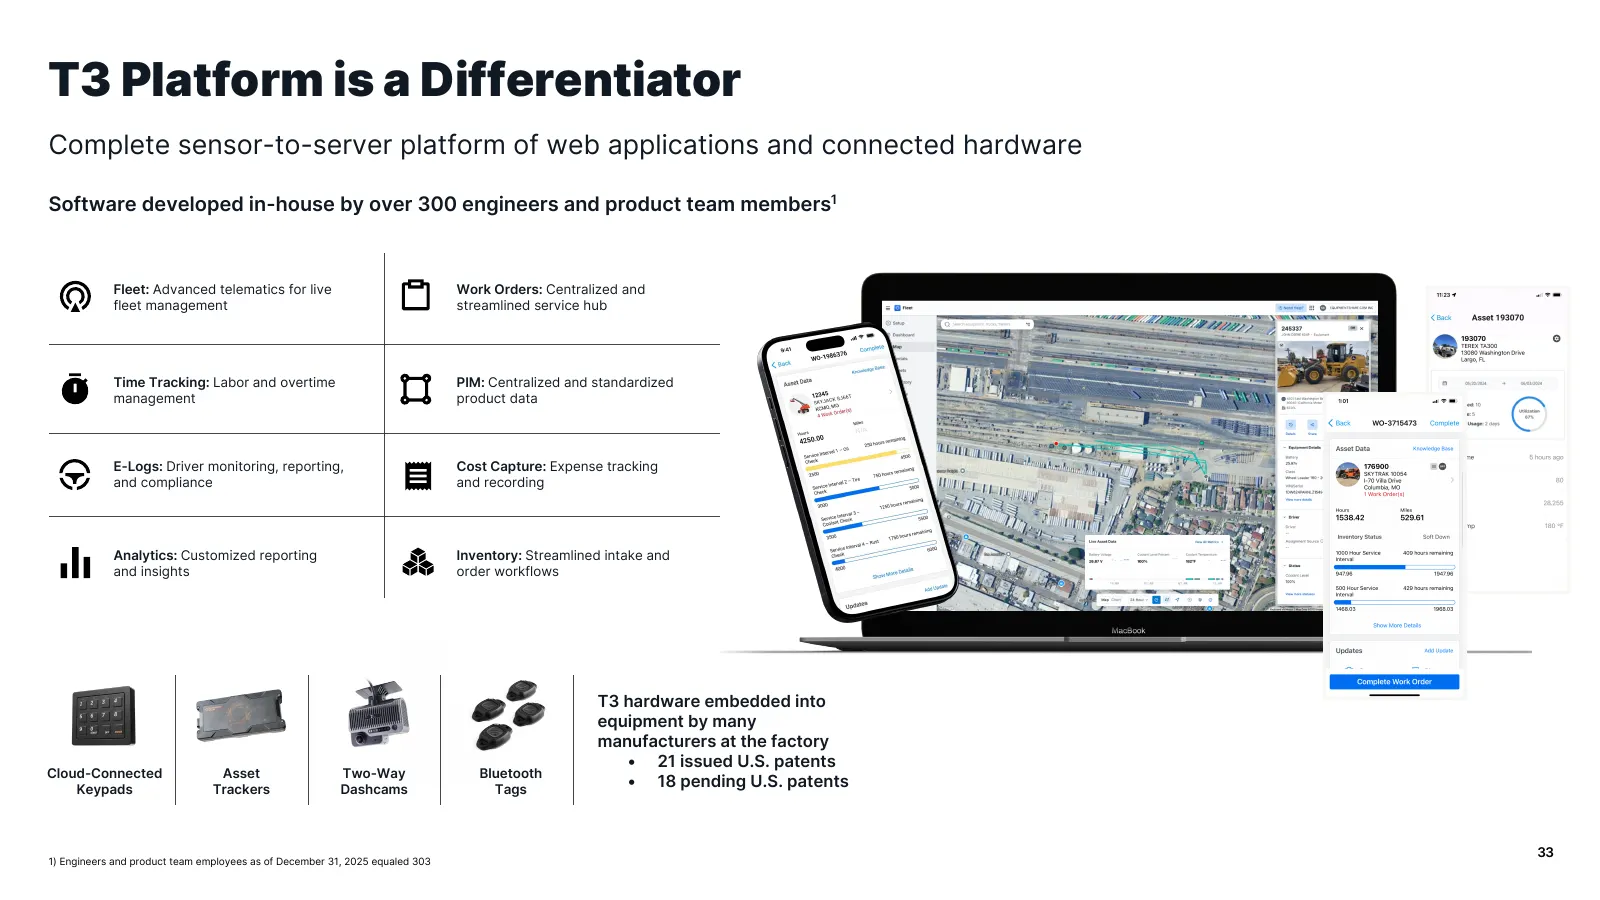
T3 Platform is a Differentiator Complete sensor-to-server platform of web applications and connected hardware Software developed in-house by over 300 engineers and product team members1 Fleet: Advanced telematics for live Work Orders: Centralized and fleet management streamlined service hub Time Tra
Slide 34: One Asset, Millions of Data Points
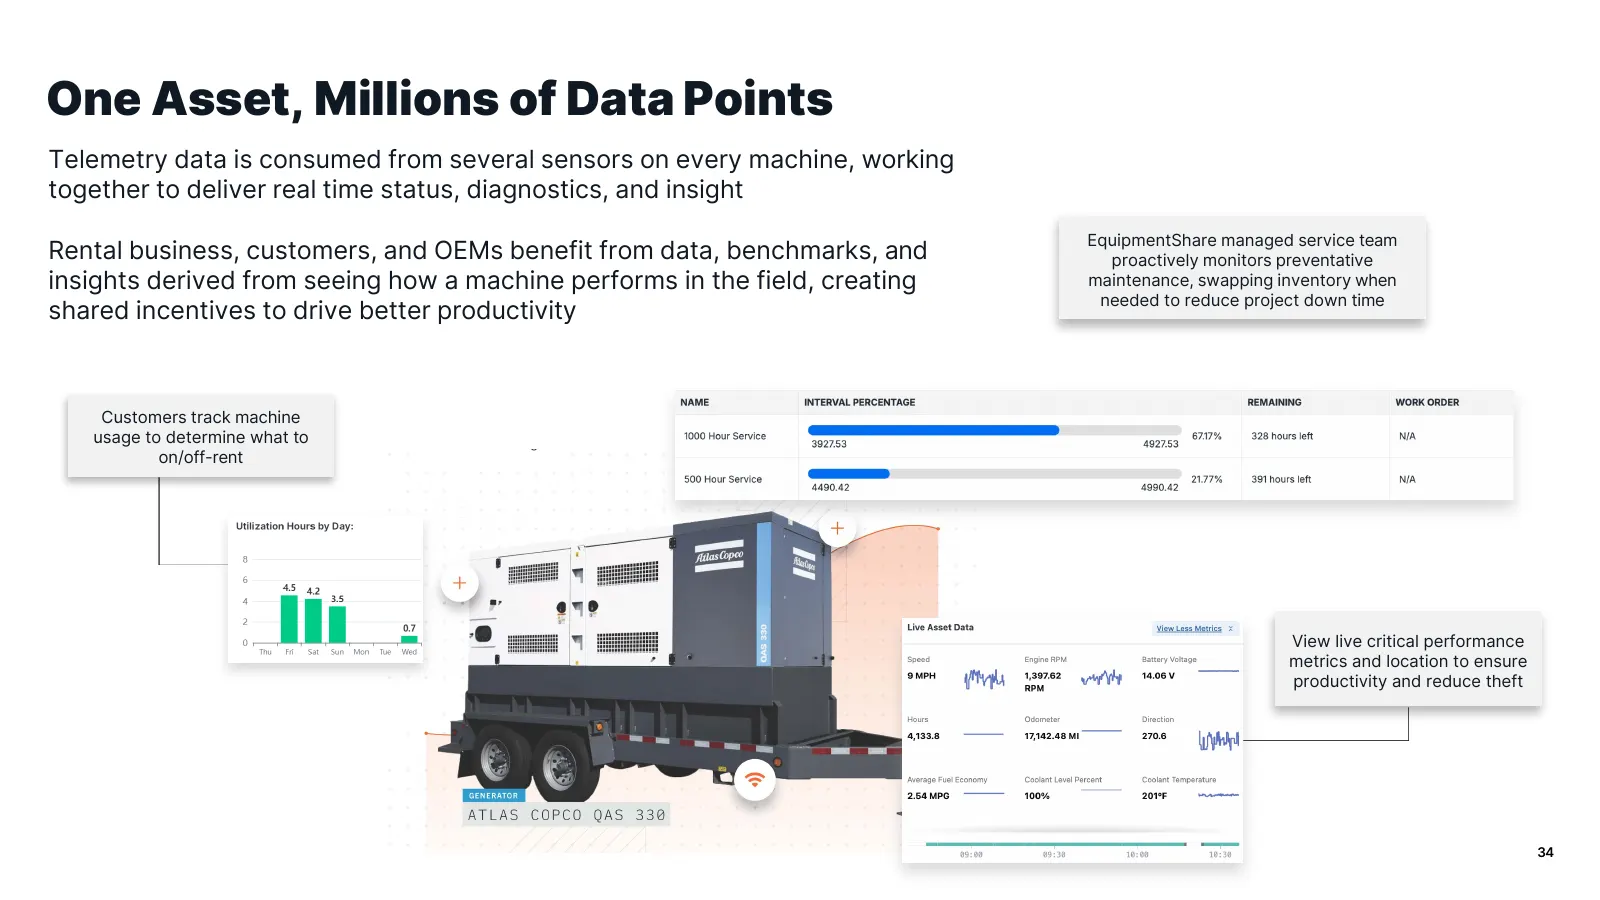
One Asset, Millions of Data Points Telemetry data is consumed from several sensors on every machine, working together to deliver real time status, diagnostics, and insight EquipmentShare managed service team Rental business, customers, and OEMs benefit from data, benchmarks, and proactively monitors
Slide 35: T3 is a Win-Win for EquipmentShare and Customers
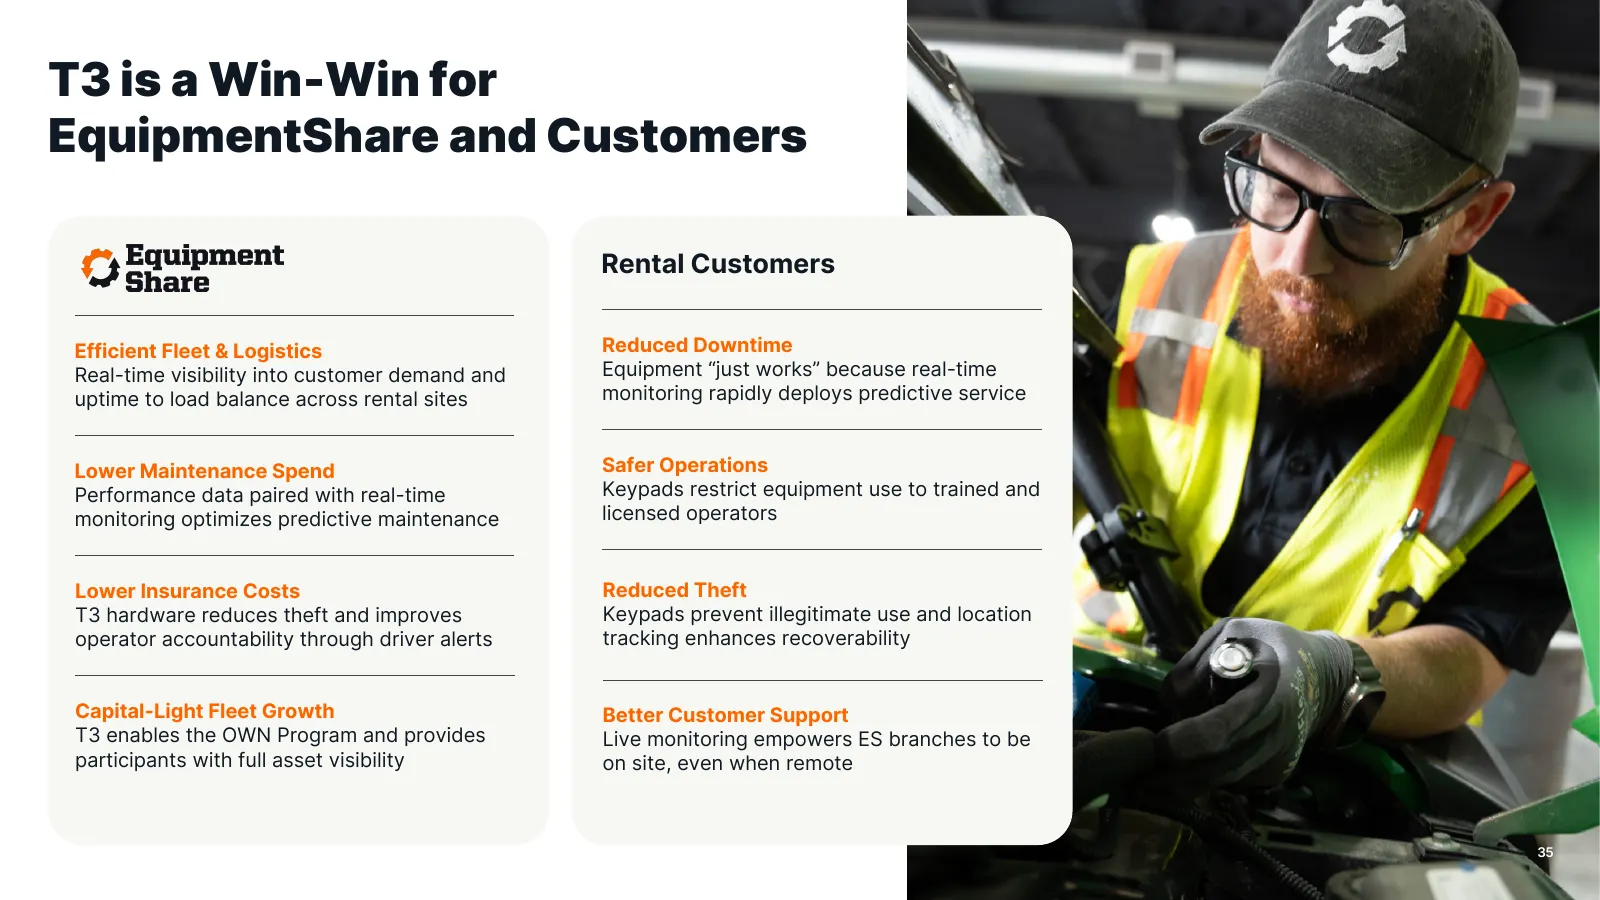
T3 is a Win-Win for EquipmentShare and Customers Rental Customers Efficient Fleet & Logistics Reduced Downtime Real-time visibility into customer demand and Equipment “just works” because real-time uptime to load balance across rental sites monitoring rapidly deploys predictive service Lower Mainten
Slide 36: EquipmentShare T3 Differentiation in Action
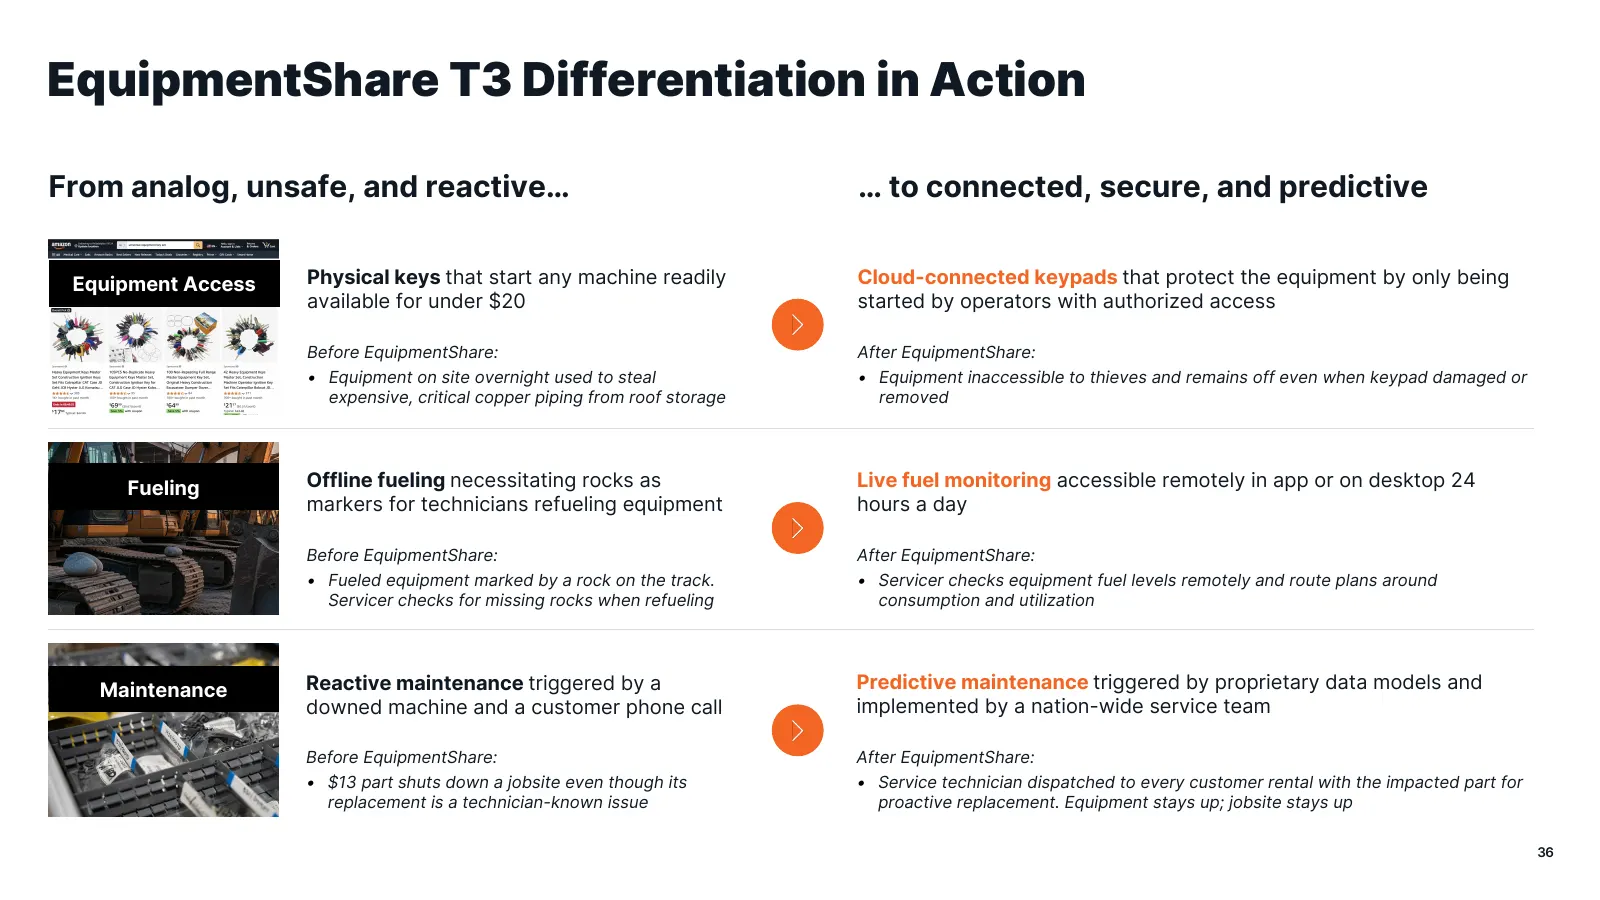
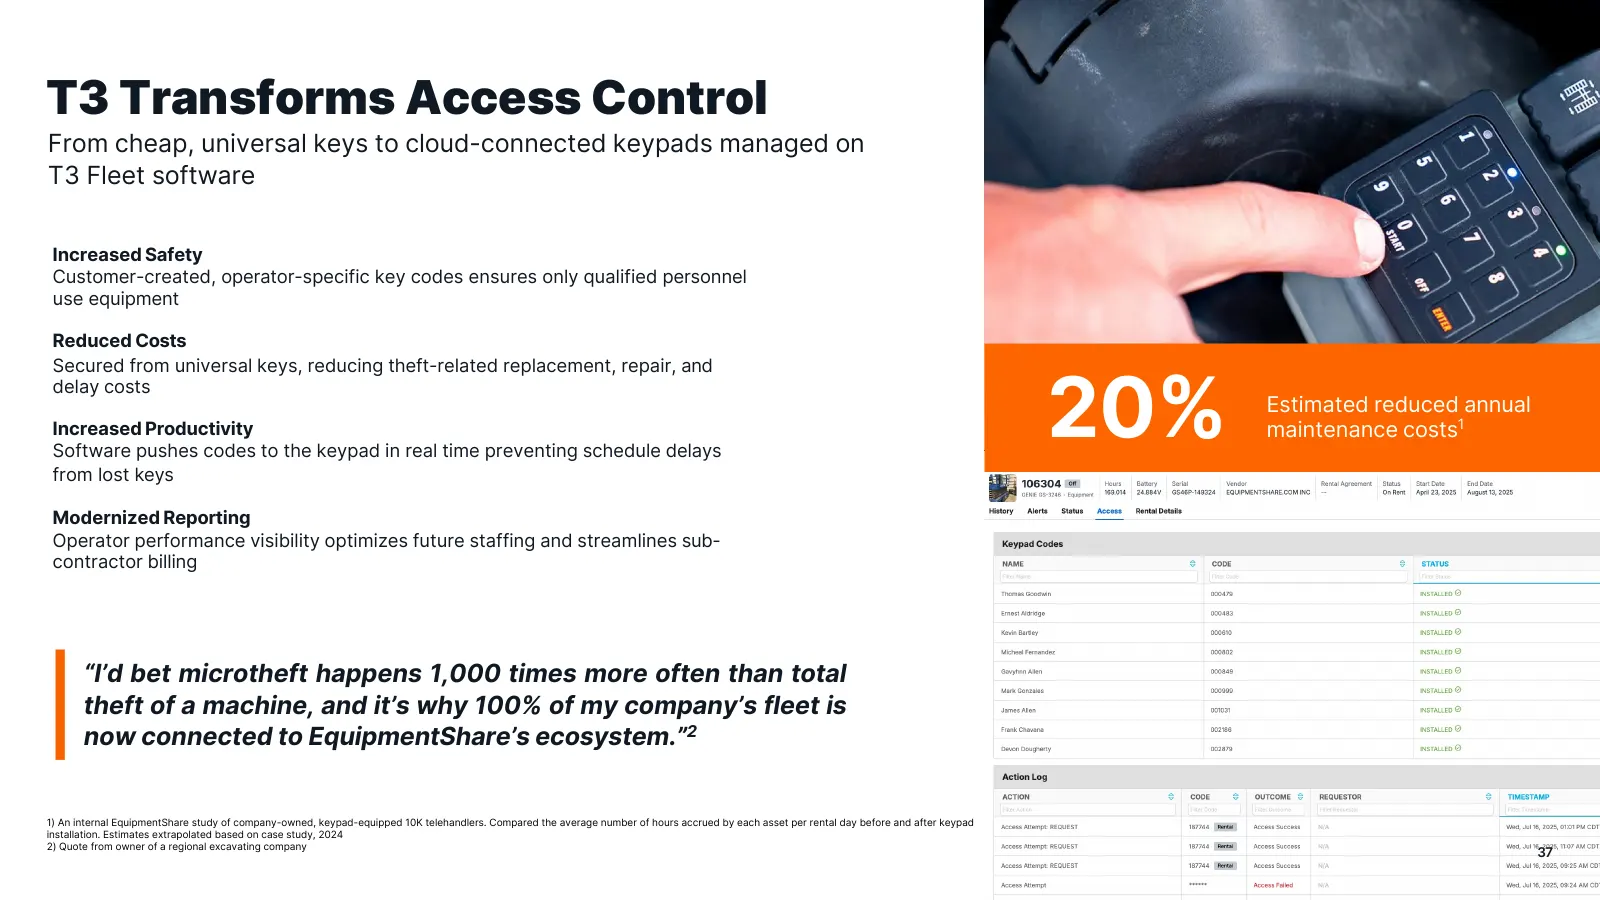
EquipmentShare T3 Differentiation in Action From analog, unsafe, and reactive… … to connected, secure, and predictive Equipment Access Physical keys that start any machine readily Cloud-connected keypads that protect the equipment by only being available for under $20 started by operators with autho
Slide 37: T3 Transforms Access Control
T3 Transforms Access Control From cheap, universal keys to cloud-connected keypads managed on T3 Fleet software Increased Safety Customer-created, operator-specific key codes ensures only qualified personnel use equipment Reduced Costs Secured from universal keys, reducing theft-related replacement,
Slide 38: Singularly Positioned to Leverage AI at Scale
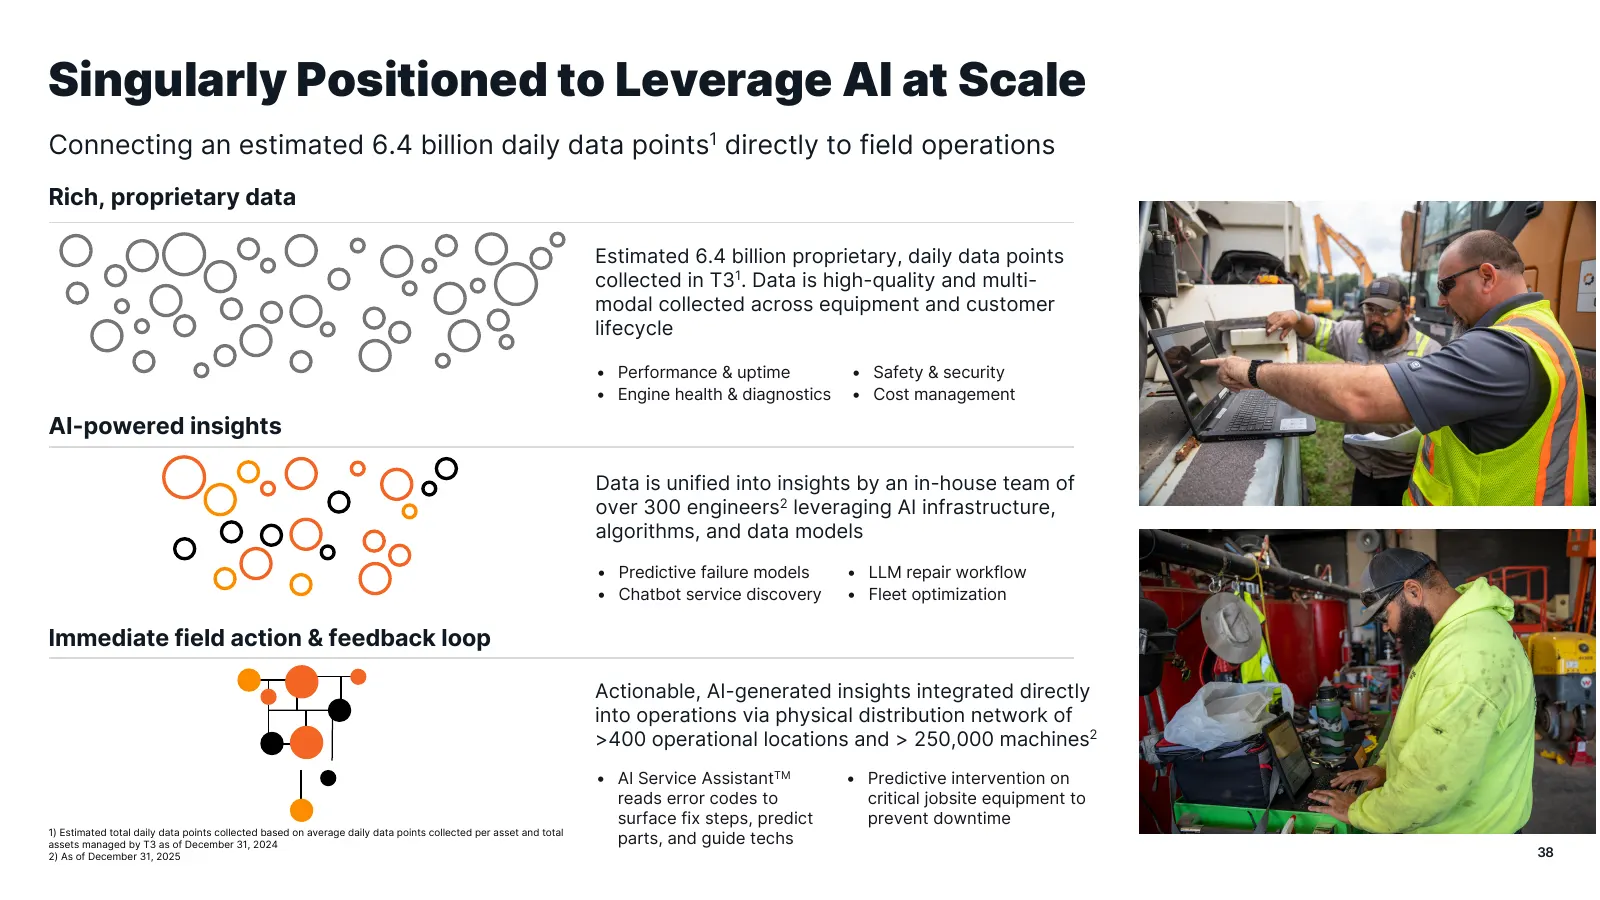
Singularly Positioned to Leverage AI at Scale Connecting an estimated 6.4 billion daily data points1 directly to field operations Rich, proprietary data Estimated 6.4 billion proprietary, daily data points collected in T31. Data is high-quality and multi- modal collected across equipment and custome
Slide 39: T3-Powered Flywheel Drives Growth Strategy
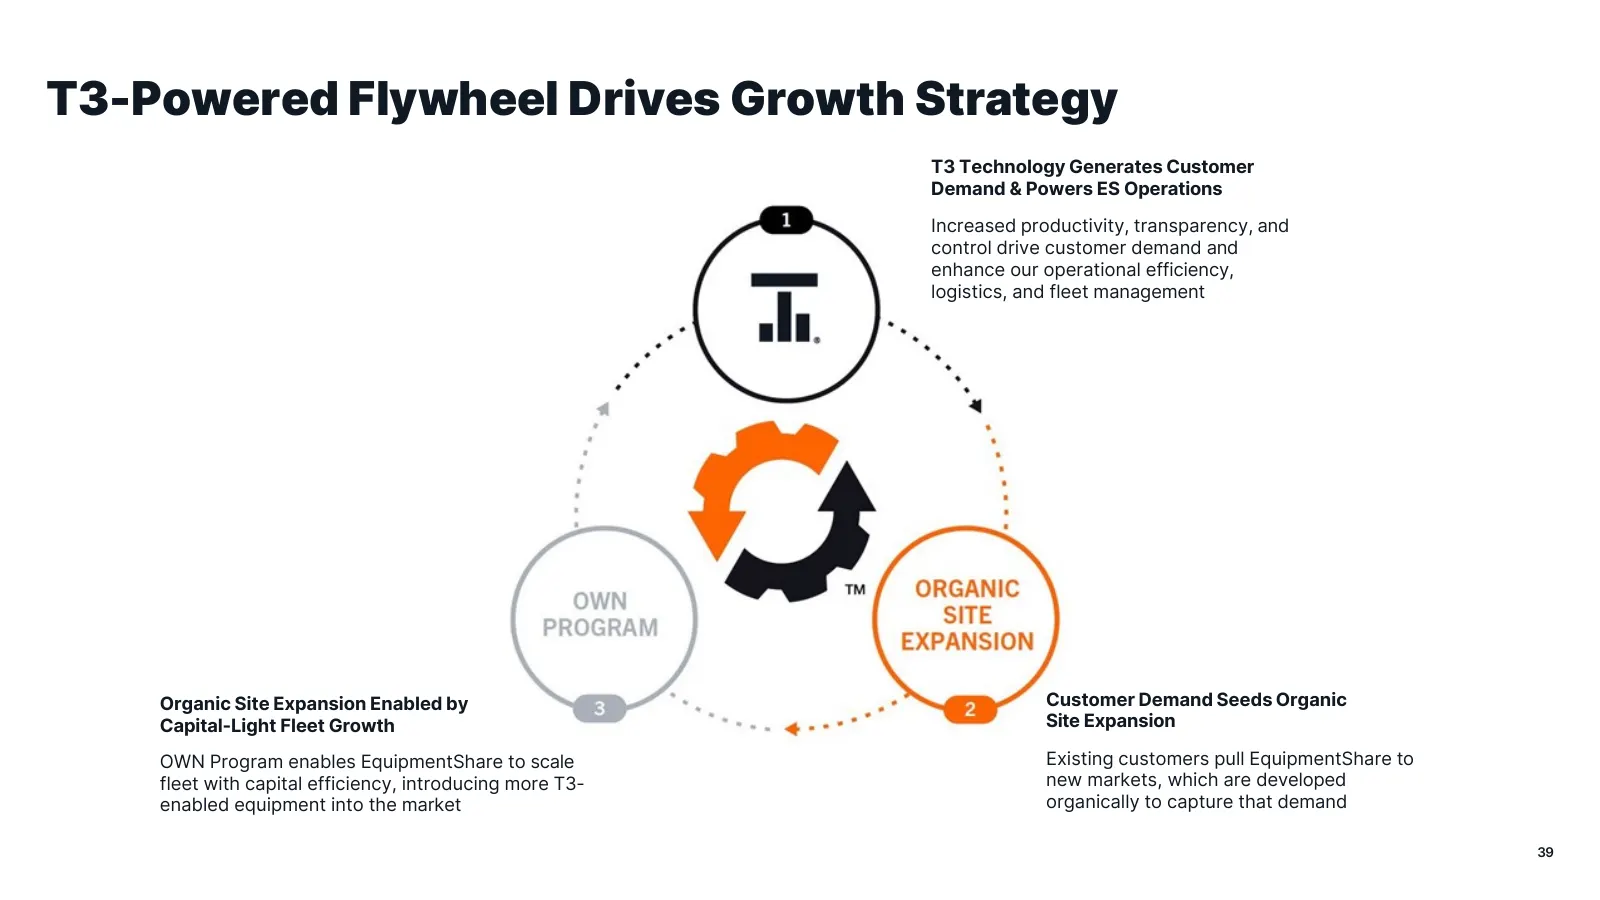
T3-Powered Flywheel Drives Growth Strategy T3 Technology Generates Customer Demand & Powers ES Operations Increased productivity, transparency, and control drive customer demand and enhance our operational efficiency, logistics, and fleet management Organic Site Expansion Enabled by Customer Demand
Slide 40: OWN Program Lifecycle
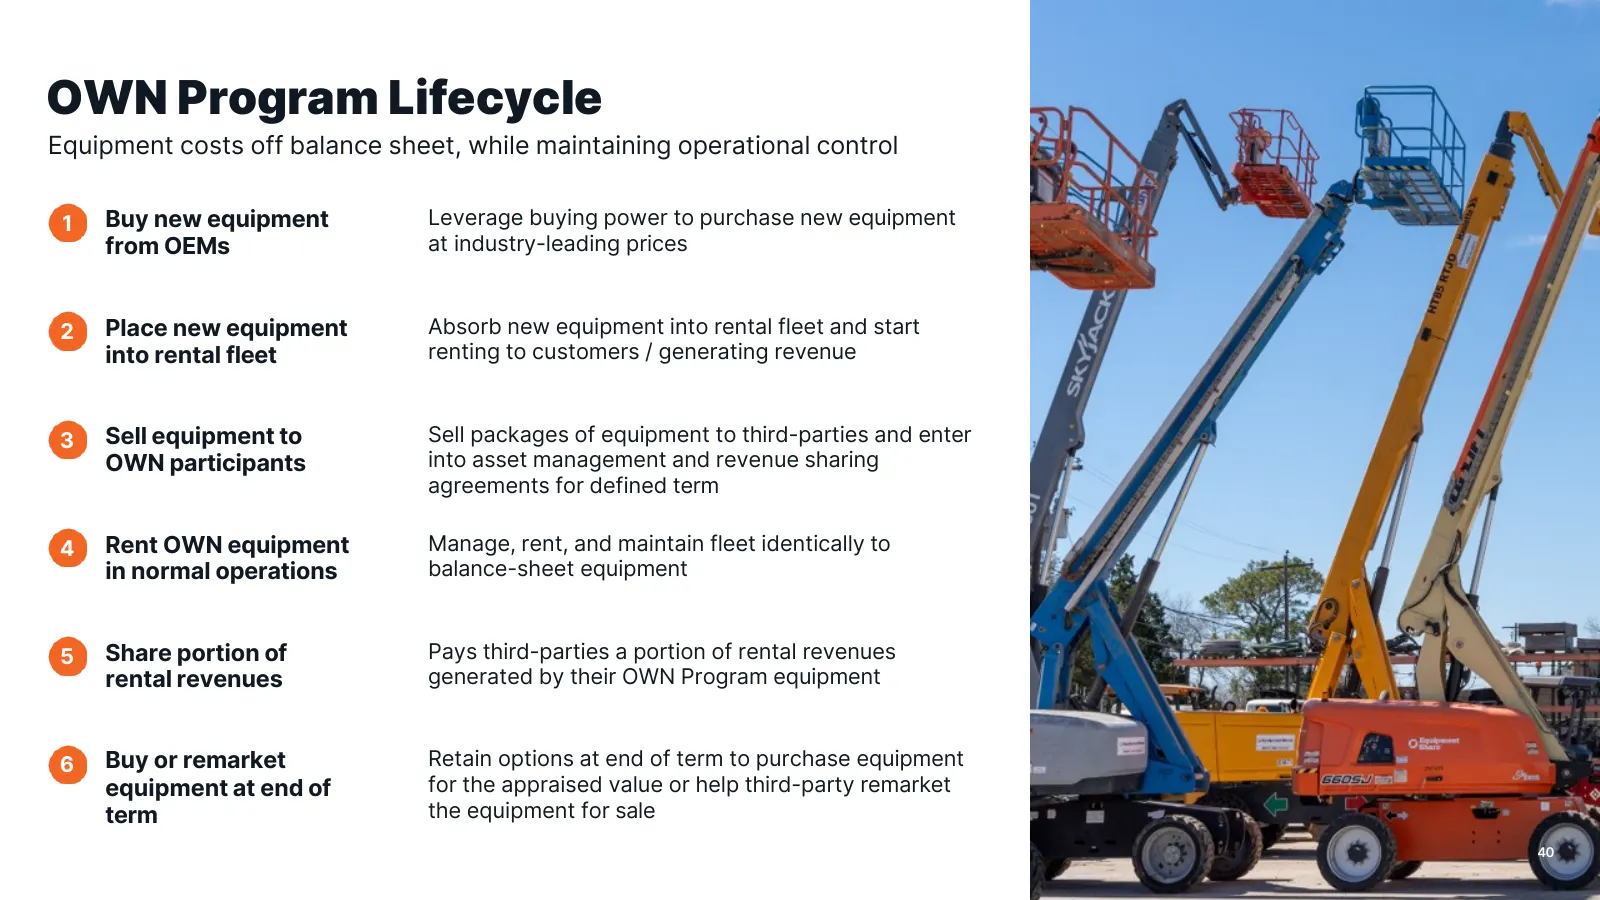
OWN Program Lifecycle Equipment costs off balance sheet, while maintaining operational control 1 Buy new equipment Leverage buying power to purchase new equipment from OEMs at industry-leading prices 2 Place new equipment Absorb new equipment into rental fleet and start into rental fleet renting to
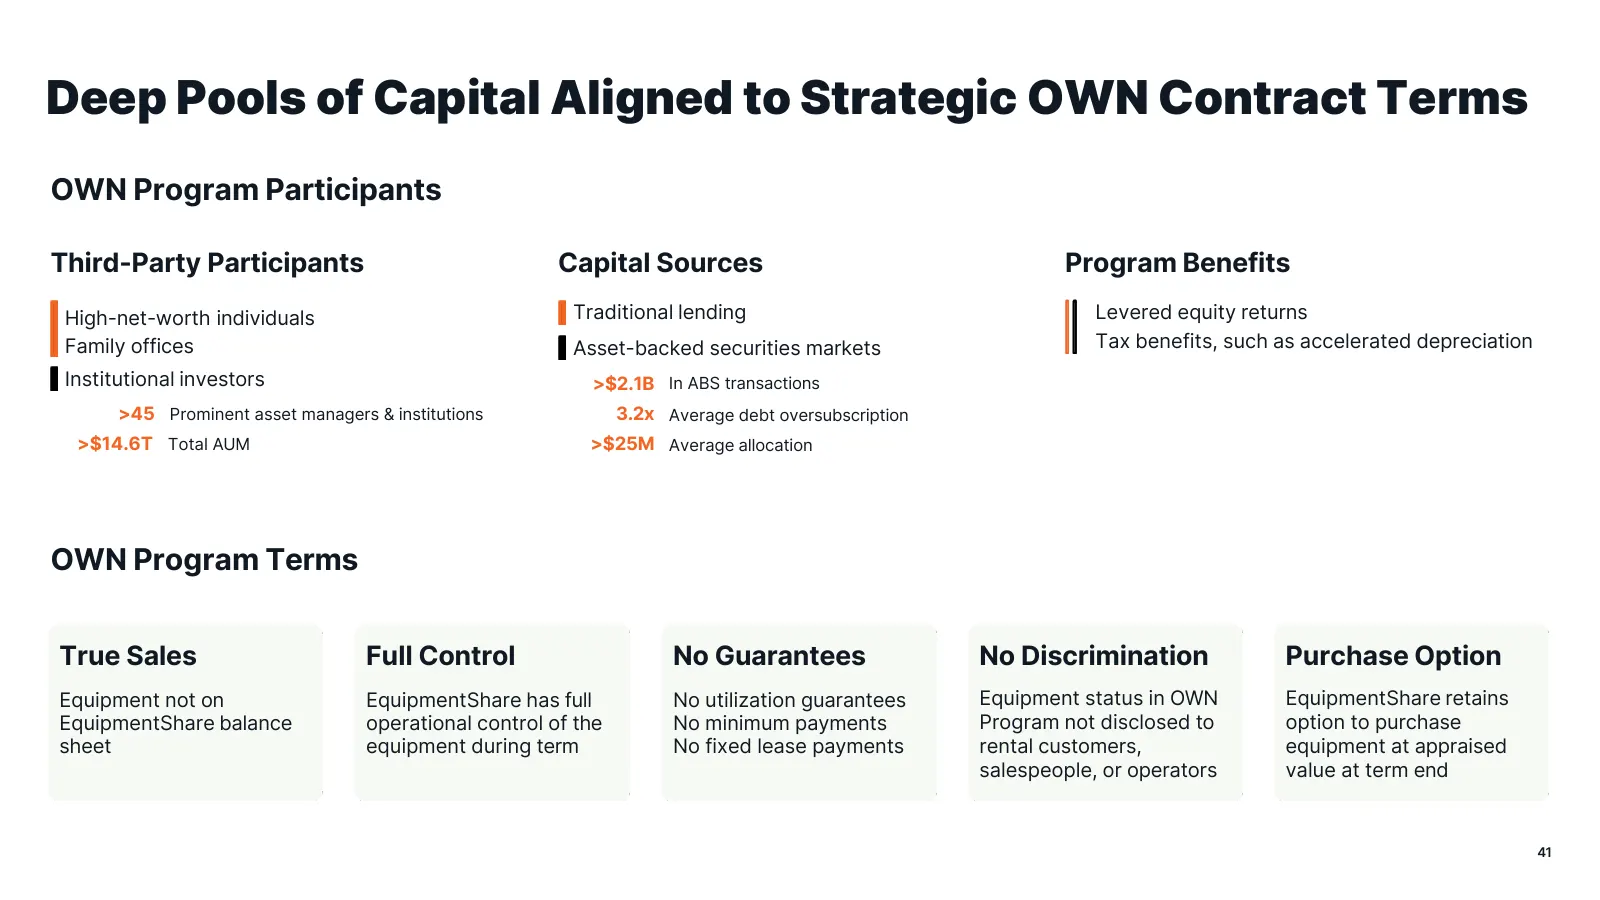
Slide 41: Deep Pools of Capital Aligned to Strategic OWN Contract Terms
Deep Pools of Capital Aligned to Strategic OWN Contract Terms OWN Program Participants Third-Party Participants Capital Sources Program Benefits High-net-worth individuals Traditional lending Levered equity returns Family offices Asset-backed securities markets Tax benefits, such as accelerated depr
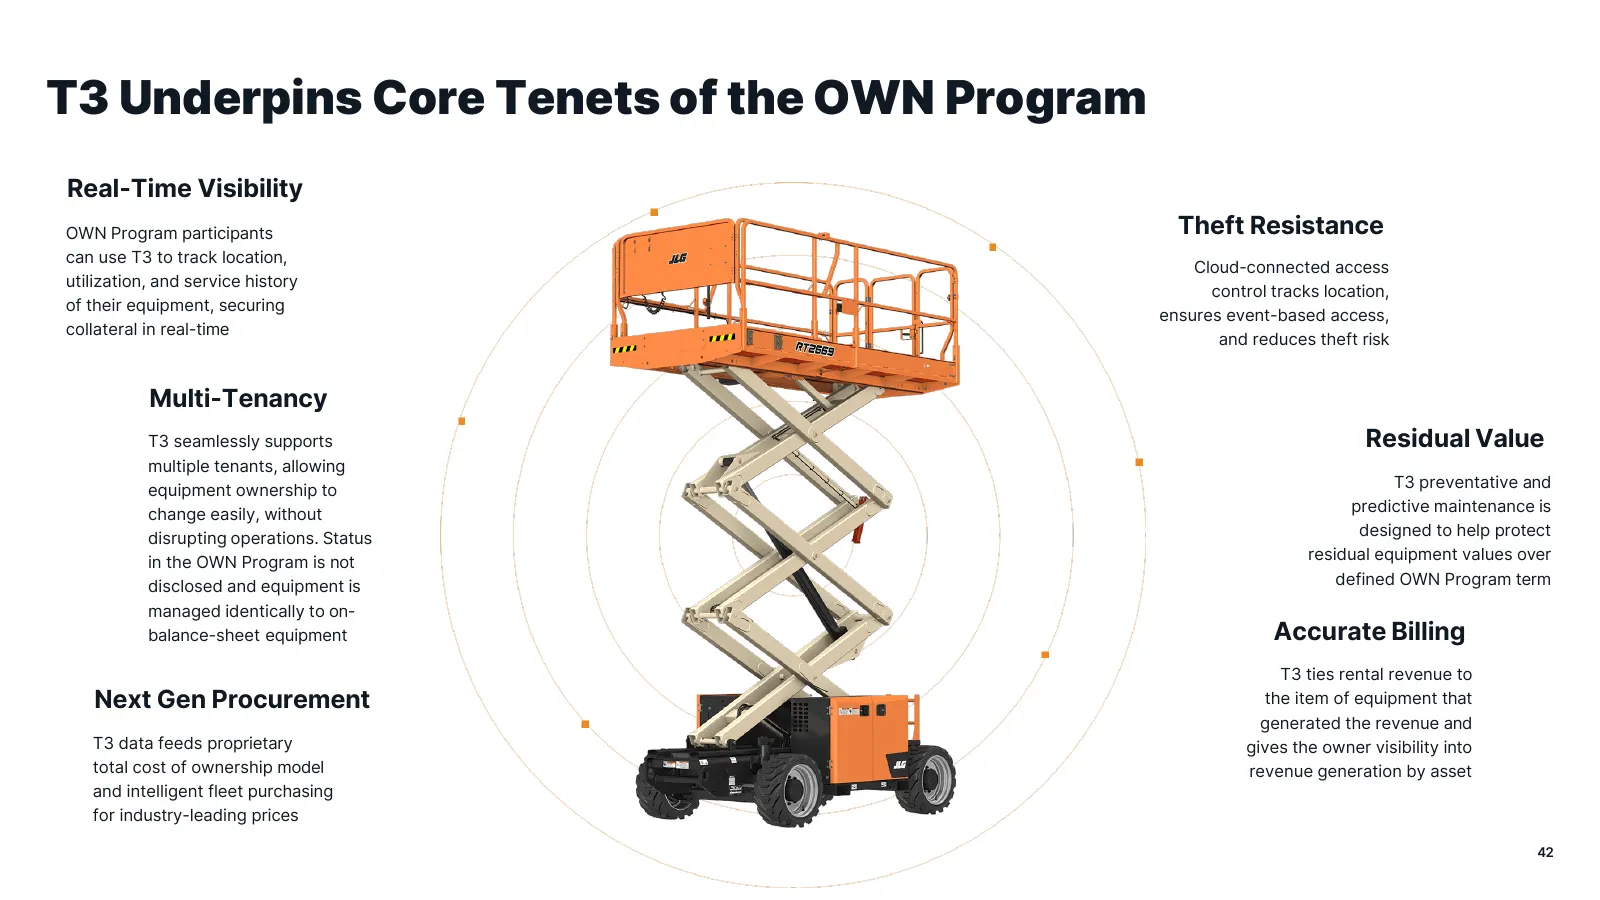
Slide 42: T3 Underpins Core Tenets of the OWN Program
T3 Underpins Core Tenets of the OWN Program Real-Time Visibility OWN Program participants Theft Resistance can use T3 to track location, Cloud-connected access utilization, and service history control tracks location, of their equipment, securing ensures event-based access, collateral in real-time a
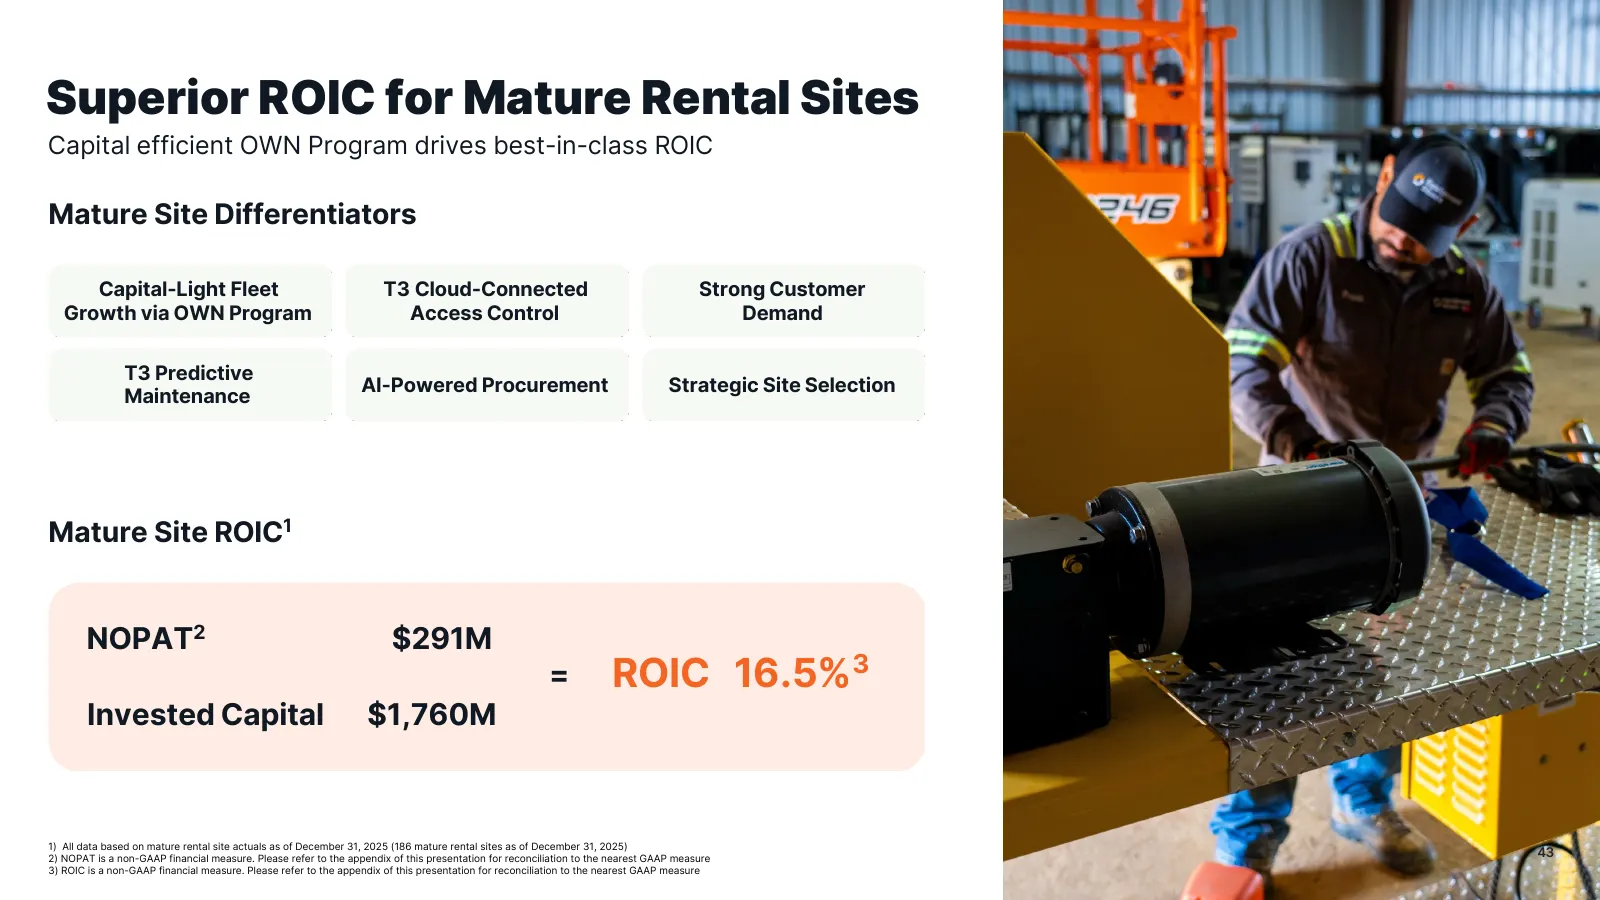
Slide 43: Superior ROIC for Mature Rental Sites
Superior ROIC for Mature Rental Sites Capital efficient OWN Program drives best-in-class ROIC Mature Site Differentiators Capital-Light Fleet T3 Cloud-Connected Strong Customer Growth via OWN Program Access Control Demand T3 Predictive AI-Powered Procurement Strategic Site Selection Maintenance Matu
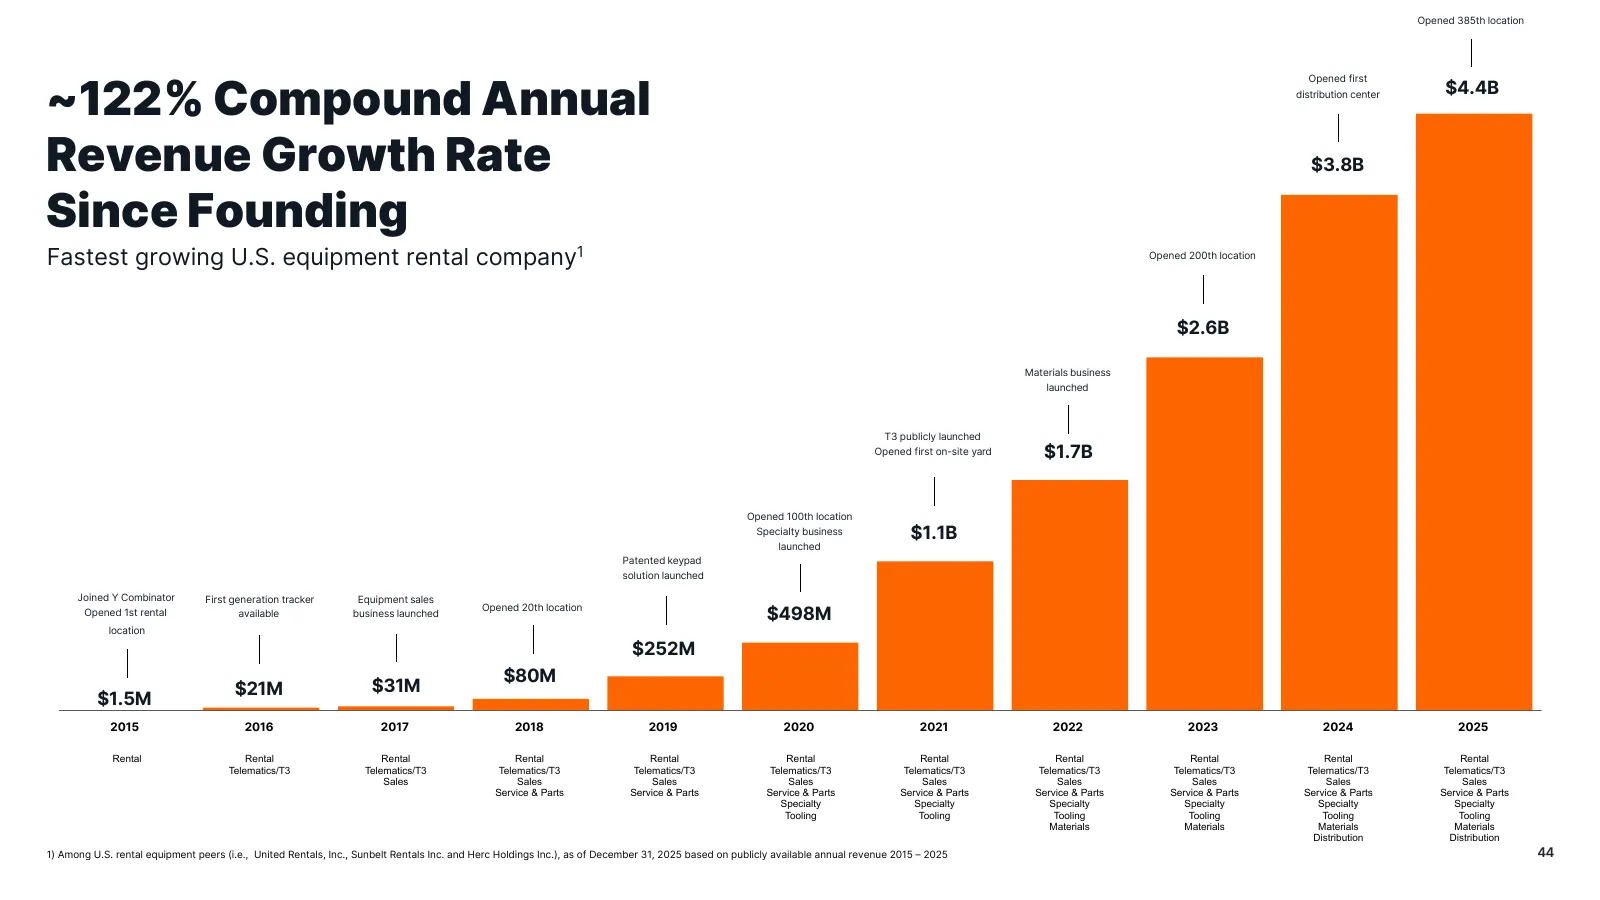
Slide 44: ~122% Compound Annual Revenue Growth Rate Since Founding
Opened 385th location ~122% Compound Annual Opened first distribution center $4.4B Revenue Growth Rate $3.8B Since Founding Fastest growing U.S. equipment rental company1 Opened 200th location $2.6B Materials business launched T3 publicly launched Opened first on-site yard $1.7B Opened 100th locatio
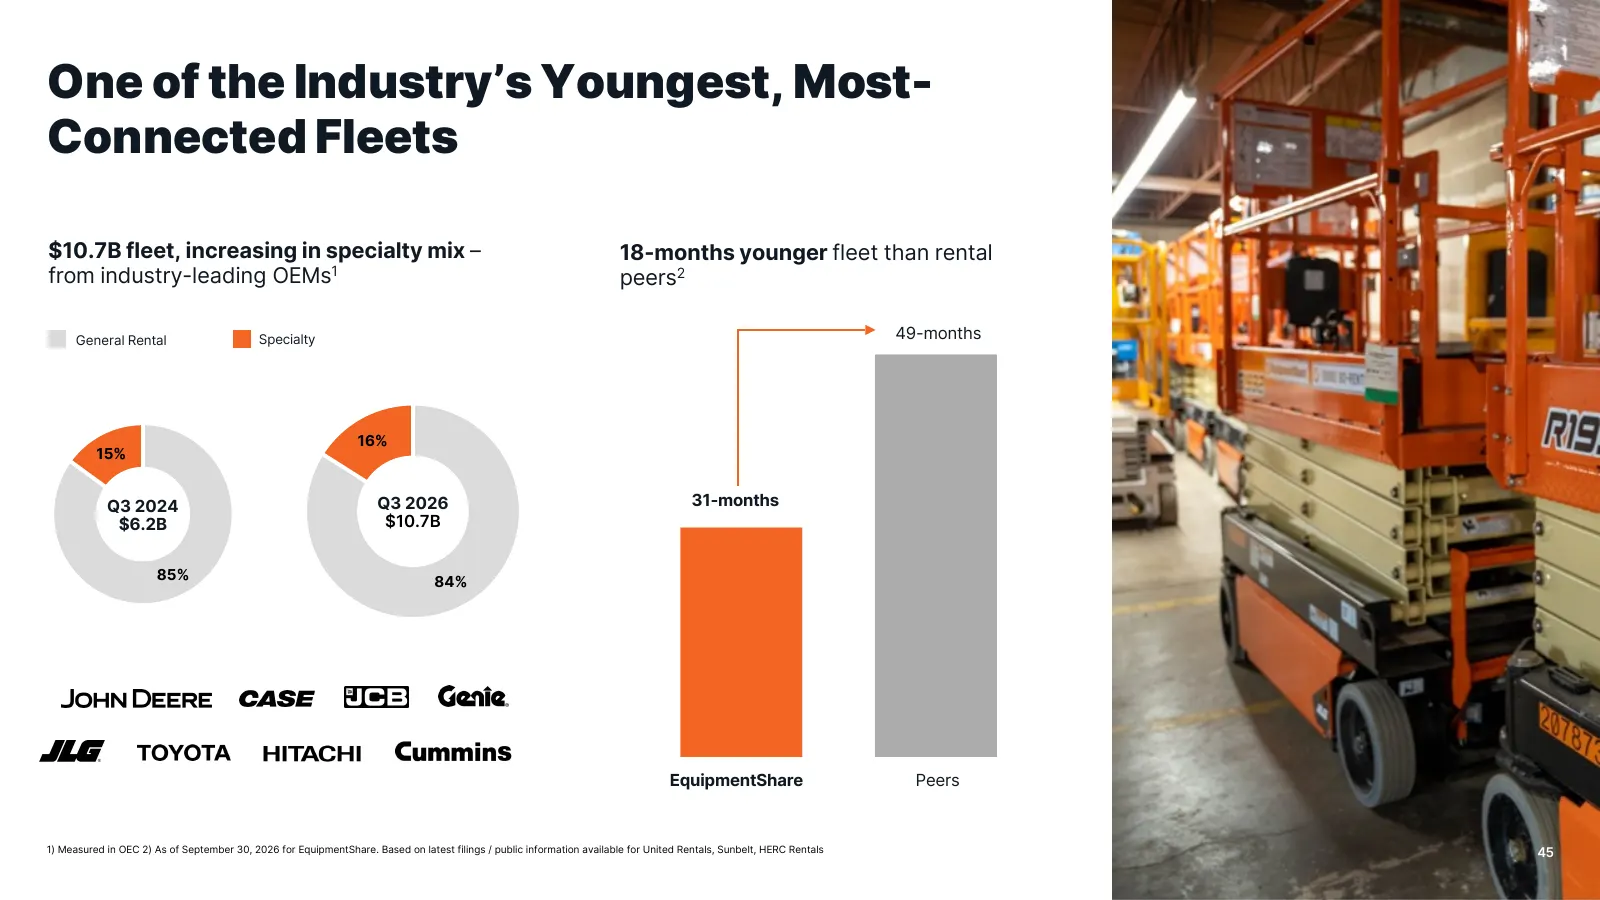
Slide 45: One of the Industry's Youngest, Most-Connected Fleets
One of the Industry’s Youngest, Most- Connected Fleets $10.7B fleet, increasing in specialty mix – 18-months younger fleet than rental from industry-leading OEMs1 peers2 General Rental Specialty 49-months 16% 15% Q3 2024 Q3 2026 31-months $6.2B $10.7B 85% 84% EquipmentShare Peers 1) Measured in OEC
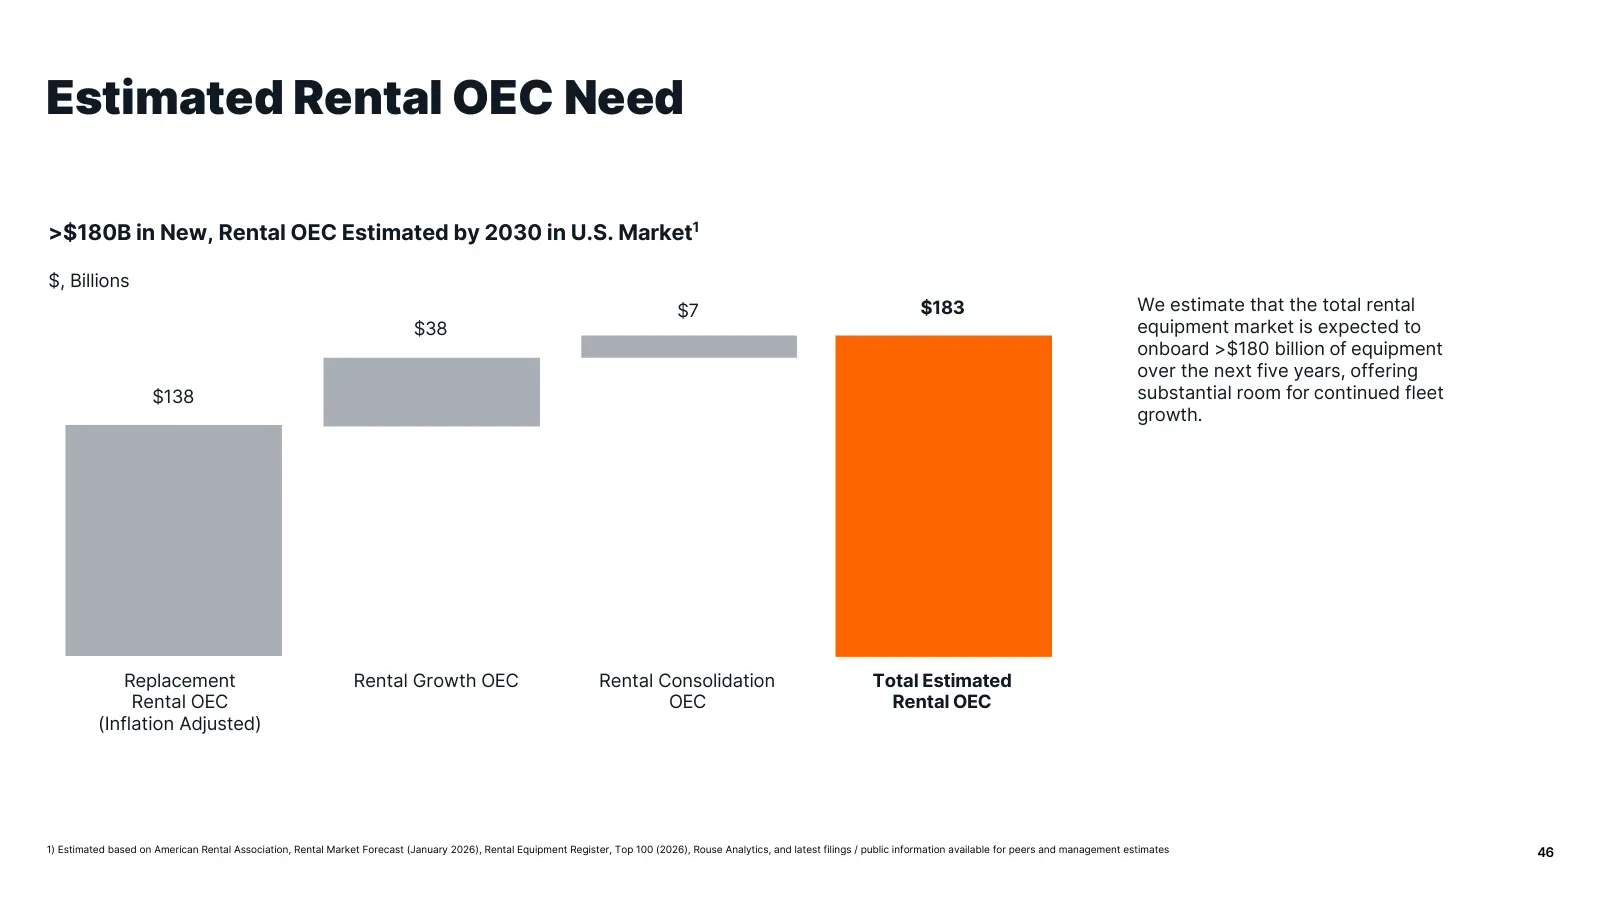
Slide 46: Estimated Rental OEC Need
Estimated Rental OEC Need >$180B in New, Rental OEC Estimated by 2030 in U.S. Market1 $, Billions $7 $183 We estimate that the total rental $38 equipment market is expected to onboard >$180 billion of equipment over the next five years, offering $138 substantial room for continued fleet growth. 0 Re
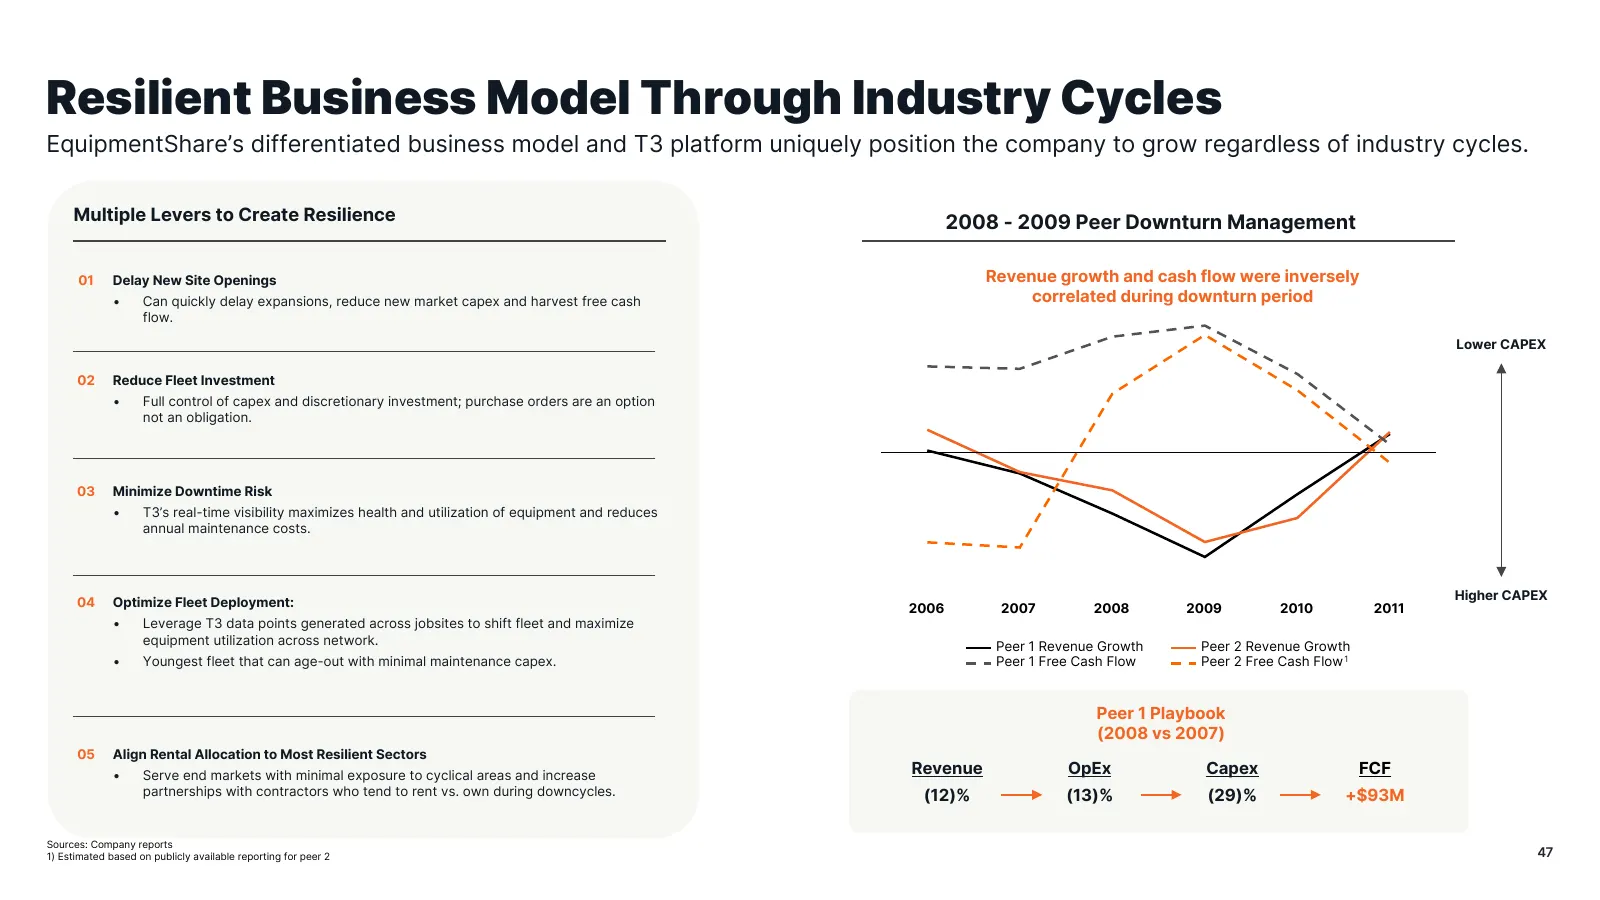
Slide 47: Resilient Business Model Through Industry Cycles
Resilient Business Model Through Industry Cycles EquipmentShare’s differentiated business model and T3 platform uniquely position the company to grow regardless of industry cycles. Multiple Levers to Create Resilience 2008 - 2009 Peer Downturn Management 01 Delay New Site Openings Revenue growth and
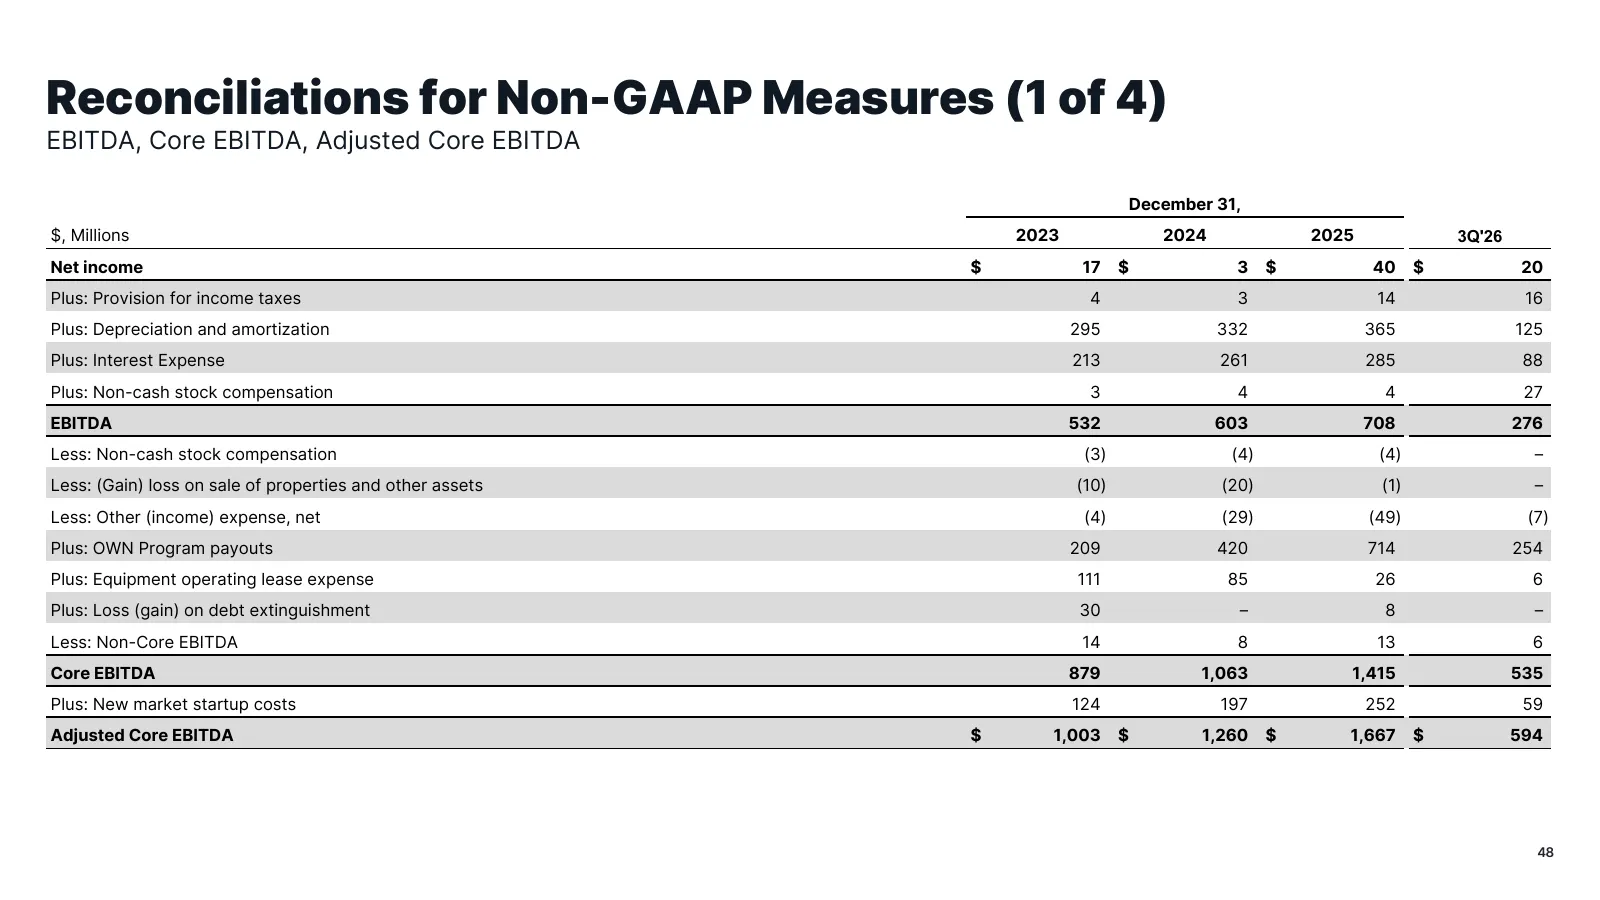
Slide 48: Reconciliations for Non-GAAP Measures (1 of 4)
Reconciliations for Non-GAAP Measures (1 of 4) EBITDA, Core EBITDA, Adjusted Core EBITDA December 31, $, Millions 2023 2024 2025 3Q'26 Net income $ 17 $ 3 $ 40 $ 20 Plus: Provision for income taxes 4 3 14 16 Plus: Depreciation and amortization 295 332 365 125 Plus: Interest Expense 213 261 285 88 Pl
Slide 49: Reconciliations for Non-GAAP Measures (2 of 4)
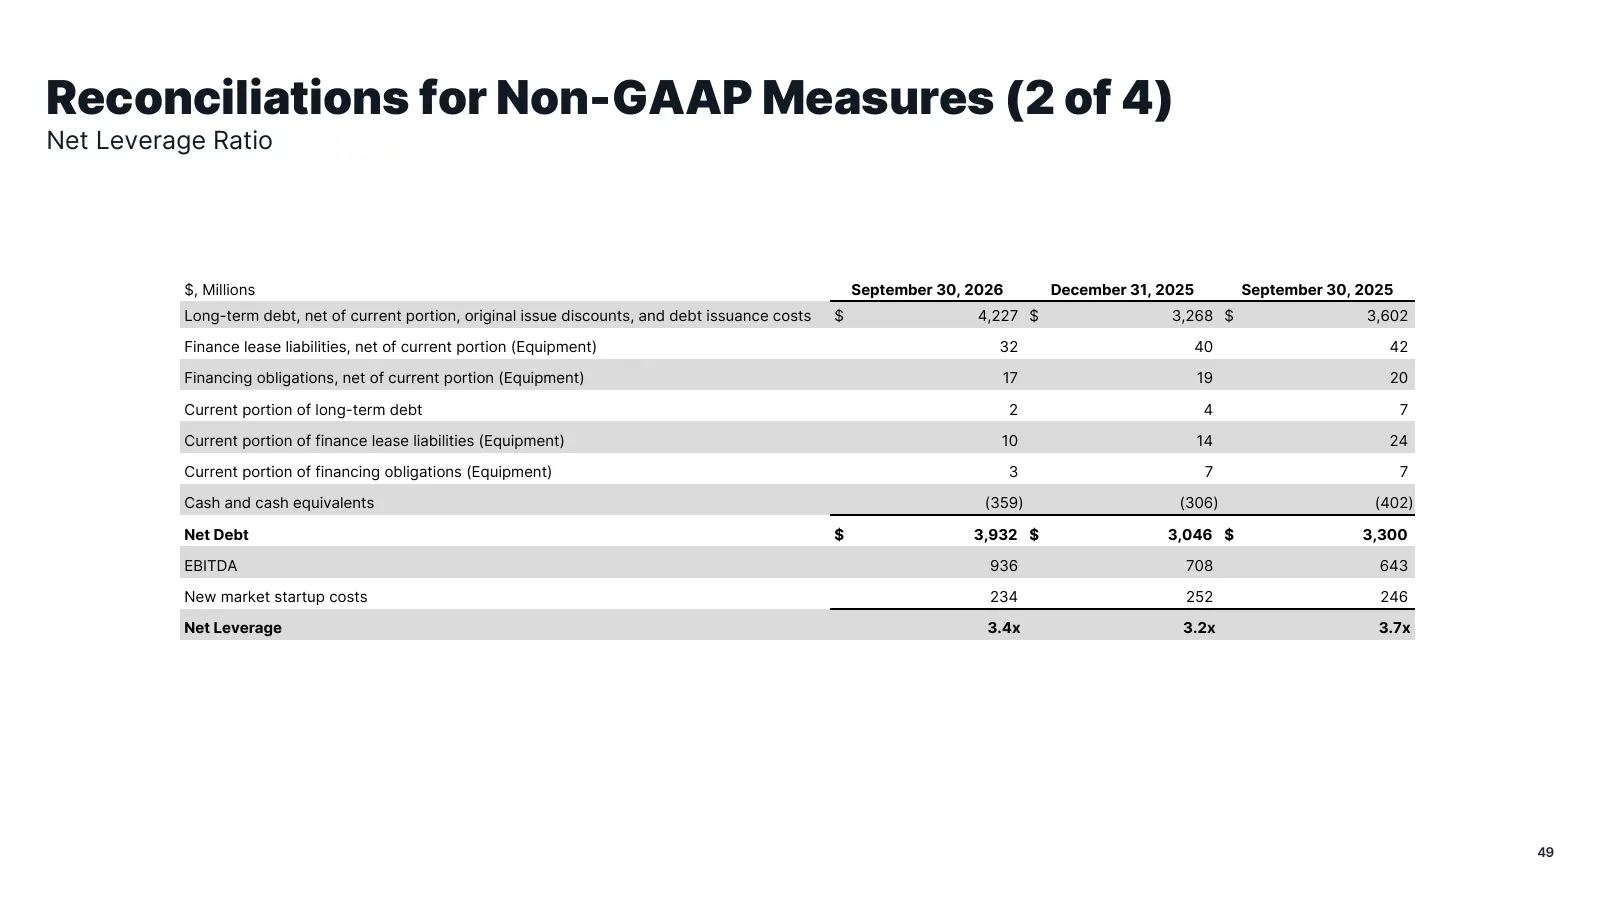
Reconciliations for Non-GAAP Measures (2 of 4) Net Leverage Ratio $, Millions September 30, 2026 December 31, 2025 September 30, 2025 Long-term debt, net of current portion, original issue discounts, and debt issuance costs $ 4,227 $ 3,268 $ 3,602 Finance lease liabilities, net of current portion (E
Slide 50: Reconciliations for Non-GAAP Measures (3 of 4)
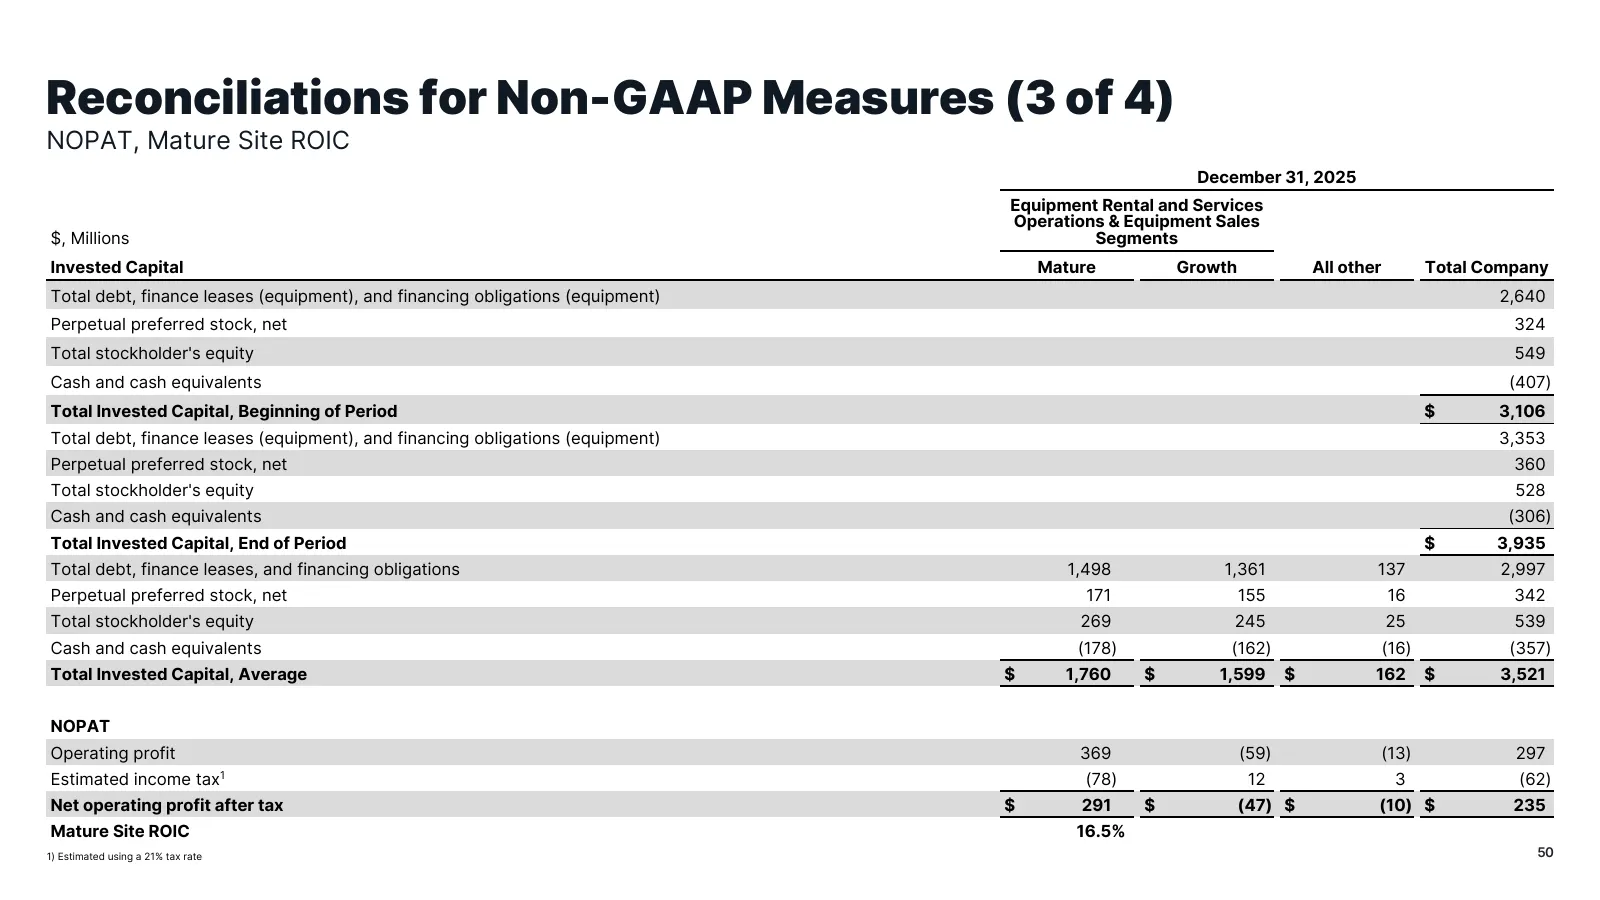
Reconciliations for Non-GAAP Measures (3 of 4) NOPAT, Mature Site ROIC December 31, 2025 Equipment Rental and Services Operations & Equipment Sales $, Millions Segments Invested Capital Mature Growth All other Total Company Total debt, finance leases (equipment), and financing obligations (equipment
Slide 51: Reconciliations for Non-GAAP Measures (4 of 4)
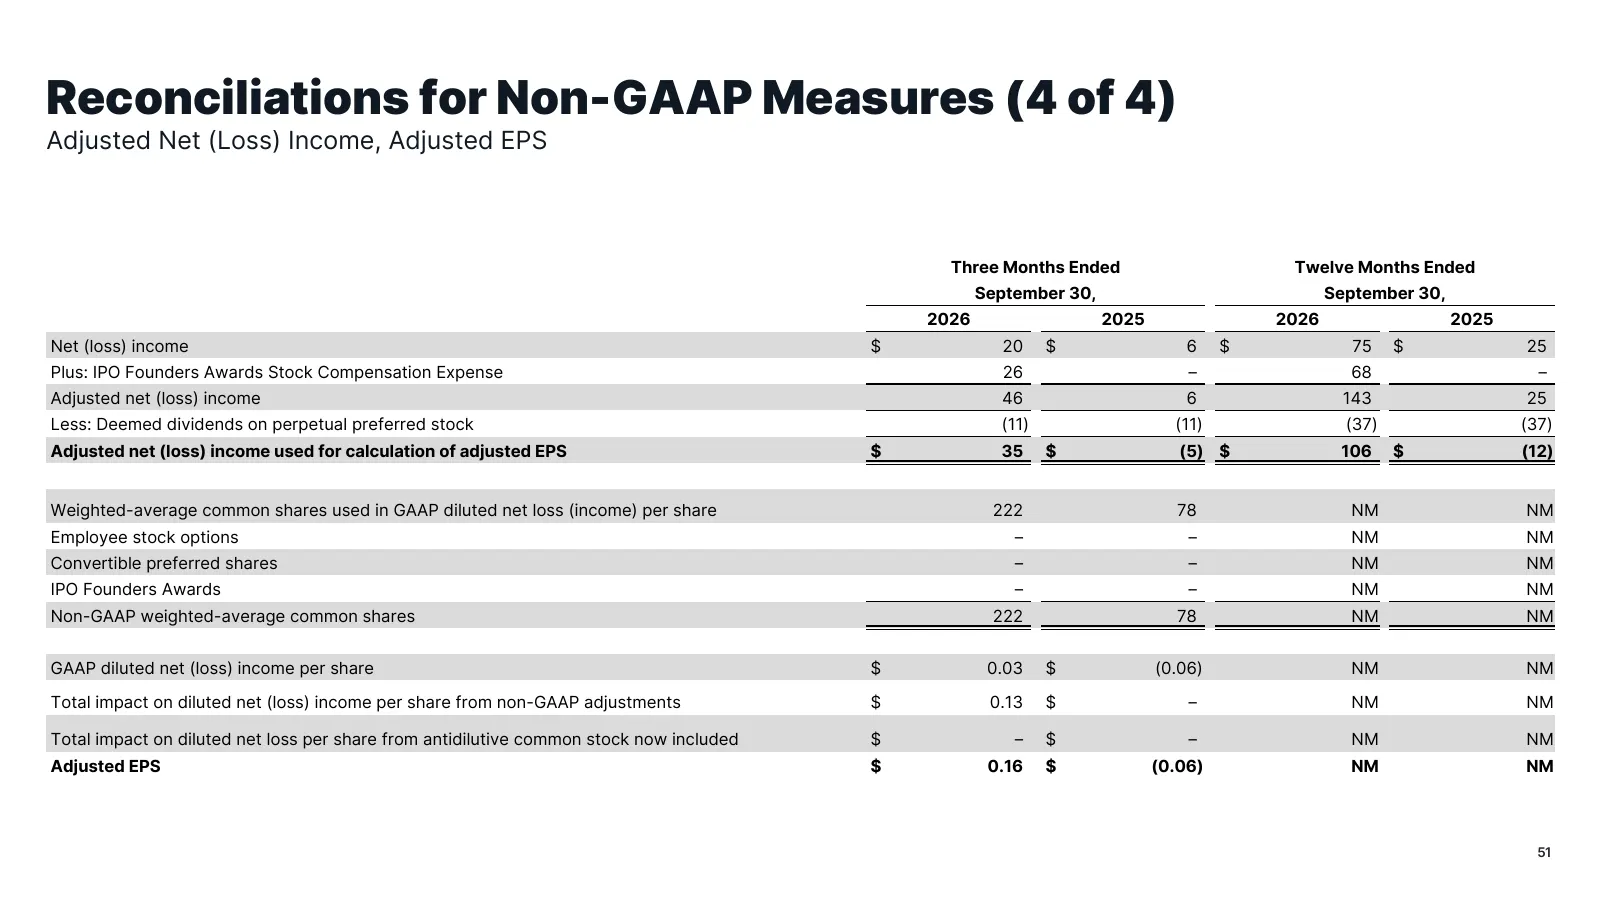
Reconciliations for Non-GAAP Measures (4 of 4) Adjusted Net (Loss) Income, Adjusted EPS Three Months Ended Twelve Months Ended September 30, September 30, 2026 2025 2026 2025 Net (loss) income $ 20 $ 6 $ 75 $ 25 Plus: IPO Founders Awards Stock Compensation Expense 26 – 68 – Adjusted net (loss) incom
Slide 52: OEC Under Management
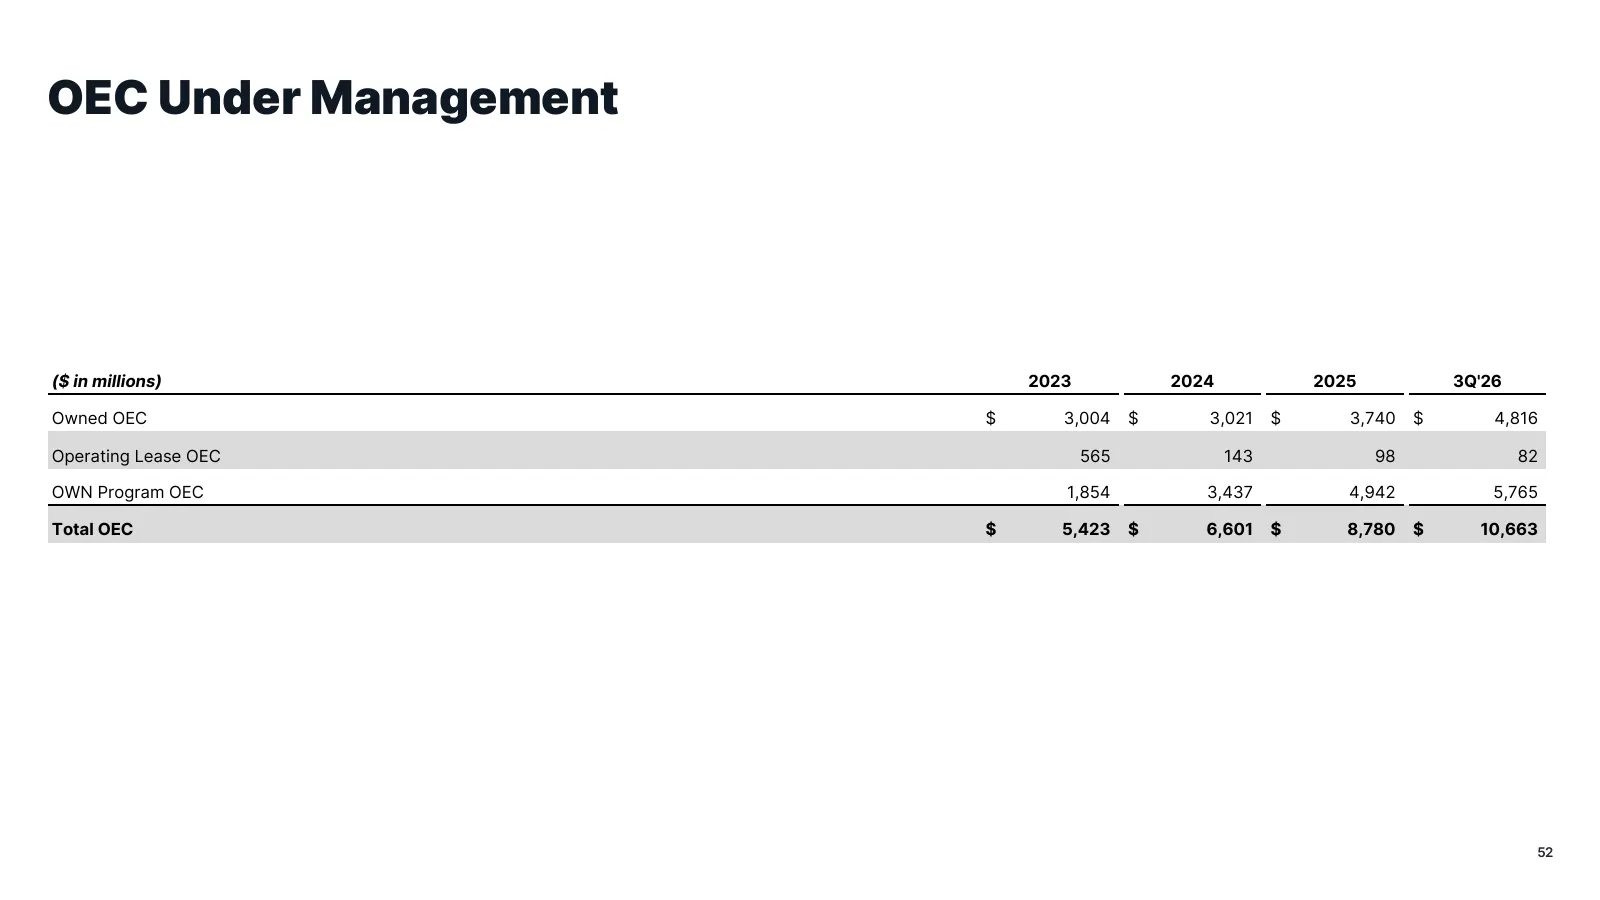
OEC Under Management ($ in millions) 2023 2024 2025 3Q'26 Owned OEC $ 3,004 $ 3,021 $ 3,740 $ 4,816 Operating Lease OEC 565 143 98 82 OWN Program OEC 1,854 3,437 4,942 5,765 Total OEC $ 5,423 $ 6,601 $ 8,780 $ 10,663 52
Slide 53: Glossary (1 of 2)
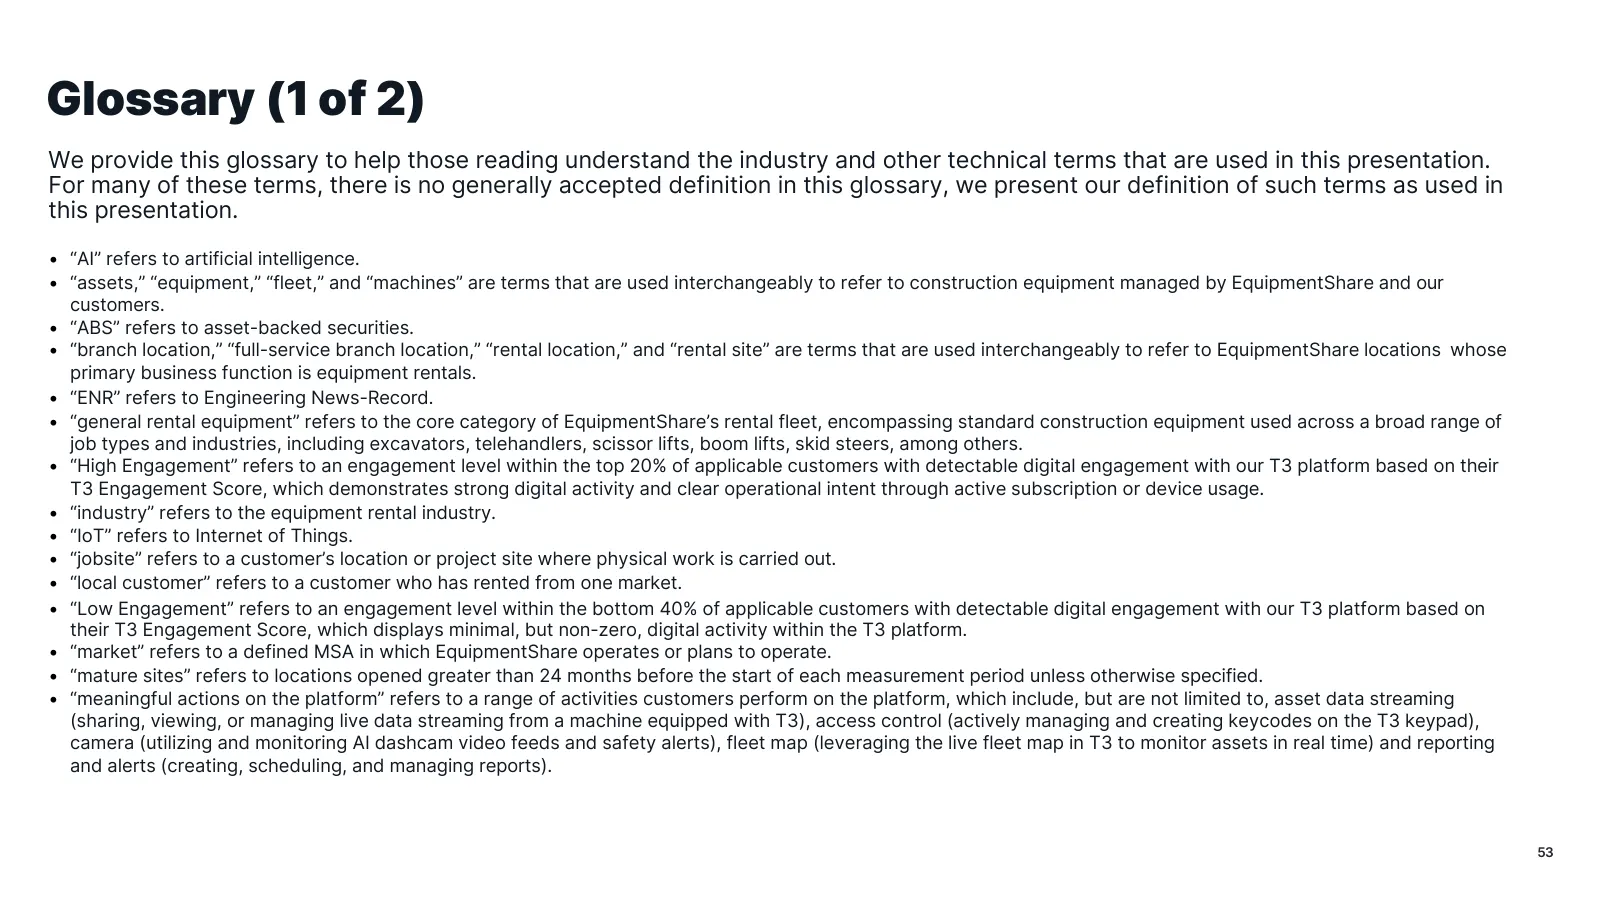
Glossary (1 of 2) We provide this glossary to help those reading understand the industry and other technical terms that are used in this presentation. For many of these terms, there is no generally accepted definition in this glossary, we present our definition of such terms as used in this presenta
Slide 54: Glossary (2 of 2)
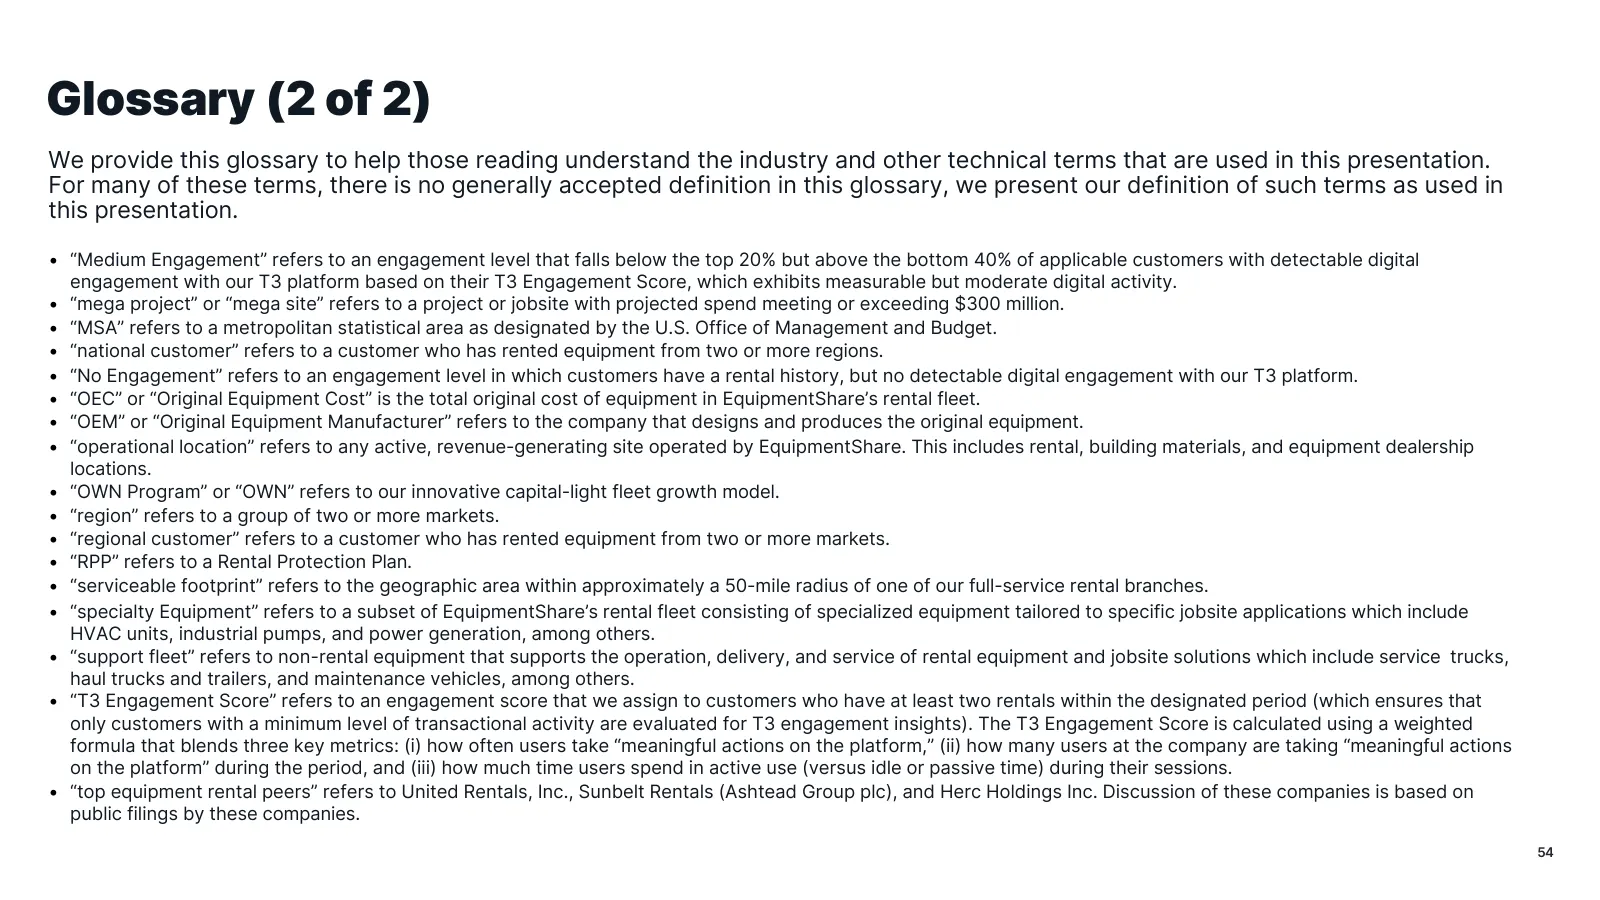
Glossary (2 of 2) We provide this glossary to help those reading understand the industry and other technical terms that are used in this presentation. For many of these terms, there is no generally accepted definition in this glossary, we present our definition of such terms as used in this presenta
Slide 55: "Our Opportunity" Footnotes for Referenced Market Sizes
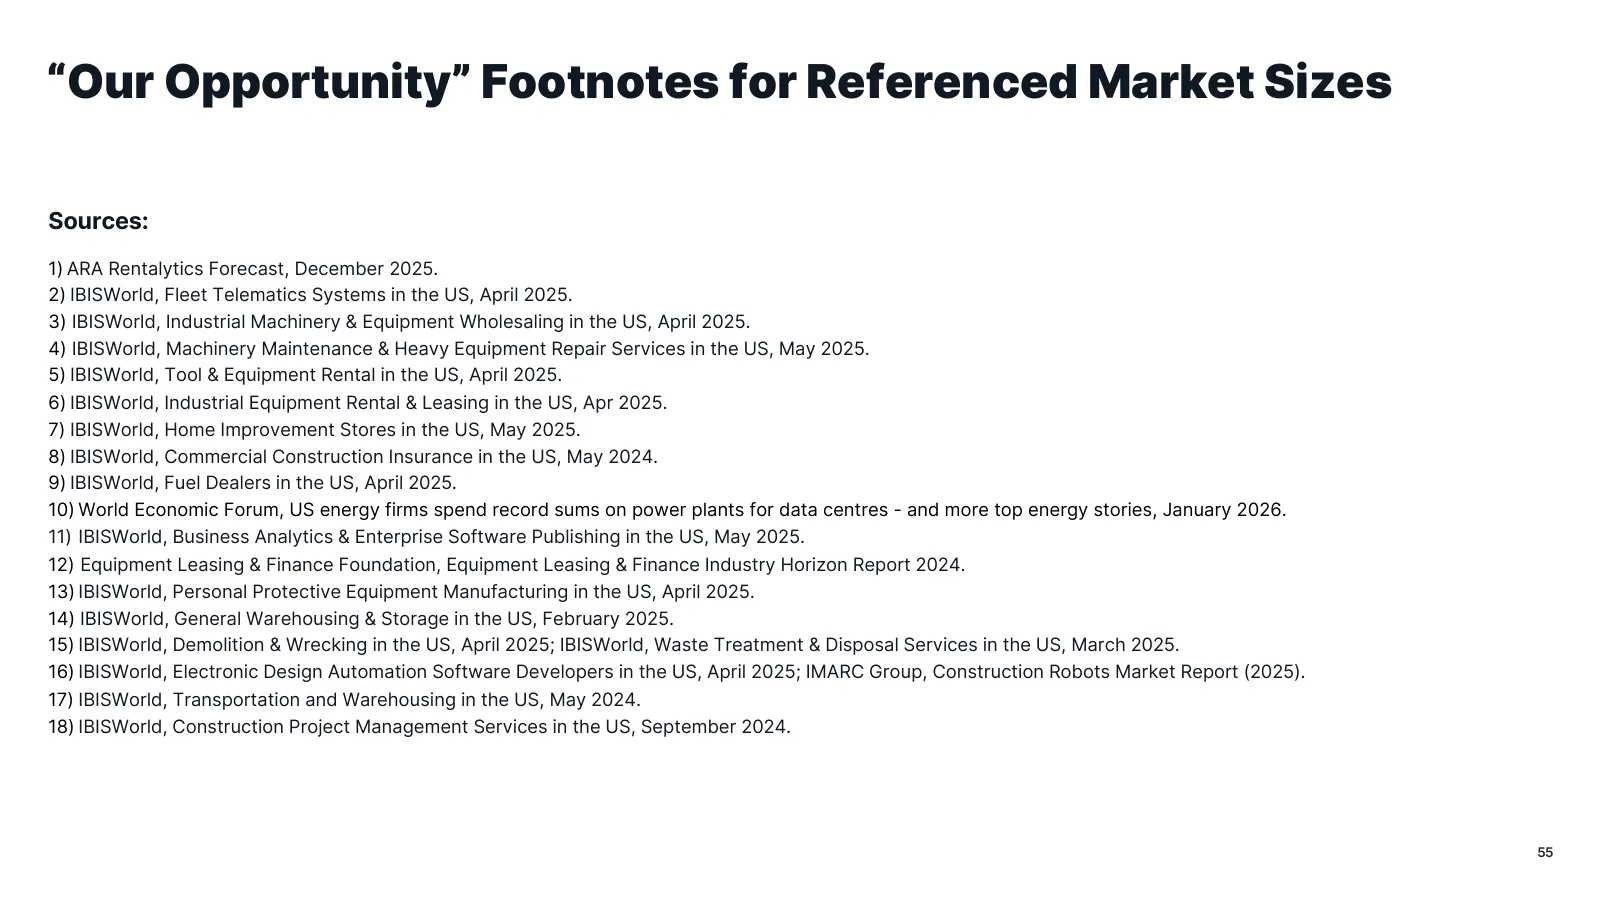
“Our Opportunity” Footnotes for Referenced Market Sizes Sources: 1) ARA Rentalytics Forecast, December 2025. 2) IBISWorld, Fleet Telematics Systems in the US, April 2025. 3) IBISWorld, Industrial Machinery & Equipment Wholesaling in the US, April 2025. 4) IBISWorld, Machinery Maintenance & Heavy Equ
Slide 56: Endnotes and Non-GAAP Financial Measures
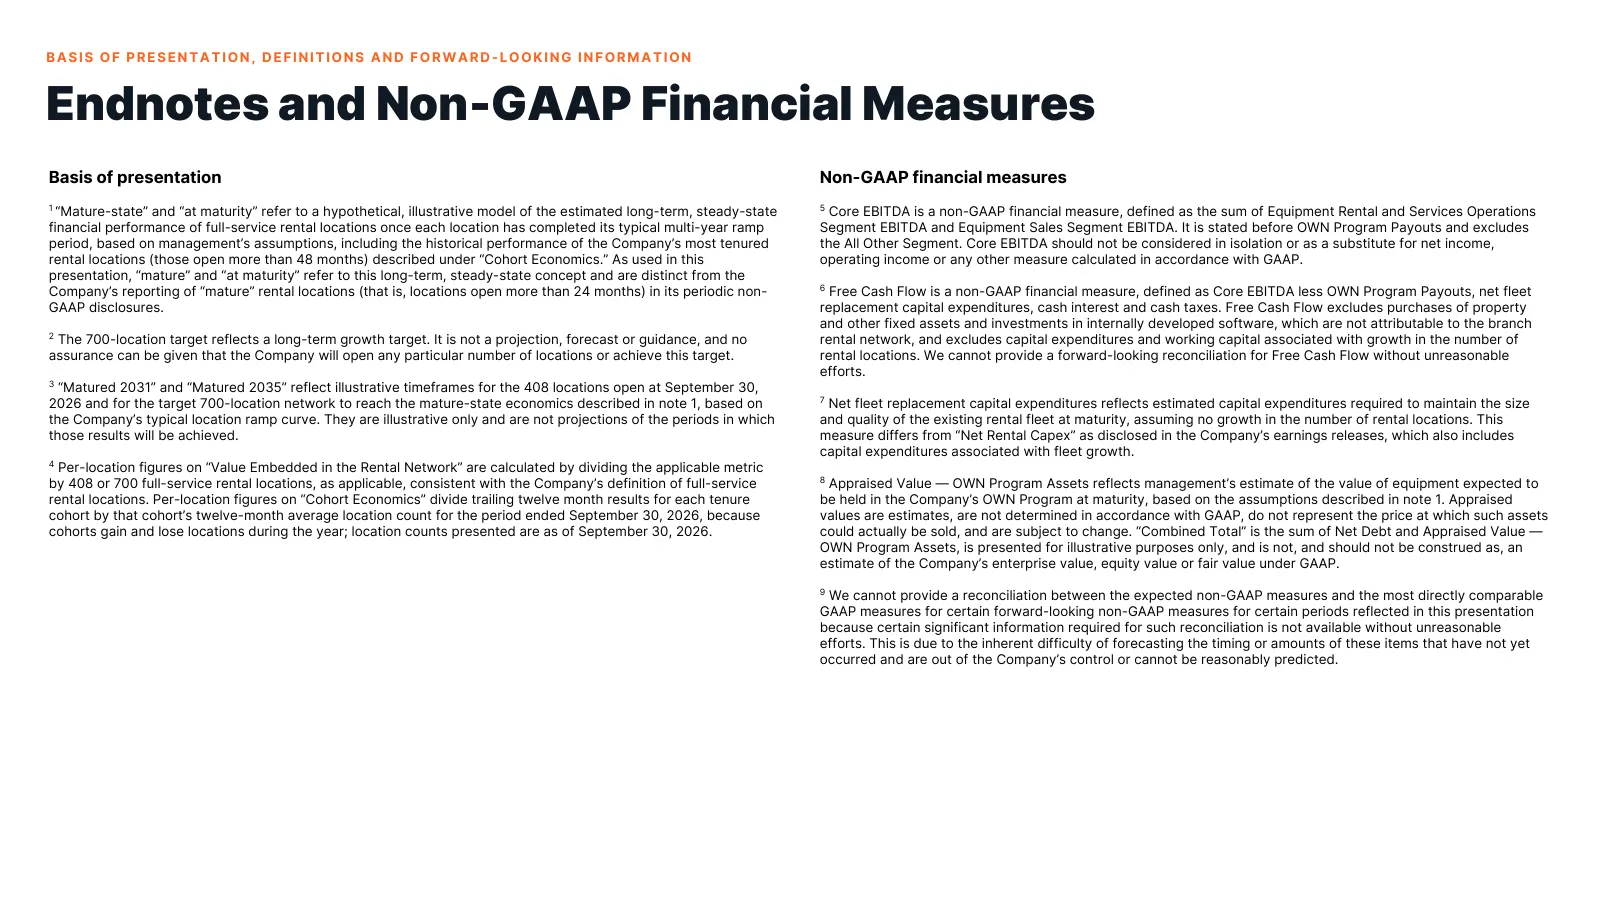
BASIS OF PRESENTATION, DEFINITIONS AND FORWARD-LOOKING INFORMATION Endnotes and Non-GAAP Financial Measures Basis of presentation Non-GAAP financial measures 1 “Mature-state” and “at maturity” refer to a hypothetical, illustrative model of the estimated long-term, steady-state 5 Core EBITDA is a non
Slide 57: Contact Us
Contact Us For additional information, please contact: Rhett Butler VP, Investor Relations ir@equipmentshare.com 57

Slide 58
Source: 6ix earnings call