Nemetschek SE · XETR:NEM
Nemetschek — FY2014 Earnings Presentation
19 slides from Nemetschek's earnings presentation, Mar 31, 2015
Slide 1: Fiscal Year 2014 and Outlook 2015
Fiscal Year 2014 and Outlook 2015 Earnings Call March 31, 2015 1
Slide 2: Nemetschek Group Highlights for FY 2014
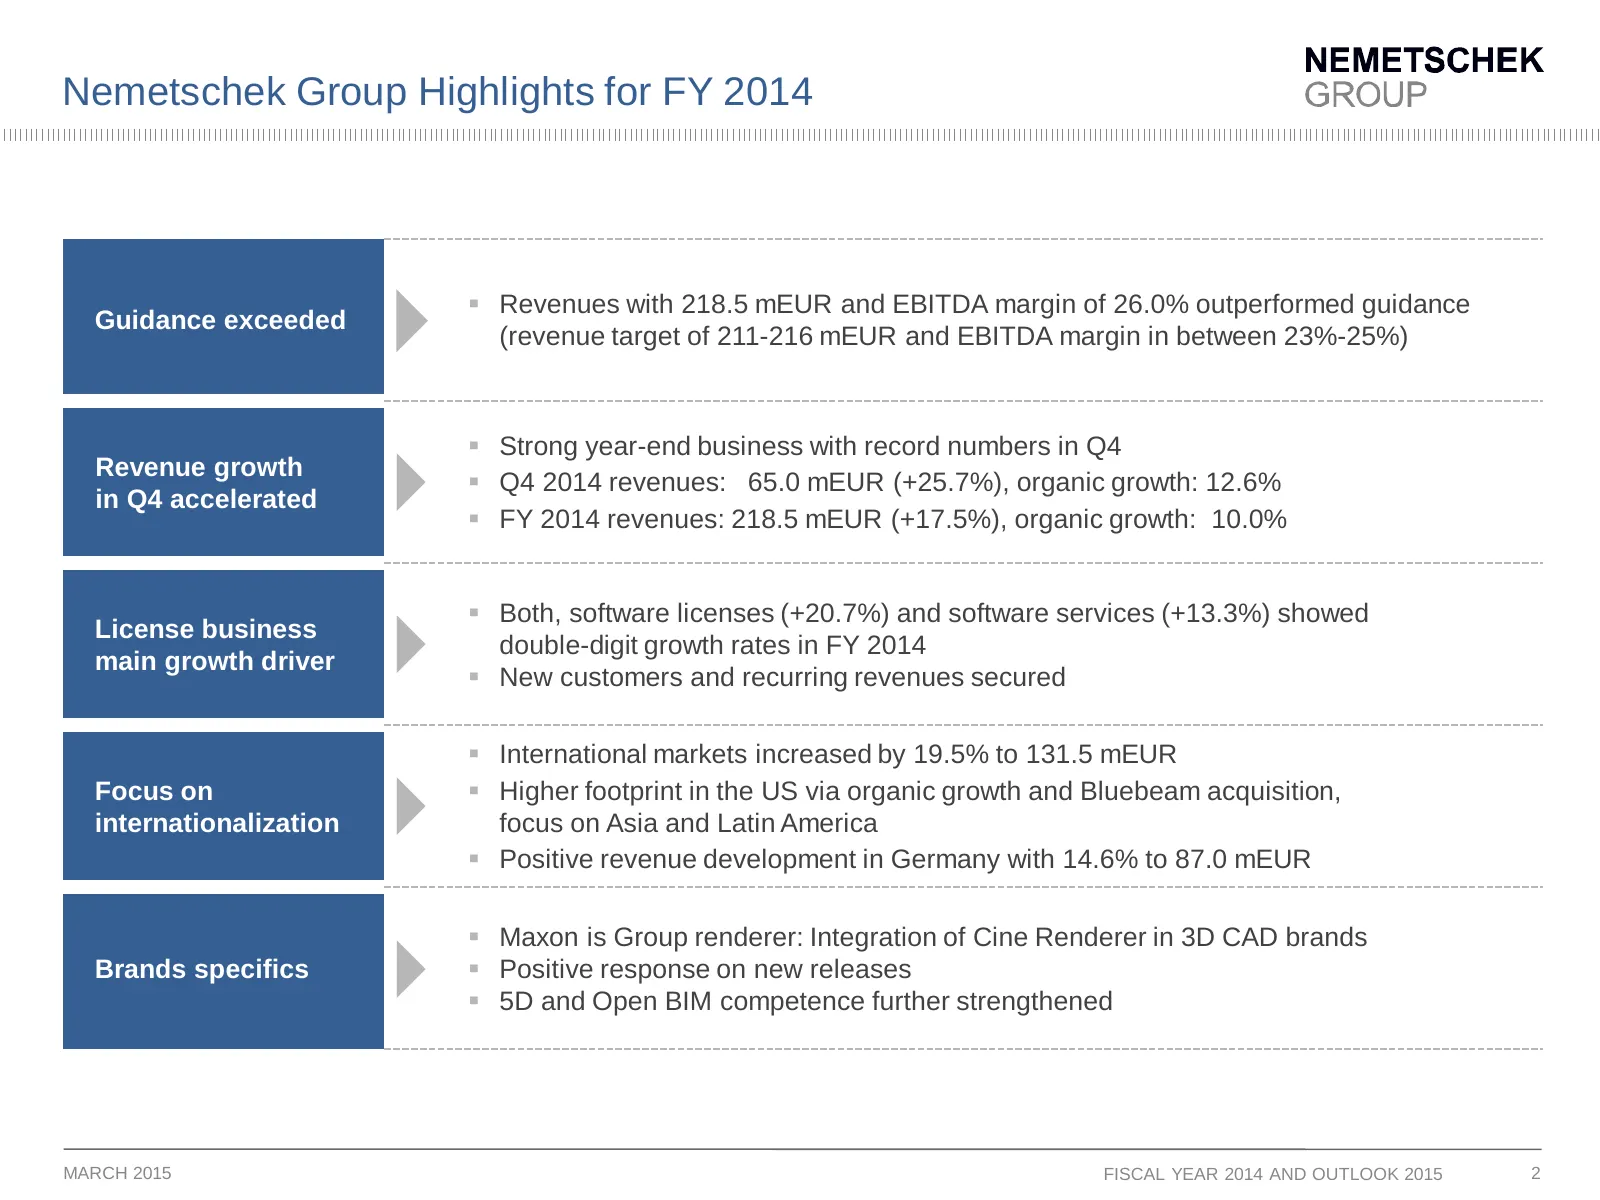
Nemetschek Group Highlights for FY 2014 Guidance exceeded Revenues with 218.5 mEUR and EBITDA margin of 26.0% outperformed guidance (revenue target of 211-216 mEUR and EBITDA margin in between 23%-25%) Strong year-end business with record numbers in Q4 Revenue growth in Q4 accelerated Q4 2
Slide 3: Nemetschek Group Highlights for FY 2014
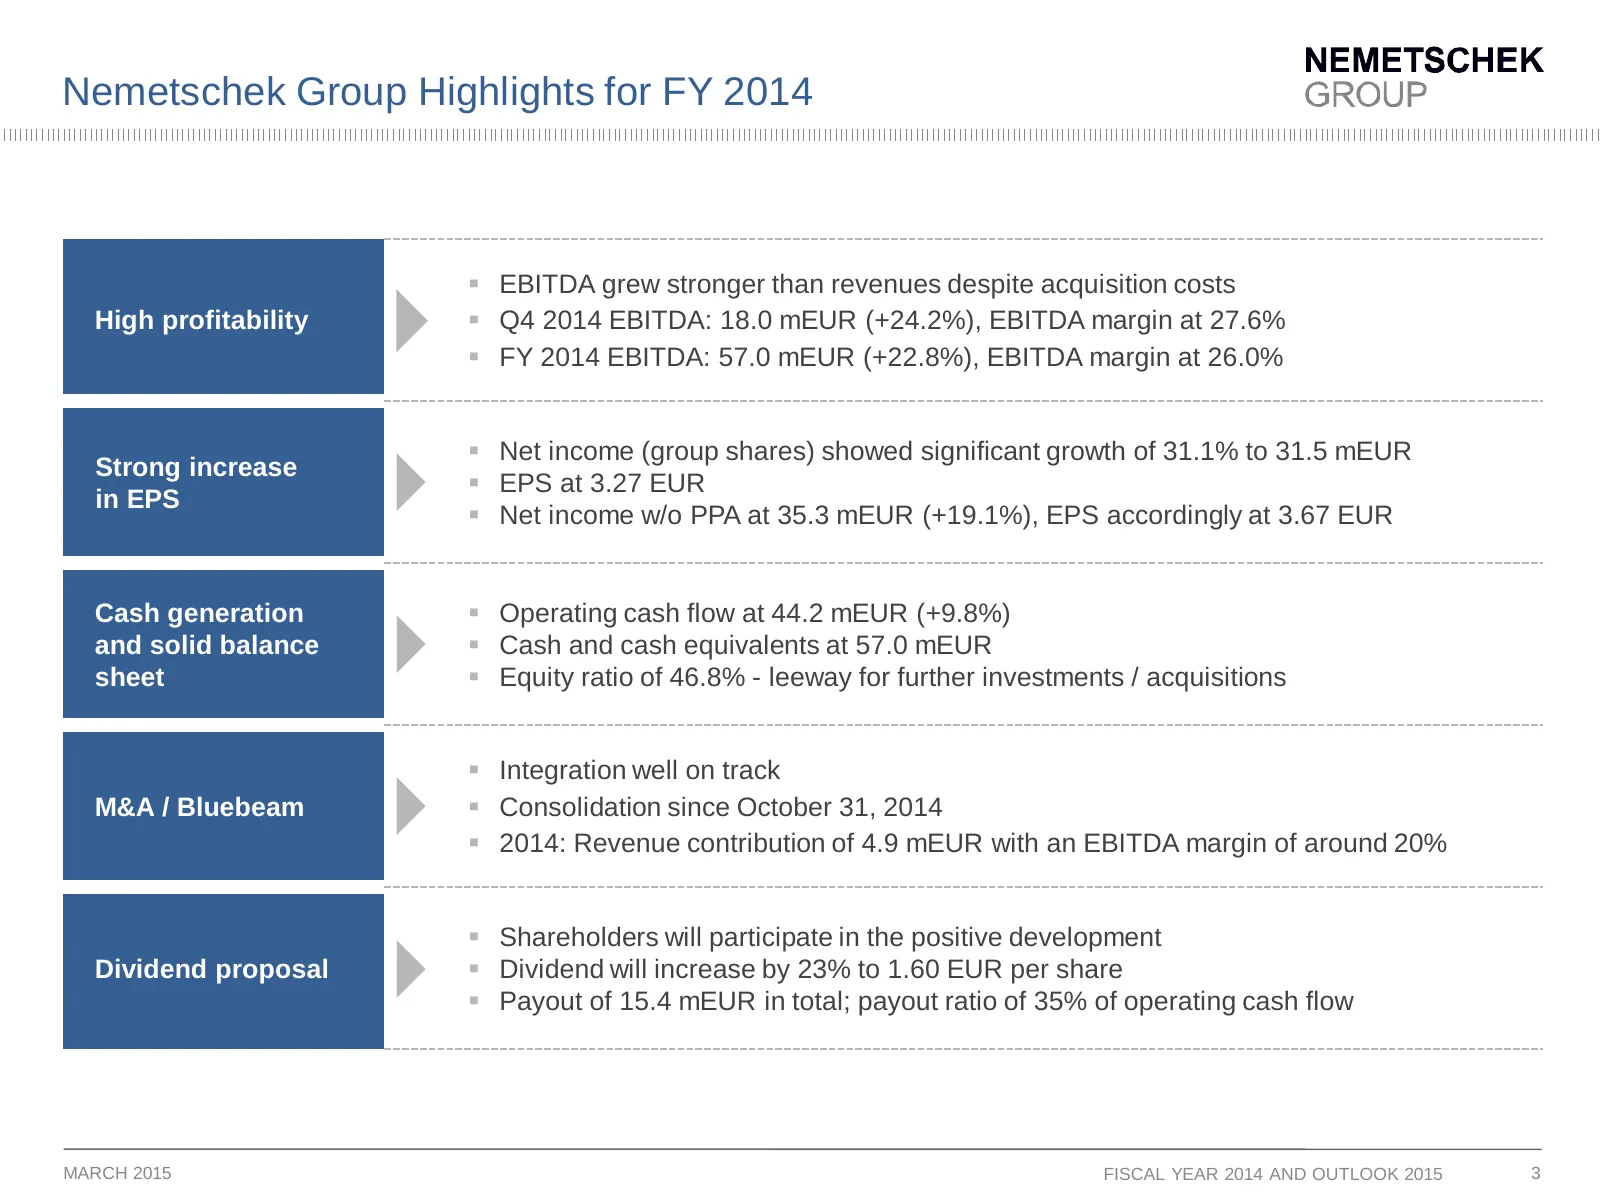
Nemetschek Group Highlights for FY 2014 EBITDA grew stronger than revenues despite acquisition costs High profitability Q4 2014 EBITDA: 18.0 mEUR (+24.2%), EBITDA margin at 27.6% FY 2014 EBITDA: 57.0 mEUR (+22.8%), EBITDA margin at 26.0% Net income (group shares) showed significant growth
Slide 4: Q4: Strongest quarter in the company's history
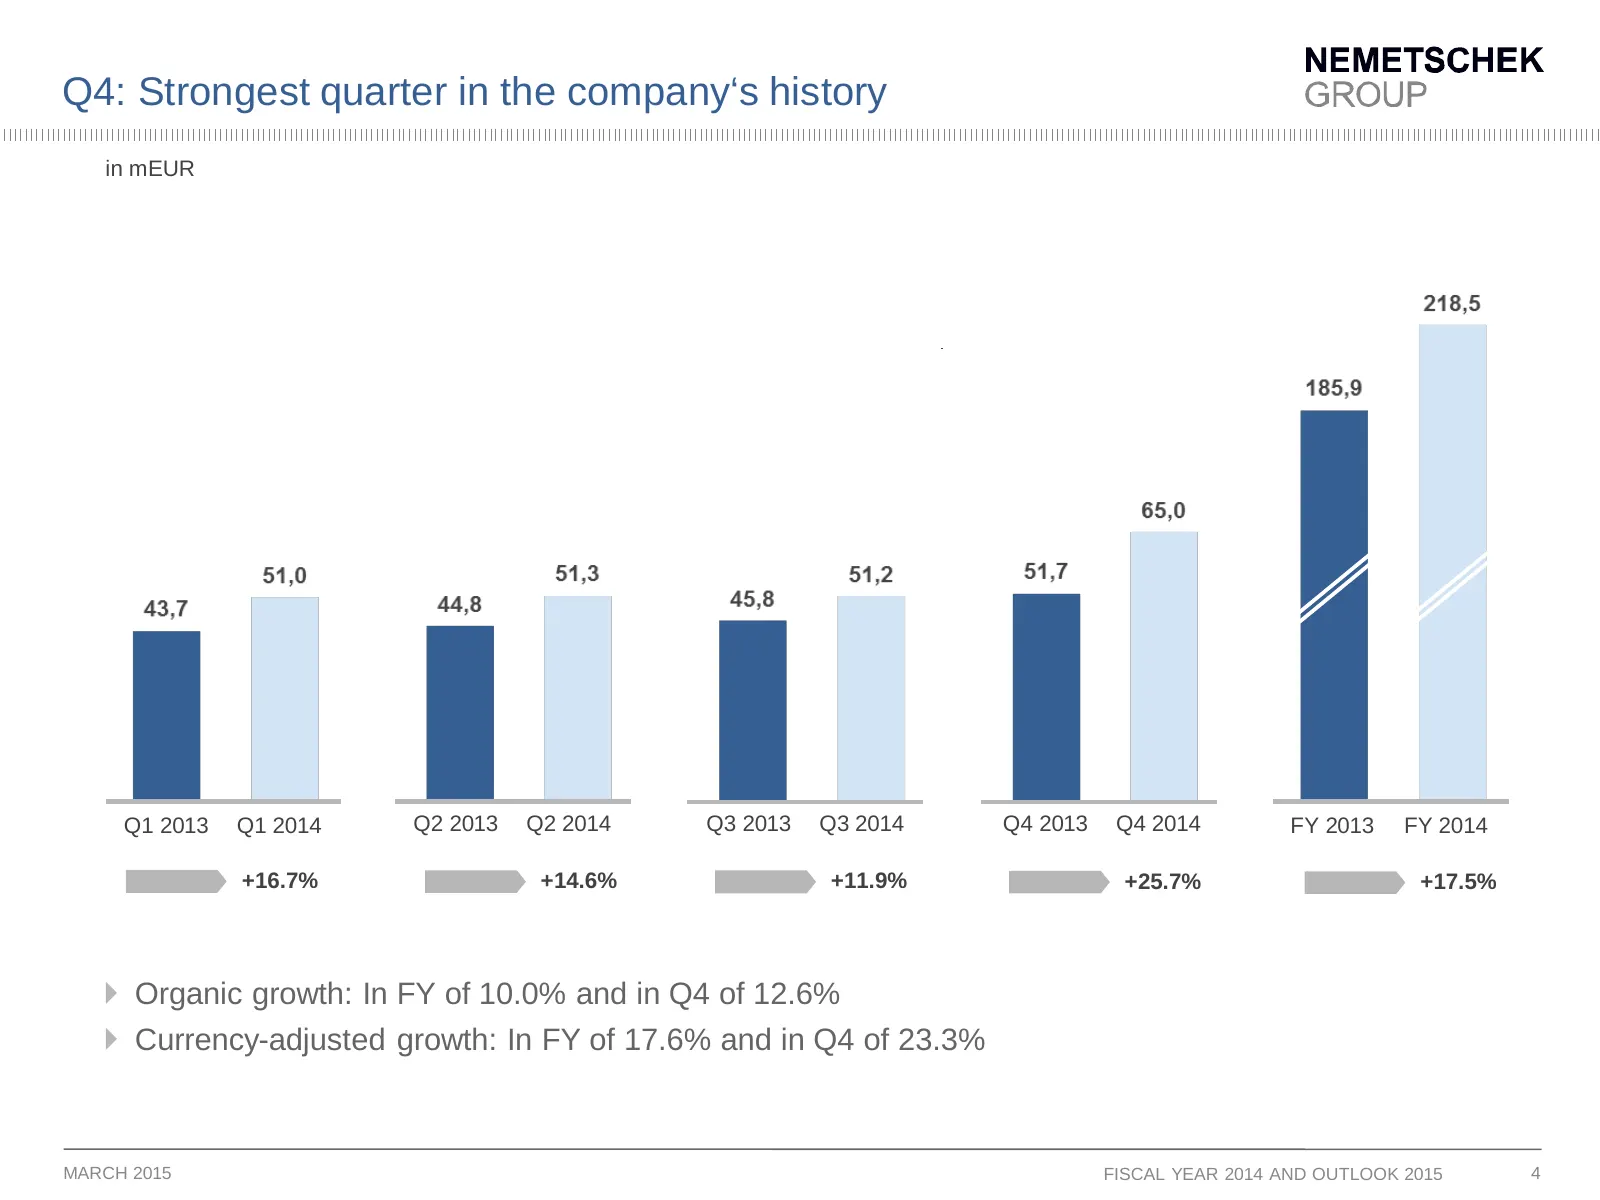
Q4: Strongest quarter in the company‘s history in mEUR Q1 2013 Q1 2014 Q2 2013 Q2 2014 Q3 2013 Q3 2014 Q4 2013 Q4 2014 FY 2013 FY 2014 +16.7% +14.6% +11.9% +25.7% +17.5% Organic growth: In FY of 10.0% and in Q4 of 12.6% Currency-adjusted growth: In FY of 17.6% and in Q4 of 23.3% MARCH 2015 FISCA
Slide 5: International growth accelerated
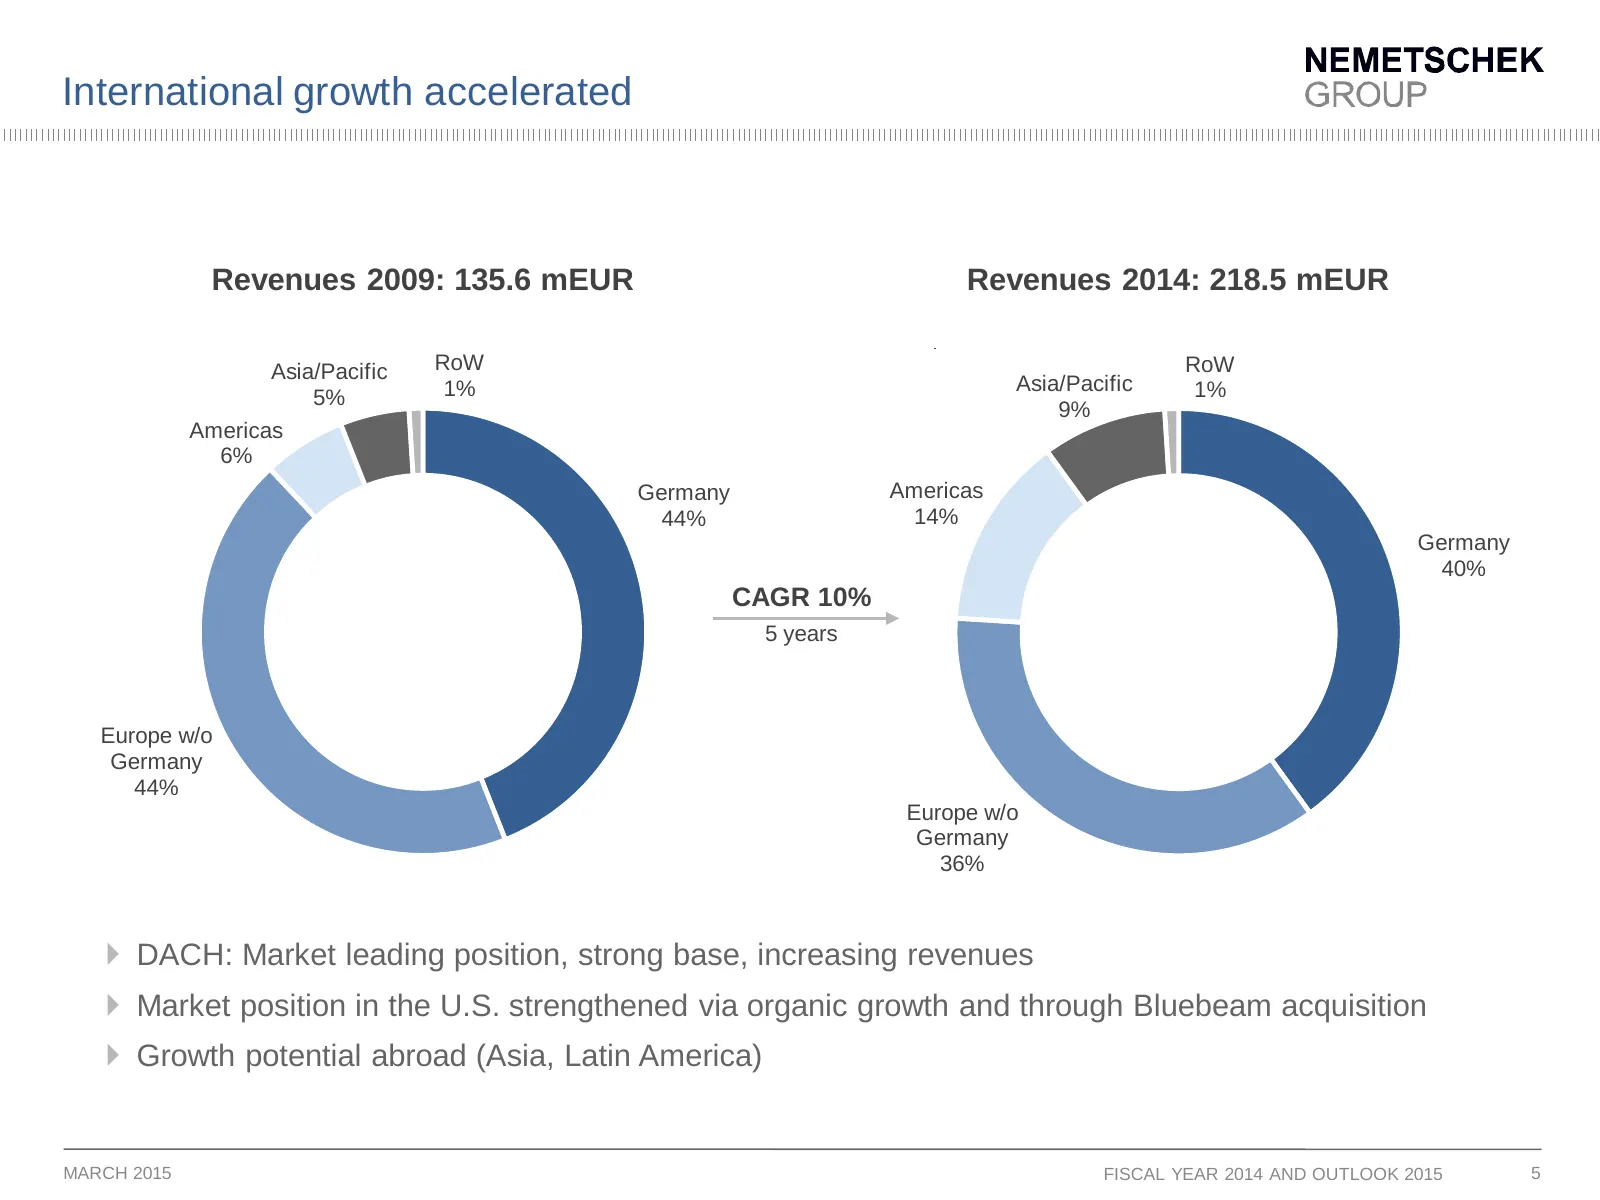
International growth accelerated Revenues 2009: 135.6 mEUR Revenues 2014: 218.5 mEUR Asia/Pacific RoW RoW 1% Asia/Pacific 1% 5% 9% Americas 6% Germany Americas 44% 14% Germany 40% CAGR 10% 5 years Europe w/o Germany 44% Europe w/o Germany 36% DACH: Market leading position, strong base, increasing
Slide 6: Well-balanced growth of software license and software services
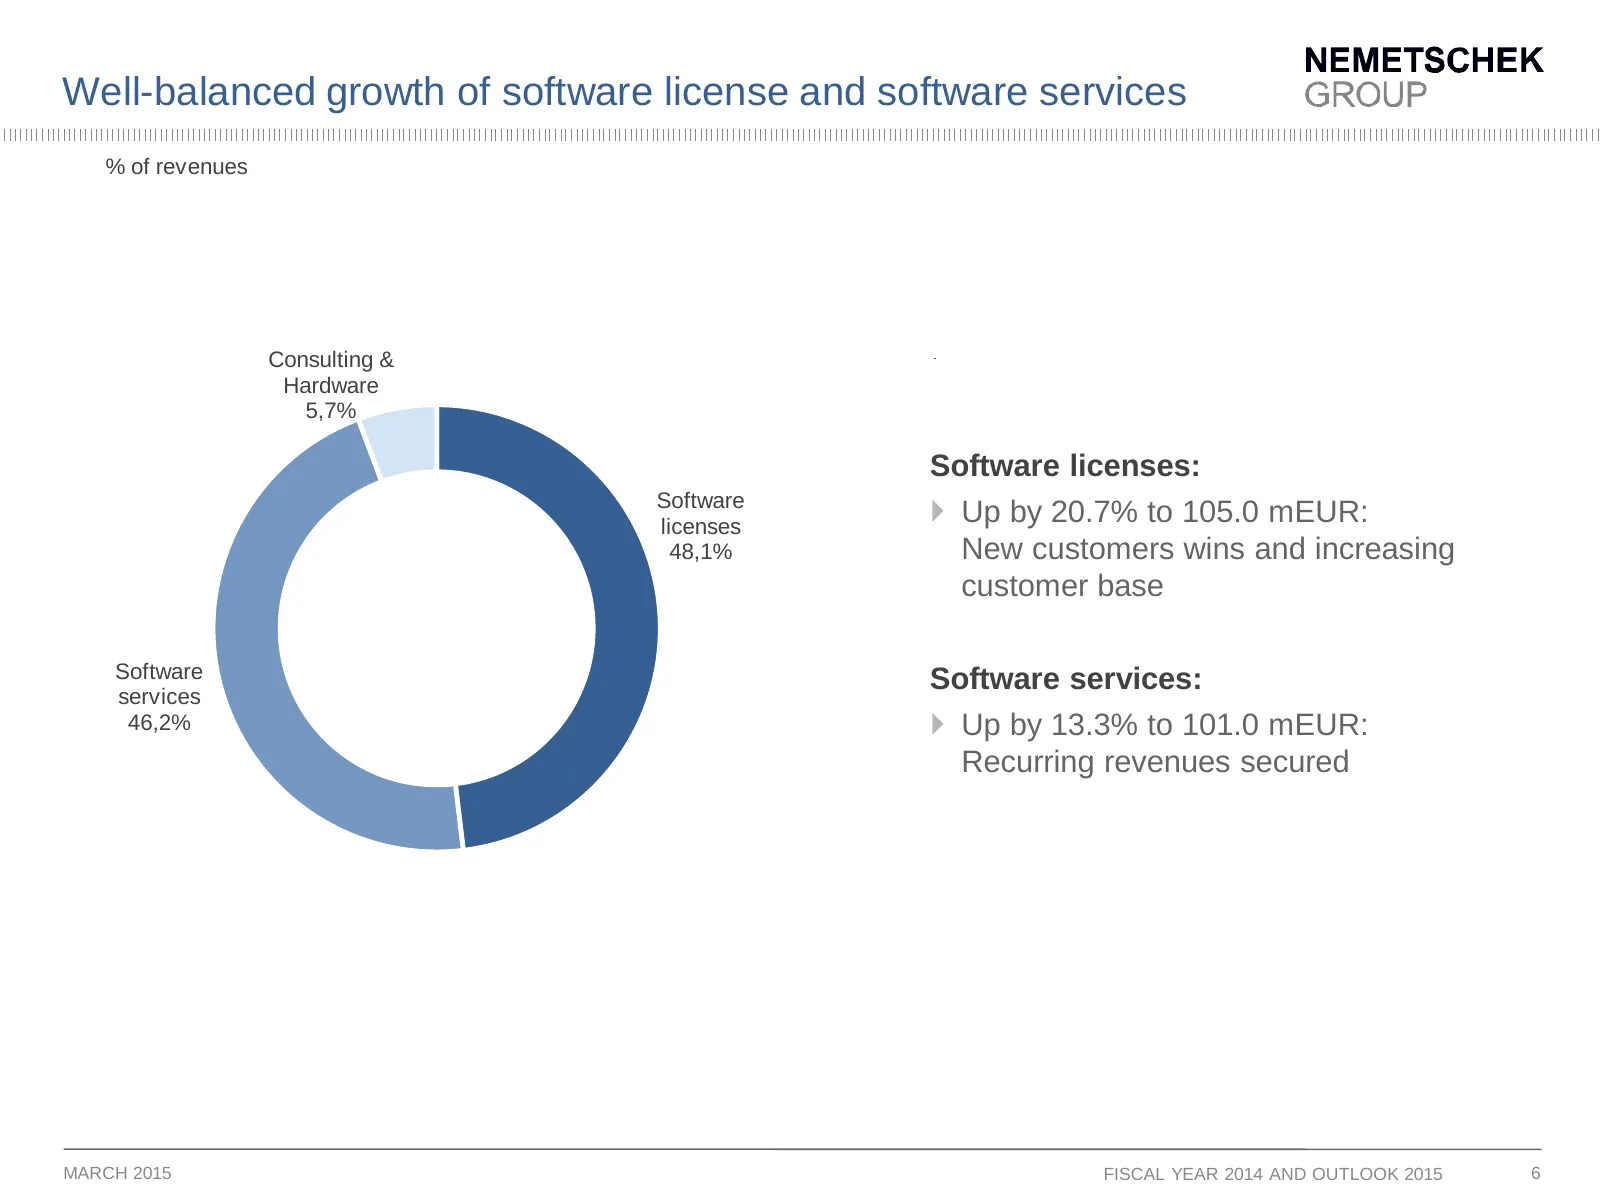
Well-balanced growth of software license and software services % of revenues Consulting & Hardware 5,7% Software licenses: Software licenses Up by 20.7% to 105.0 mEUR: 48,1% New customers wins and increasing customer base Software Software services: services 46,2% Up by 13.3% to 101.0 mEUR: Recu
Slide 7: EBITDA margin exceeded target range of 23% - 25%
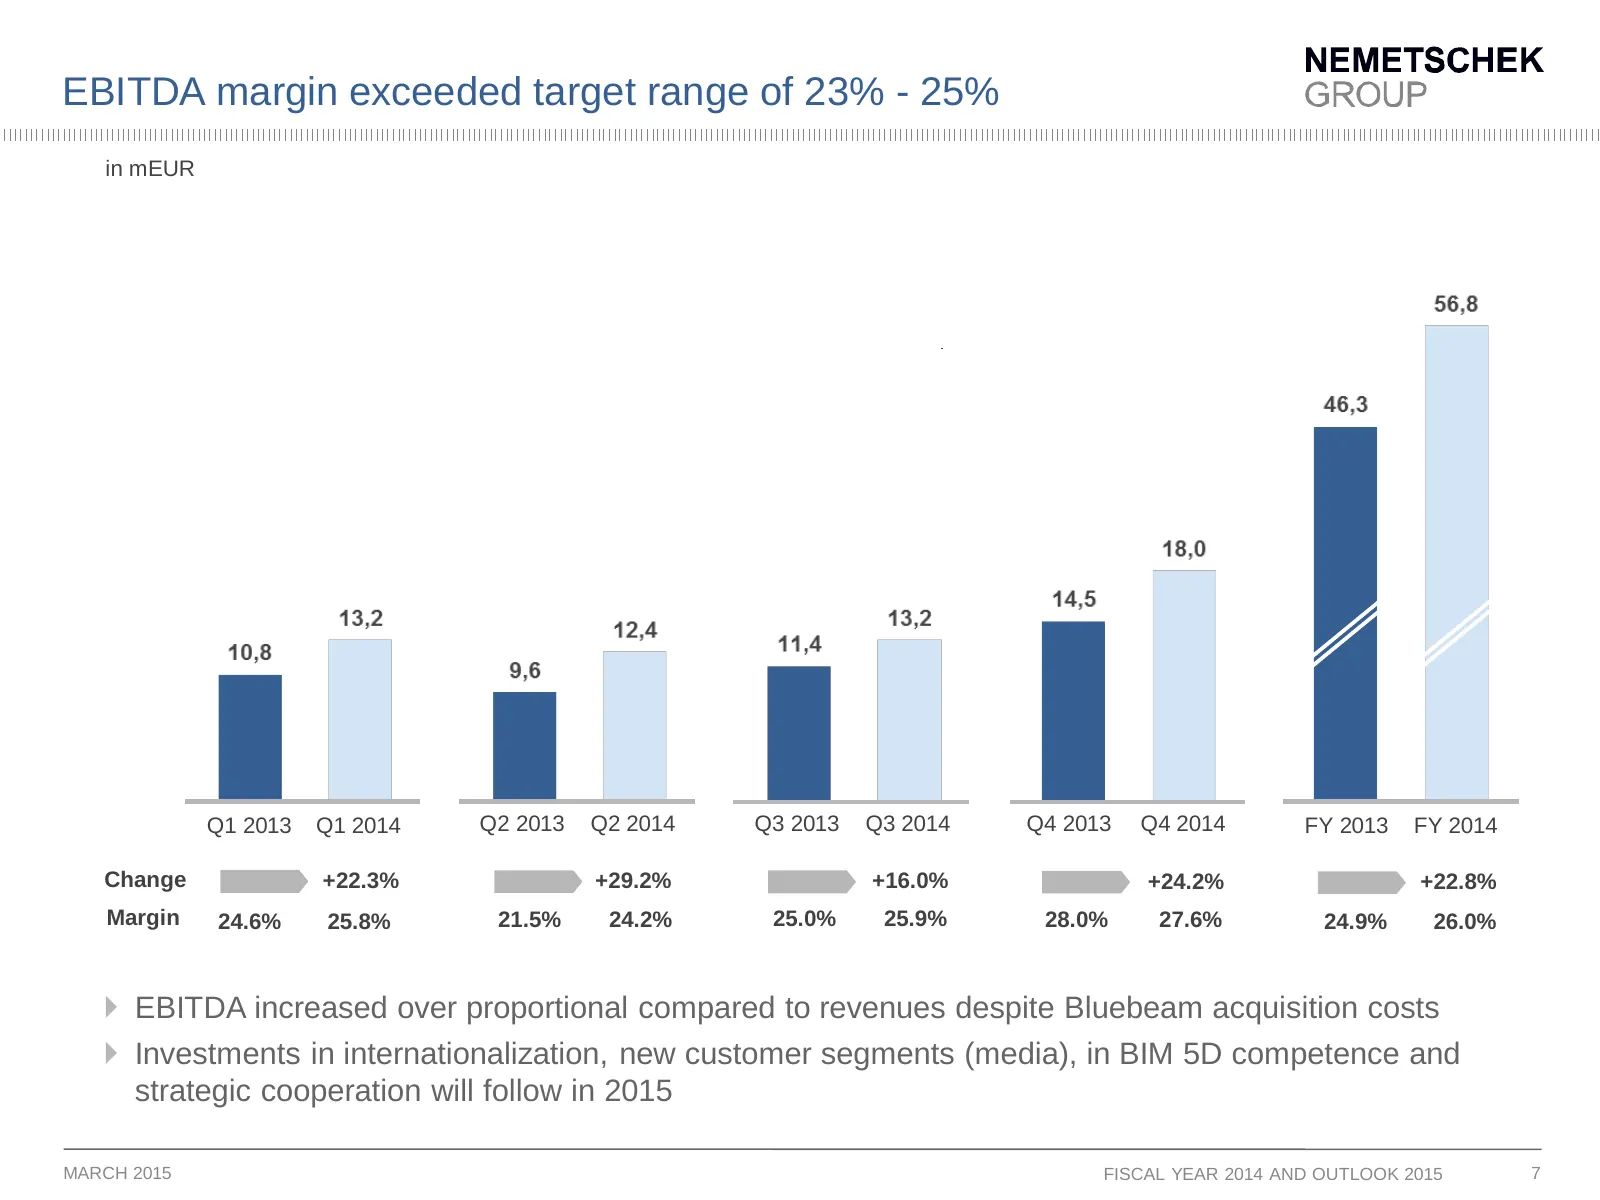
EBITDA margin exceeded target range of 23% - 25% in mEUR Q1 2013 Q1 2014 Q2 2013 Q2 2014 Q3 2013 Q3 2014 Q4 2013 Q4 2014 FY 2013 FY 2014 Change +22.3% +29.2% +16.0% +24.2% +22.8% Margin 24.6% 25.8% 21.5% 24.2% 25.0% 25.9% 28.0% 27.6% 24.9% 26.0% EBITDA increased over proportional compared to reven
Slide 8: Earnings per share increased strongly
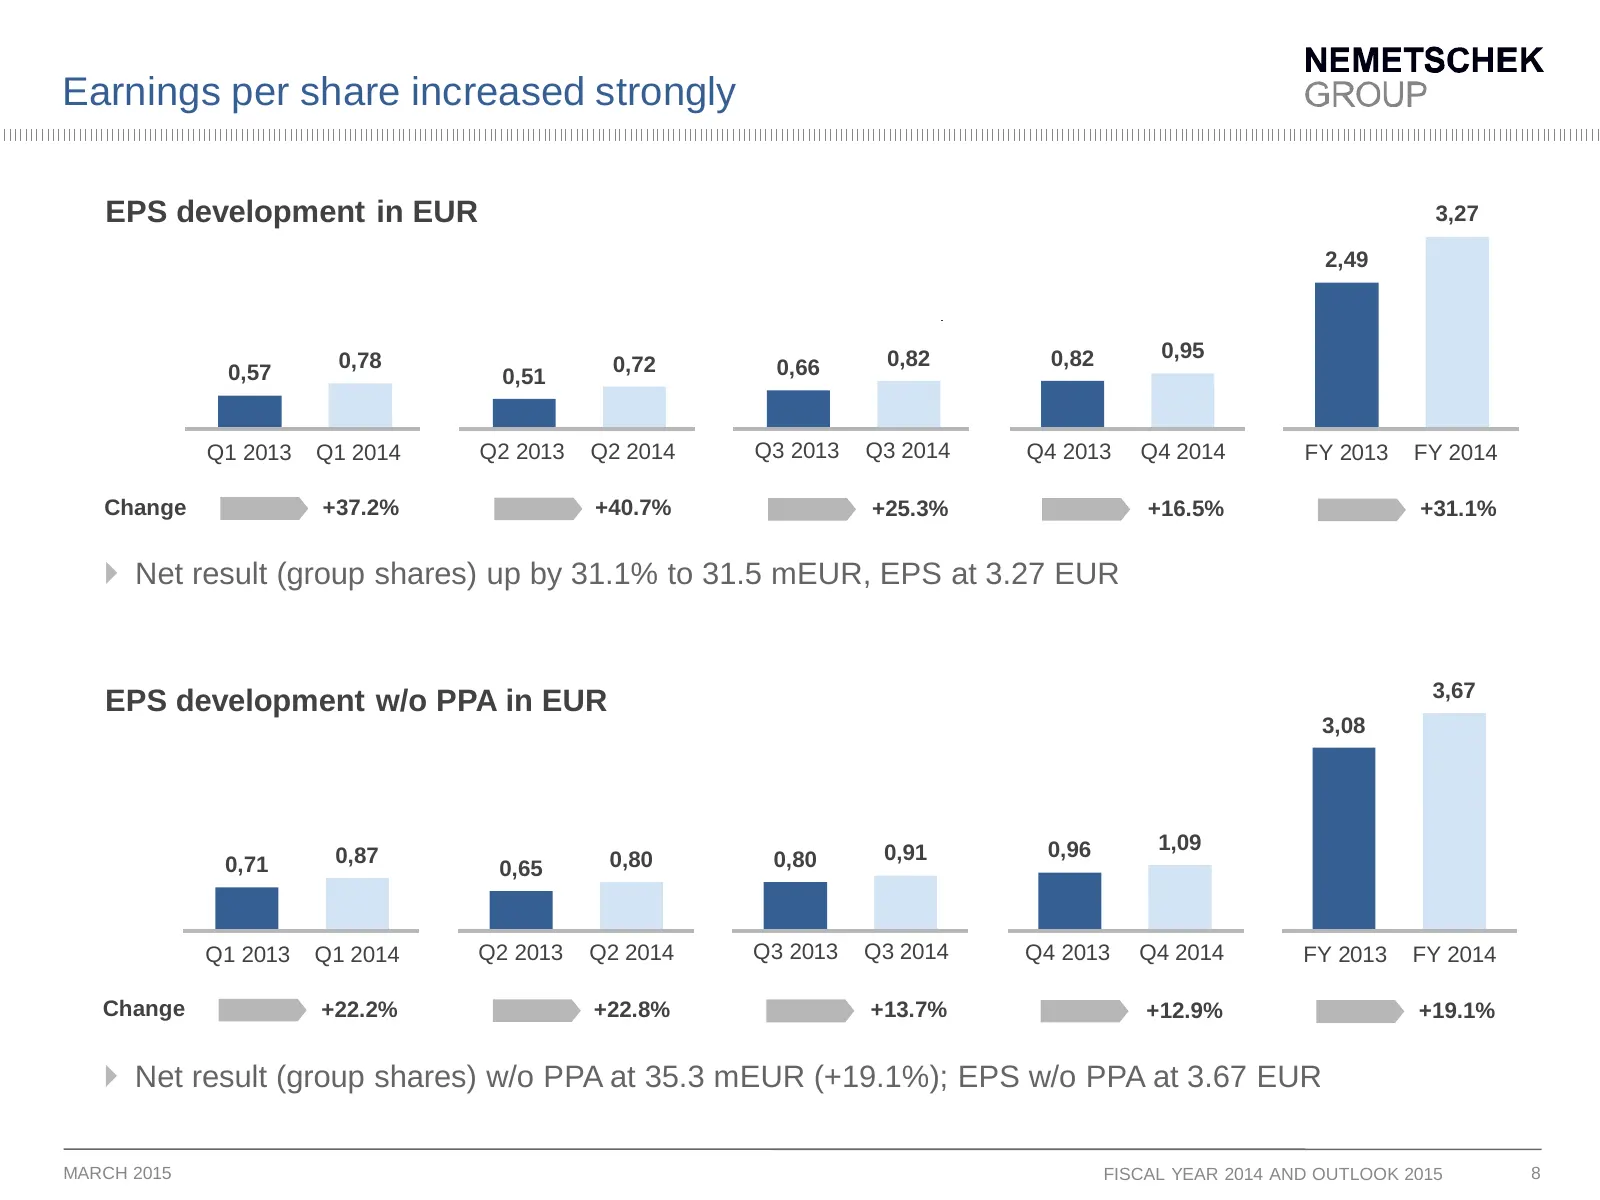
Earnings per share increased strongly EPS development in EUR 3,27 2,49 0,78 0,82 0,82 0,95 0,57 0,72 0,66 0,51 Q1 2013 Q1 2014 Q2 2013 Q2 2014 Q3 2013 Q3 2014 Q4 2013 Q4 2014 FY 2013 FY 2014 Change +37.2% +40.7% +25.3% +16.5% +31.1% Net result (group shares) up by 31.1% to 31.5 mEUR, EPS at 3.27 E
Slide 9: Segment overview
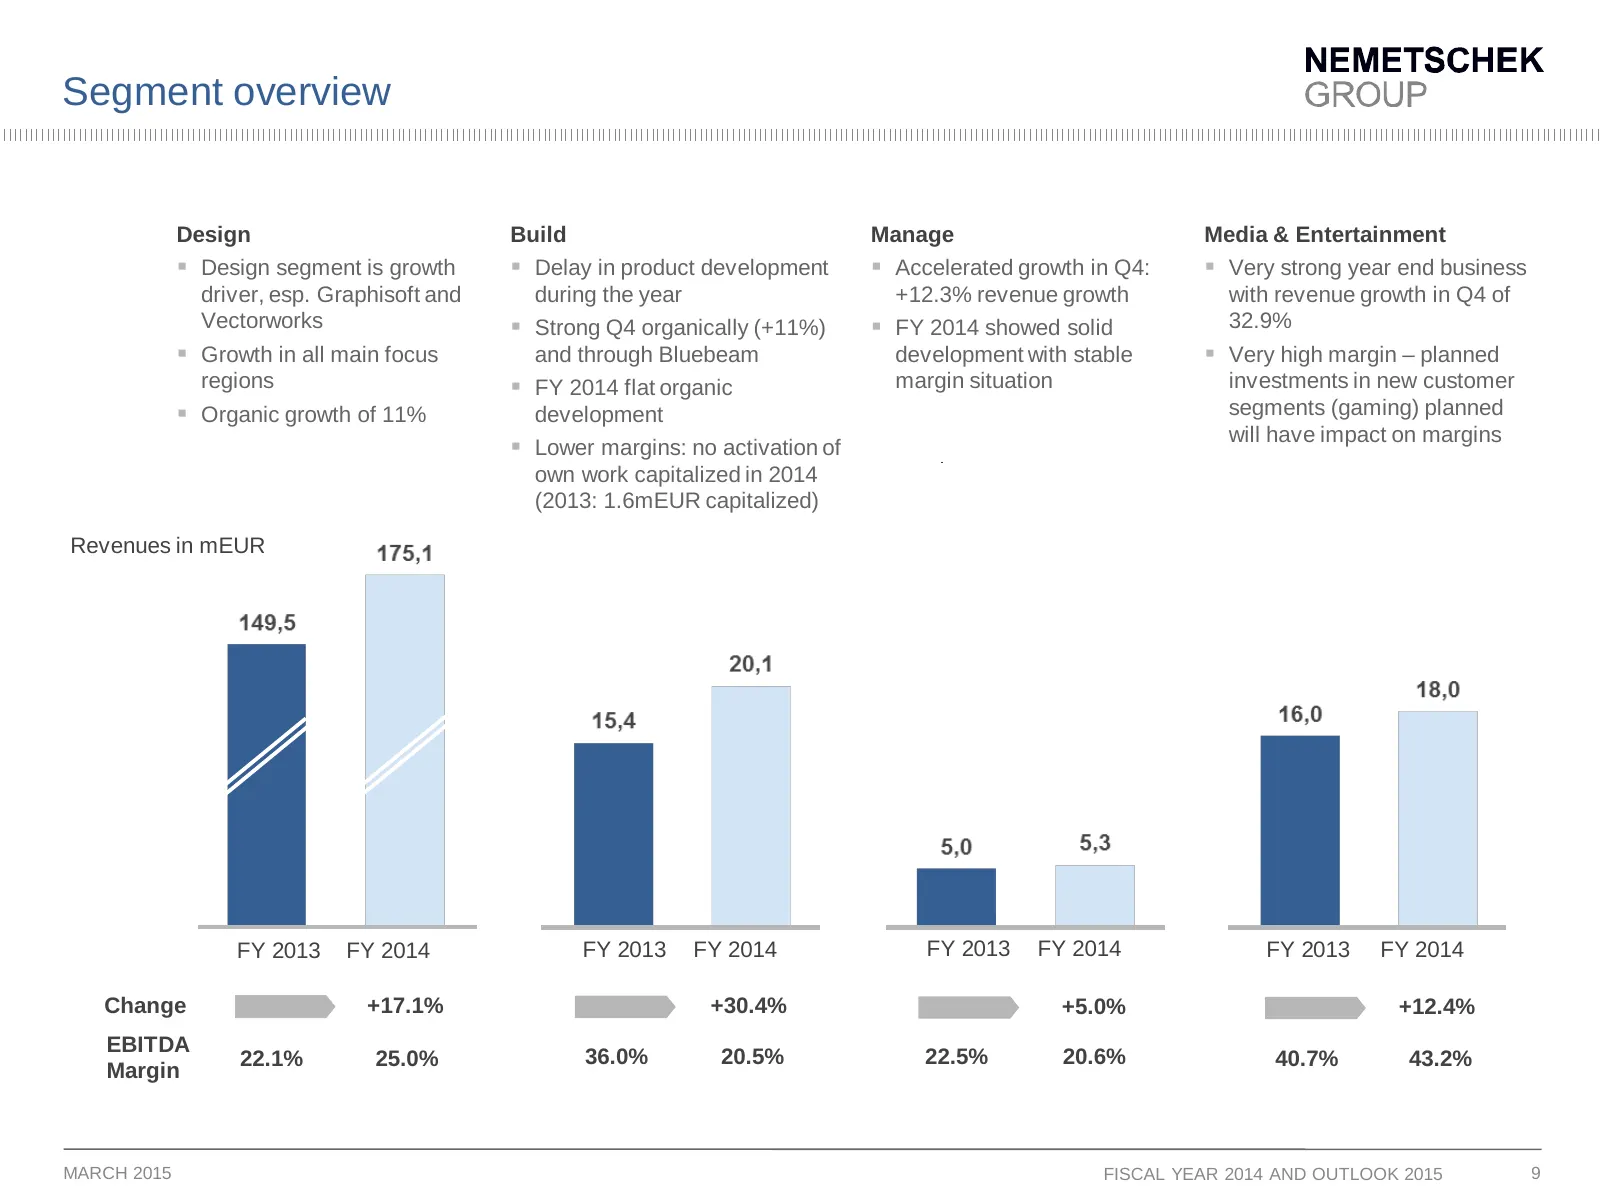
Segment overview Design Build Manage Media & Entertainment Design segment is growth Delay in product development Accelerated growth in Q4: Very strong year end business driver, esp. Graphisoft and during the year +12.3% revenue growth with revenue growth in Q4 of Vectorworks Strong Q4 orga
Slide 10: Cash flow situation
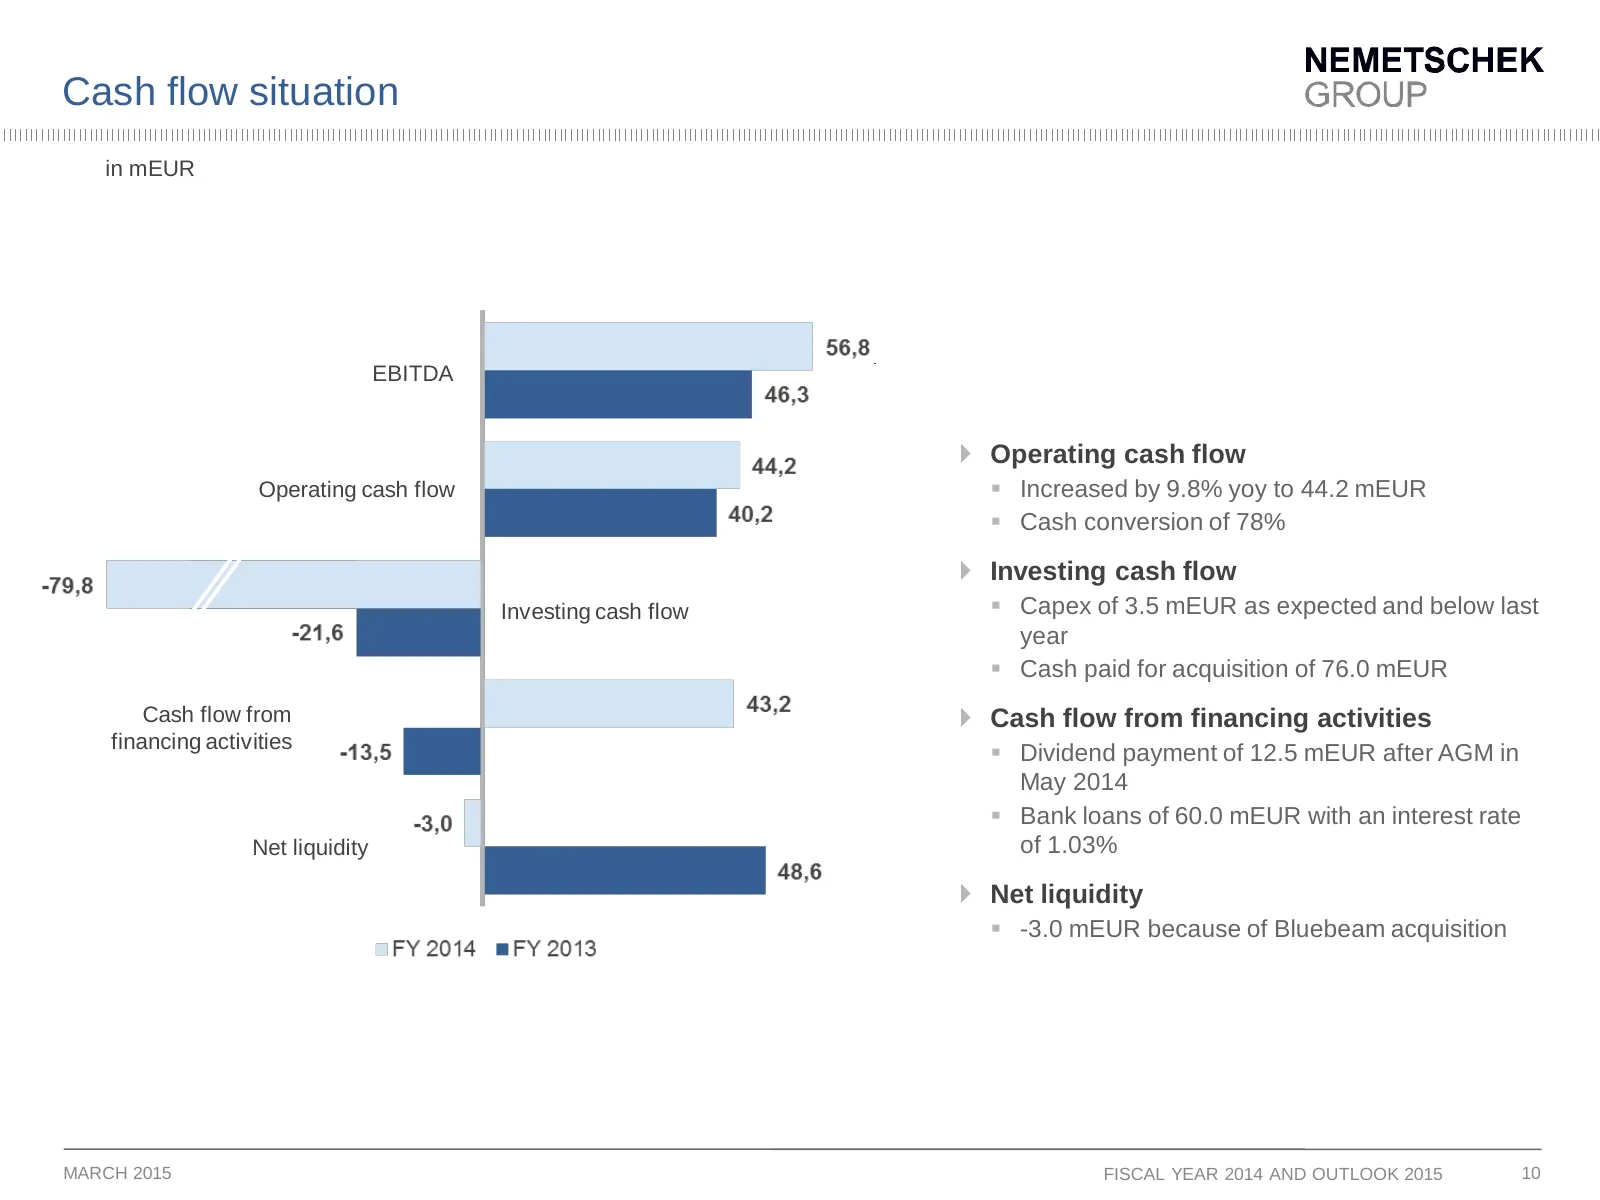
Cash flow situation in mEUR EBITDA Operating cash flow Operating cash flow Increased by 9.8% yoy to 44.2 mEUR Cash conversion of 78% Investing cash flow Investing cash flow Capex of 3.5 mEUR as expected and below last year Cash paid for acquisition of 76.0 mEUR Cash flow from Cash flow
Slide 11: Solid balance sheet
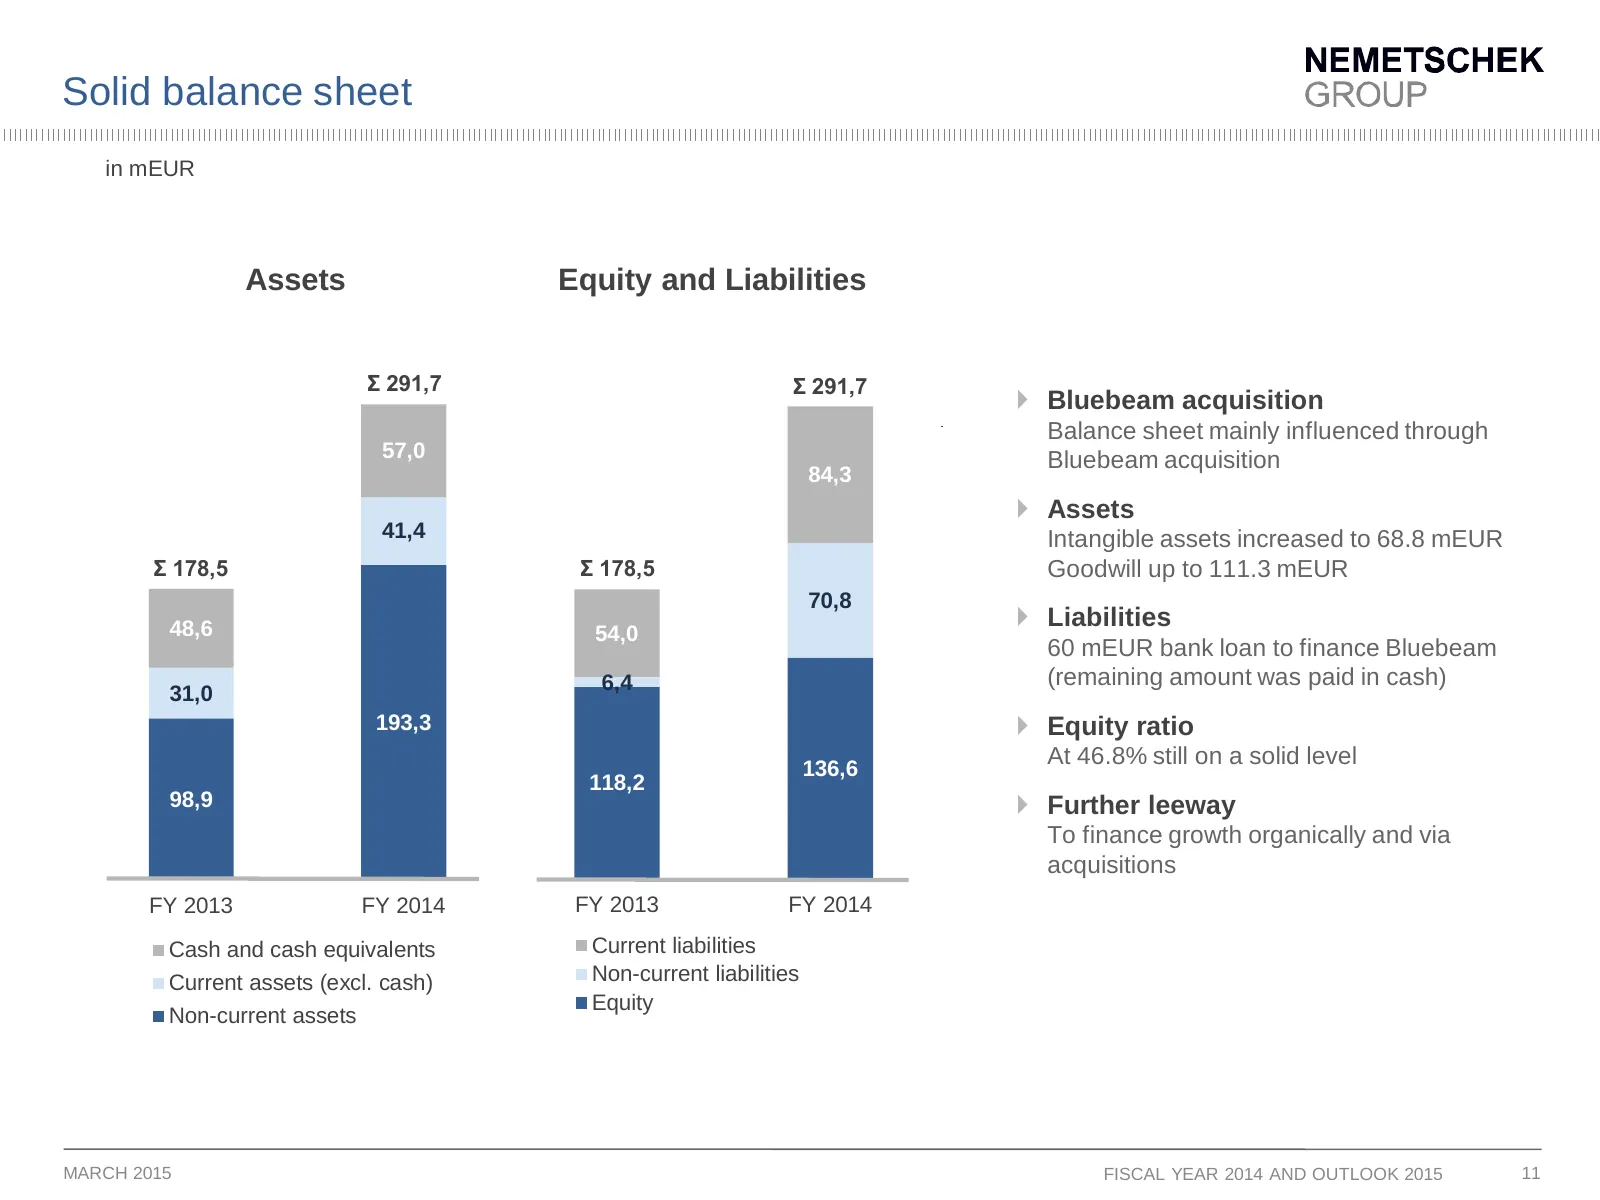
Solid balance sheet in mEUR Assets Equity and Liabilities Σ 291,7 Σ 291,7 Bluebeam acquisition Balance sheet mainly influenced through 57,0 Bluebeam acquisition 84,3 Assets 41,4 Intangible assets increased to 68.8 mEUR Σ 178,5 Σ 178,5 Goodwill up to 111.3 mEUR 70,8 48,6 Liabilities 54,0 60 mEU
Slide 12: Dividend payment of 1.60 EUR per share
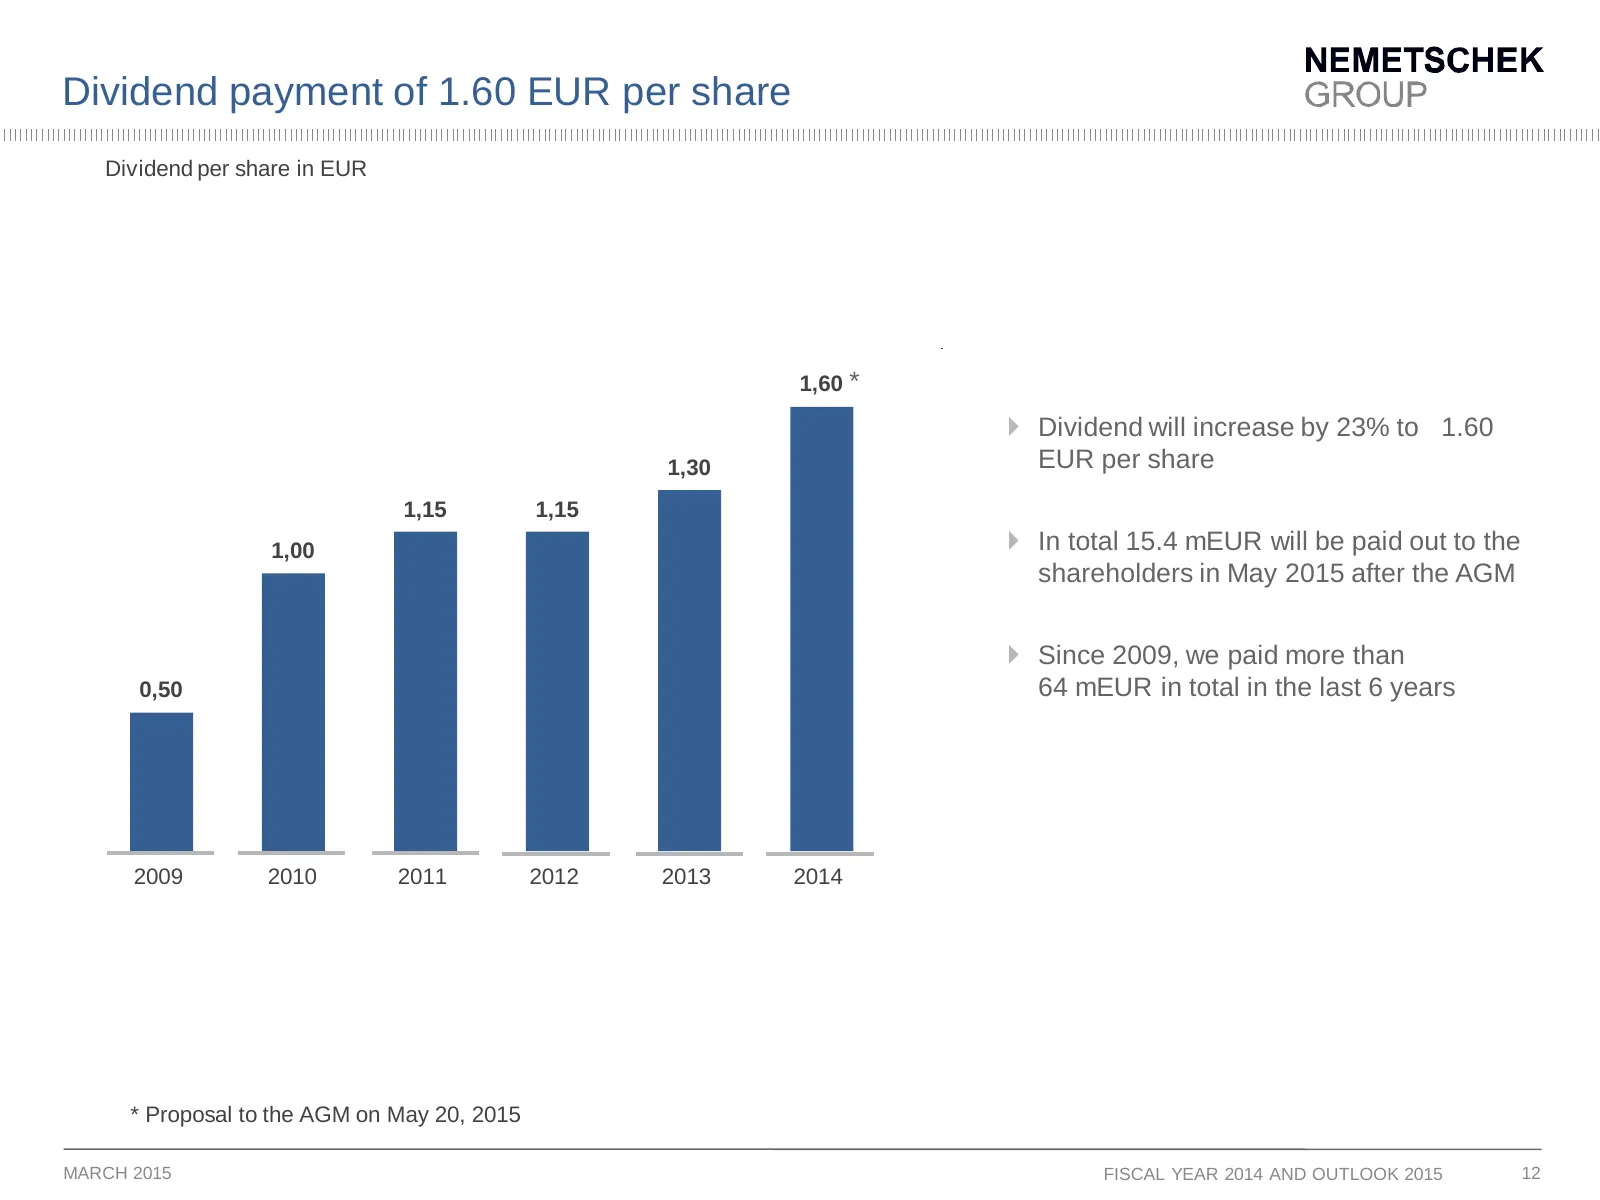
Dividend payment of 1.60 EUR per share Dividend per share in EUR 1,60 * Dividend will increase by 23% to 1.60 1,30 EUR per share 1,15 1,15 1,00 In total 15.4 mEUR will be paid out to the shareholders in May 2015 after the AGM Since 2009, we paid more than 0,50 64 mEUR in total in the last 6 ye
Slide 13: Optimistic outlook 2015
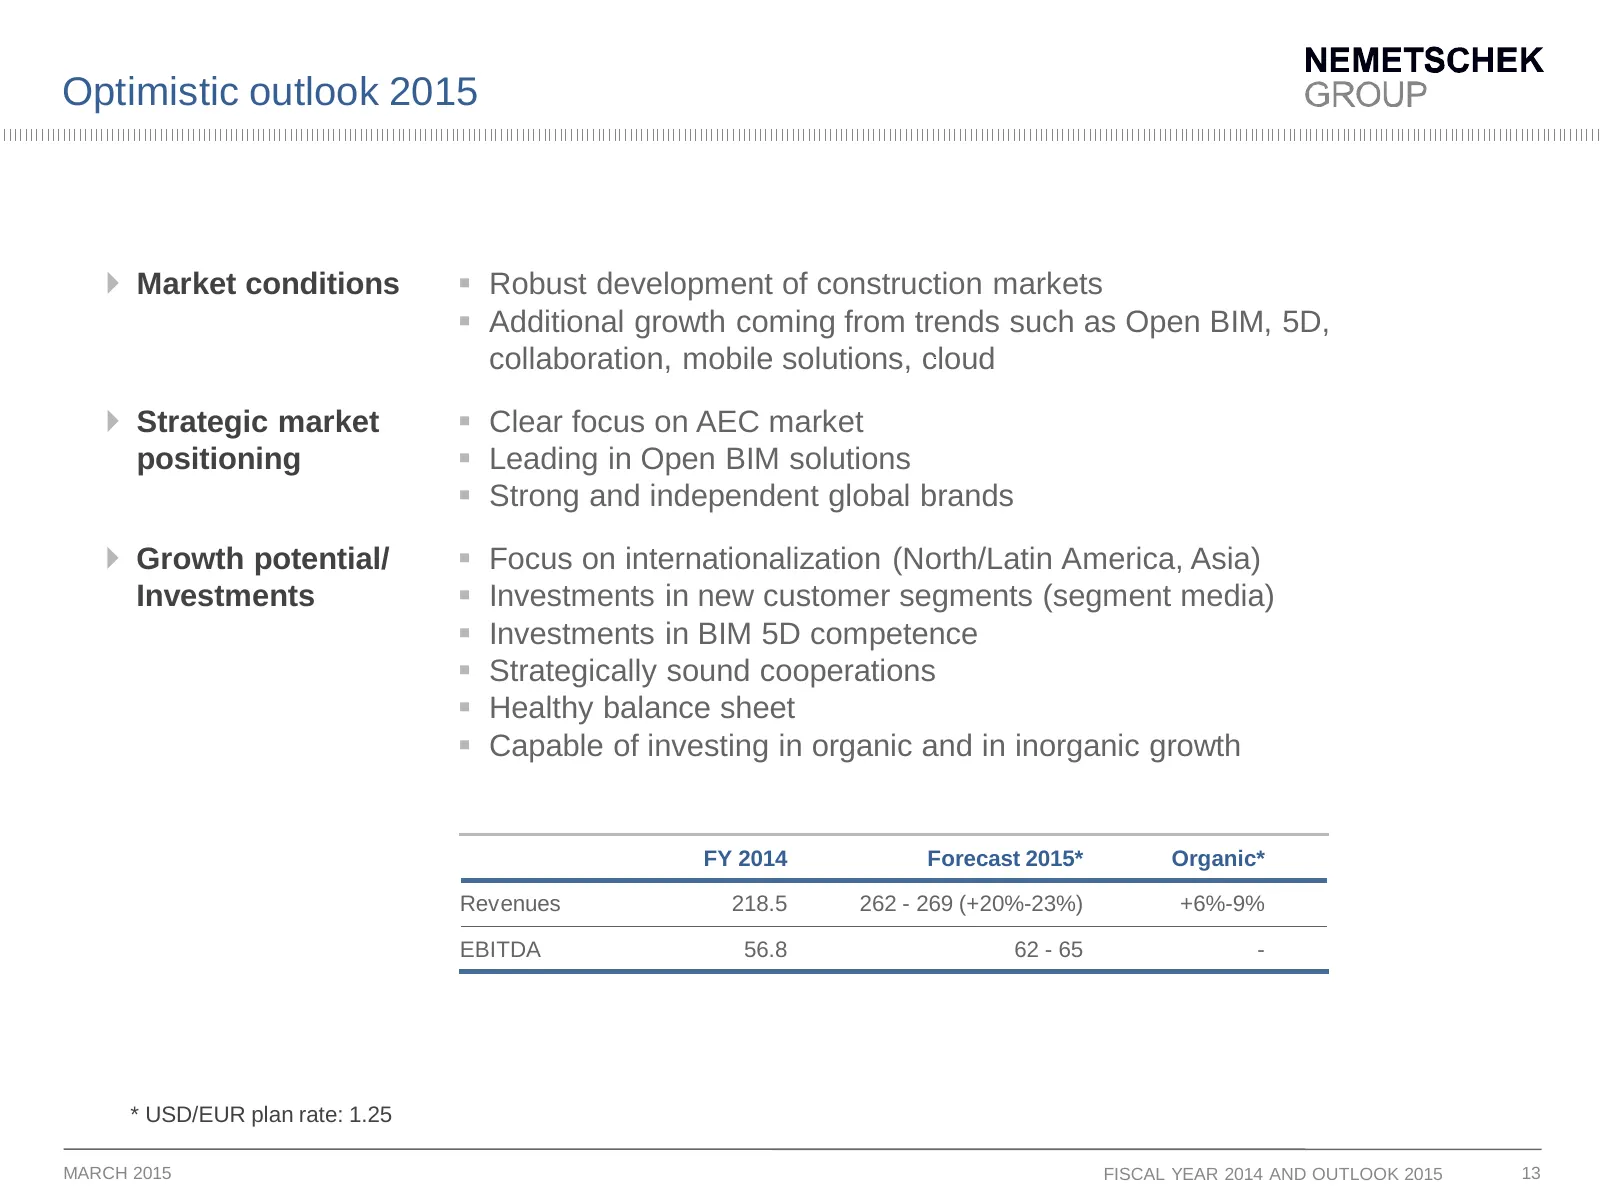
Optimistic outlook 2015 Market conditions Robust development of construction markets Additional growth coming from trends such as Open BIM, 5D, collaboration, mobile solutions, cloud Strategic market Clear focus on AEC market positioning Leading in Open BIM solutions Strong and indepen
Slide 14: Appendix
fash os Lf i \ tg va ba en os Hcy > Uae: NY eit
Slide 15: P+L statement Q4 / FY comparison
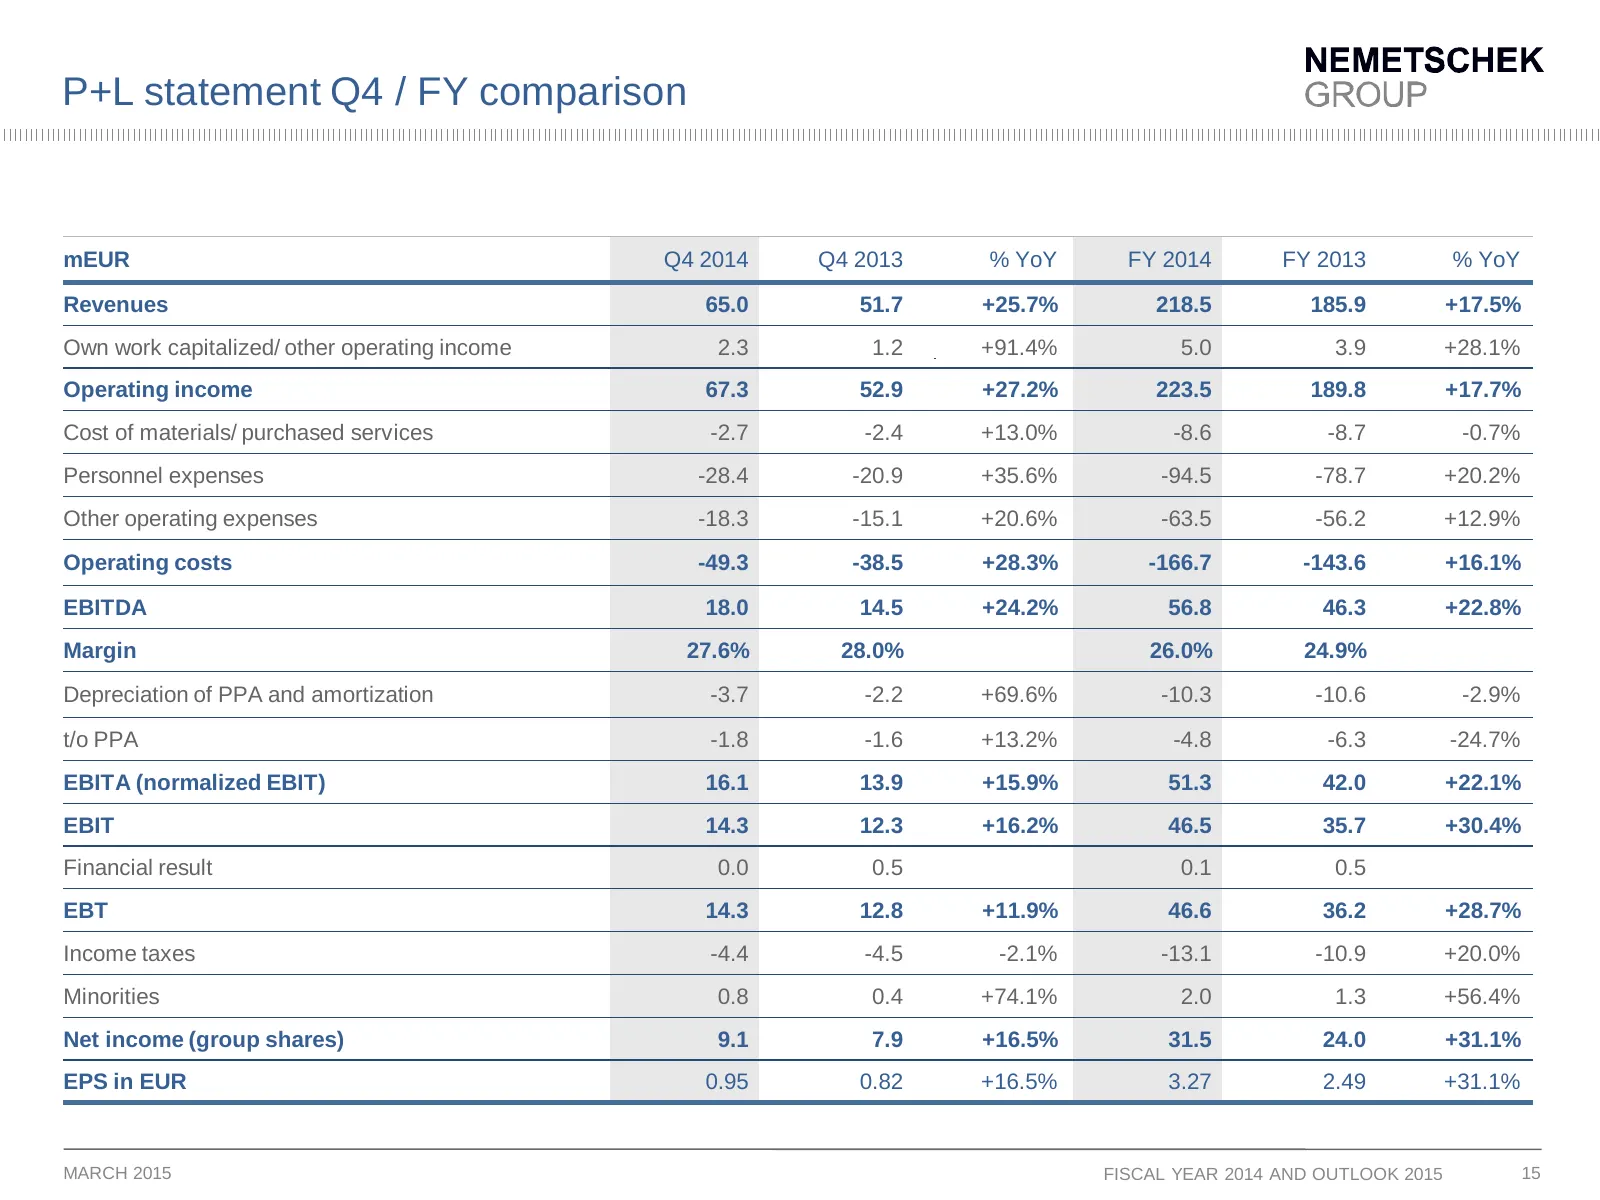
P+L statement Q4 / FY comparison mEUR Q4 2014 Q4 2013 % YoY FY 2014 FY 2013 % YoY Revenues 65.0 51.7 +25.7% 218.5 185.9 +17.5% Own work capitalized/ other operating income 2.3 1.2 +91.4% 5.0 3.9 +28.1% Operating income 67.3 52.9 +27.2% 223.5 189.8 +17.7% Cost of materials/ purchased services -2.7 -2
Slide 16: Balance sheet - Assets
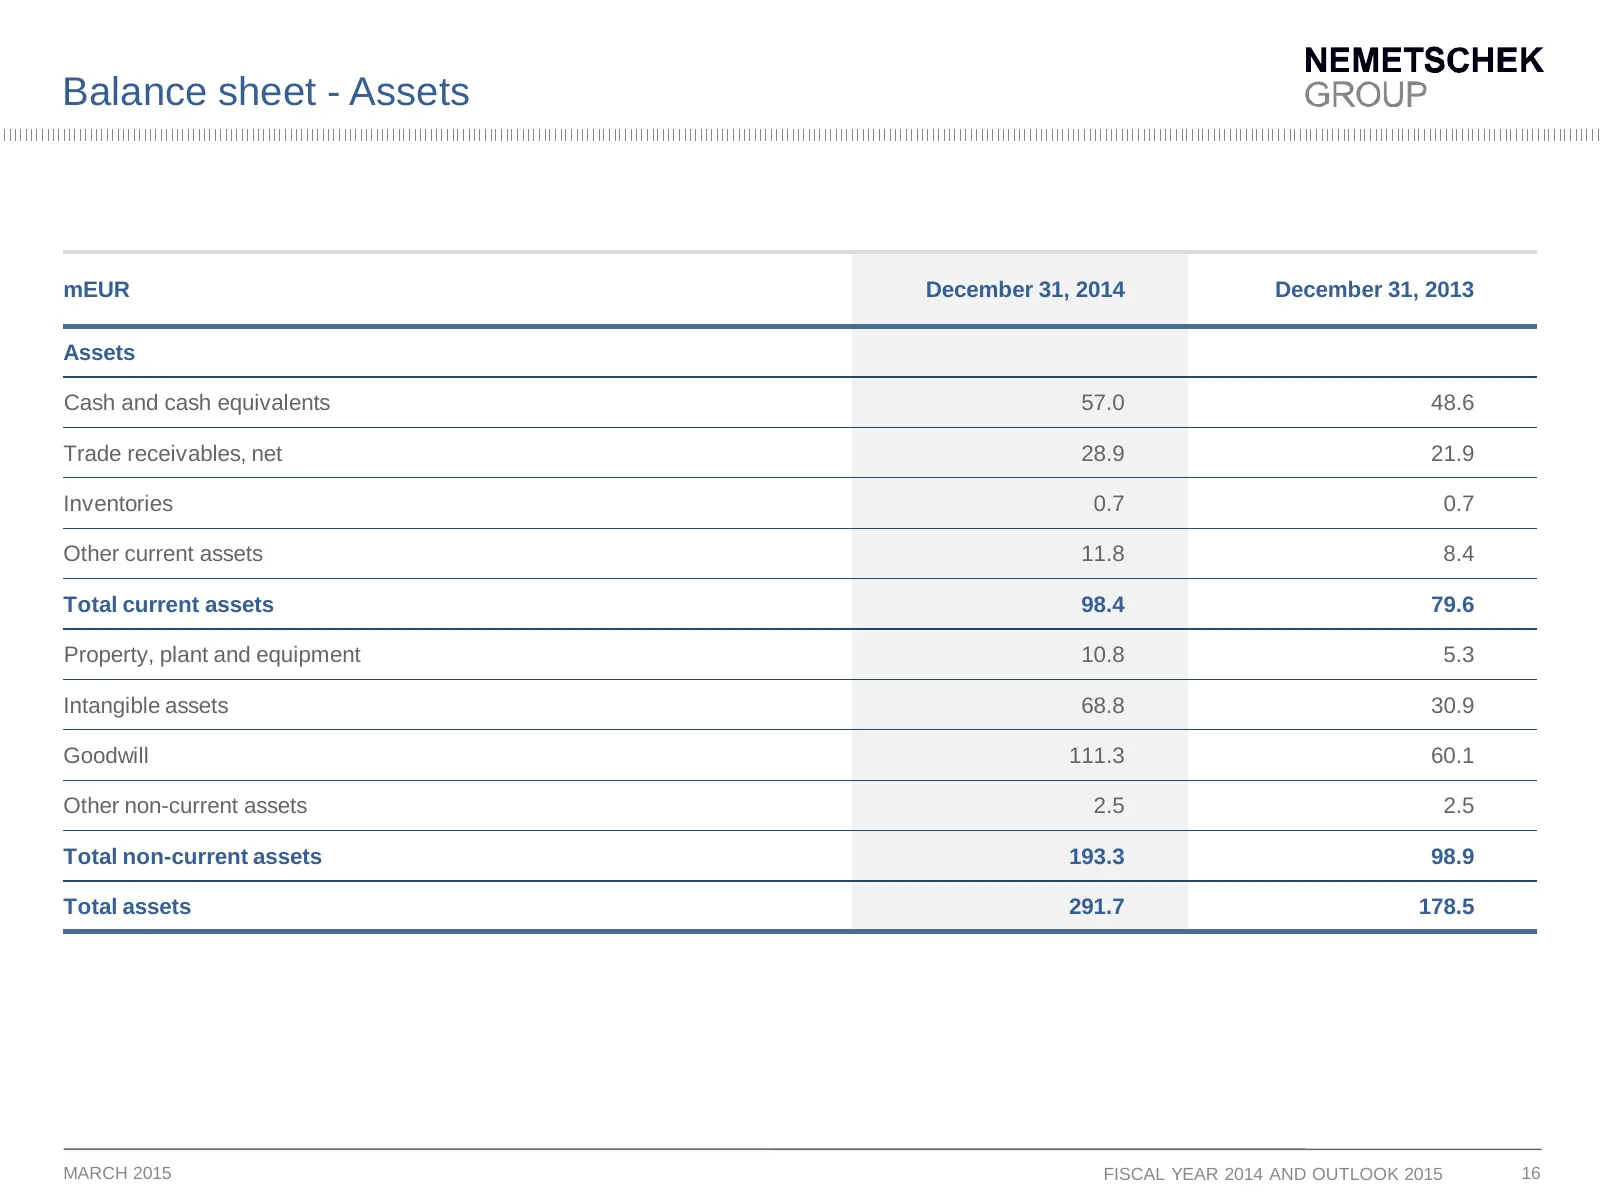
Balance sheet - Assets mEUR December 31, 2014 December 31, 2013 Assets Cash and cash equivalents 57.0 48.6 Trade receivables, net 28.9 21.9 Inventories 0.7 0.7 Other current assets 11.8 8.4 Total current assets 98.4 79.6 Property, plant and equipment 10.8 5.3 Intangible assets 68.8 30.9 Goodwill 111
Slide 17: Balance sheet – Equity and liabilities
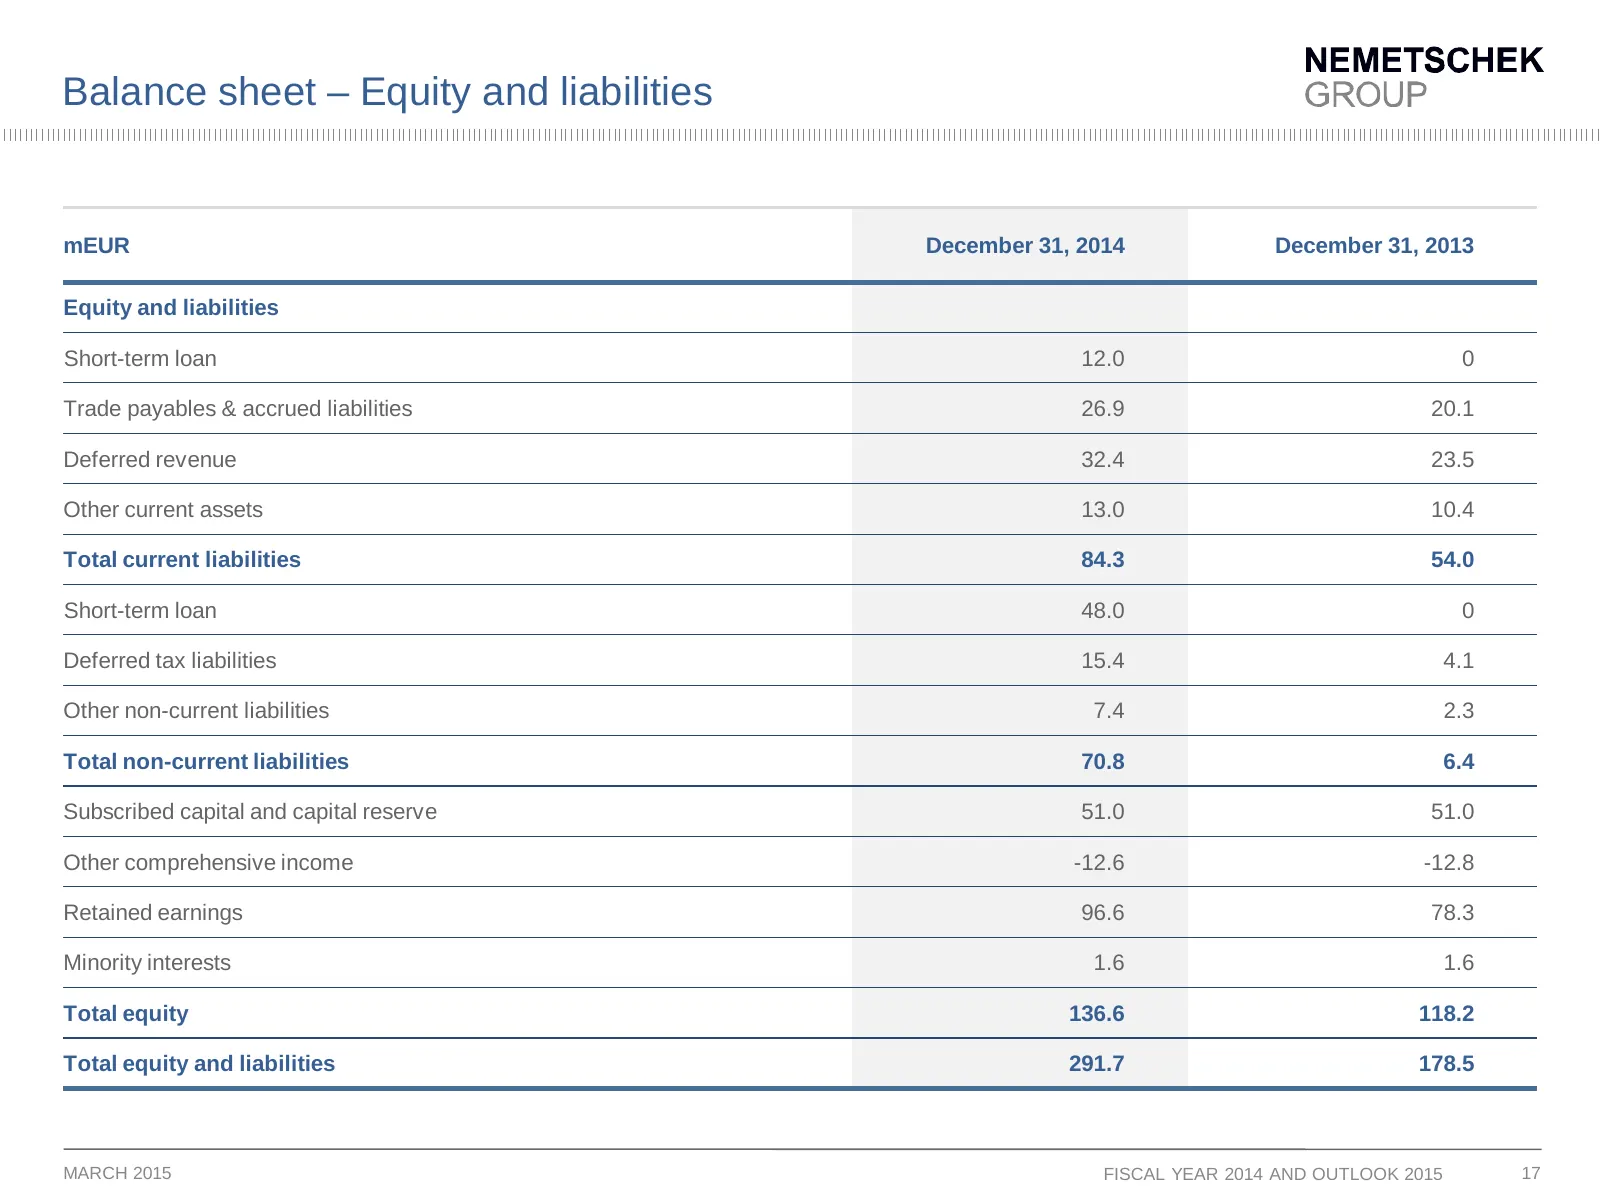
Balance sheet – Equity and liabilities mEUR December 31, 2014 December 31, 2013 Equity and liabilities Short-term loan 12.0 0 Trade payables & accrued liabilities 26.9 20.1 Deferred revenue 32.4 23.5 Other current assets 13.0 10.4 Total current liabilities 84.3 54.0 Short-term loan 48.0 0 Deferred t
Slide 18: Cash flow statement
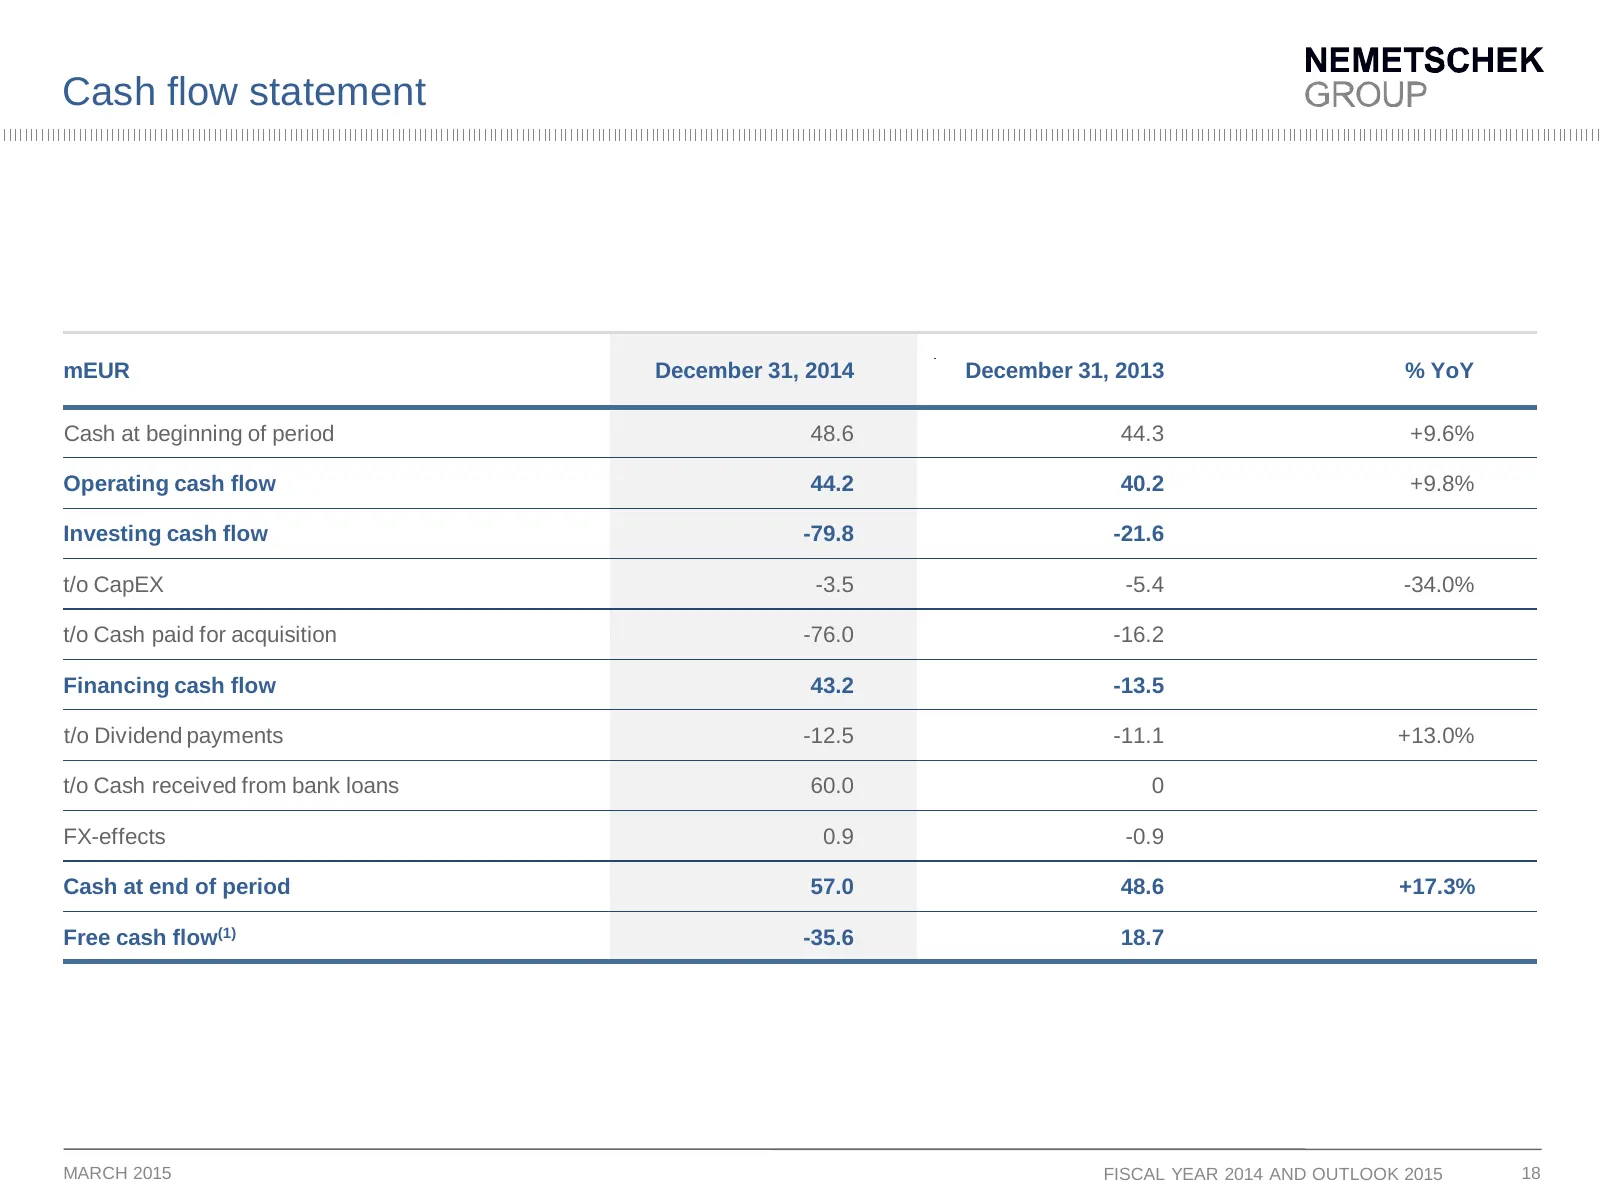
Cash flow statement mEUR December 31, 2014 December 31, 2013 % YoY Cash at beginning of period 48.6 44.3 +9.6% Operating cash flow 44.2 40.2 +9.8% Investing cash flow -79.8 -21.6 t/o CapEX -3.5 -5.4 -34.0% t/o Cash paid for acquisition -76.0 -16.2 Financing cash flow 43.2 -13.5 t/o Dividend payments

Slide 19: Disclaimer
Disclaimer This presentation contains forward-looking statements based on the beliefs of Nemetschek AG management. Such statements reflect current views of Nemetschek AG with respect to future events and results and are subject to risks and uncertainties. Actual results may vary materially from thos
Source: Internet Archive copy of ir.nemetschek.com
More decks from Nemetschek SE
 Q3 2026 Earnings Presentation20 slides · Nov 5, 2026
 Q2 2026 Earnings Presentation19 slides · Jul 30, 2026
 Q1 2026 Earnings Presentation19 slides · Apr 30, 2026
 Merger or Acquisition (April 2026)24 slides · April 2026
 FY2025 Earnings Presentation21 slides · Mar 19, 2026
 Investor Presentation (August 2025)15 slides · August 2025