Renishaw plc · LSE:RSW
Renishaw — FY2013 Earnings Presentation
38 slides from Renishaw's earnings presentation, Jul 24, 2013
Slide 1: 2013 results
2013 results 24th July 2013 Renishaw plc 1
Slide 2: Introduction
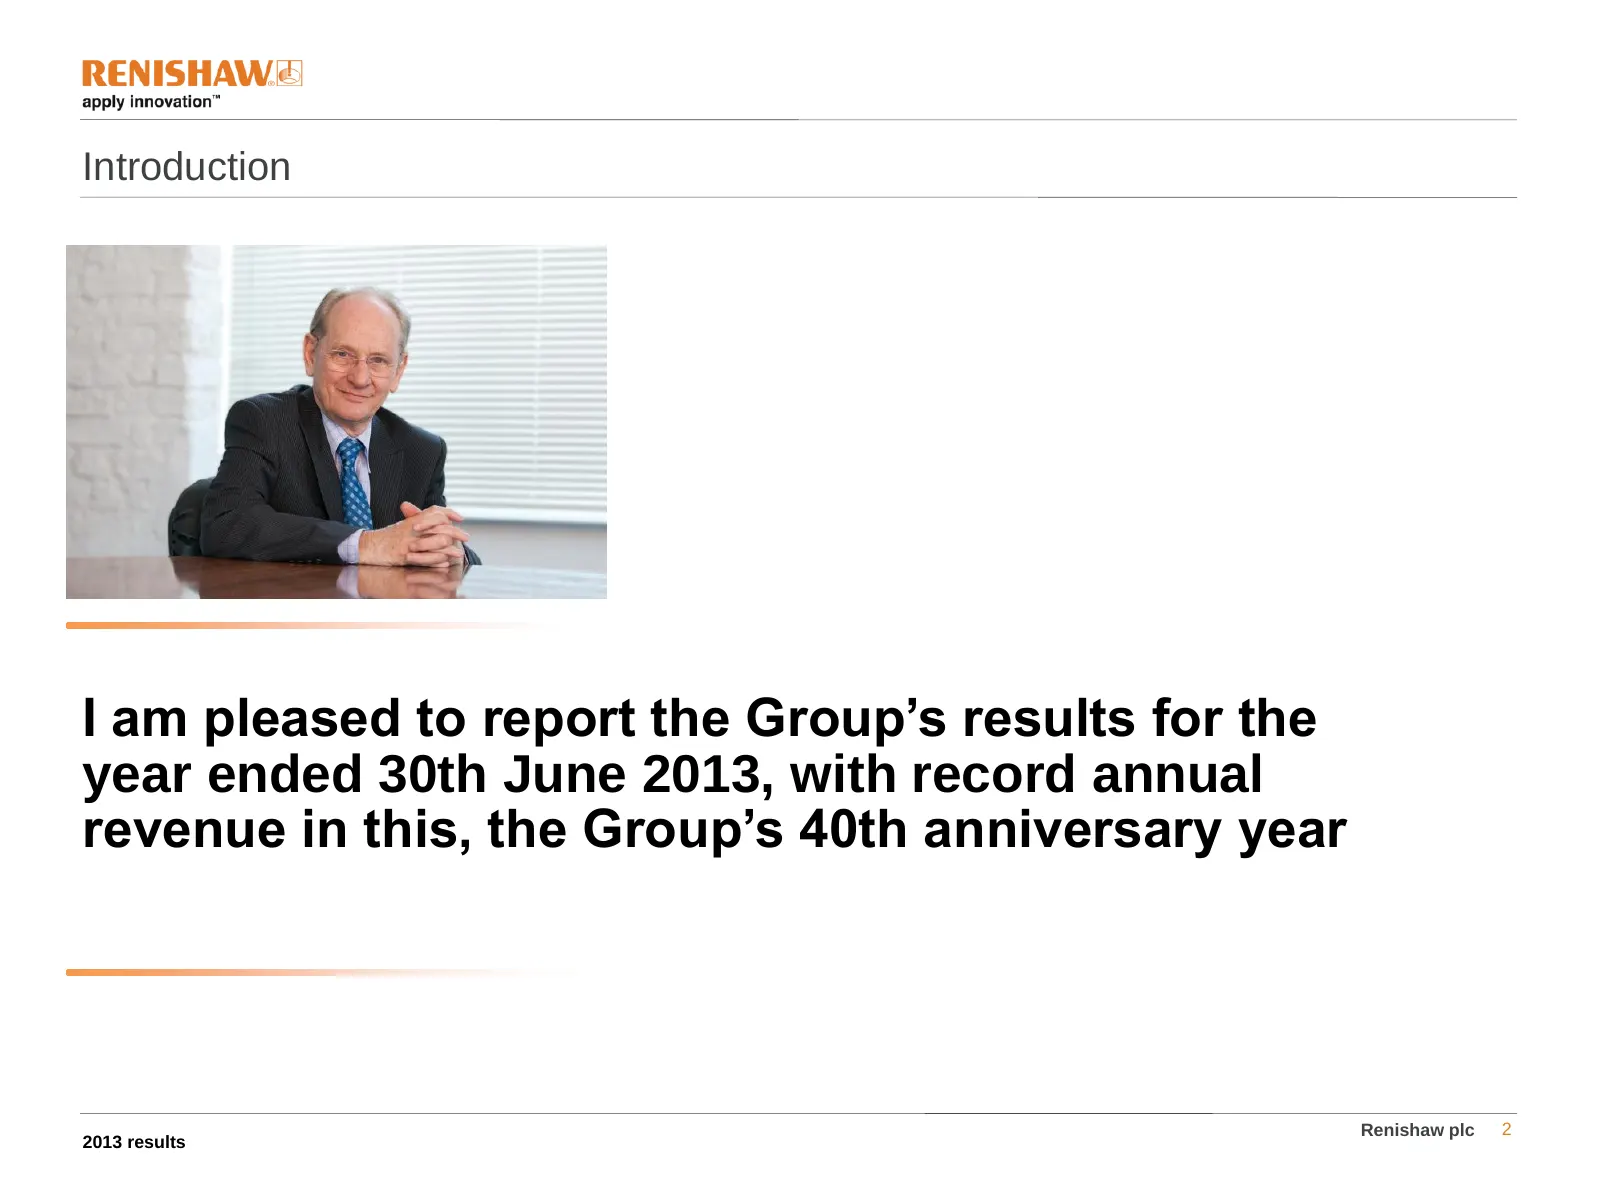
Introduction I am pleased to report the Group’s results for the year ended 30th June 2013, with record annual revenue in this, the Group’s 40th anniversary year Renishaw plc 2 2013 results
Slide 3: Chairman's statement highlights
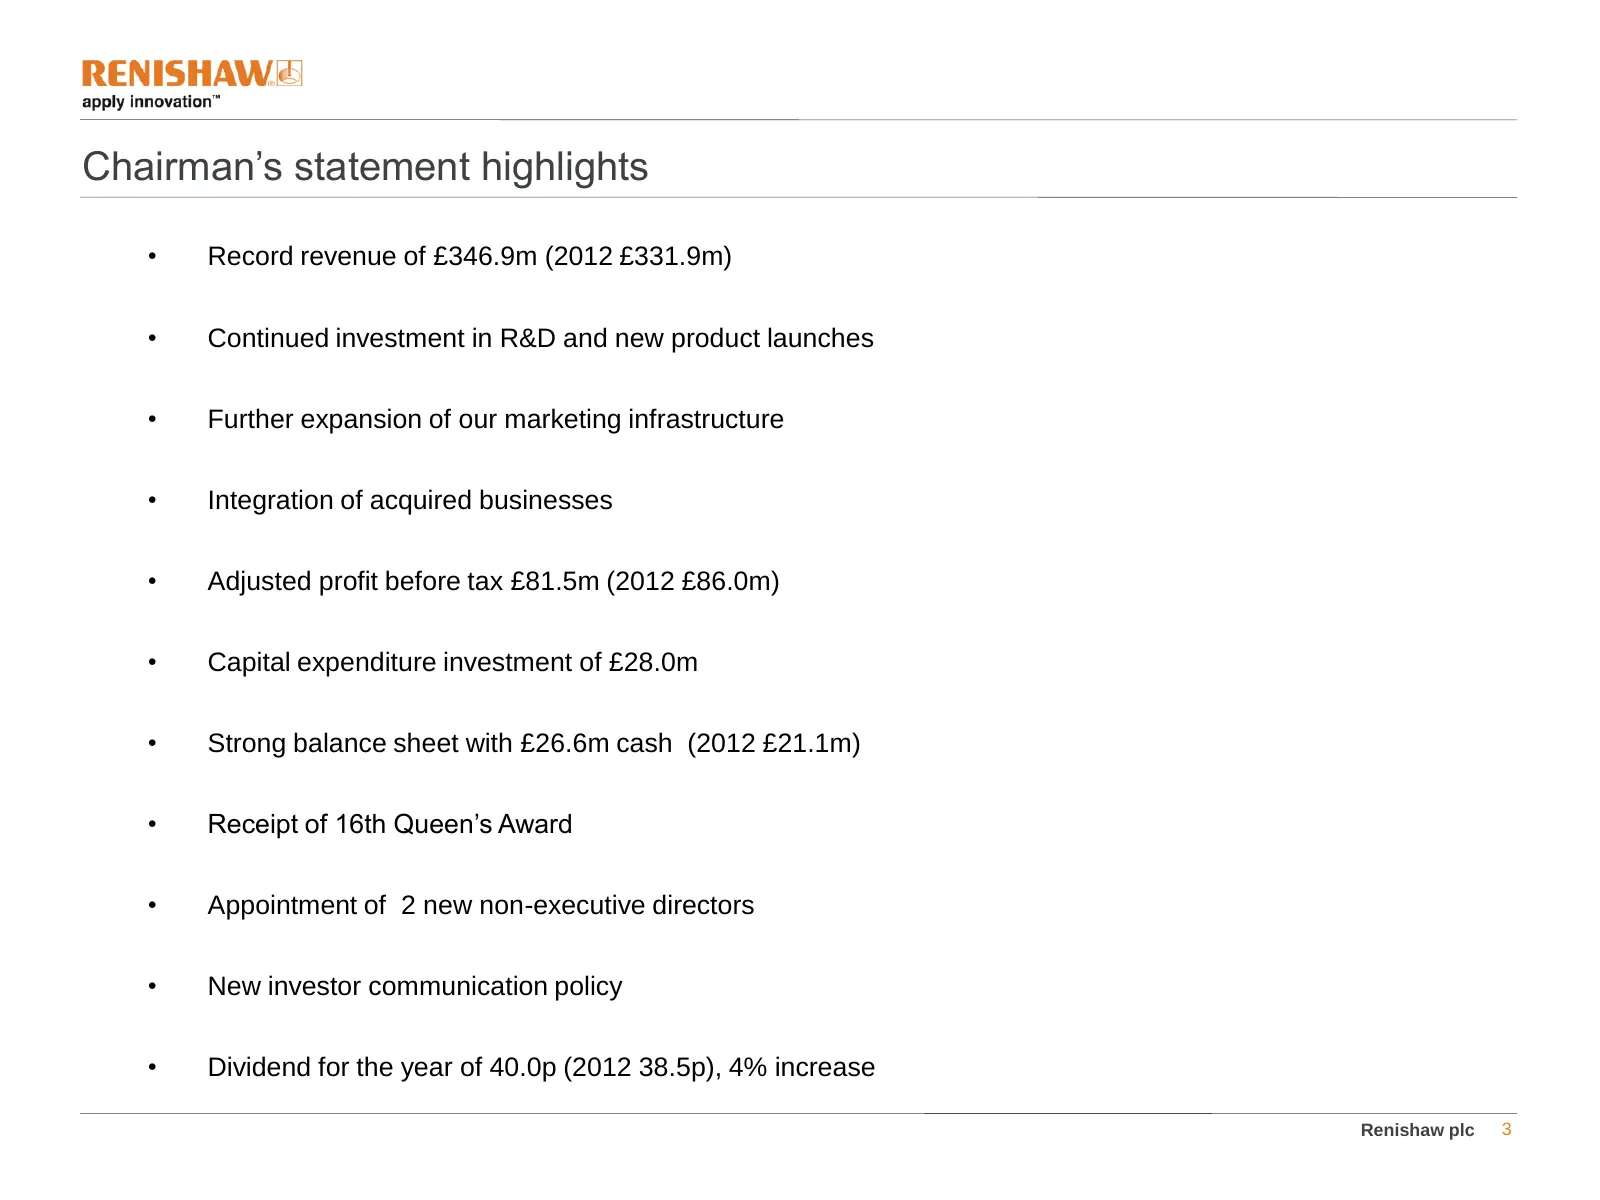
Chairman’s statement highlights • Record revenue of £346.9m (2012 £331.9m) • Continued investment in R&D and new product launches • Further expansion of our marketing infrastructure • Integration of acquired businesses • Adjusted profit before tax £81.5m (2012 £86.0m) • Capital expenditure investmen
Slide 4: Financial highlights
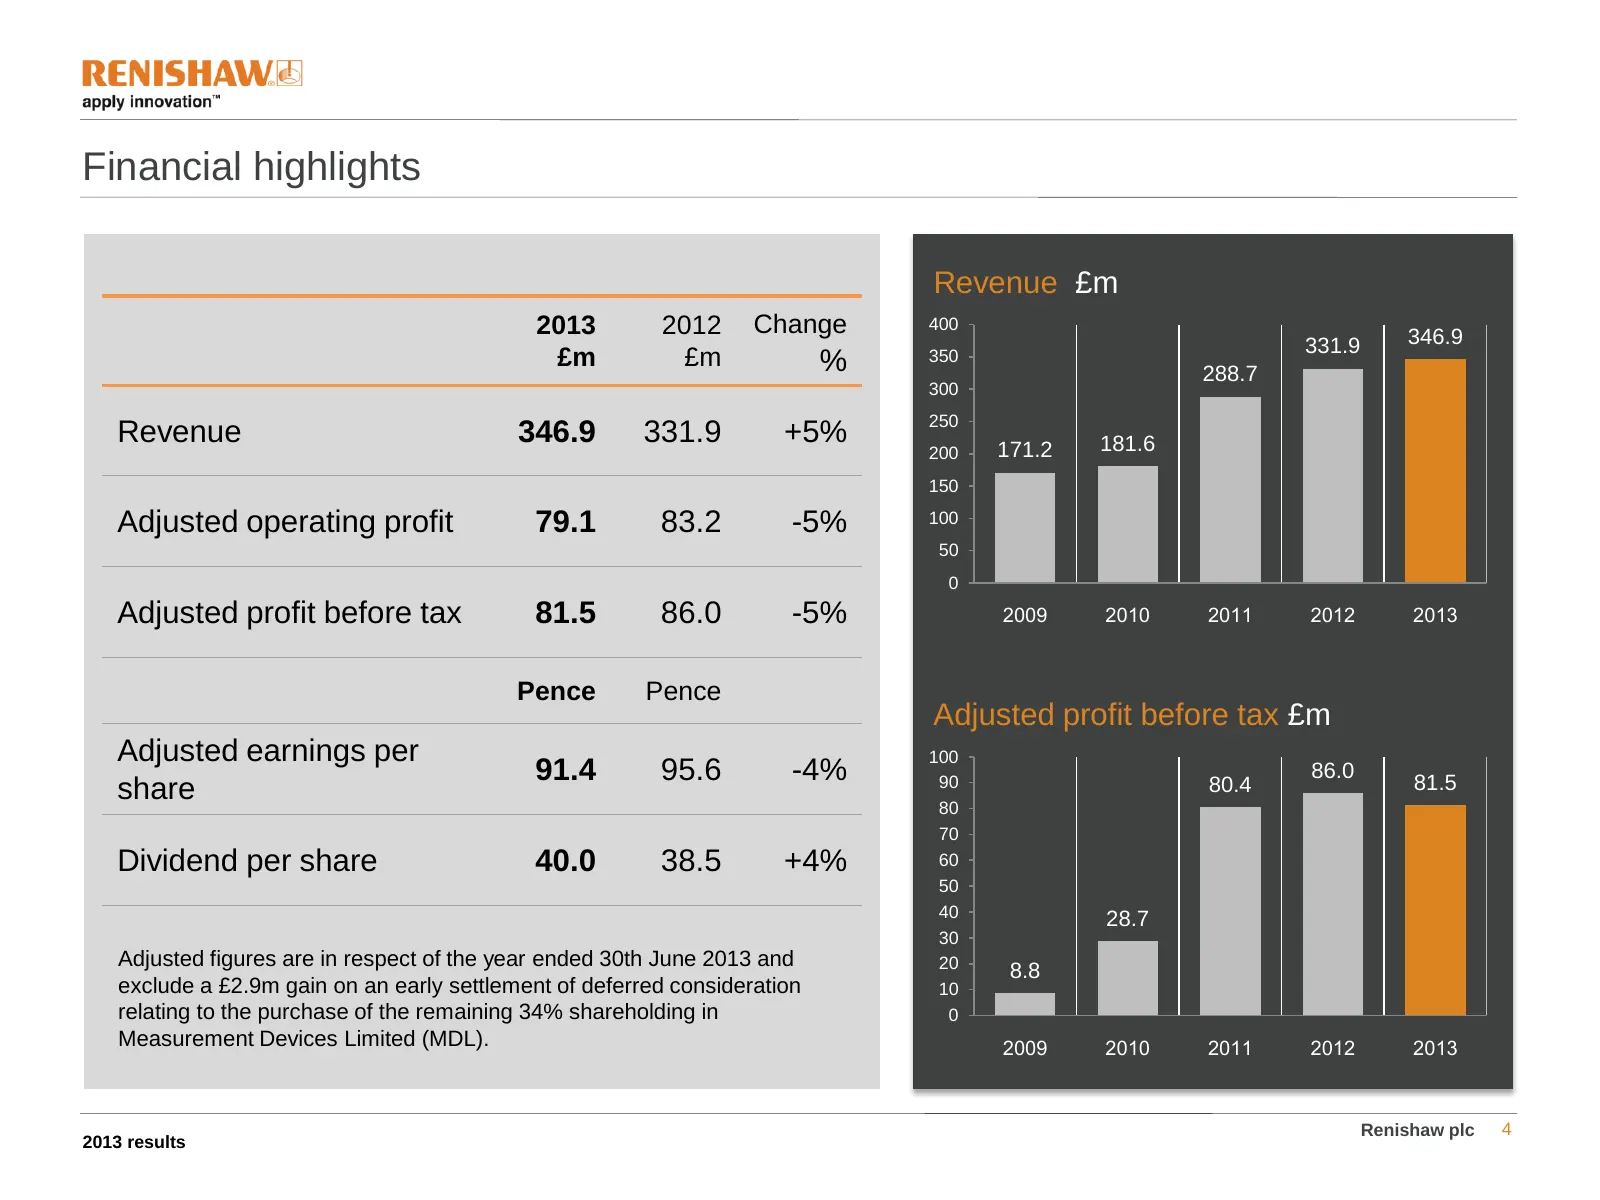
Financial highlights Revenue £m 2013 2012 Change 400 346.9 331.9 £m £m % 350 288.7 300 250 Revenue 346.9 331.9 +5% 171.2 181.6 200 150 Adjusted operating profit 79.1 83.2 -5% 100 50 0 Adjusted profit before tax 81.5 86.0 -5% 2009 2010 2011 2012 2013 Pence Pence Adjusted profit before tax £m Adjusted
Slide 5: Income statement
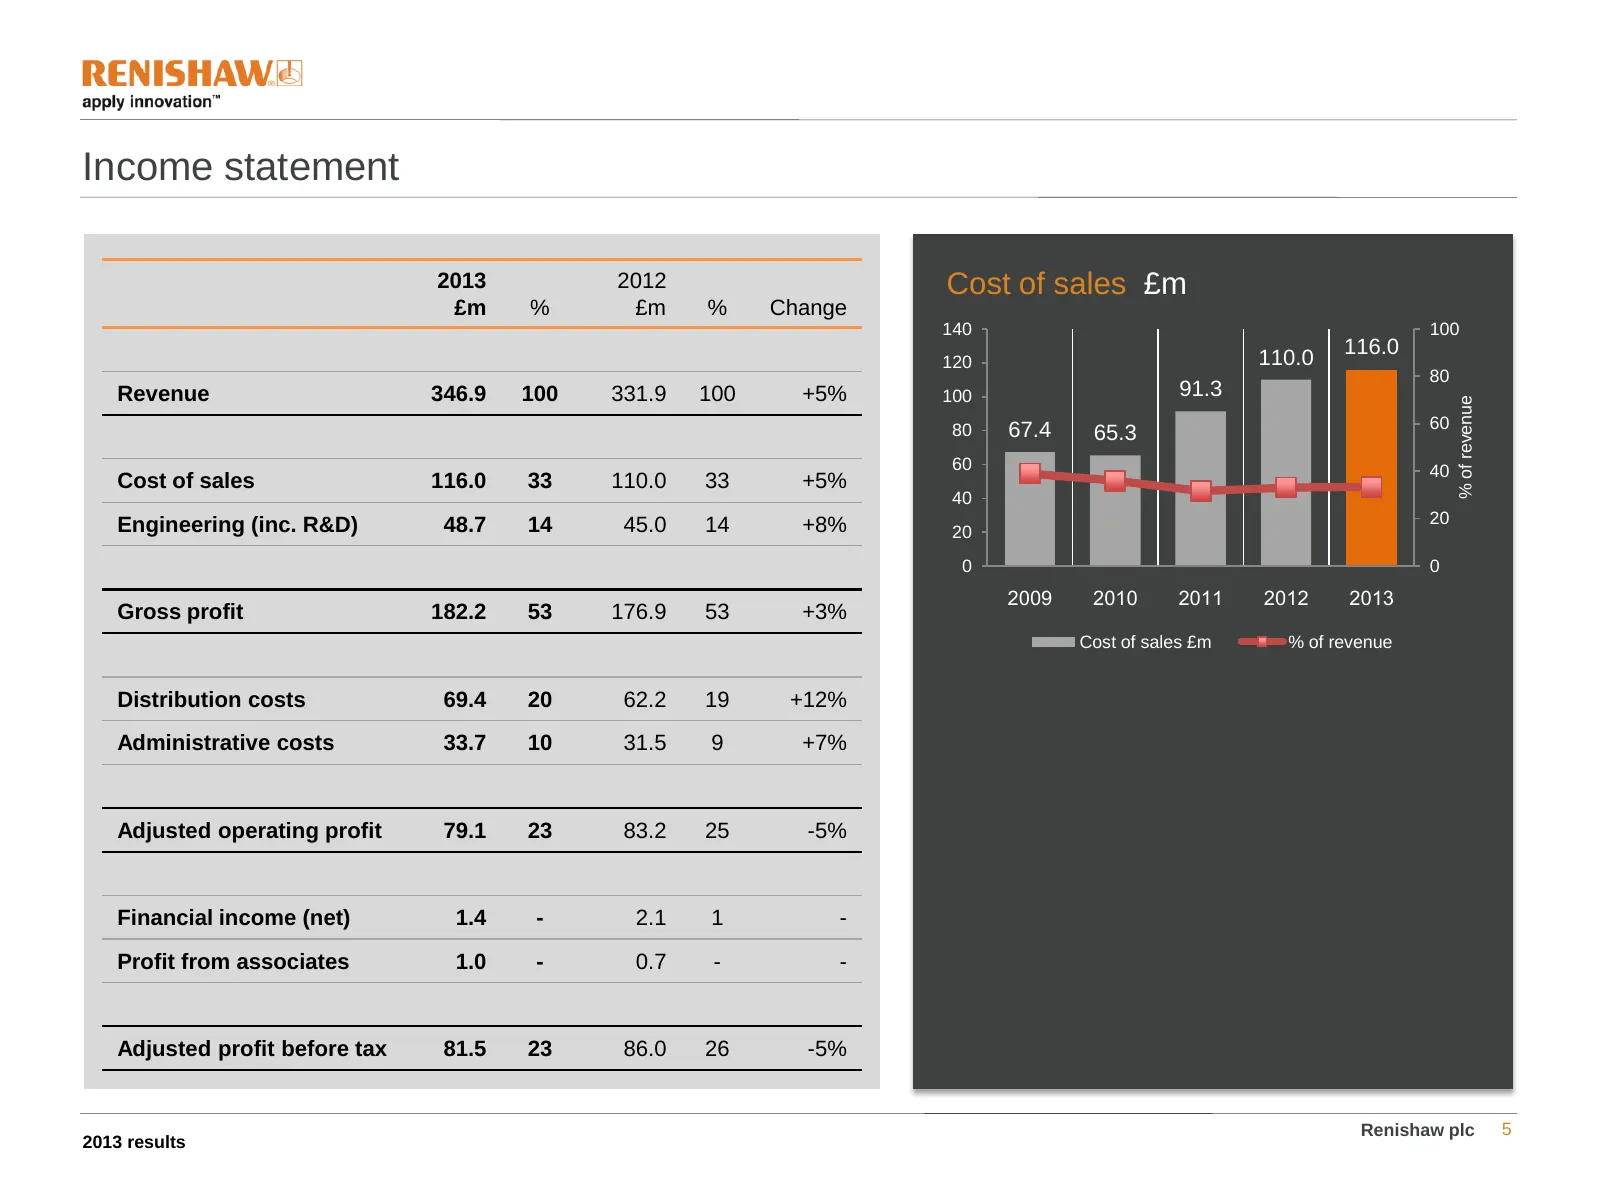
Income statement 2013 2012 Cost of sales £m £m % £m % Change 140 100 110.0 116.0 120 80 Revenue 346.9 100 331.9 100 +5% 100 91.3 % of revenue 80 67.4 60 65.3 60 40 Cost of sales 116.0 33 110.0 33 +5% 40 Engineering (inc. R&D) 48.7 14 45.0 14 +8% 20 20 0 0 2009 2010 2011 2012 2013 Gross profit 182.2
Slide 6: Income statement – Adjusted operating profit
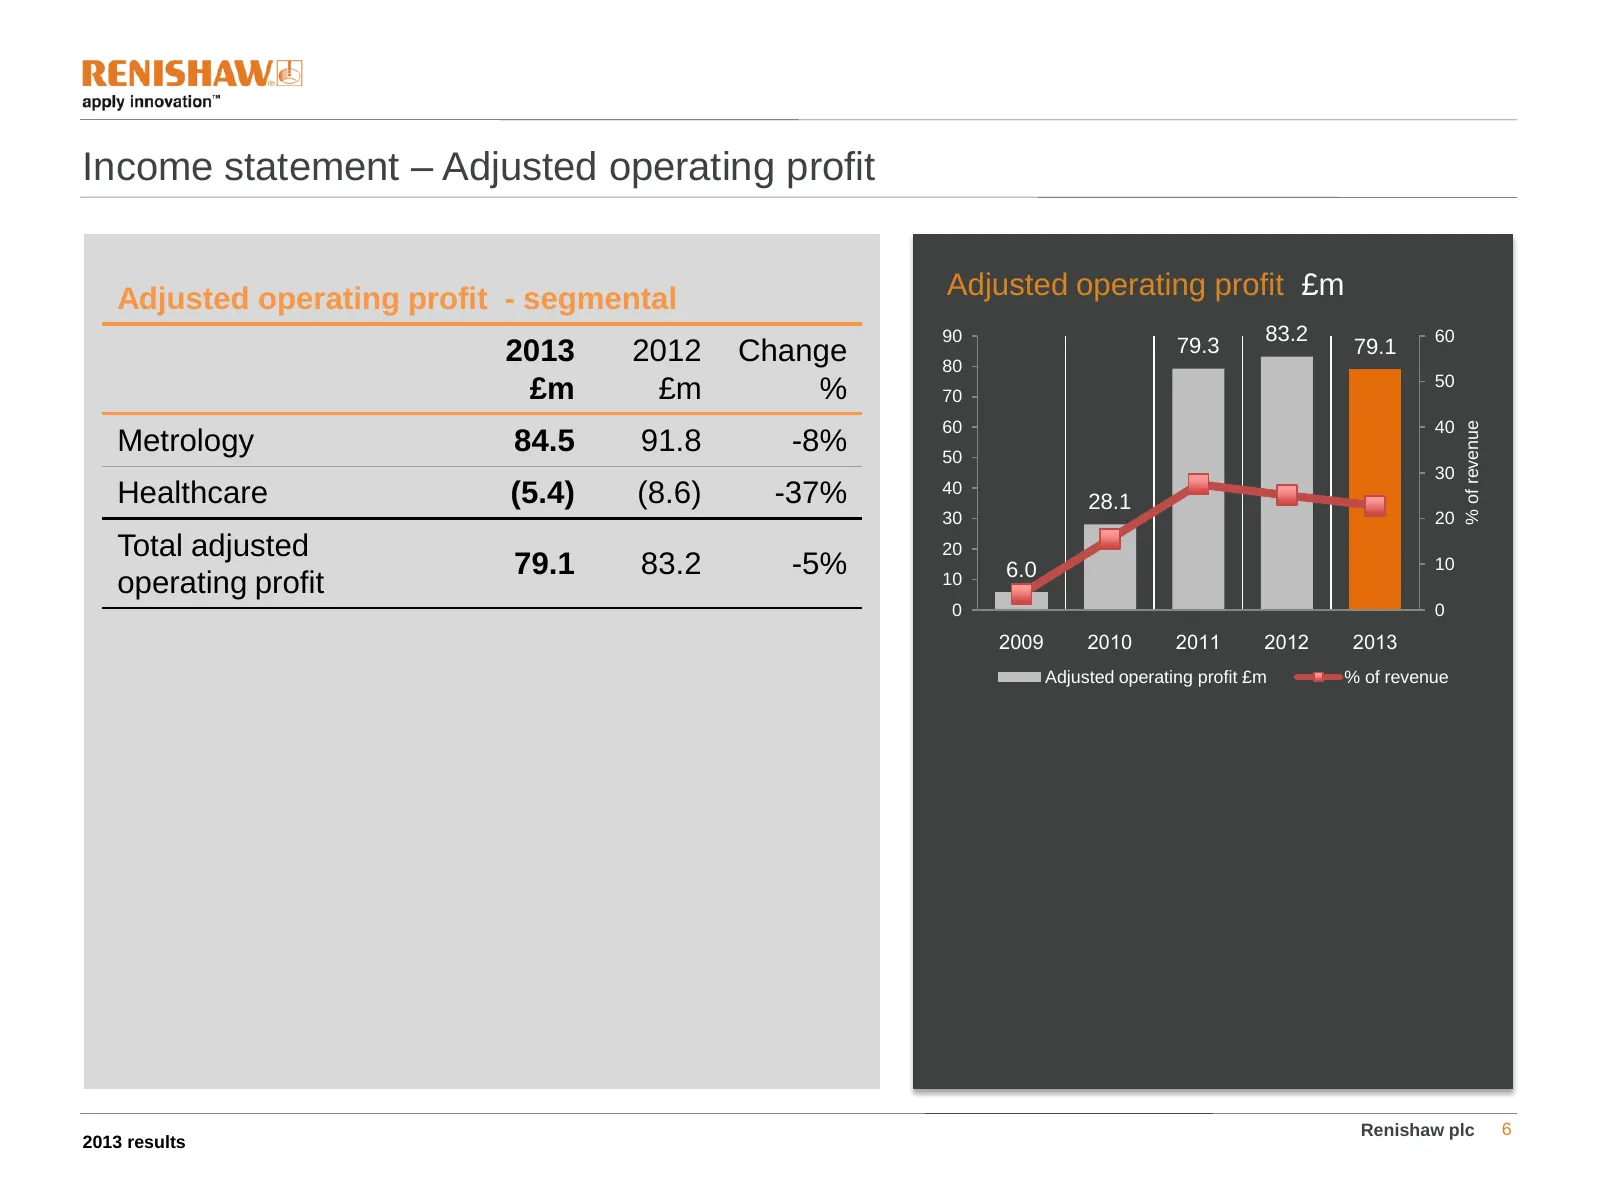
Income statement – Adjusted operating profit Adjusted operating profit - segmental Adjusted operating profit £m 90 83.2 60 2013 2012 Change 79.3 79.1 80 50 £m £m % 70 60 40 % of revenue Metrology 84.5 91.8 -8% 50 30 40 Healthcare (5.4) (8.6) -37% 28.1 30 20 Total adjusted 20 79.1 83.2 -5% 6.0 10 ope
Slide 7: Income statement – Quarterly results
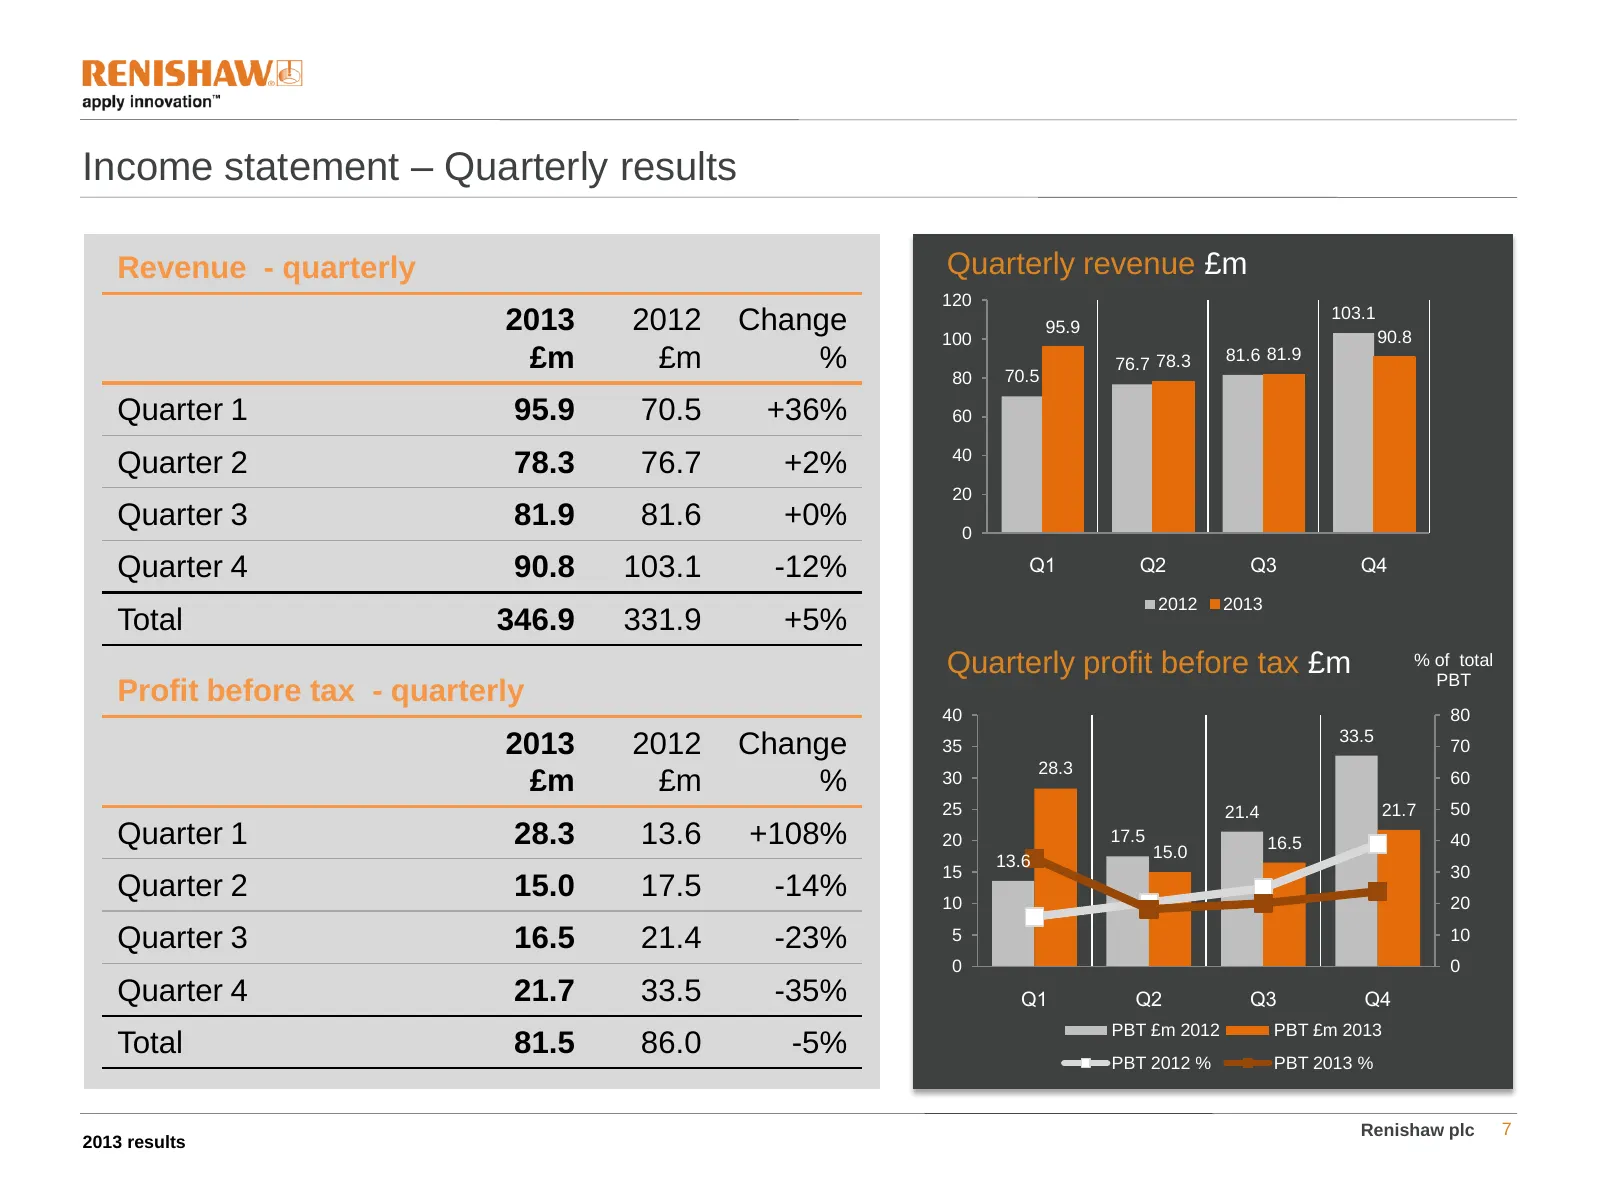
Income statement – Quarterly results Revenue - quarterly Quarterly revenue £m 120 103.1 2013 2012 Change 100 95.9 90.8 £m £m % 70.5 76.7 78.3 81.6 81.9 80 Quarter 1 95.9 70.5 +36% 60 40 Quarter 2 78.3 76.7 +2% 20 Quarter 3 81.9 81.6 +0% 0 Quarter 4 90.8 103.1 -12% Q1 Q2 Q3 Q4 2012 2013 Total 346.9 3
Slide 8: Income statement – Engineering costs
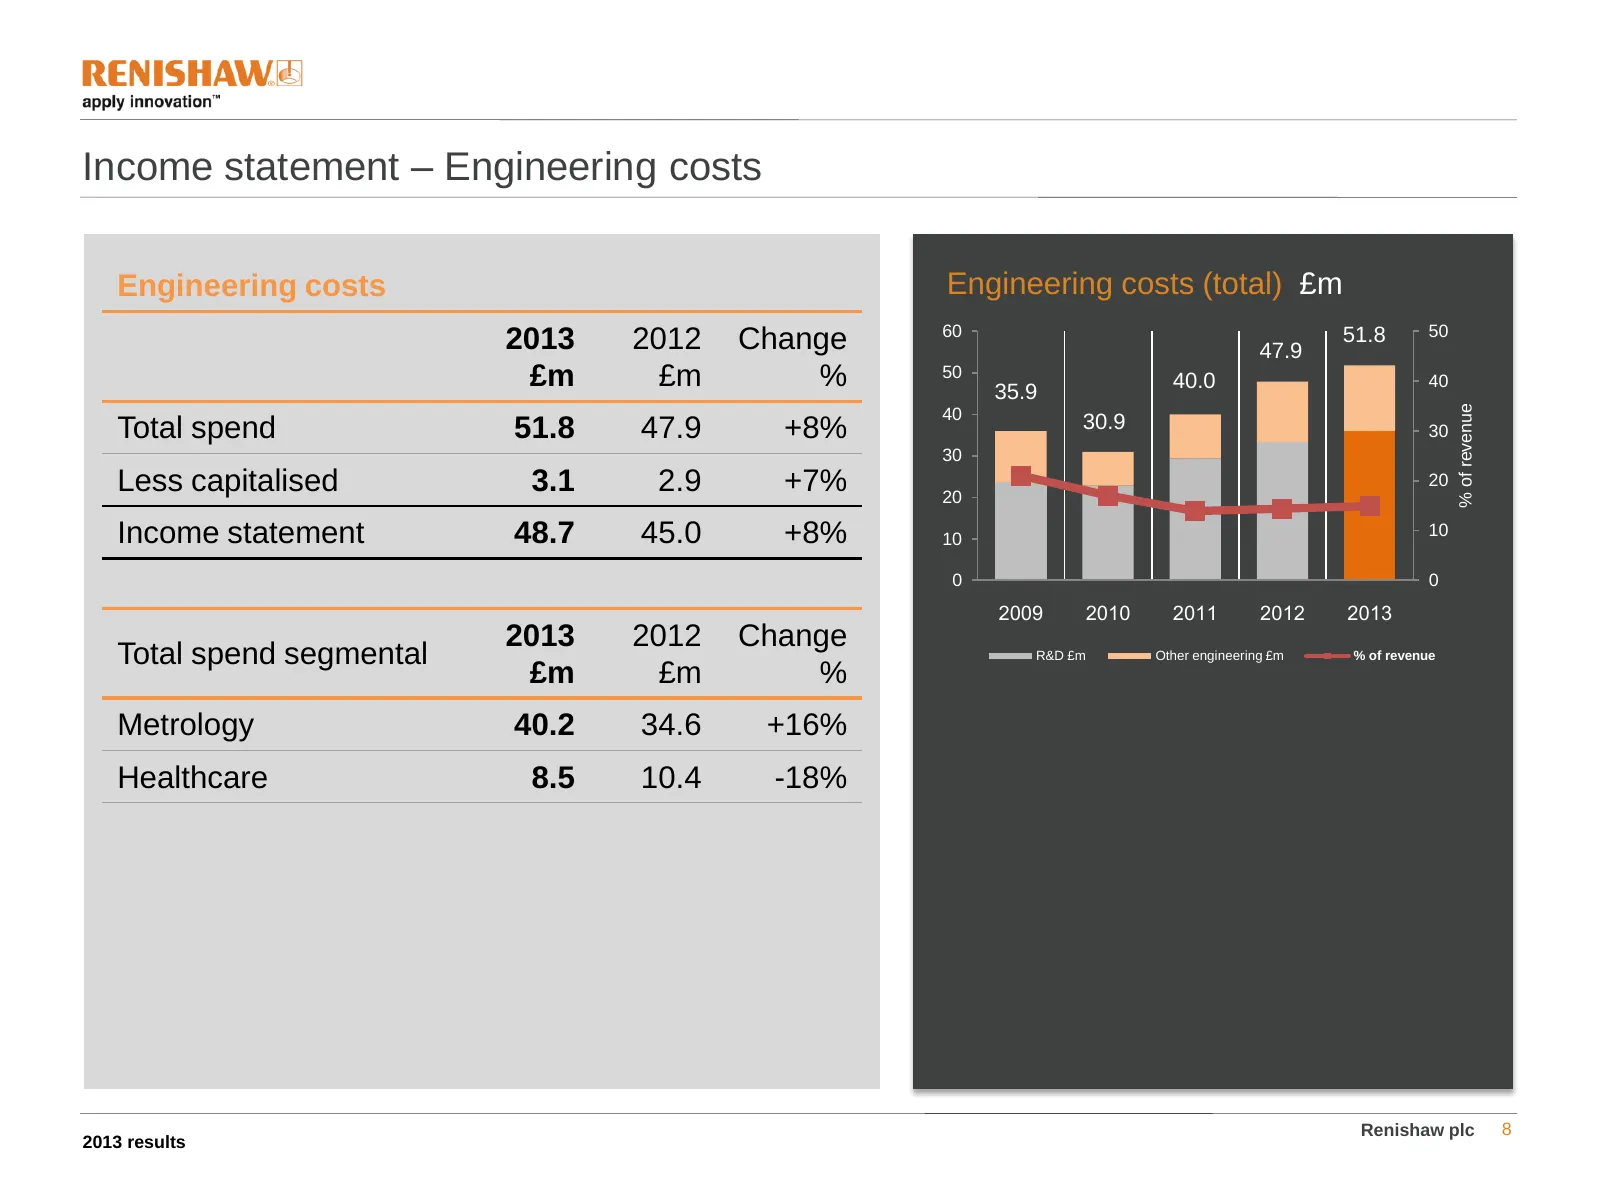
Income statement – Engineering costs Engineering costs Engineering costs (total) £m 60 50 2013 2012 Change 47.9 51.8 £m £m % 50 35.9 40.0 40 % of revenue 40 Total spend 51.8 47.9 +8% 30.9 30 30 Less capitalised 3.1 2.9 +7% 20 20 Income statement 48.7 45.0 +8% 10 10 0 0 2009 2010 2011 2012 2013 2013
Slide 9: Income statement – Distribution costs
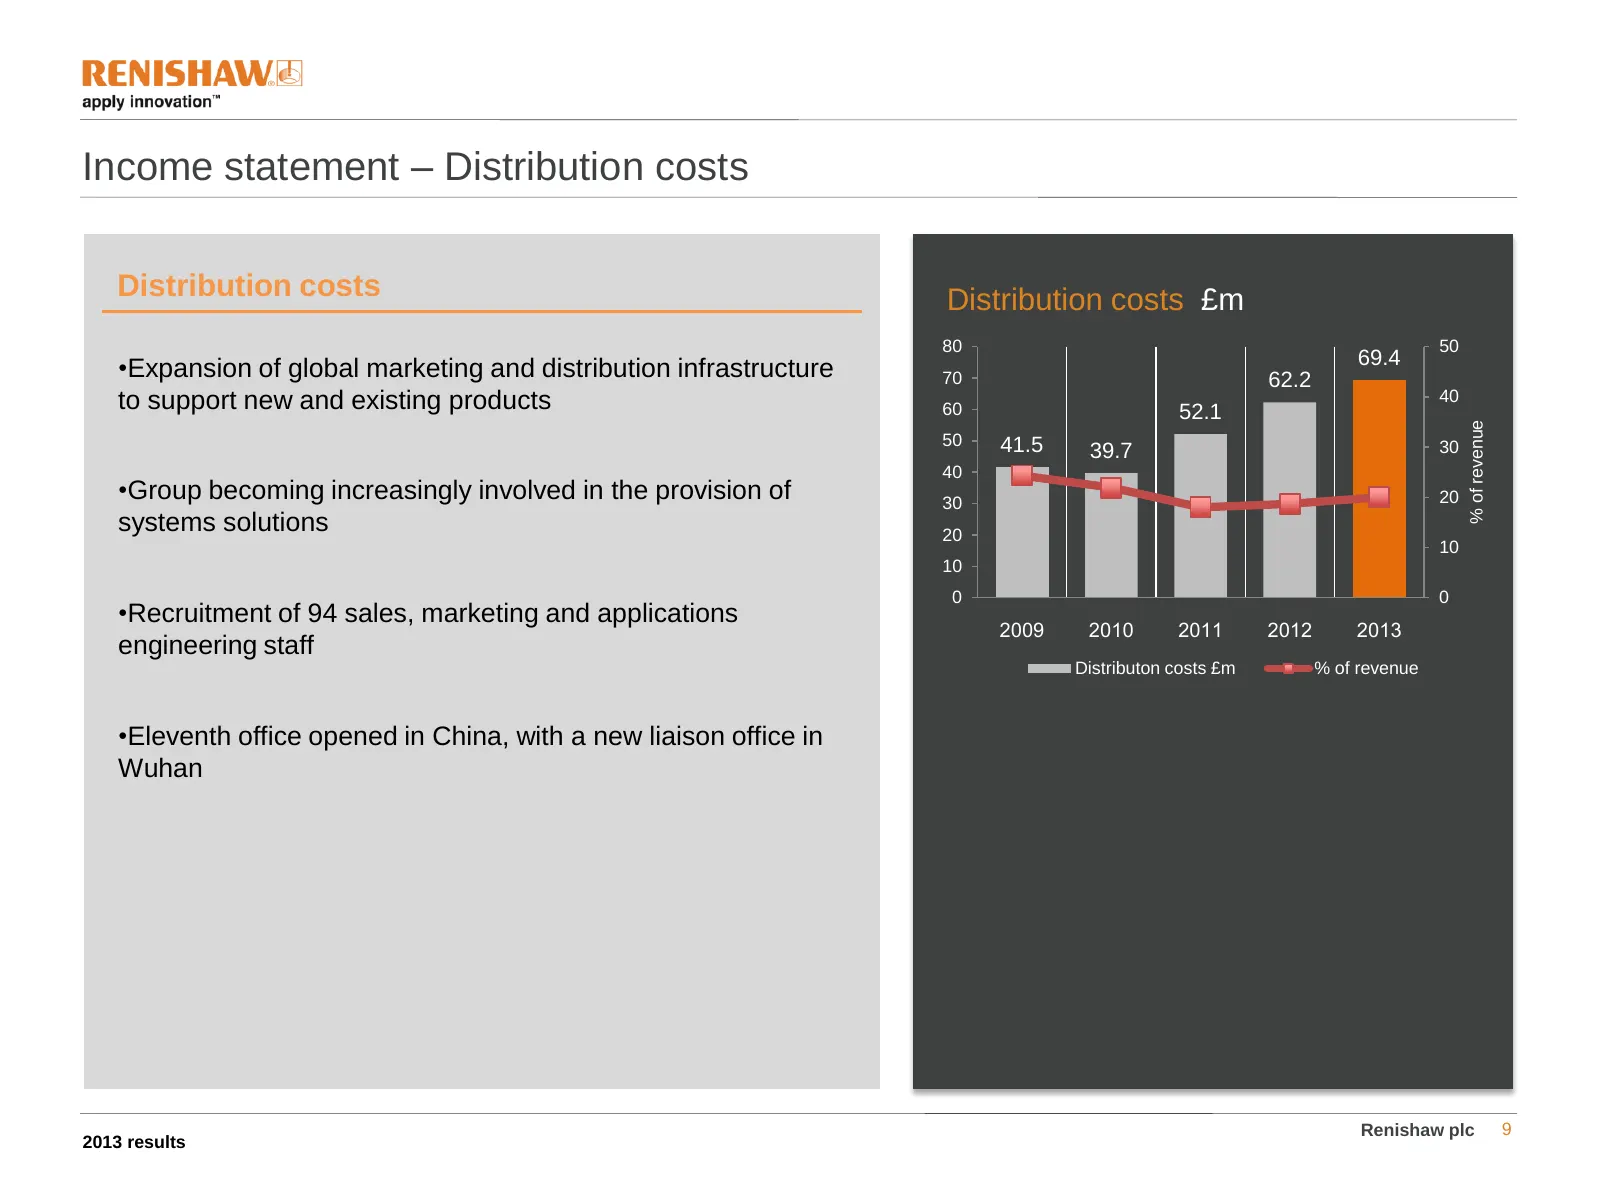
Income statement – Distribution costs Distribution costs Distribution costs £m 80 50 69.4 •Expansion of global marketing and distribution infrastructure 70 62.2 to support new and existing products 60 52.1 40 % of revenue 50 41.5 30 39.7 40 •Group becoming increasingly involved in the provision of 3
Slide 10: Income statement – Administrative costs and Group headcount
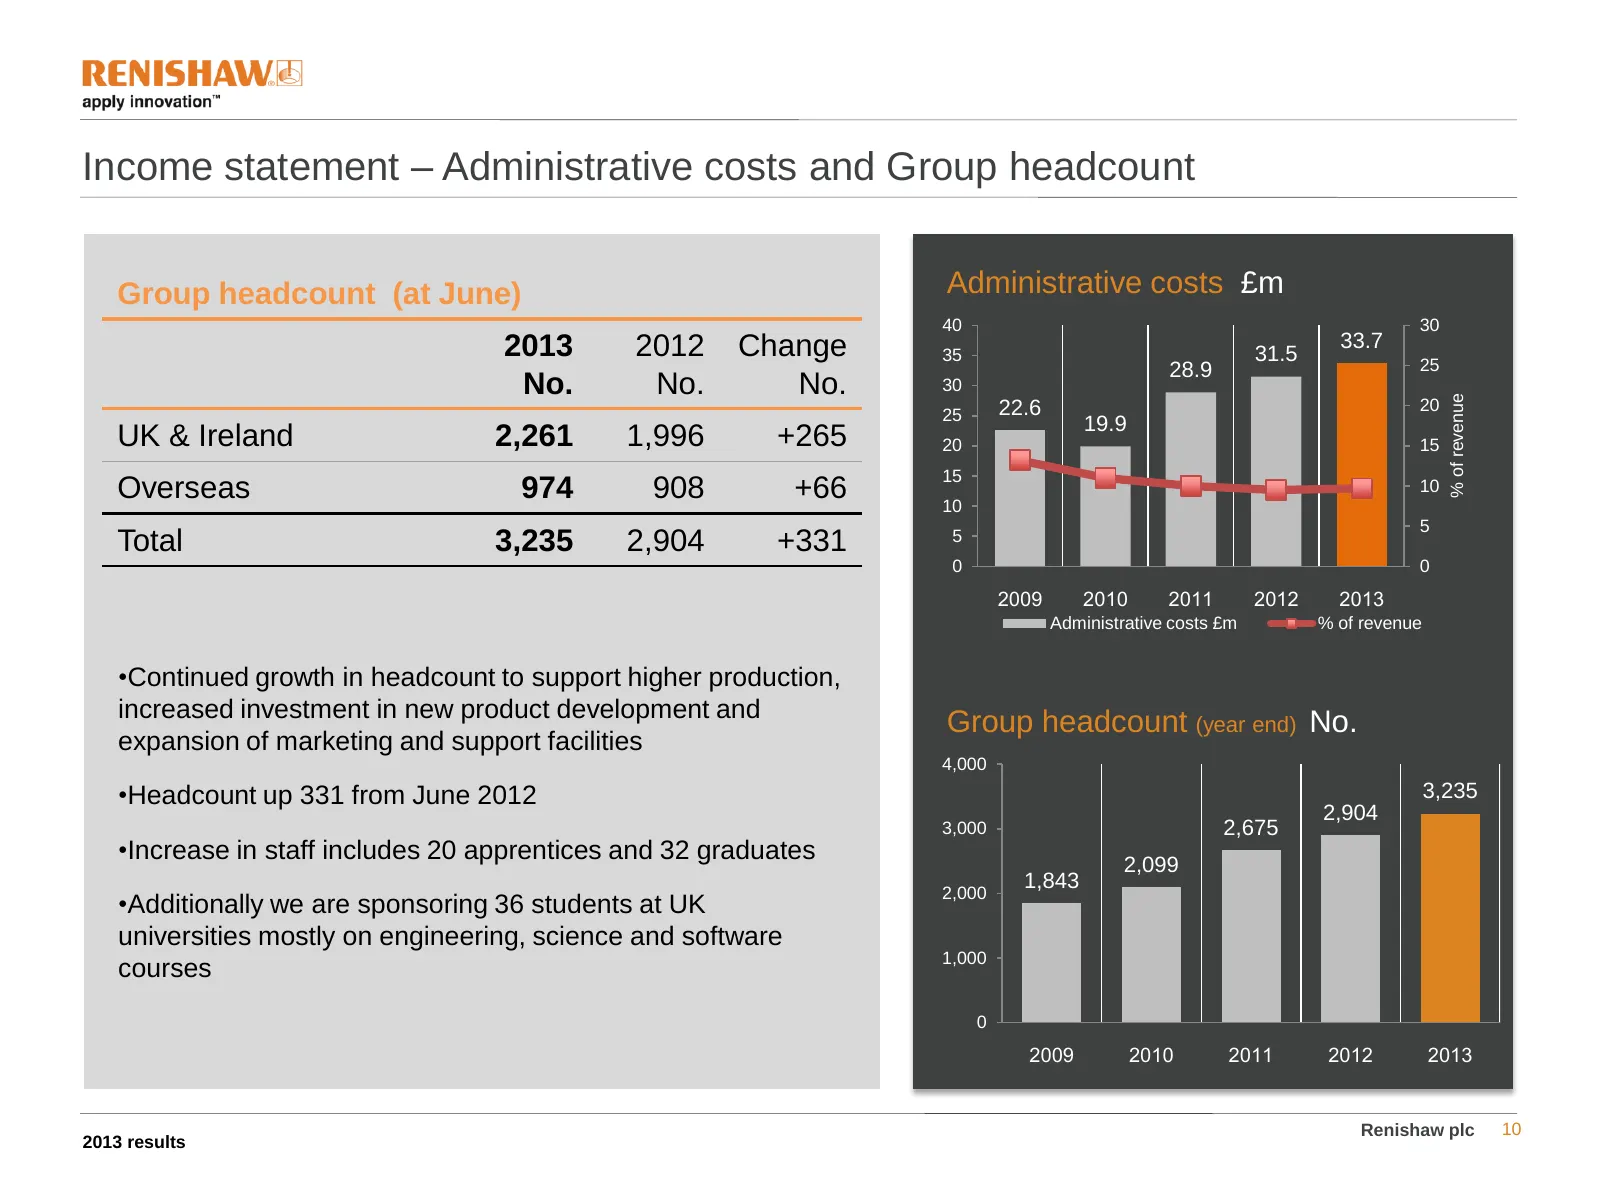
Income statement – Administrative costs and Group headcount Group headcount (at June) Administrative costs £m 40 30 2013 2012 Change 33.7 35 31.5 25 28.9 No. No. No. 30 % of revenue 22.6 20 25 19.9 UK & Ireland 2,261 1,996 +265 20 15 15 Overseas 974 908 +66 10 10 5 Total 3,235 2,904 +331 5 0 0 2009
Slide 11: Income statement – variances from previous year
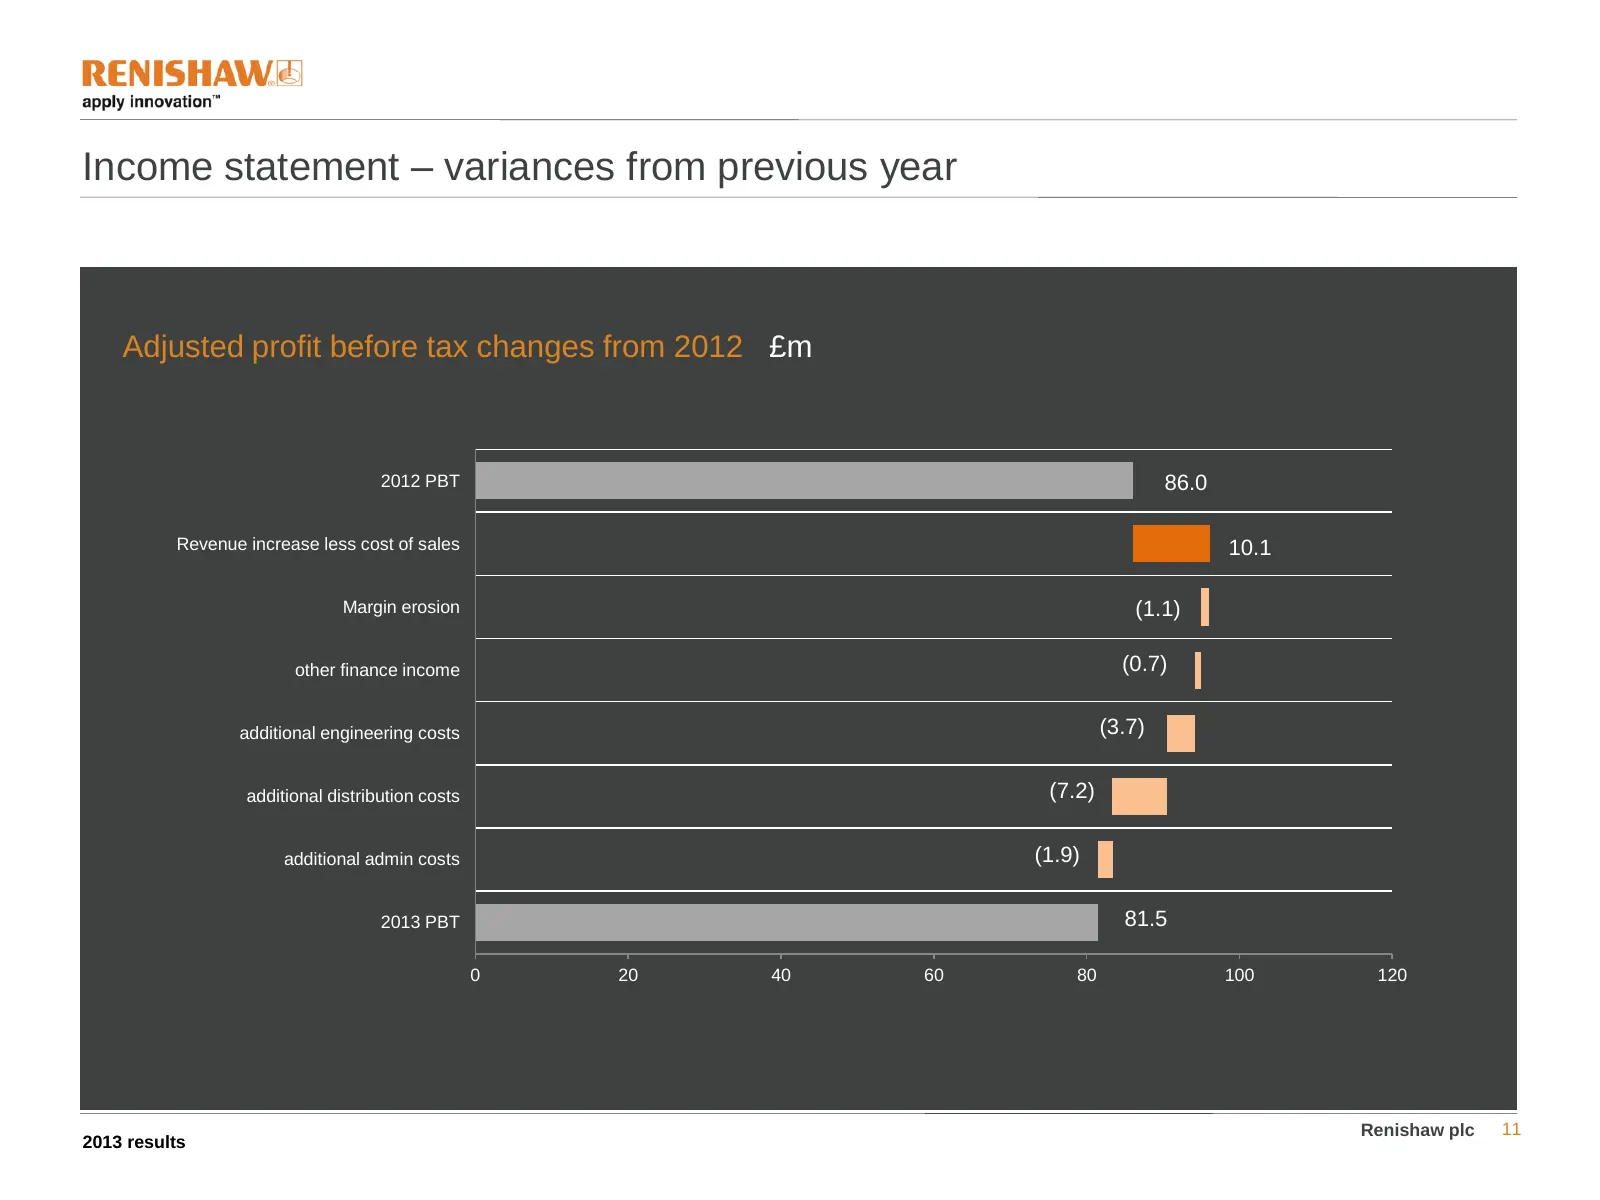
Income statement – variances from previous year Adjusted profit before tax changes from 2012 £m 2012 PBT 86.0 Revenue increase less cost of sales 10.1 Margin erosion (1.1) other finance income (0.7) additional engineering costs (3.7) additional distribution costs (7.2) additional admin costs (1.9) 2
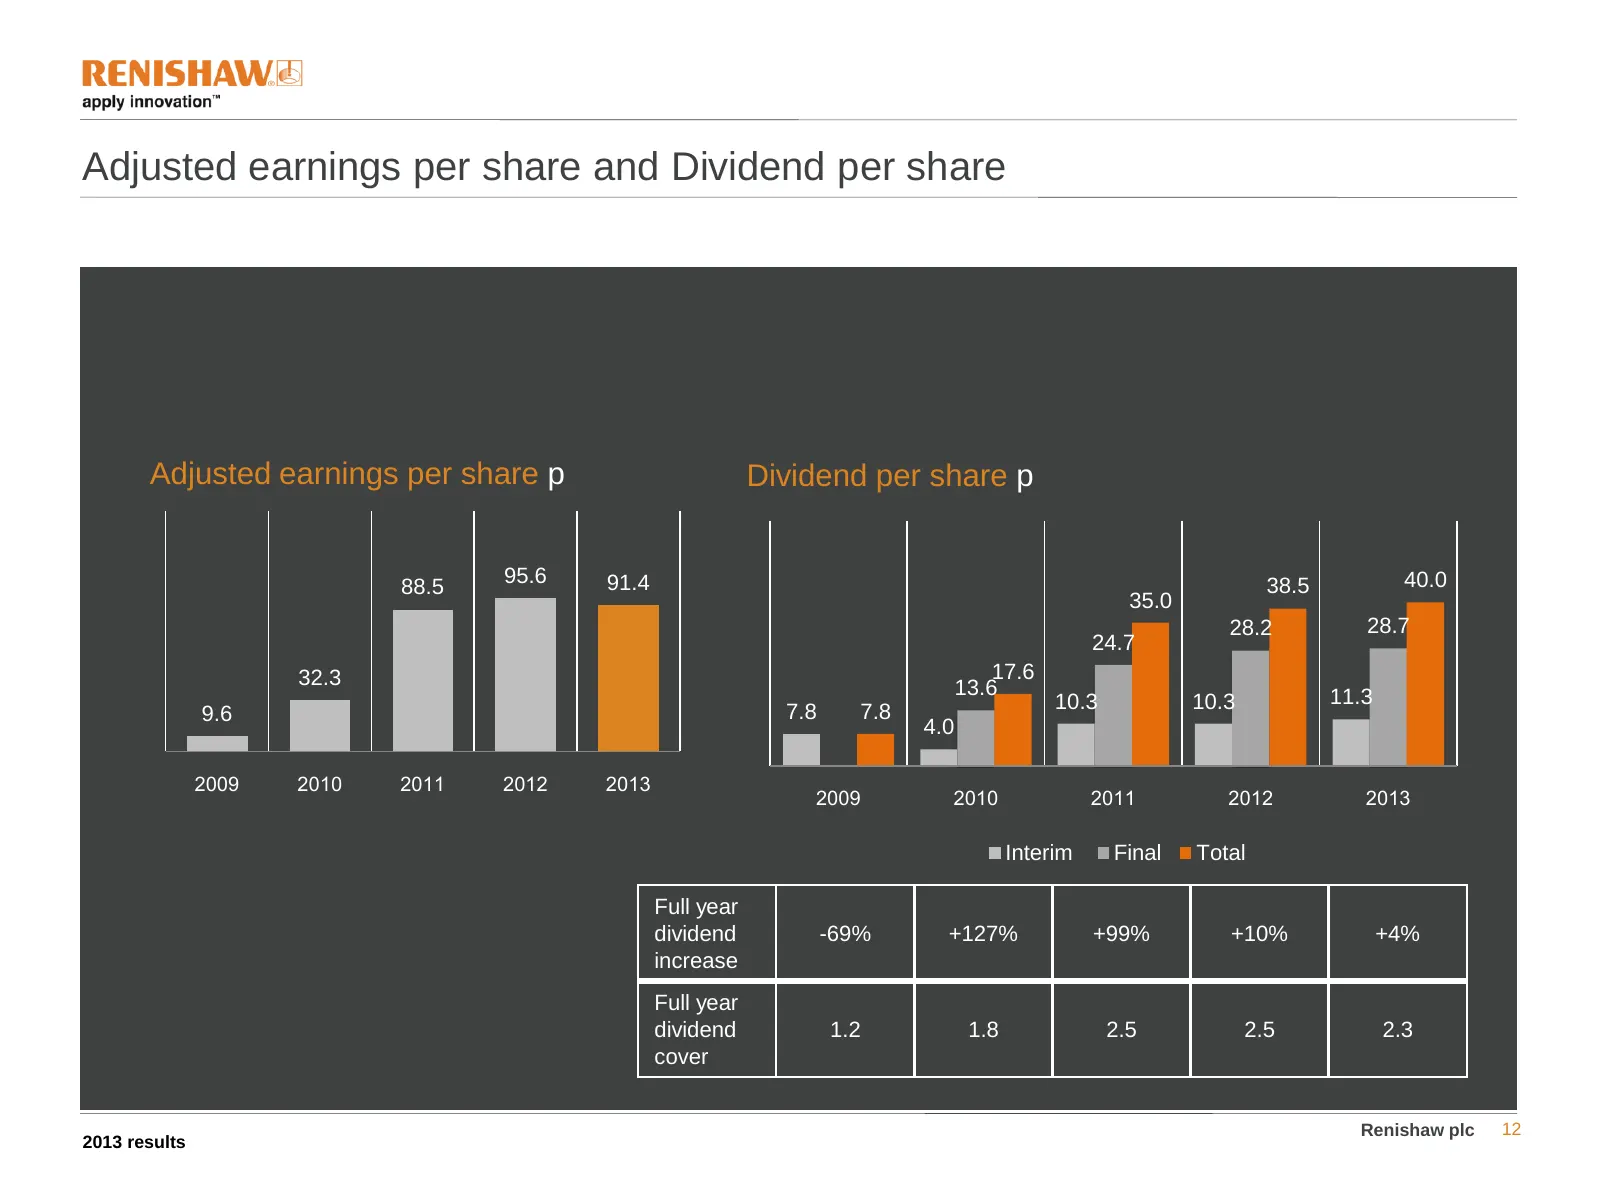
Slide 12: Adjusted earnings per share and Dividend per share
Adjusted earnings per share and Dividend per share Adjusted earnings per share p Dividend per share p 95.6 91.4 38.5 40.0 88.5 35.0 28.2 28.7 24.7 32.3 17.6 13.6 11.3 7.8 7.8 10.3 10.3 9.6 4.0 2009 2010 2011 2012 2013 2009 2010 2011 2012 2013 Interim Final Total Full year dividend -69% +127% +99% +1
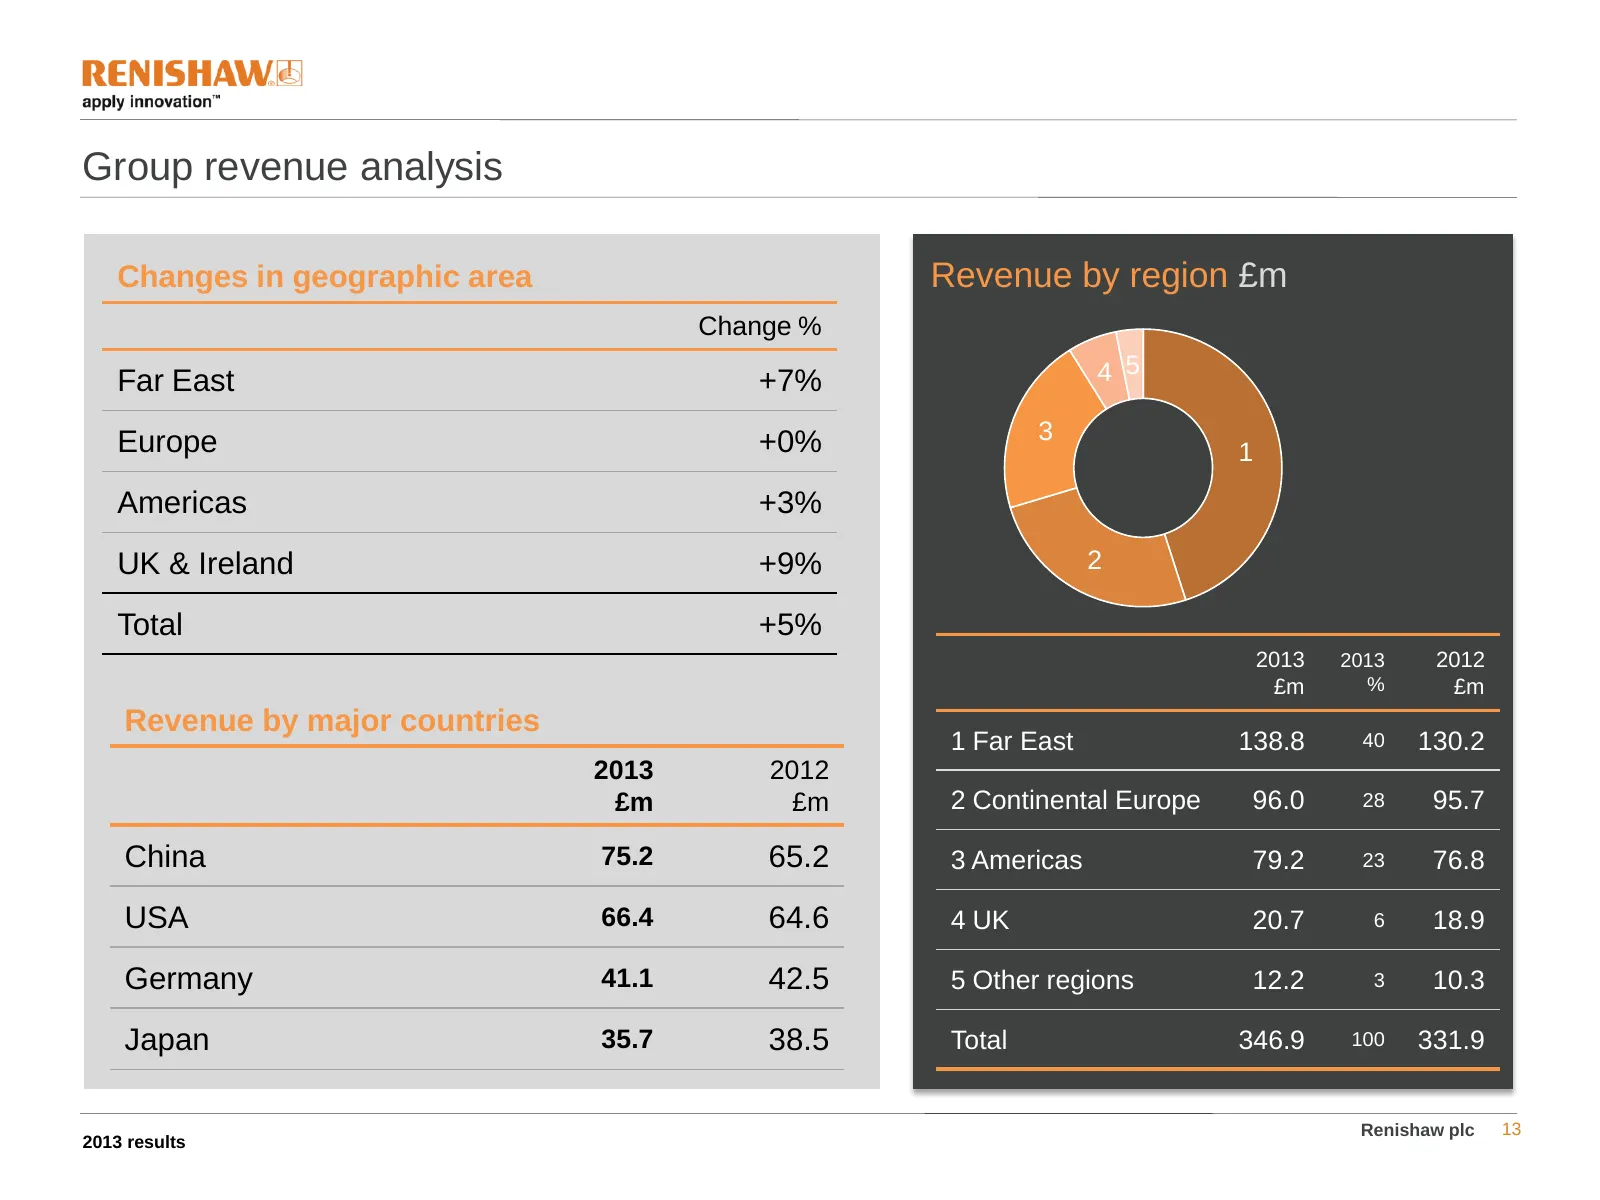
Slide 13: Group revenue analysis
Group revenue analysis Changes in geographic area Revenue by region £m Change % Far East +7% 4 5 Europe +0% 3 1 Americas +3% UK & Ireland +9% 2 Total +5% 2013 2013 2012 £m % £m Revenue by major countries 1 Far East 138.8 40 130.2 2013 2012 £m £m 2 Continental Europe 96.0 28 95.7 China 75.2 65.2 3 Am
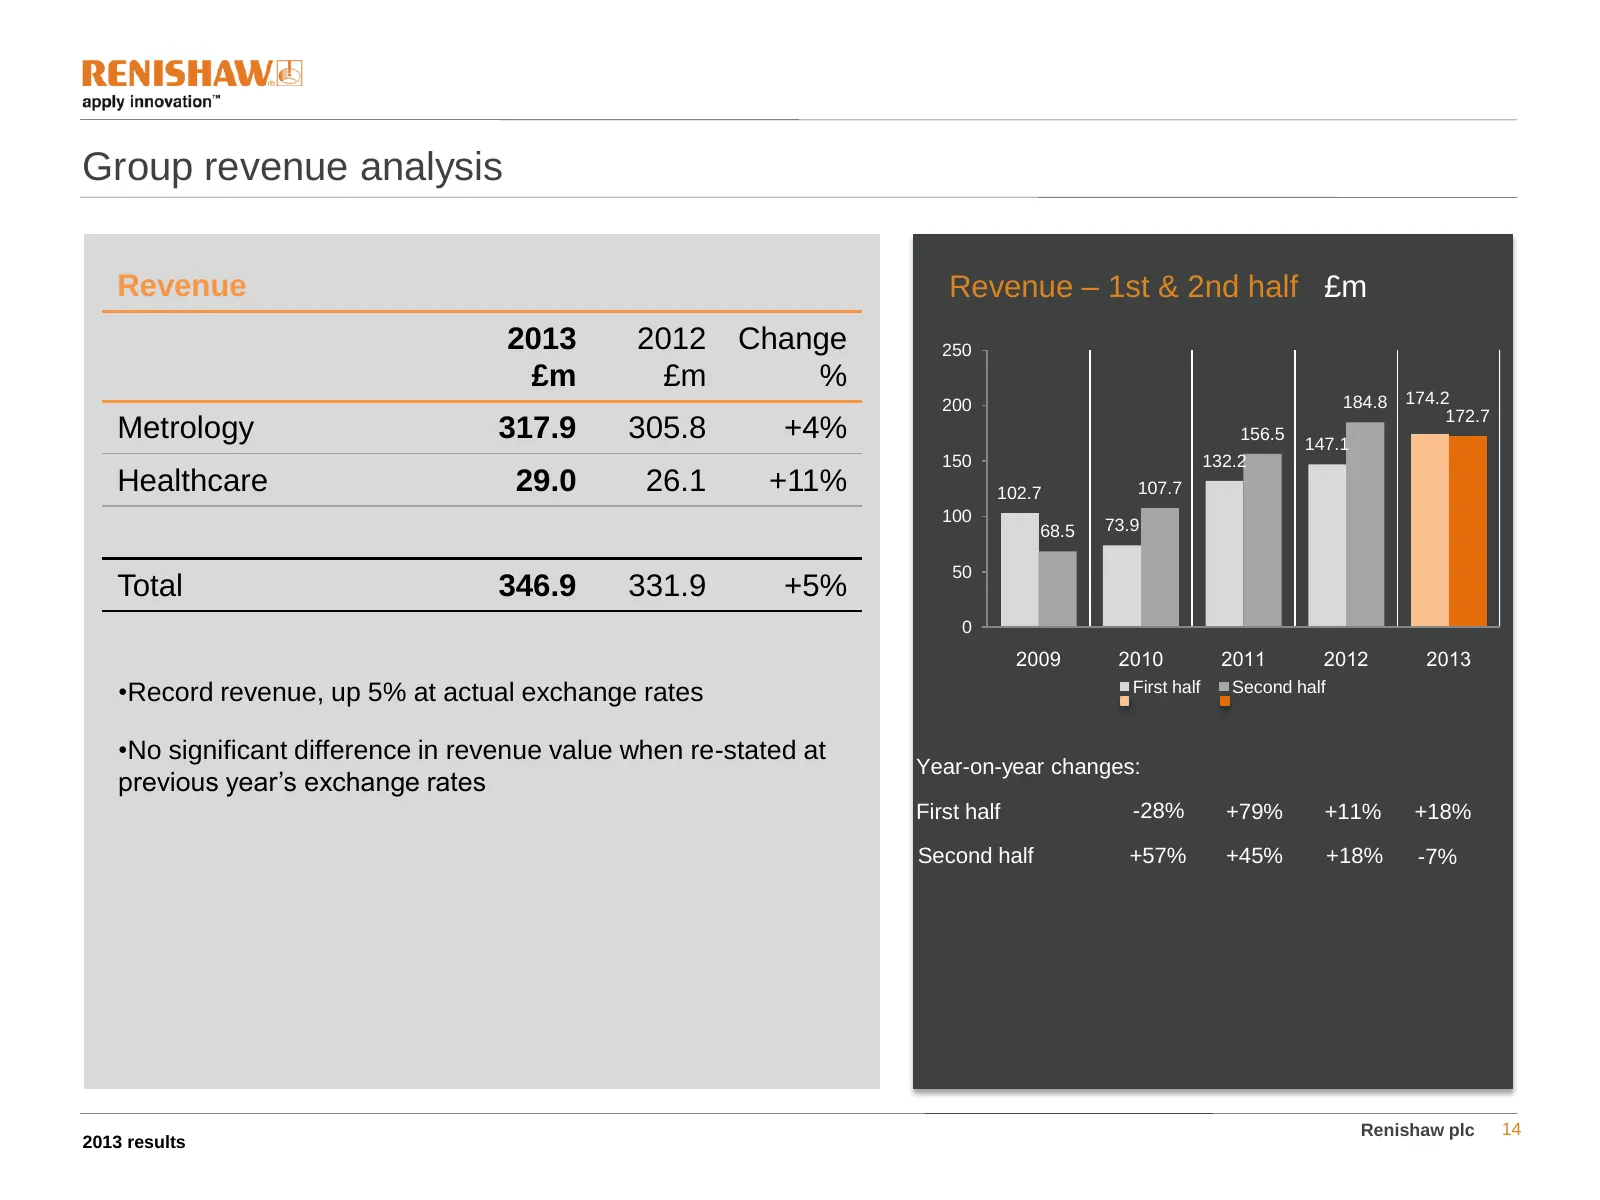
Slide 14: Group revenue analysis
Group revenue analysis Revenue Revenue – 1st & 2nd half £m 2013 2012 Change 250 £m £m % 200 184.8 174.2 172.7 Metrology 317.9 305.8 +4% 156.5 147.1 150 132.2 Healthcare 29.0 26.1 +11% 102.7 107.7 100 68.5 73.9 50 Total 346.9 331.9 +5% 0 2009 2010 2011 2012 2013 •Record revenue, up 5% at actual excha
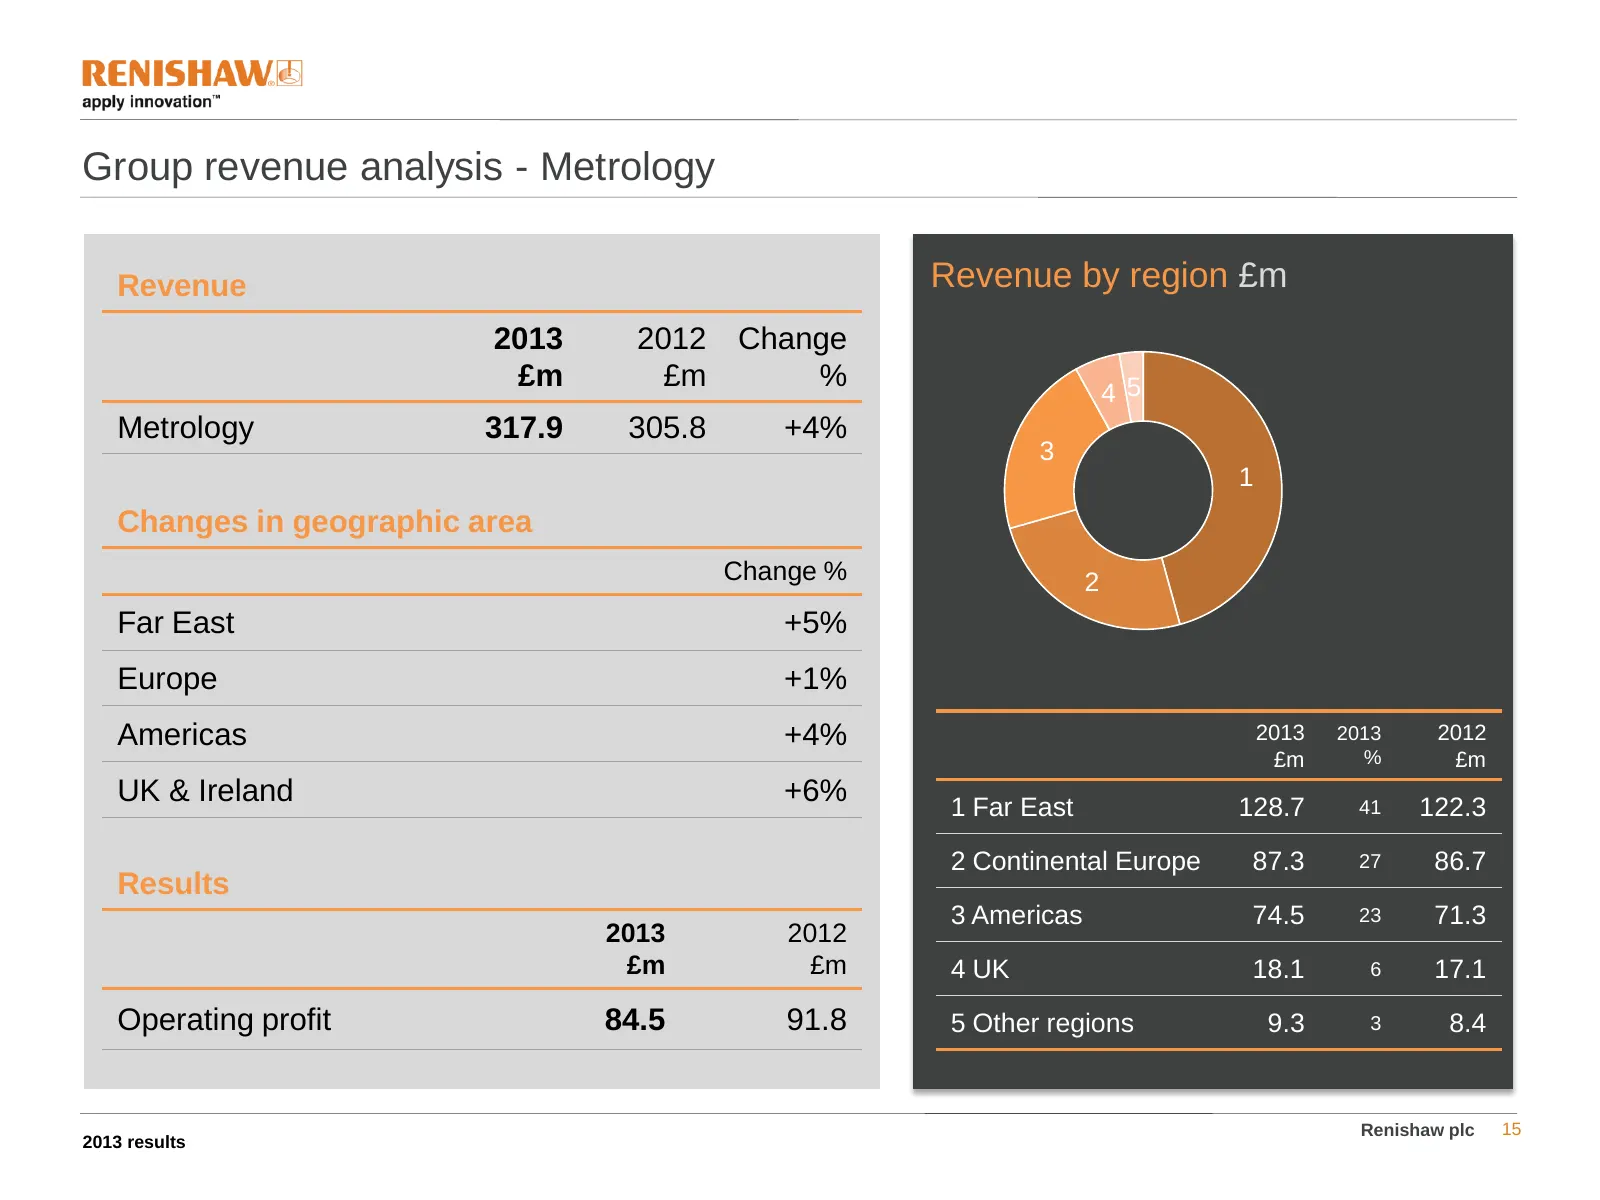
Slide 15: Group revenue analysis - Metrology
Group revenue analysis - Metrology Revenue Revenue by region £m 2013 2012 Change £m £m % 4 5 Metrology 317.9 305.8 +4% 3 1 Changes in geographic area Change % 2 Far East +5% Europe +1% Americas +4% 2013 2013 2012 £m % £m UK & Ireland +6% 1 Far East 128.7 41 122.3 2 Continental Europe 87.3 27 86.7 Re
Slide 16: Metrology highlights
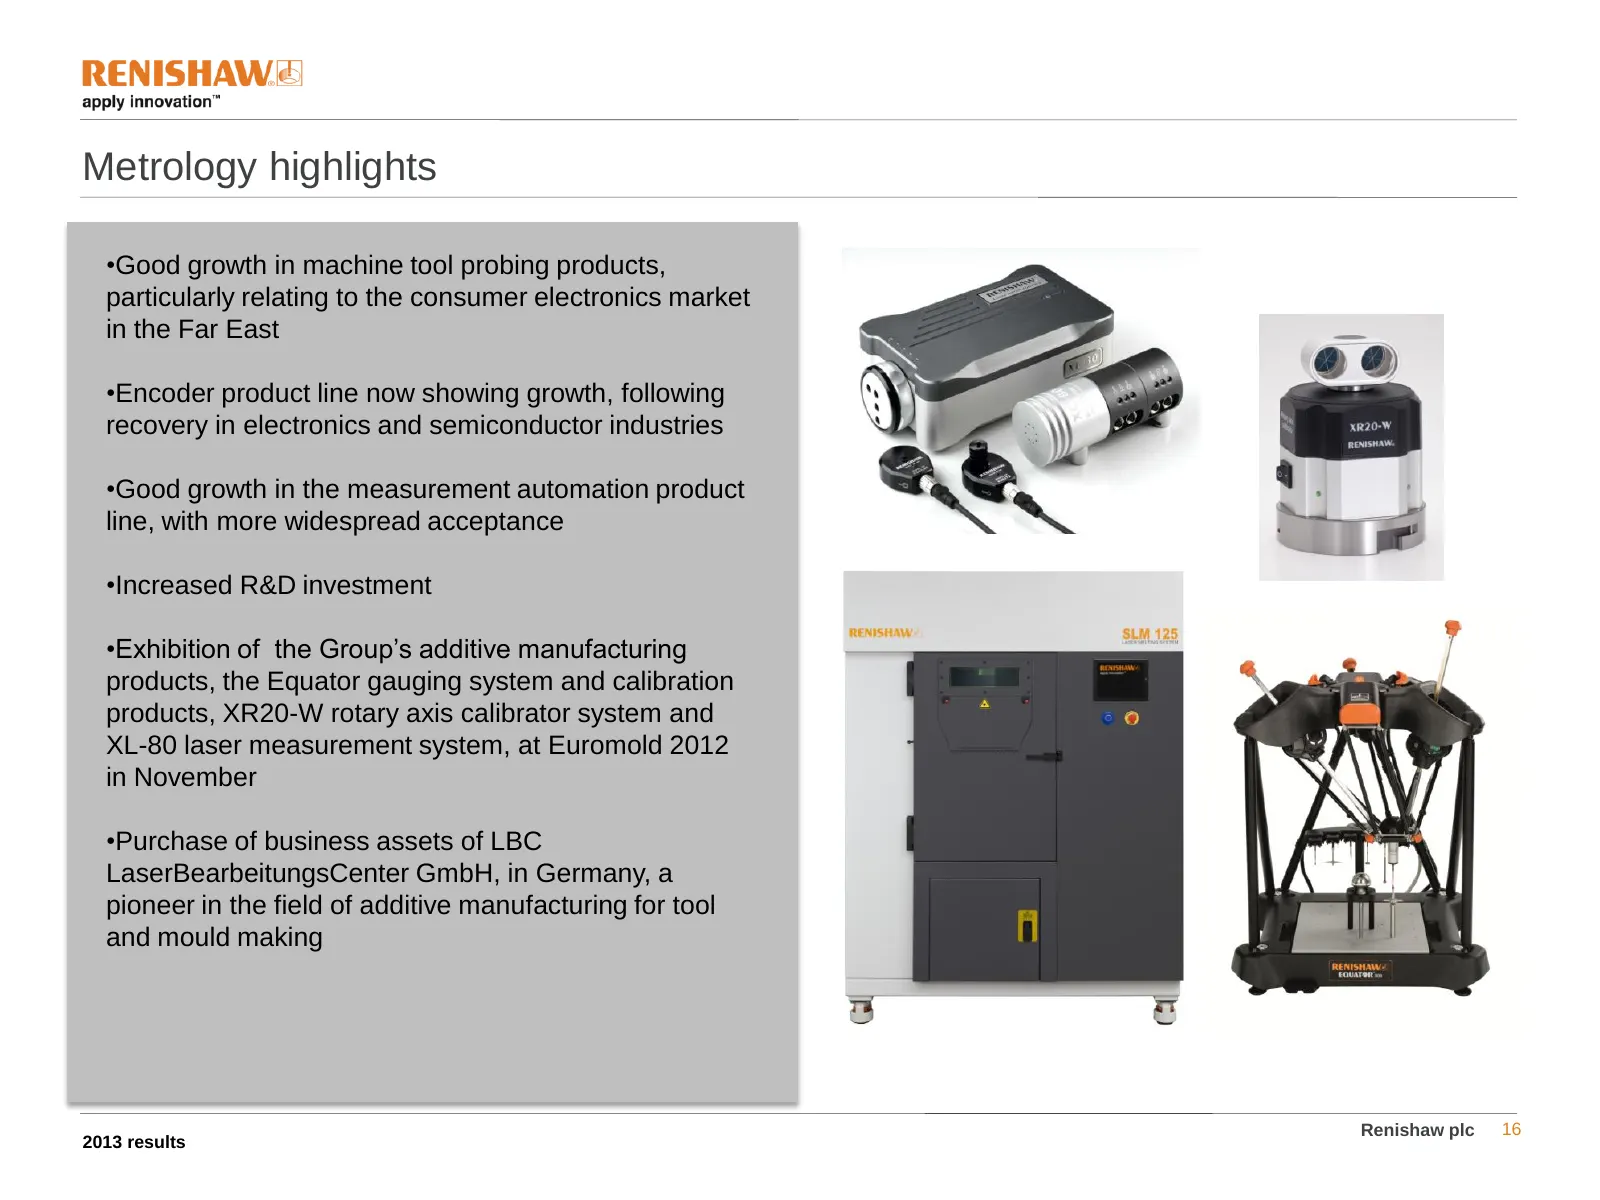
Metrology highlights •Good growth in machine tool probing products, particularly relating to the consumer electronics market in the Far East •Encoder product line now showing growth, following recovery in electronics and semiconductor industries •Good growth in the measurement automation product lin
Slide 17: New product releases / Metrology
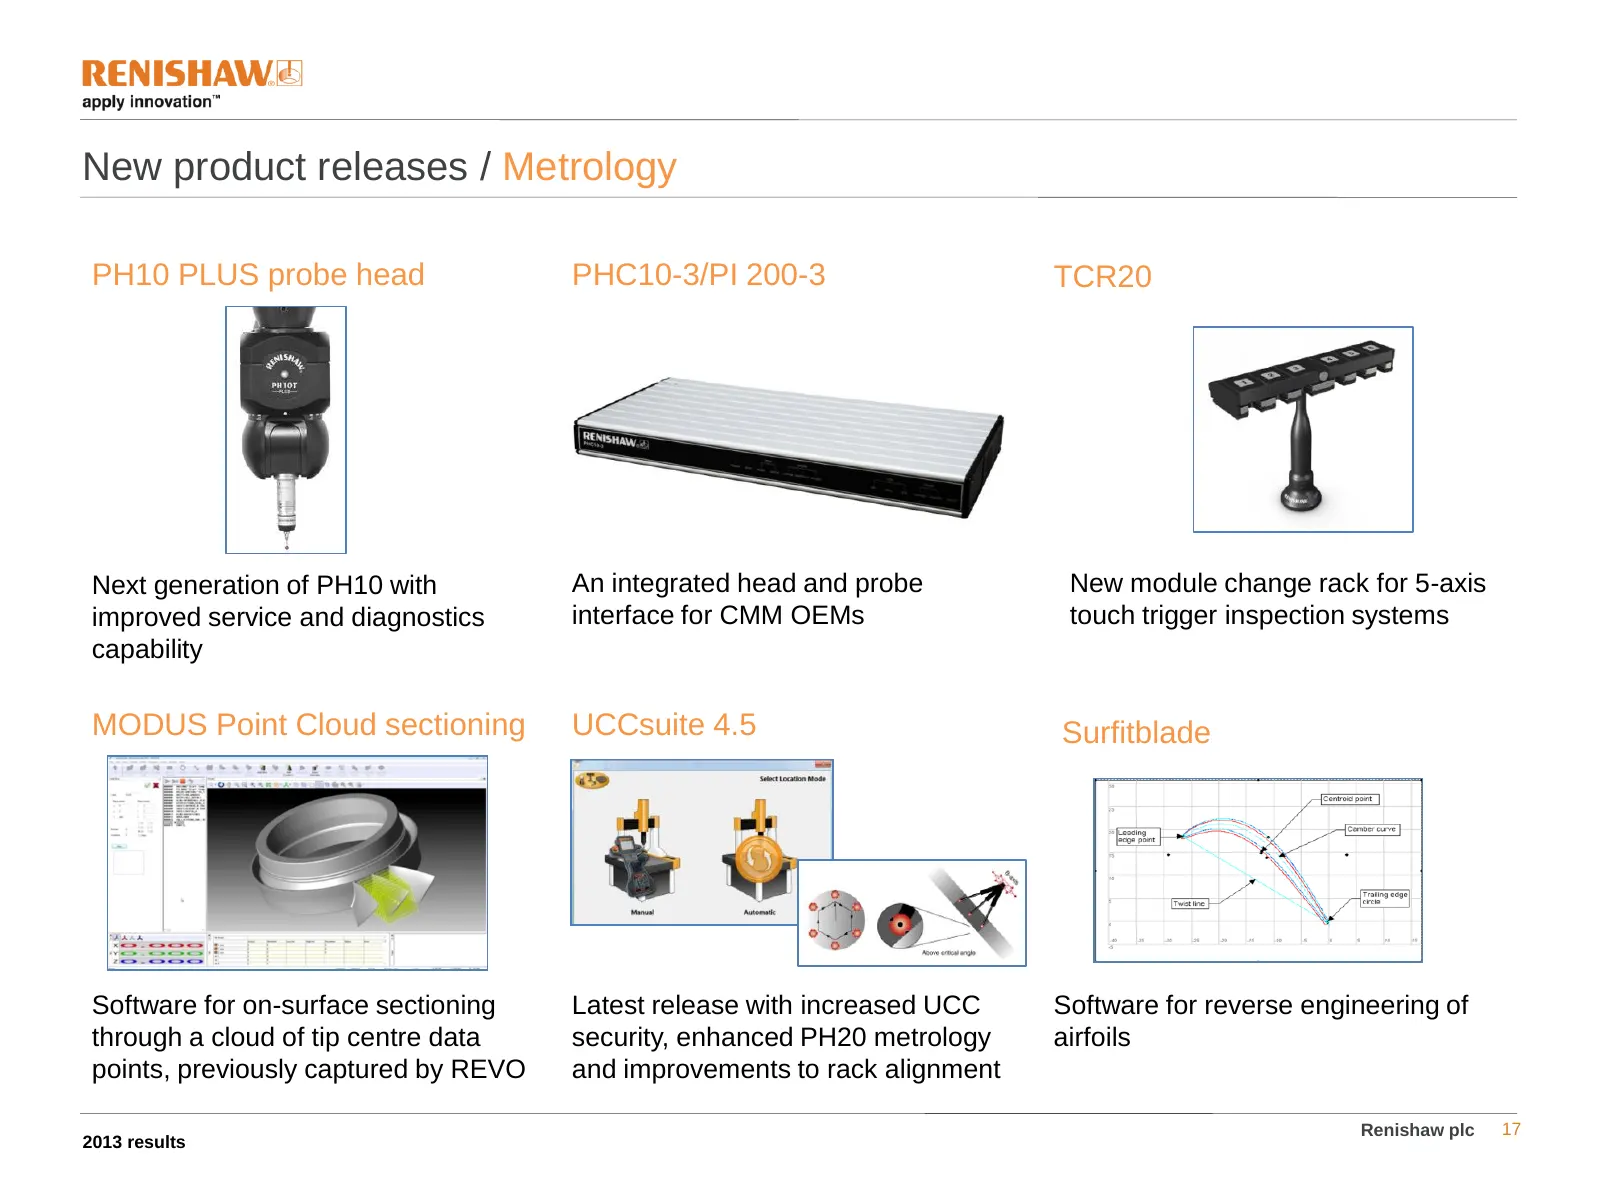
New product releases / Metrology PH10 PLUS probe head PHC10-3/PI 200-3 TCR20 Next generation of PH10 with An integrated head and probe New module change rack for 5-axis improved service and diagnostics interface for CMM OEMs touch trigger inspection systems capability MODUS Point Cloud sectioning UC
Slide 18: New product releases / Metrology
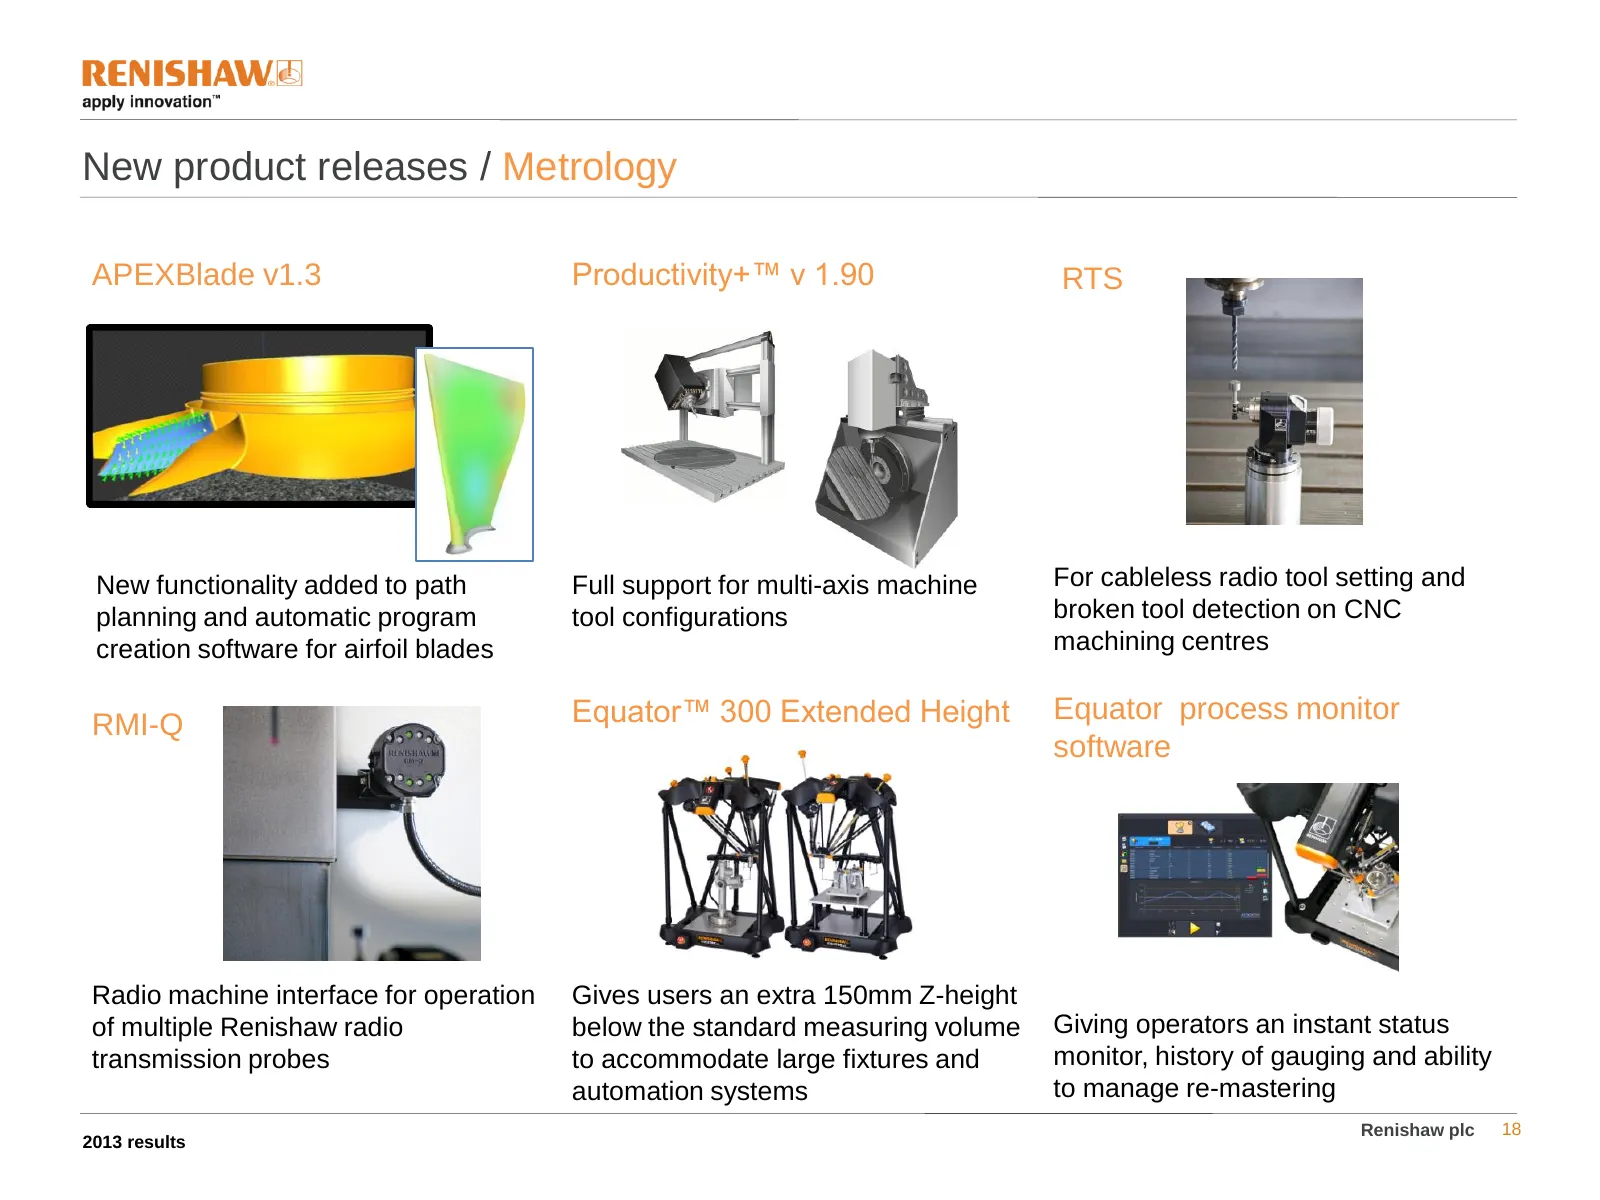
New product releases / Metrology APEXBlade v1.3 Productivity+™ v 1.90 RTS New functionality added to path Full support for multi-axis machine For cableless radio tool setting and planning and automatic program tool configurations broken tool detection on CNC creation software for airfoil blades mach
Slide 19: New product releases / Metrology
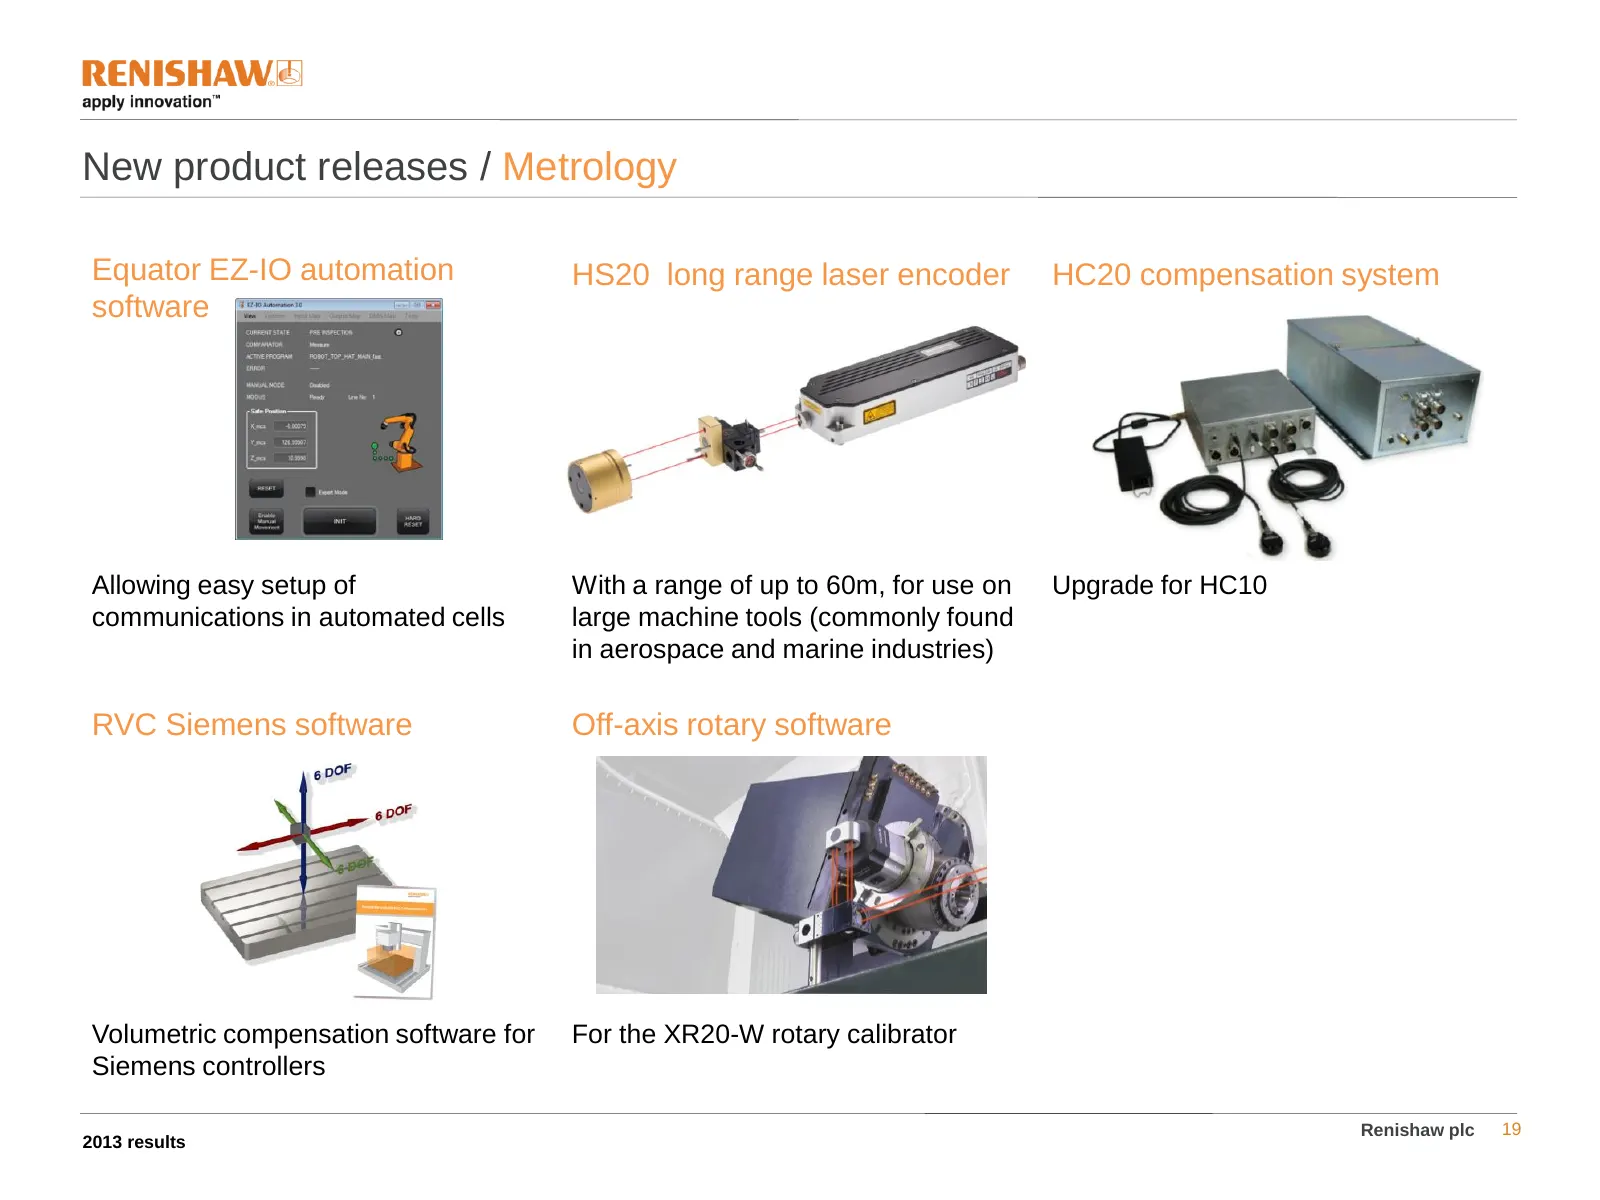
New product releases / Metrology Equator EZ-IO automation HS20 long range laser encoder HC20 compensation system software Allowing easy setup of With a range of up to 60m, for use on Upgrade for HC10 communications in automated cells large machine tools (commonly found in aerospace and marine indust
Slide 20: New product releases / Metrology
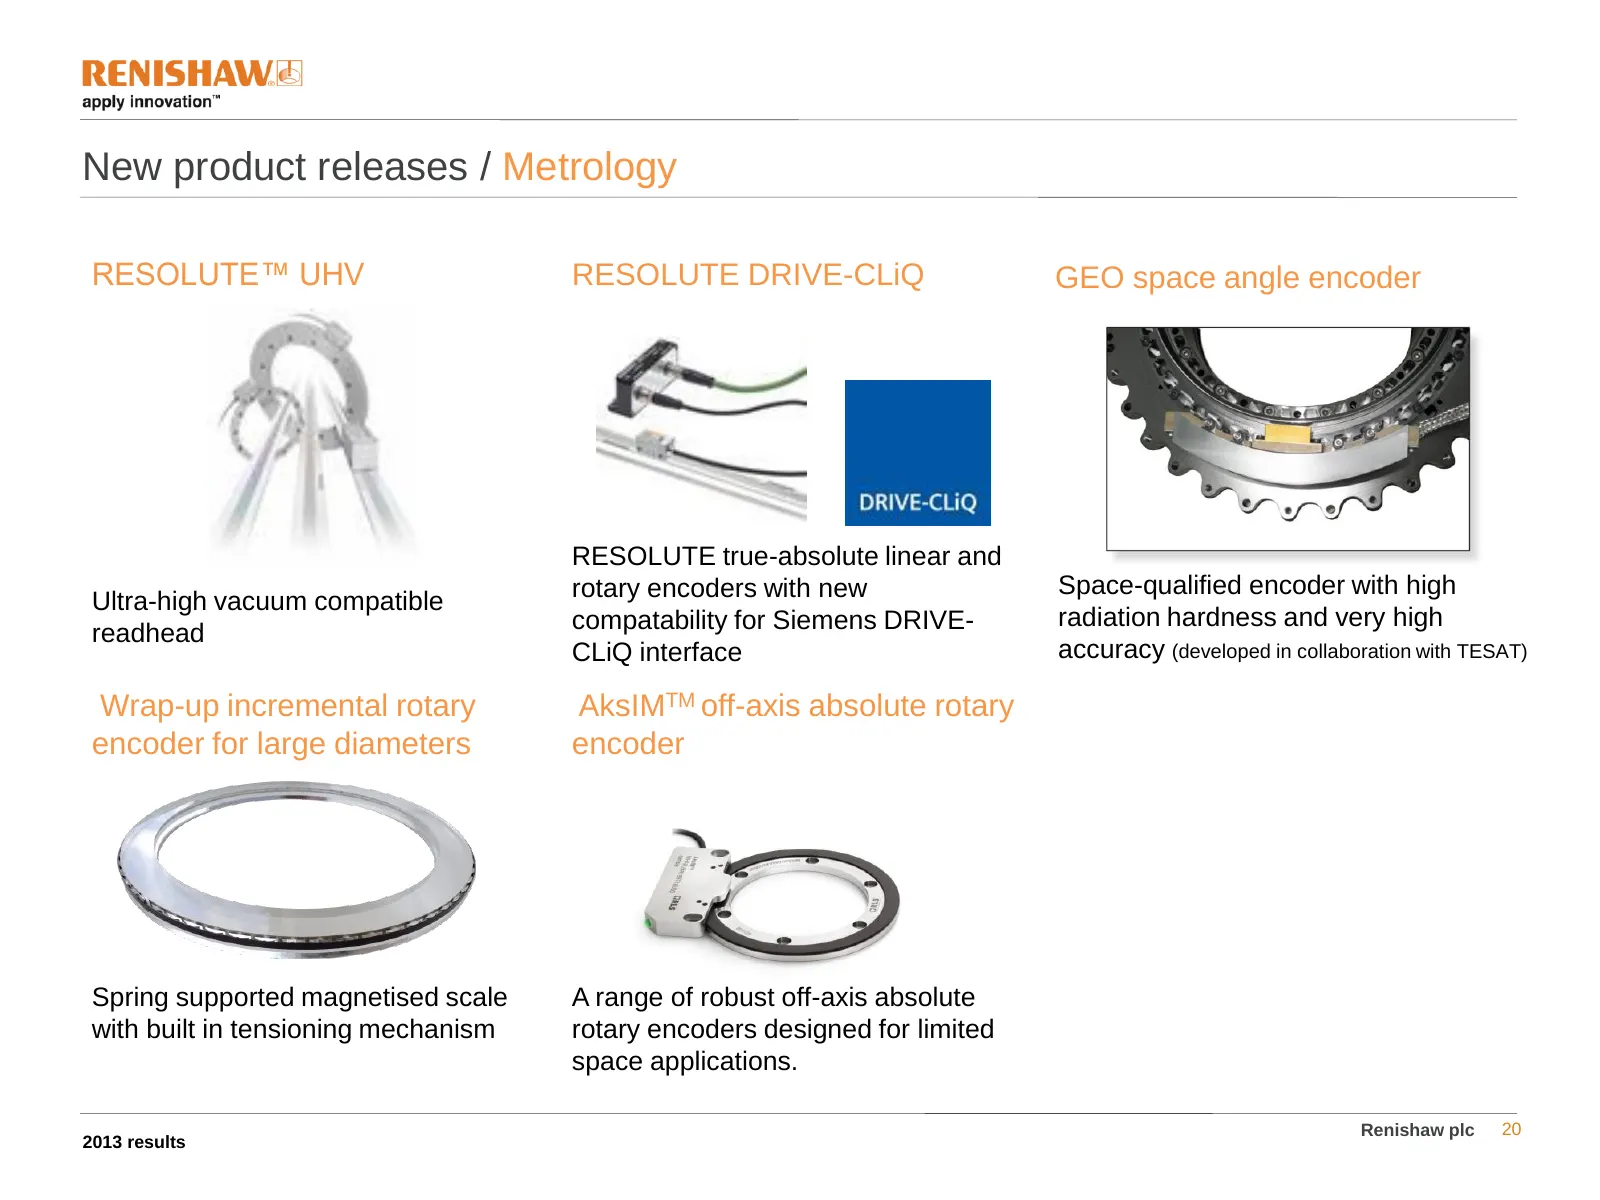
New product releases / Metrology RESOLUTE™ UHV RESOLUTE DRIVE-CLiQ GEO space angle encoder RESOLUTE true-absolute linear and rotary encoders with new Space-qualified encoder with high Ultra-high vacuum compatible compatability for Siemens DRIVE- radiation hardness and very high readhead CLiQ interfa
Slide 21: Group revenue analysis - Healthcare
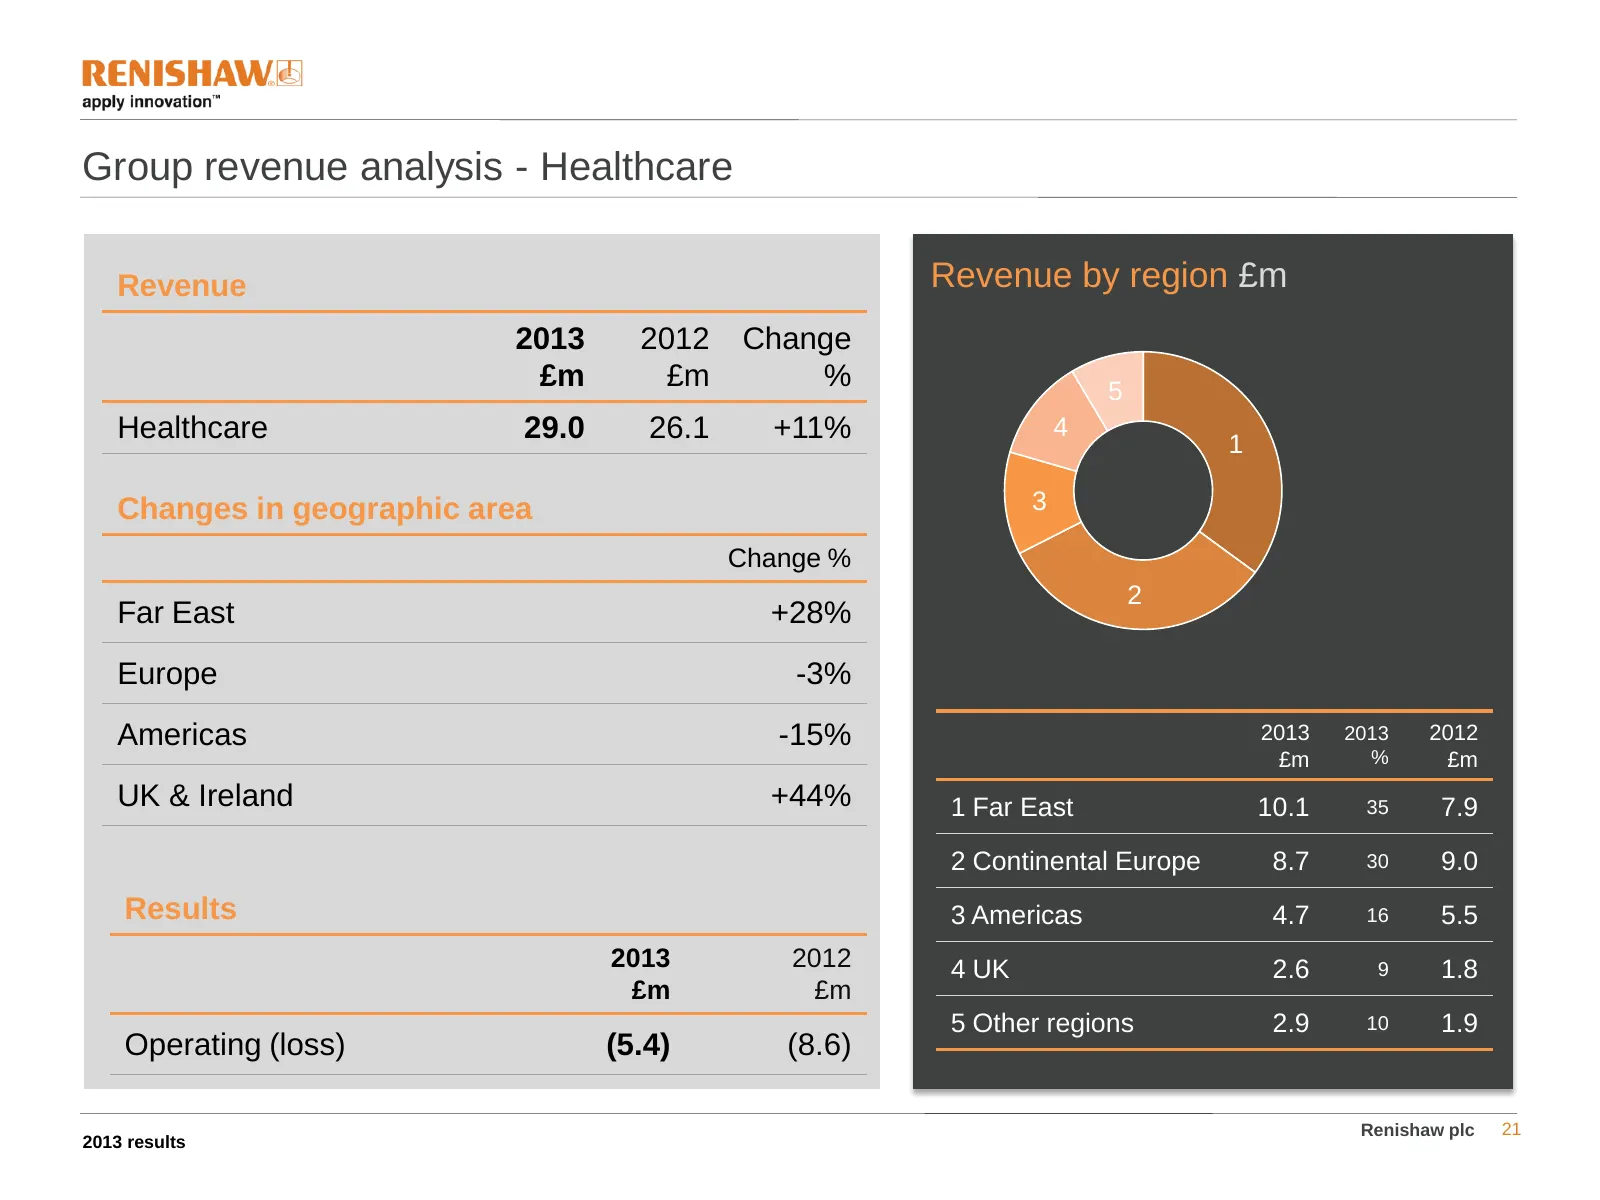
Group revenue analysis - Healthcare Revenue Revenue by region £m 2013 2012 Change £m £m % 5 Healthcare 29.0 26.1 +11% 4 1 Changes in geographic area 3 Change % 2 Far East +28% Europe -3% Americas -15% 2013 2013 2012 £m % £m UK & Ireland +44% 1 Far East 10.1 35 7.9 2 Continental Europe 8.7 30 9.0 Res
Slide 22: Healthcare highlights
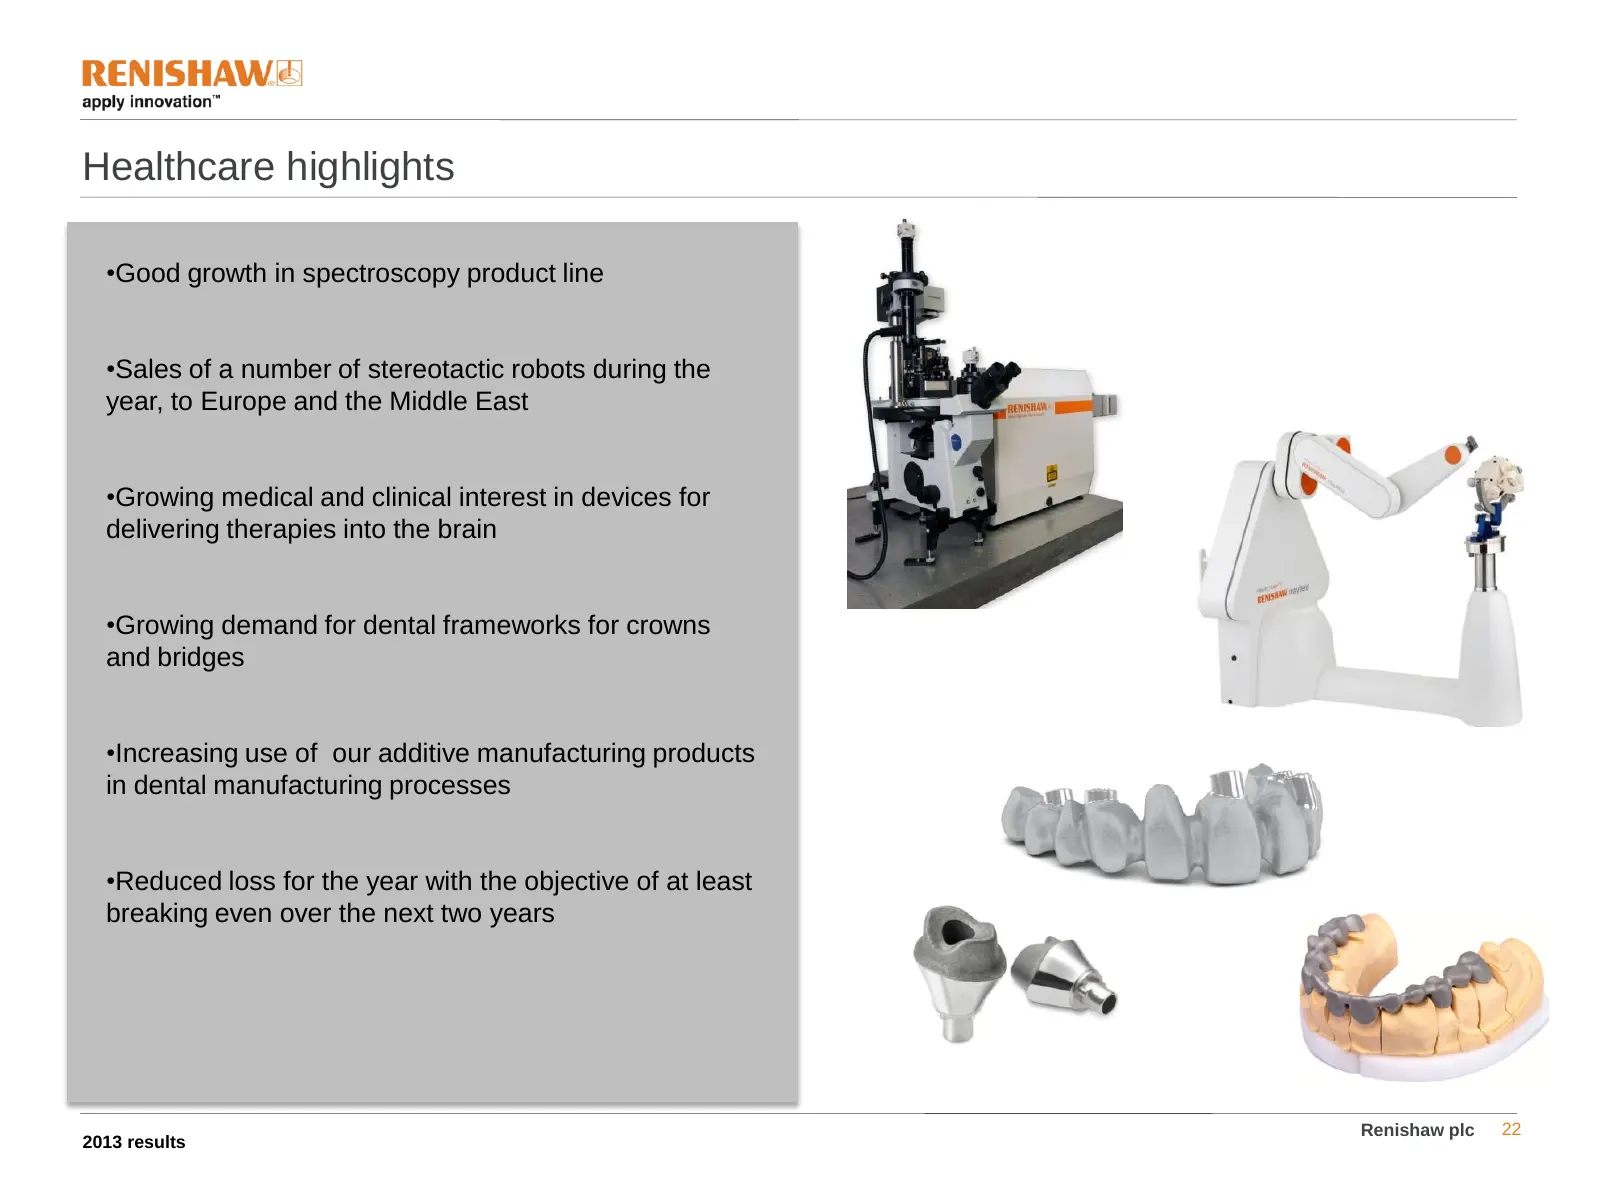
Healthcare highlights •Good growth in spectroscopy product line •Sales of a number of stereotactic robots during the year, to Europe and the Middle East •Growing medical and clinical interest in devices for delivering therapies into the brain •Growing demand for dental frameworks for crowns and brid
Slide 23: New product releases / Healthcare
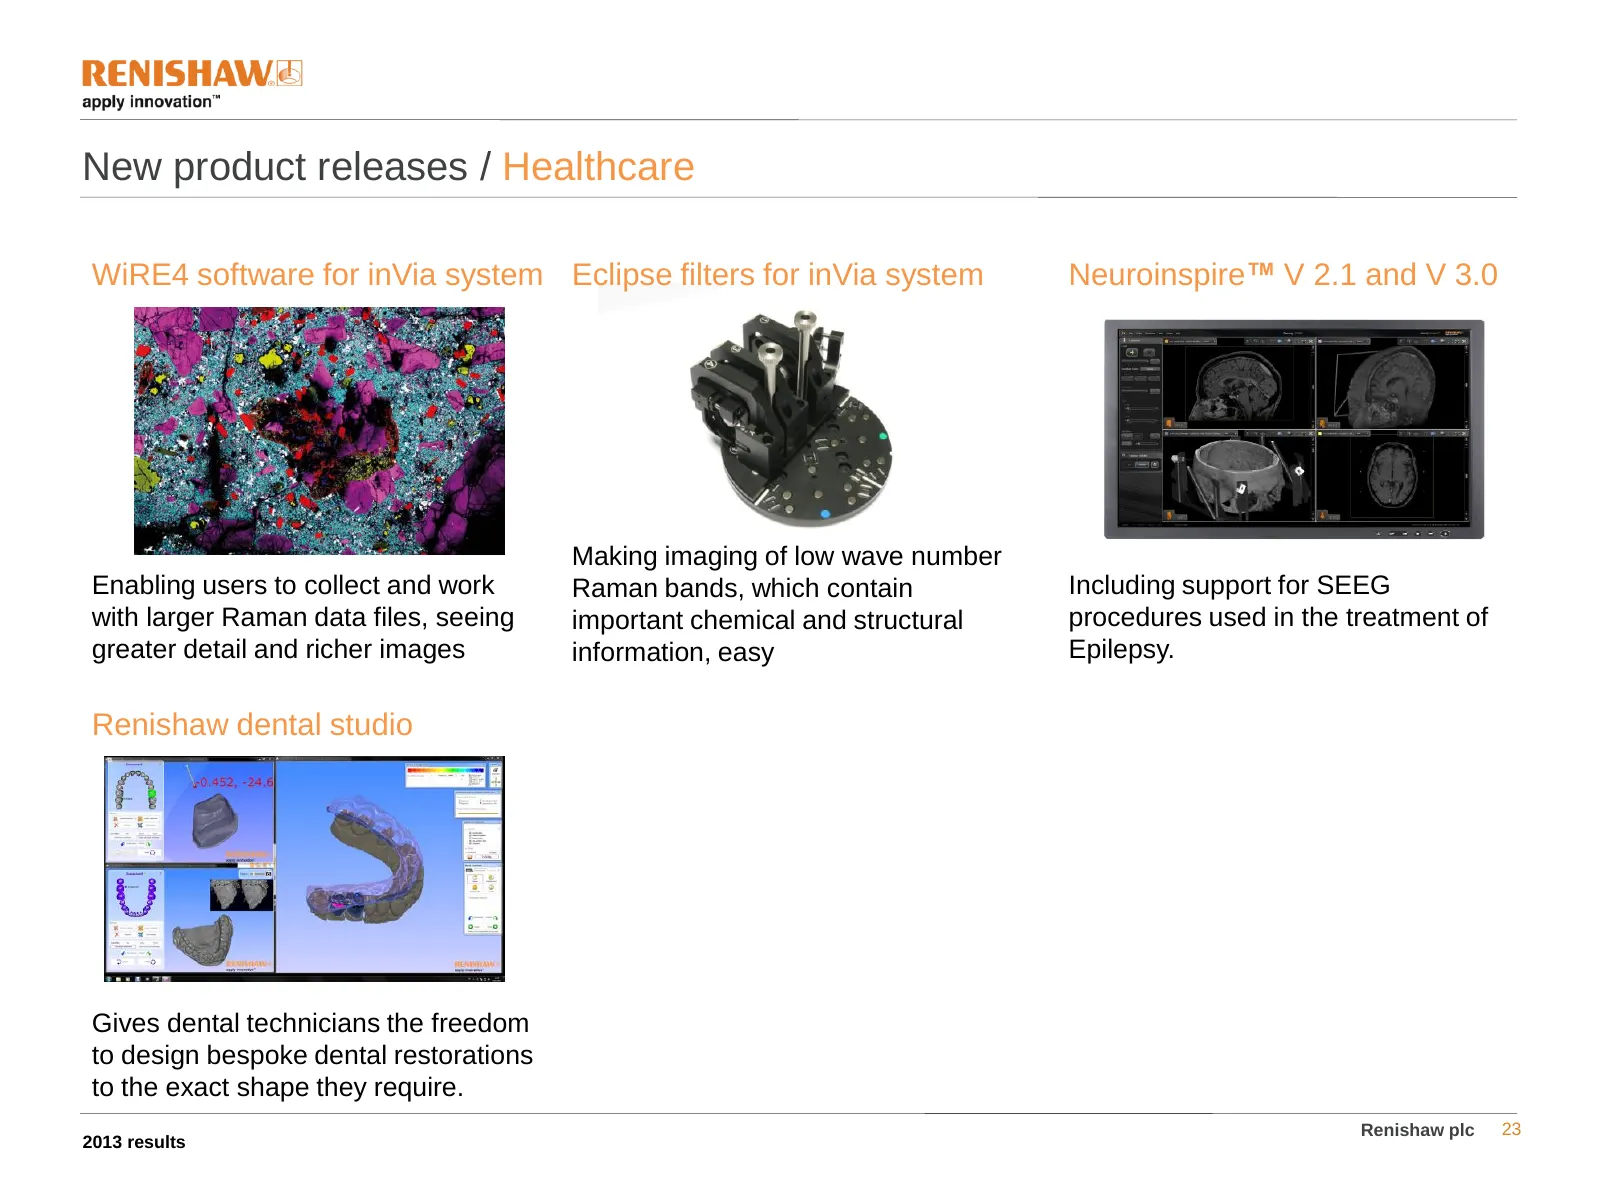
New product releases / Healthcare WiRE4 software for inVia system Eclipse filters for inVia system Neuroinspire™ V 2.1 and V 3.0 Making imaging of low wave number Enabling users to collect and work Raman bands, which contain Including support for SEEG with larger Raman data files, seeing important c
Slide 24: Awards
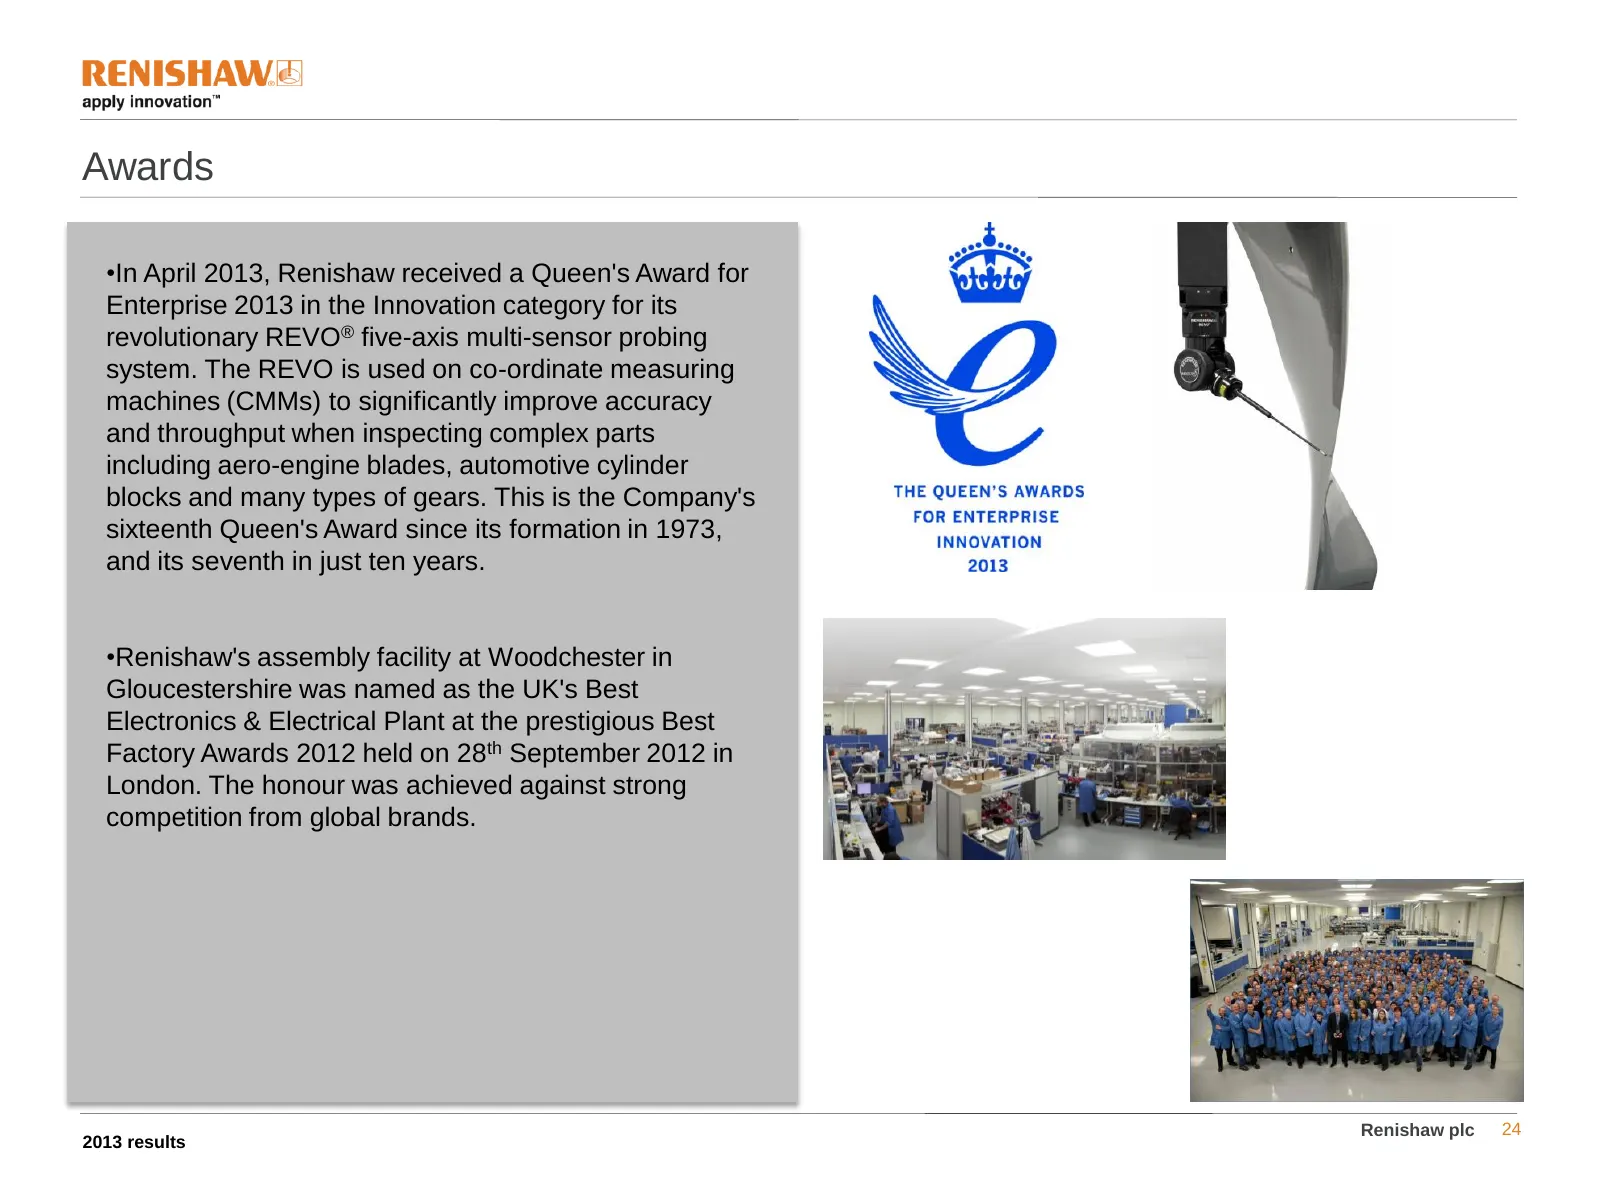
Awards •In April 2013, Renishaw received a Queen's Award for Enterprise 2013 in the Innovation category for its revolutionary REVO® five-axis multi-sensor probing system. The REVO is used on co-ordinate measuring machines (CMMs) to significantly improve accuracy and throughput when inspecting comple
Slide 25: Board of directors – Non-executive changes
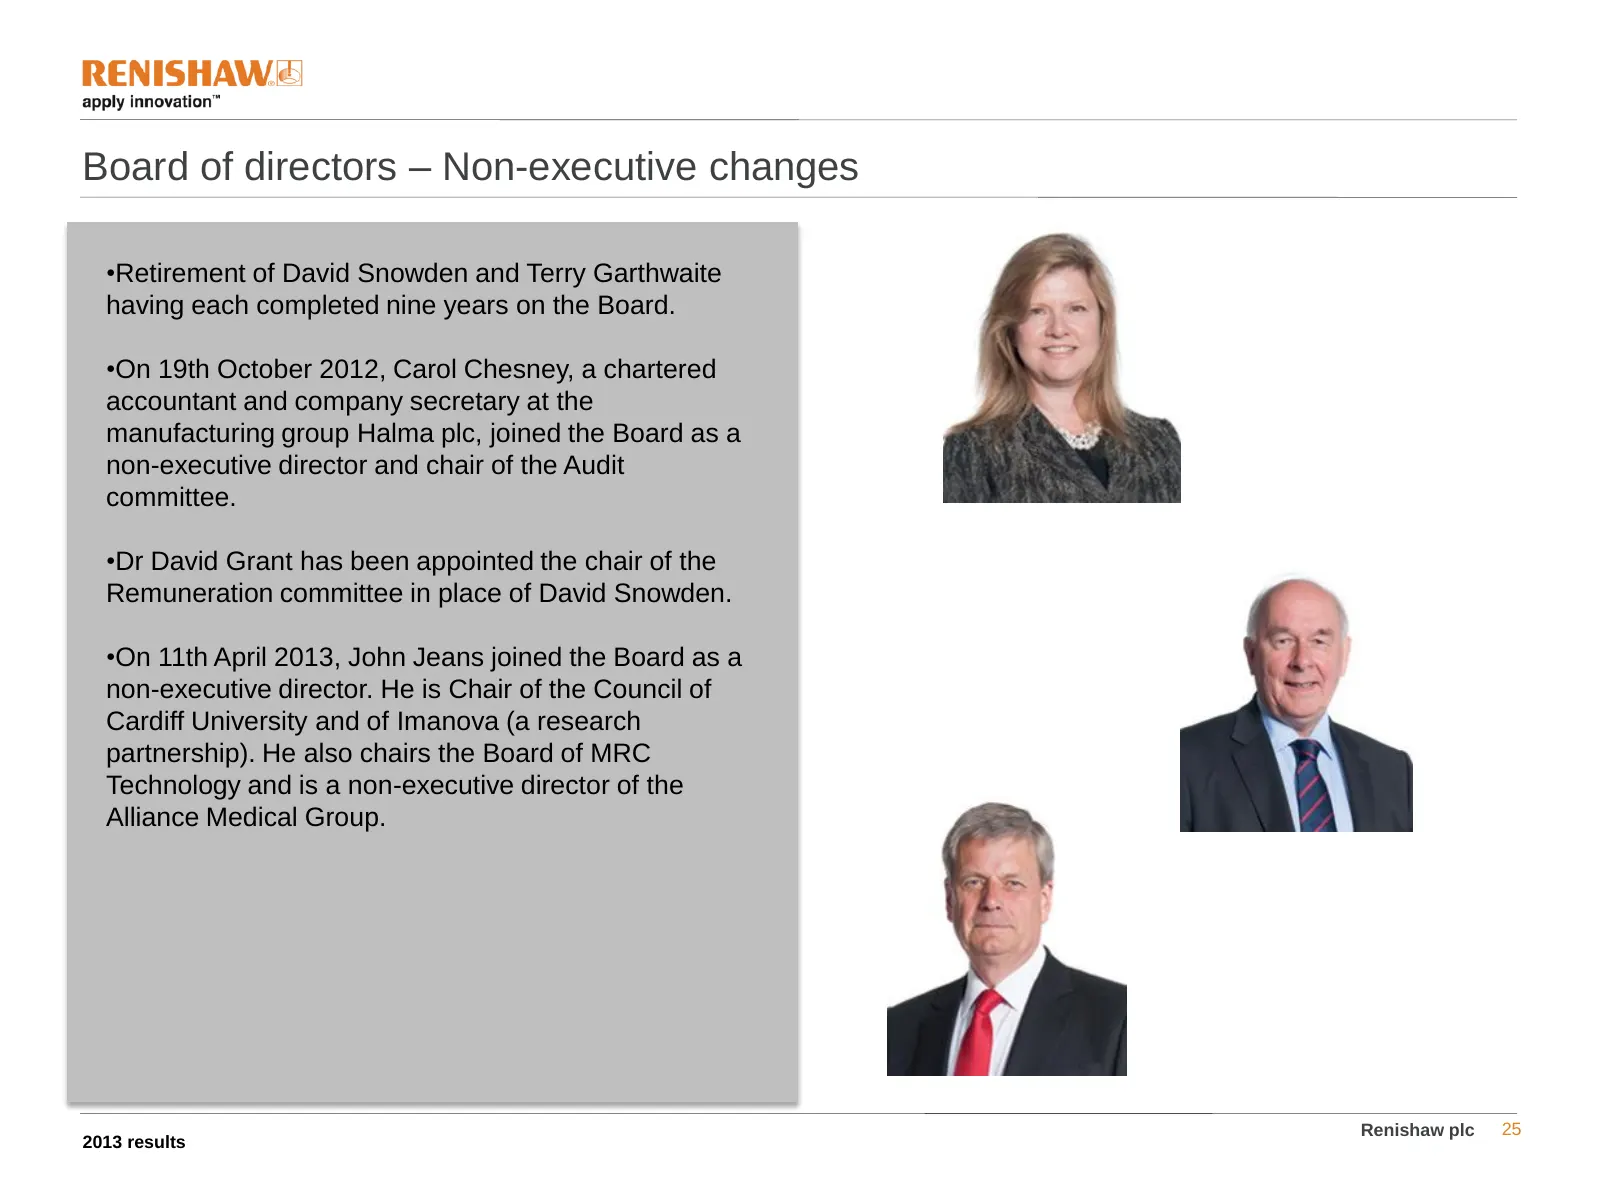
Board of directors – Non-executive changes •Retirement of David Snowden and Terry Garthwaite having each completed nine years on the Board. •On 19th October 2012, Carol Chesney, a chartered accountant and company secretary at the manufacturing group Halma plc, joined the Board as a non-executive dir
Slide 26: Cash flow
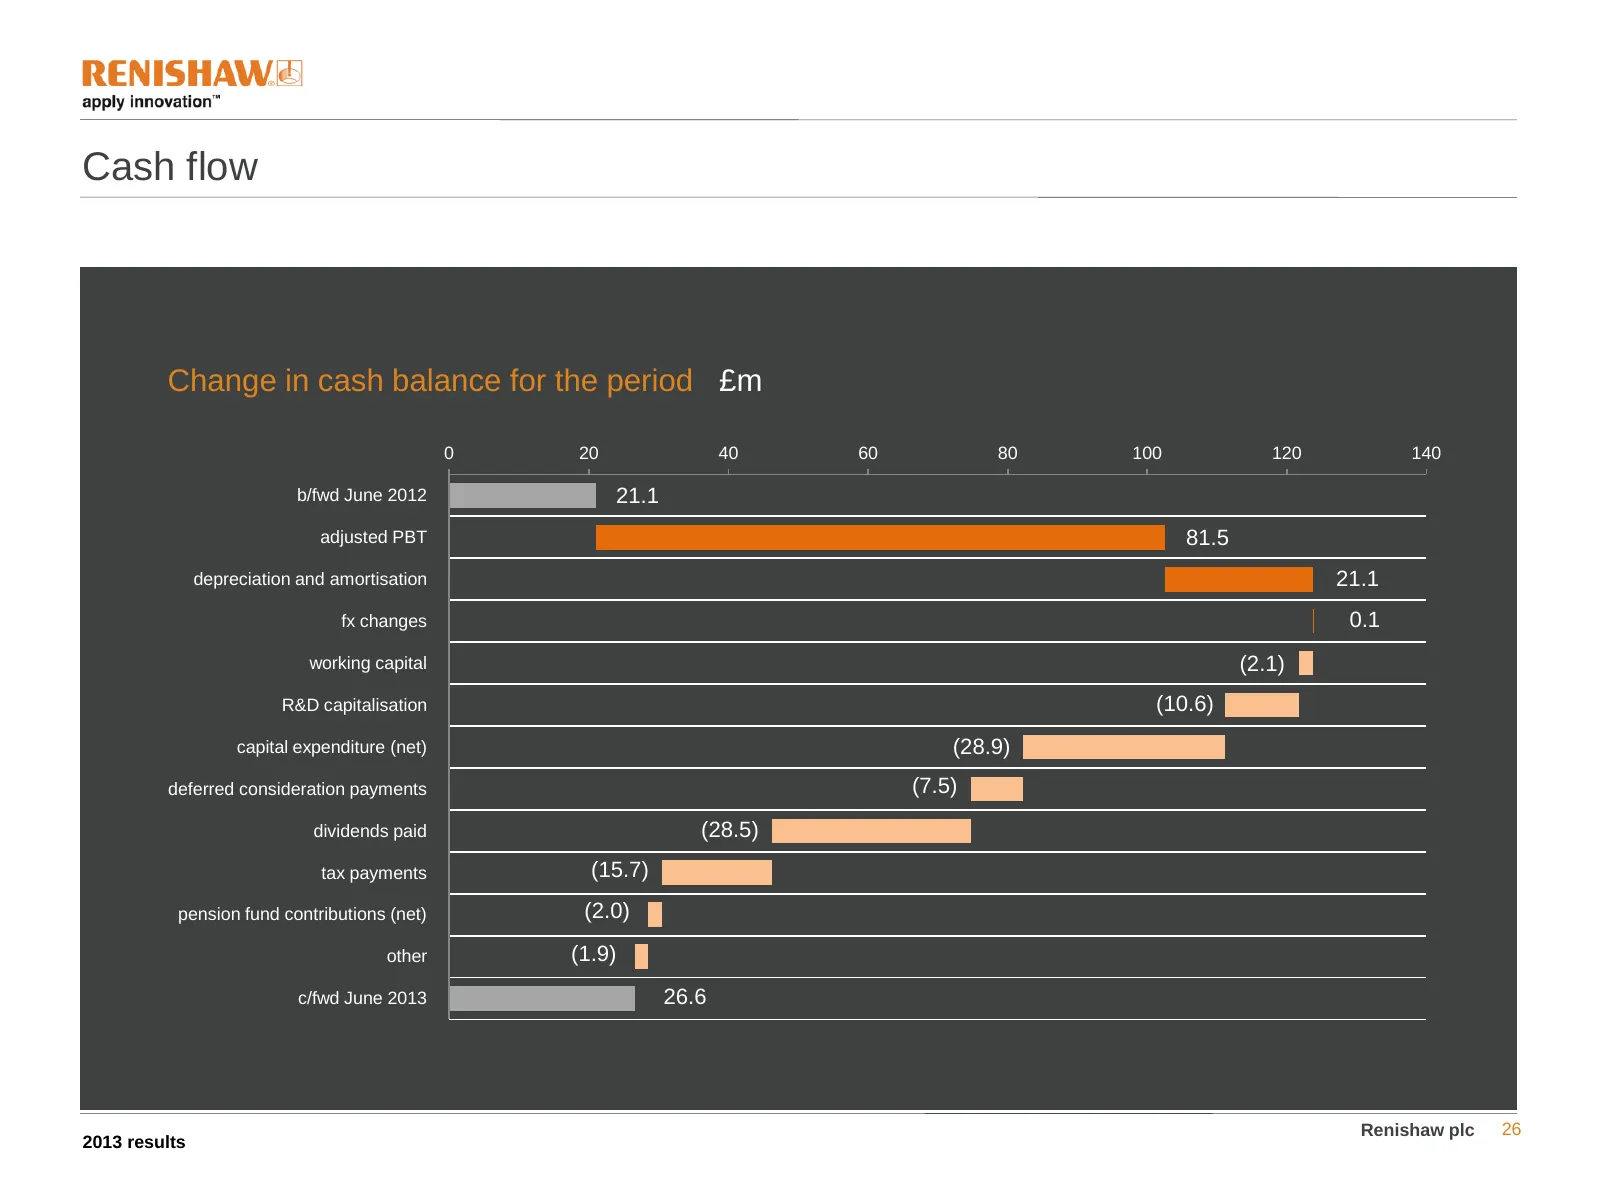
Cash flow Change in cash balance for the period £m 0 20 40 60 80 100 120 140 b/fwd June 2012 21.1 adjusted PBT 81.5 depreciation and amortisation 21.1 fx changes 0.1 working capital (2.1) R&D capitalisation (10.6) capital expenditure (net) (28.9) deferred consideration payments (7.5) dividends paid
Slide 27: Balance sheet
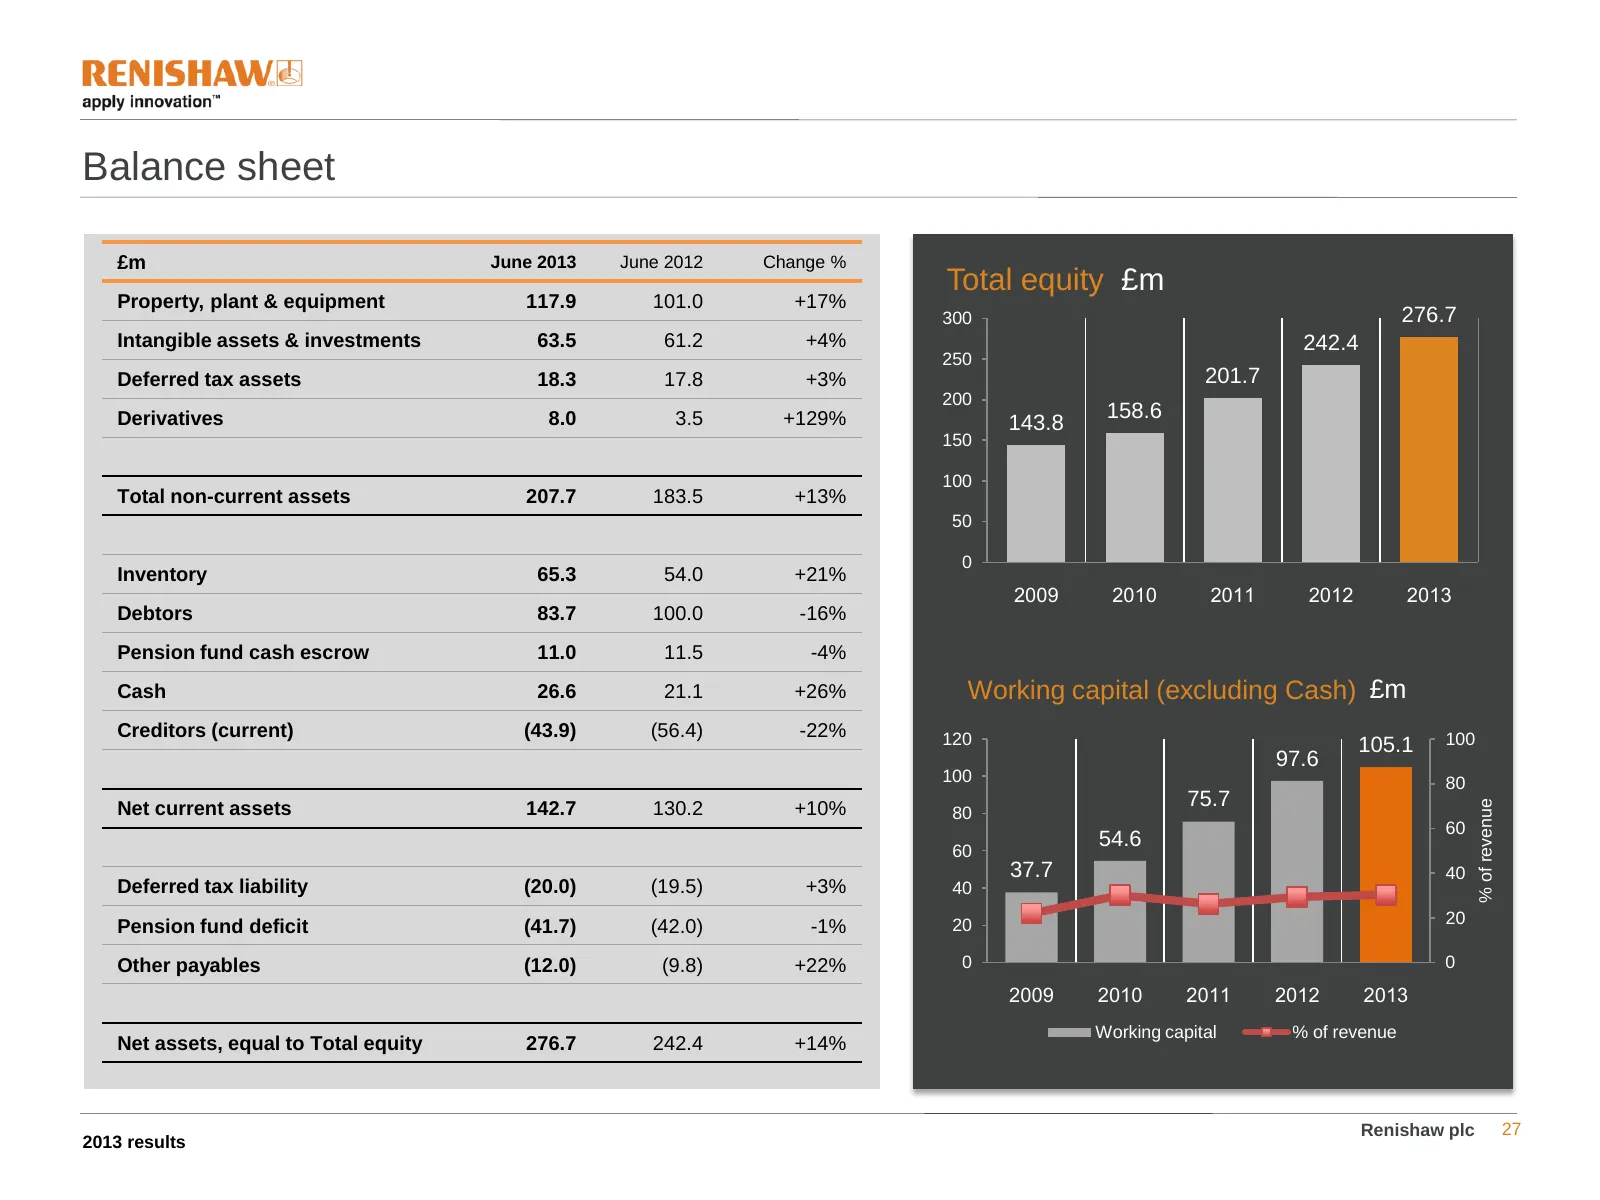
Balance sheet £m June 2013 June 2012 Change % Total equity £m Property, plant & equipment 117.9 101.0 +17% 300 276.7 Intangible assets & investments 63.5 61.2 +4% 242.4 250 Deferred tax assets 18.3 17.8 +3% 201.7 200 Derivatives 8.0 3.5 +129% 158.6 143.8 150 100 Total non-current assets 207.7 183.5
Slide 28: Capital expenditure
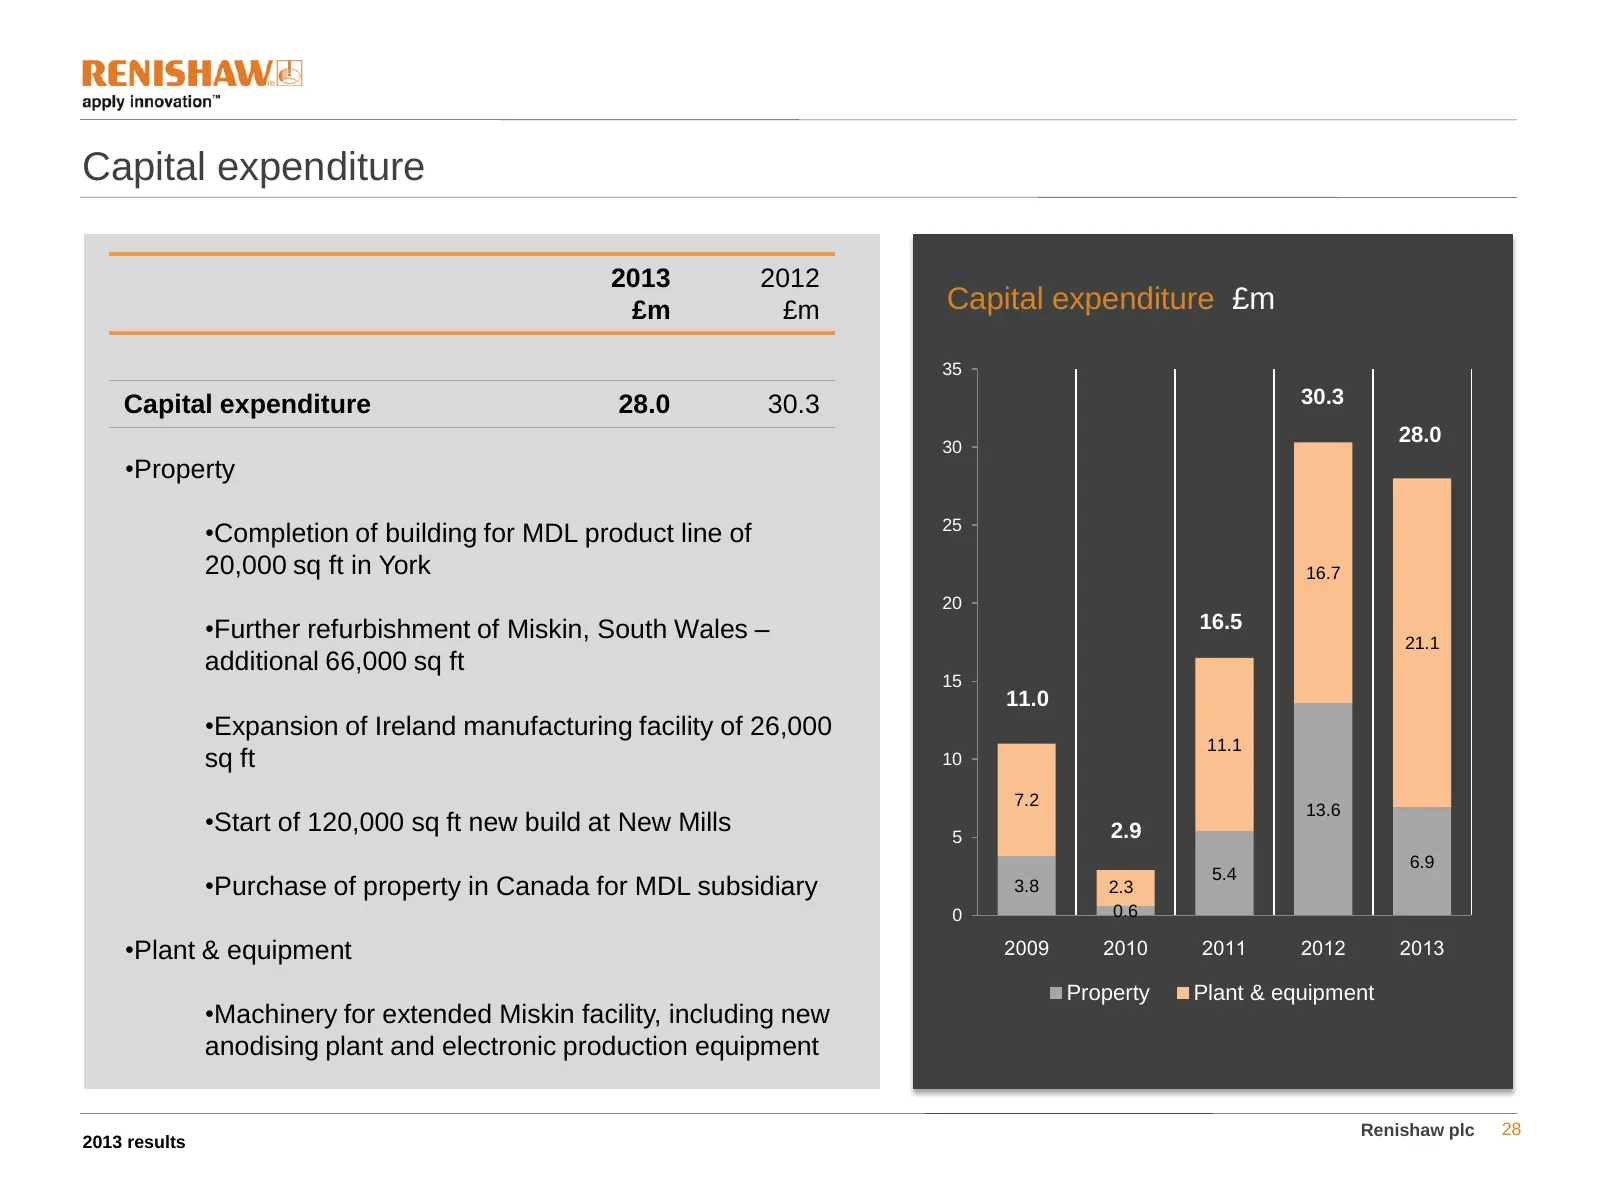
Capital expenditure 2013 2012 £m £m Capital expenditure £m 35 Capital expenditure 28.0 30.3 30.3 30 28.0 •Property 25 •Completion of building for MDL product line of 20,000 sq ft in York 16.7 20 •Further refurbishment of Miskin, South Wales – 16.5 21.1 additional 66,000 sq ft 15 11.0 •Expansion of I
Slide 29: Capital expenditure - property
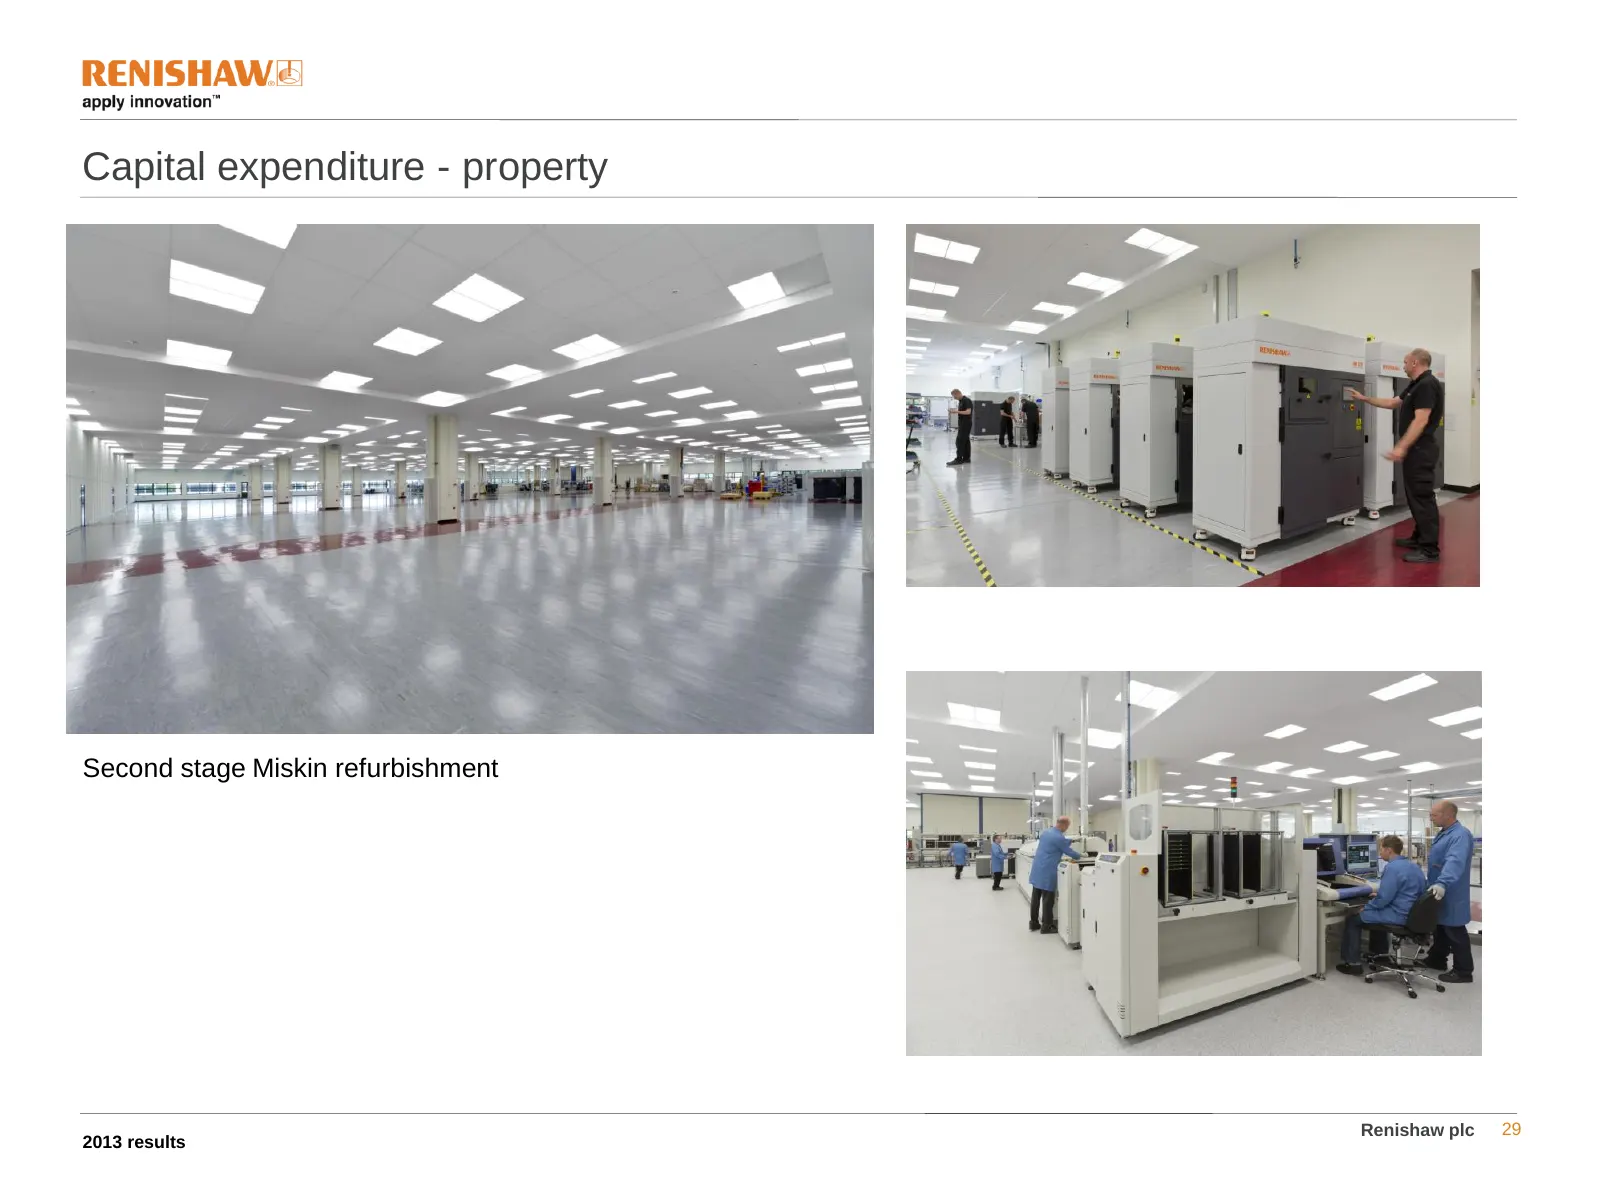
Capital expenditure - property Second stage Miskin refurbishment Renishaw plc 29 2013 results
Slide 30: Capital expenditure - property
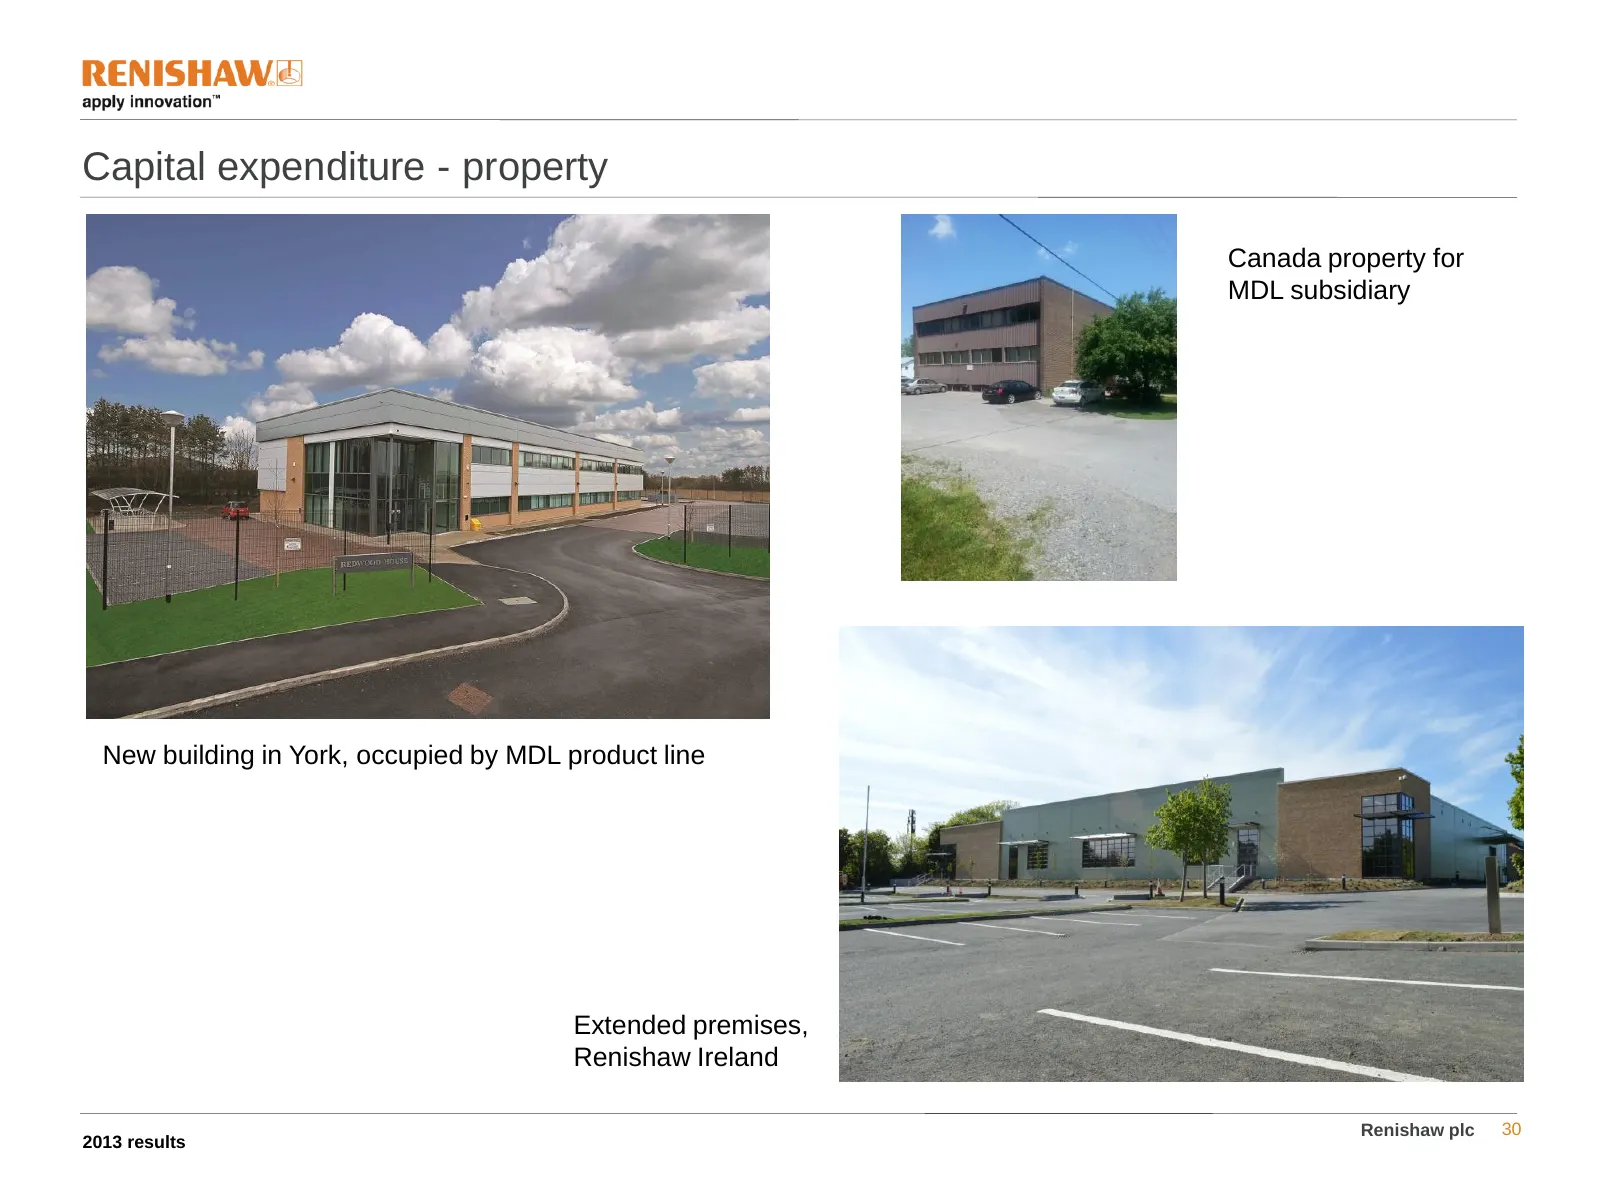
Capital expenditure - property Canada property for MDL subsidiary New building in York, occupied by MDL product line Extended premises, Renishaw Ireland Renishaw plc 30 2013 results
Slide 31: Capital expenditure - property
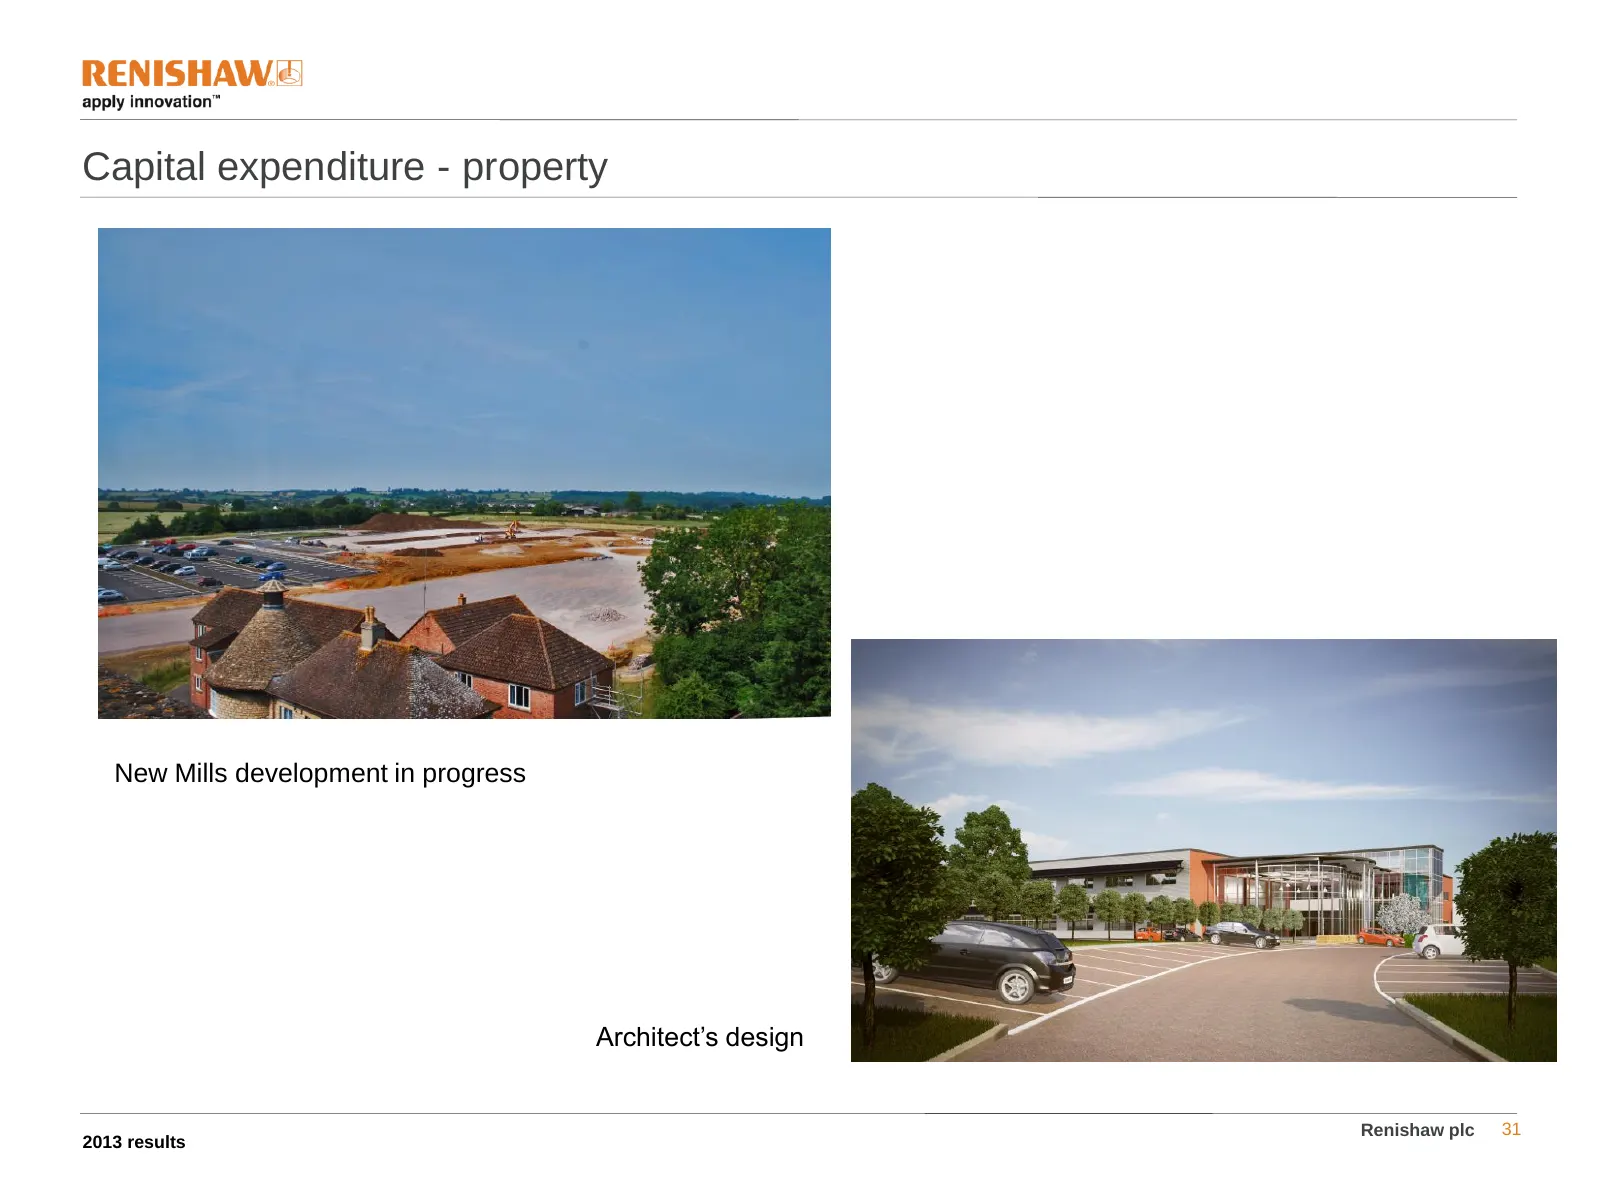
Capital expenditure - property New Mills development in progress Architect’s design Renishaw plc 31 2013 results
Slide 32: Miskin plans
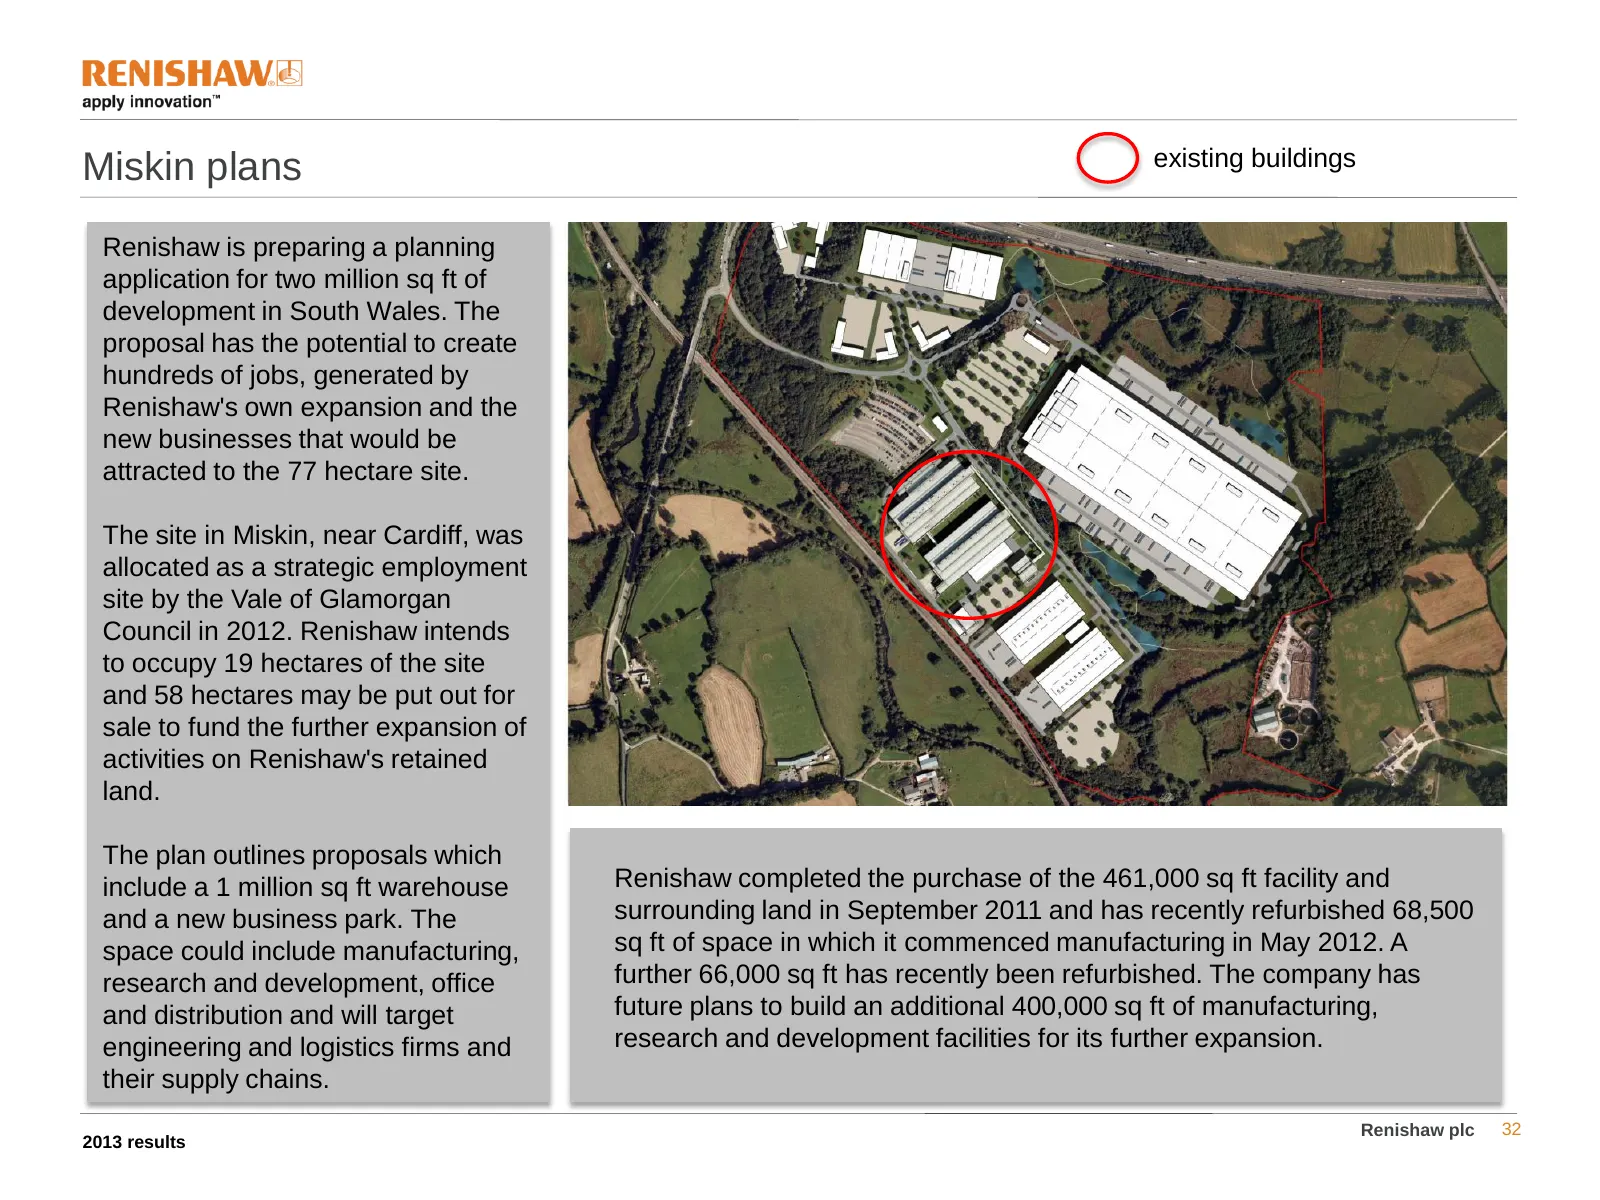
Miskin plans existing buildings Renishaw is preparing a planning application for two million sq ft of development in South Wales. The proposal has the potential to create hundreds of jobs, generated by Renishaw's own expansion and the new businesses that would be attracted to the 77 hectare site. Th
Slide 33: Investor communication
Investor communication During the year the Board has reviewed its policy on communications with shareholders and the analyst and investor community. The Board will provide all shareholders with information at the same time, in the same forum or medium, and ensure that the level and quality of inform
Slide 34: Outlook
Outlook During the year the Group has further consolidated its leading position in its principal markets, as well as investing for future growth and expansion. There is an extensive new product pipeline and strategy for each of our business segments and a number of new product introductions are anti

Slide 35: Questions?
Questions ? Renishaw plc 35 2013 results
Slide 36: Cash flow from operating activities
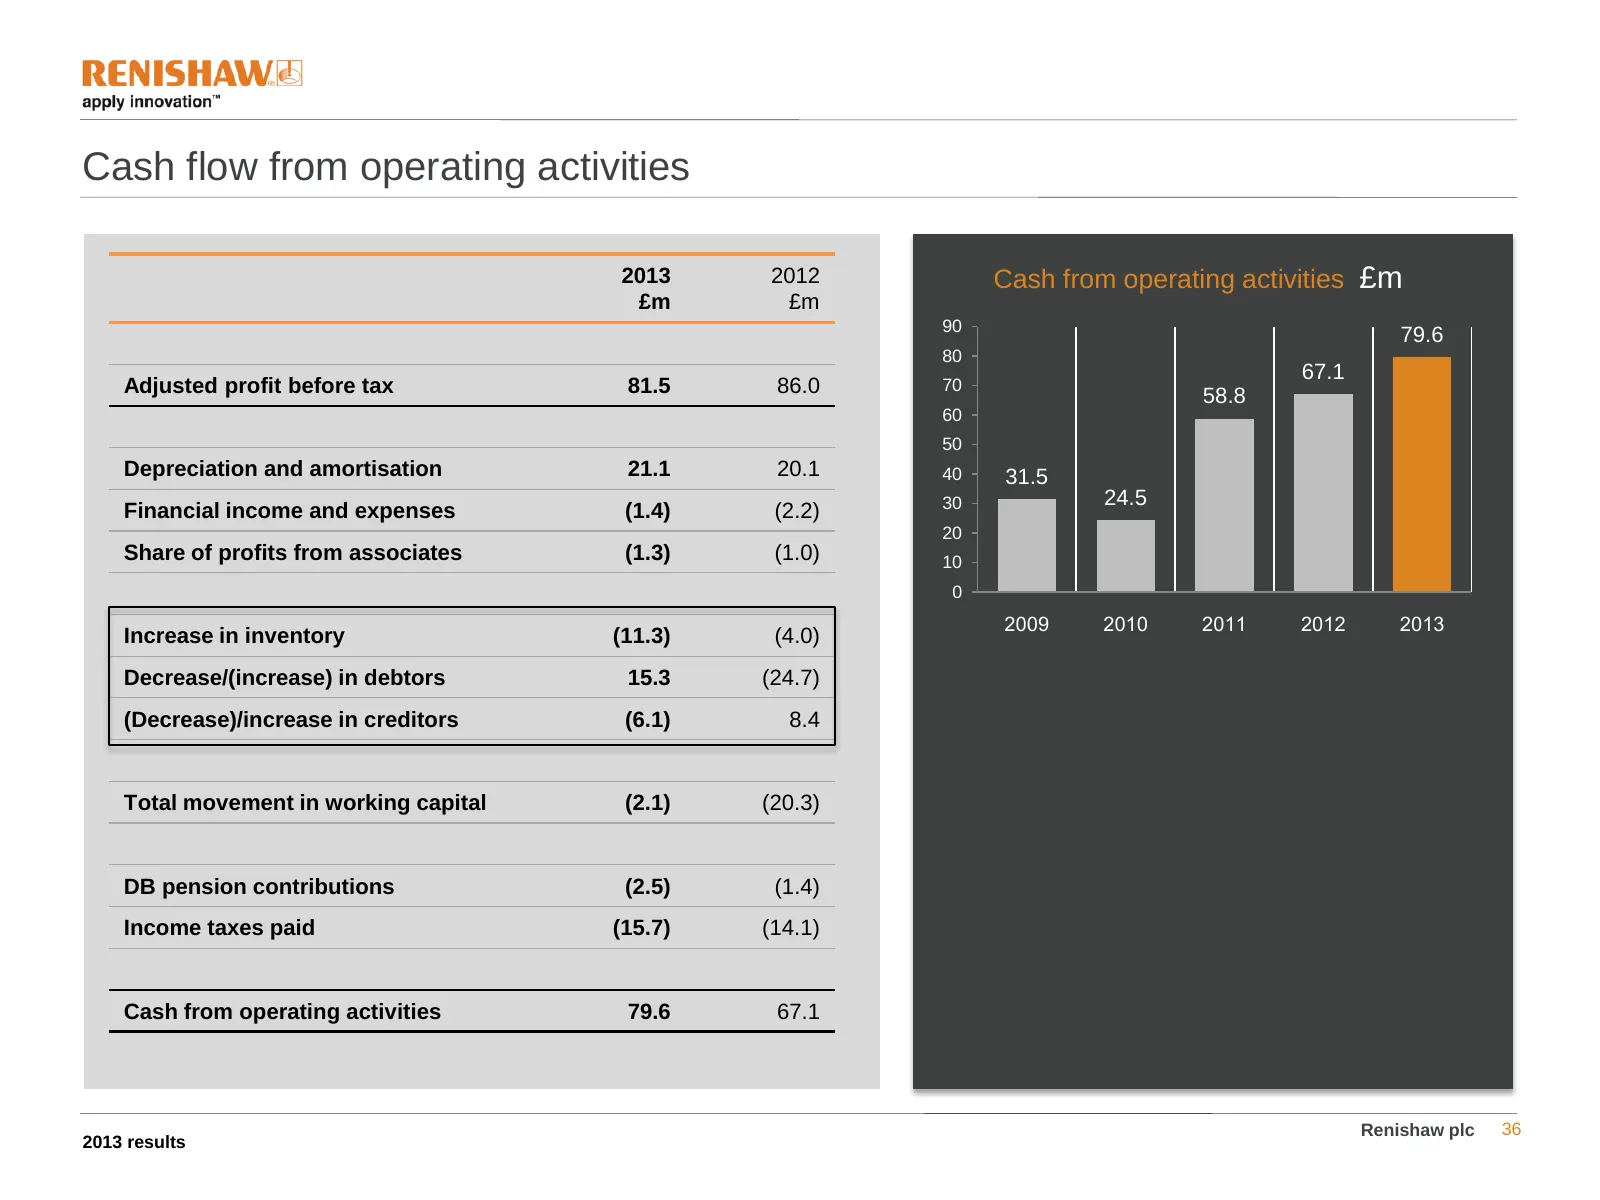
Cash flow from operating activities 2013 2012 Cash from operating activities £m £m £m 90 79.6 80 67.1 Adjusted profit before tax 81.5 86.0 70 58.8 60 50 Depreciation and amortisation 21.1 20.1 40 31.5 30 24.5 Financial income and expenses (1.4) (2.2) 20 Share of profits from associates (1.3) (1.0) 1
Slide 37: Cash flow
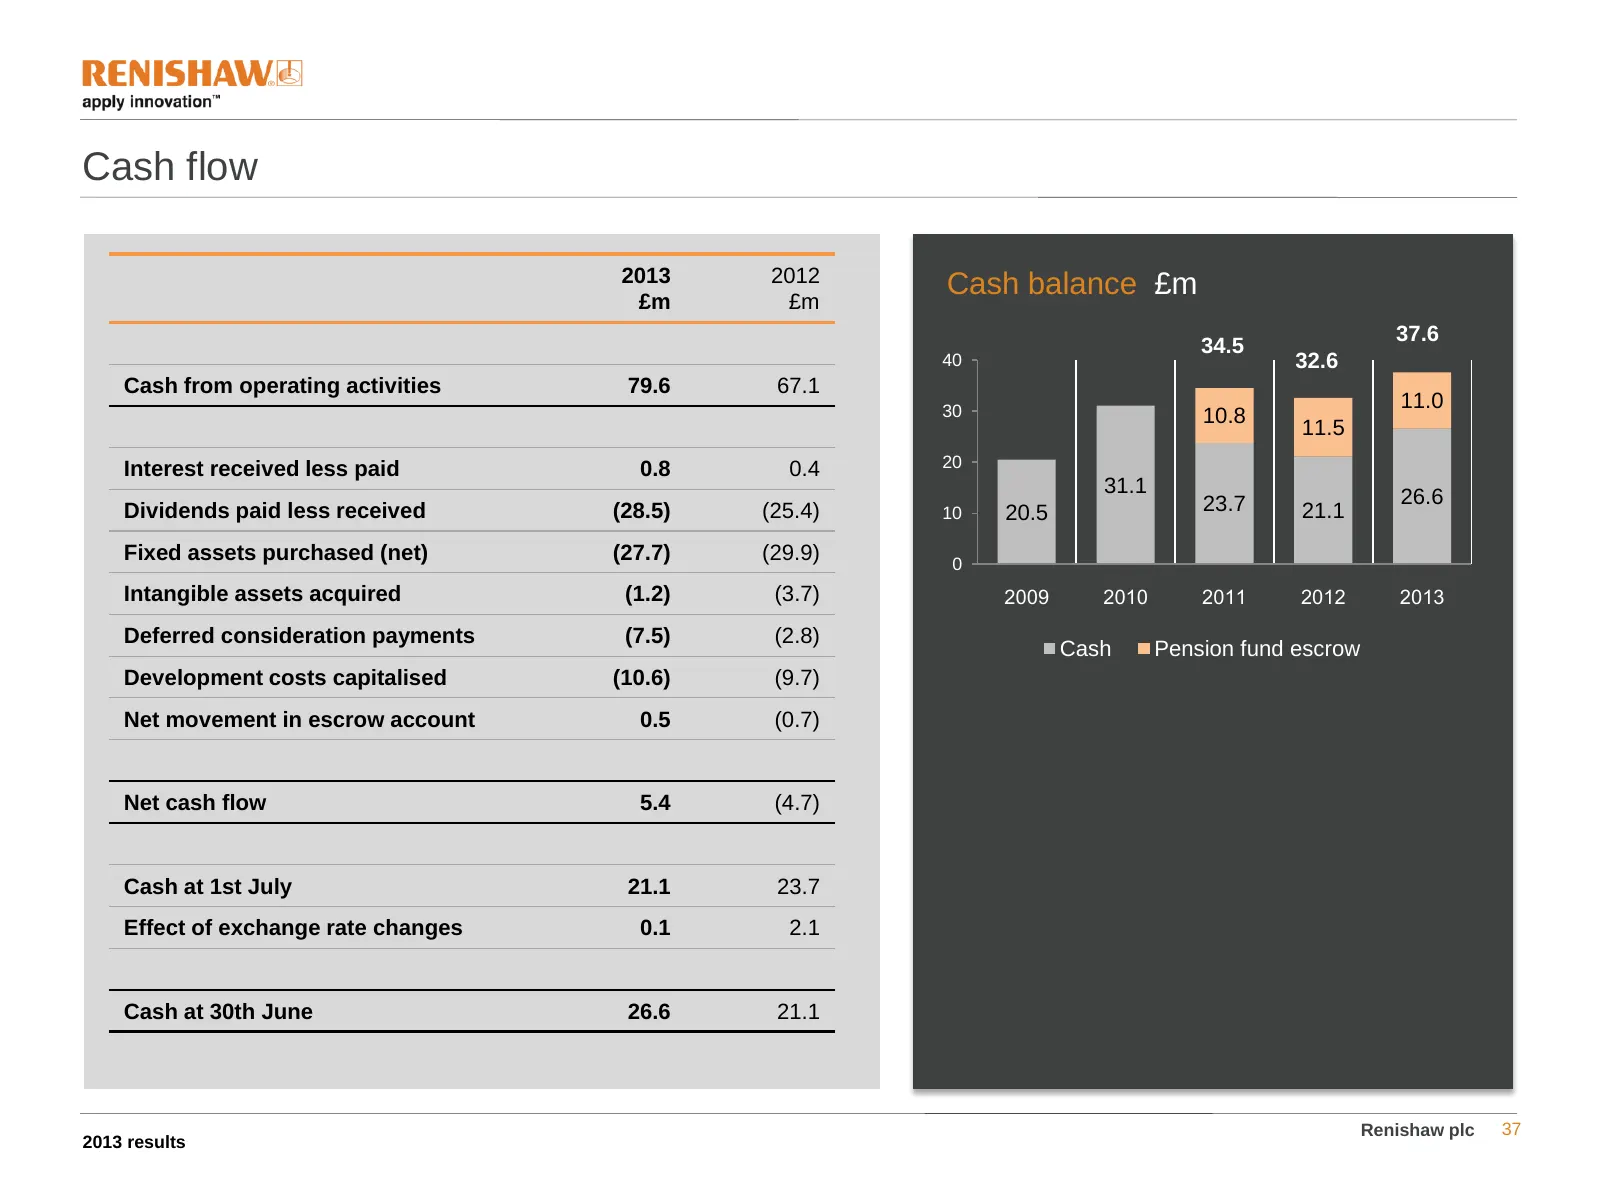
Cash flow 2013 2012 Cash balance £m £m £m 37.6 34.5 40 32.6 Cash from operating activities 79.6 67.1 30 11.0 10.8 11.5 Interest received less paid 0.8 0.4 20 31.1 23.7 26.6 Dividends paid less received (28.5) (25.4) 10 20.5 21.1 Fixed assets purchased (net) (27.7) (29.9) 0 Intangible assets acquired
Slide 38: Disclaimer
Disclaimer This document contains statements about Renishaw plc that are or may be forward-looking statements. These forward-looking statements are not guarantees of future performance. They have not been reviewed by the auditors of Renishaw plc. They involve known and unknown risks, uncertainties a
Source: Internet Archive copy of renishaw.com