ATS Corporation · TSX:ATS
ATS — Investor Presentation (November 2023)
24 slides from ATS's investor presentation, November 2023

Slide 1: Investor Presentation November 2023
Investor Presentation November 2023
Slide 2: Disclaimer
Disclaimer Note to Reader: This informational meeting regarding ATS Corporation is for you to familiarize yourself with the Company. We are not making any offers of securities at this time, and cannot accept orders for any securities at this time. Accordingly, this presentation shall not constitute
Slide 3: Disclaimer
Disclaimer Non-IFRS and Other Financial Measures: Throughout this presentation management uses certain non-IFRS financial measures, non-IFRS ratios and supplementary financial measures to evaluate the performance of the Company. The terms “EBITDA”, “organic revenue”, “adjusted EBITDA”, and “free cas
Slide 4: A Decentralized Automation & Technology Leader
A Decentralized Automation & Technology Leader Strategic Provider of End-to-End Automation Solutions Strong Execution Across Our Business Driving Performance and Innovation Delivering Improvement and Growth Positioned for Continued Strong Performance 4
Slide 5: ATS at a Glance
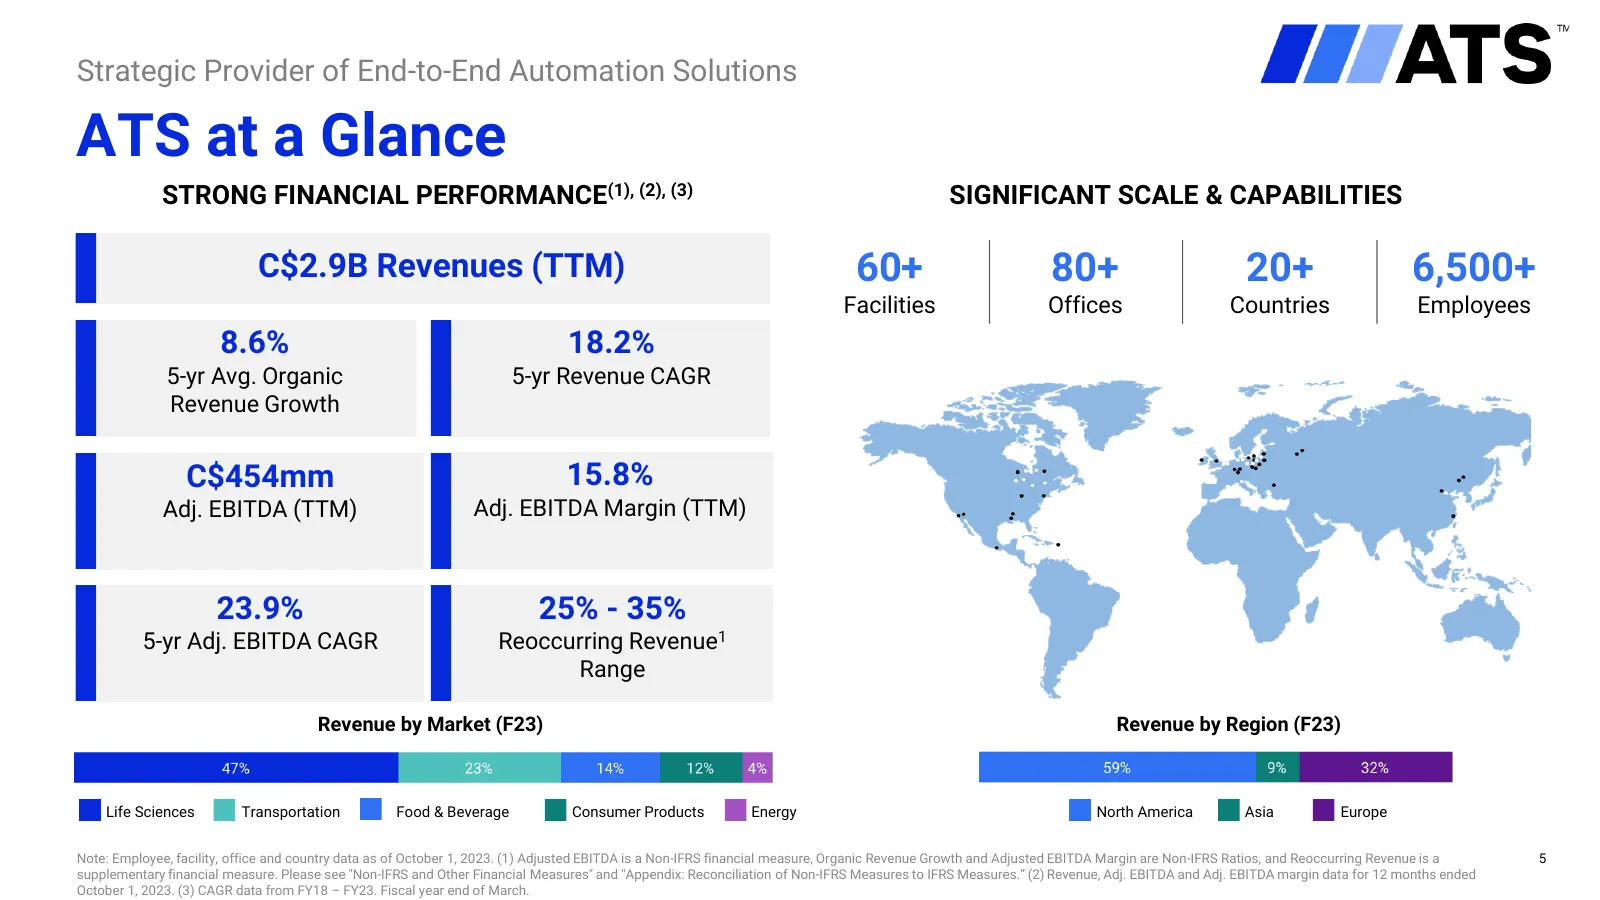
Strategic Provider of End-to-End Automation Solutions ATS at a Glance STRONG FINANCIAL PERFORMANCE(1), (2), (3) SIGNIFICANT SCALE & CAPABILITIES C$2.9B Revenues (TTM) 60+ 80+ 20+ 6,500+ Facilities Offices Countries Employees 8.6% 18.2% 5-yr Avg. Organic 5-yr Revenue CAGR Revenue Growth C$454mm 15.8%
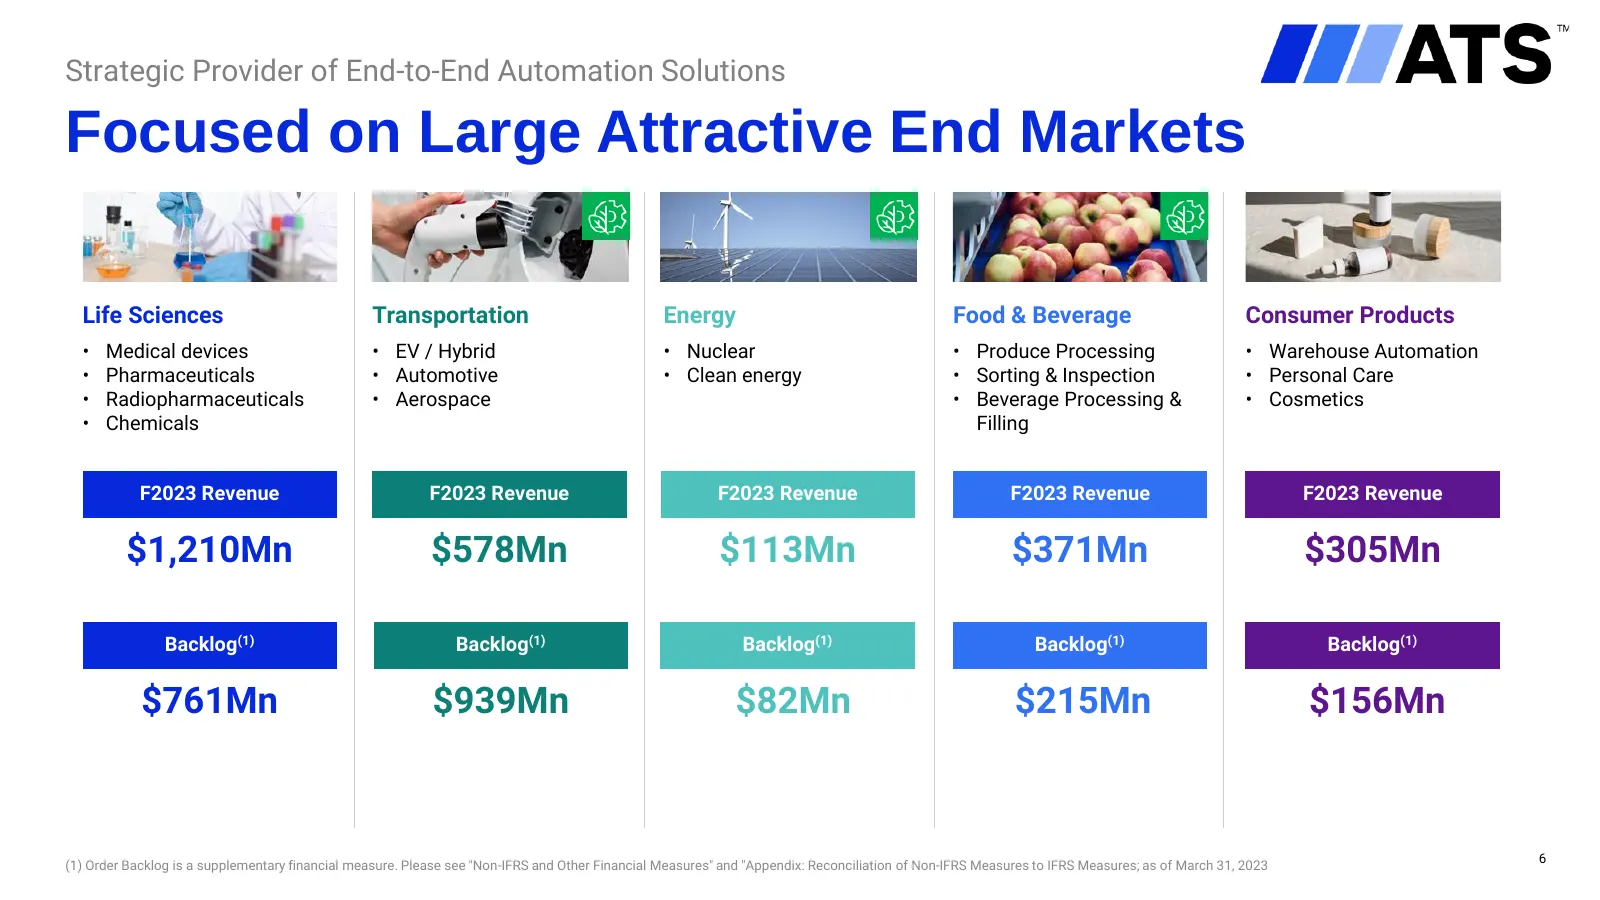
Slide 6: Focused on Large Attractive End Markets
Strategic Provider of End-to-End Automation Solutions Focused on Large Attractive End Markets Life Sciences Transportation Energy Food & Beverage Consumer Products • Medical devices • EV / Hybrid • Nuclear • Produce Processing • Warehouse Automation • Pharmaceuticals • Automotive • Clean energy • So
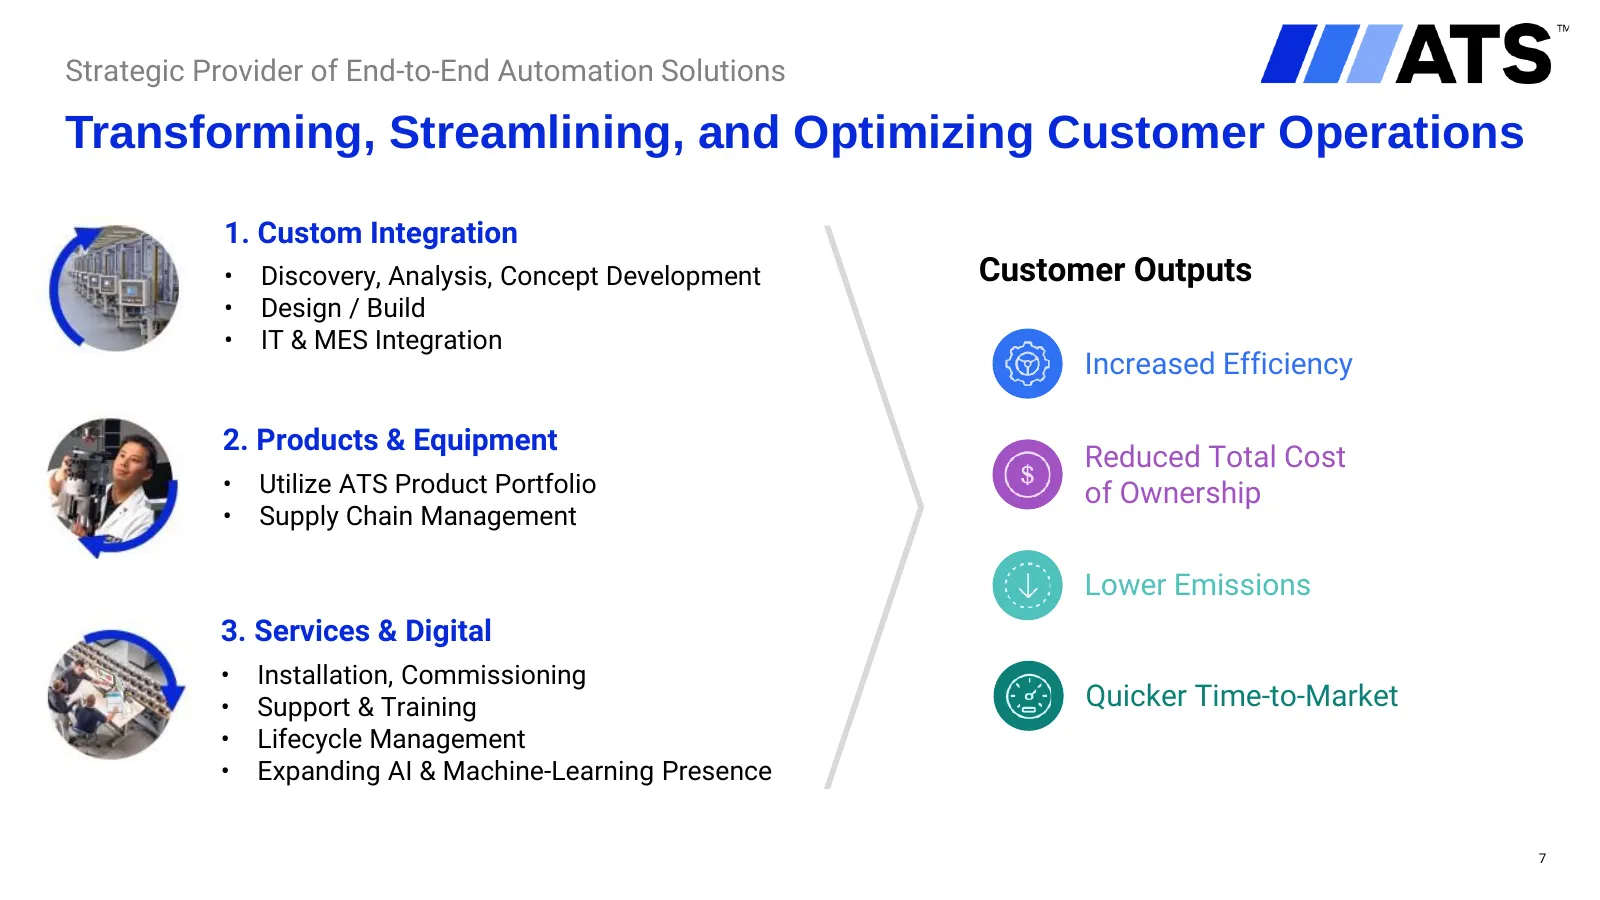
Slide 7: Transforming, Streamlining, and Optimizing Customer Operations
Strategic Provider of End-to-End Automation Solutions Transforming, Streamlining, and Optimizing Customer Operations 1. Custom Integration • Discovery, Analysis, Concept Development Customer Outputs • Design / Build • IT & MES Integration Increased Efficiency 2. Products & Equipment Reduced Total Co
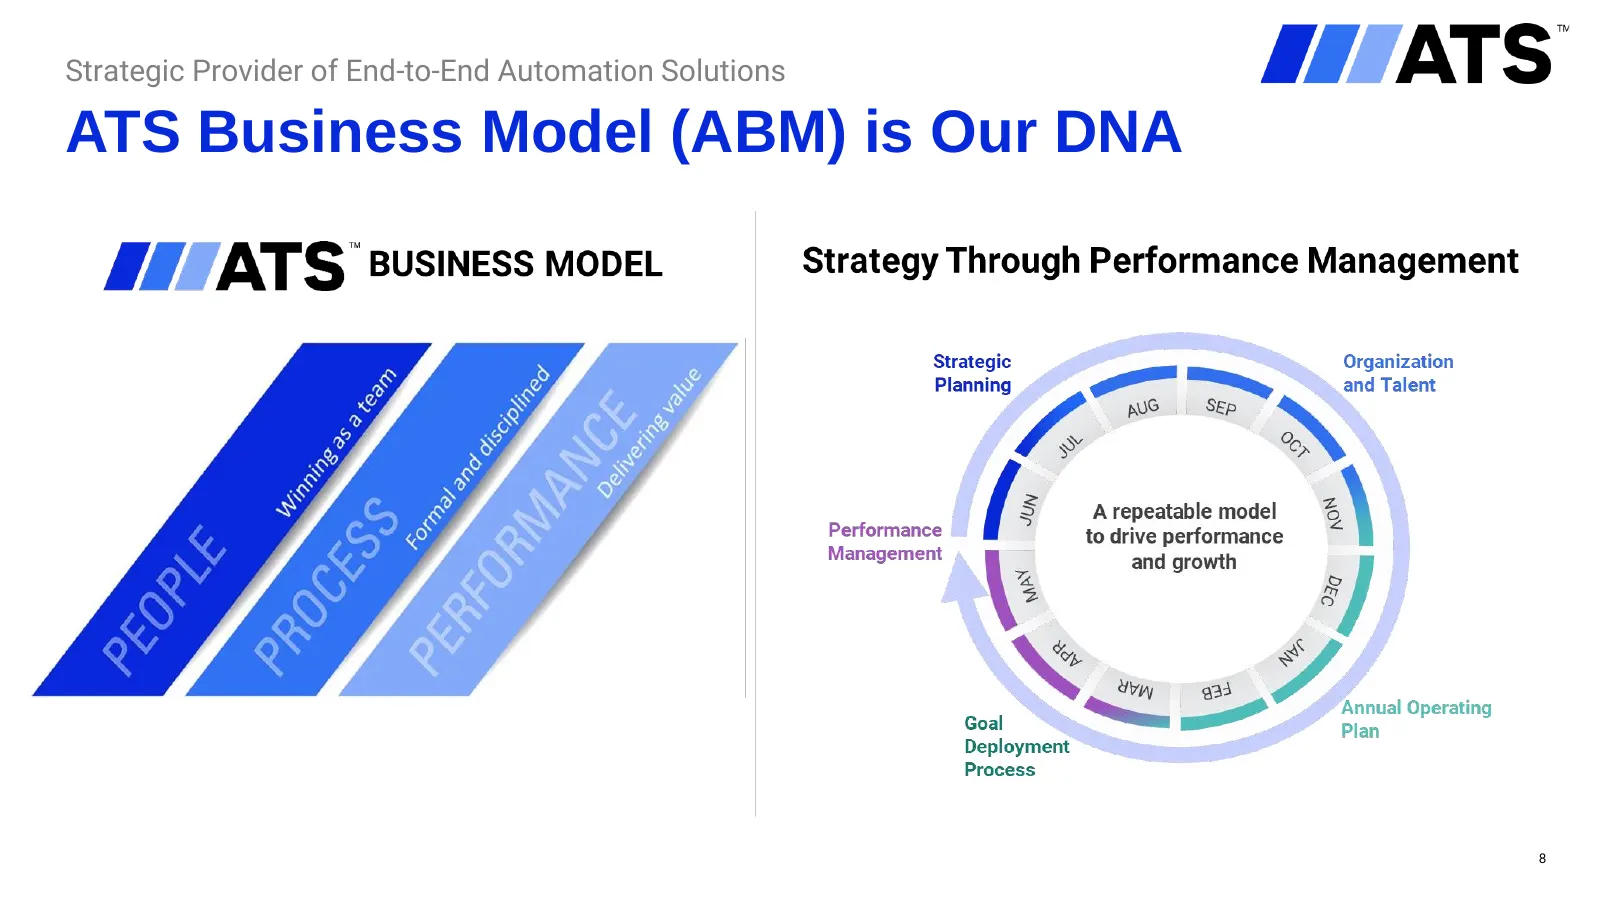
Slide 8: ATS Business Model (ABM) is Our DNA
Strategic Provider of End-to-End Automation Solutions ATS Business Model (ABM) is Our DNA 8
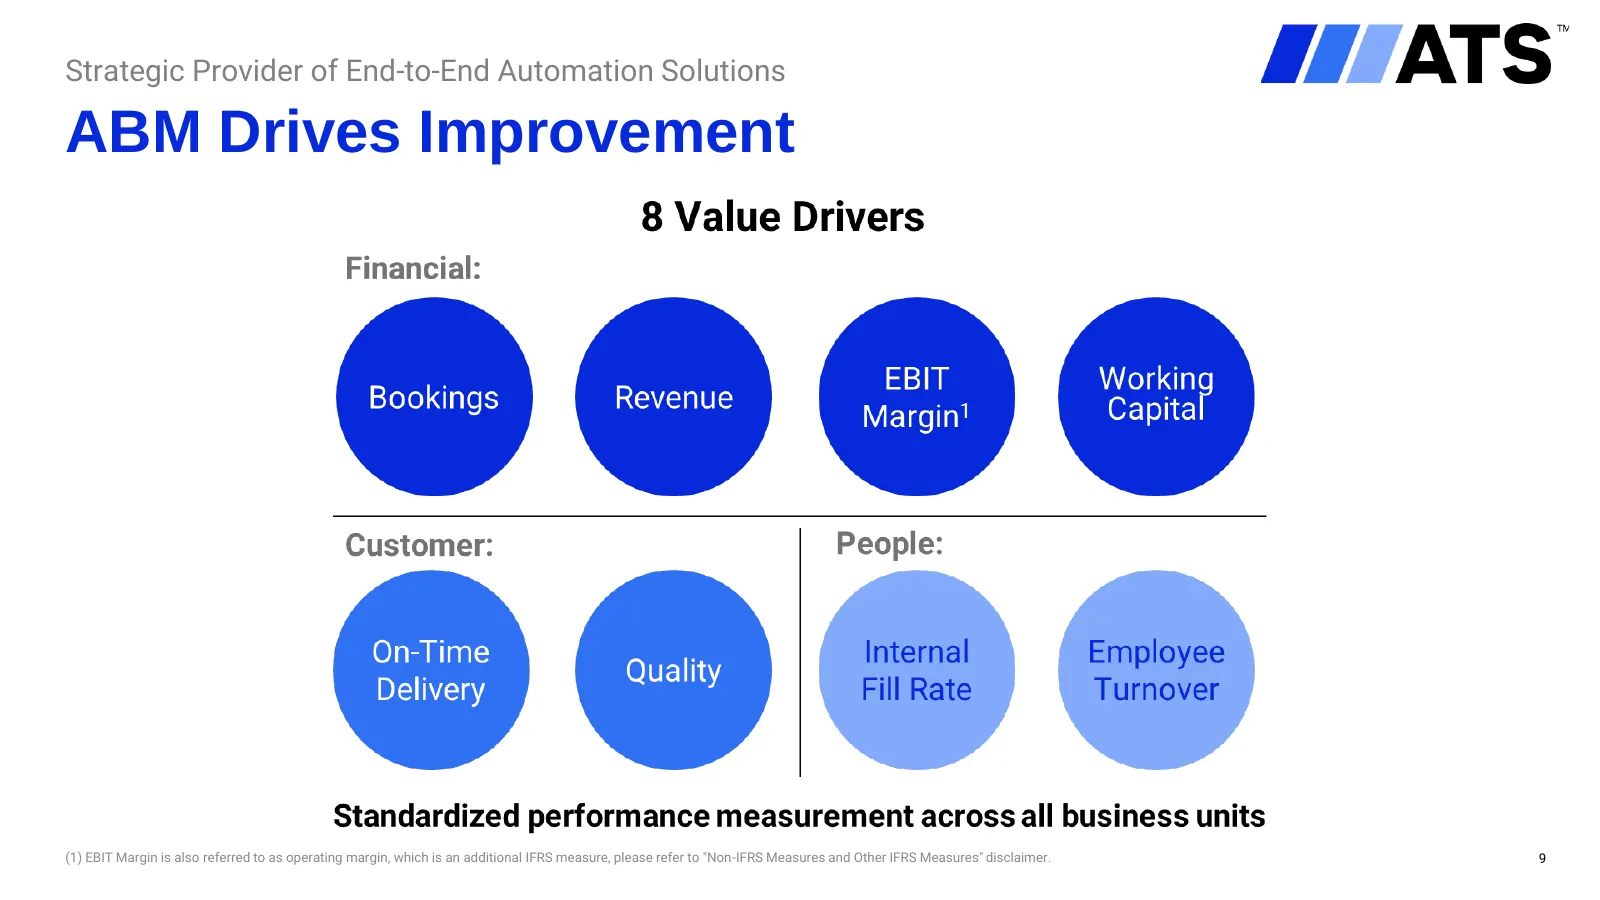
Slide 9: ABM Drives Improvement
Strategic Provider of End-to-End Automation Solutions ABM Drives Improvement (1) EBIT Margin is also referred to as operating margin, which is an additional IFRS measure, please refer to "Non-IFRS Measures and Other IFRS Measures" disclaimer. 9
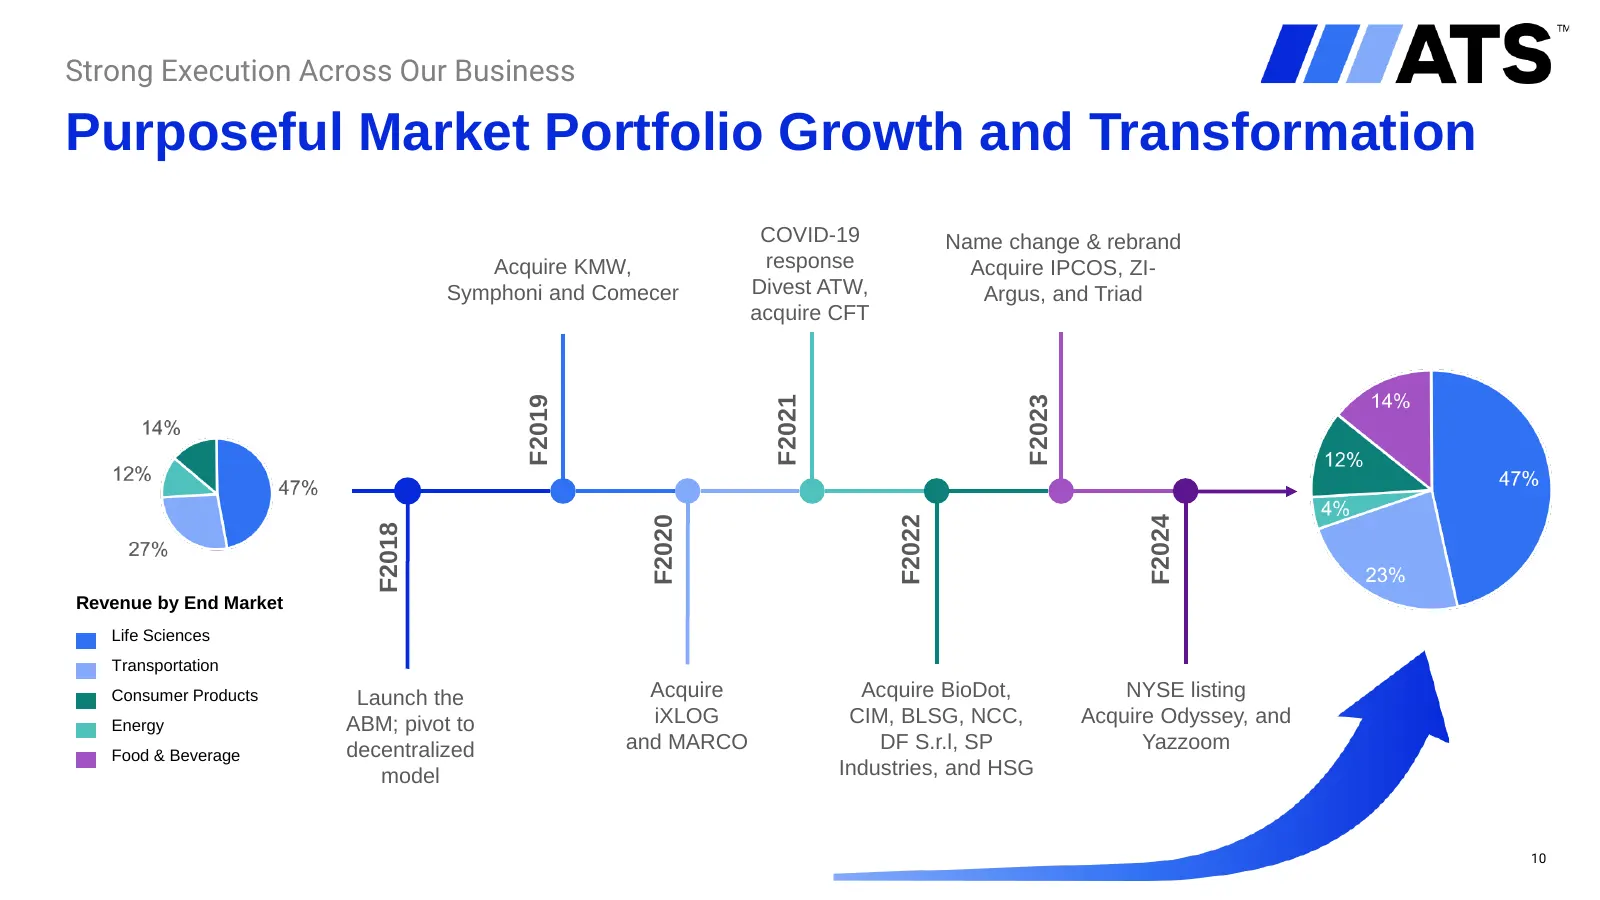
Slide 10: Purposeful Market Portfolio Growth and Transformation
Strong Execution Across Our Business Purposeful Market Portfolio Growth and Transformation COVID-19 Name change & rebrand Acquire KMW, response Acquire IPCOS, ZI- Symphoni and Comecer Divest ATW, Argus, and Triad acquire CFT F2019 F2021 F2023 F2022 F2020 F2024 F2018 Revenue by End Market Life Scienc
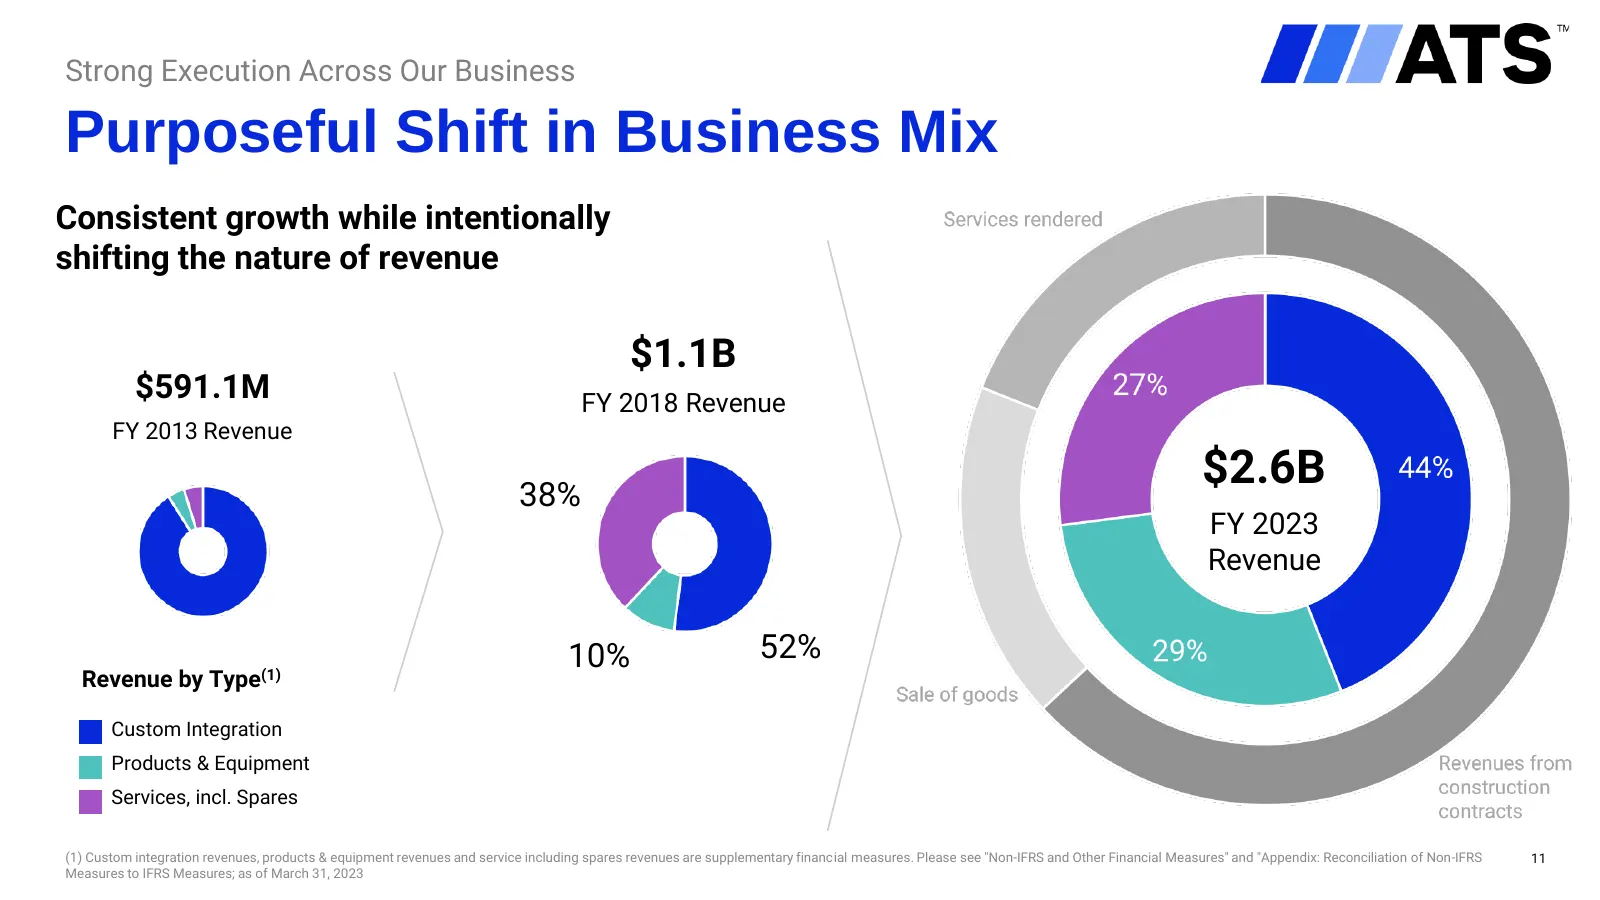
Slide 11: Purposeful Shift in Business Mix
Strong Execution Across Our Business Purposeful Shift in Business Mix Consistent growth while intentionally shifting the nature of revenue $1.1B $591.1M FY 2018 Revenue FY 2013 Revenue 38% $2.6B FY 2023 Revenue 10% 52% Revenue by Type(1) Custom Integration Products & Equipment Services, incl. Spares
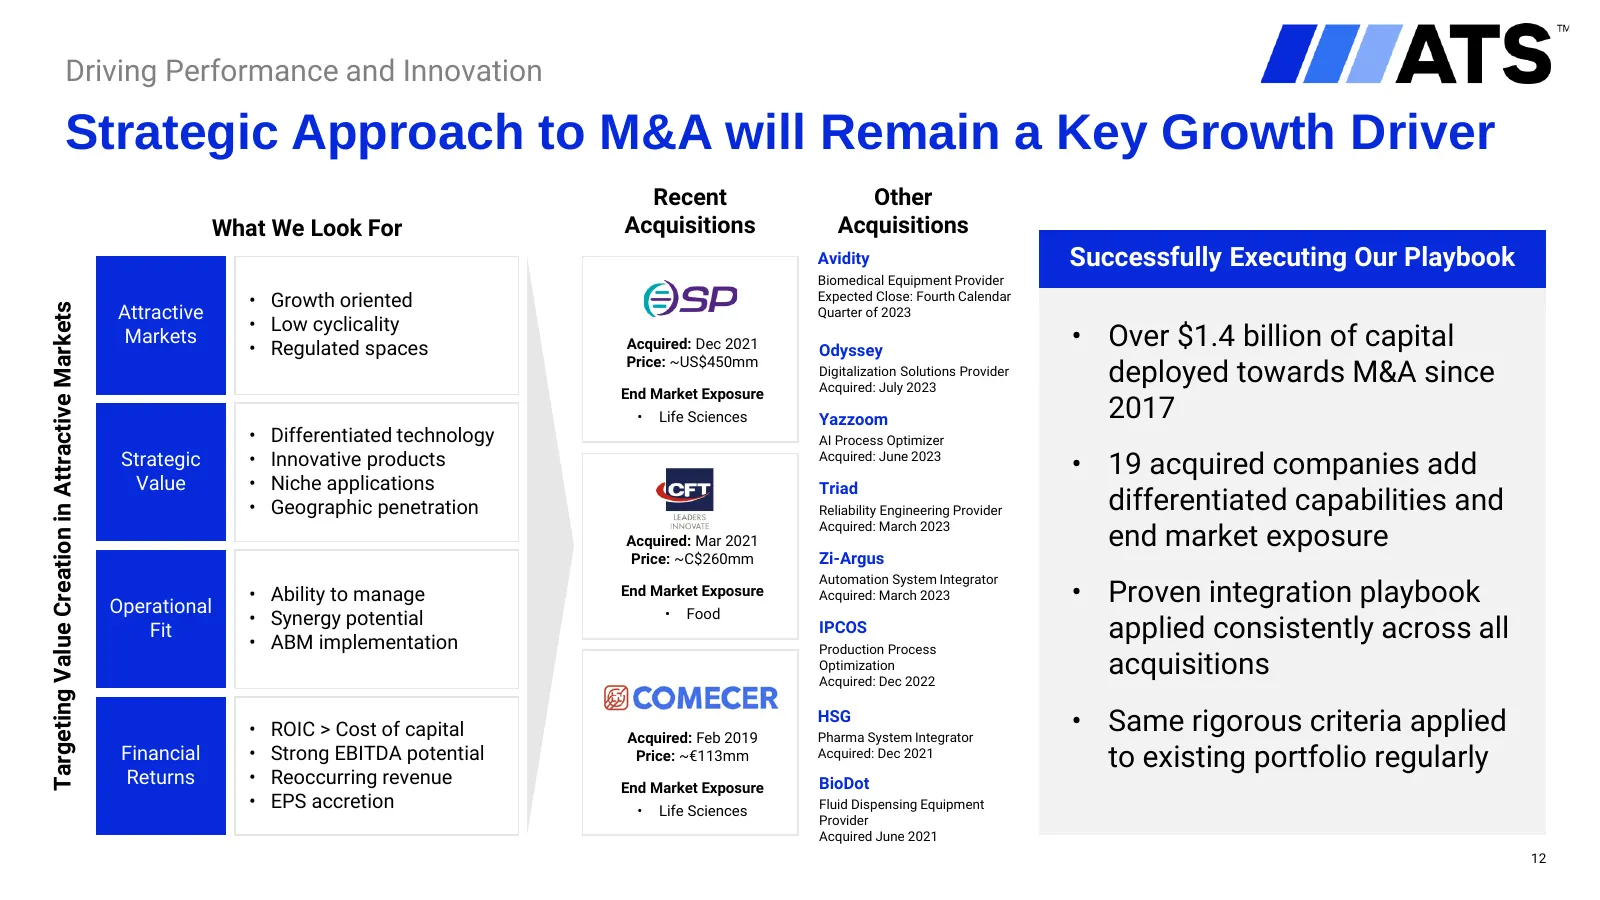
Slide 12: Targeting Value Creation in Attractive Markets
Driving Performance and Innovation Strategic Approach to M&A will Remain a Key Growth Driver Recent Other What We Look For Acquisitions Acquisitions Avidity Successfully Executing Our Playbook Biomedical Equipment Provider • Growth oriented Expected Close: Fourth Calendar Attractive Targeting Value
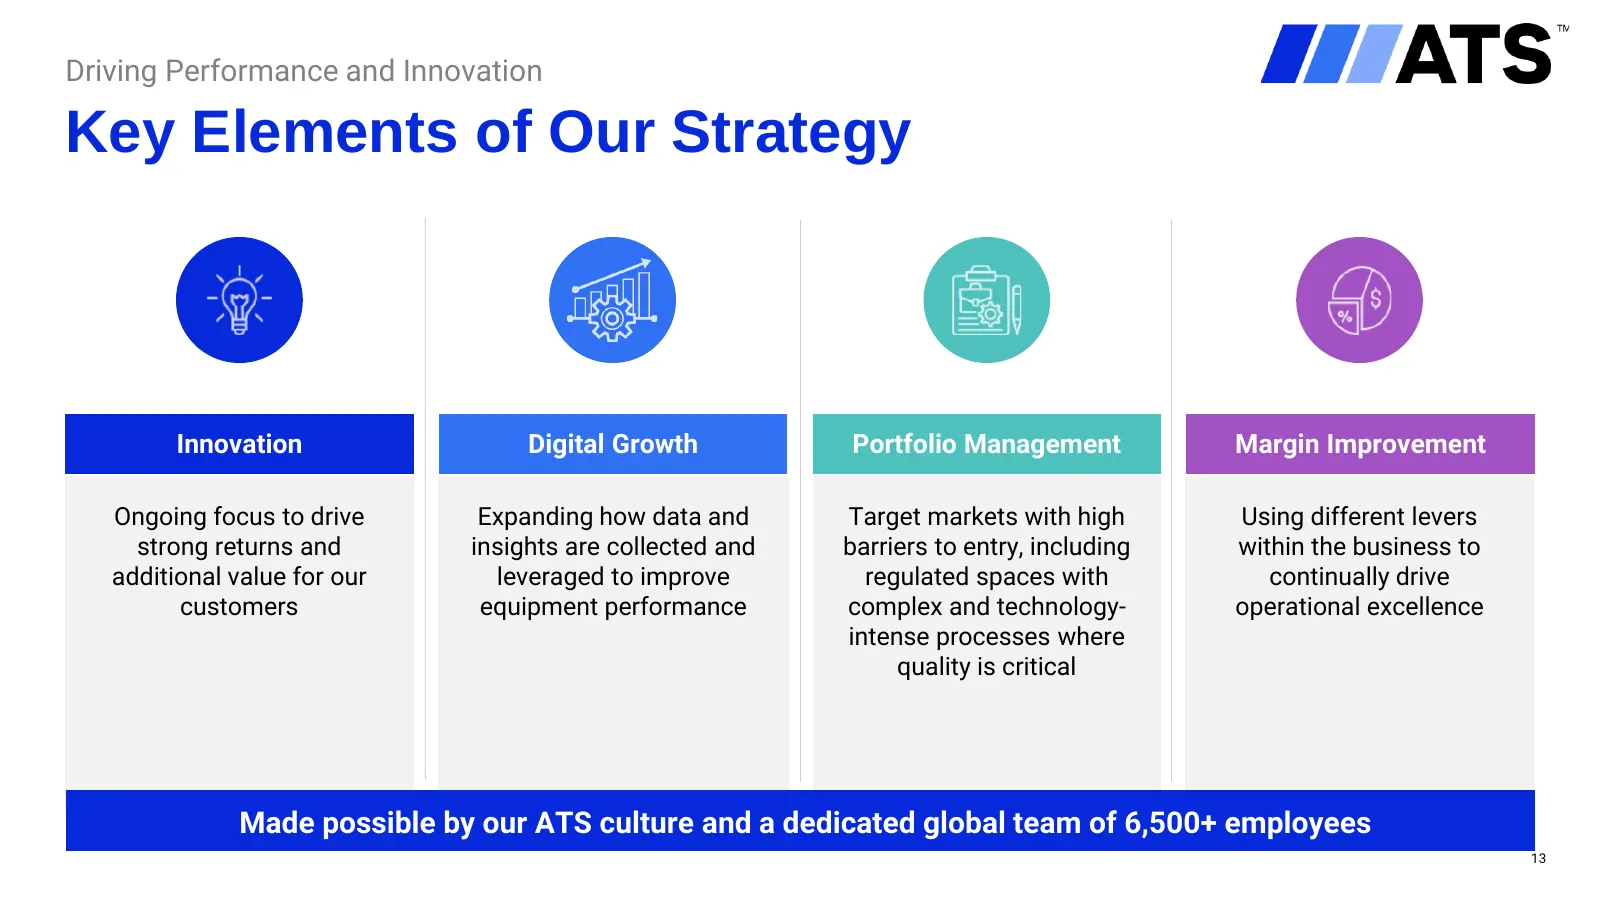
Slide 13: Key Elements of Our Strategy
Driving Performance and Innovation Key Elements of Our Strategy Innovation Digital Growth Portfolio Management Margin Improvement Ongoing focus to drive Expanding how data and Target markets with high Using different levers strong returns and insights are collected and barriers to entry, including w
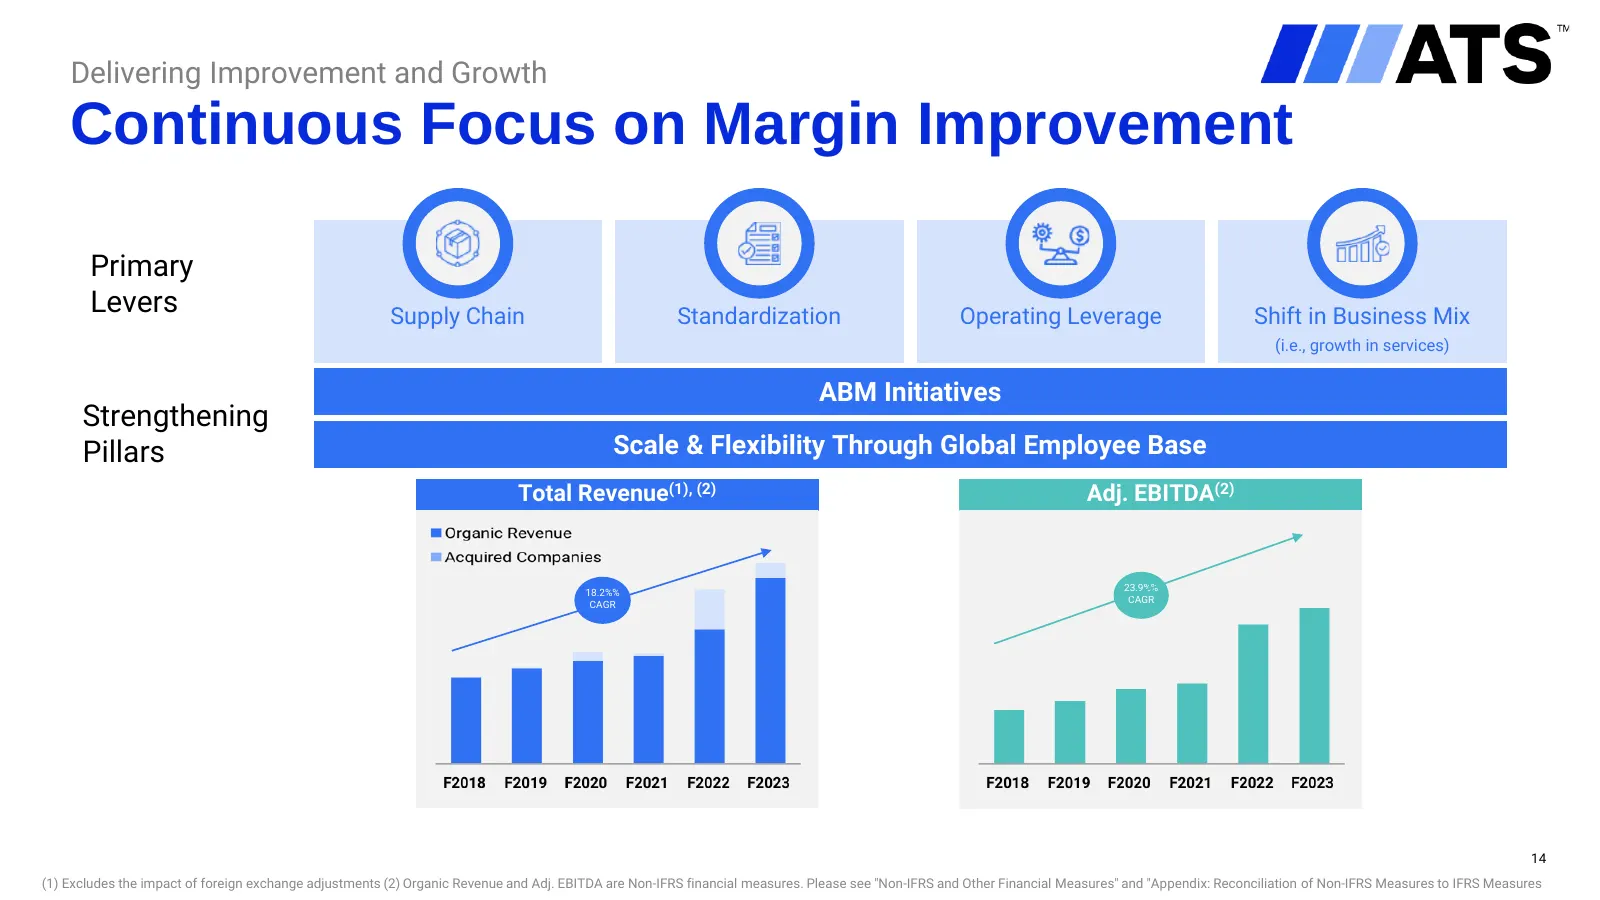
Slide 14: Continuous Focus on Margin Improvement
Delivering Improvement and Growth Continuous Focus on Margin Improvement Primary Levers Supply Chain Standardization Operating Leverage Shift in Business Mix (i.e., growth in services) ABM Initiatives Strengthening Pillars Scale & Flexibility Through Global Employee Base Total Revenue(1), (2) Adj. E
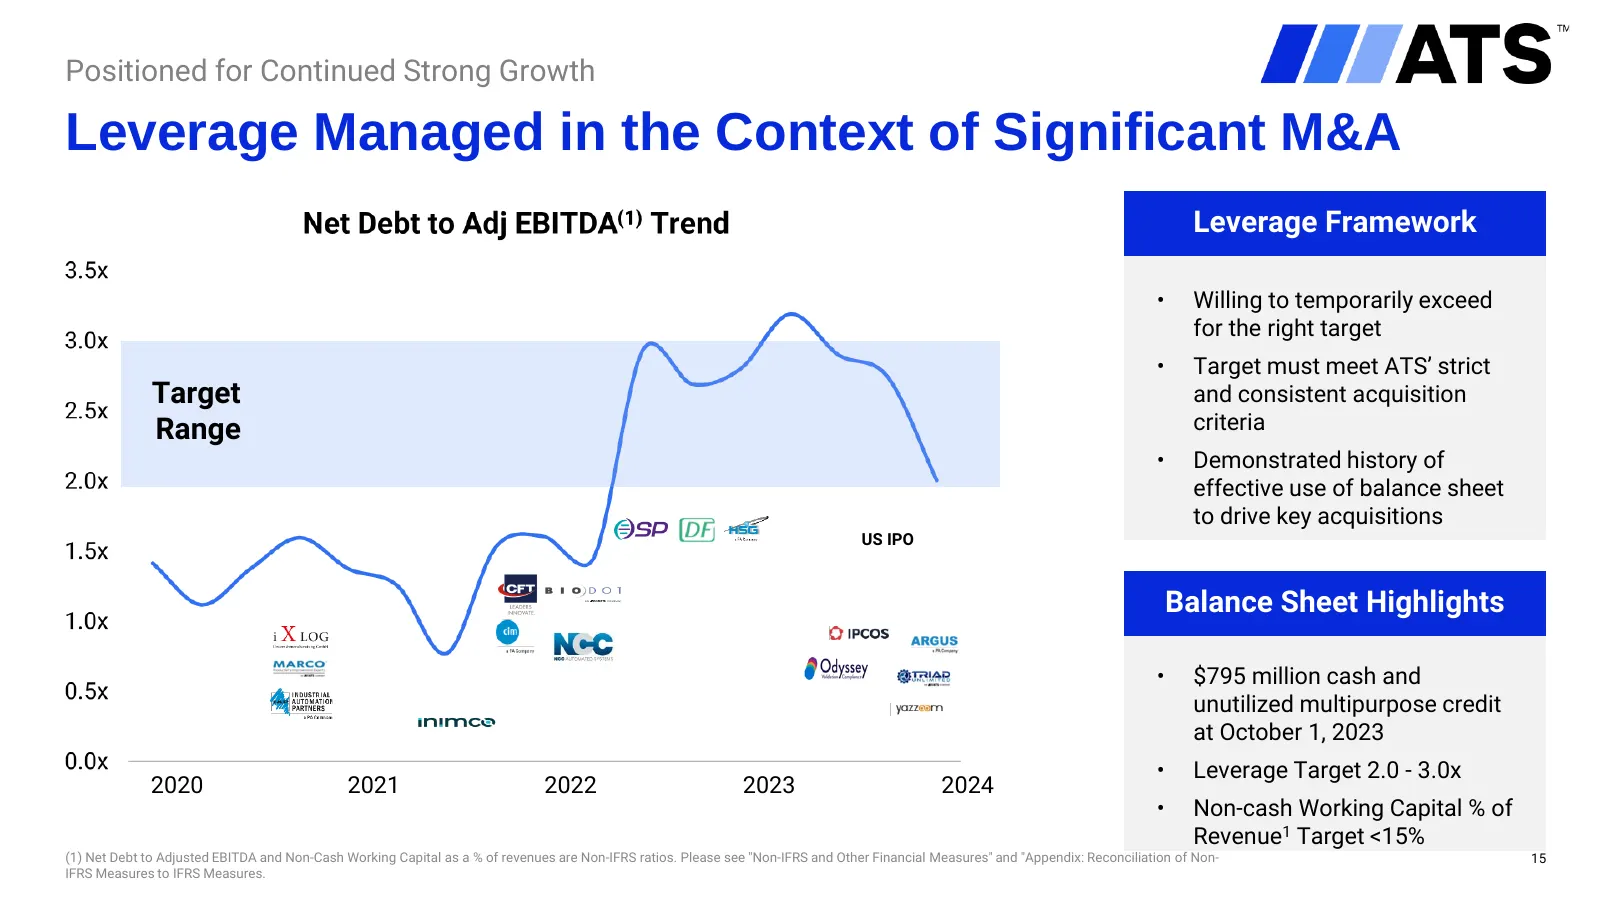
Slide 15: Leverage Managed in the Context of Significant M&A
Positioned for Continued Strong Growth Leverage Managed in the Context of Significant M&A Leverage Framework • Willing to temporarily exceed for the right target • Target must meet ATS’ strict Target and consistent acquisition Range criteria • Demonstrated history of effective use of balance sheet t
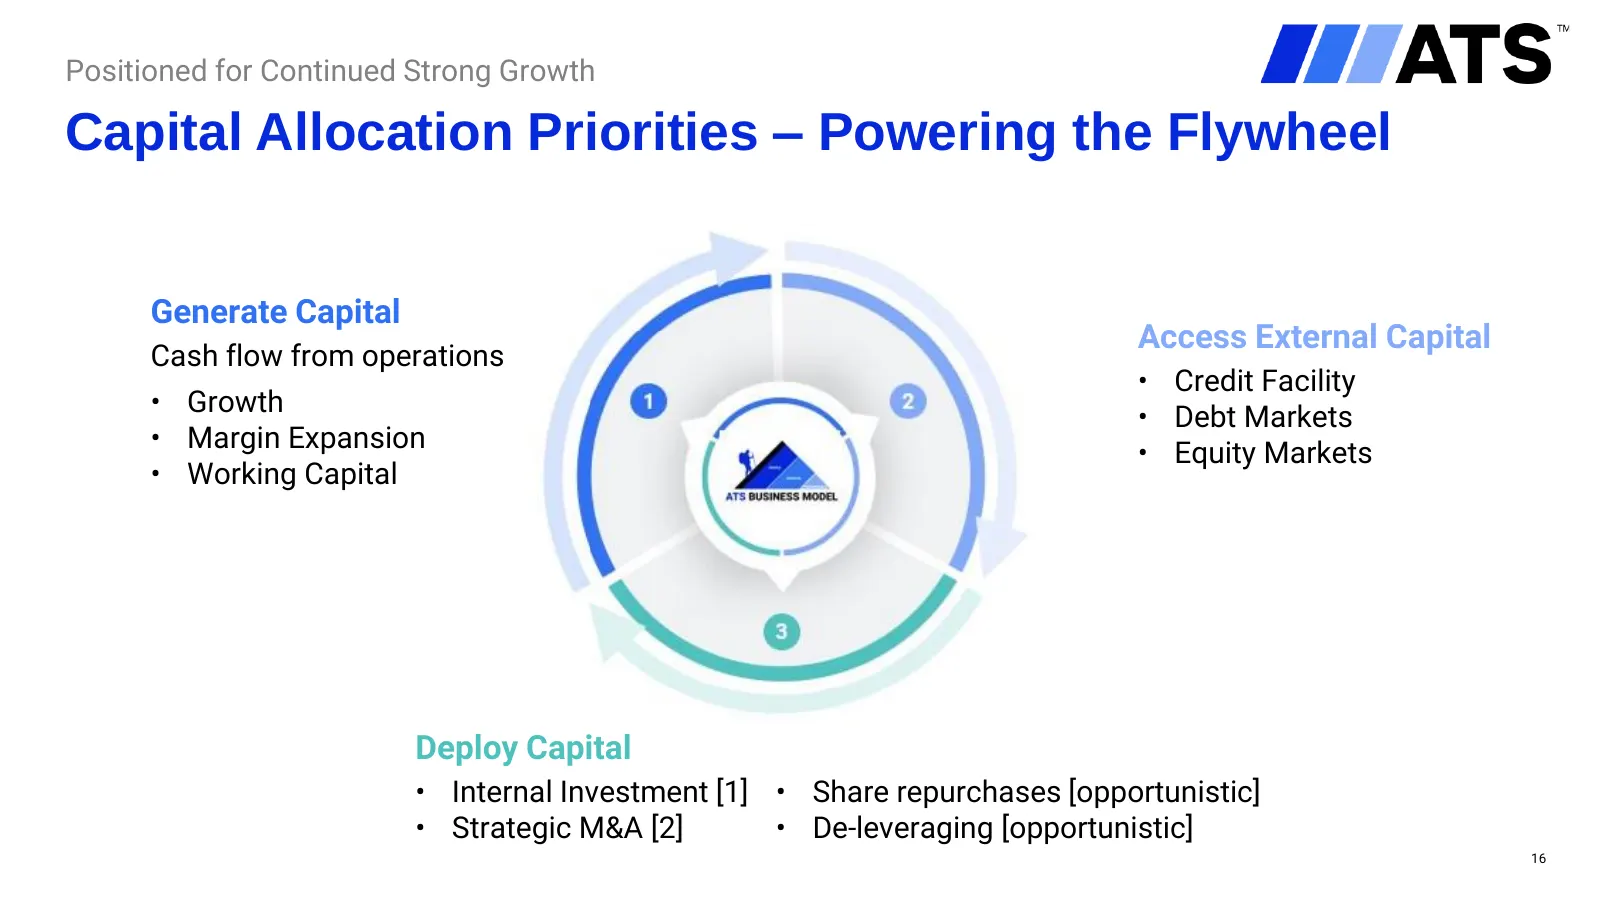
Slide 16: Capital Allocation Priorities – Powering the Flywheel
Positioned for Continued Strong Growth Capital Allocation Priorities – Powering the Flywheel Generate Capital Access External Capital Cash flow from operations • Credit Facility • Growth • Debt Markets • Margin Expansion • Equity Markets • Working Capital Deploy Capital • Internal Investment [1] • S
Slide 17: Long-Term Targets Aligned to Value Creation
Positioned for Continued Strong Growth Long-Term Targets Aligned to Value Creation 1 2 3 Growth Margin Expansion FCF(1) Generation Above Market Organic + +15% Adjusted EBIT 100% of Net Income Acquisitions Margins1 (multi-year target) (1) Adjusted EBIT margin is a Non-IFRS ratio and Free cash flow is
Slide 18: Key Takeaways
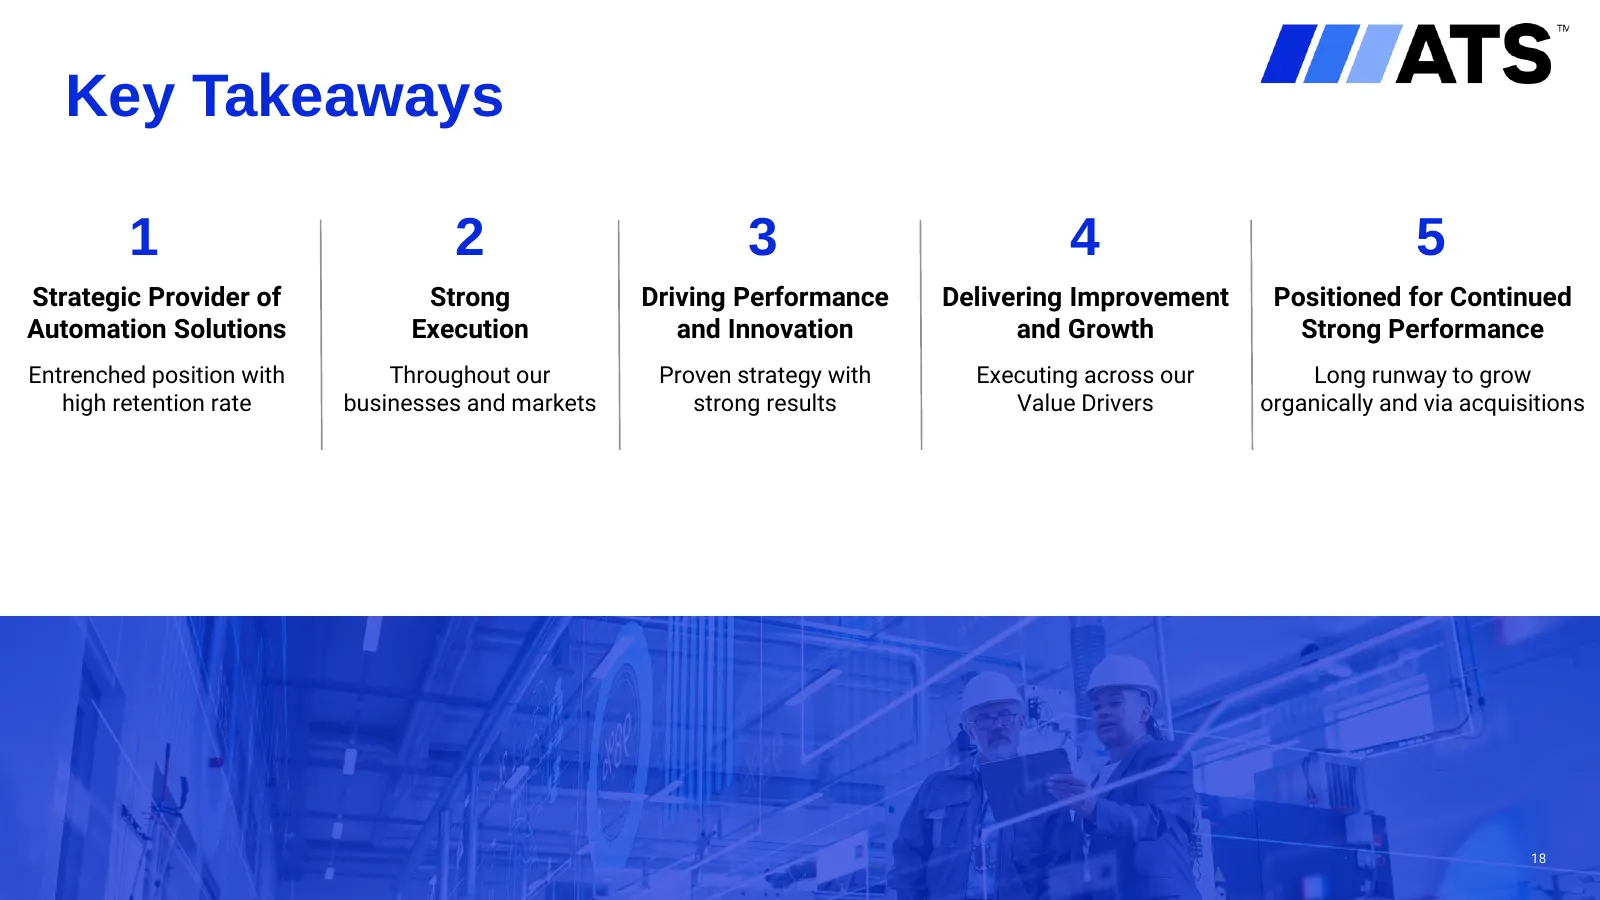
Key Takeaways 1 2 3 4 5 Strategic Provider of Strong Driving Performance Delivering Improvement Positioned for Continued Automation Solutions Execution and Innovation and Growth Strong Performance Entrenched position with Throughout our Proven strategy with Executing across our Long runway to grow h
Slide 19: Appendix: Measures
Appendix Reconciliation of Non-IFRS Measures to IFRS Measures 19
Slide 20: Appendix: Reconciliation of Non-IFRS Measures to IFRS Measures
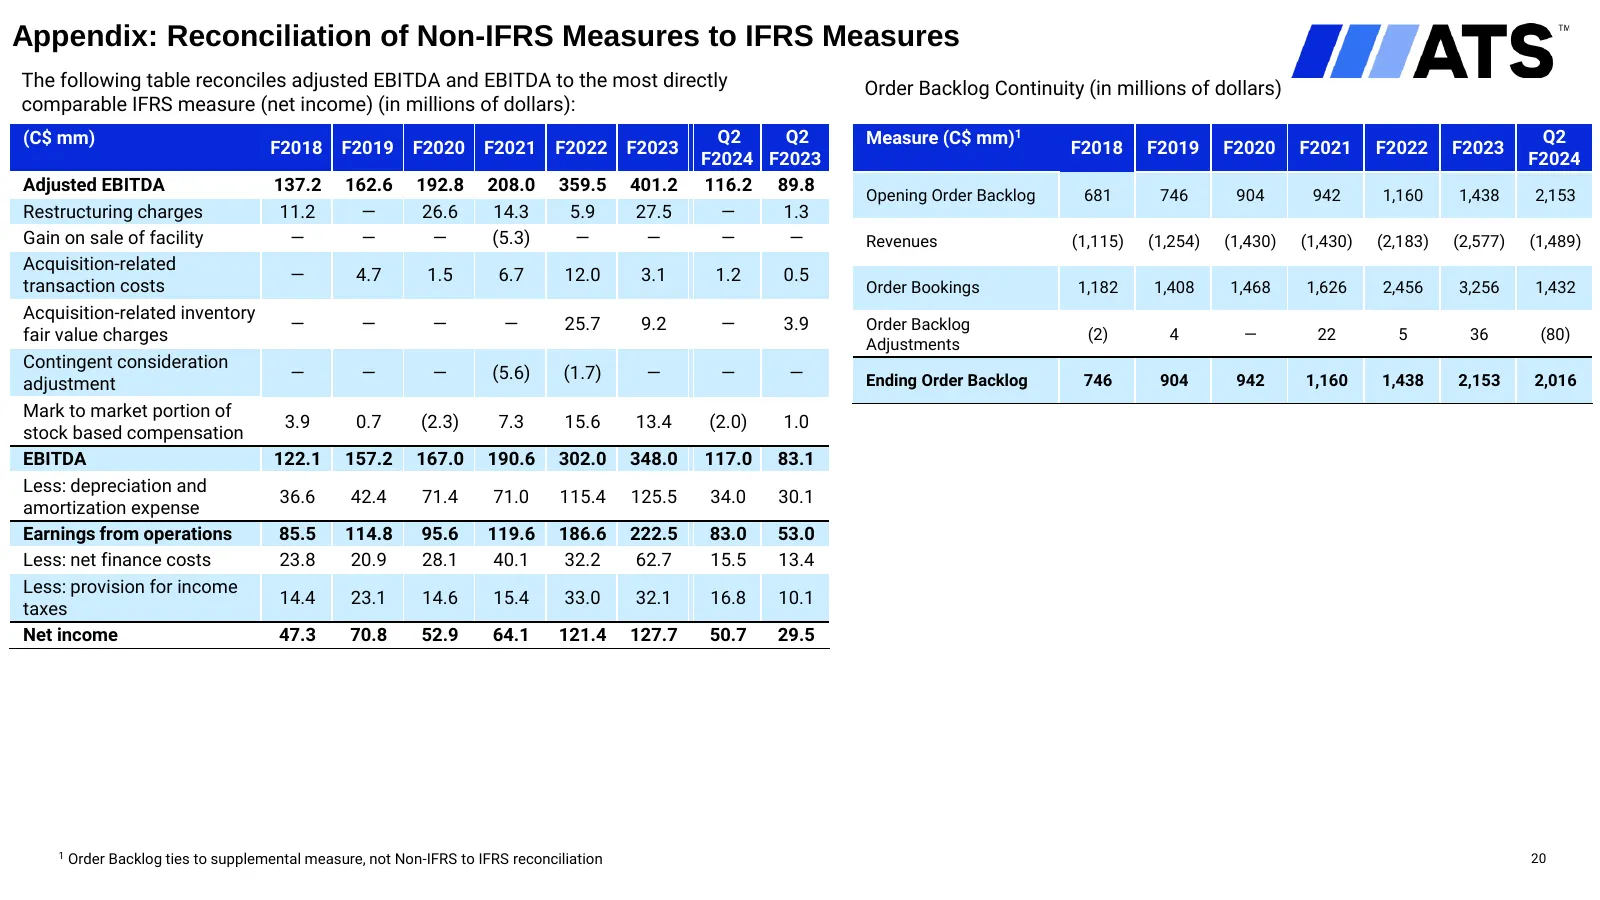
Appendix: Reconciliation of Non-IFRS Measures to IFRS Measures The following table reconciles adjusted EBITDA and EBITDA to the most directly Order Backlog Continuity (in millions of dollars) comparable IFRS measure (net income) (in millions of dollars): (C$ mm) Q2 Q2 Measure (C$ mm)1 Q2 F2018 F2019
Slide 21: Appendix: Reconciliation of Non-IFRS Measures to IFRS Measures
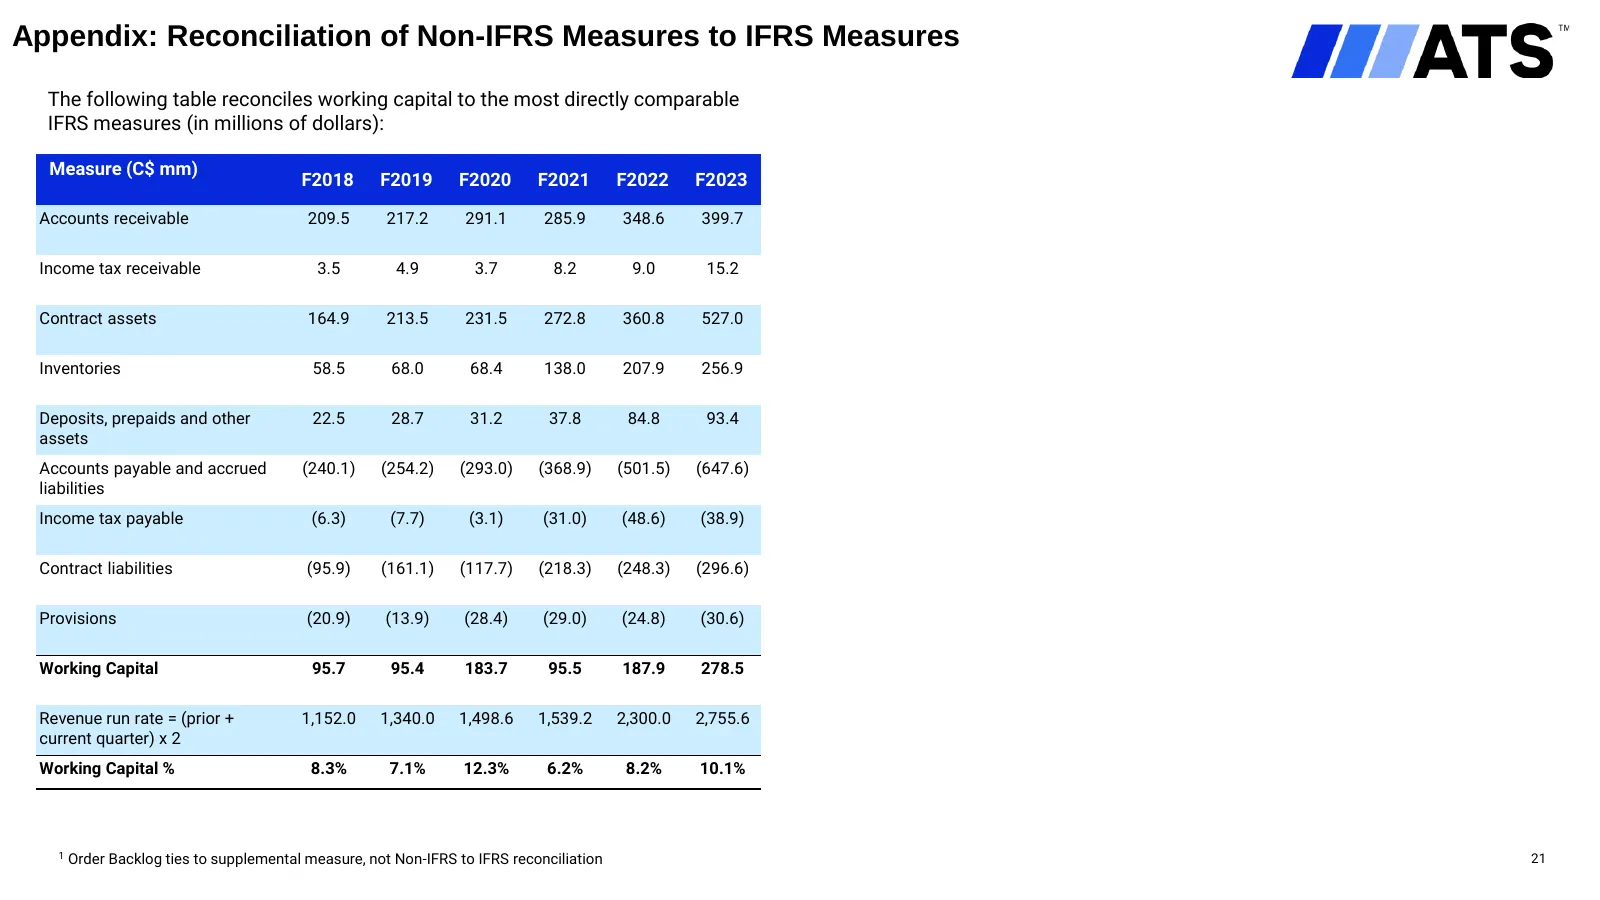
Appendix: Reconciliation of Non-IFRS Measures to IFRS Measures The following table reconciles working capital to the most directly comparable IFRS measures (in millions of dollars): Measure (C$ mm) F2018 F2019 F2020 F2021 F2022 F2023 Accounts receivable 209.5 217.2 291.1 285.9 348.6 399.7 Income tax
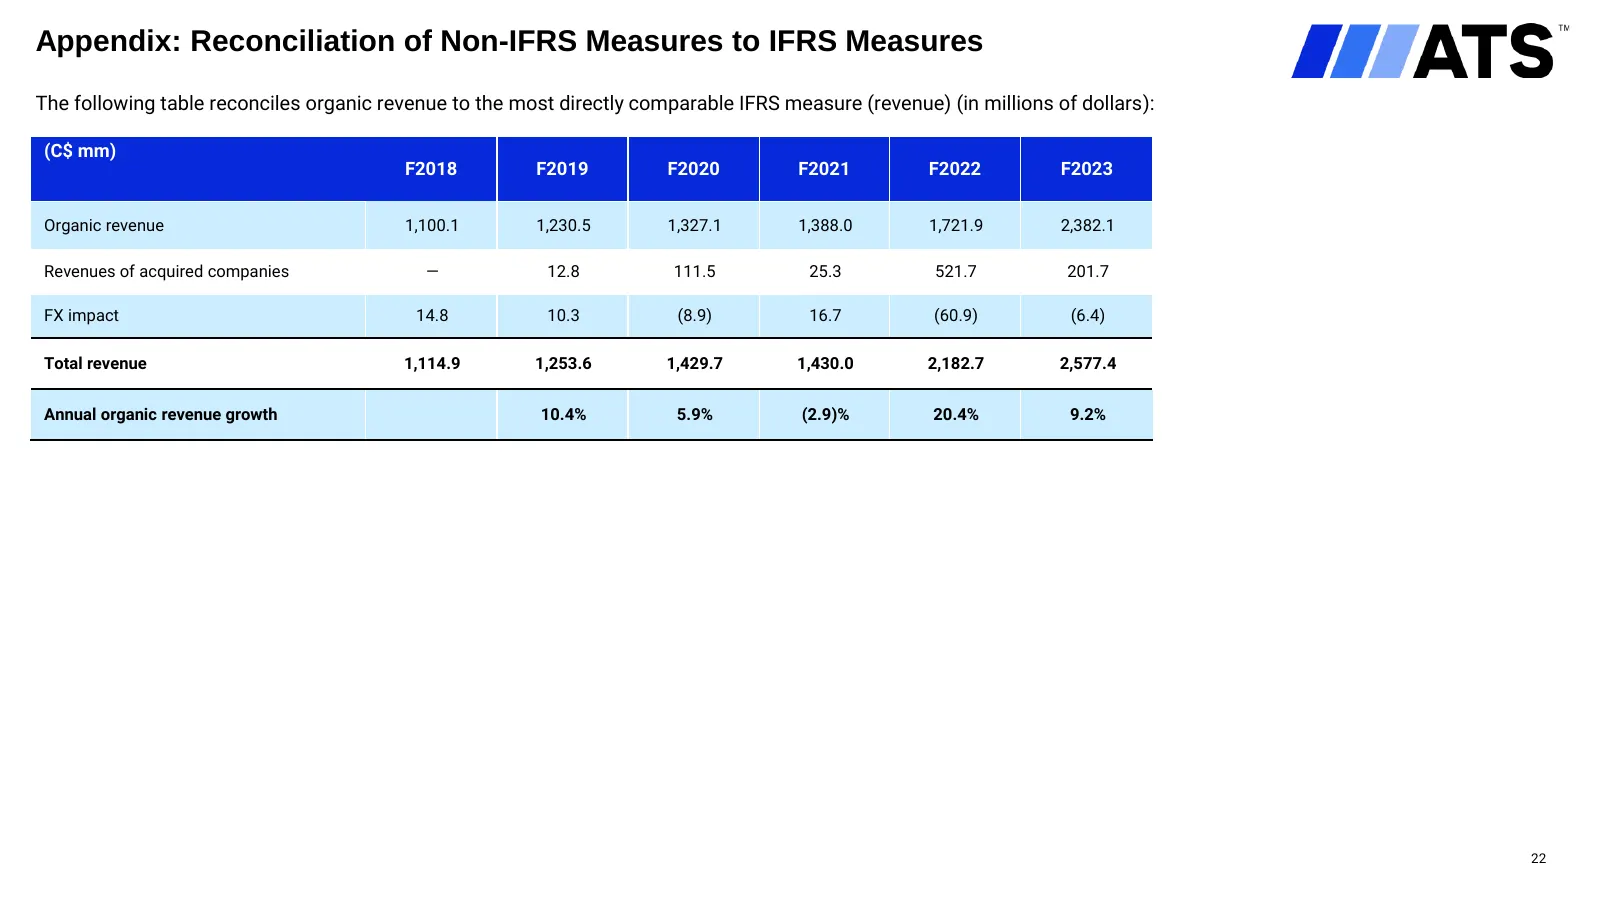
Slide 22: Appendix: Reconciliation of Non-IFRS Measures to IFRS Measures
Appendix: Reconciliation of Non-IFRS Measures to IFRS Measures The following table reconciles organic revenue to the most directly comparable IFRS measure (revenue) (in millions of dollars): (C$ mm) F2018 F2019 F2020 F2021 F2022 F2023 Organic revenue 1,100.1 1,230.5 1,327.1 1,388.0 1,721.9 2,382.1 R
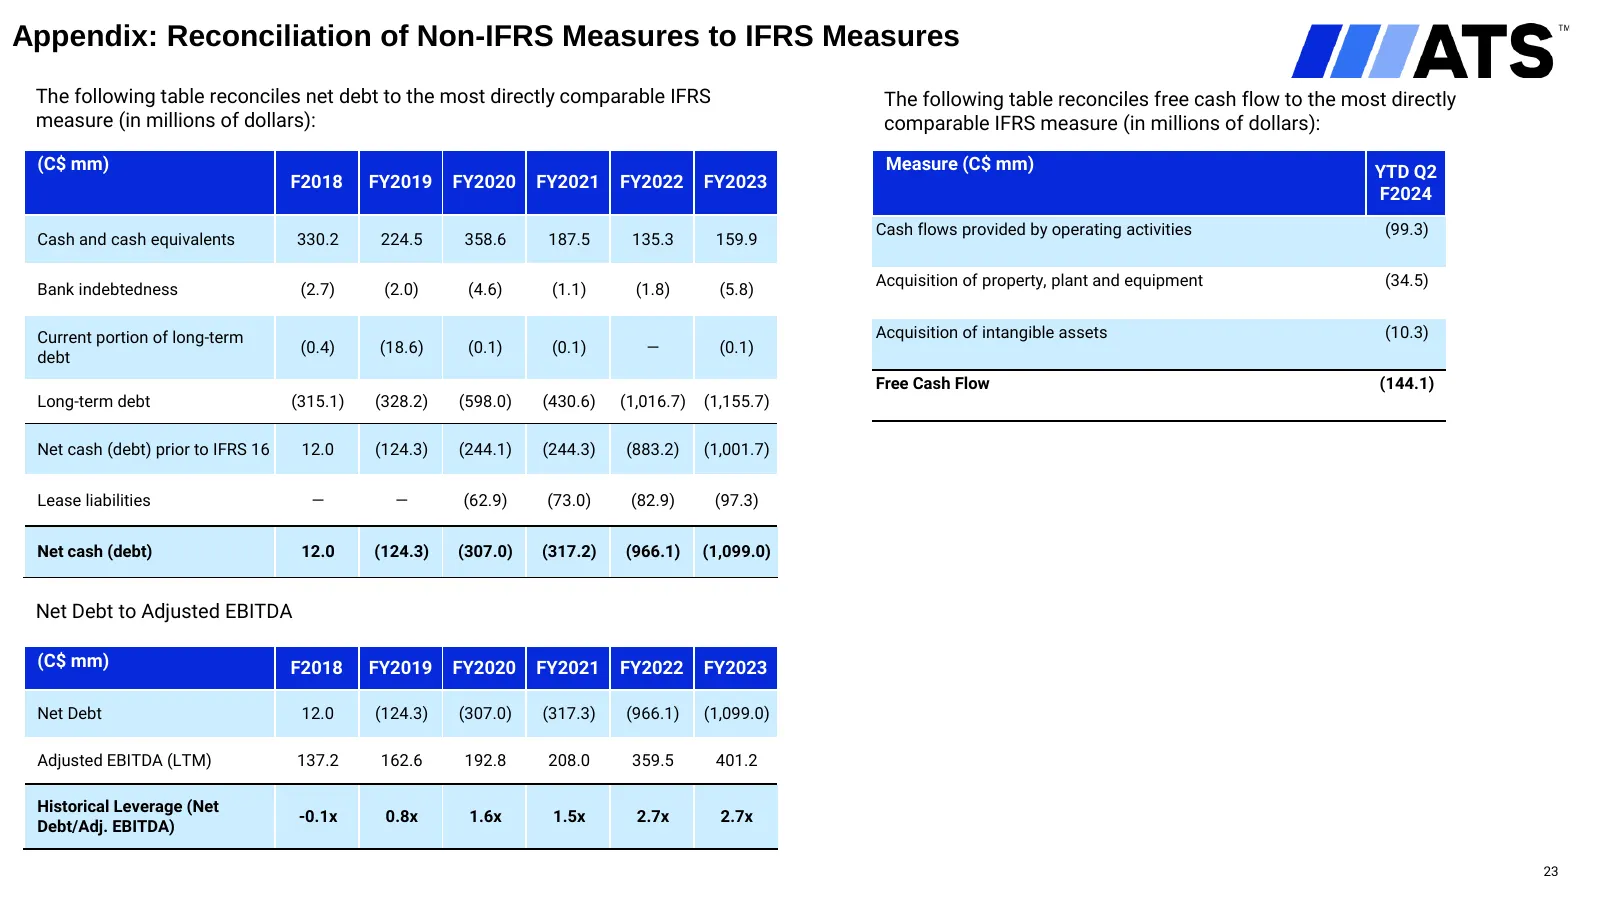
Slide 23: Appendix: Reconciliation of Non-IFRS Measures to IFRS Measures
Appendix: Reconciliation of Non-IFRS Measures to IFRS Measures The following table reconciles net debt to the most directly comparable IFRS The following table reconciles free cash flow to the most directly measure (in millions of dollars): comparable IFRS measure (in millions of dollars): (C$ mm) M
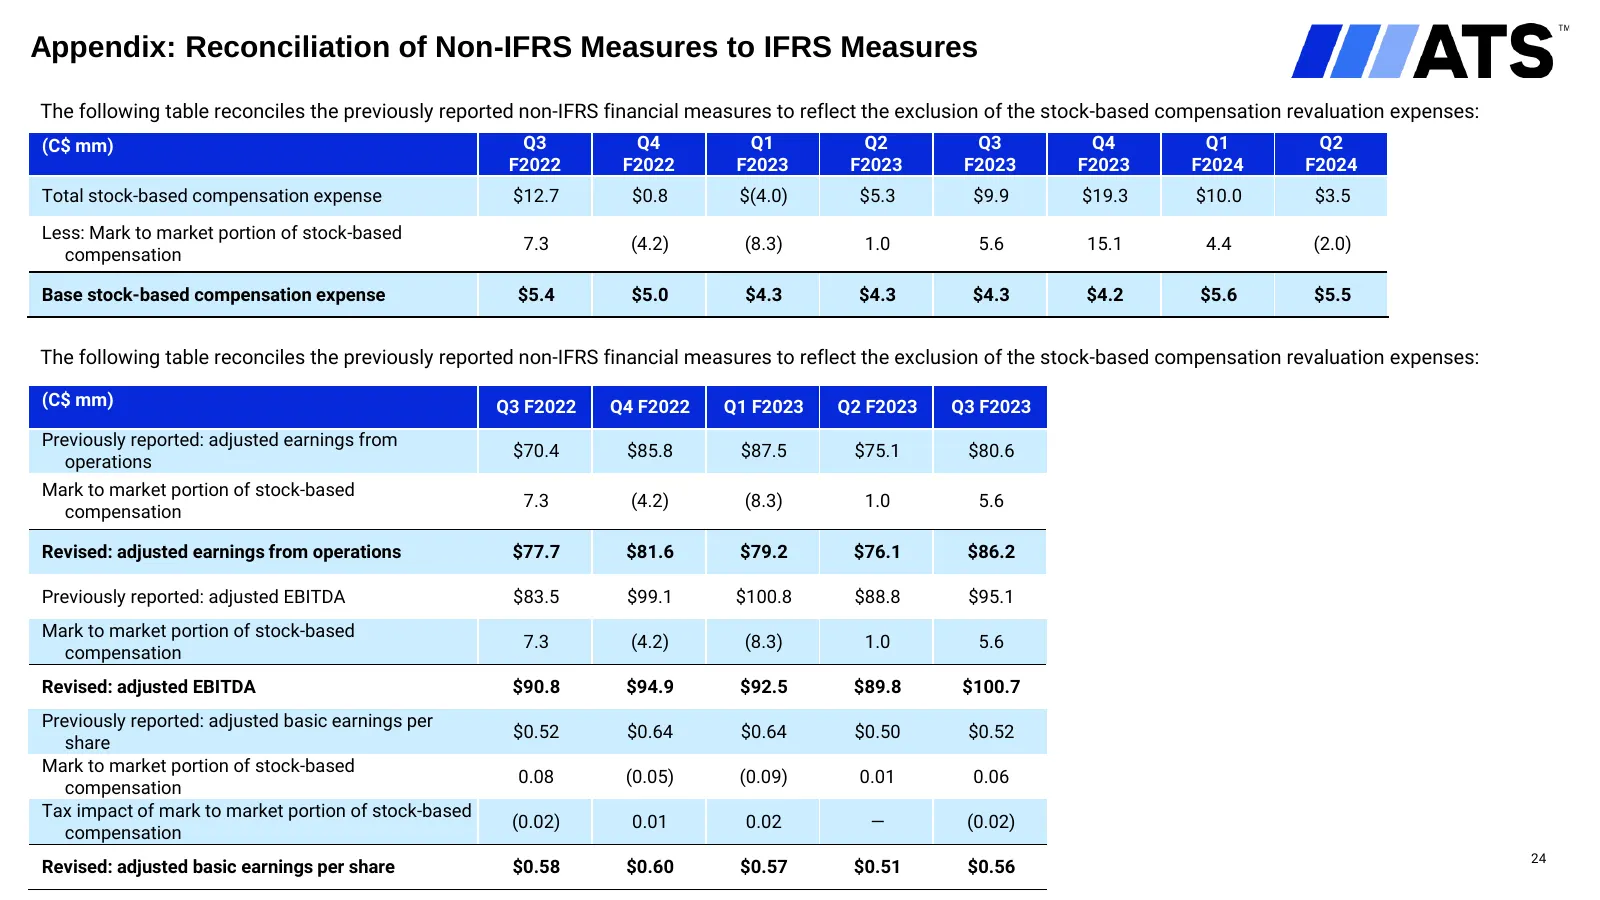
Slide 24: Appendix: Reconciliation of Non-IFRS Measures to IFRS Measures
Appendix: Reconciliation of Non-IFRS Measures to IFRS Measures The following table reconciles the previously reported non-IFRS financial measures to reflect the exclusion of the stock-based compensation revaluation expenses: (C$ mm) Q3 Q4 Q1 Q2 Q3 Q4 Q1 Q2 F2022 F2022 F2023 F2023 F2023 F2023 F2024 F
Source: Internet Archive copy of s201.q4cdn.com
More decks from ATS Corporation
 Q2 2027 Earnings Presentation15 slides · Nov 4, 2026
 Q1 2027 Earnings Presentation15 slides · Aug 6, 2026
 Q4 2026 Earnings Presentation15 slides · May 28, 2026
 Q3 2026 Earnings Presentation15 slides · Feb 4, 2026
 Q2 2026 Earnings Presentation15 slides · Nov 5, 2025
 Q1 2026 Earnings Presentation15 slides · Aug 7, 2025