Star Bulk Carriers Corp. · NASDAQ:SBLK
Star Bulk Carriers — Q3 2009 Earnings Presentation
19 slides from Star Bulk Carriers's earnings presentation, November 2009
Slide 1: 3rd Quarter and 9 Months 2009 Financial Results
3rd Quarter and 9 Months 2009 Financial Results NASDAQ: SBLK November 2009
Slide 2: Safe Harbor Statement
Safe Harbor Statement Except for the historical information contained herein, this presentation contains among other things, certain forward-looking statements, within the meaning of the Private Securities Litigation Reform Act of 1995 that involve risks and uncertainties. Such statements may includ
Slide 3: 3rd Quarter and 9 Months 2009 Financial Highlights
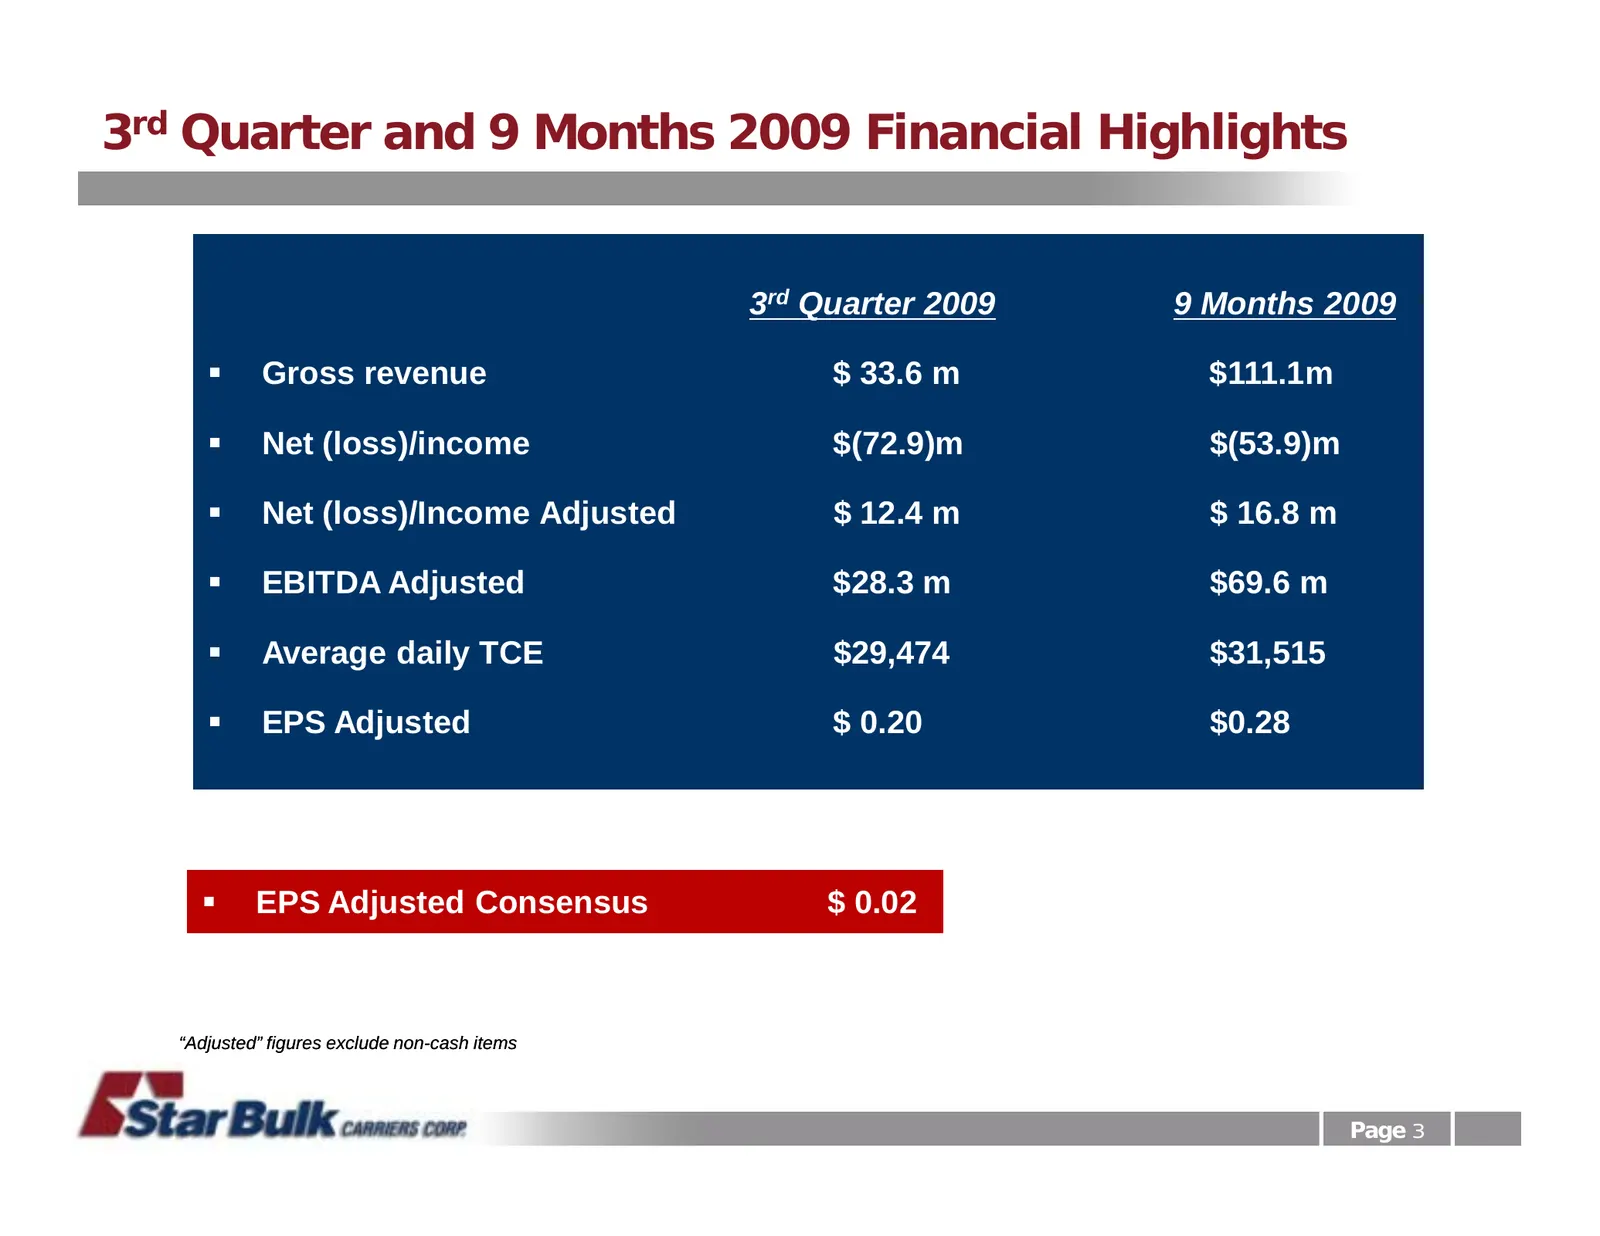
3rd Quarter and 9 Months 2009 Financial Highlights 3rd Quarter 2009 9 Months 2009 ! Gross revenue $ 33.6 m $111.1m ! Net (loss)/income $(72.9)m $(53.9)m ! Net (loss)/Income Adjusted $ 12.4 m $ 16.8 m ! EBITDA Adjusted $28.3 m $69.6 m ! Average daily TCE $29,474 $31,515 ! EPS Adjusted $ 0.20 $0.28 !
Slide 4: Selected Financial Data
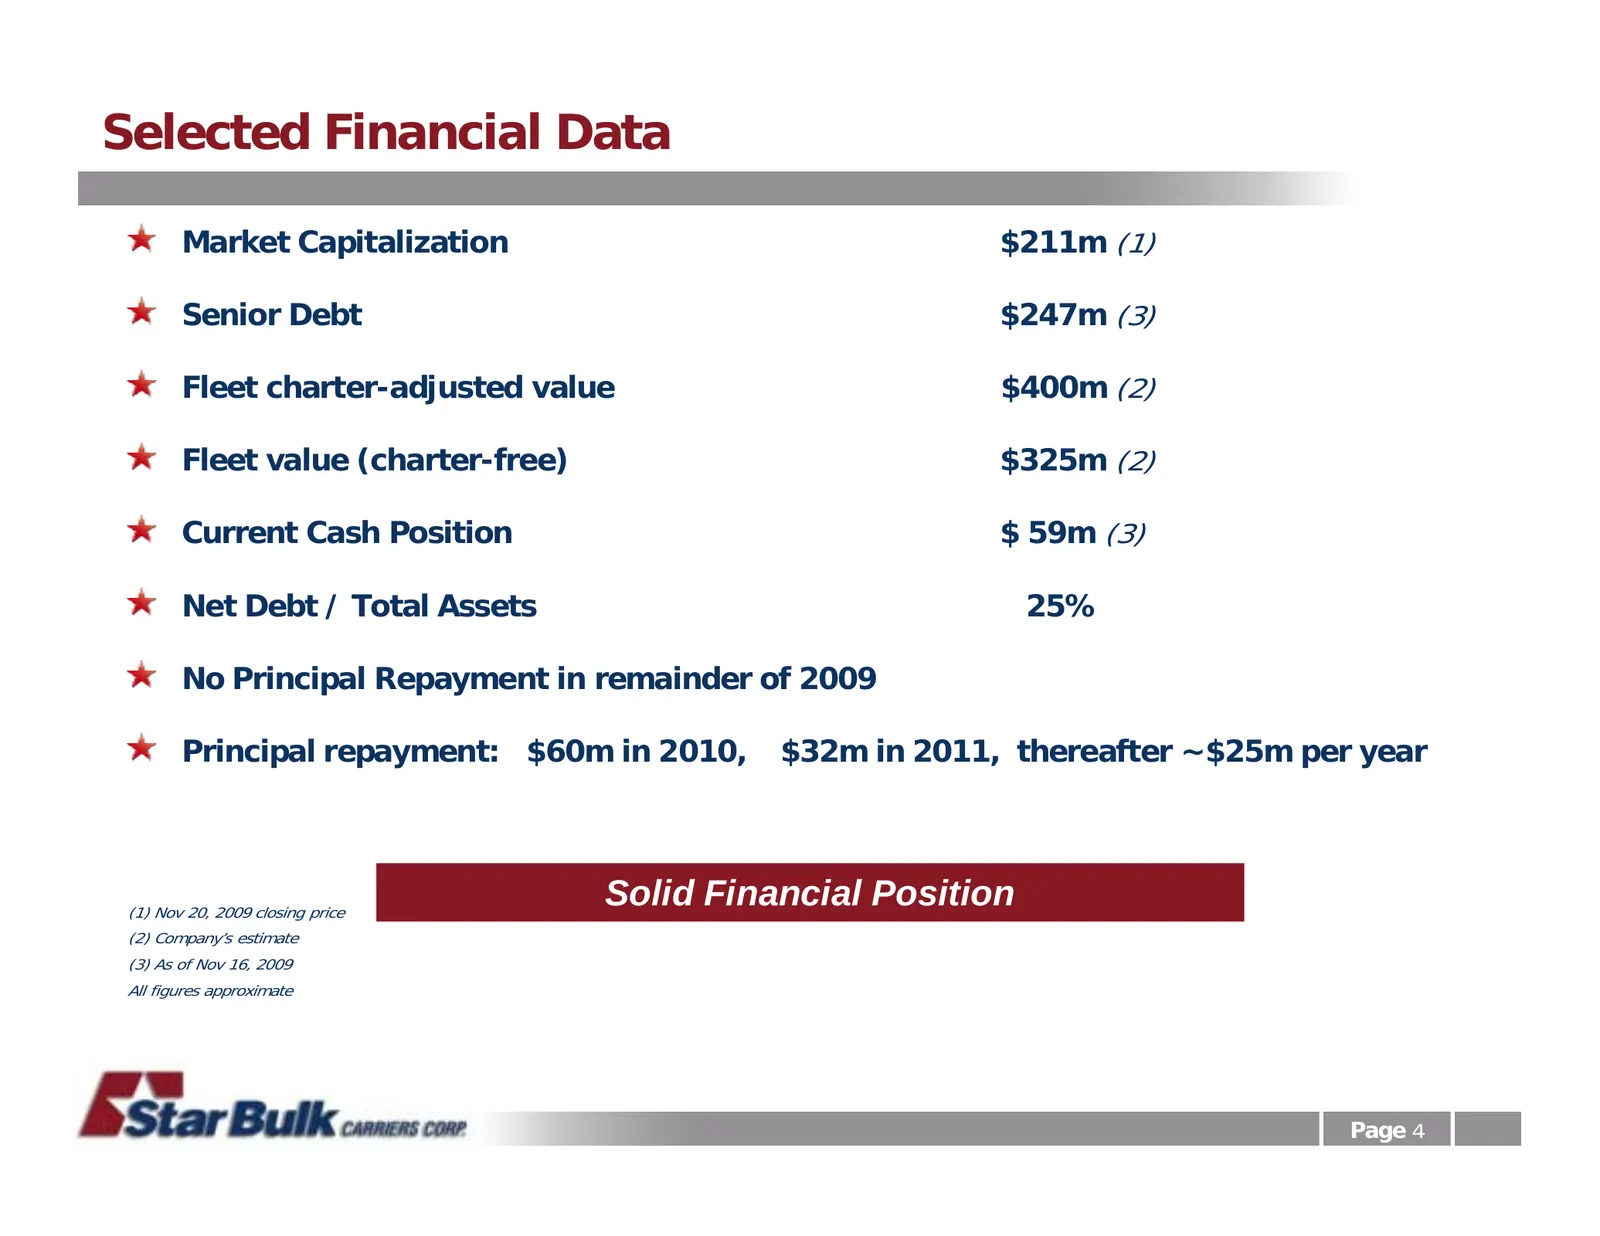
Selected Financial Data Market Capitalization $211m (1) Senior Debt $247m (3) Fleet charter-adjusted value $400m (2) Fleet value (charter-free) $325m (2) Current Cash Position $ 59m (3) Net Debt / Total Assets 25% No Principal Repayment in remainder of 2009 Principal repayment: $60m in 2010, $32m in
Slide 5: Recent Activity
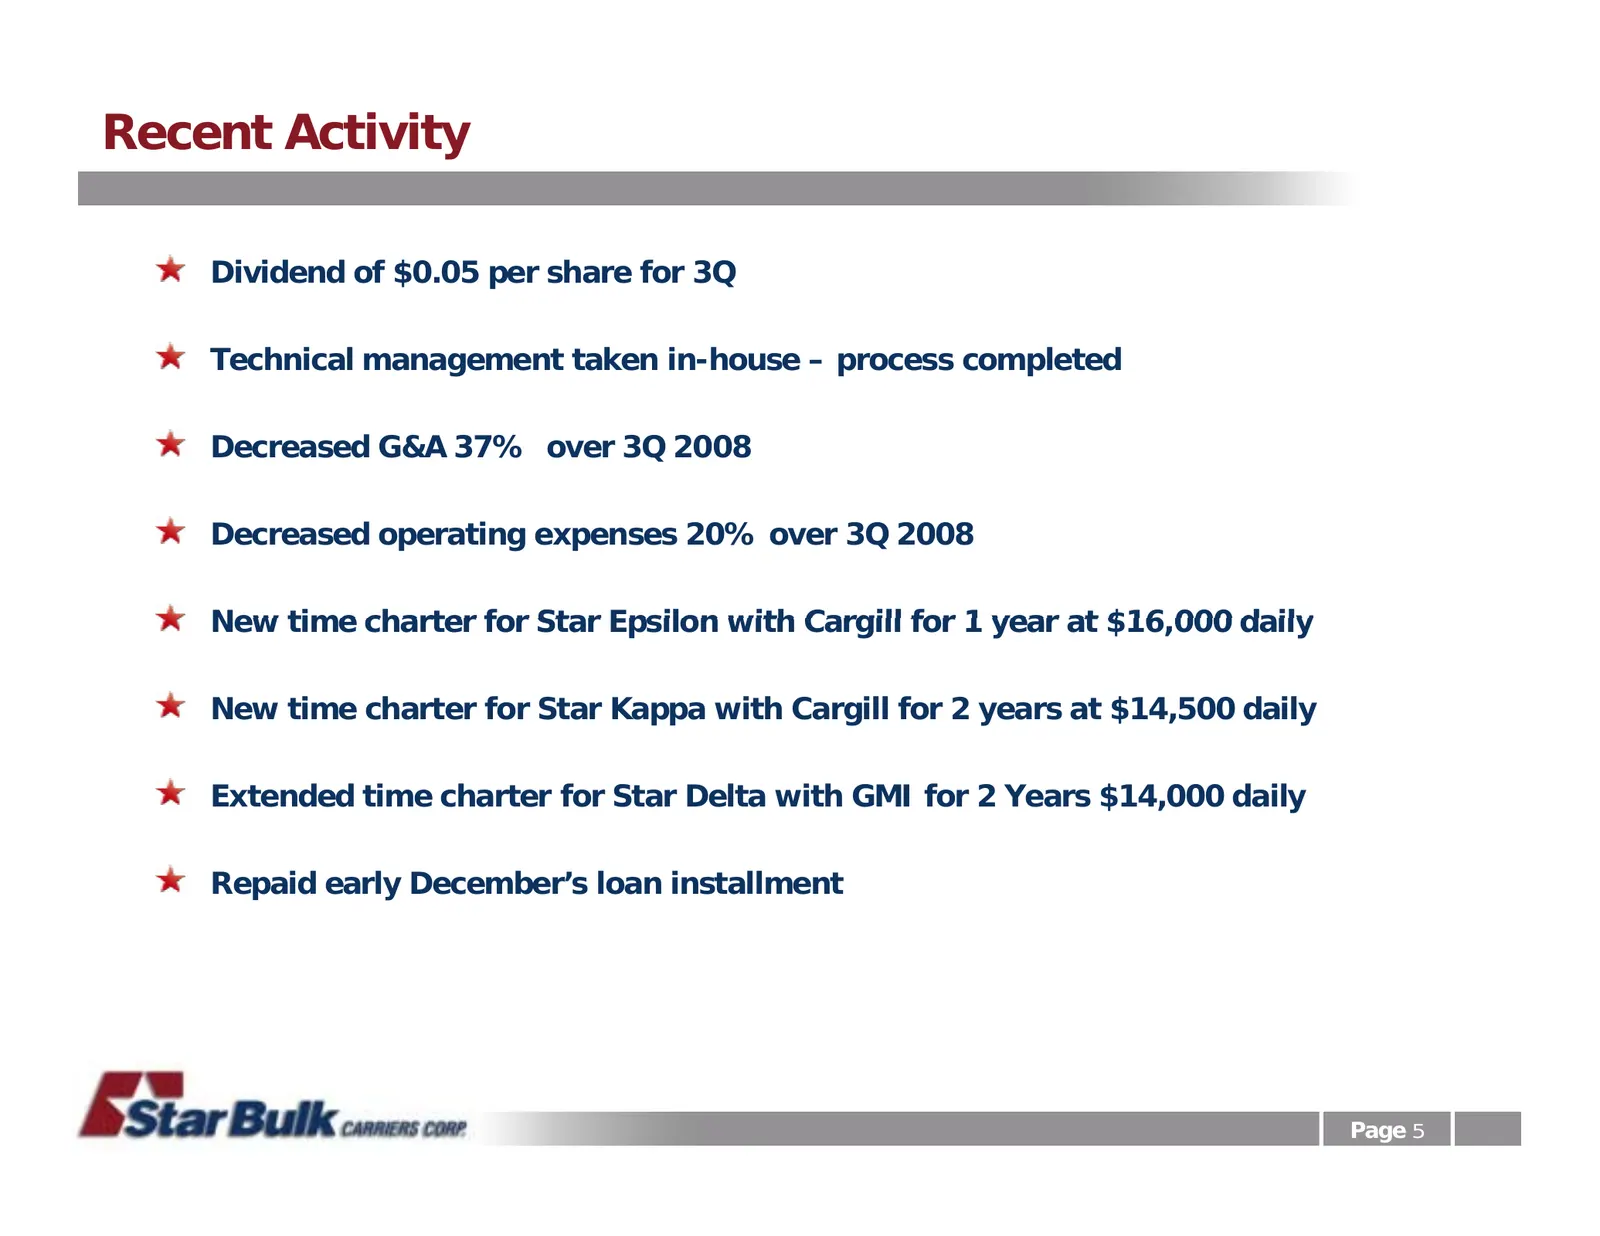
Recent Activity Dividend of $0.05 per share for 3Q Technical management taken in-house – process completed Decreased G&A 37% over 3Q 2008 Decreased operating expenses 20% over 3Q 2008 New time charter for Star Epsilon with Cargill for 1 year at $16,000 $16 000 daily New time charter for Star Kappa w
Slide 6: Star Bulk Fleet
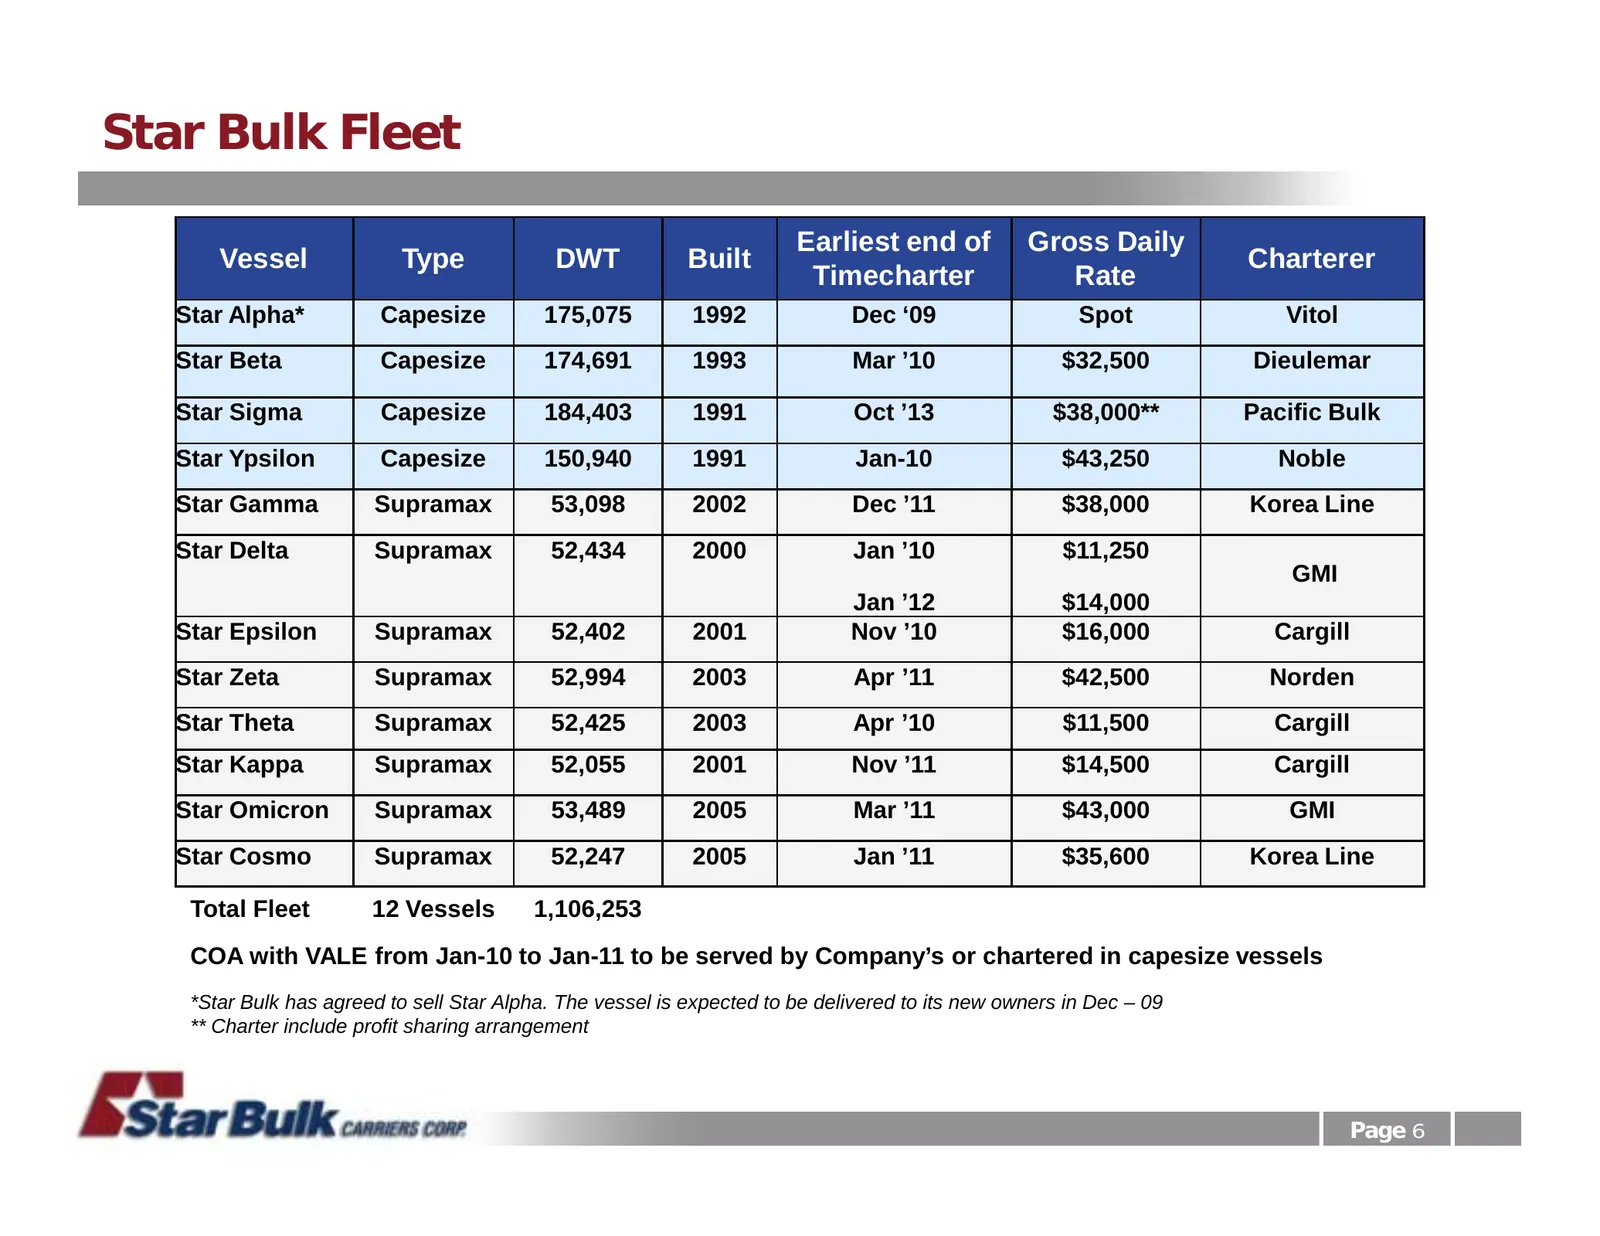
Star Bulk Fleet Earliest end of Gross Daily Vessel Type DWT Built Charterer Timecharter Rate Star Alpha* Capesize 175,075 1992 Dec ‘09 Spot Vitol Star Beta Capesize 174,691 1993 Mar ’10 $32,500 Dieulemar Star Sigma Capesize 184,403 1991 Oct ’13 $38,000** Pacific Bulk Star Ypsilon Capesize 150,940 19
Slide 7: Contracted Operating Days - Revenue Visibility
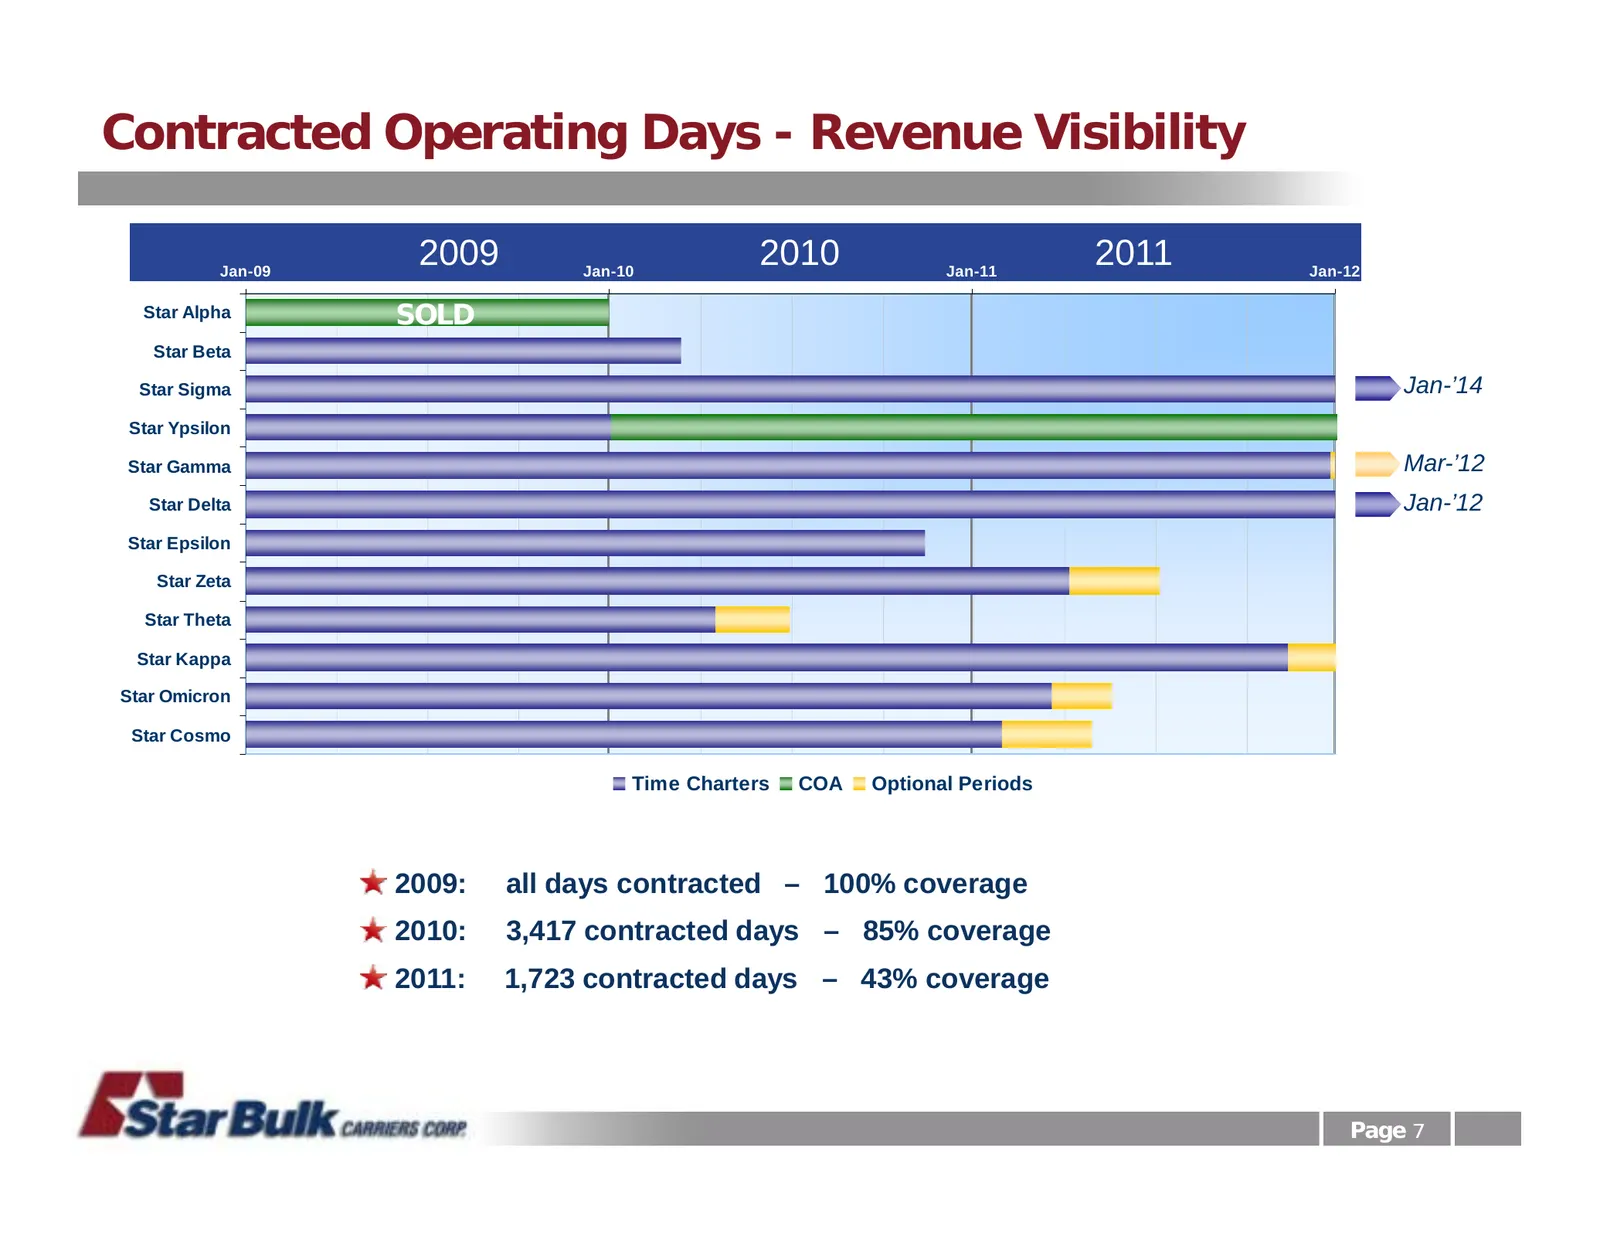
Contracted Operating Days - Revenue Visibility Jan-09 2009 Jan-10 2010 Jan-11 2011 Jan-12 Star Alpha SOLD Star Beta Star Sigma Jan-’14 Star Ypsilon Star Gamma Mar-’12 Star Delta Jan-’12 Star Epsilon Star Zeta Star Theta Star Kappa Star Omicron Star Cosmo Time Charters COA Optional Periods 2009: all

Slide 8: Company Financials
COMPANY FINANCIALS Page 8
Slide 9: Balance Sheet
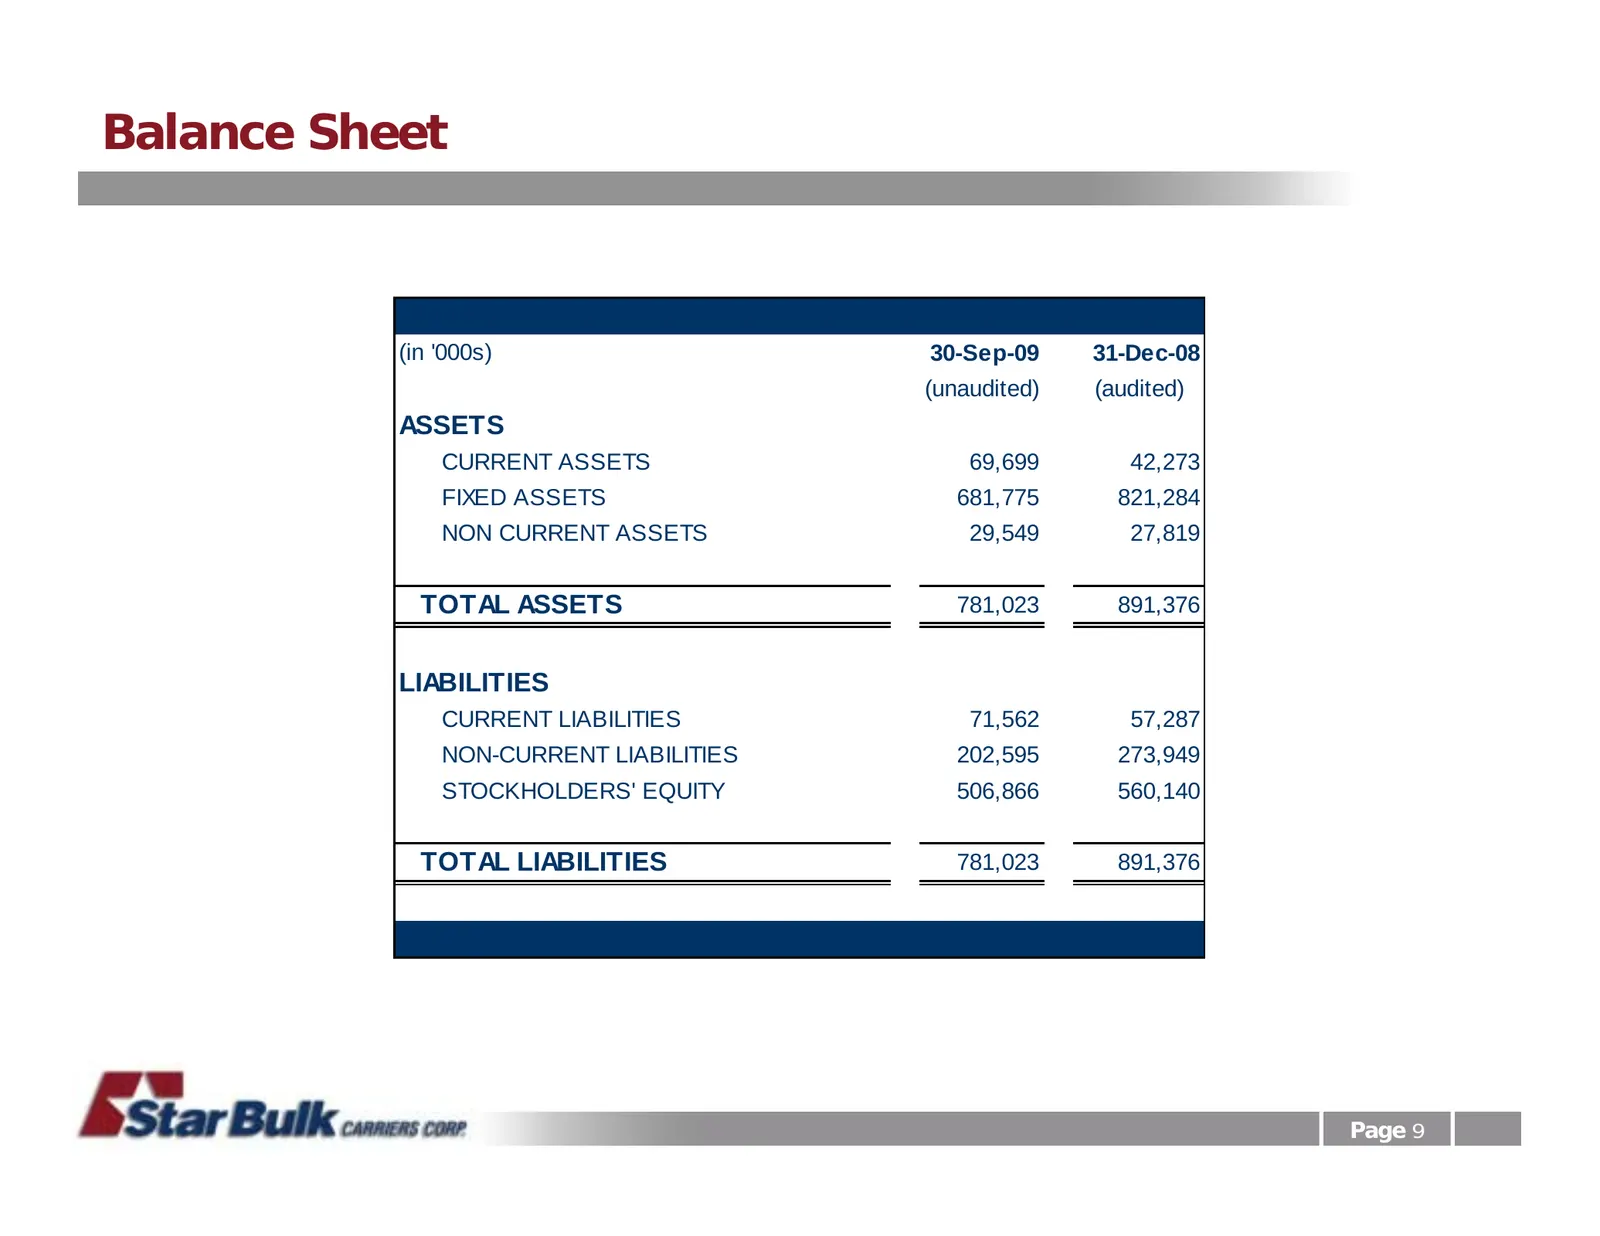
Balance Sheet (in '000s) 30-Sep-09 31-Dec-08 (unaudited) (audited) ASSETS CURRENT ASSETS 69,699 42,273 FIXED ASSETS 681,775 821,284 NON CURRENT ASSETS 29,549 27,819 TOTAL ASSETS 781,023 891,376 LIABILITIES CURRENT LIABILITIES 71,562 57,287 NON-CURRENT LIABILITIES 202,595 273,949 STOCKHOLDERS' EQUITY
Slide 10: Income Statement 3rd Quarter 2009
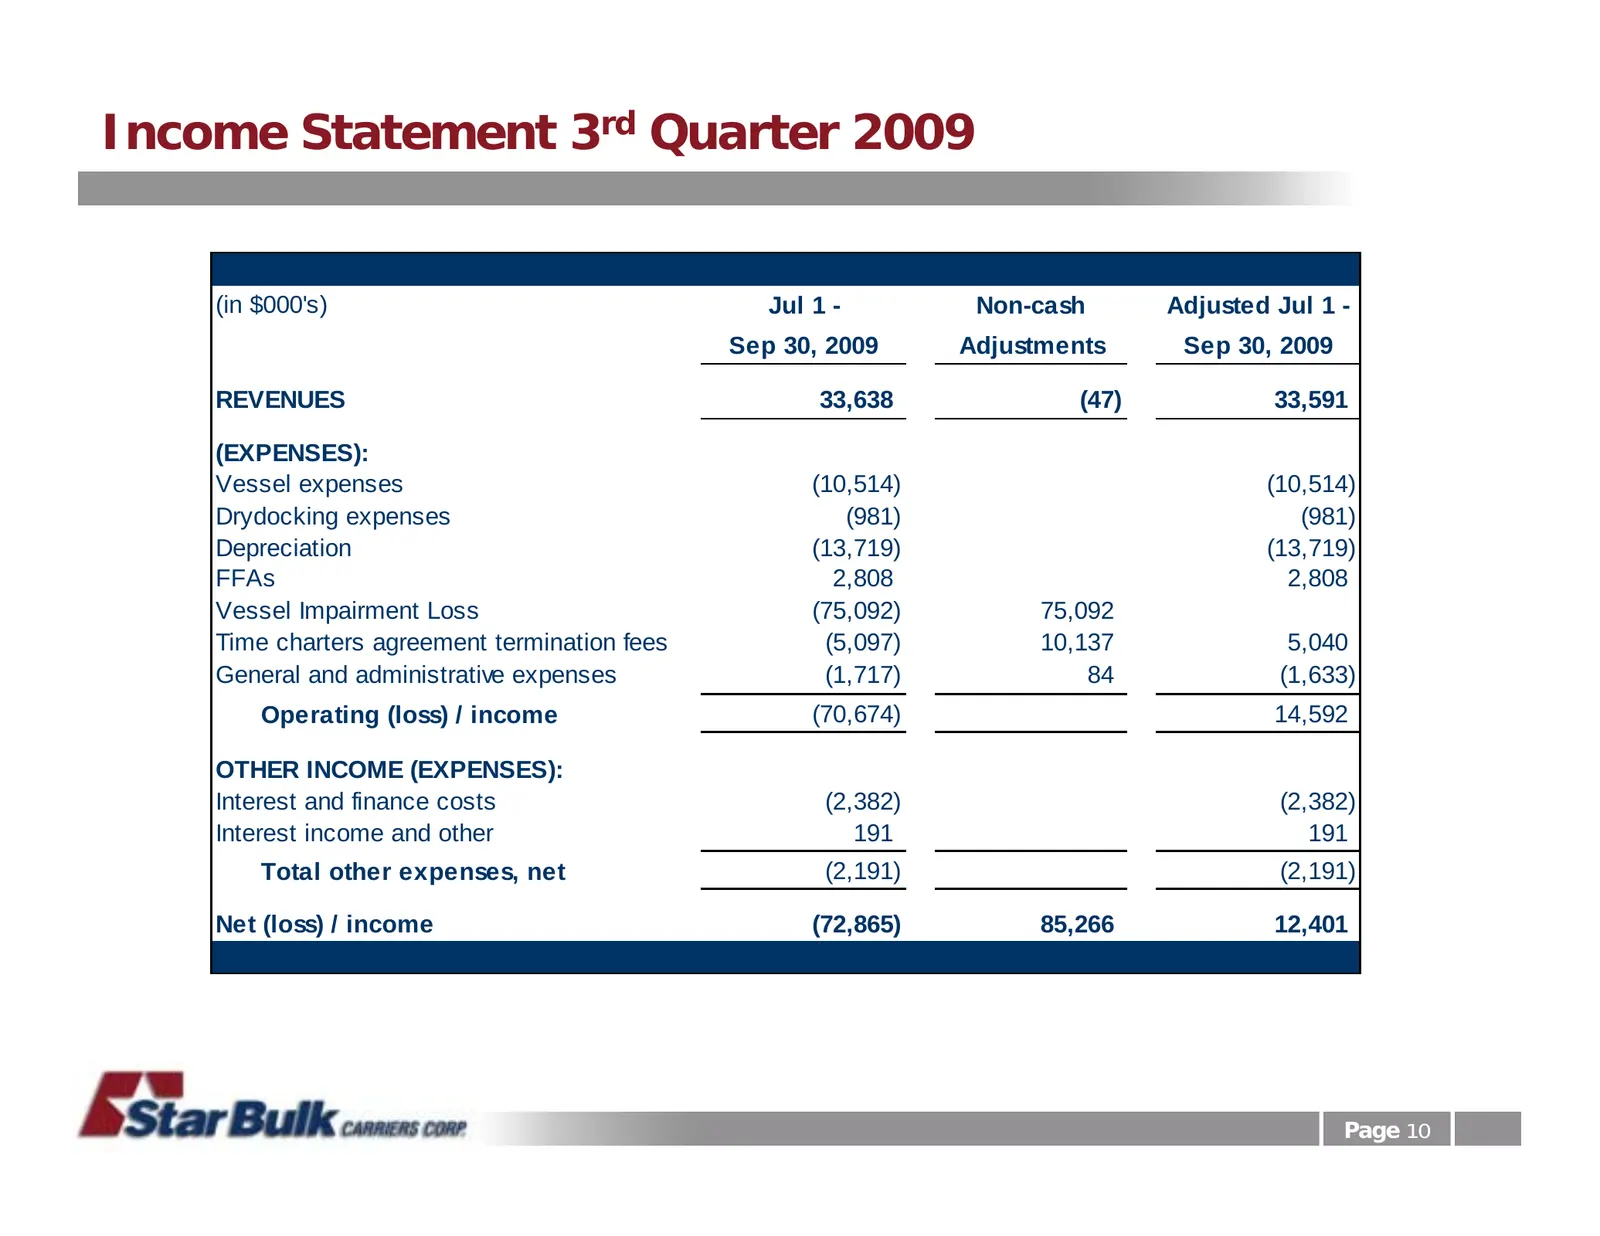
Income Statement 3rd Quarter 2009 (in $000's) Jul 1 - Non-cash Adjusted Jul 1 - Sep 30, 2009 Adjustments Sep 30, 2009 REVENUES 33,638 (47) 33,591 (EXPENSES): Vessel expenses (10,514) (10,514) Drydocking expenses (981) (981) Depreciation (13,719) (13,719) FFAs 2,808 2,808 Vessel Impairment Loss (75,0
Slide 11: Income Statement 9 Months 2009
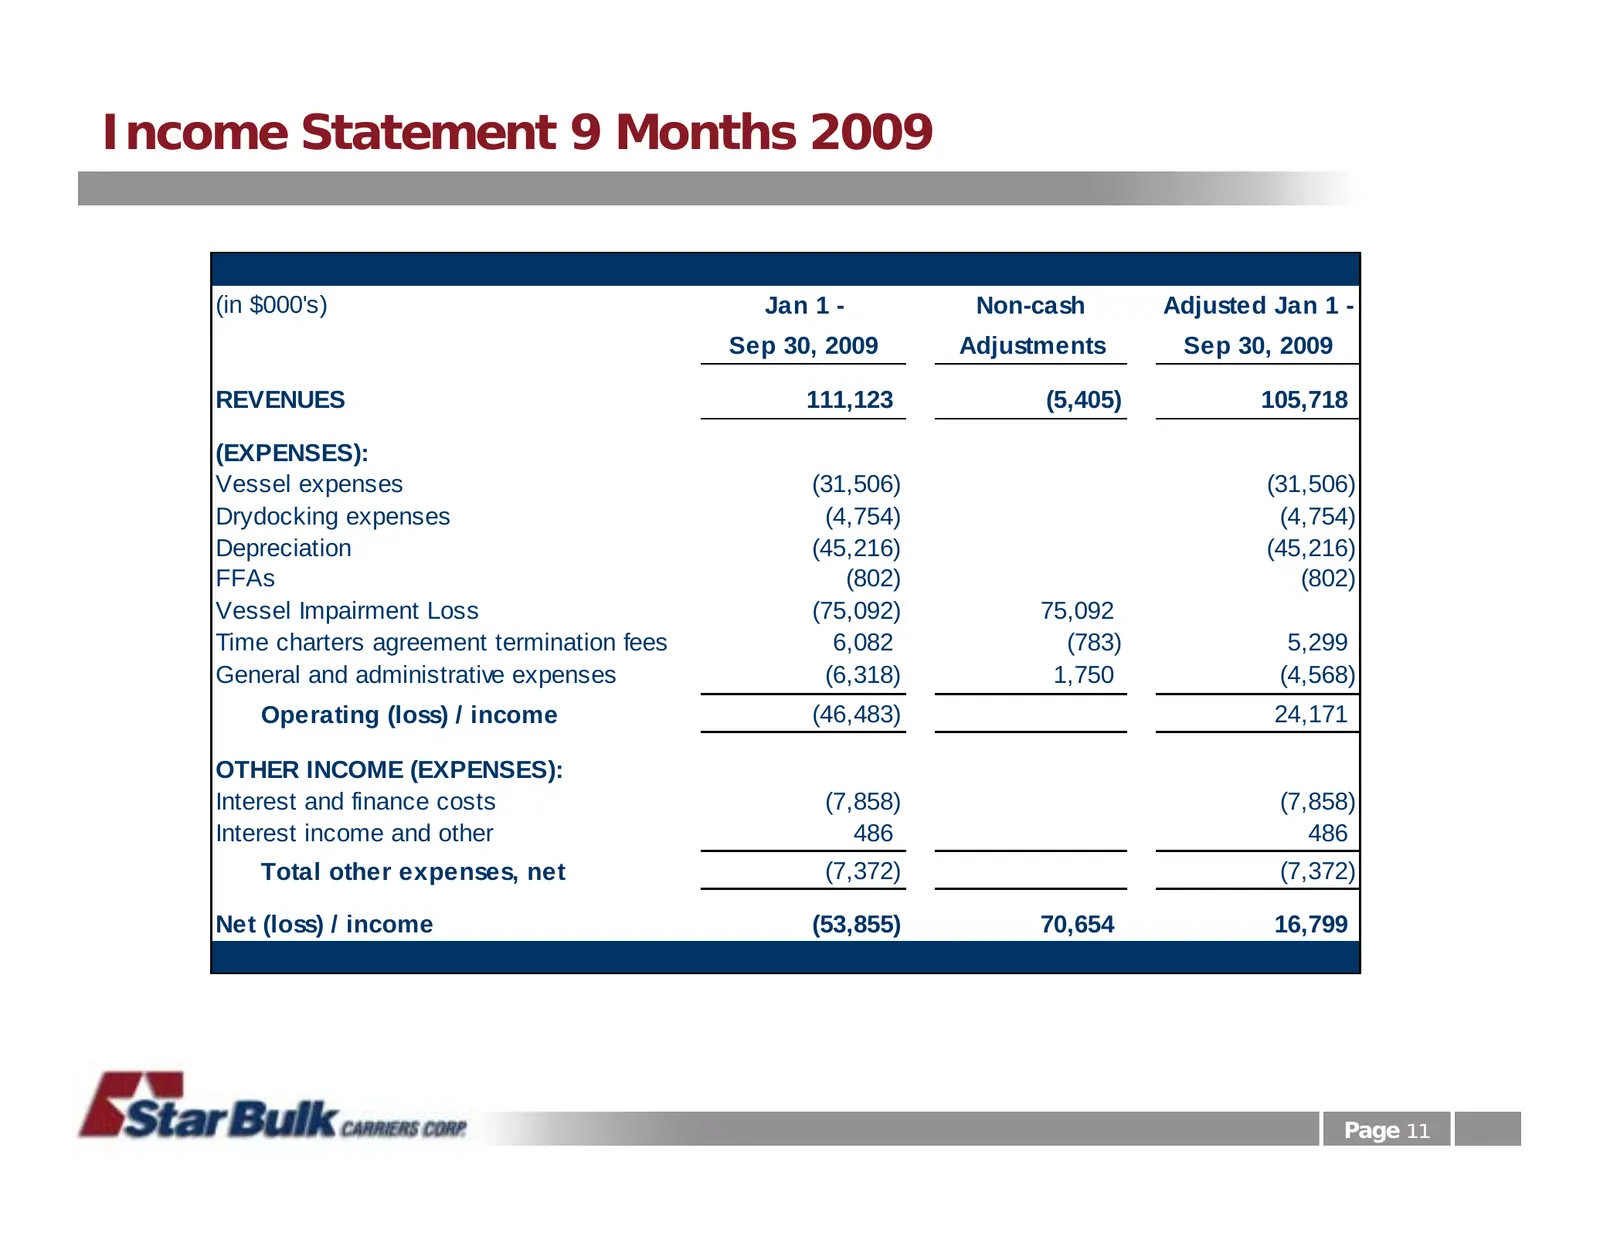
Income Statement 9 Months 2009 (in $000's) Jan 1 - Non-cash Adjusted Jan 1 - Sep 30, 2009 Adjustments Sep 30, 2009 REVENUES 111,123 (5,405) 105,718 (EXPENSES): Vessel expenses (31,506) (31,506) Drydocking expenses (4,754) (4,754) Depreciation (45,216) (45,216) FFAs (802) (802) Vessel Impairment Loss
Slide 12: Market Comments
Market Comments
Slide 13: Demand – Recovery Continuing
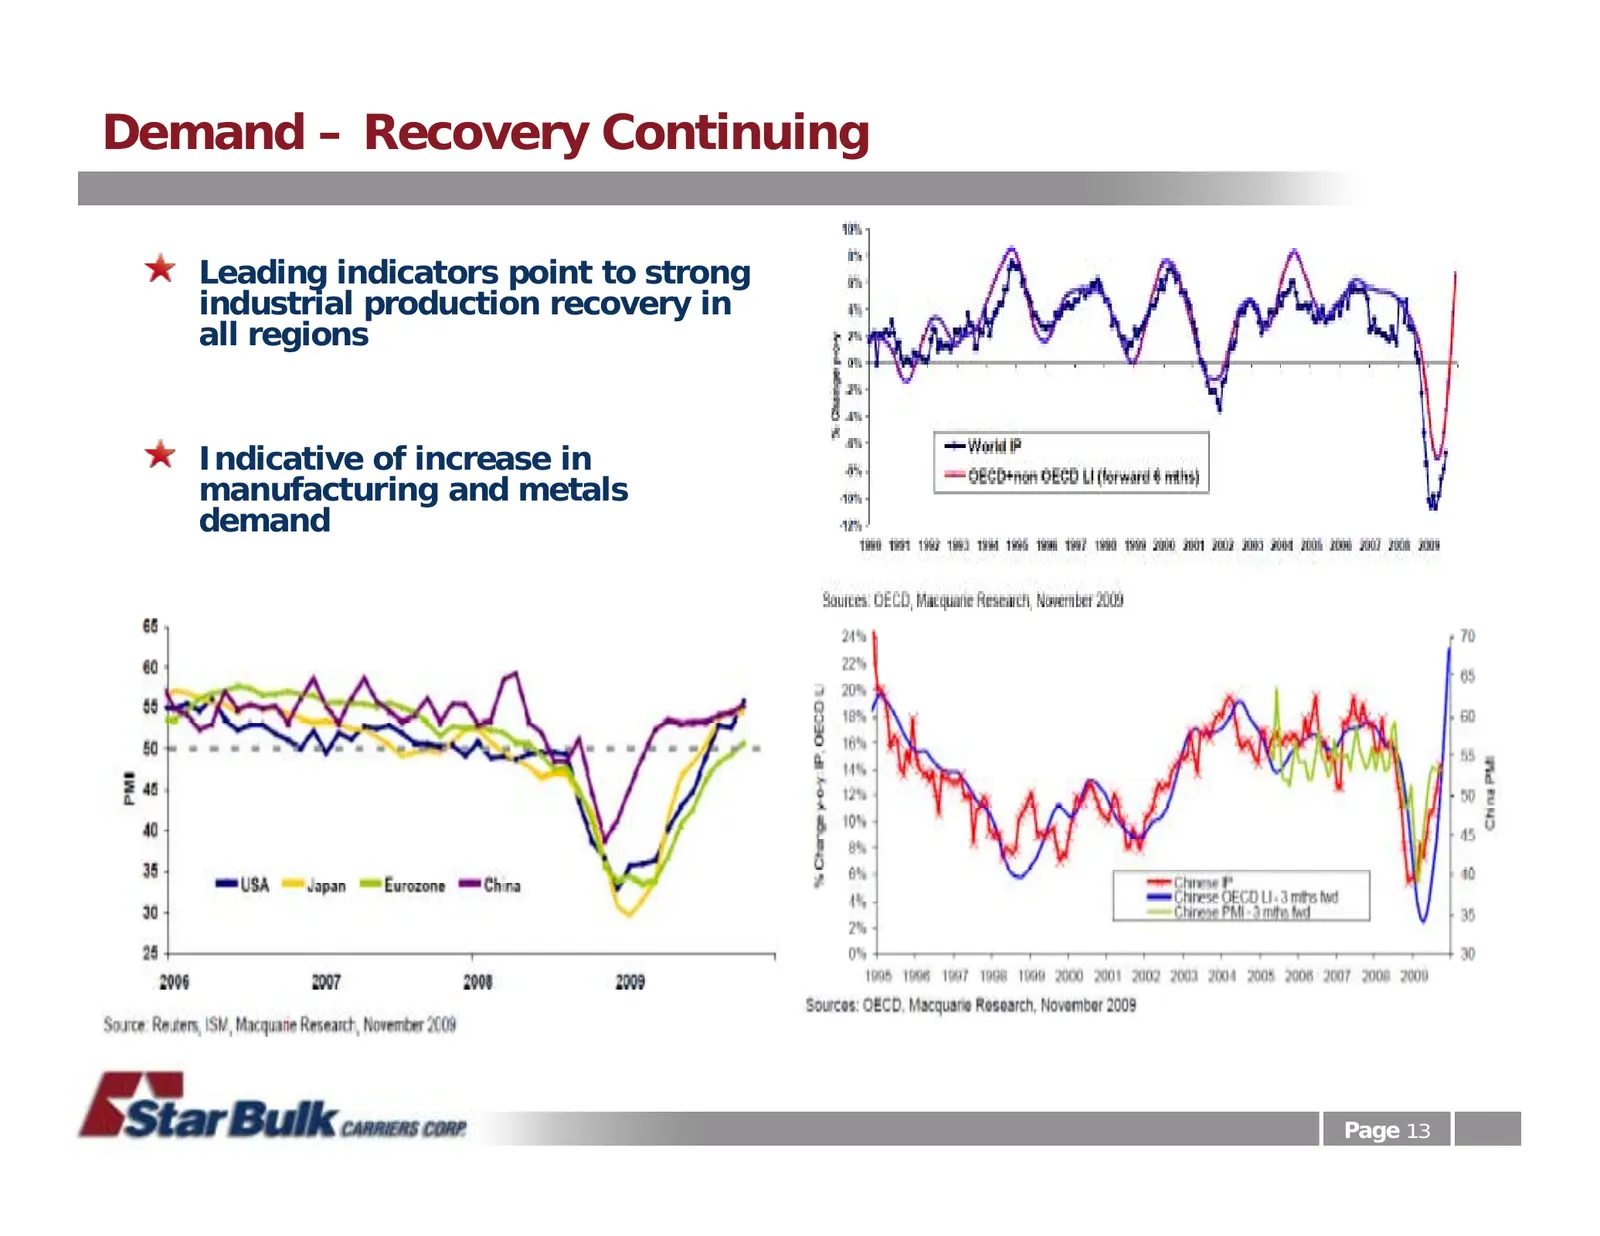
Demand – Recovery Continuing Leading indicators point to strong industrial production recovery in all regions Indicative of increase in manufacturing and metals demand Page 13
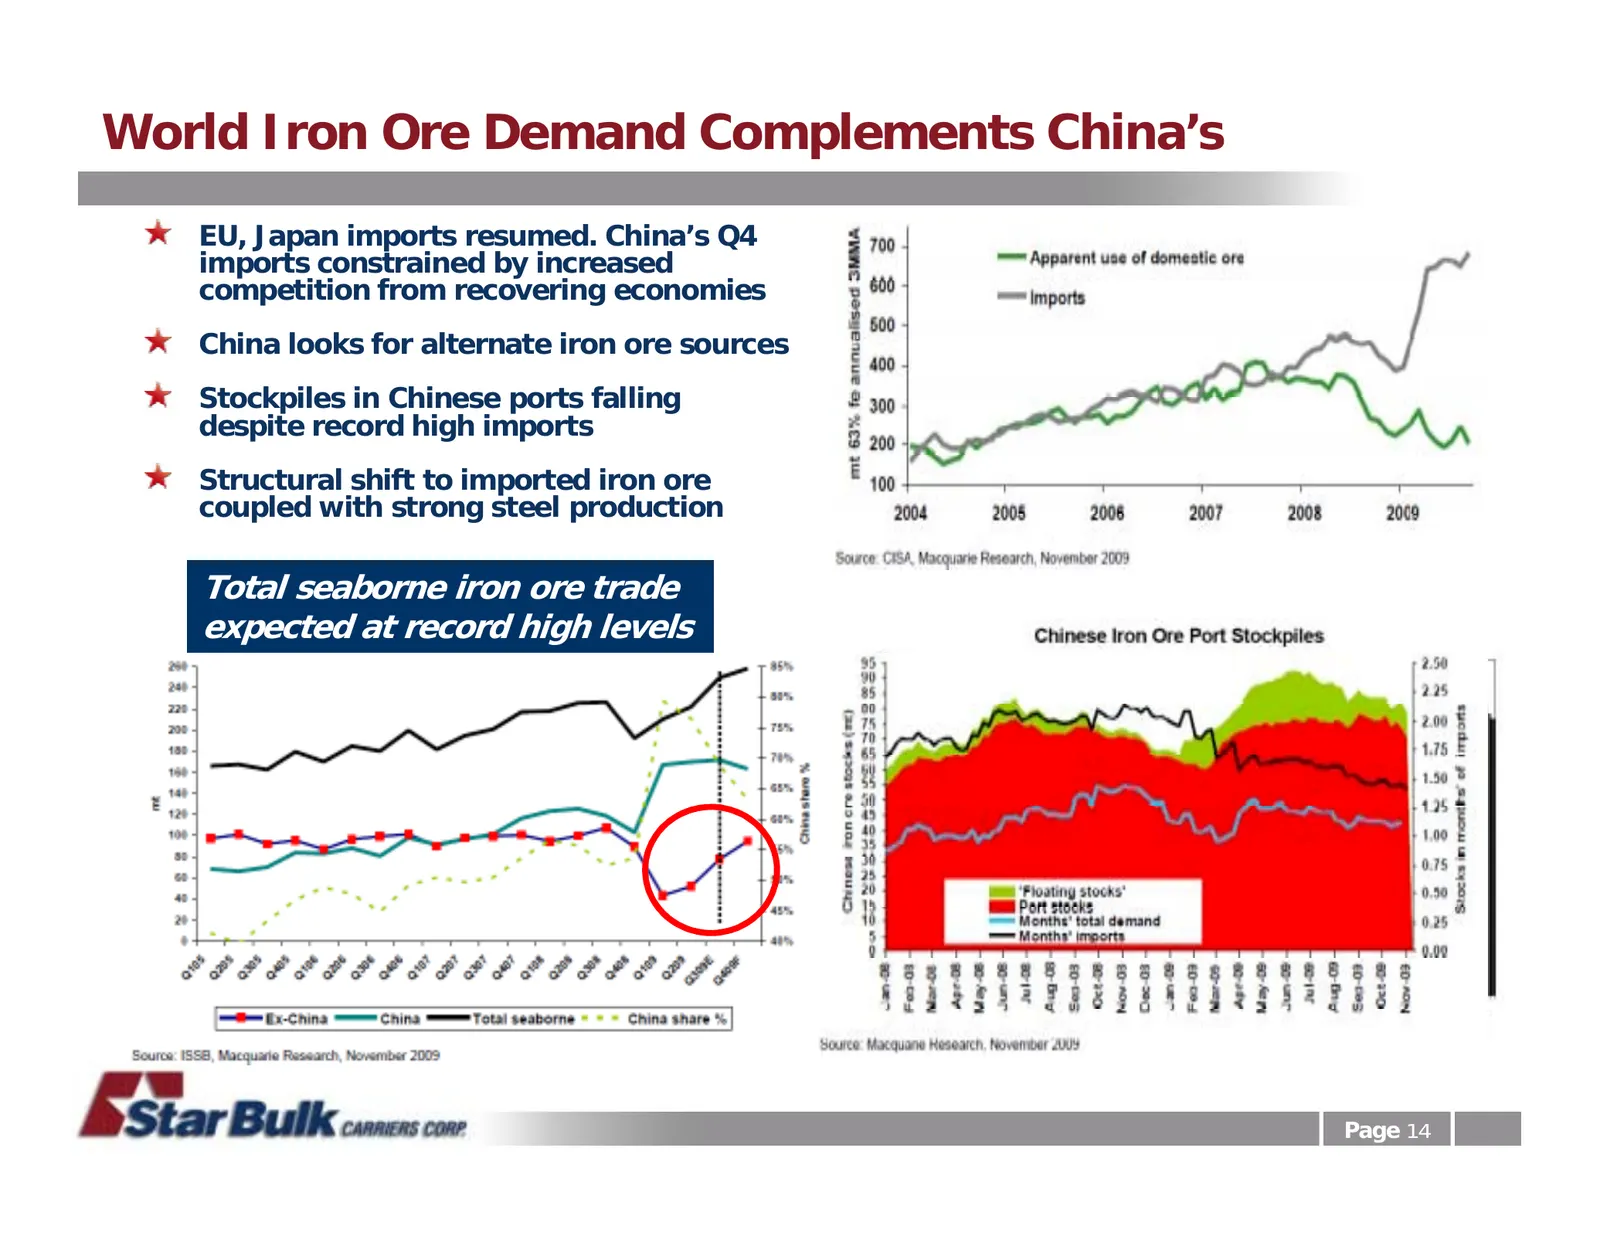
Slide 14: World Iron Ore Demand Complements China's
World Iron Ore Demand Complements China’s EU, Japan imports resumed. China’s Q4 imports constrained by increased competition from recovering economies China looks for alternate iron ore sources Stockpiles in Chinese ports falling despite record high imports Structural shift to imported iron ore coup
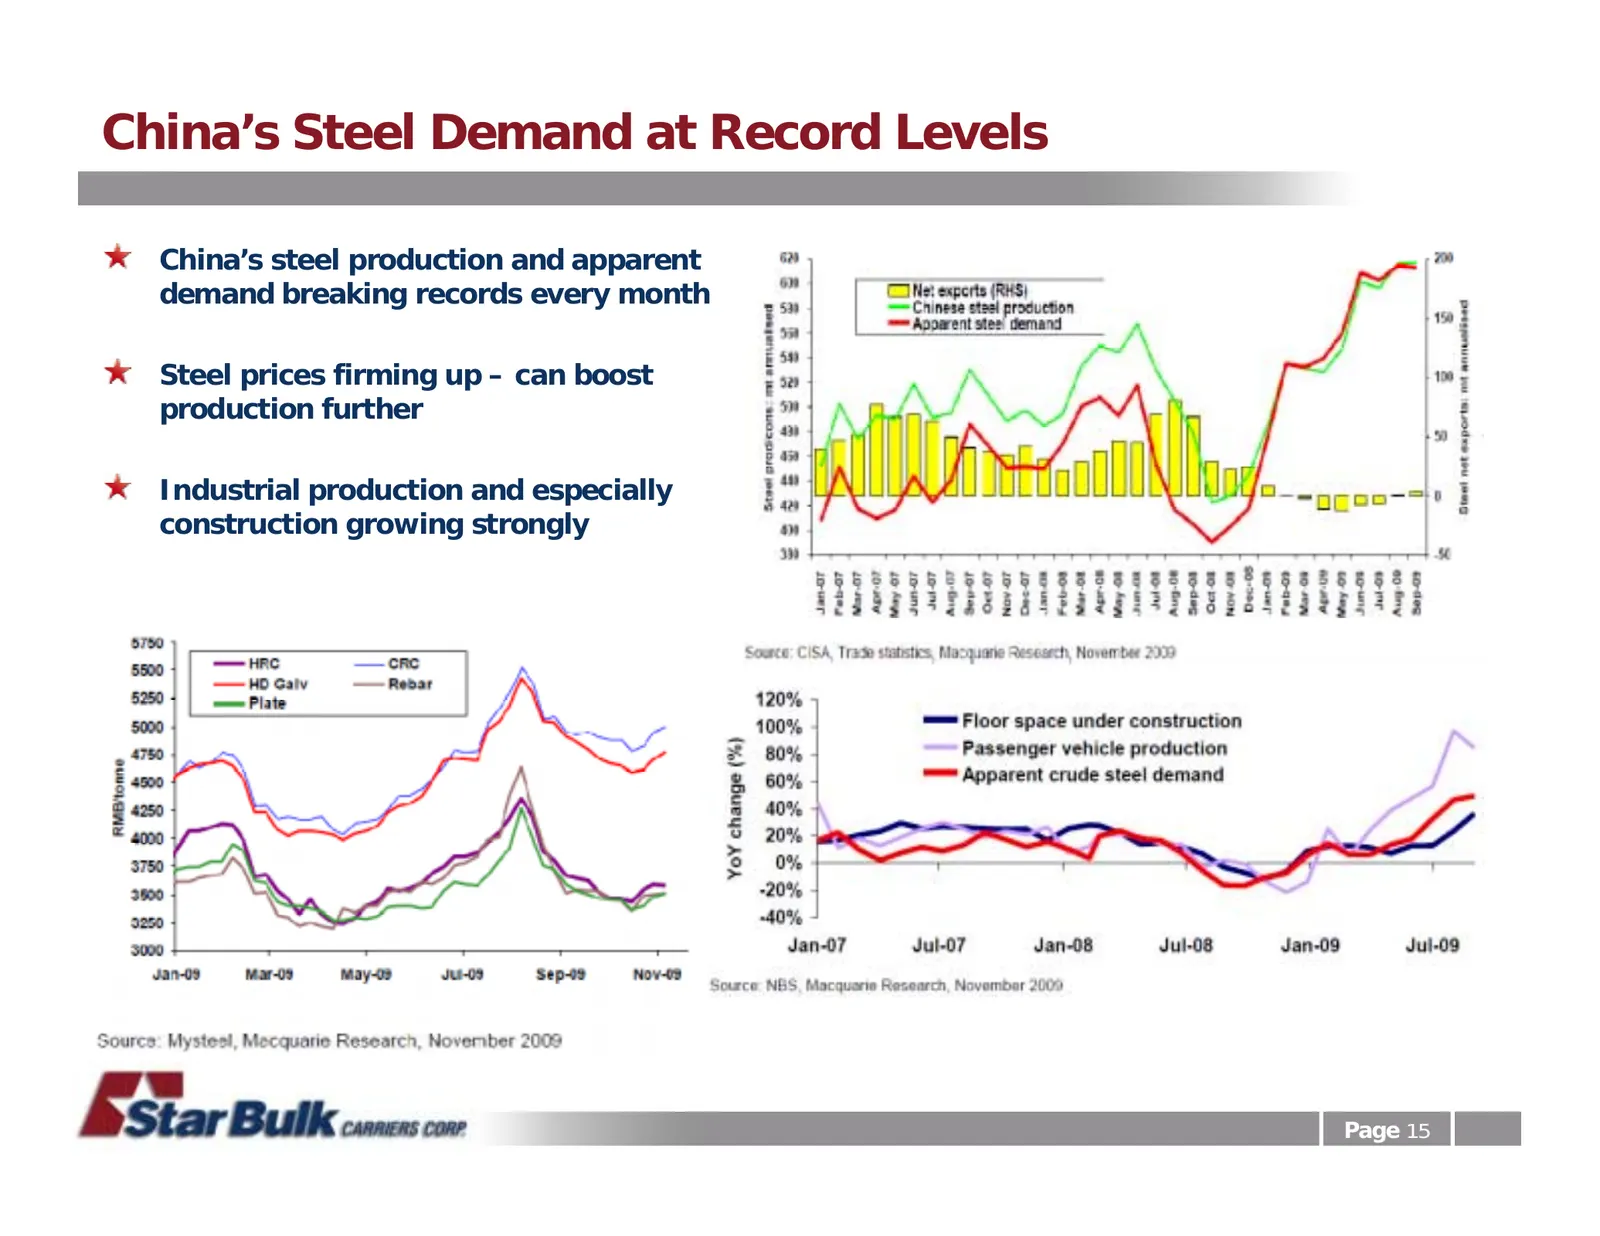
Slide 15: China's Steel Demand at Record Levels
China’s Steel Demand at Record Levels China’s steel production and apparent Chinese iron ore is expensive and of demand breaking records every month low quality As soon as imported iron ore became Steel prices firming up – can boost available at lower price imports surged production further Imports
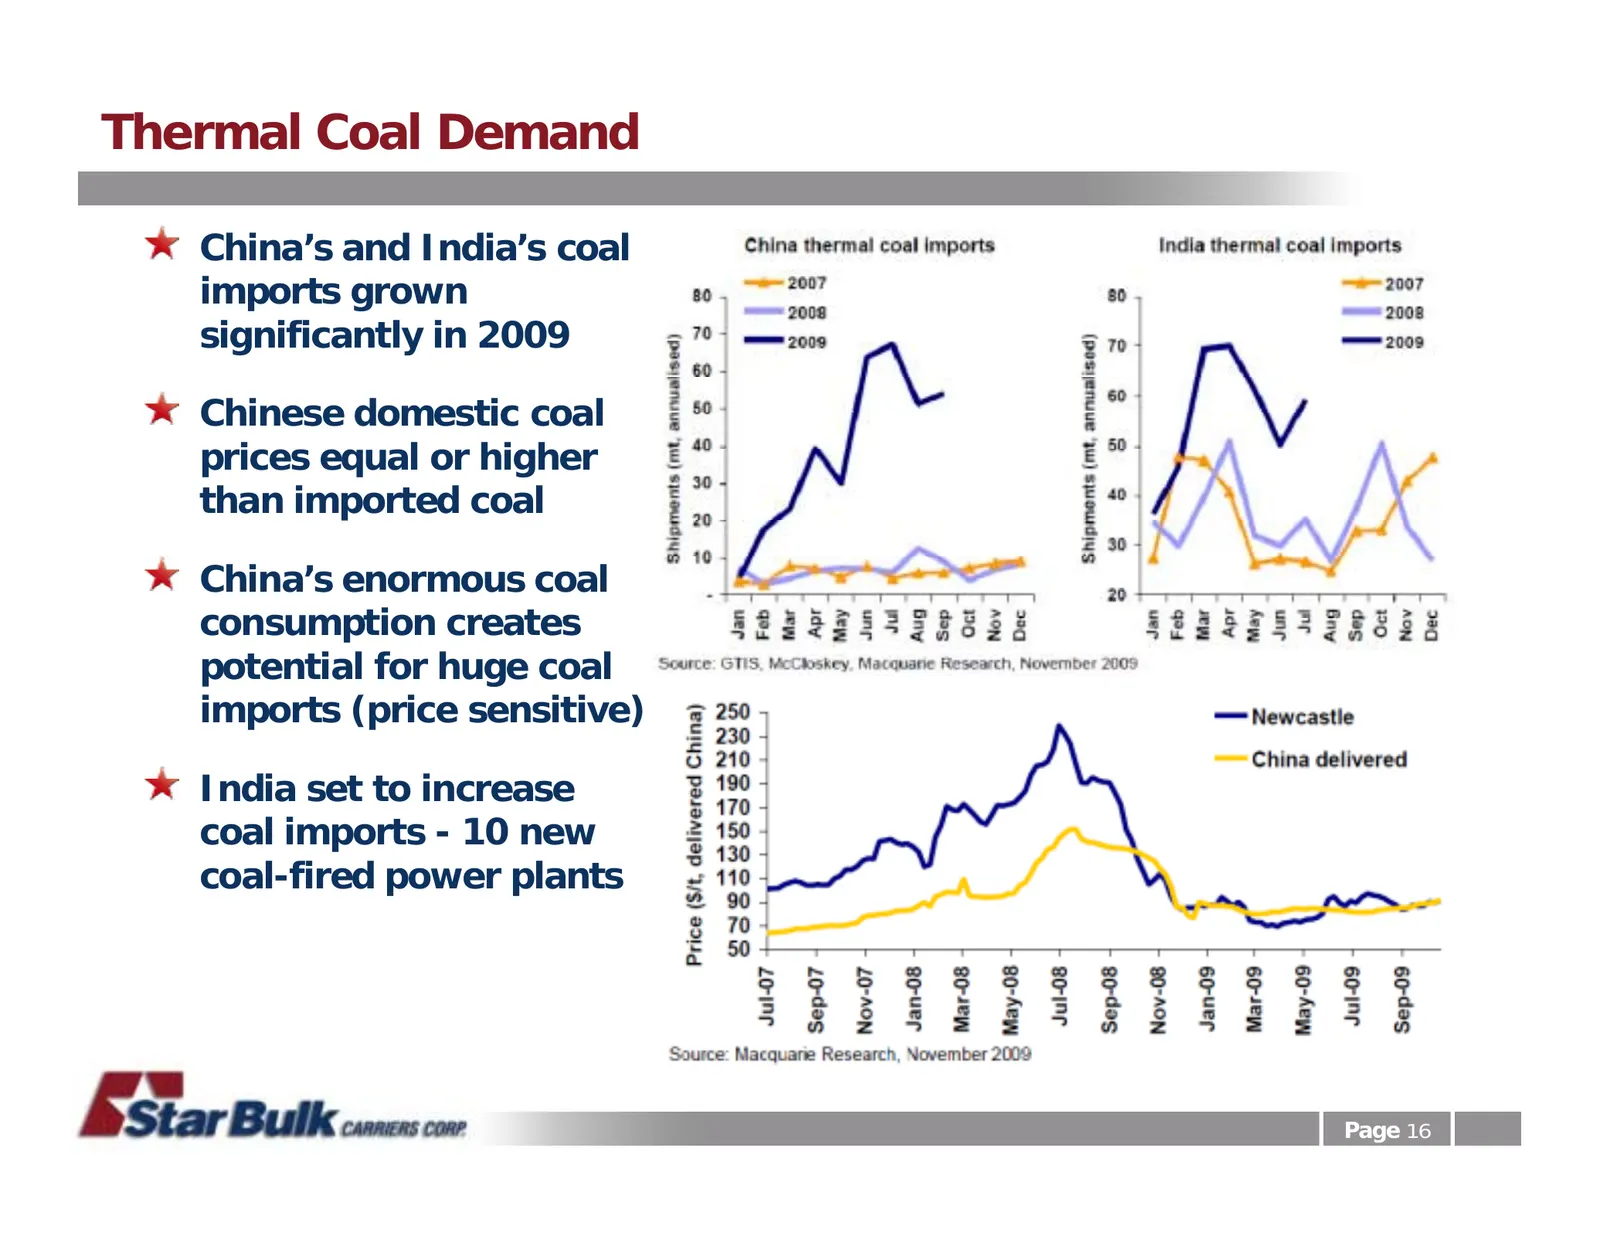
Slide 16: Thermal Coal Demand
Thermal Coal Demand China’s and India’s coal imports grown significantly in 2009 Chinese domestic coal prices equal or higher than imported coal China’s enormous coal consumption creates potential for huge coal imports (price sensitive) India set to increase coal imports - 10 new coal-fired power pl
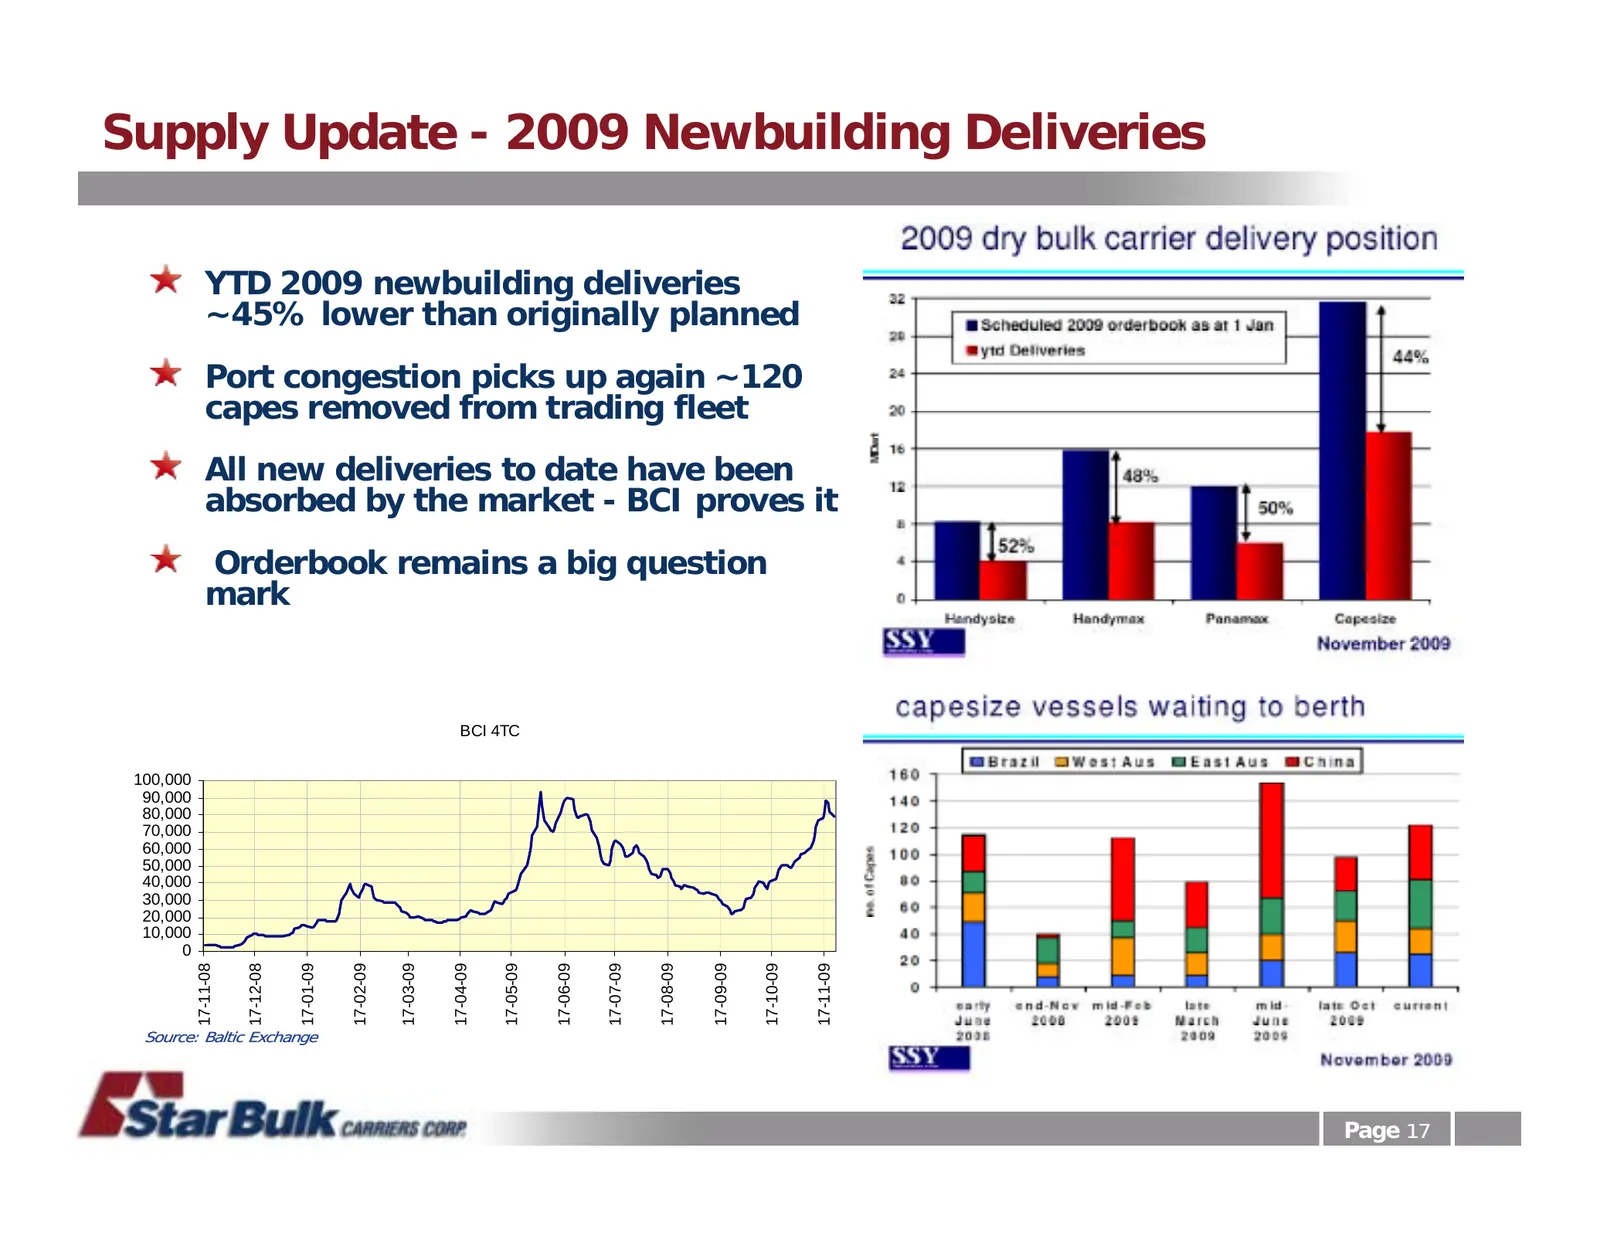
Slide 17: Supply Update - 2009 Newbuilding Deliveries
Supply Update - 2009 Newbuilding Deliveries YTD 2009 newbuilding deliveries ~45% lower than originally planned Port congestion picks up again ~120 capes removed from trading fleet All new deliveries to date have been absorbed by the market - BCI proves it Orderbook remains a big question mark BCI 4T
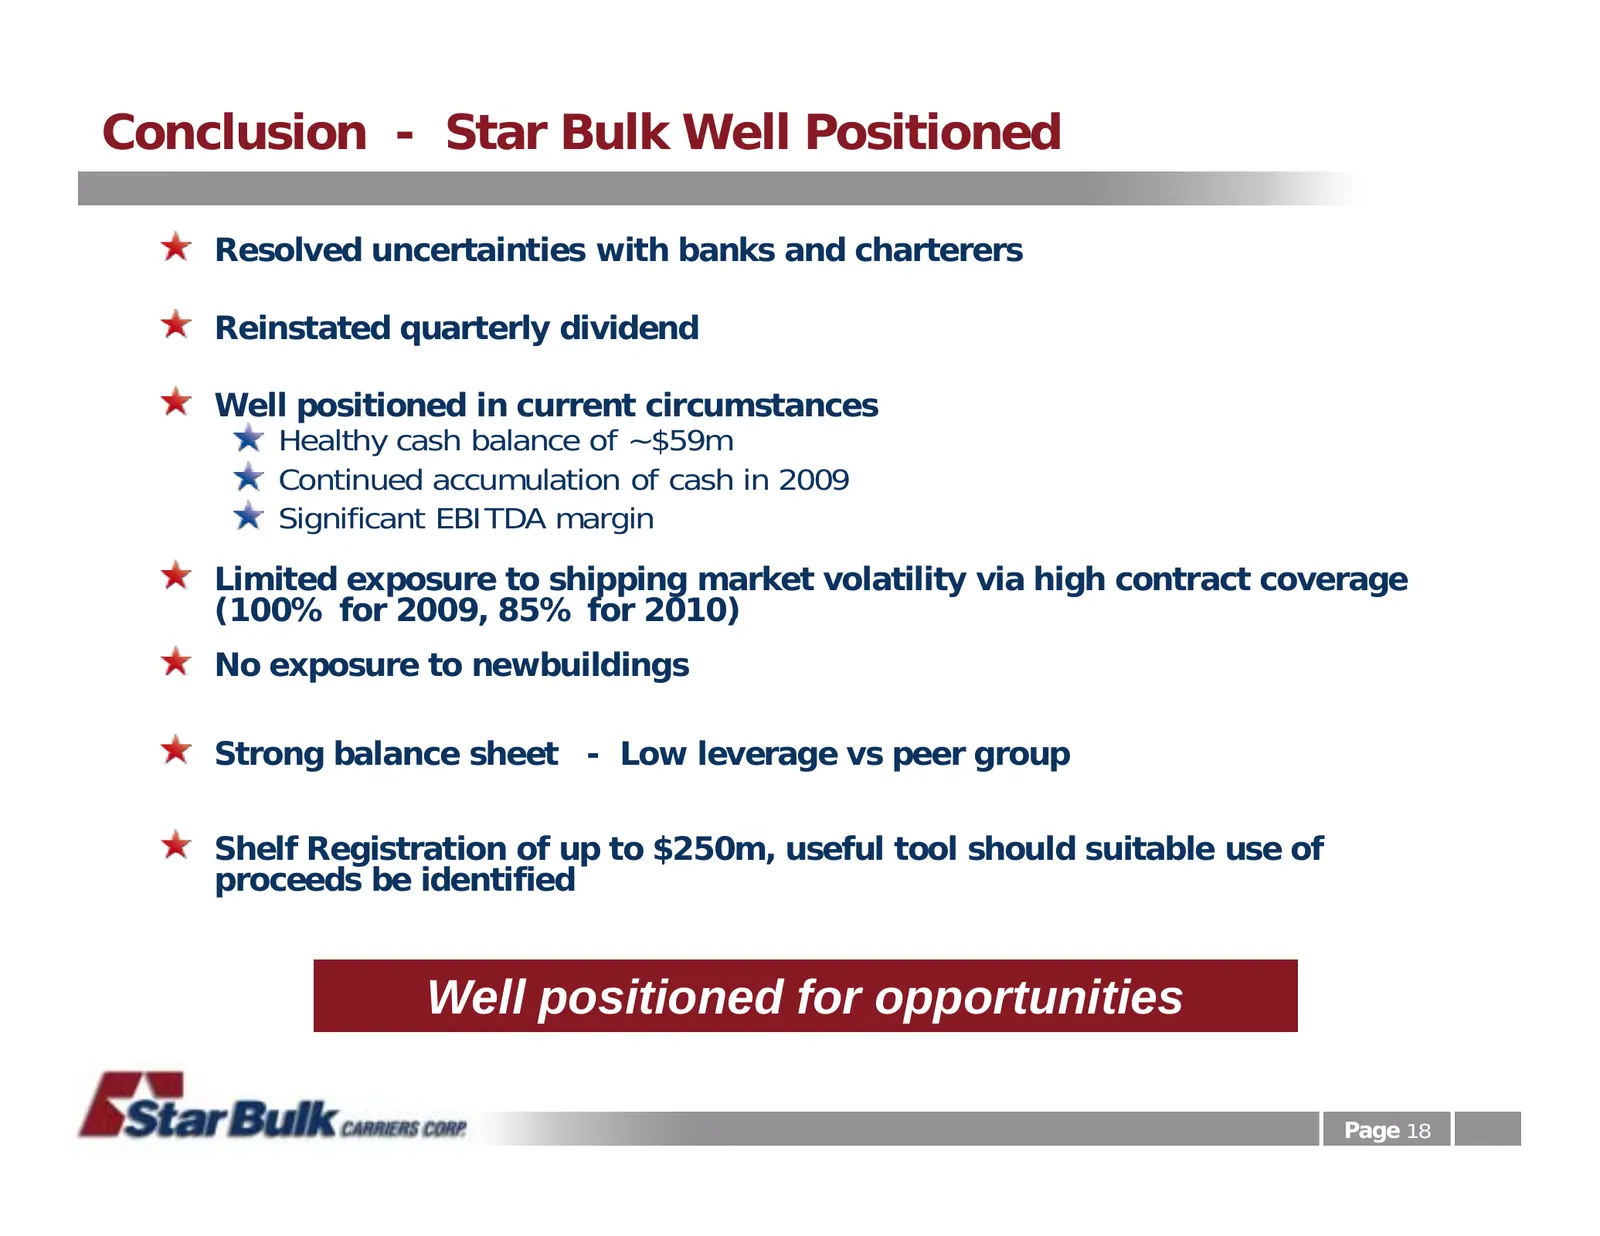
Slide 18: Conclusion - Star Bulk Well Positioned
Conclusion - Star Bulk Well Positioned Resolved uncertainties with banks and charterers Reinstated quarterly dividend Well positioned in current circumstances Healthy cash balance of ~$59m Continued accumulation of cash in 2009 Significant EBITDA margin Limited exposure to shipping market volatility

Slide 19: Thank You
THANK YOU
Source: Internet Archive copy of starbulk.com
More decks from Star Bulk Carriers Corp.
 Investor Presentation (September 2026)47 slides · September 2026
 Q2 2026 Earnings Presentation16 slides · August 2026
 Investor Presentation (June 2026)10 slides · June 2026
 Q1 2026 Earnings Presentation16 slides · May 21, 2026
 Q4 2025 Earnings Presentation15 slides · Feb 26, 2026
 Q3 2025 Earnings Presentation14 slides · Nov 19, 2025