ERock, Inc. · NYSE:EROC
ERock — Q3 2026 Earnings Presentation
18 slides from ERock's earnings presentation, November 2026
Slide 1: Q3 2026 Earnings Presentation
Q3 2026 Earnings Presentation November 2026
Slide 2: Disclaimers
Disclaimers This presentation (and oral statements made regarding the subjects of this presentation) contains forward-looking statements within the meaning of Section 27A of the Securities Act of 1933, as amended, and Section 21E of the Securities Exchange Act of 1934, as amended, (each a “forward-l
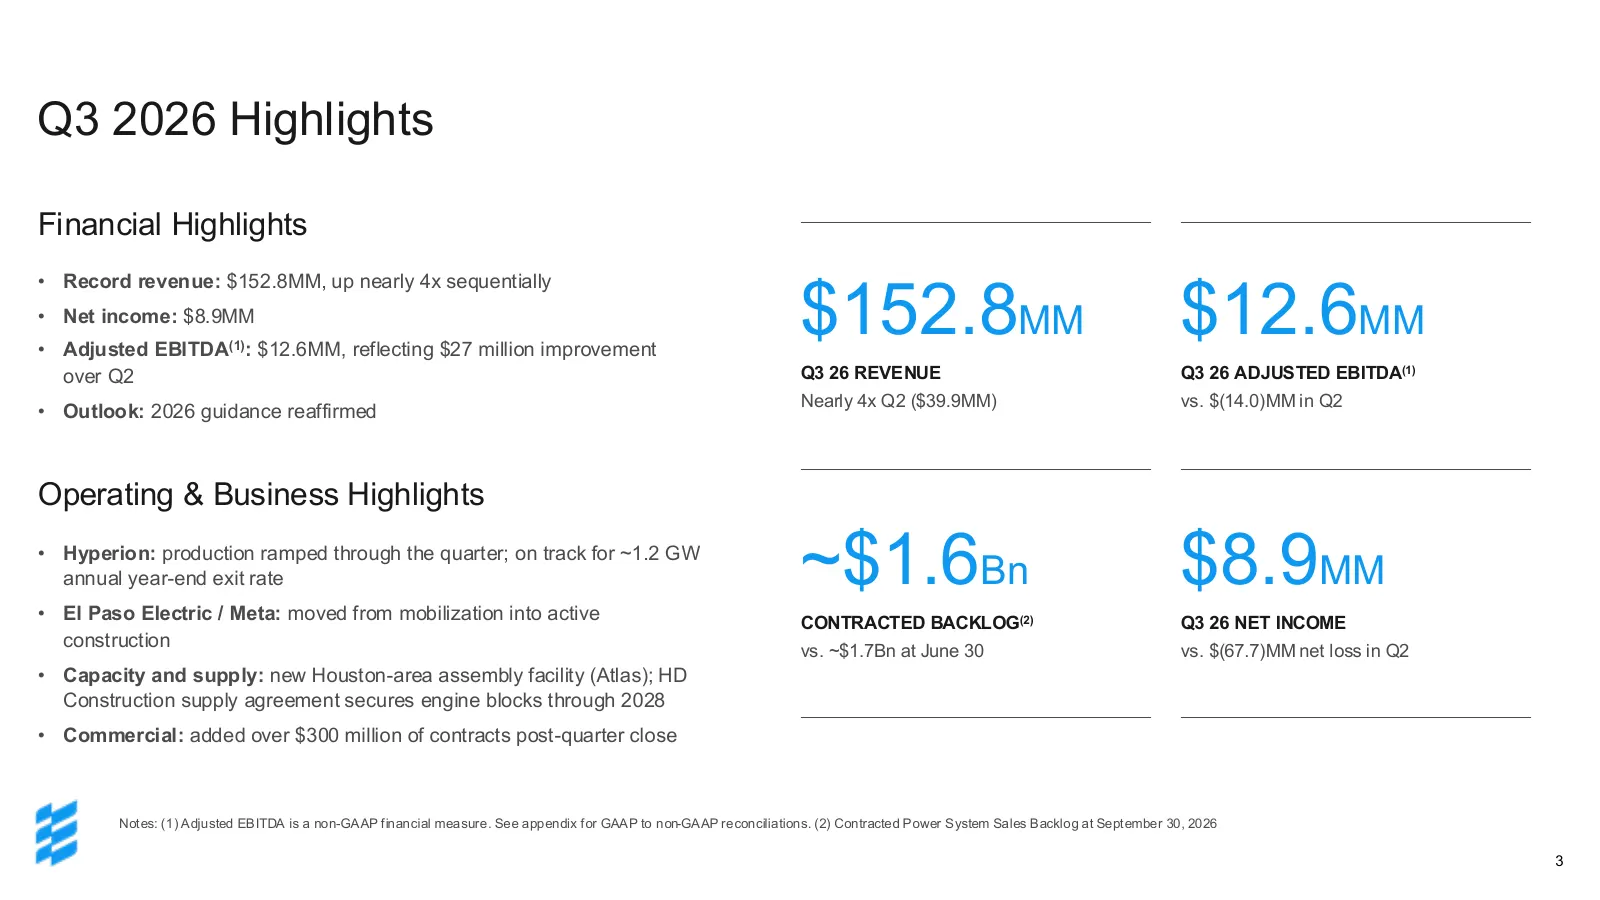
Slide 3: Q3 2026 Highlights
Q3 2026 Highlights Financial Highlights $152.8MM $12.6MM • Record revenue: $152.8MM, up nearly 4x sequentially • Net income: $8.9MM • Adjusted EBITDA(1): $12.6MM, reflecting $27 million improvement over Q2 Q3 26 REVENUE Q3 26 ADJUSTED EBITDA(1) Nearly 4x Q2 ($39.9MM) vs. $(14.0)MM in Q2 • Outlook: 2
Slide 4: Capital-Light Model
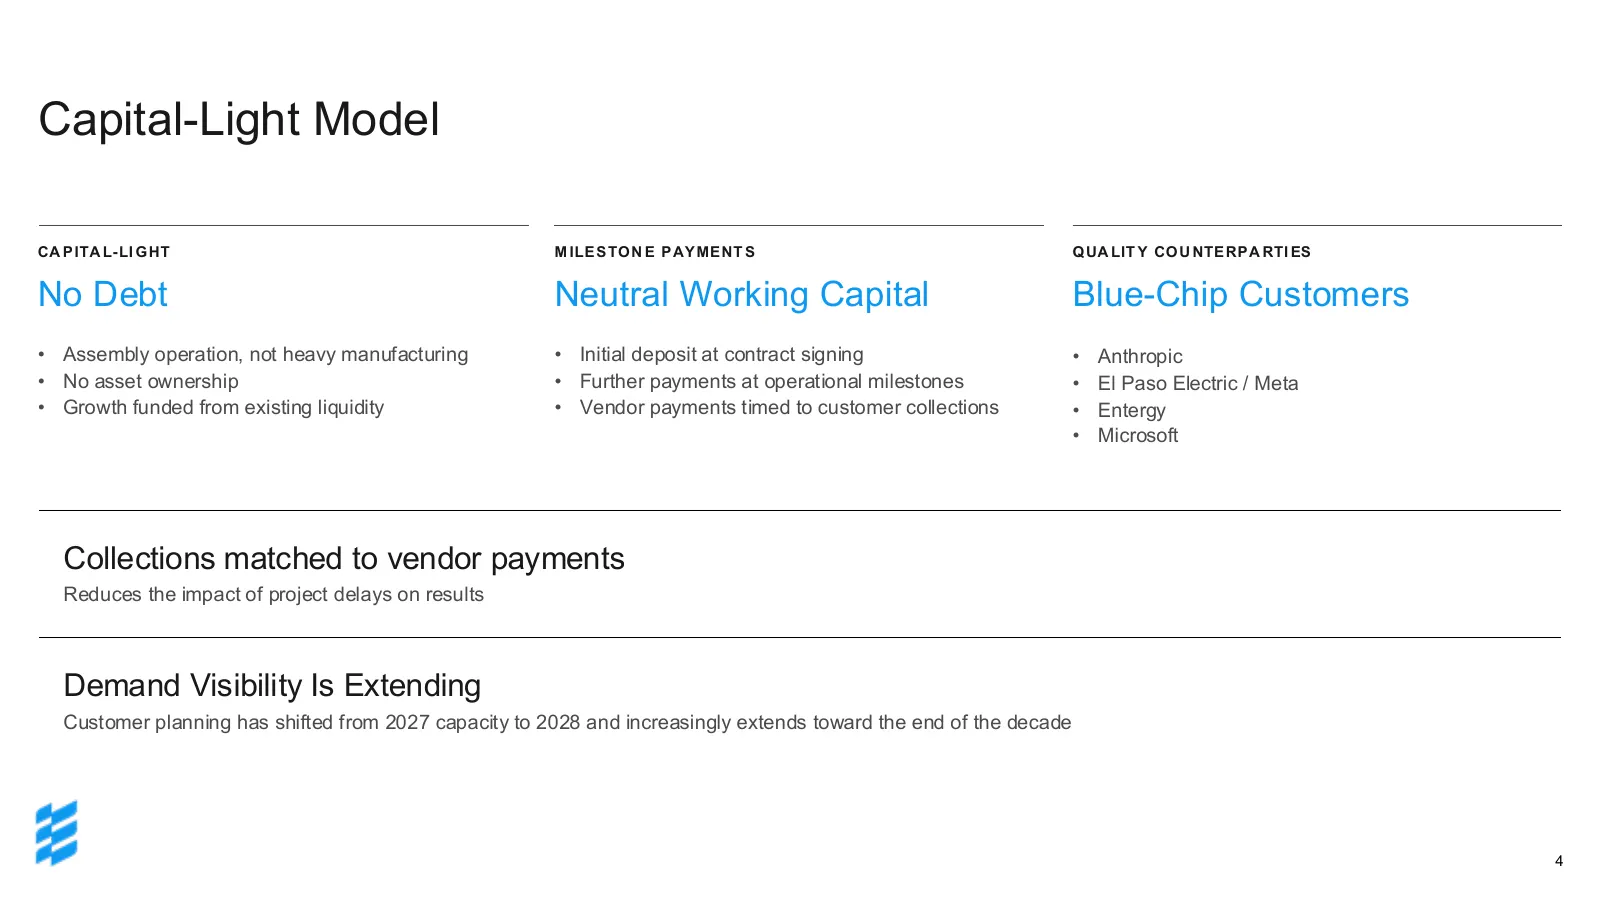
Capital-Light Model CA P ITA L-LI G HT M ILE S TO N E P AY ME NT S Q UA LIT Y CO U NTE RP A RTI ES No Debt Neutral Working Capital Blue-Chip Customers • Assembly operation, not heavy manufacturing • Initial deposit at contract signing • Anthropic • No asset ownership • Further payments at operationa
Slide 5: ERock Snapshot
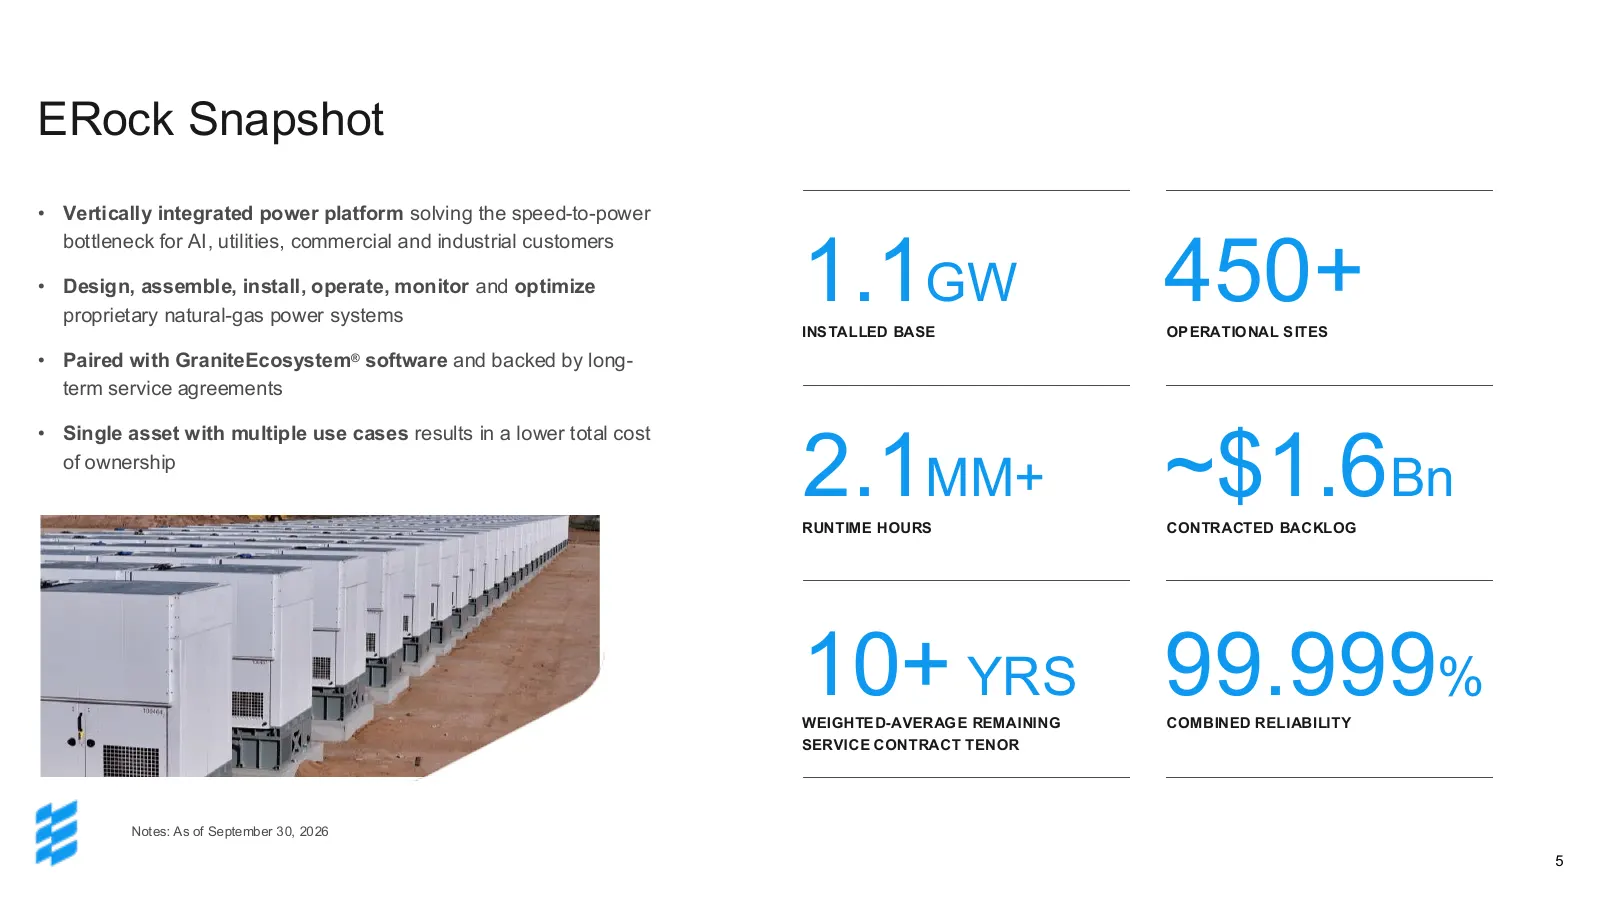
ERock Snapshot • Vertically integrated power platform solving the speed-to-power 1.1GW 450+ bottleneck for AI, utilities, commercial and industrial customers • Design, assemble, install, operate, monitor and optimize proprietary natural-gas power systems INS TALLED BASE OP ERATIO NAL S ITES • Paired
Slide 6: Vertical Integration: Seamless Turnkey Power Delivery
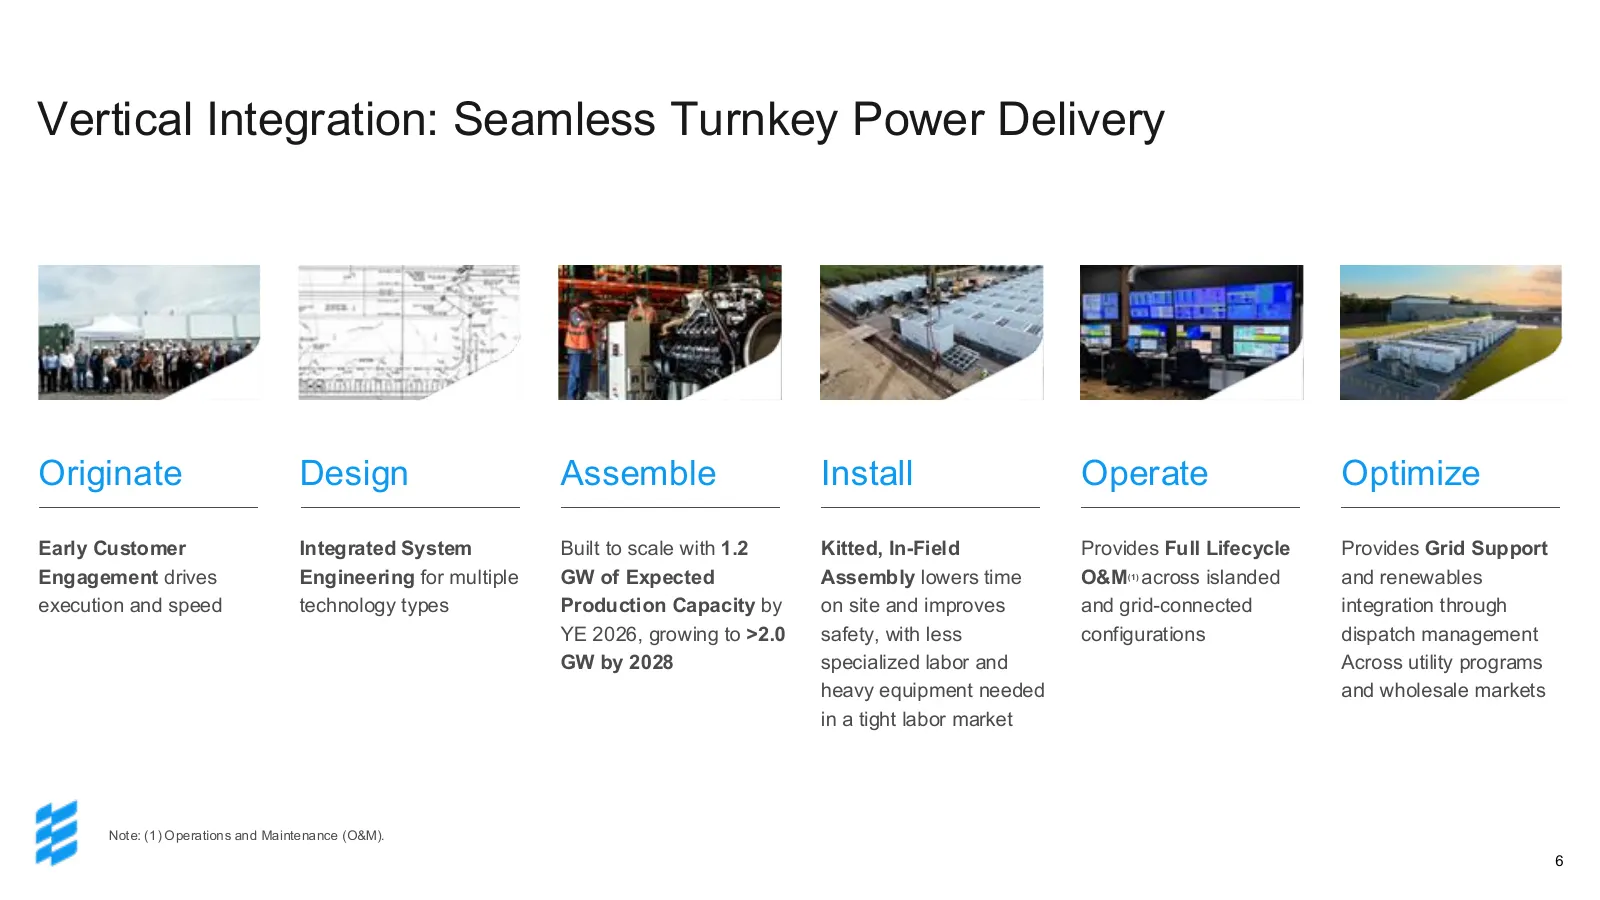
Vertical Integration: Seamless Turnkey Power Delivery Originate Design Assemble Install Operate Optimize Early Customer Integrated System Built to scale with 1.2 Kitted, In-Field Provides Full Lifecycle Provides Grid Support Engagement drives Engineering for multiple GW of Expected Assembly lowers t
Slide 7: Project Spotlight: El Paso Electric + Meta
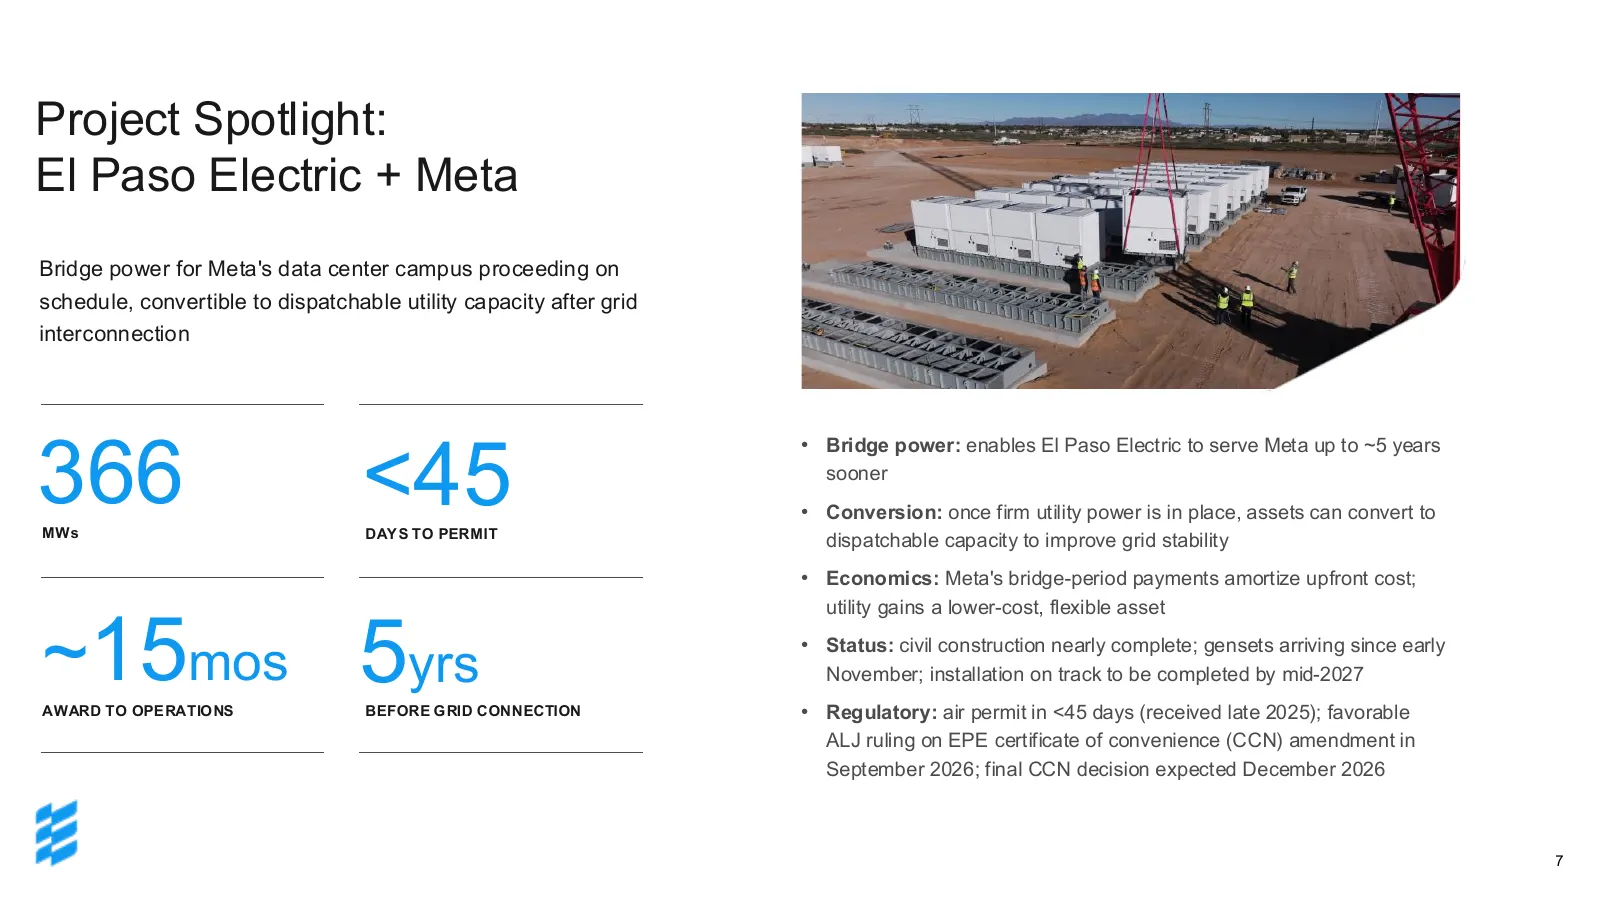
Project Spotlight: El Paso Electric + Meta Bridge power for Meta's data center campus proceeding on schedule, convertible to dispatchable utility capacity after grid interconnection 366 <45 • Bridge power: enables El Paso Electric to serve Meta up to ~5 years sooner • Conversion: once firm utility p
Slide 8: Growing Capacity and Locking In Supply Chain Agreements
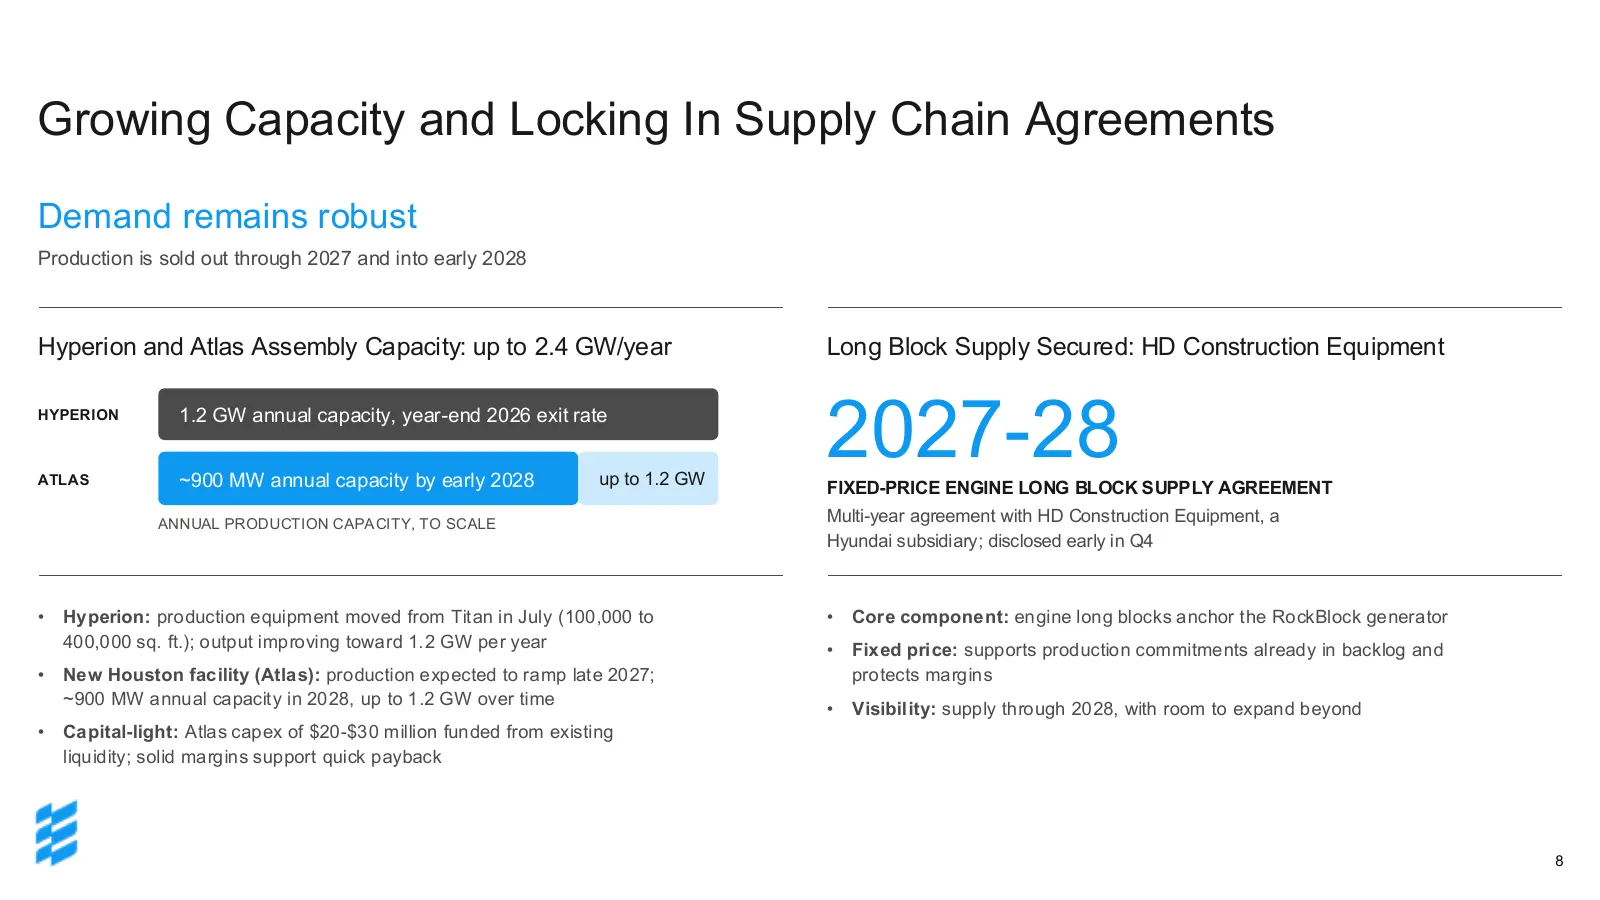
Growing Capacity and Locking In Supply Chain Agreements Demand remains robust Production is sold out through 2027 and into early 2028 Hyperion and Atlas Assembly Capacity: up to 2.4 GW/year Long Block Supply Secured: HD Construction Equipment HYPERION ATLAS 1.2 GW annual capacity, year-end 2026 exit
Slide 9: C&I: A Growing Engine with Larger Loads
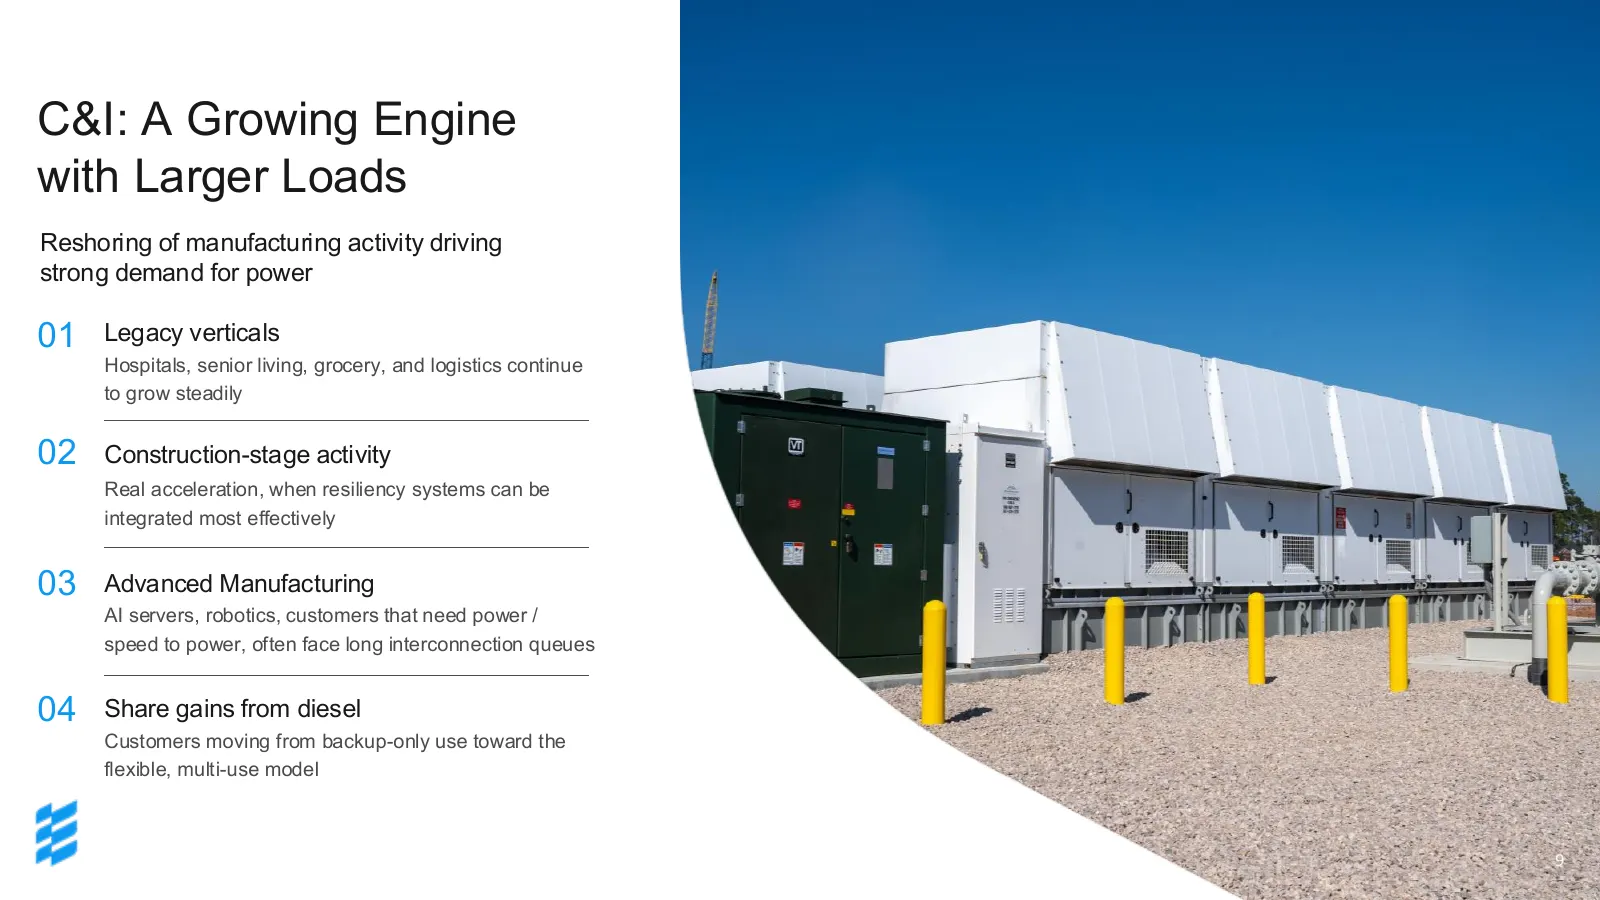
C&I: A Growing Engine with Larger Loads Reshoring of manufacturing activity driving strong demand for power 01 Legacy verticals Hospitals, senior living, grocery, and logistics continue to grow steadily 02 Construction-stage activity Real acceleration, when resiliency systems can be integrated most
Slide 10: Q3 2026 Financial Results
Q3 2026 Financial Results
Slide 11: Continued Strong Execution in Q3 2026
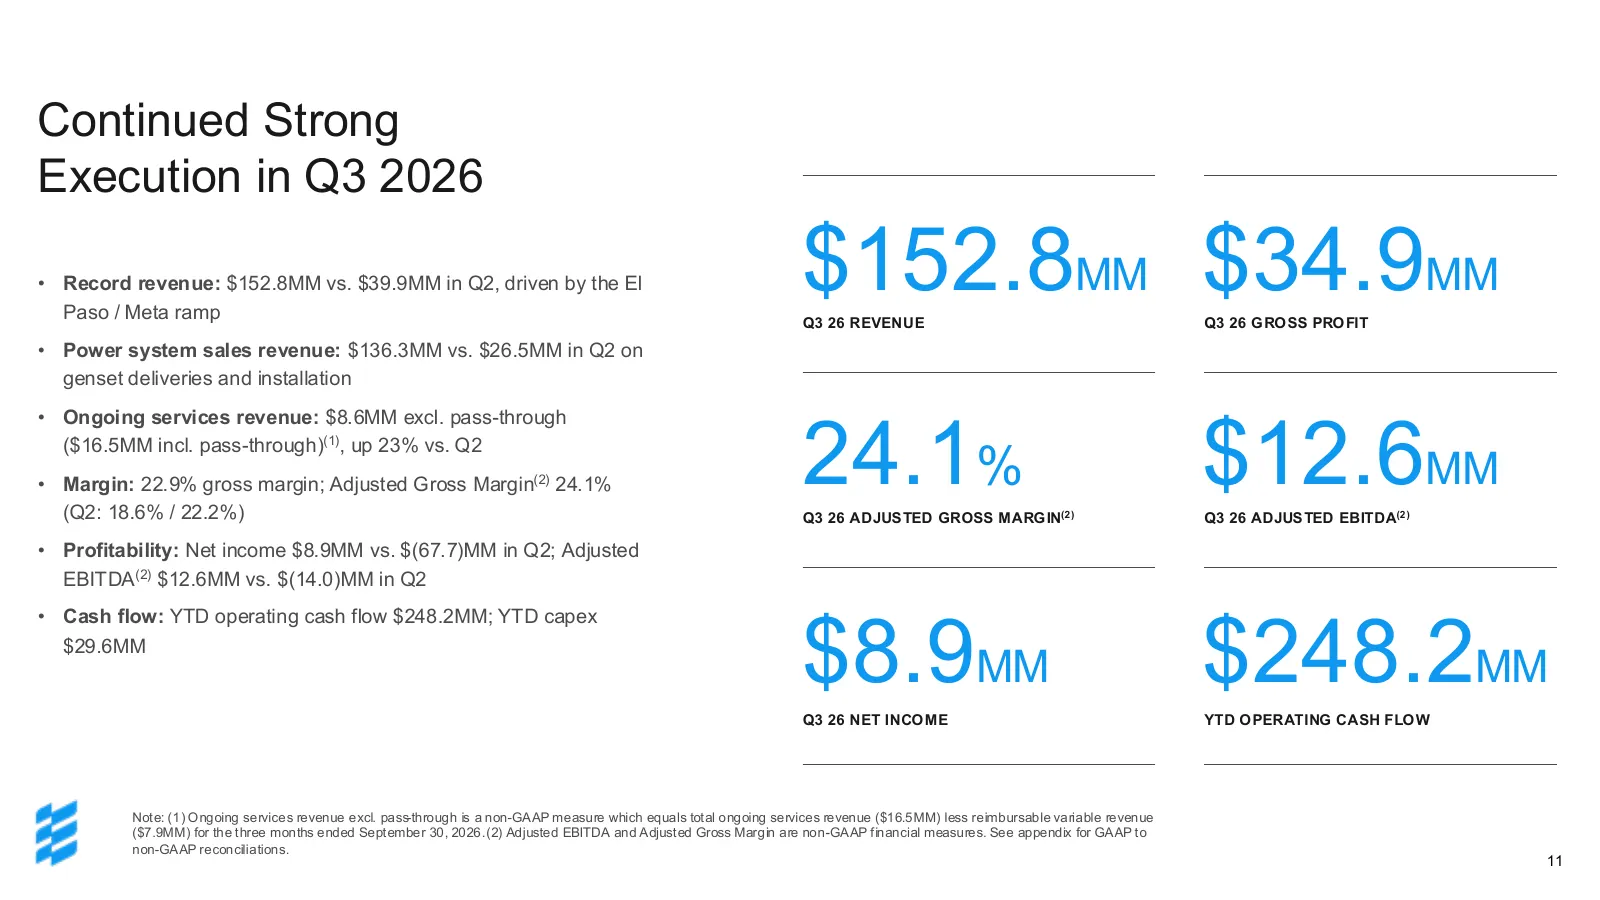
Continued Strong Execution in Q3 2026 • Record revenue: $152.8MM vs. $39.9MM in Q2, driven by the El Paso / Meta ramp $152.8MM $34.9MM Q3 26 REVENUE Q3 26 G RO SS PRO FIT • Power system sales revenue: $136.3MM vs. $26.5MM in Q2 on genset deliveries and installation 24.1% $12.6MM • Ongoing services r
Slide 12: 2026 Full Year & Q4 Outlook
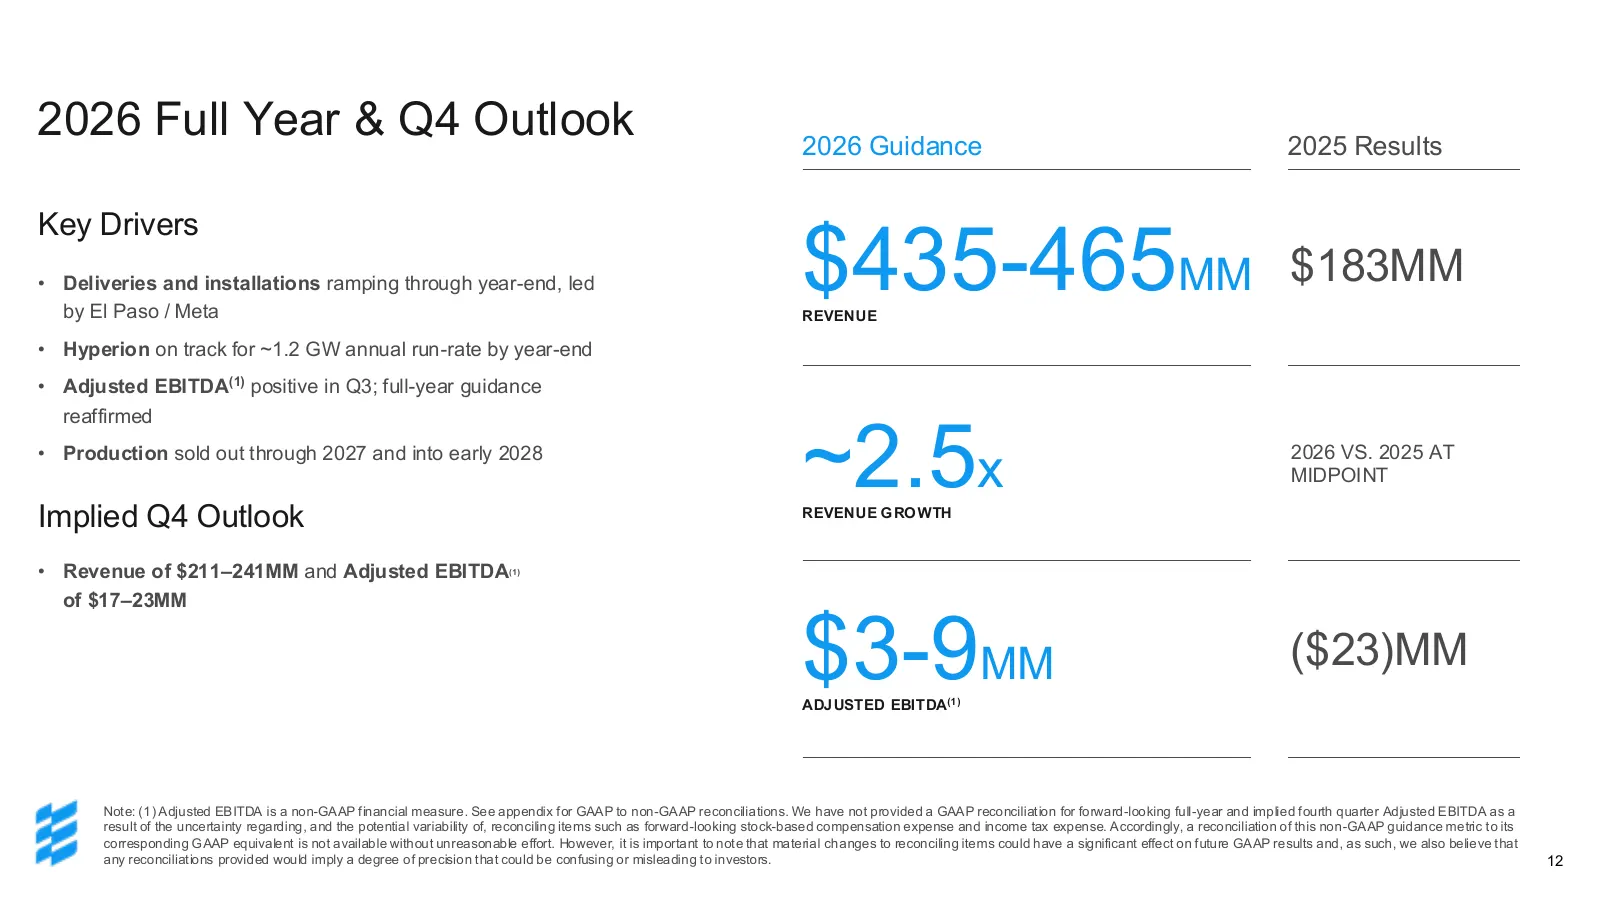
2026 Full Year & Q4 Outlook 2026 Guidance 2025 Results Key Drivers • Deliveries and installations ramping through year-end, led by El Paso / Meta $435-465MM $183MM REVENUE • Hyperion on track for ~1.2 GW annual run-rate by year-end • Adjusted EBITDA(1) positive in Q3; full-year guidance reaffirmed •
Slide 13: Balance Sheet: No Debt, Strong Cash Position
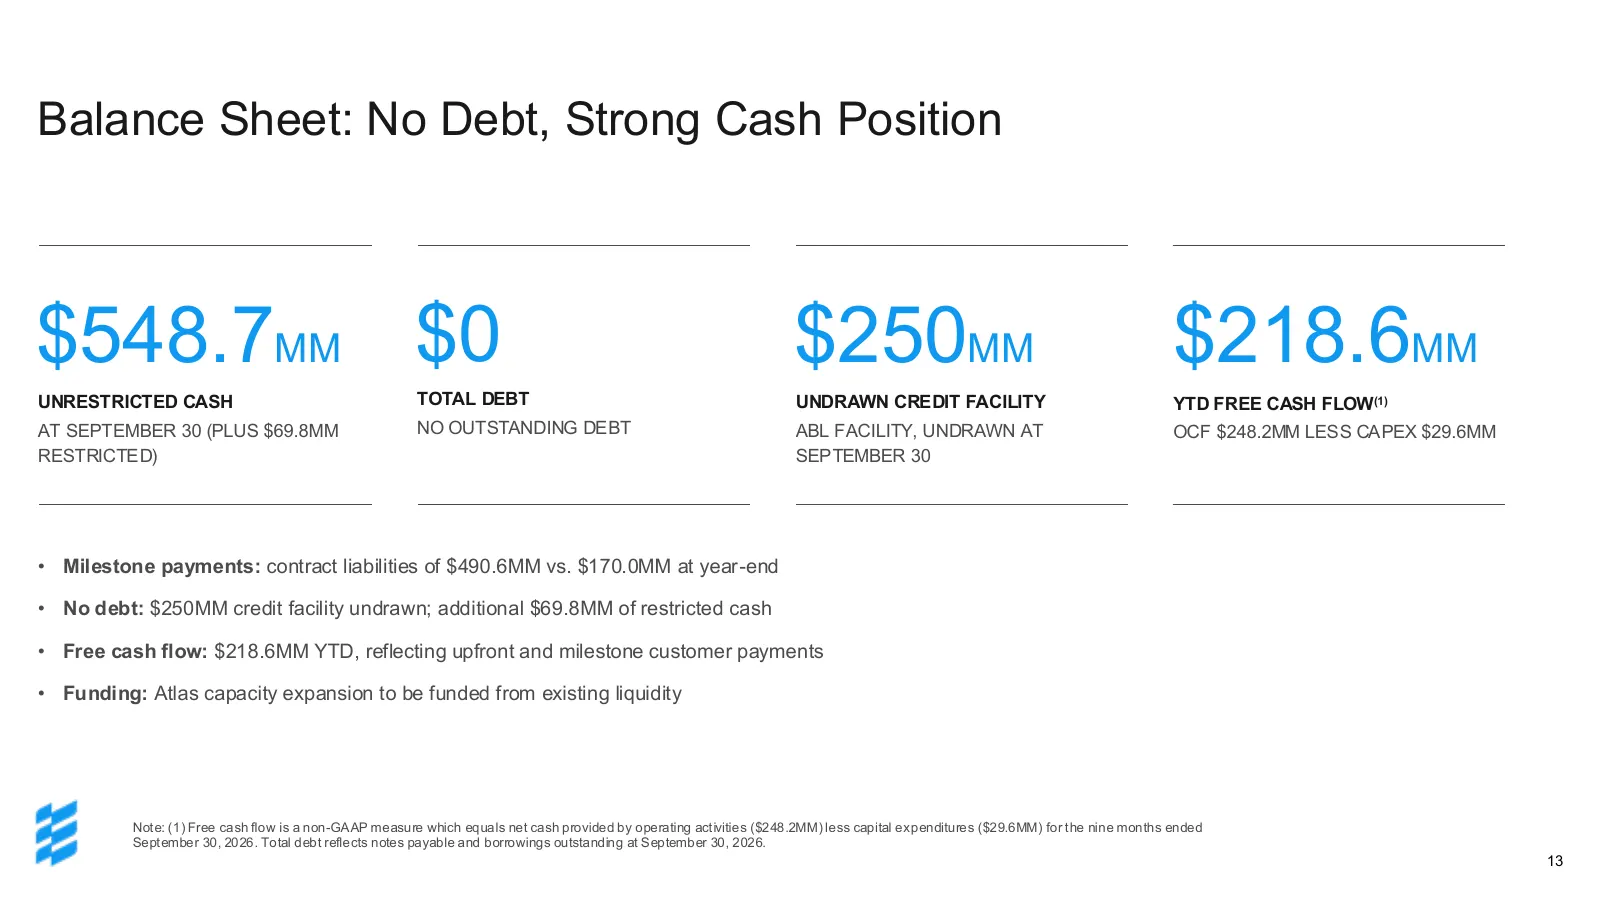
Balance Sheet: No Debt, Strong Cash Position $548.7MM $0 $250MM $218.6MM UNRESTRICTED CASH TOTAL DEBT UNDRAWN CREDIT FACILITY YTD FREE CASH FLOW(1) AT SEPTEMBER 30 (PLUS $69.8MM NO OUTSTANDING DEBT ABL FACILITY, UNDRAWN AT OCF $248.2MM LESS CAPEX $29.6MM RESTRICTED) SEPTEMBER 30 • Milestone payments
Slide 14: Looking Ahead
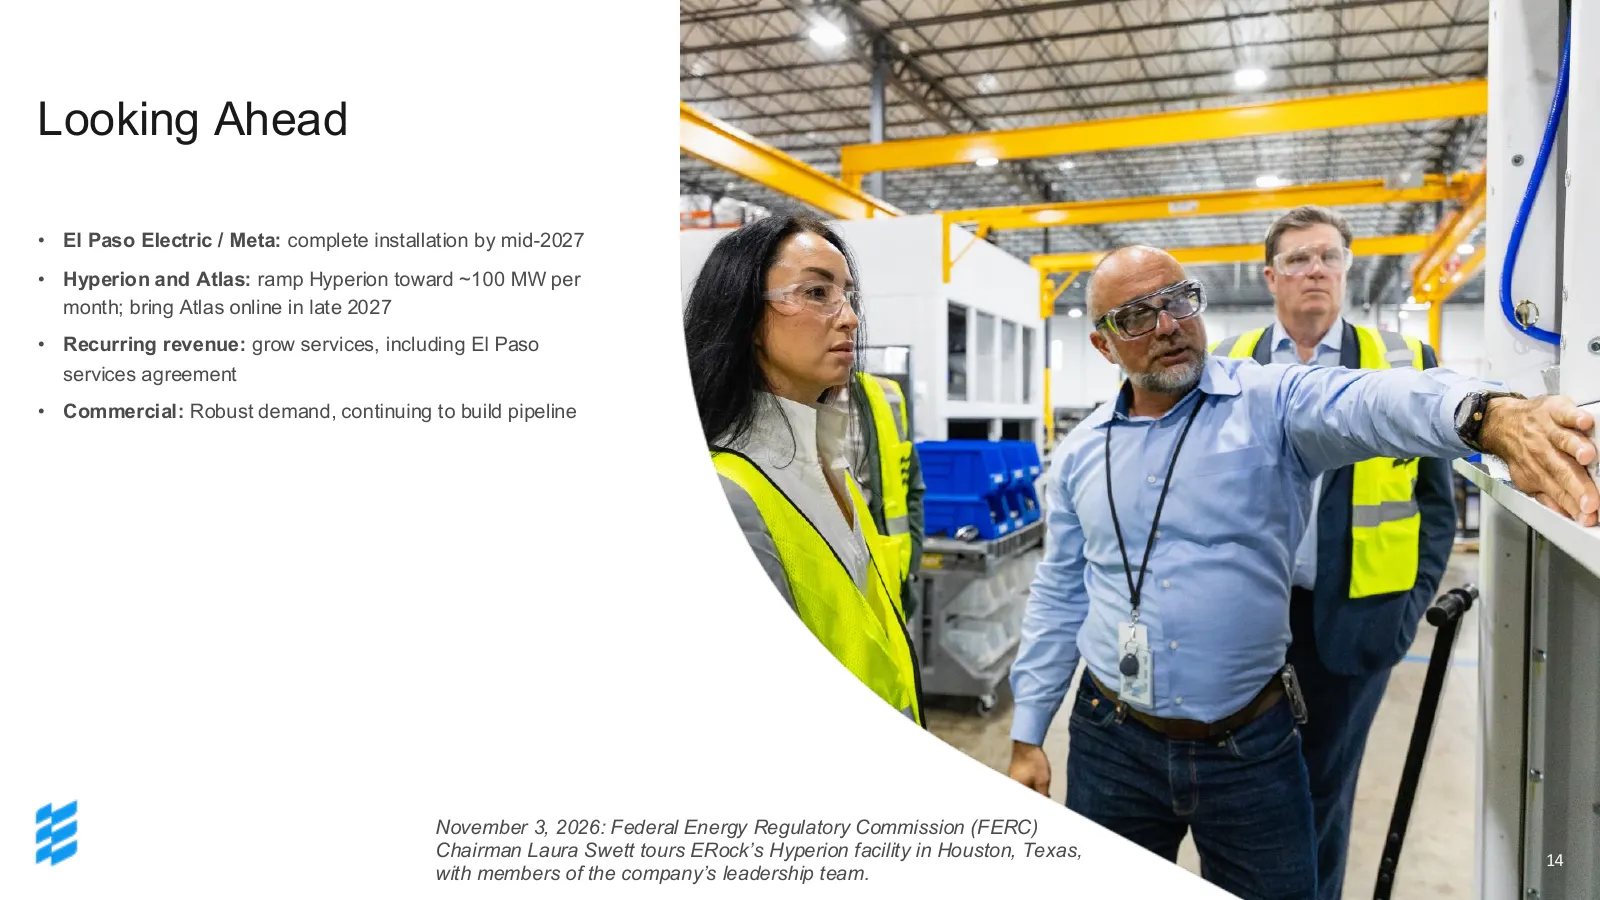
Looking Ahead • El Paso Electric / Meta: complete installation by mid-2027 • Hyperion and Atlas: ramp Hyperion toward ~100 MW per month; bring Atlas online in late 2027 • Recurring revenue: grow services, including El Paso services agreement • Commercial: Robust demand, continuing to build pipeline
Slide 15: Appendix
Appendix
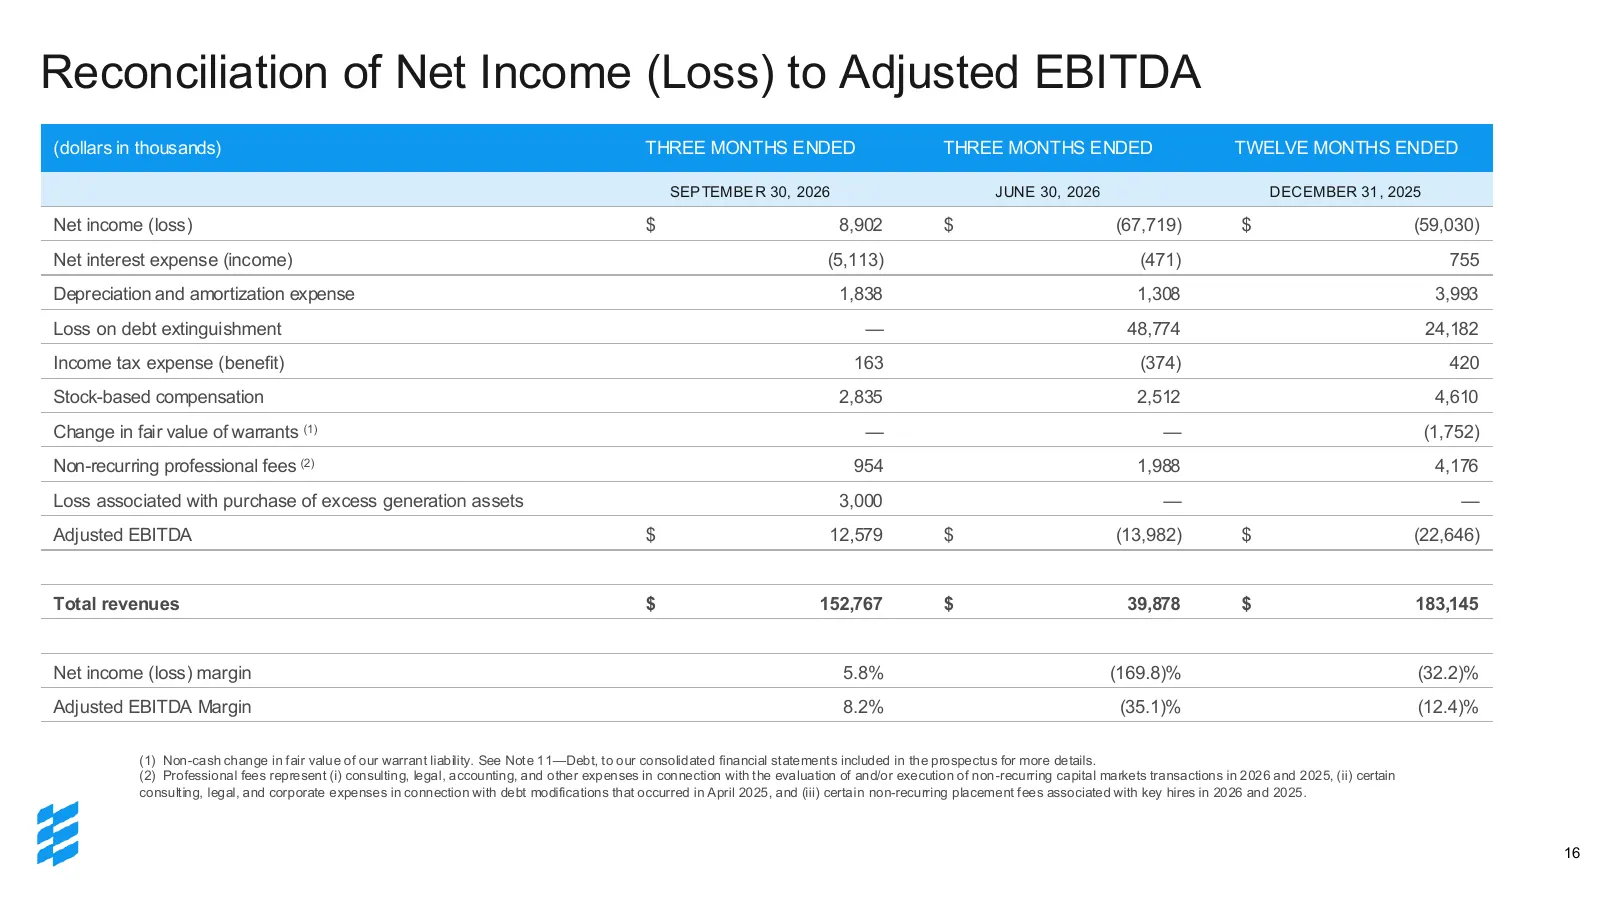
Slide 16: Reconciliation of Net Income (Loss) to Adjusted EBITDA
Reconciliation of Net Income (Loss) to Adjusted EBITDA (dollars in thousands) THREE MONTHS ENDED THREE MONTHS ENDED TWELVE MONTHS ENDED SEP TEMBE R 30, 2026 JUNE 30, 2026 DECEMBER 31 , 2025 Net income (loss) $ 8,902 $ (67,719) $ (59,030) Net interest expense (income) (5,113) (471) 755 Depreciation a
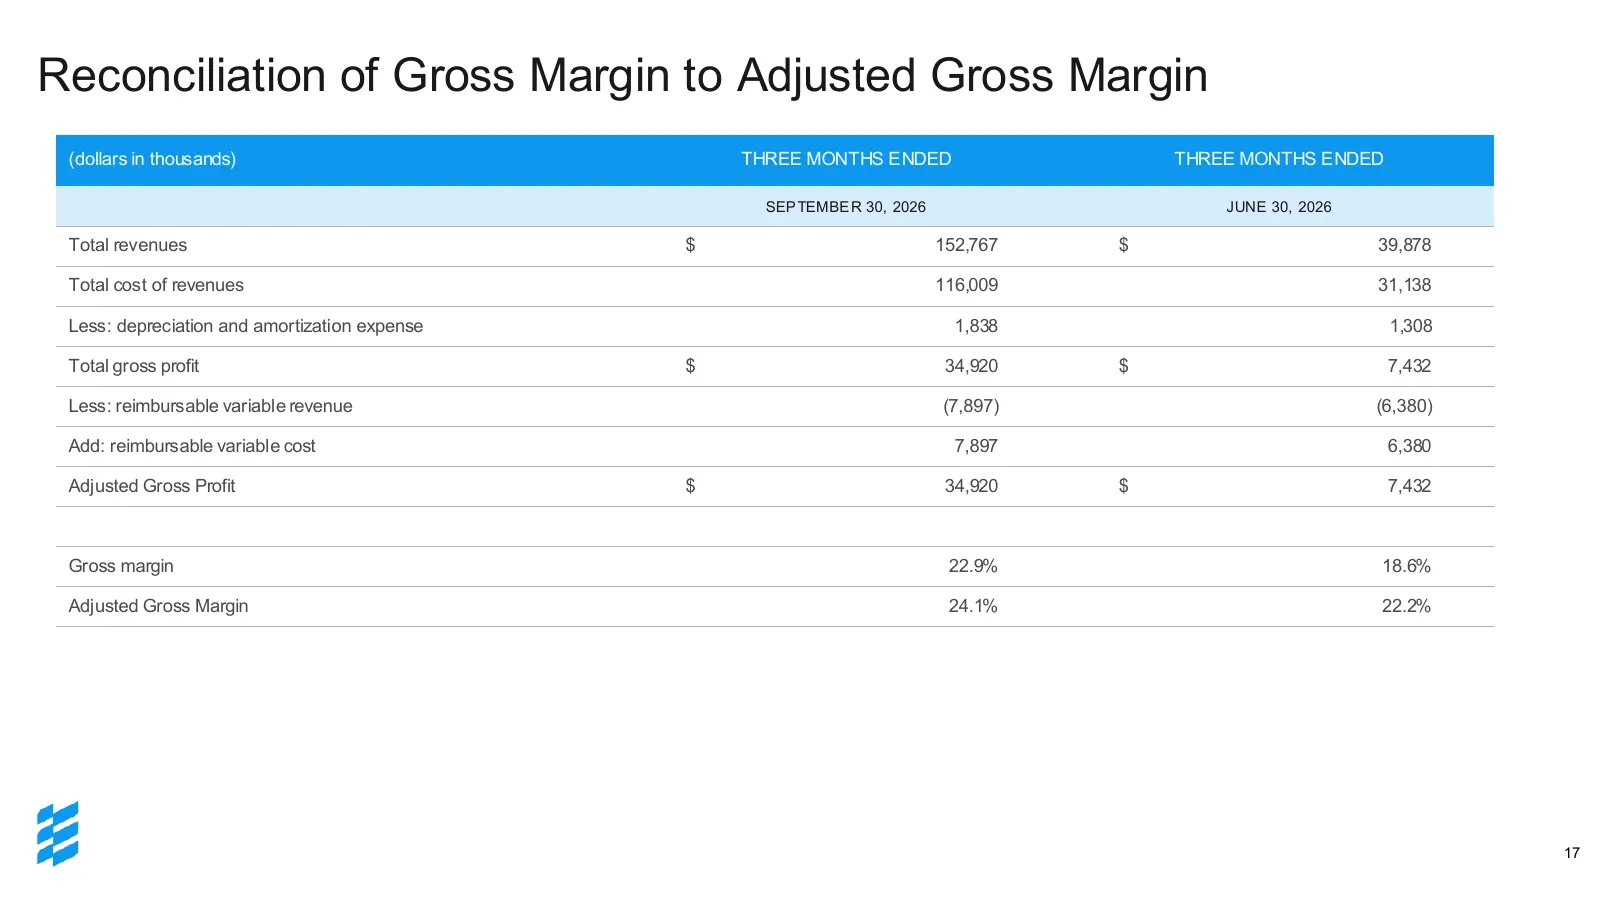
Slide 17: Reconciliation of Gross Margin to Adjusted Gross Margin
Reconciliation of Gross Margin to Adjusted Gross Margin (dollars in thousands) THREE MONTHS ENDED THREE MONTHS ENDED SEP TEMBE R 30, 2026 JUNE 30, 2026 Total revenues $ 152,767 $ 39,878 Total cost of revenues 116,009 31,138 Less: depreciation and amortization expense 1,838 1,308 Total gross profit $
Slide 18: Headquarters and Investor Relations
Headquarters 1113 Vine Street, Suite 101 Houston, TX 77002 T: (713) 429-4091 info@erock.com Investor Relations Ted Durbin investors@erock.com Eduardo Royes ERock@icrinc.com
Source: company website