TPG Inc. · NASDAQ:TPG
TPG — FY2003 Earnings Presentation
38 slides from TPG's earnings presentation, Feb 19, 2004
Slide 1: Full Year Results 2003 Press Presentation
Full Year Results 2003 Press Presentation 19 February, 2004
Slide 2: Agenda
Agenda Highlights Peter Bakker, CEO Business and Financial review Jan Haars, CFO TPG Strategy Peter Bakker, CEO

Slide 3: Highlights
Highlights Peter Bakker
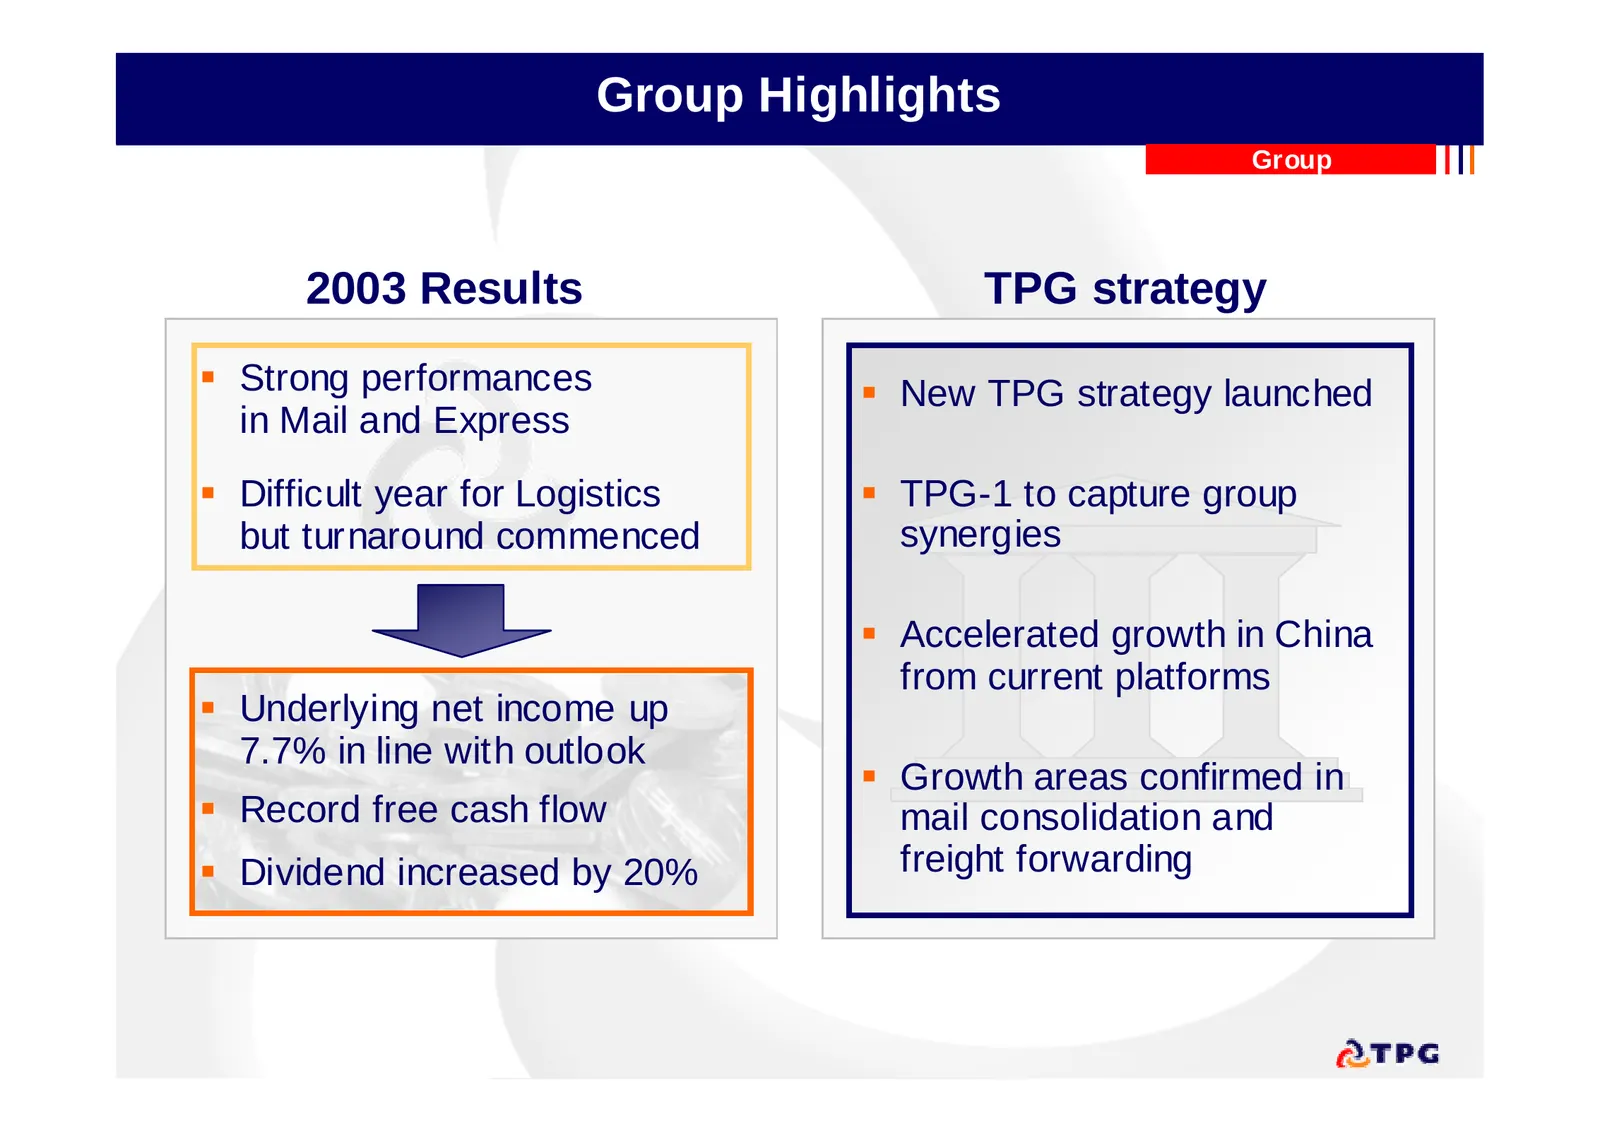
Slide 4: Group Highlights
Group Highlights Group 2003 Results TPG strategy Strong performances New TPG strategy launched in Mail and Express Difficult year for Logistics TPG-1 to capture group but turnaround commenced synergies Accelerated growth in China from current platforms Underlying net income up 7.7% in li
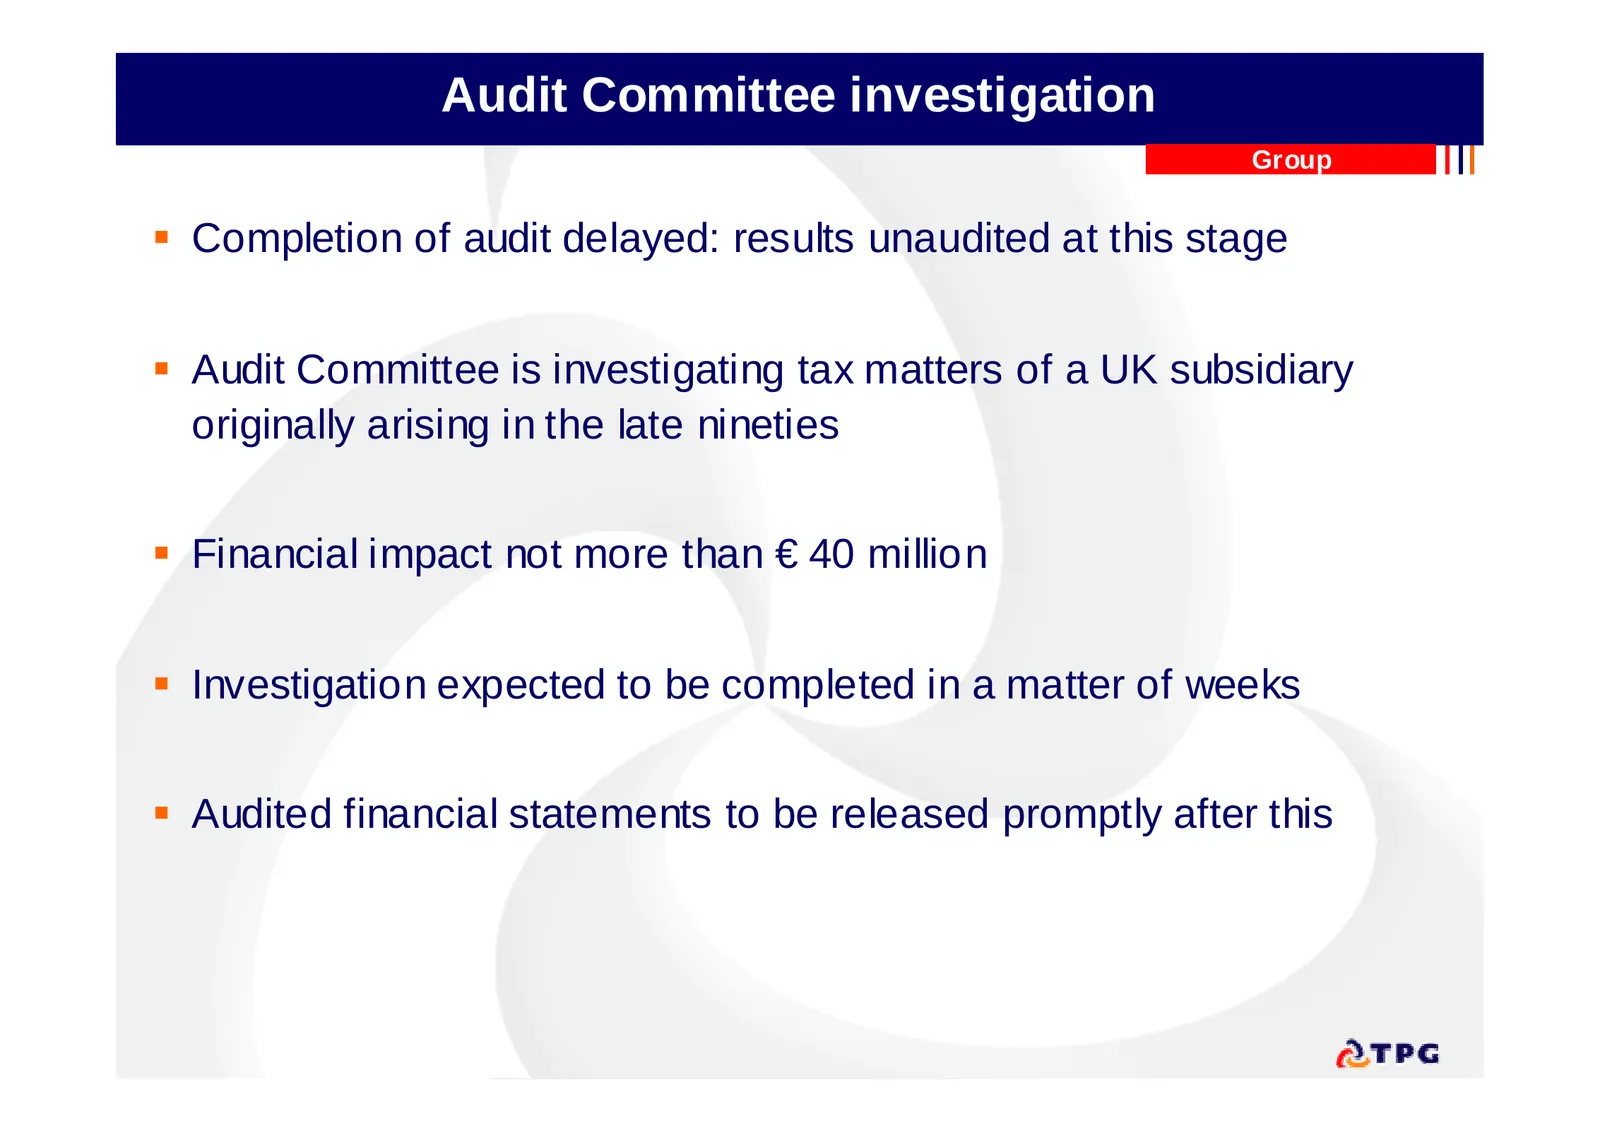
Slide 5: Audit Committee investigation
Audit Committee investigation Group Completion of audit delayed: results unaudited at this stage Audit Committee is investigating tax matters of a UK subsidiary originally arising in the late nineties Financial impact not more than € 40 million Investigation expected to be completed in a mat
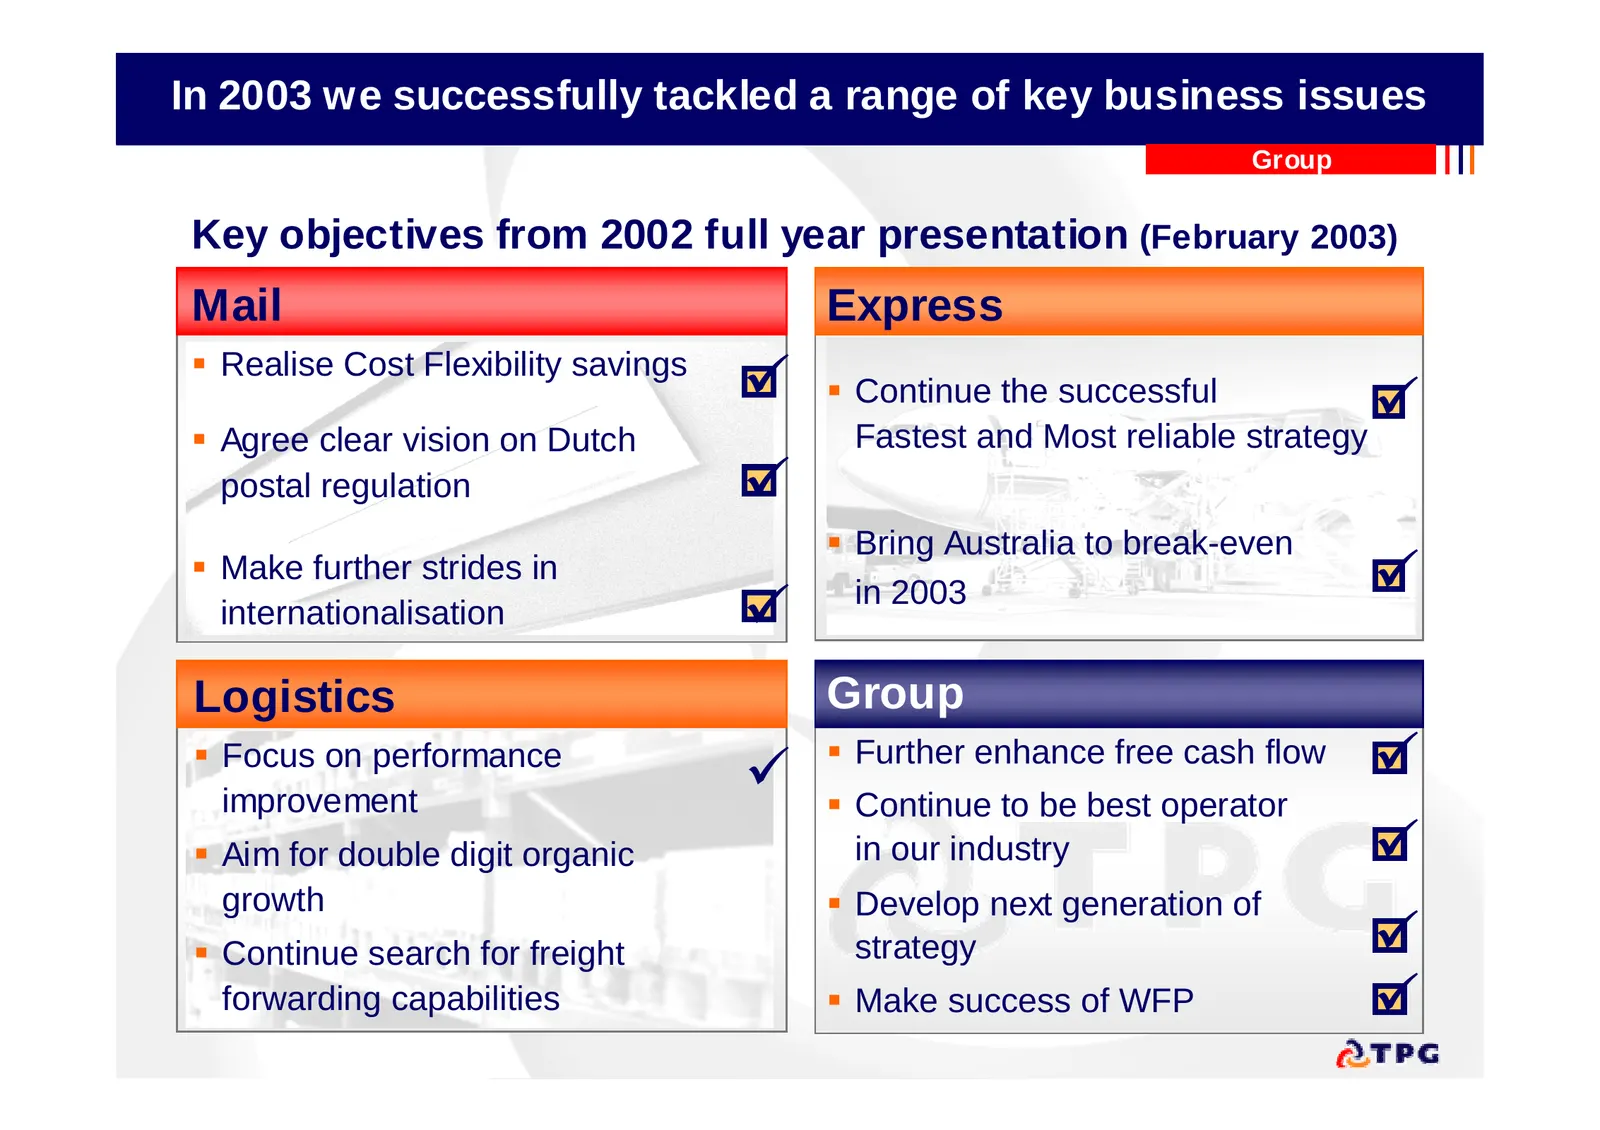
Slide 6: In 2003 we successfully tackled a range of key business issues
In 2003 we successfully tackled a range of key business issues Group Key objectives from 2002 full year presentation (February 2003) Mail Express Realise Cost Flexibility savings 9 Continue the successful 9 Agree clear vision on Dutch Fastest and Most reliable strategy postal regulation 9 Br

Slide 7: Business and Financial review
Business and Financial review Jan Haars
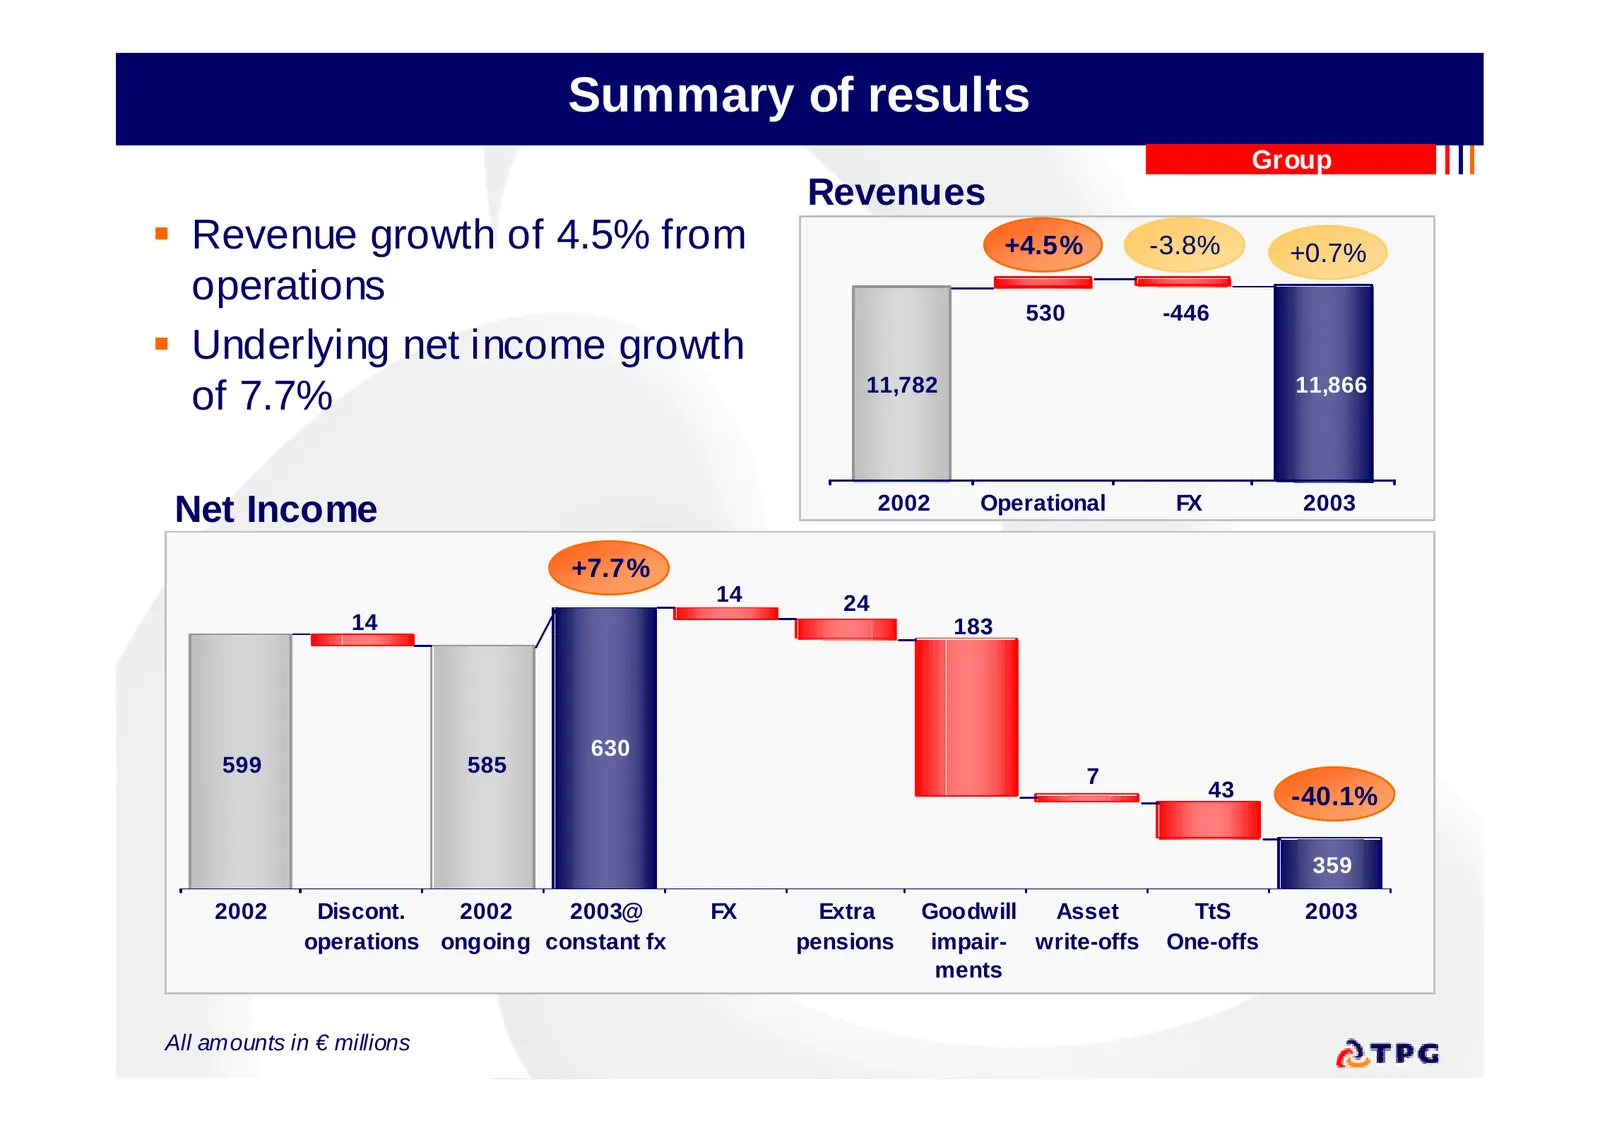
Slide 8: Summary of results
Summary of results Group Revenues Revenue growth of 4.5% from +4.5% -3.8% +0.7% operations 530 -446 Underlying net income growth 11,782 11,782 11,866 11,866 of 7.7% Net Income 2002 Operational FX 2003 +7.7% 14 24 14 183 630 599 585 7 43 -40.1% 359 2002 Discont. 2002 2003@ FX Extra Goodwill Asset
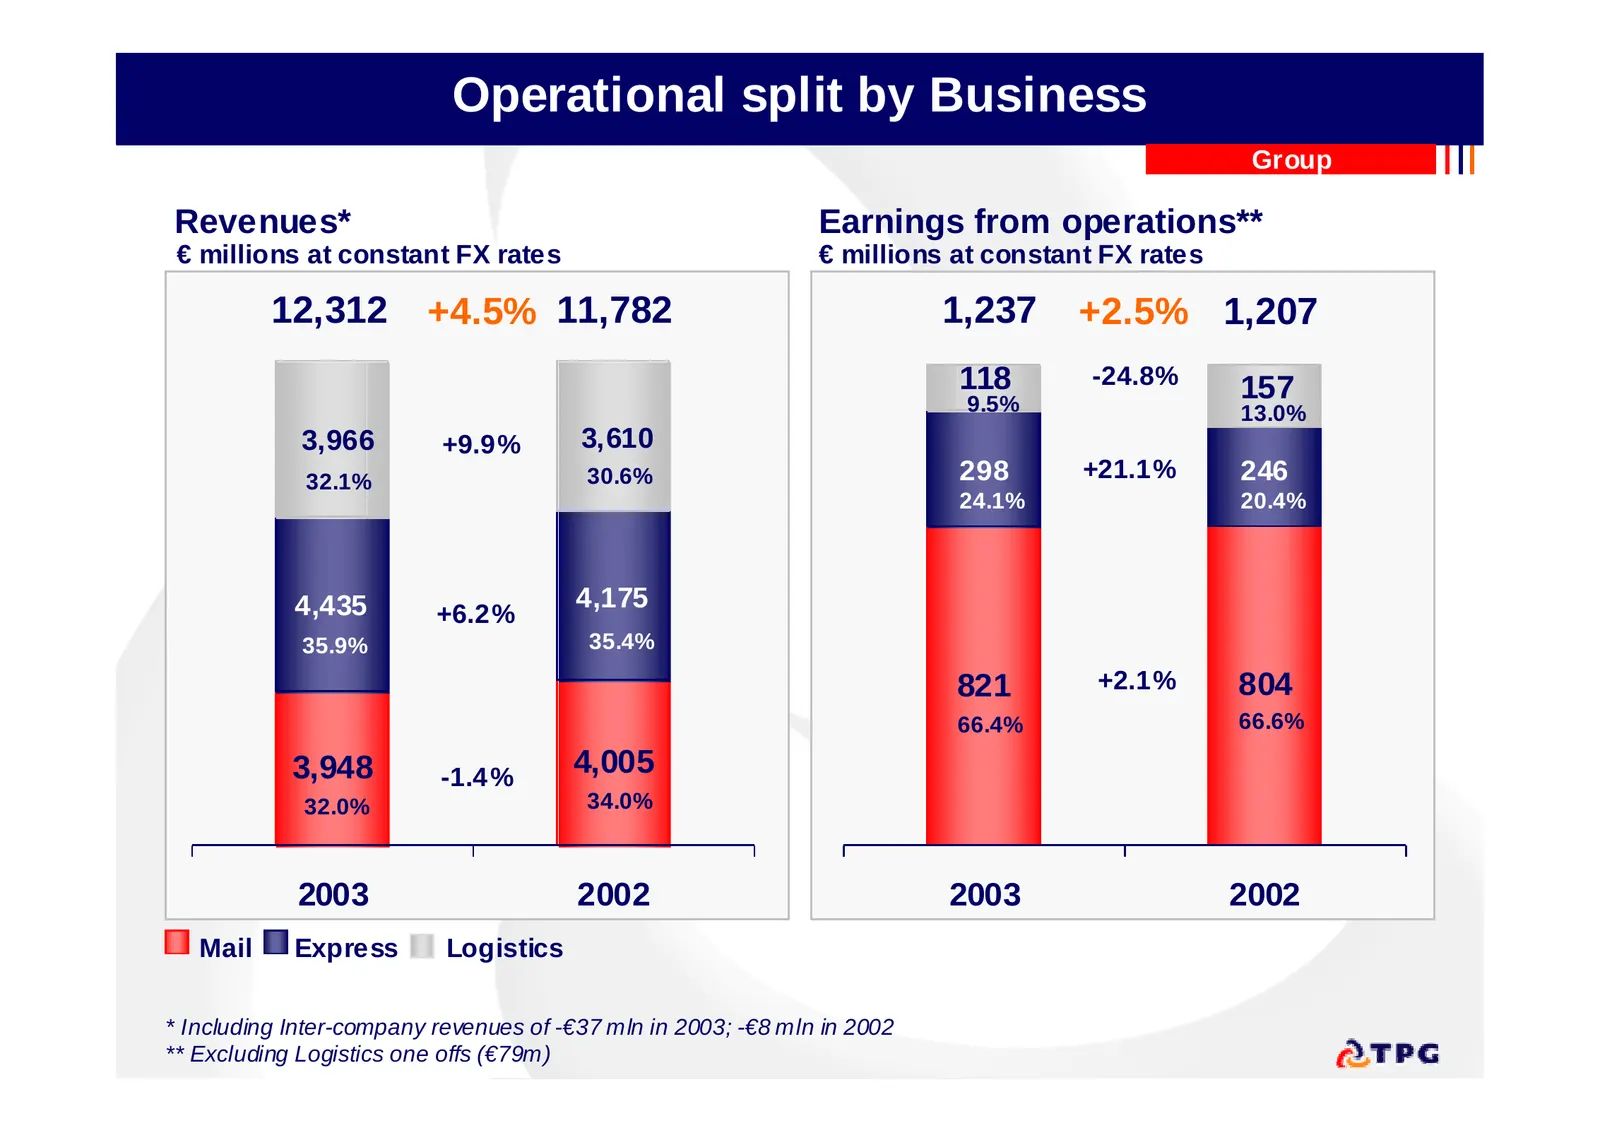
Slide 9: Operational split by Business
Operational split by Business Group Revenues* Earnings from operations** € millions at constant FX rates € millions at constant FX rates 12,312 +4.5% 11,782 1,237 +2.5% 1,207 118 -24.8% 157 9.5% 13.0% 3,966 +9.9% 3,610 32.1% 30.6% 298 +21.1% 246 24.1% 20.4% 4,435 4,175 +6.2% 35.9% 35.4% 821 +2.1% 80
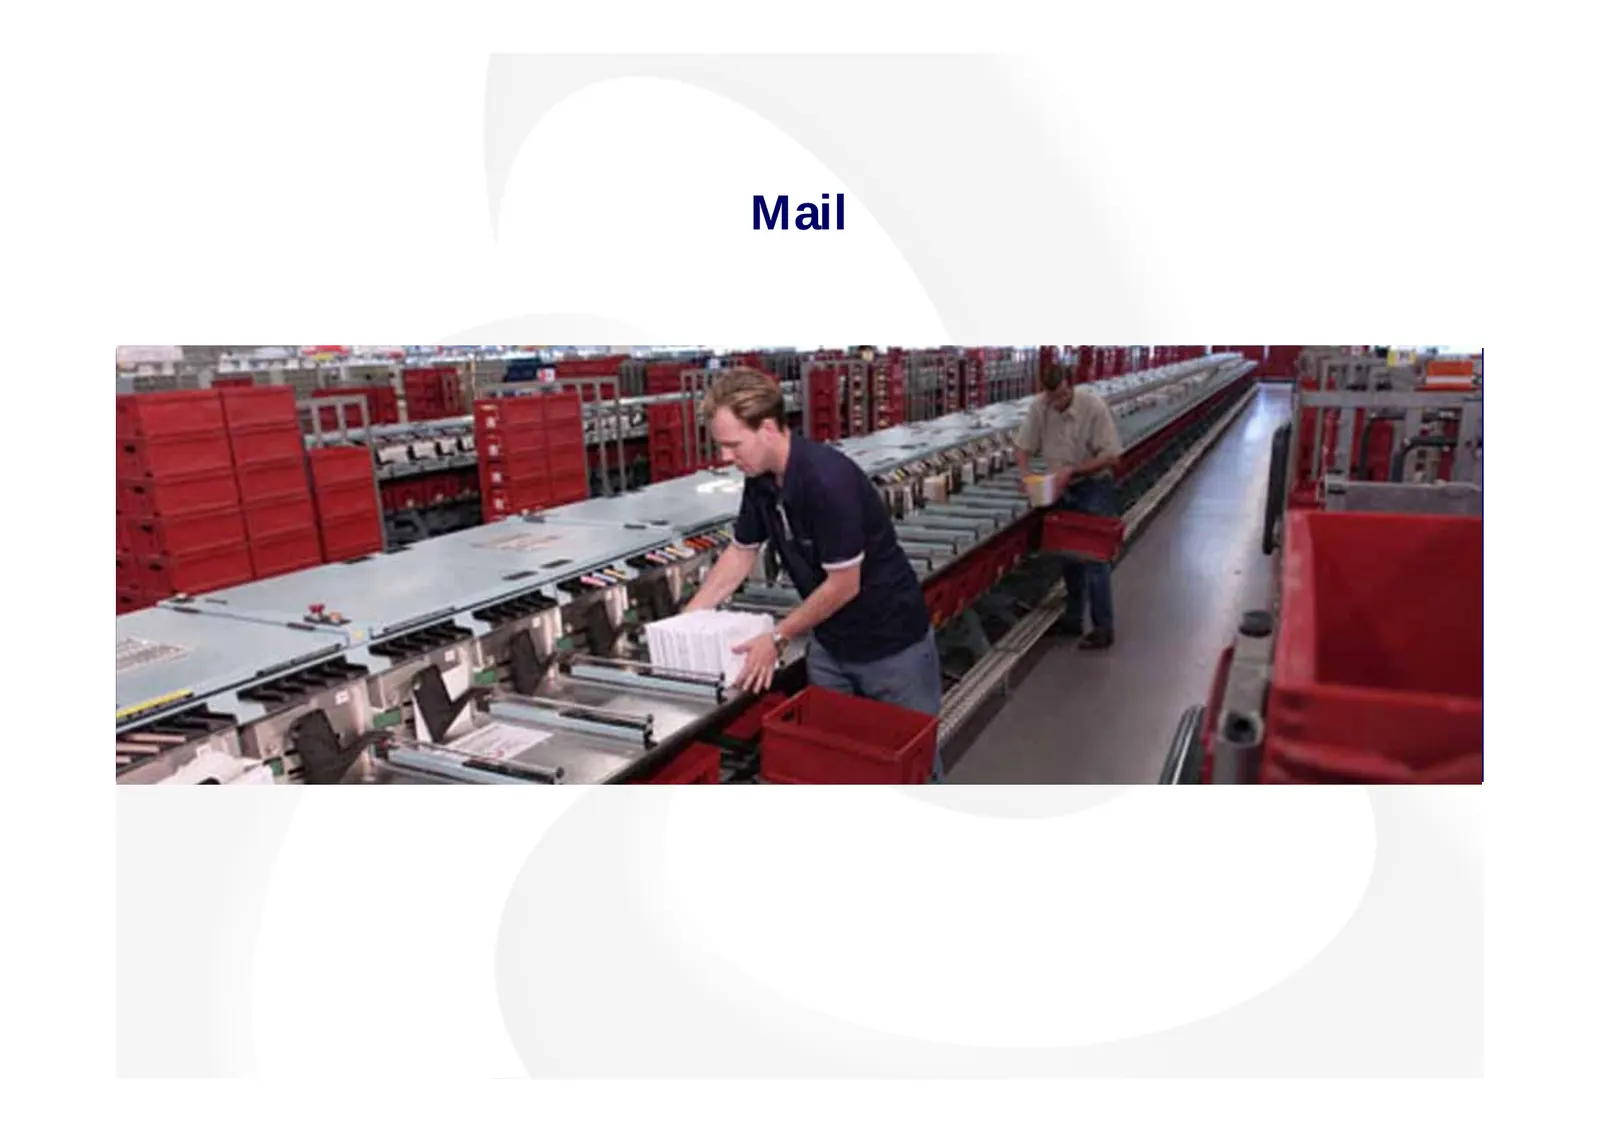
Slide 10: Mail
Mail
Slide 11: Mail Overview
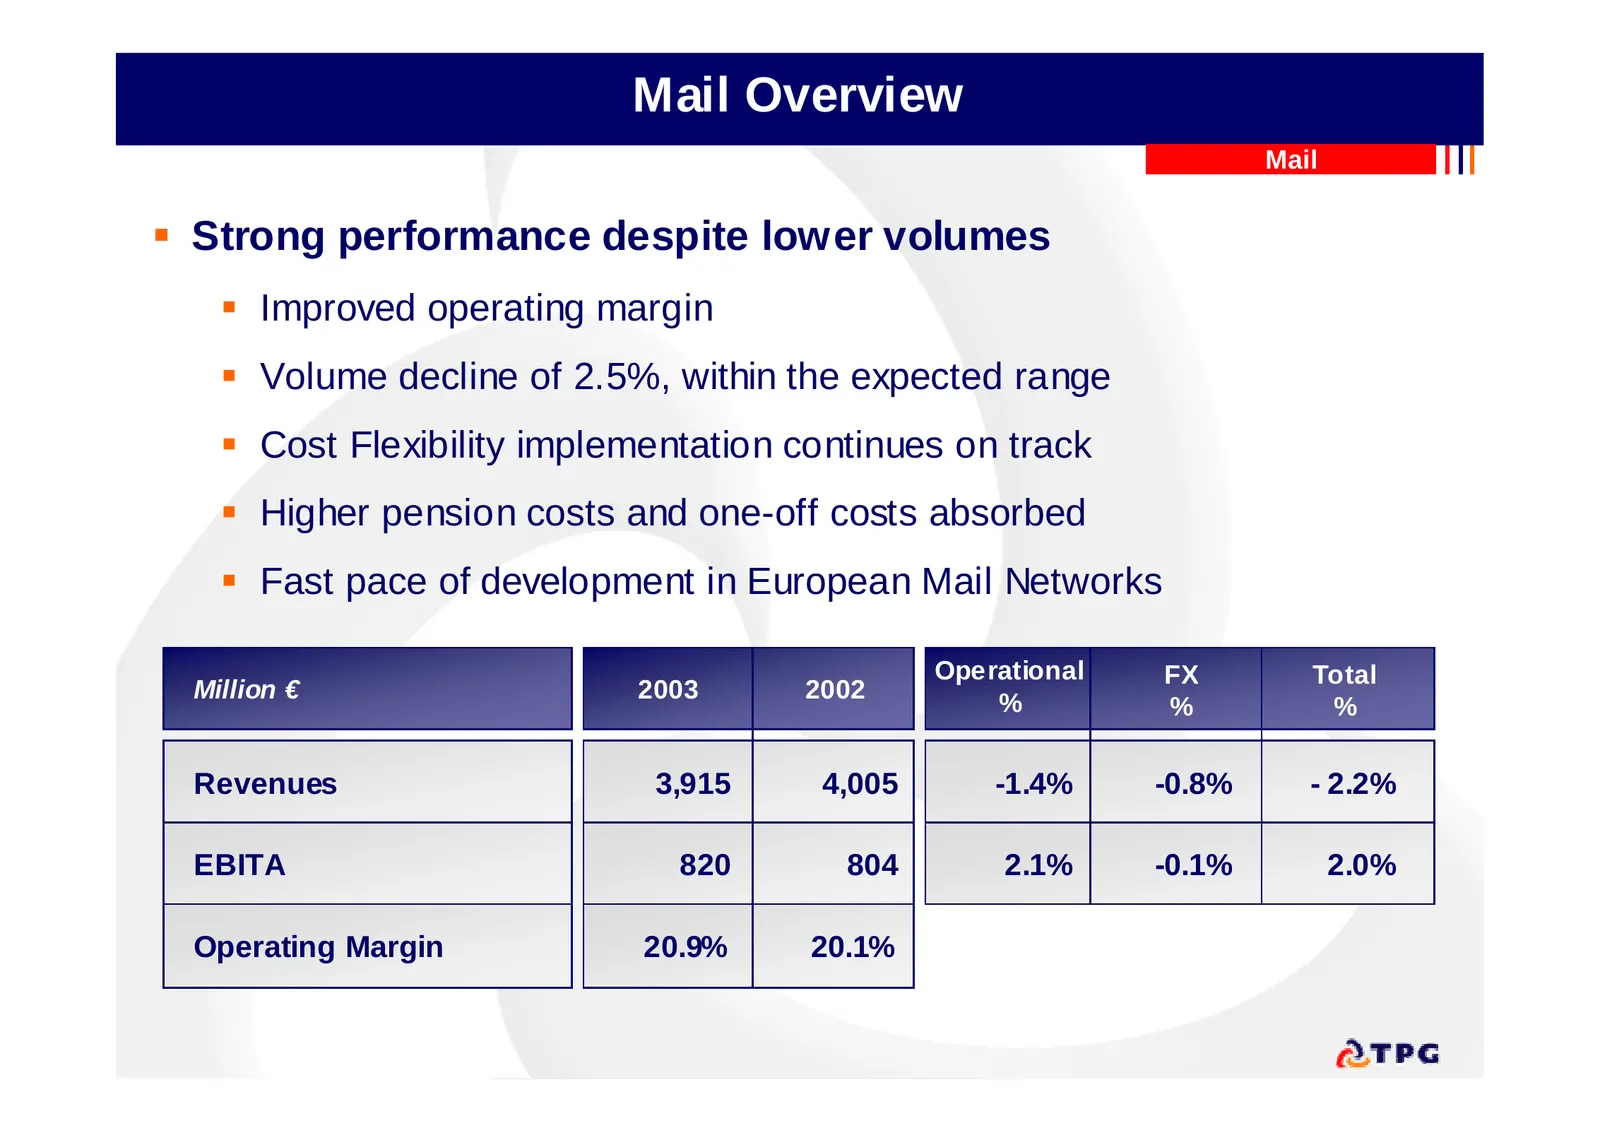
Mail Overview Mail Strong performance despite lower volumes Improved operating margin Volume decline of 2.5%, within the expected range Cost Flexibility implementation continues on track Higher pension costs and one-off costs absorbed Fast pace of development in European Mail Networks Op
Slide 12: Volume declines between 2% and 3% a year are still expected
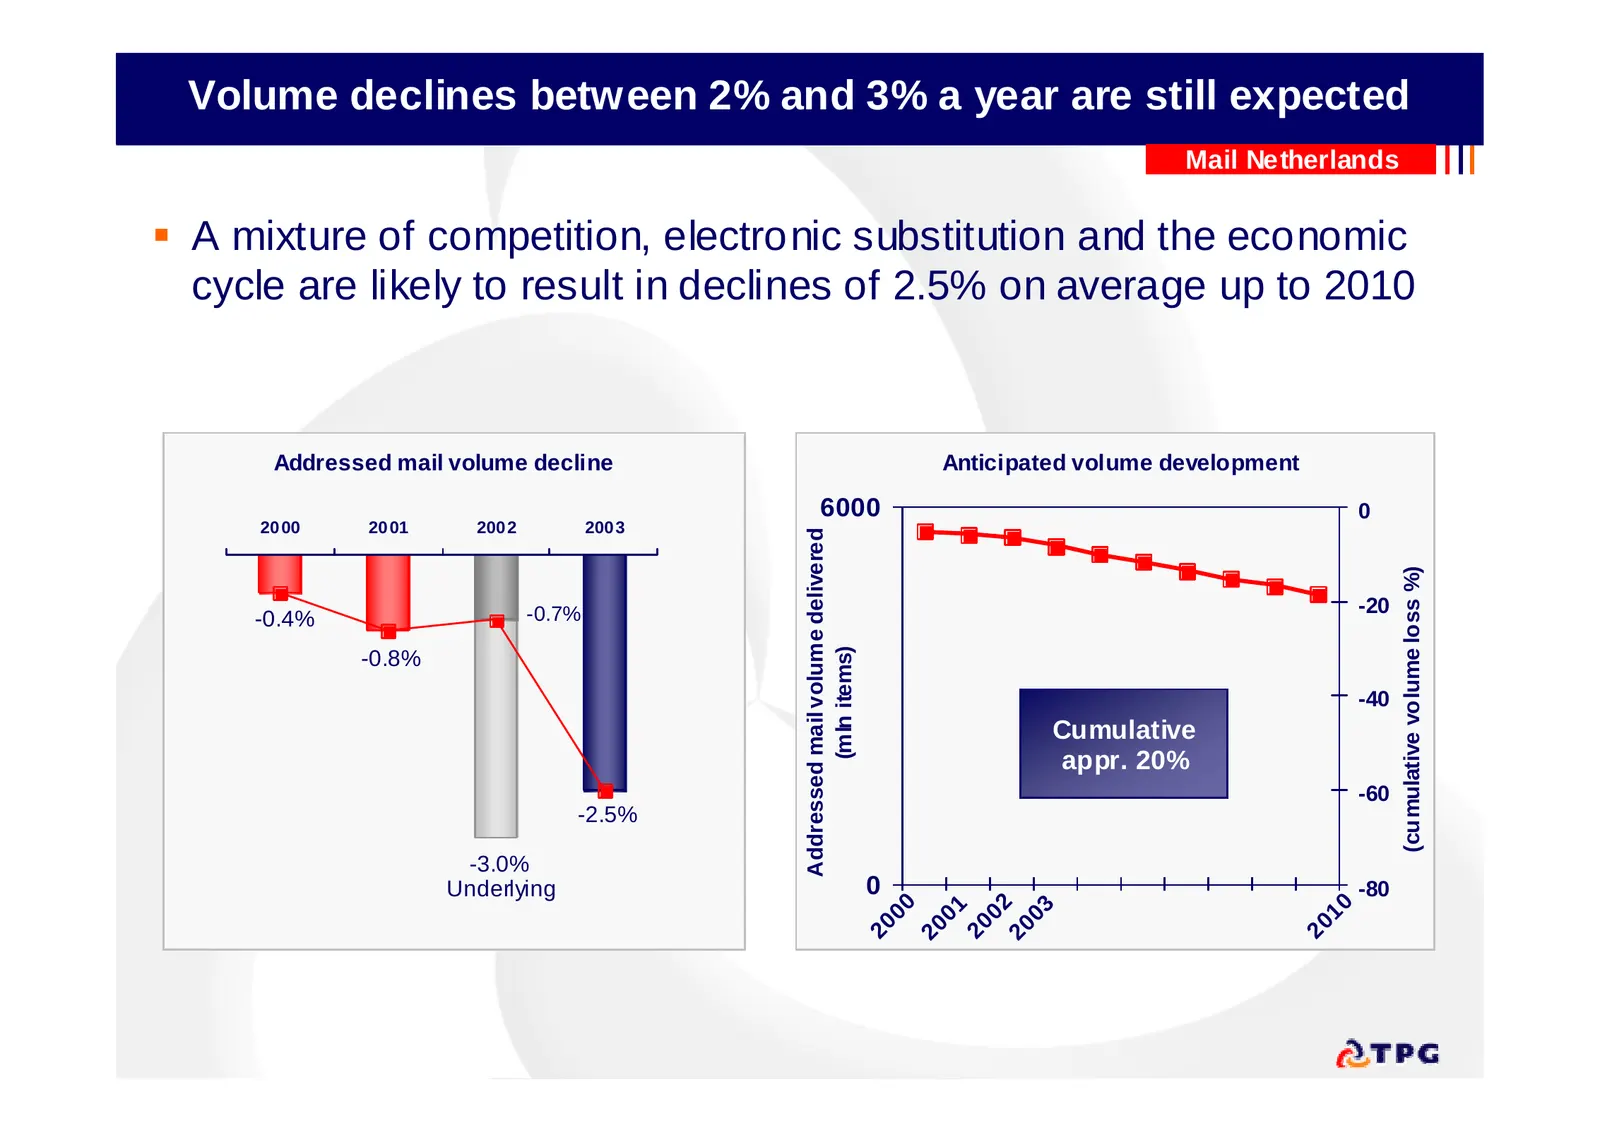
Volume declines between 2% and 3% a year are still expected Mail Netherlands A mixture of competition, electronic substitution and the economic cycle are likely to result in declines of 2.5% on average up to 2010 Addressed mail volume decline Anticipated volume development 6000 0 20 00 20 01 200 2
Slide 13: Express
Express
Slide 14: Express Overview
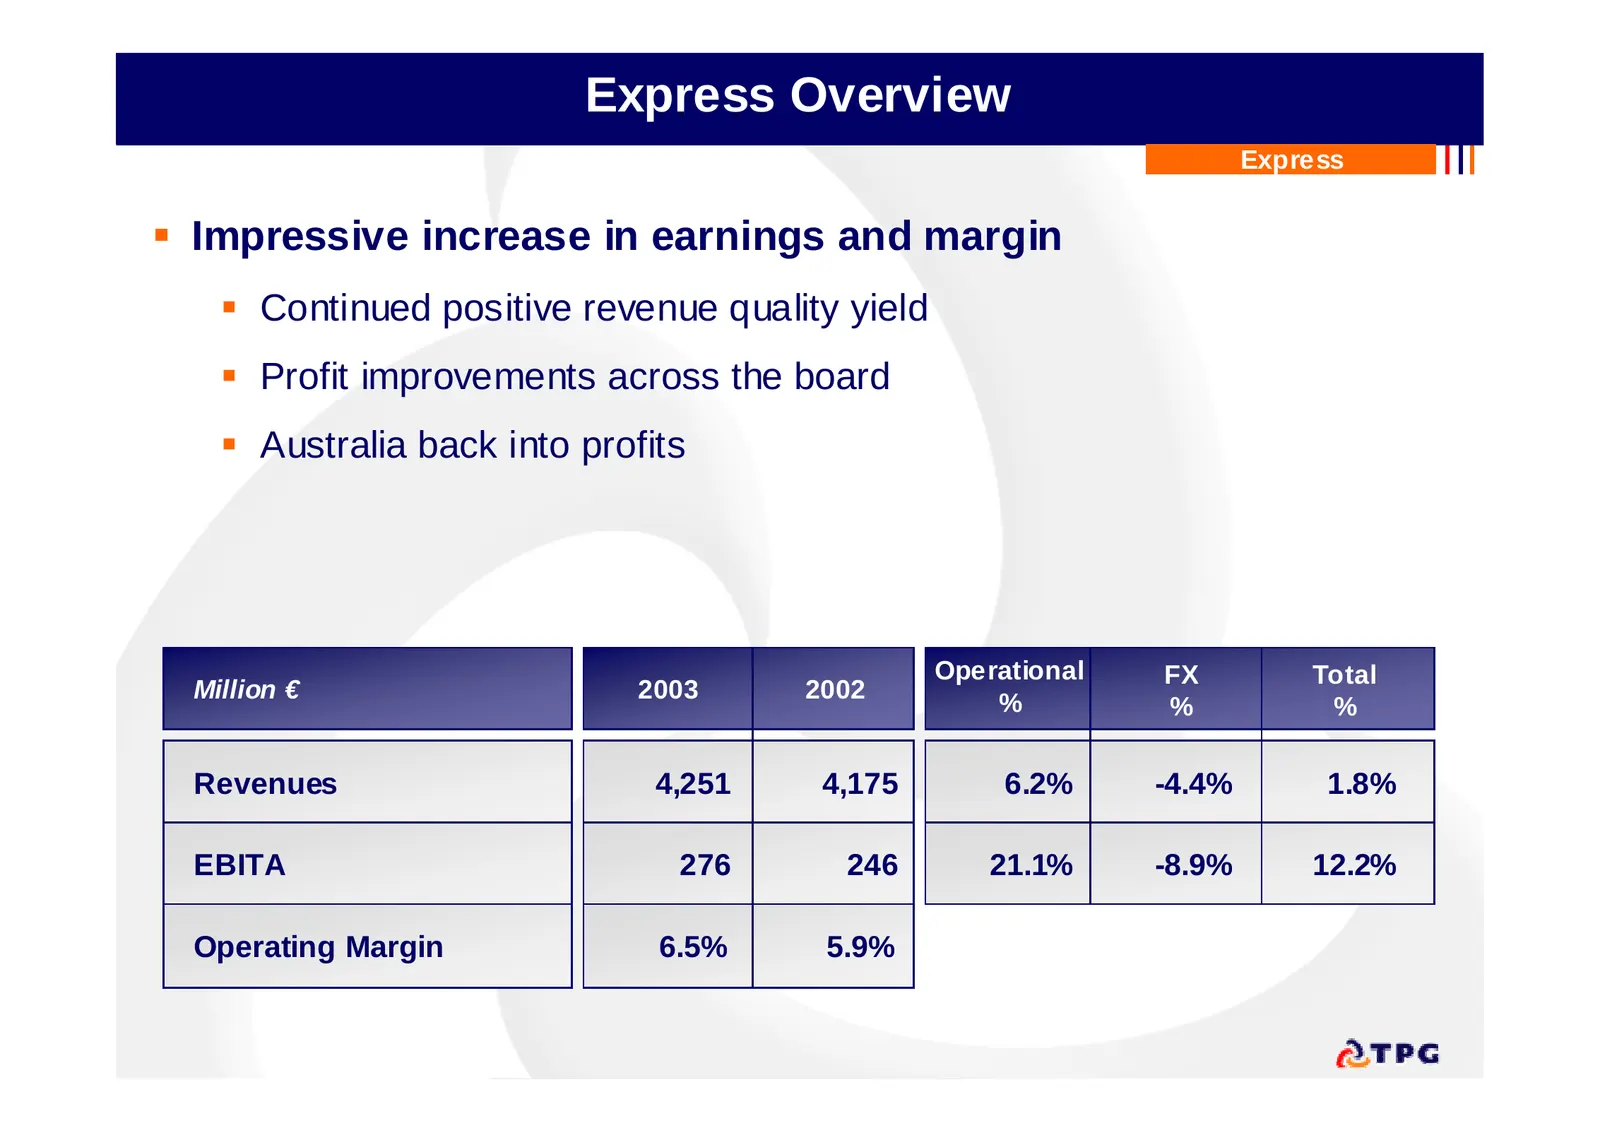
Express Overview Express Impressive increase in earnings and margin Continued positive revenue quality yield Profit improvements across the board Australia back into profits Operational FX Total Million € 2003 2002 % % % Revenues 4,251 4,175 6.2% -4.4% 1.8% EBITA 276 246 21.1% -8.9% 12.2% Op
Slide 15: Strong revenue quality yield is the key to success
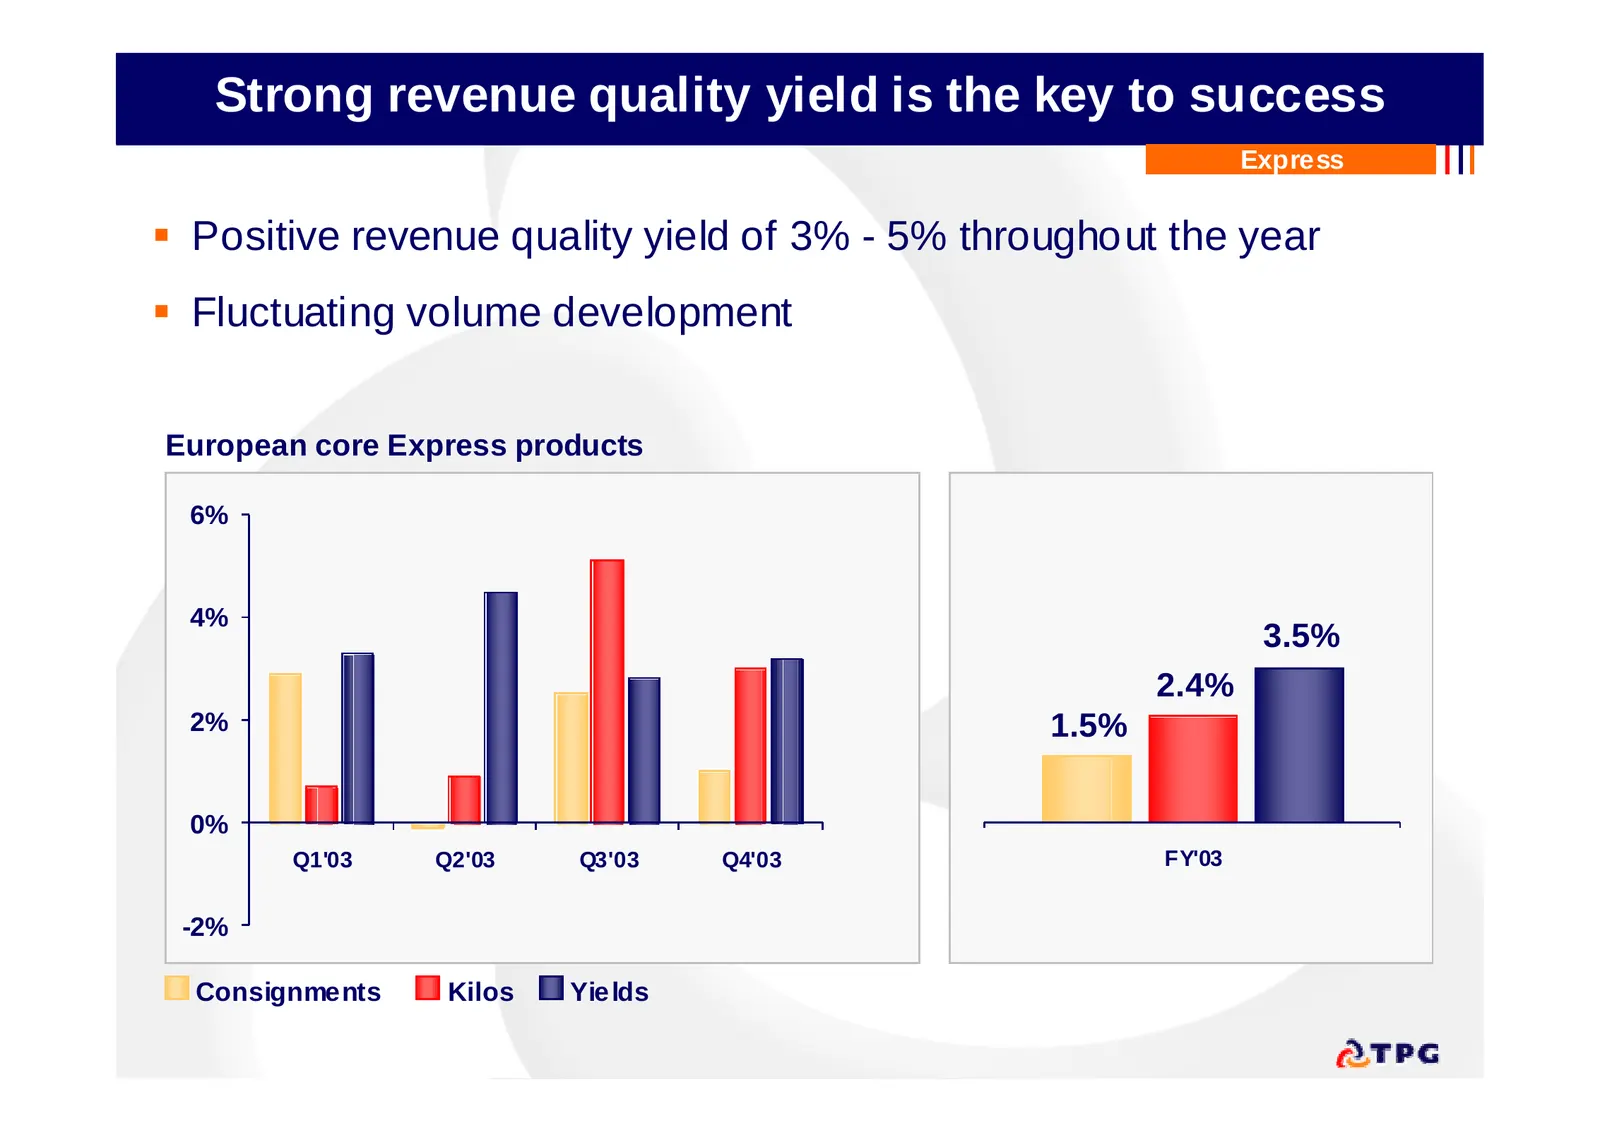
Strong revenue quality yield is the key to success Express Positive revenue quality yield of 3% - 5% throughout the year Fluctuating volume development European core Express products 6% 4% 3.5% 2.4% 2% 1.5% 0% Q1'03 Q2'03 Q3'03 Q4'03 FY'03 -2% Consignments Kilos Yields
Slide 16: Australia back in profits
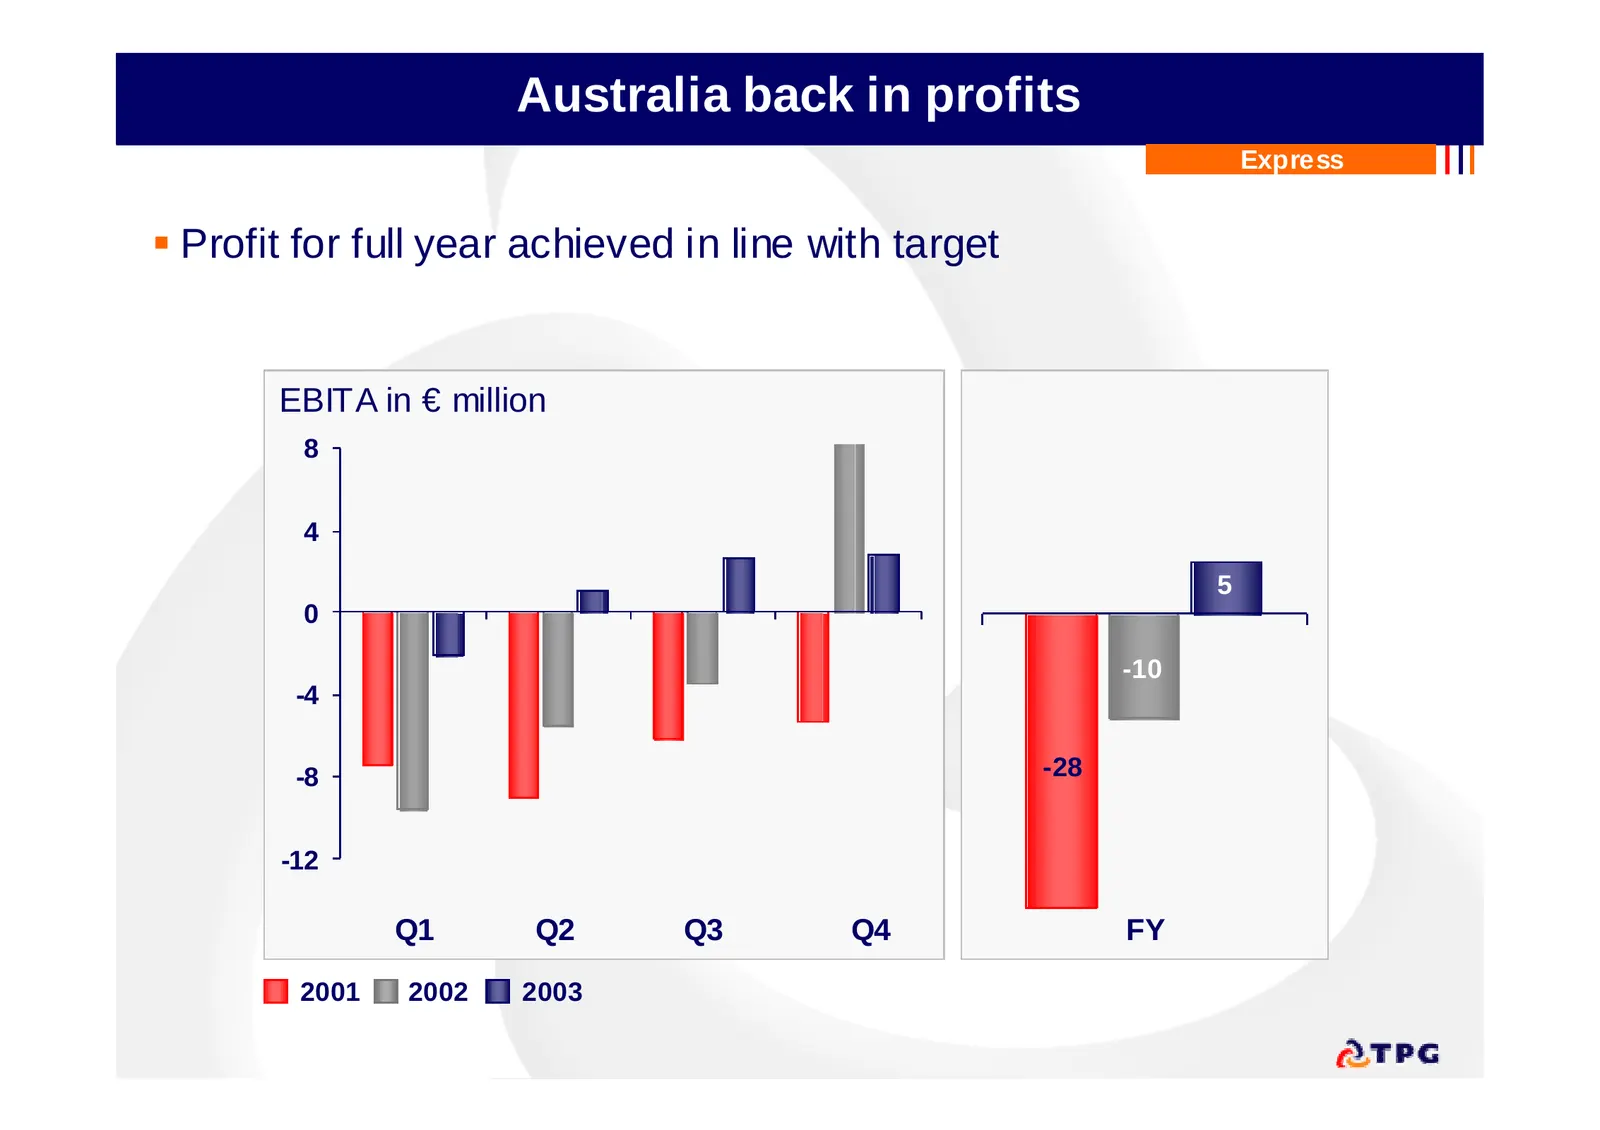
Australia back in profits Express Profit for full year achieved in line with target EBITA in € million 8 4 5 0 -10 -4 -8 -28 -12 Q1 Q2 Q3 Q4 FY 2001 2002 2003
Slide 17: Logistics
Logistics : wv <= a —
Slide 18: Logistics Overview
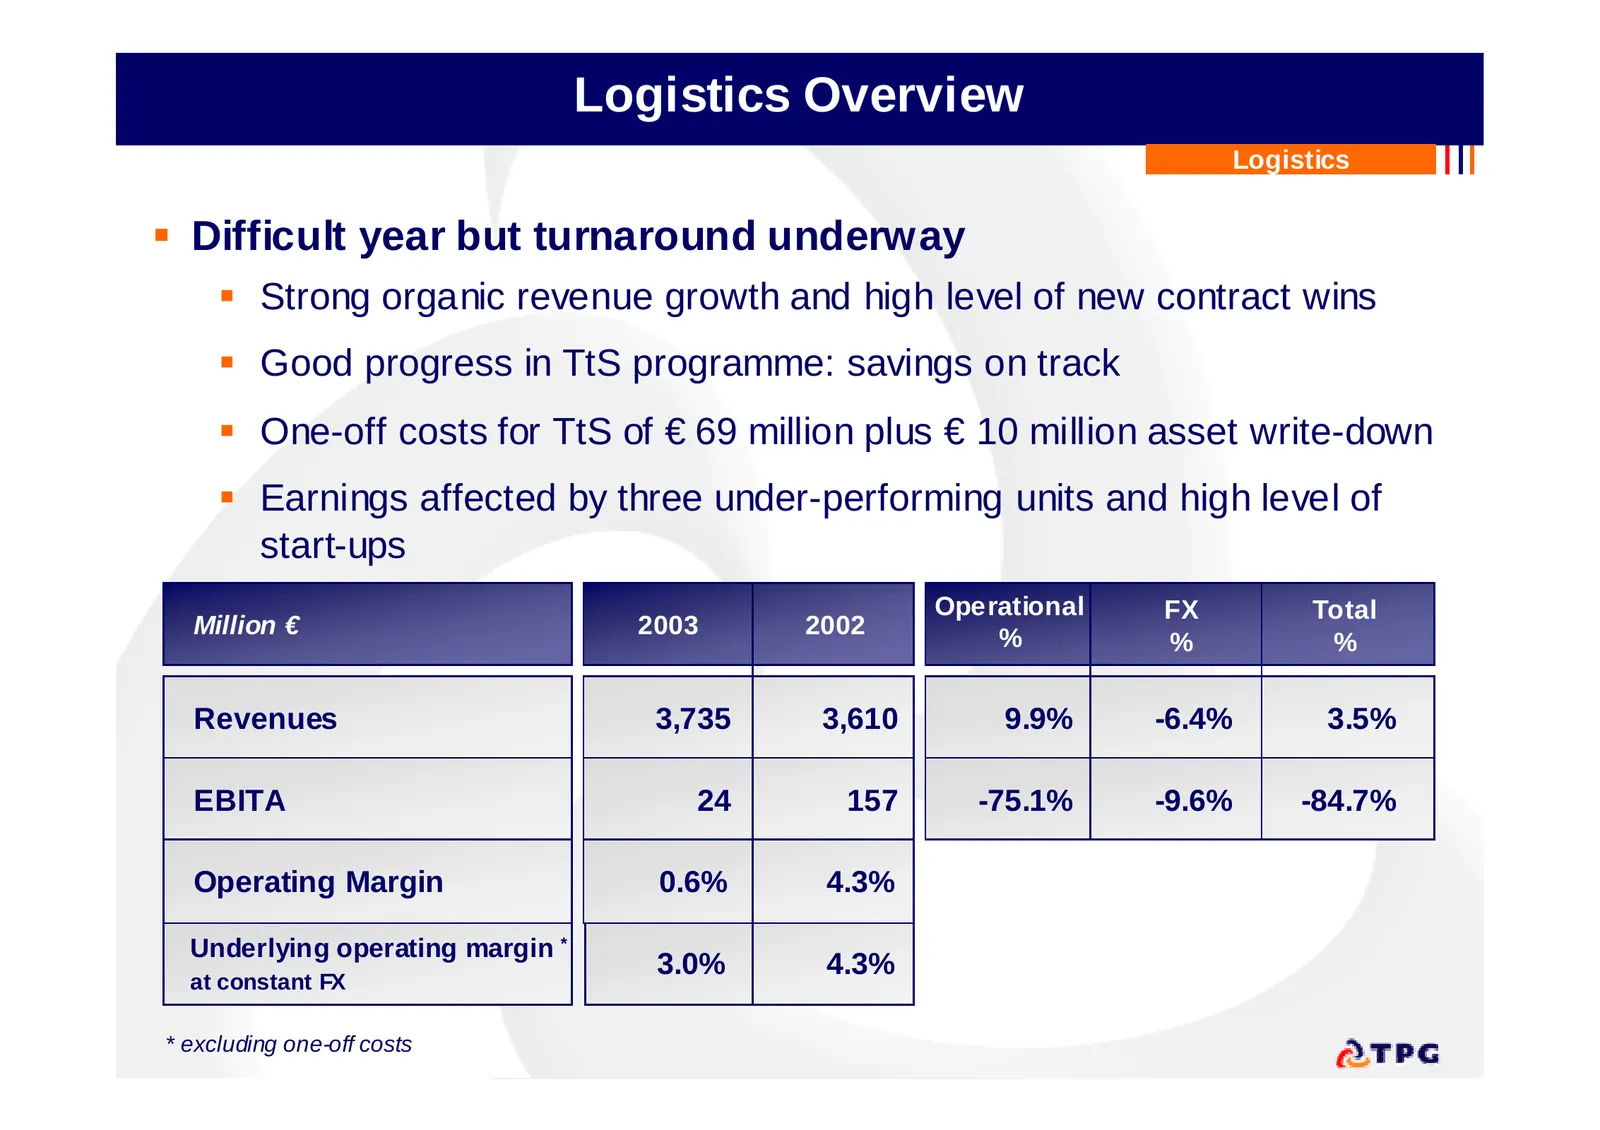
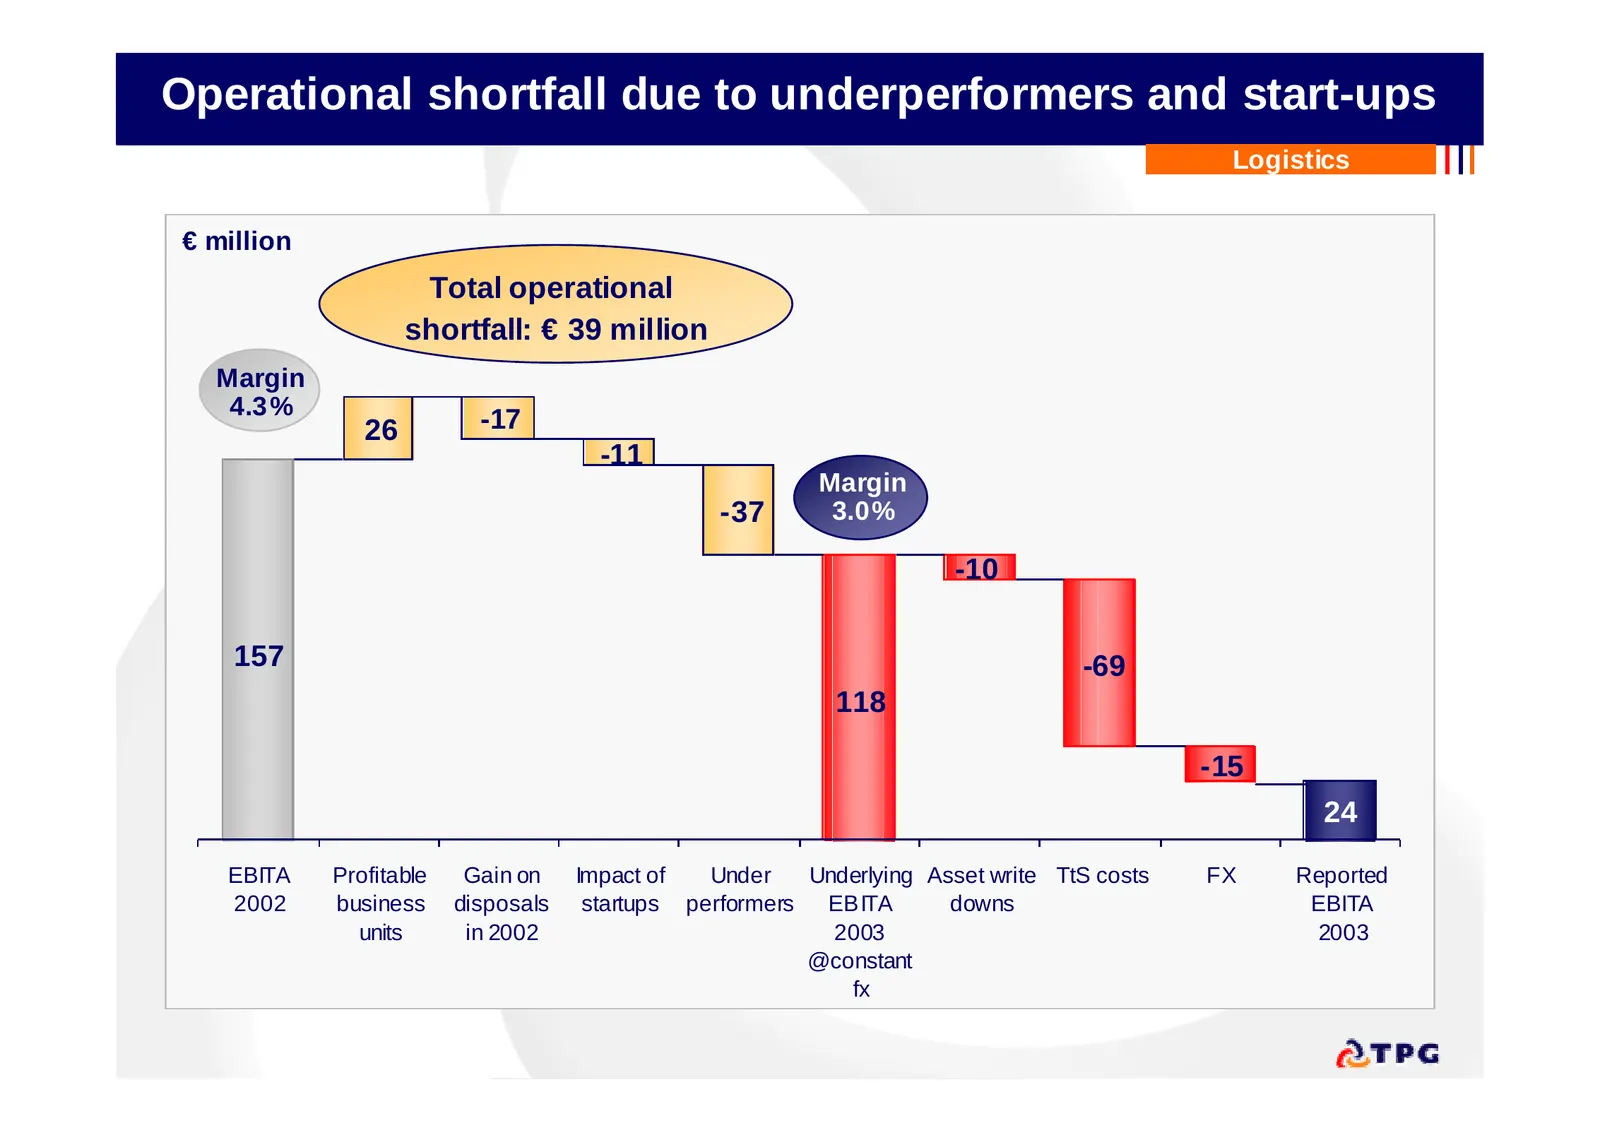
Logistics Overview Logistics Difficult year but turnaround underway Strong organic revenue growth and high level of new contract wins Good progress in TtS programme: savings on track One-off costs for TtS of € 69 million plus € 10 million asset write-down Earnings affected by three under-p
Slide 19: Operational shortfall due to underperformers and start-ups
Operational shortfall due to underperformers and start-ups Logistics € million Total operational shortfall: € 39 million Margin 4.3% 26 -17 -11 Margin -37 3.0% -10 157 -69 118 -15 24 EBITA Profitable Gain on Impact of Under Underlying Asset write TtS costs FX Reported 2002 business disposals startup
Slide 20: Business development is healthy
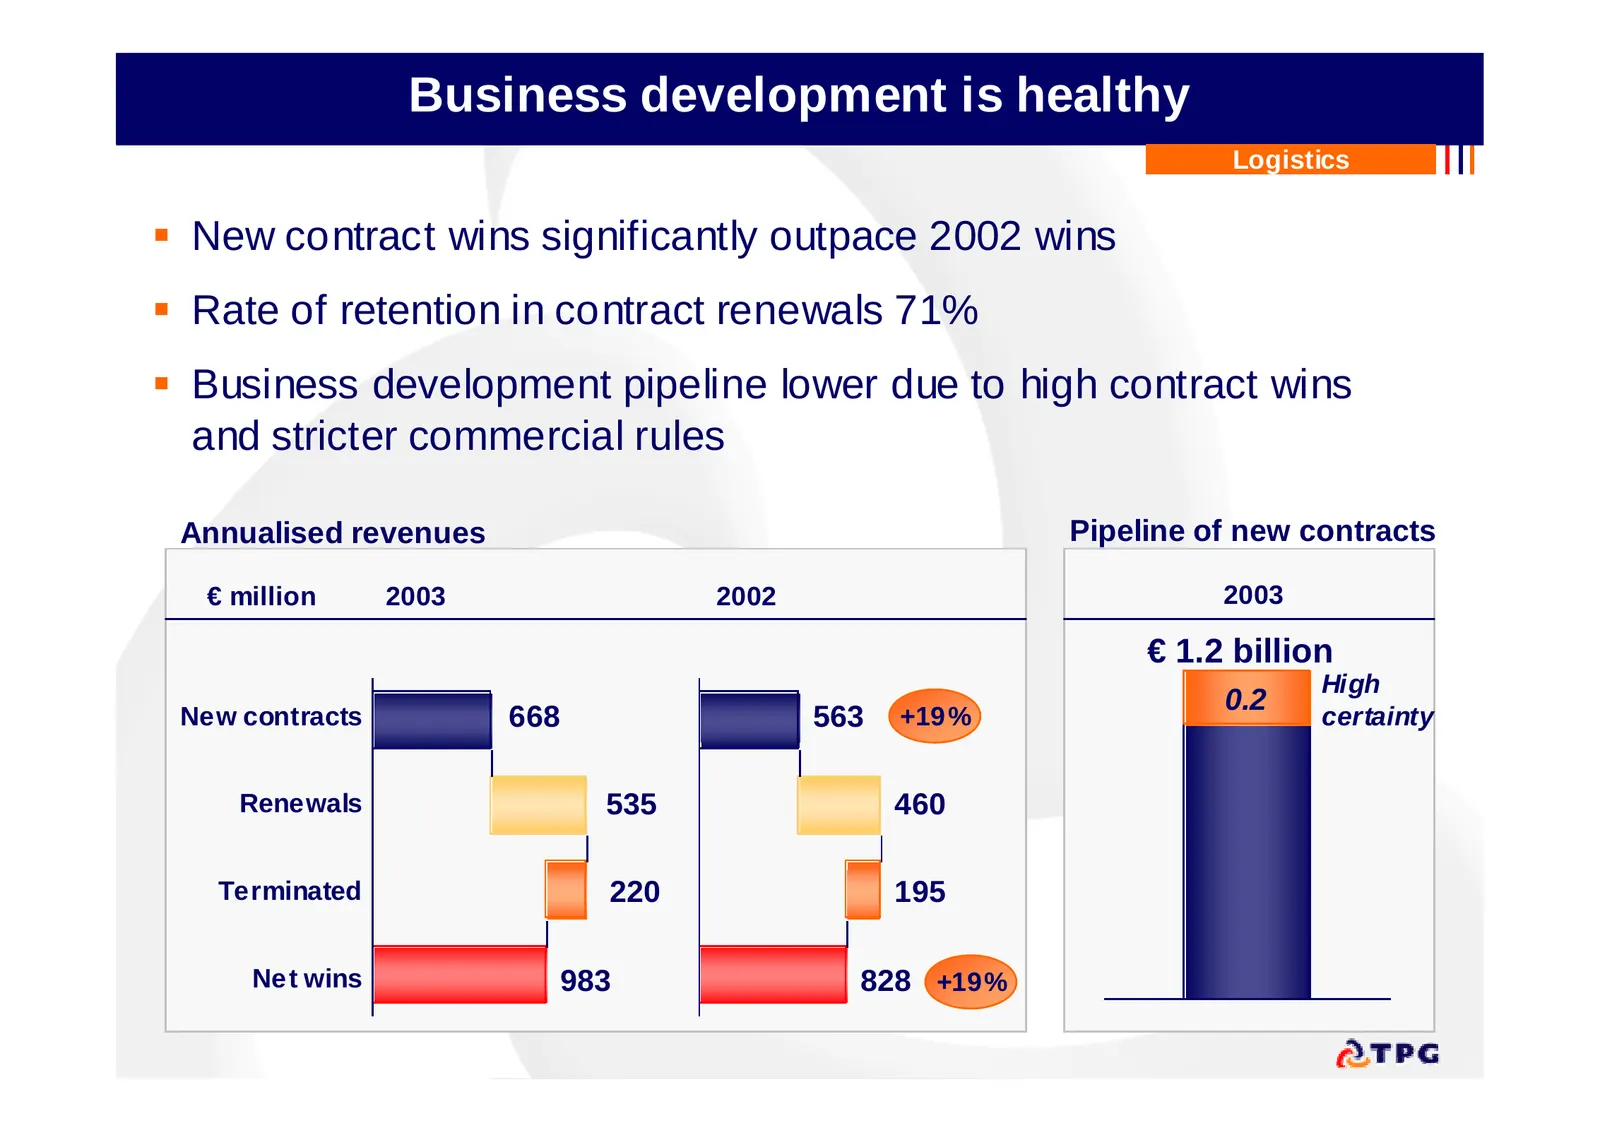
Business development is healthy Logistics New contract wins significantly outpace 2002 wins Rate of retention in contract renewals 71% Business development pipeline lower due to high contract wins and stricter commercial rules Annualised revenues Pipeline of new contracts € million 2003 2002 2
Slide 21: Group Outlook 2004
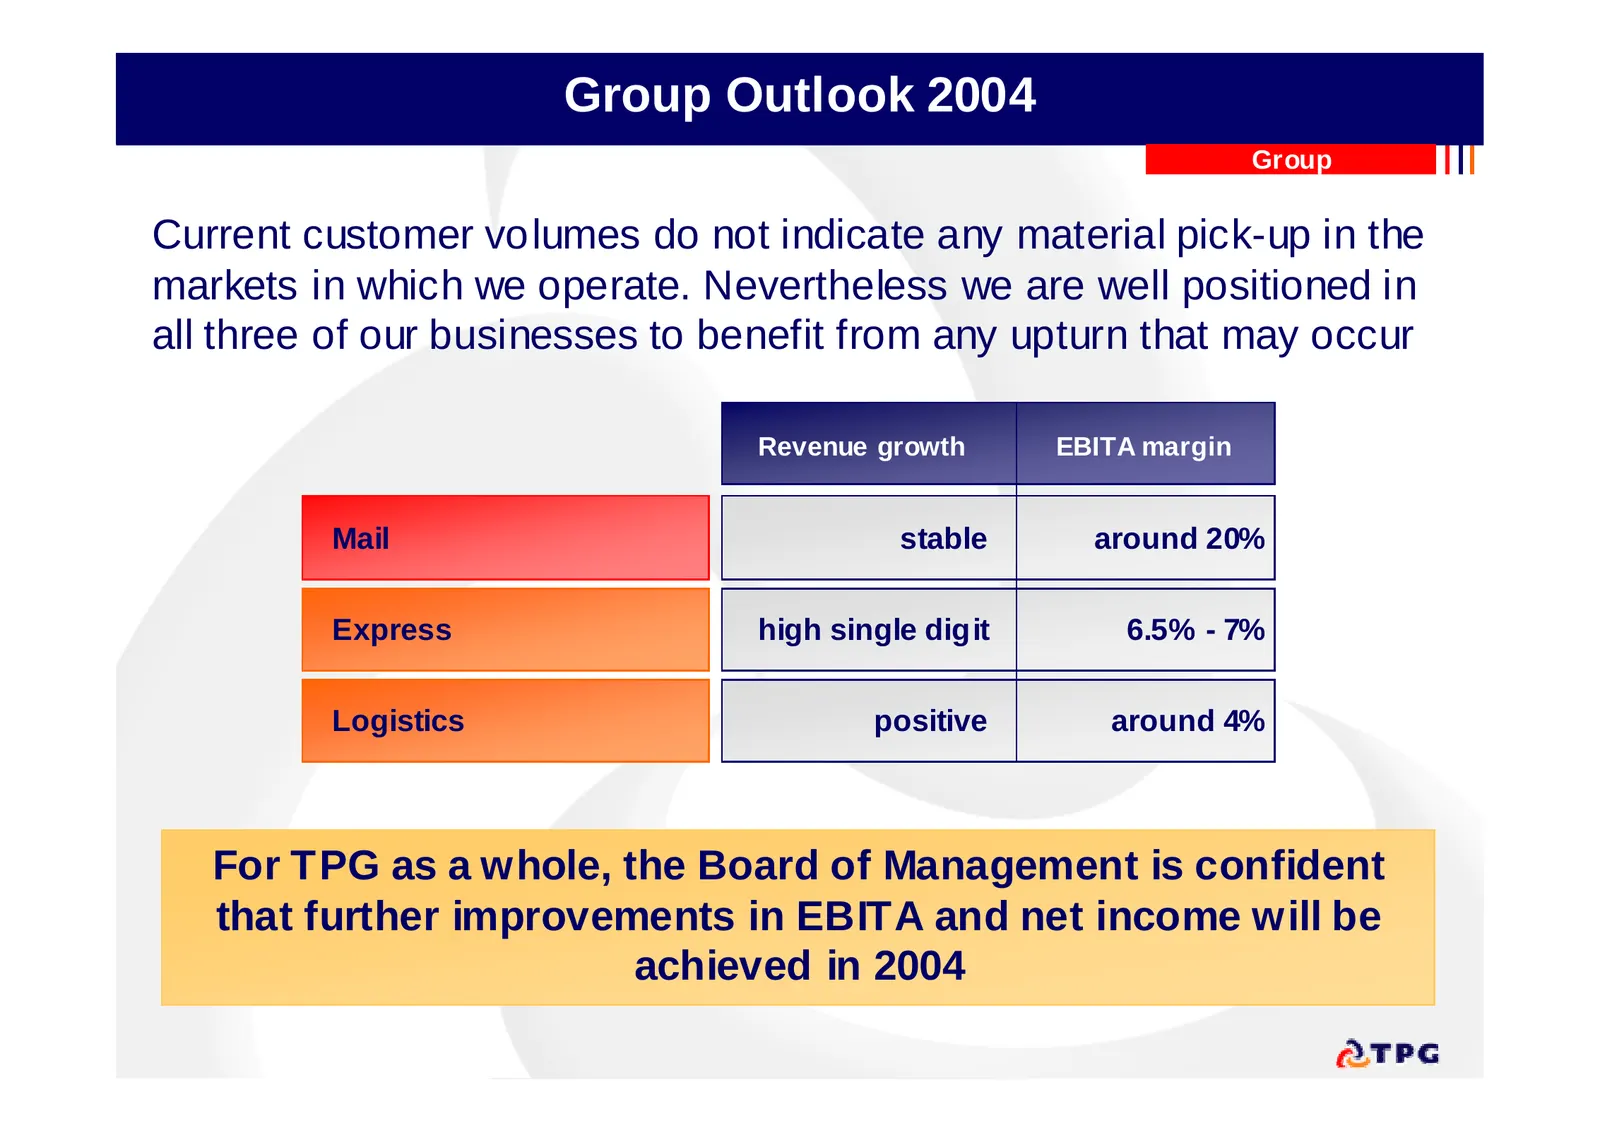
Group Outlook 2004 Group Current customer volumes do not indicate any material pick-up in the markets in which we operate. Nevertheless we are well positioned in all three of our businesses to benefit from any upturn that may occur Revenue growth EBITA margin Mail stable around 20% Express high sing
Slide 22: TPG Strategy
TPG Strategy TPG Peter Bakker
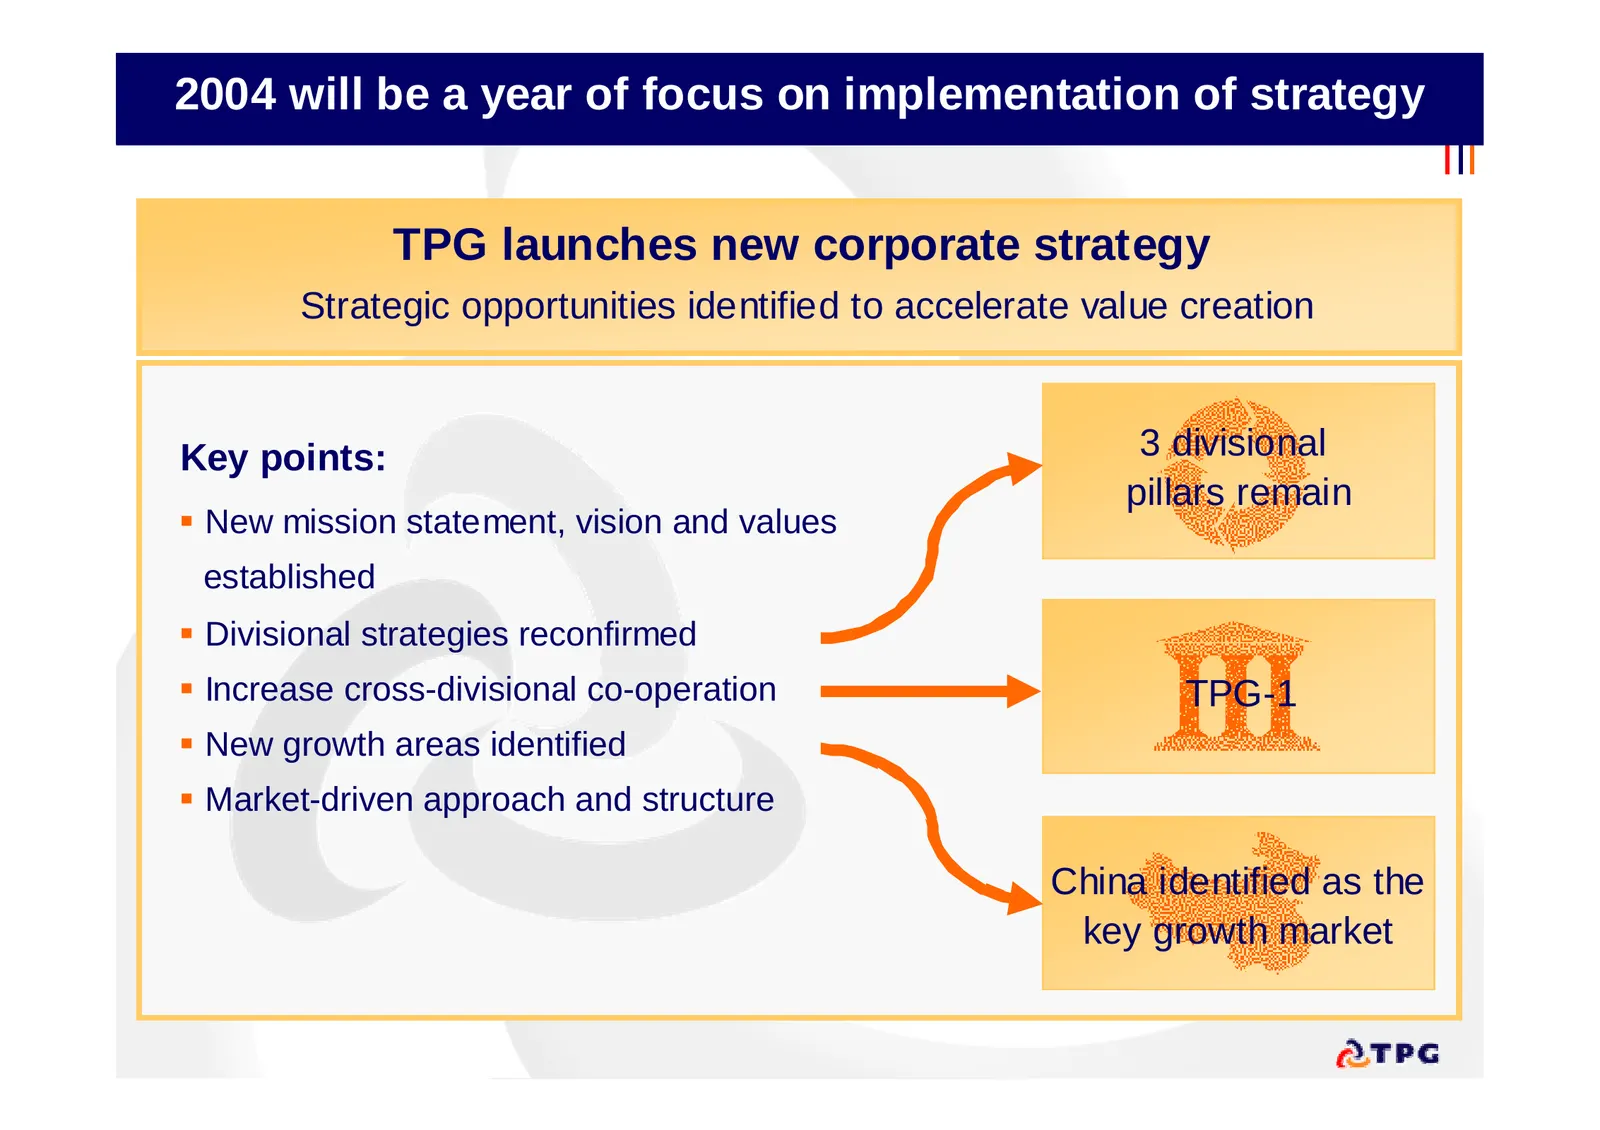
Slide 23: 2004 will be a year of focus on implementation of strategy
2004 will be a year of focus on implementation of strategy TPG launches new corporate strategy Strategic opportunities identified to accelerate value creation Key points: 3 divisional pillars remain New mission statement, vision and values established Divisional strategies reconfirmed Increase
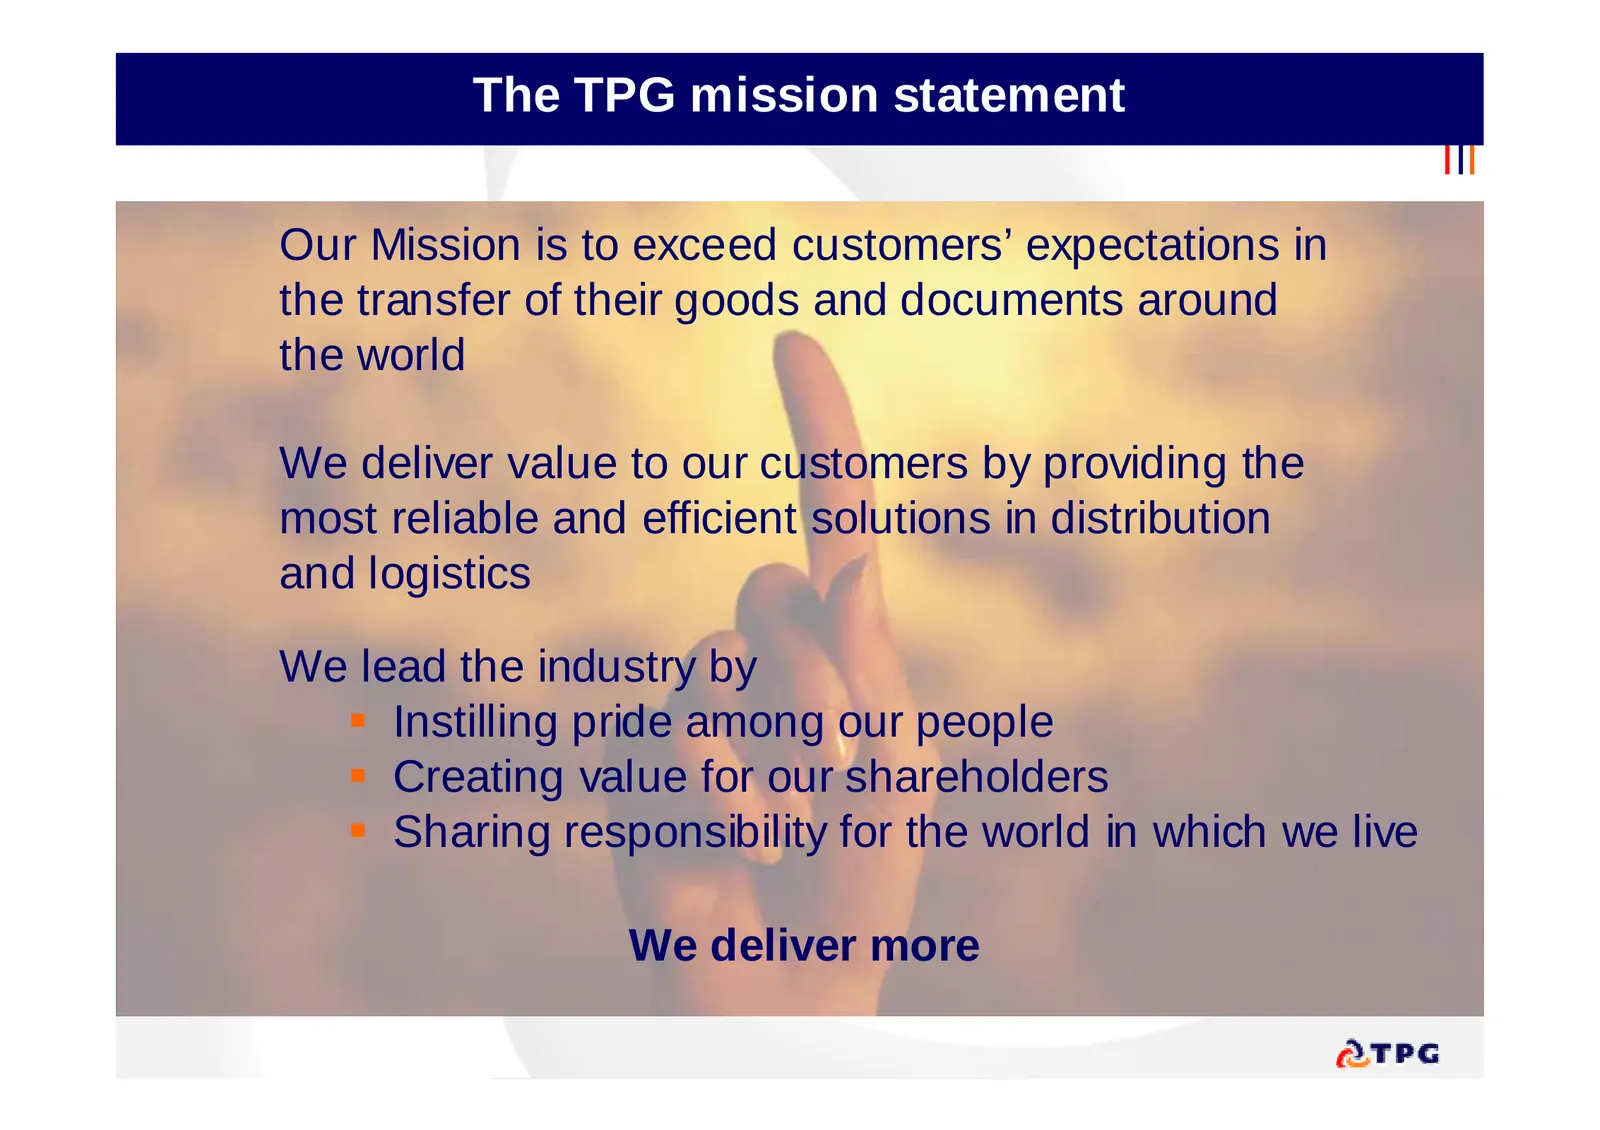
Slide 24: The TPG mission statement
The TPG mission statement Our Mission is to exceed customers’ expectations in the transfer of their goods and documents around the world We deliver value to our customers by providing the most reliable and efficient solutions in distribution and logistics We lead the industry by Instilling pride a
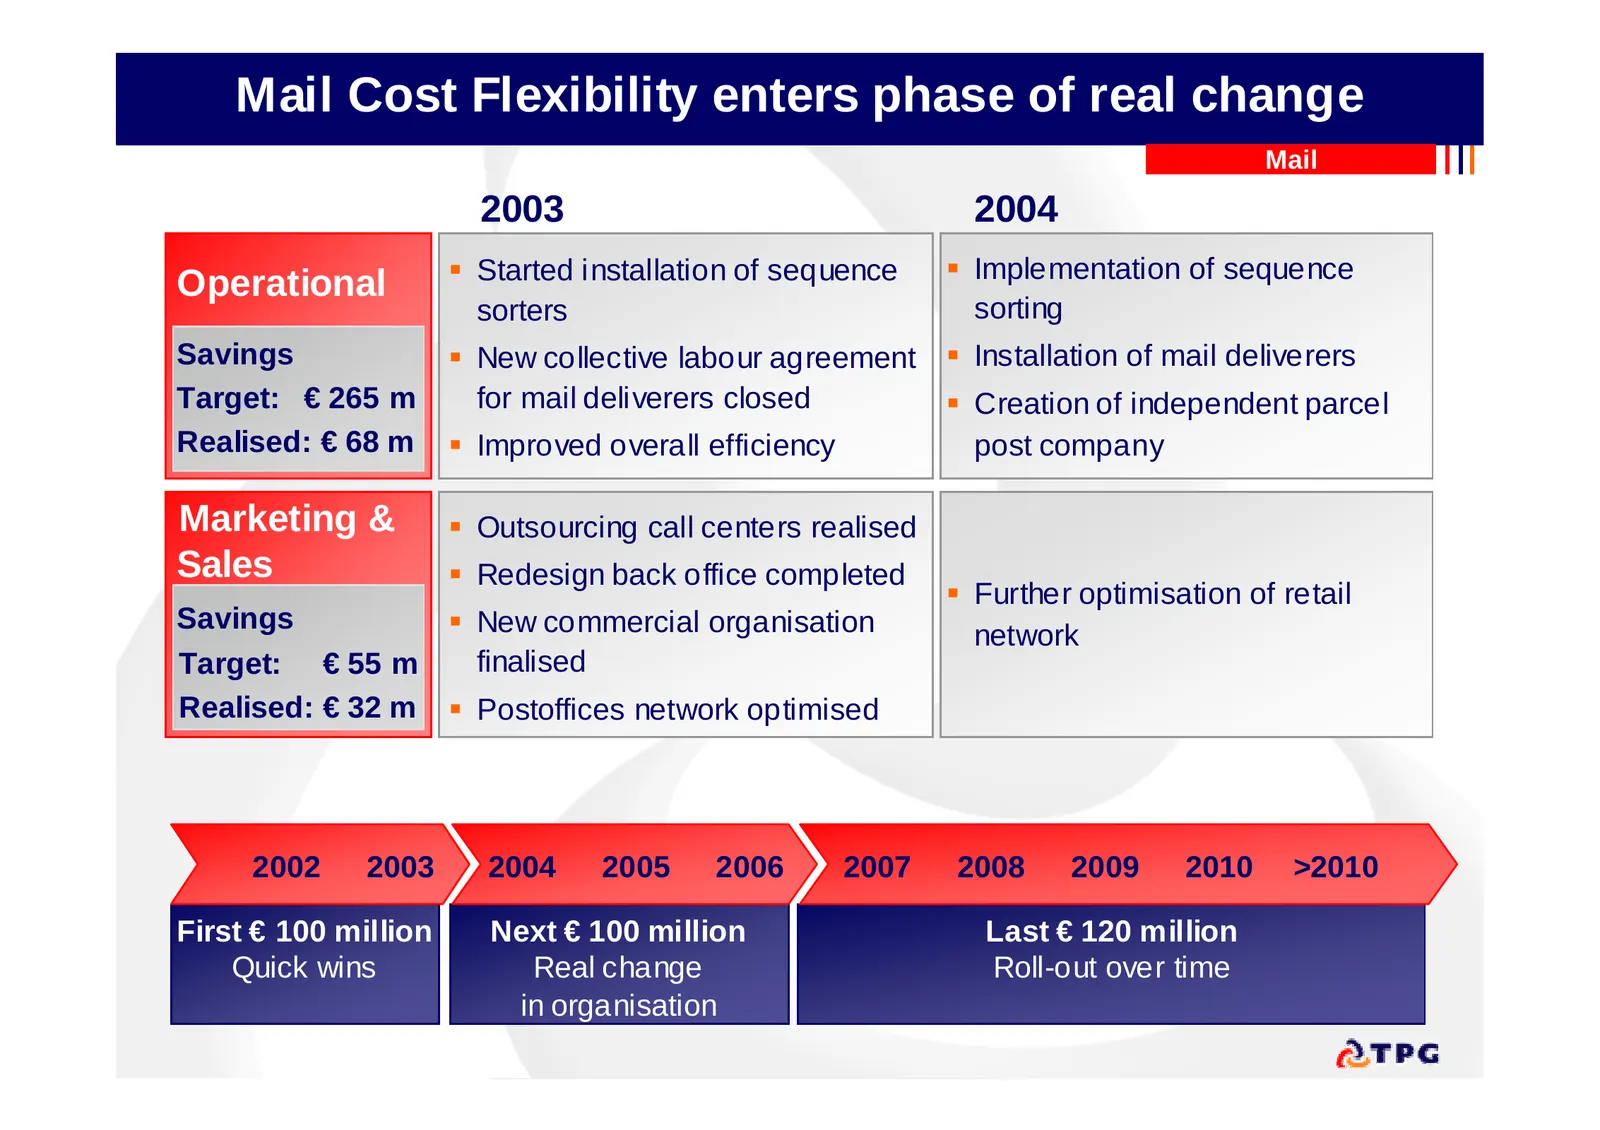
Slide 25: Mail Cost Flexibility enters phase of real change
Mail Cost Flexibility enters phase of real change Mail 2003 2004 Started installation of sequence Implementation of sequence Operational sorters sorting Savings New collective labour agreement Installation of mail deliverers Target: € 265 m for mail deliverers closed Creation of independen
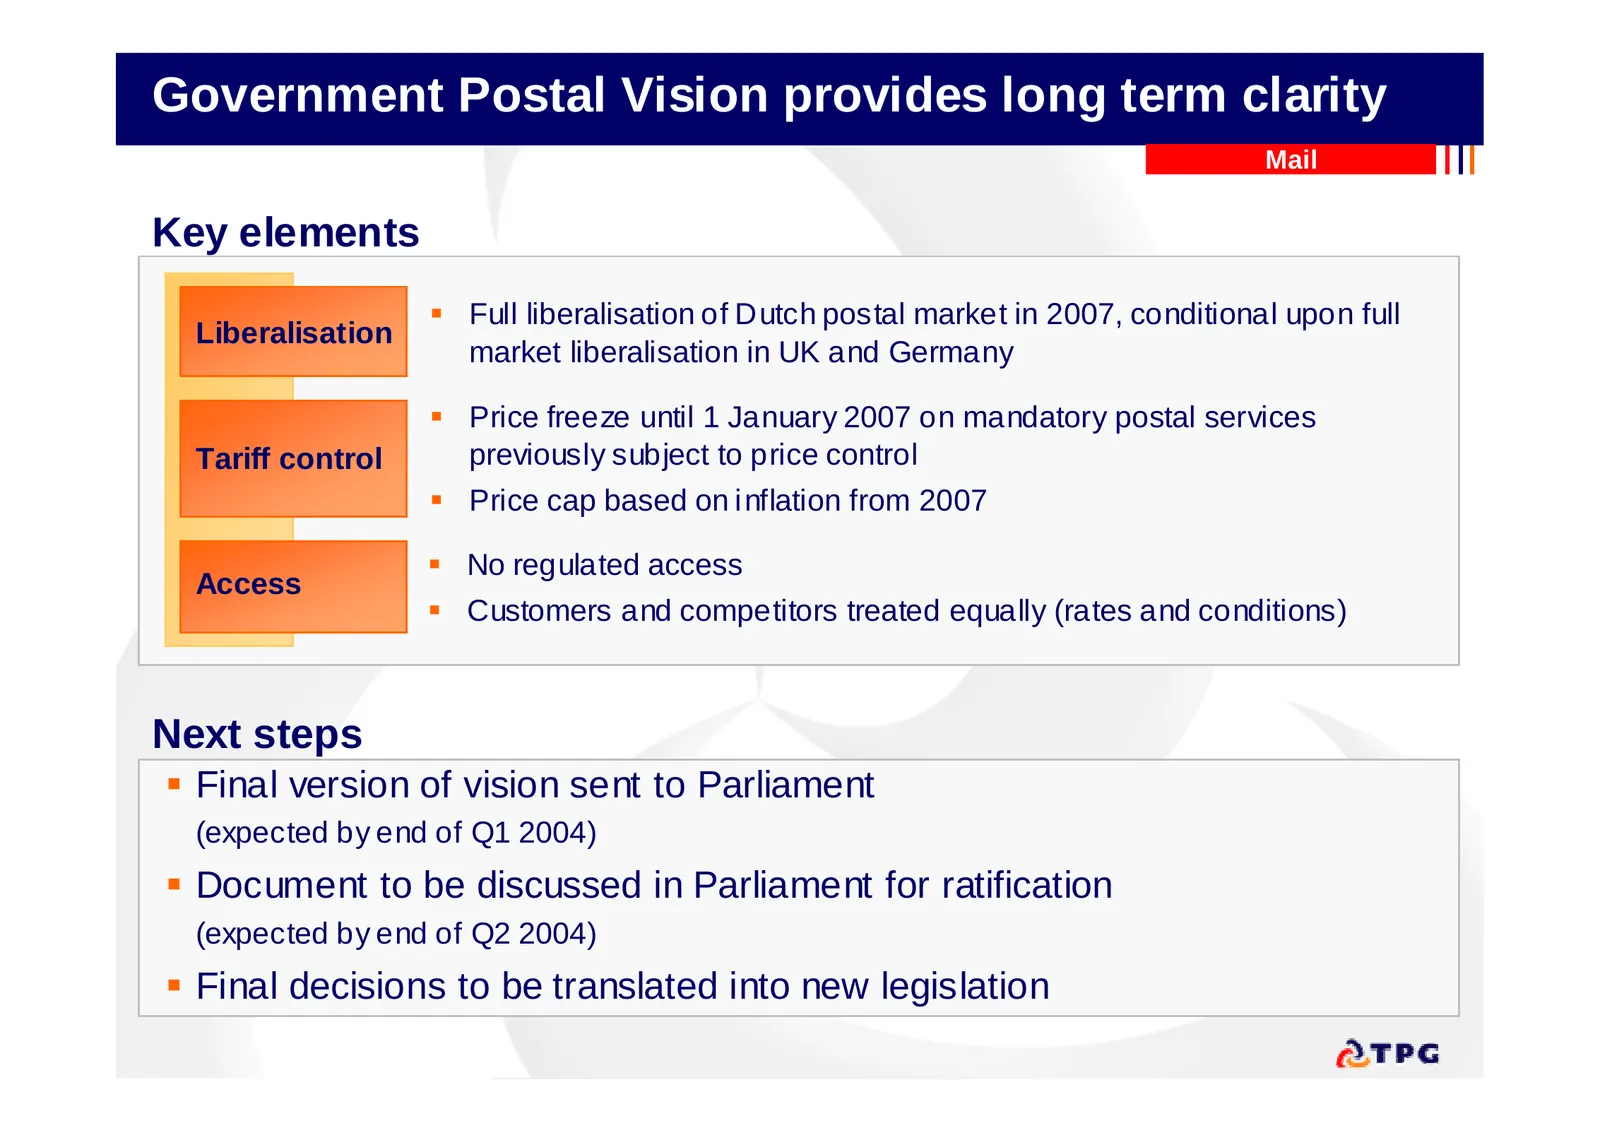
Slide 26: Government Postal Vision provides long term clarity
Government Postal Vision provides long term clarity Mail Key elements Full liberalisation of Dutch postal market in 2007, conditional upon full Liberalisation market liberalisation in UK and Germany Price freeze until 1 January 2007 on mandatory postal services Tariff control previously subject
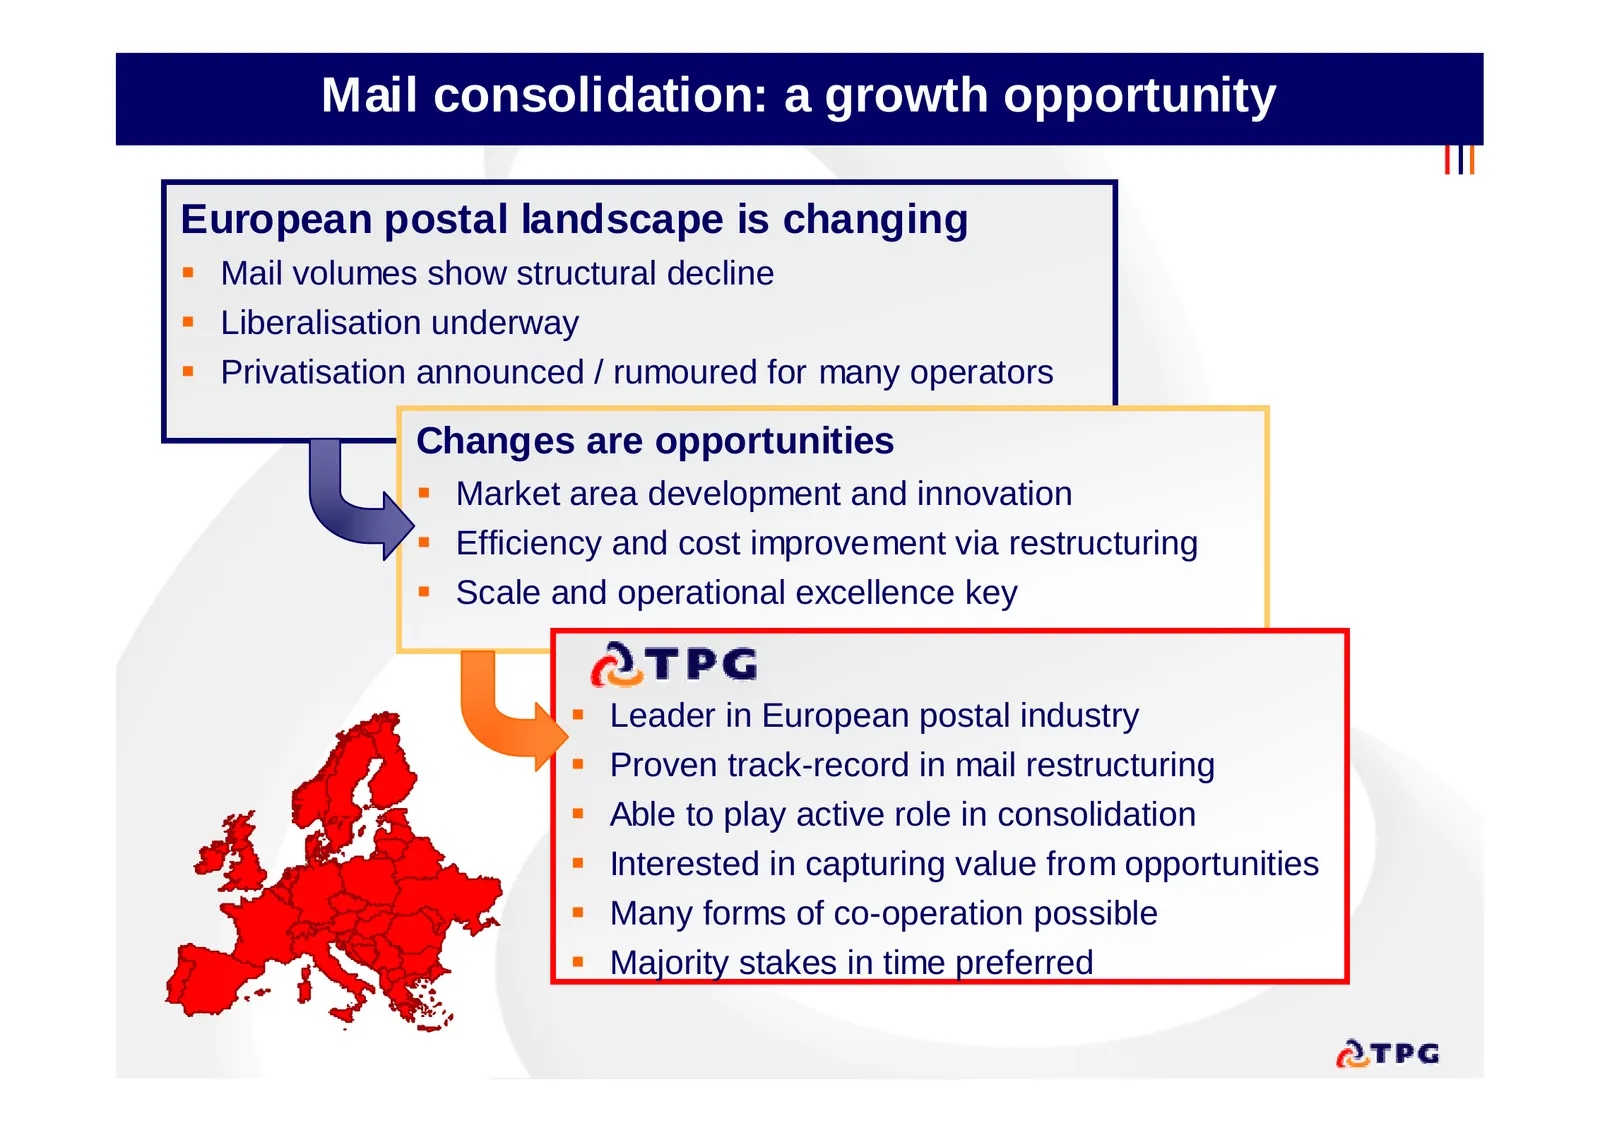
Slide 27: Mail consolidation: a growth opportunity
Mail consolidation: a growth opportunity European postal landscape is changing Mail volumes show structural decline Liberalisation underway Privatisation announced / rumoured for many operators Changes are opportunities Market area development and innovation Efficiency and cost improvement
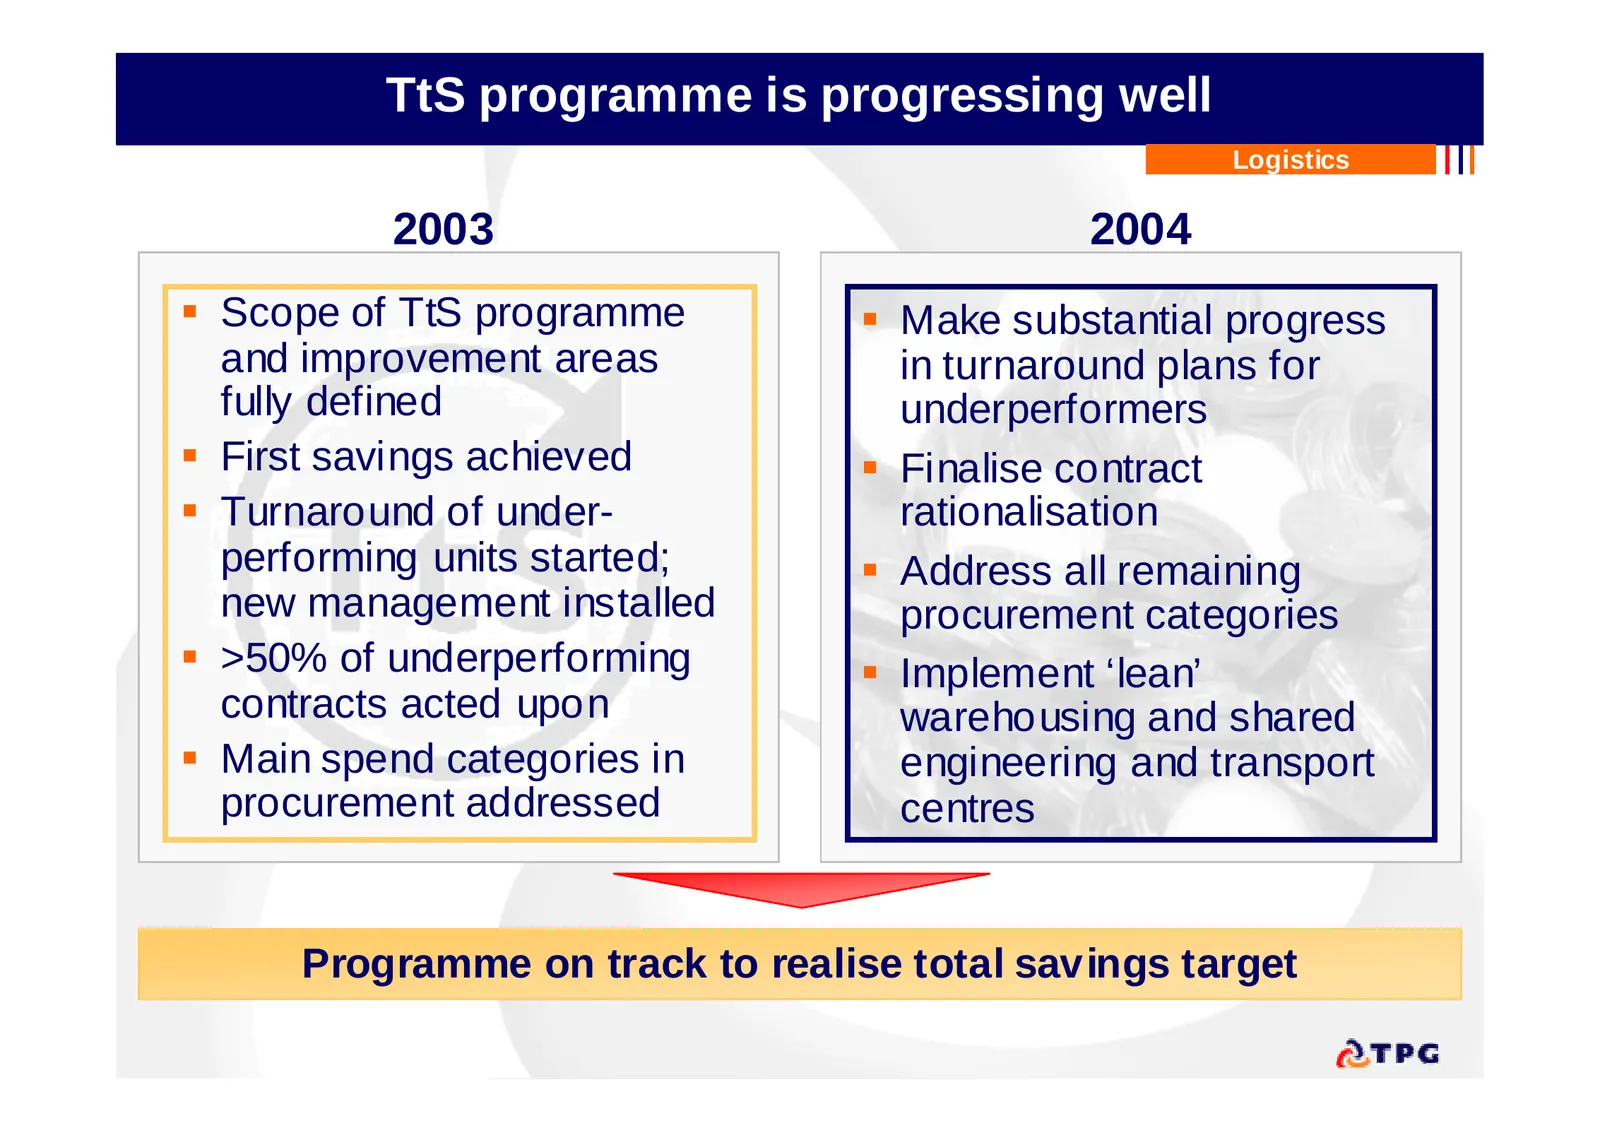
Slide 28: TtS programme is progressing well
TtS programme is progressing well Logistics 2003 2004 Scope of TtS programme Make substantial progress and improvement areas in turnaround plans for fully defined underperformers First savings achieved Finalise contract Turnaround of under- rationalisation performing units started; Addre
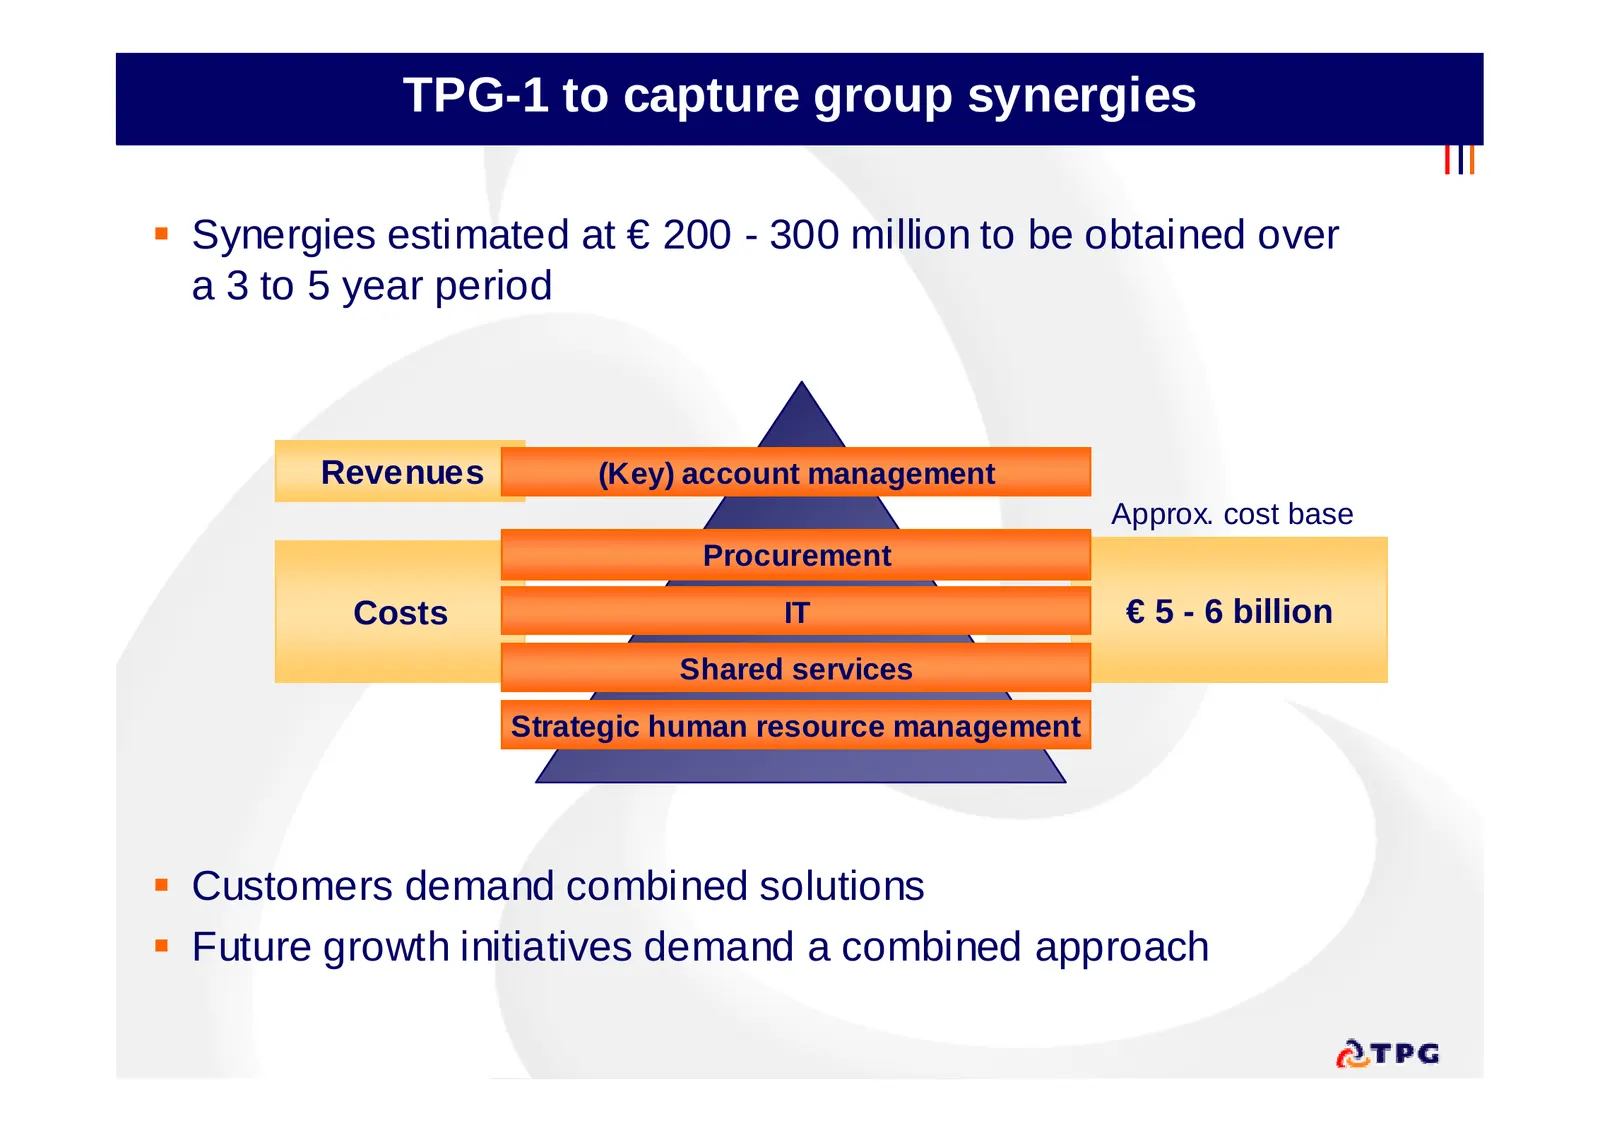
Slide 29: TPG-1 to capture group synergies
TPG-1 to capture group synergies Synergies estimated at € 200 - 300 million to be obtained over a 3 to 5 year period Revenues (Key) account management Approx. cost base Procurement Costs IT € 5 - 6 billion Shared services Strategic human resource management Customers demand combined solutions
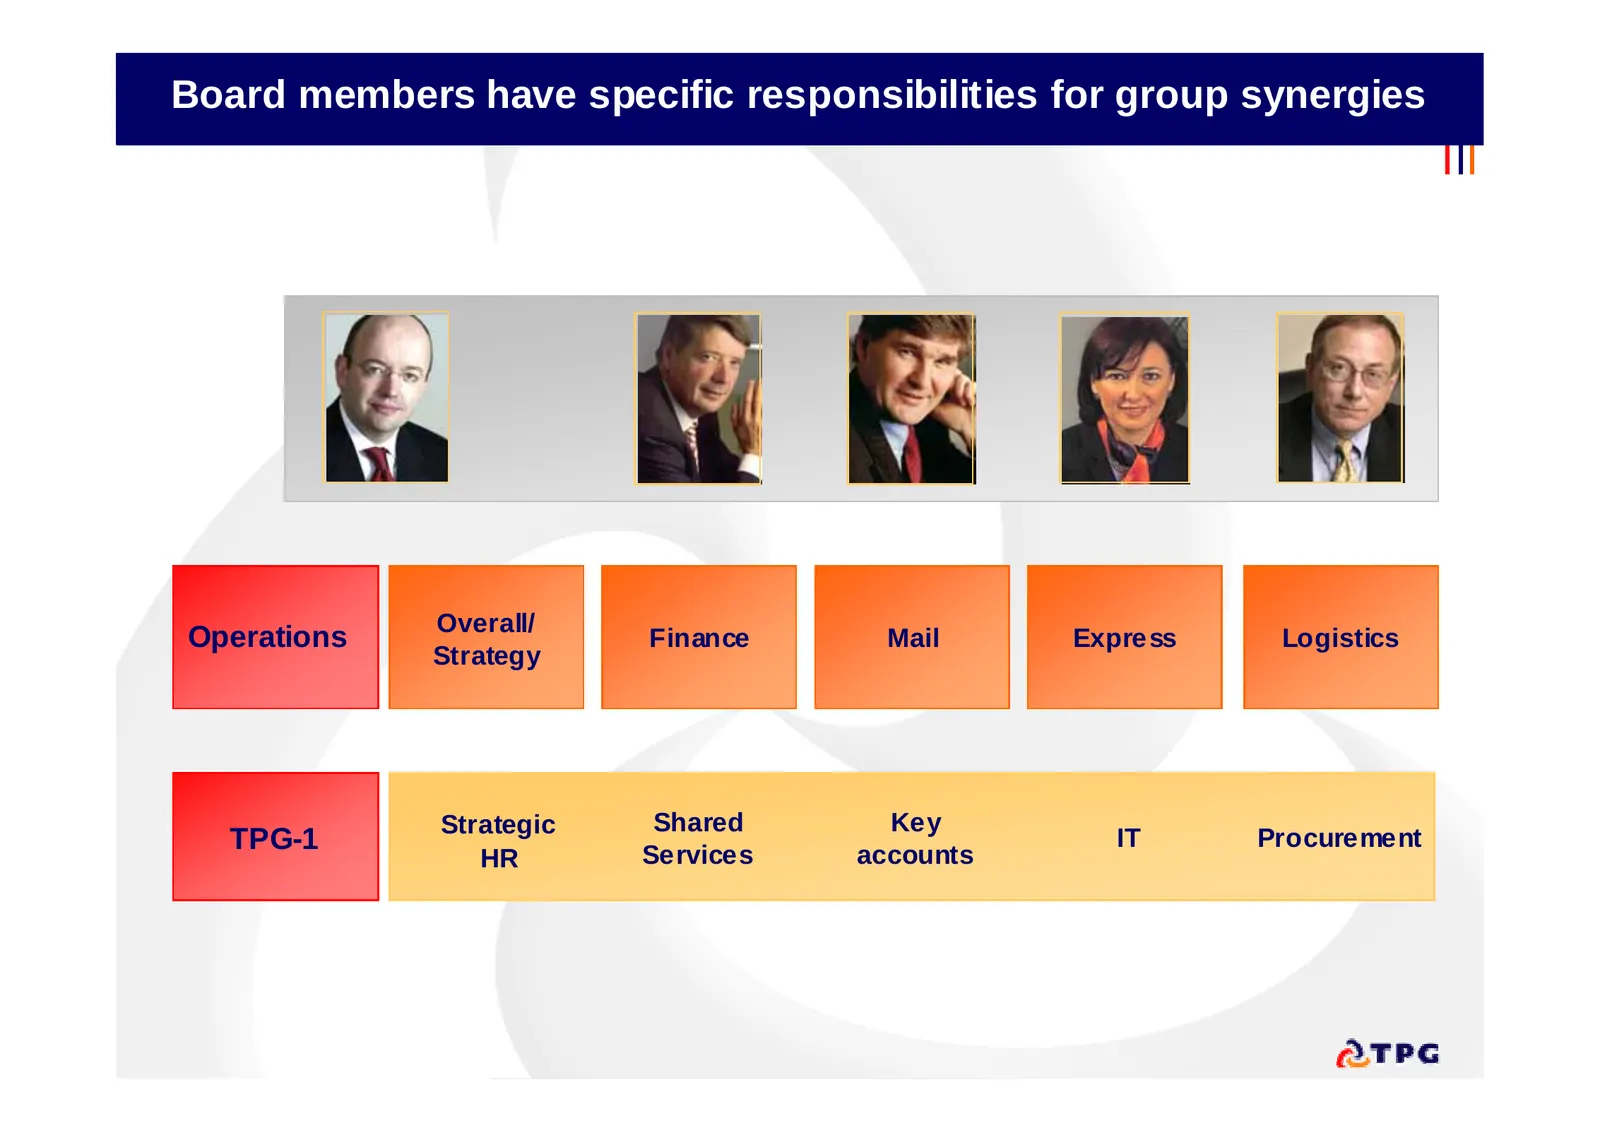
Slide 30: Board members have specific responsibilities for group synergies
Board members have specific responsibilities for group synergies Overall/ Operations Finance Mail Express Logistics Strategy Strategic Shared Key TPG-1 IT Procurement HR Services accounts
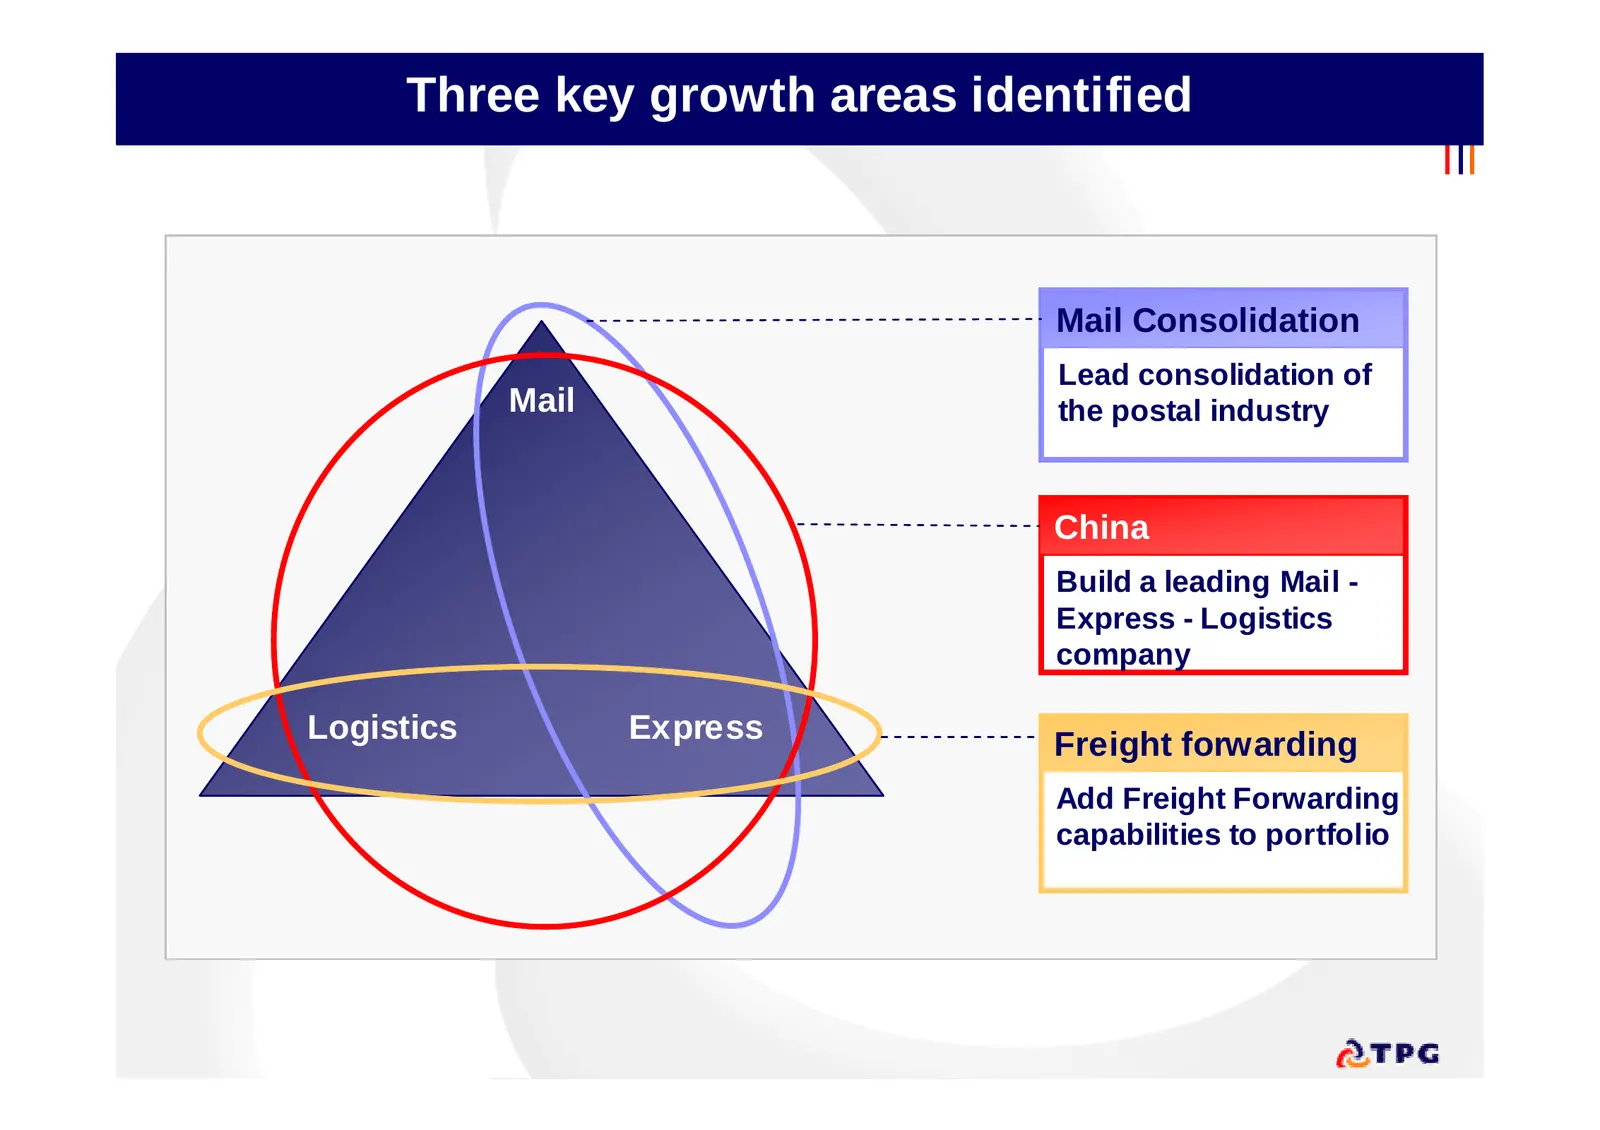
Slide 31: Three key growth areas identified
Three key growth areas identified Mail Consolidation Lead consolidation of Mail the postal industry China Build a leading Mail - Express - Logistics company Logistics Express Freight forwarding Add Freight Forwarding capabilities to portfolio
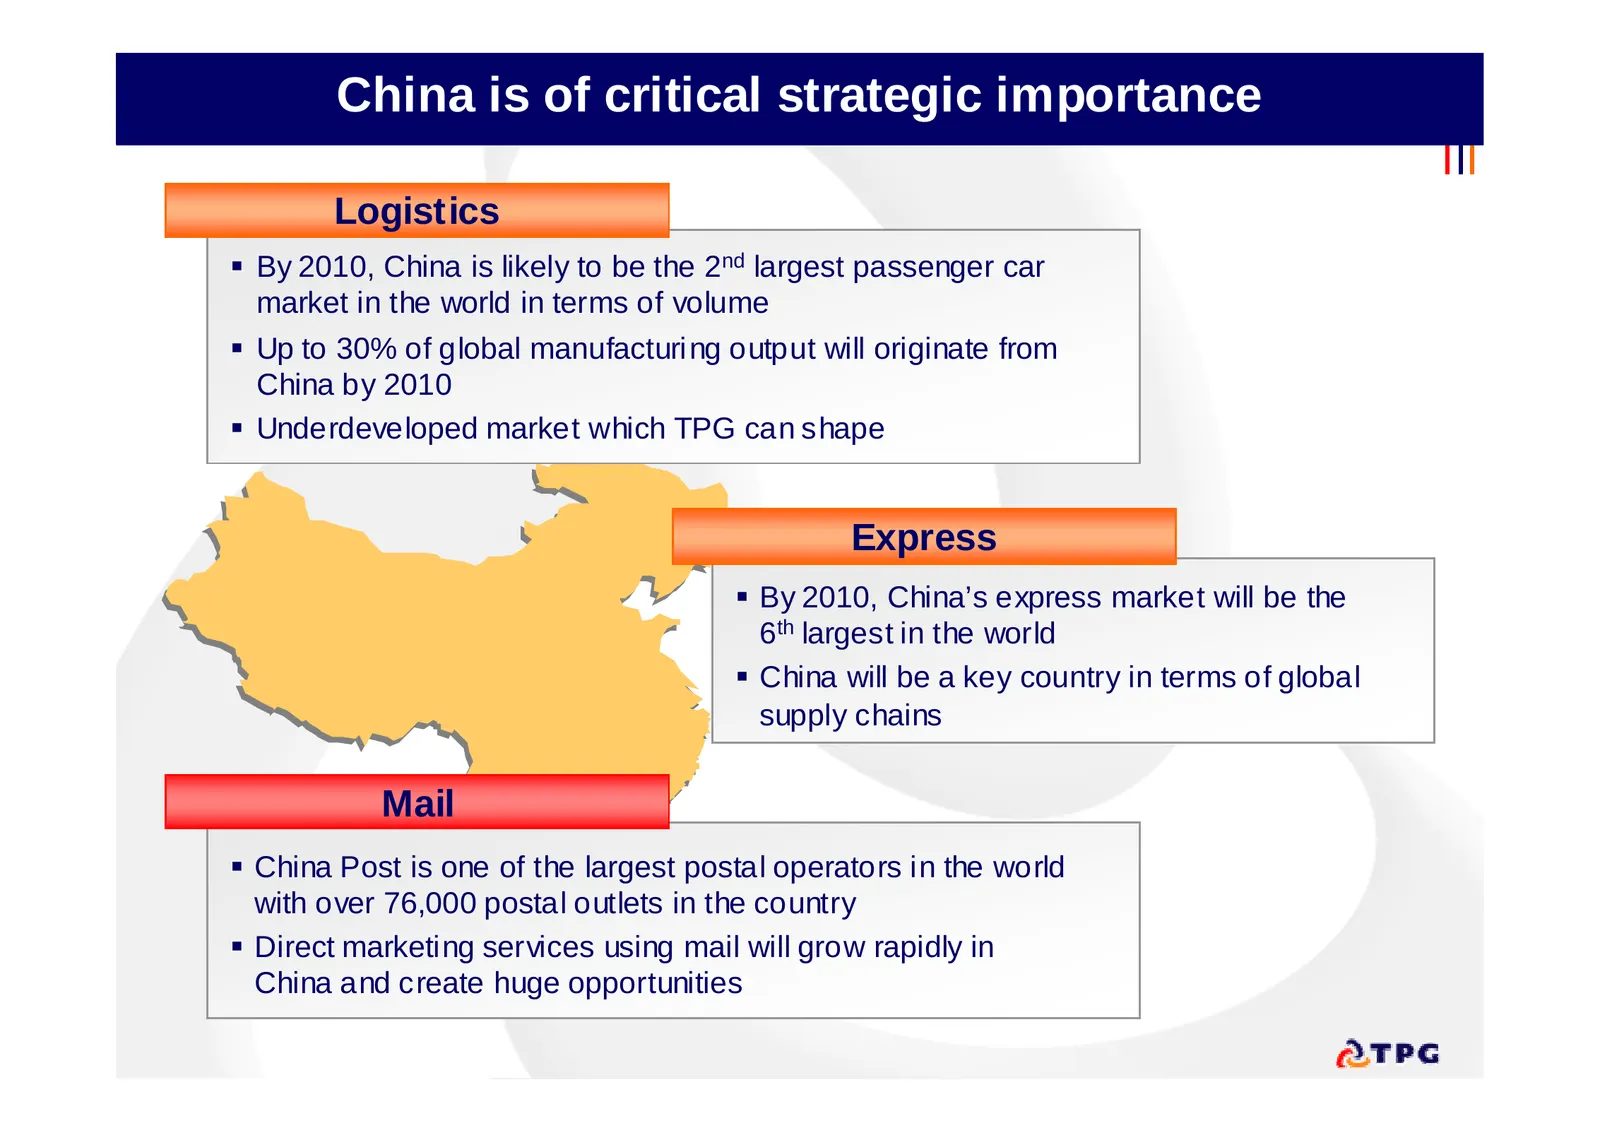
Slide 32: China is of critical strategic importance
China is of critical strategic importance Logistics By 2010, China is likely to be the 2nd largest passenger car market in the world in terms of volume Up to 30% of global manufacturing output will originate from China by 2010 Underdeveloped market which TPG can shape Express By 2010, China’
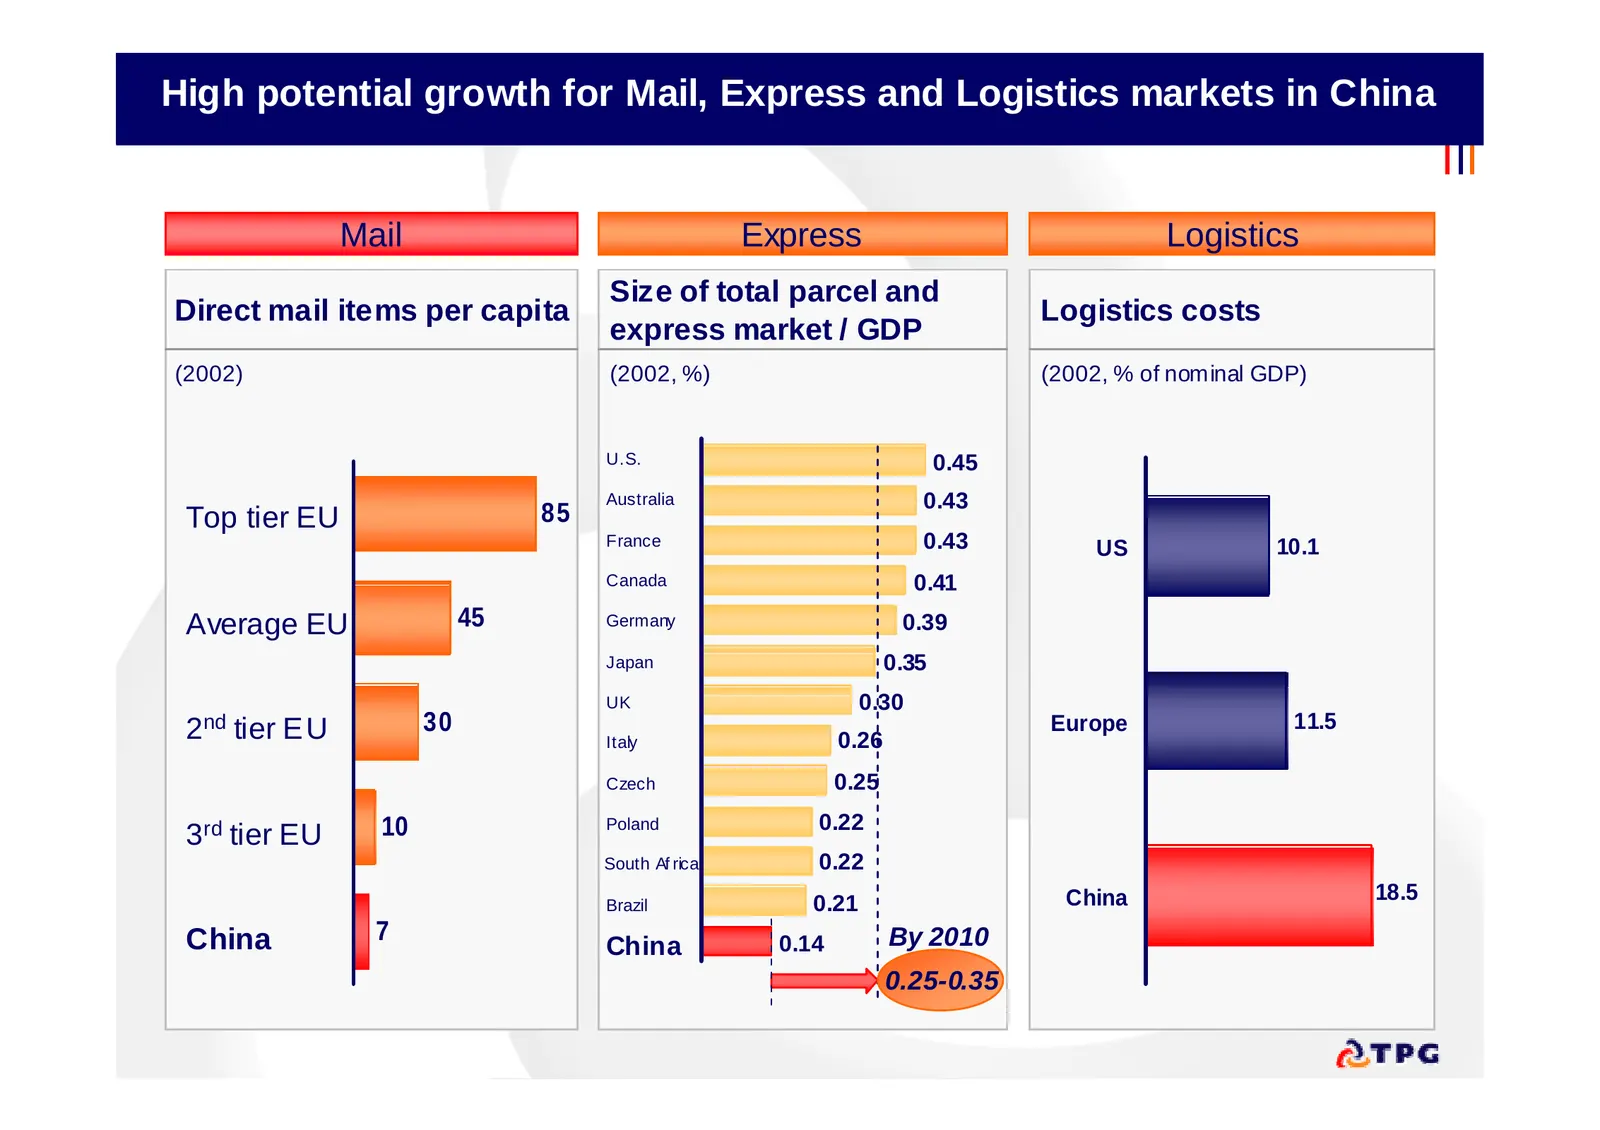
Slide 33: High potential growth for Mail, Express and Logistics markets in China
High potential growth for Mail, Express and Logistics markets in China Mail Express Logistics Size of total parcel and Direct mail items per capita Logistics costs express market / GDP (2002) (2002, %) (2002, % of nominal GDP) U.S. 0.45 Australia 0.43 Top tier EU 85 France 0.43 US 10.1 Canada 0.41 A
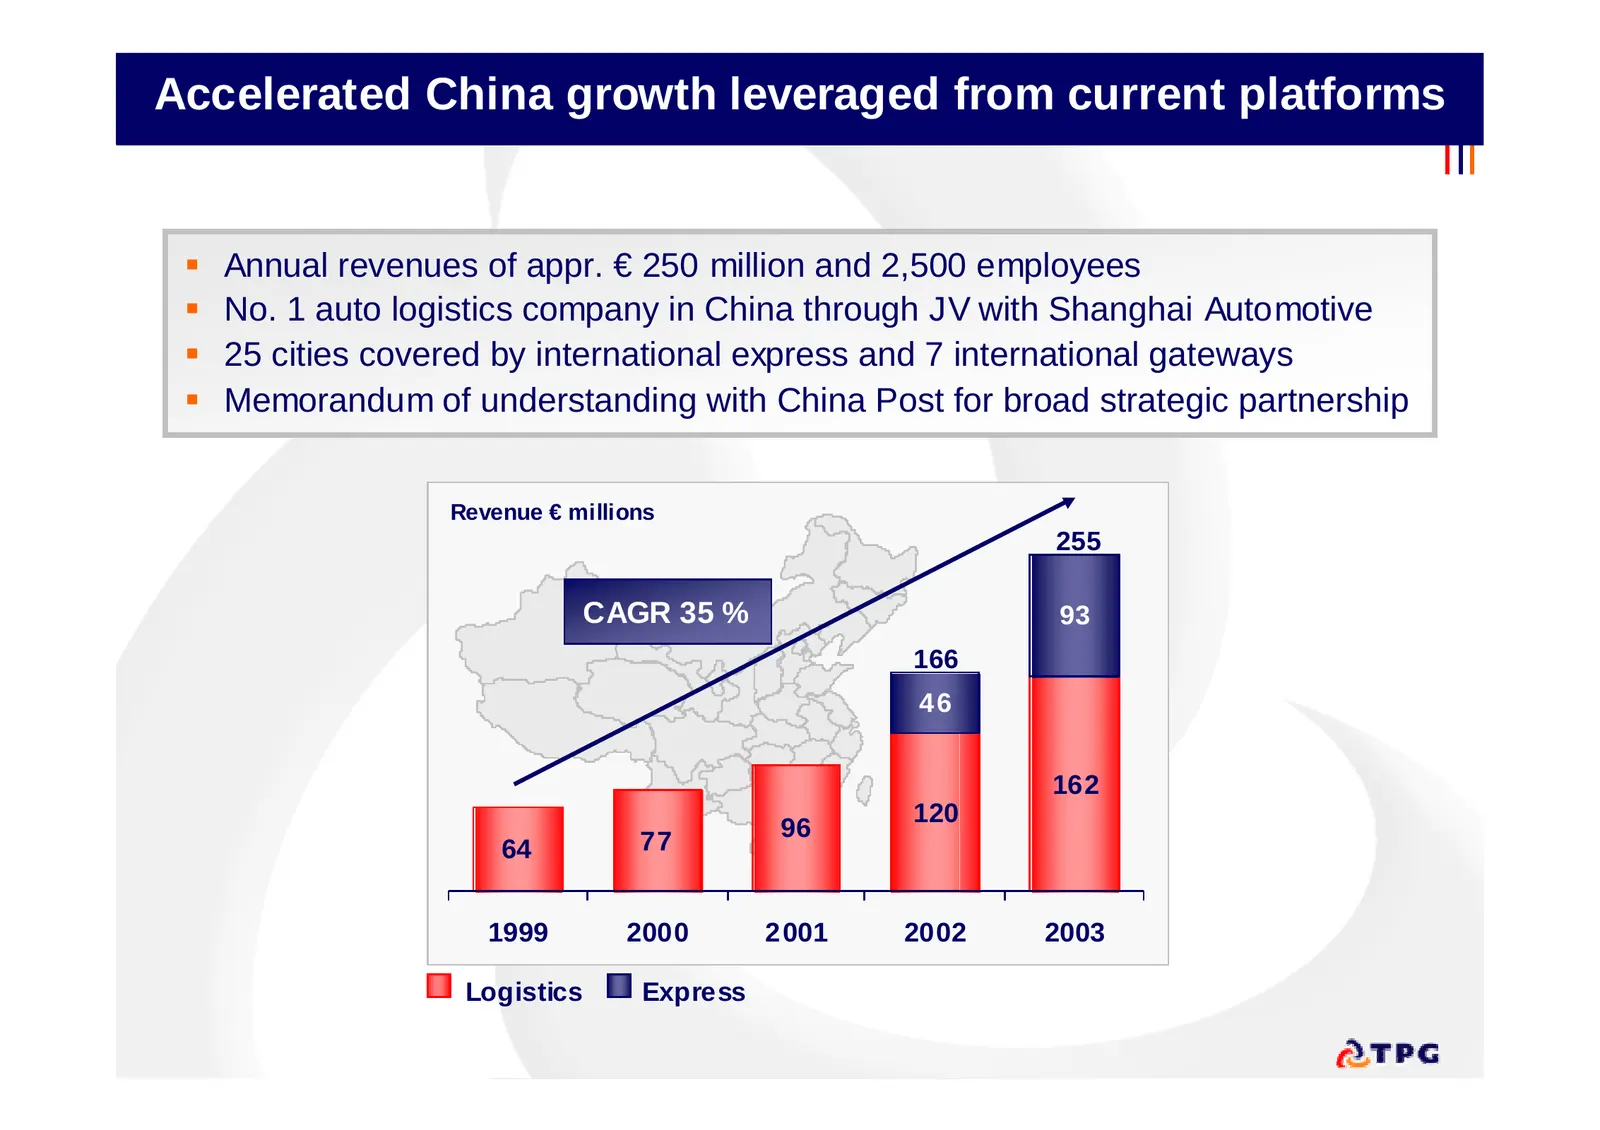
Slide 34: Accelerated China growth leveraged from current platforms
Accelerated China growth leveraged from current platforms Annual revenues of appr. € 250 million and 2,500 employees No. 1 auto logistics company in China through JV with Shanghai Automotive 25 cities covered by international express and 7 international gateways Memorandum of understanding w
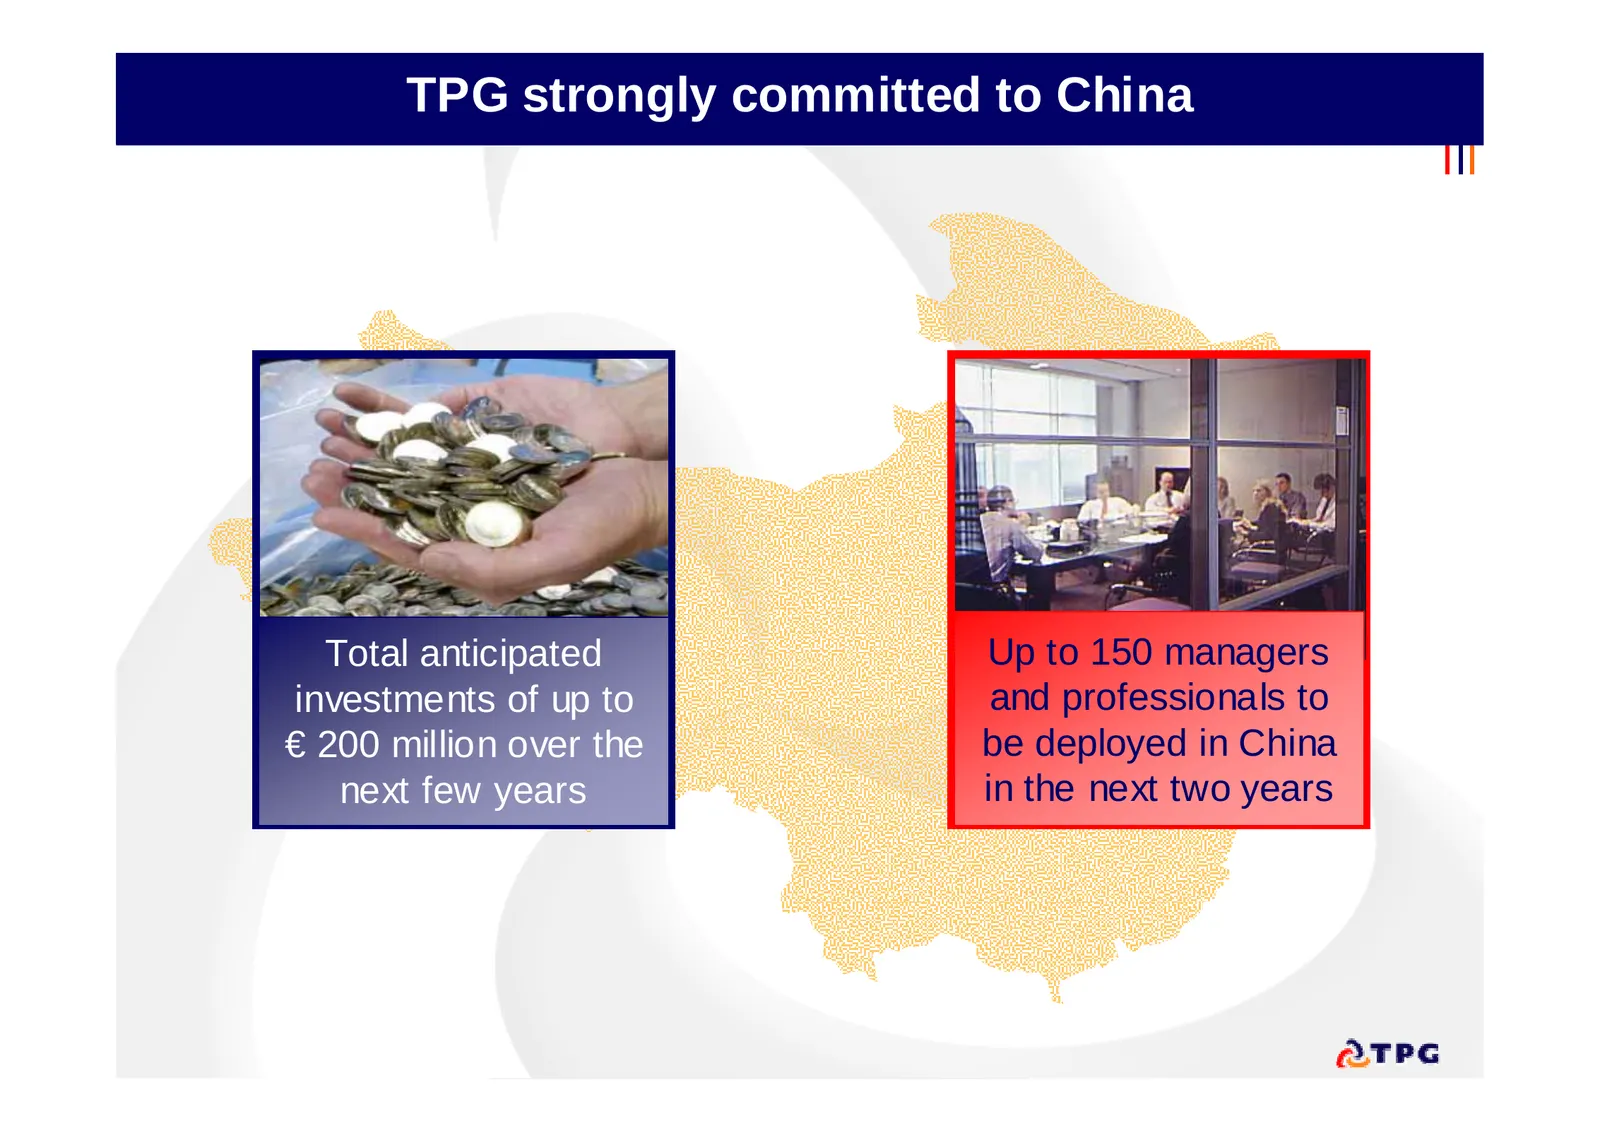
Slide 35: TPG strongly committed to China
TPG strongly committed to China Total anticipated Up to 150 managers investments of up to and professionals to € 200 million over the be deployed in China next few years in the next two years
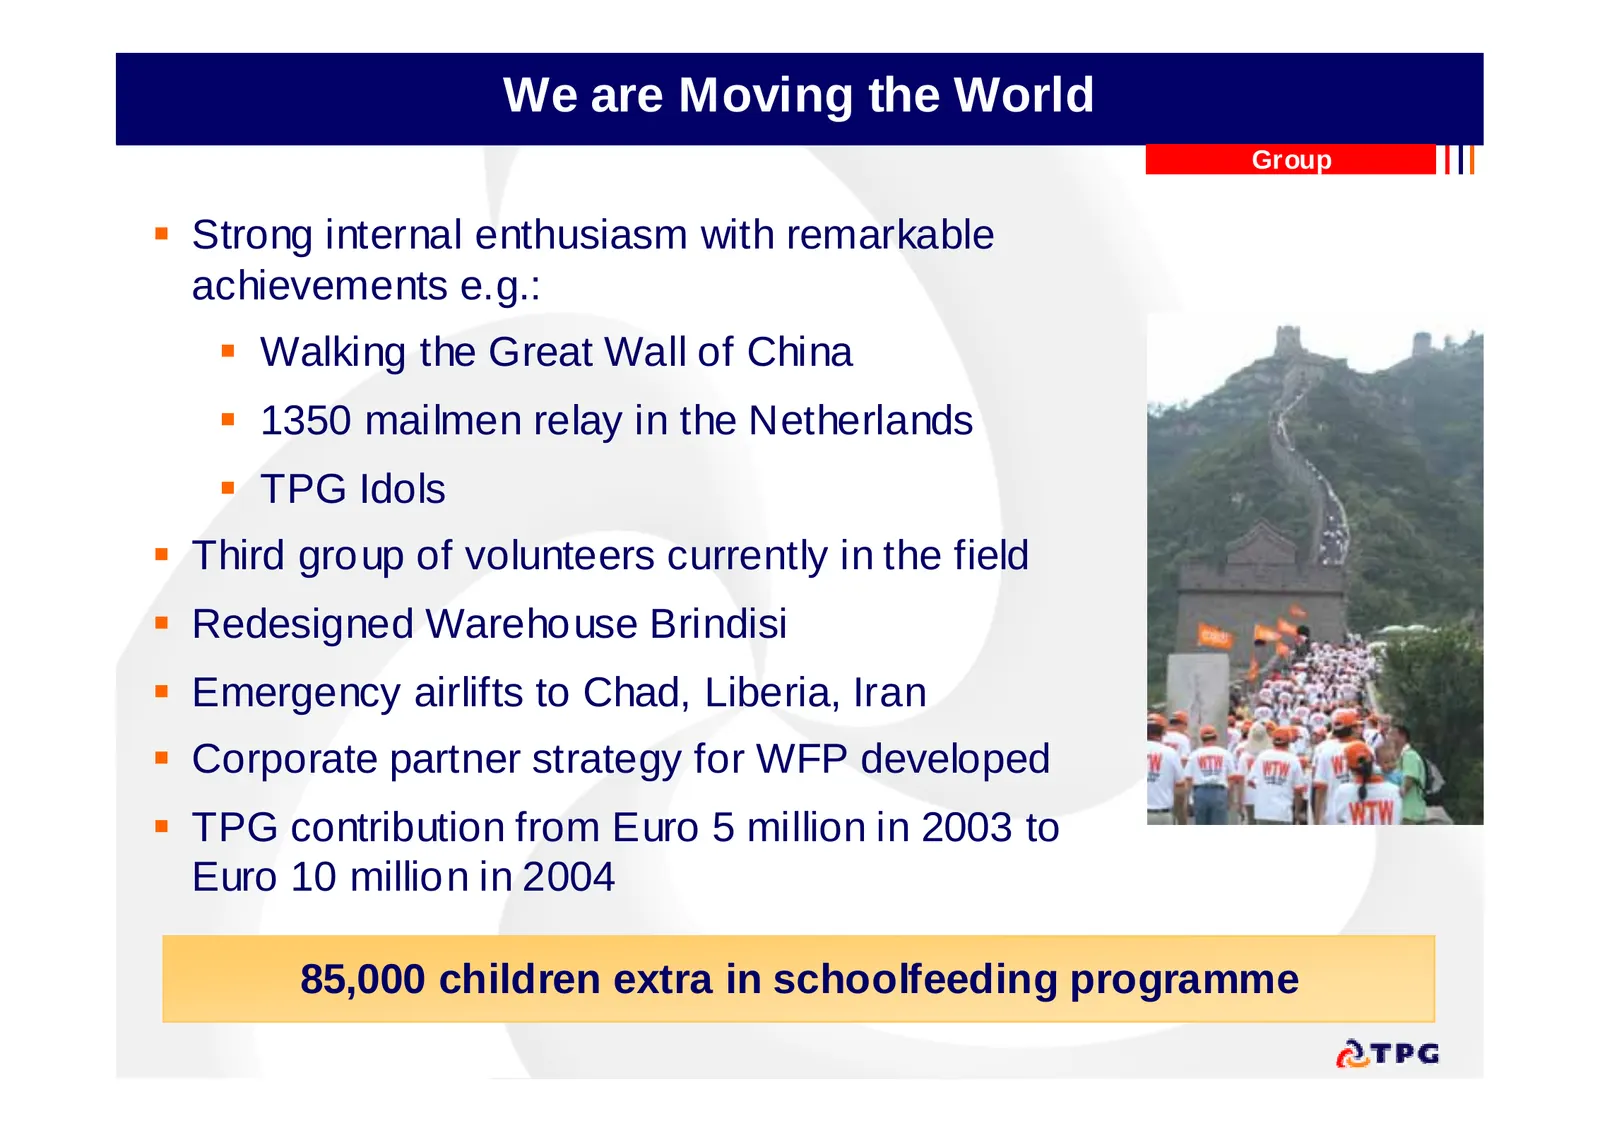
Slide 36: We are Moving the World
We are Moving the World Group Strong internal enthusiasm with remarkable achievements e.g.: Walking the Great Wall of China 1350 mailmen relay in the Netherlands TPG Idols Third group of volunteers currently in the field Redesigned Warehouse Brindisi Emergency airlifts to Chad, Liberia
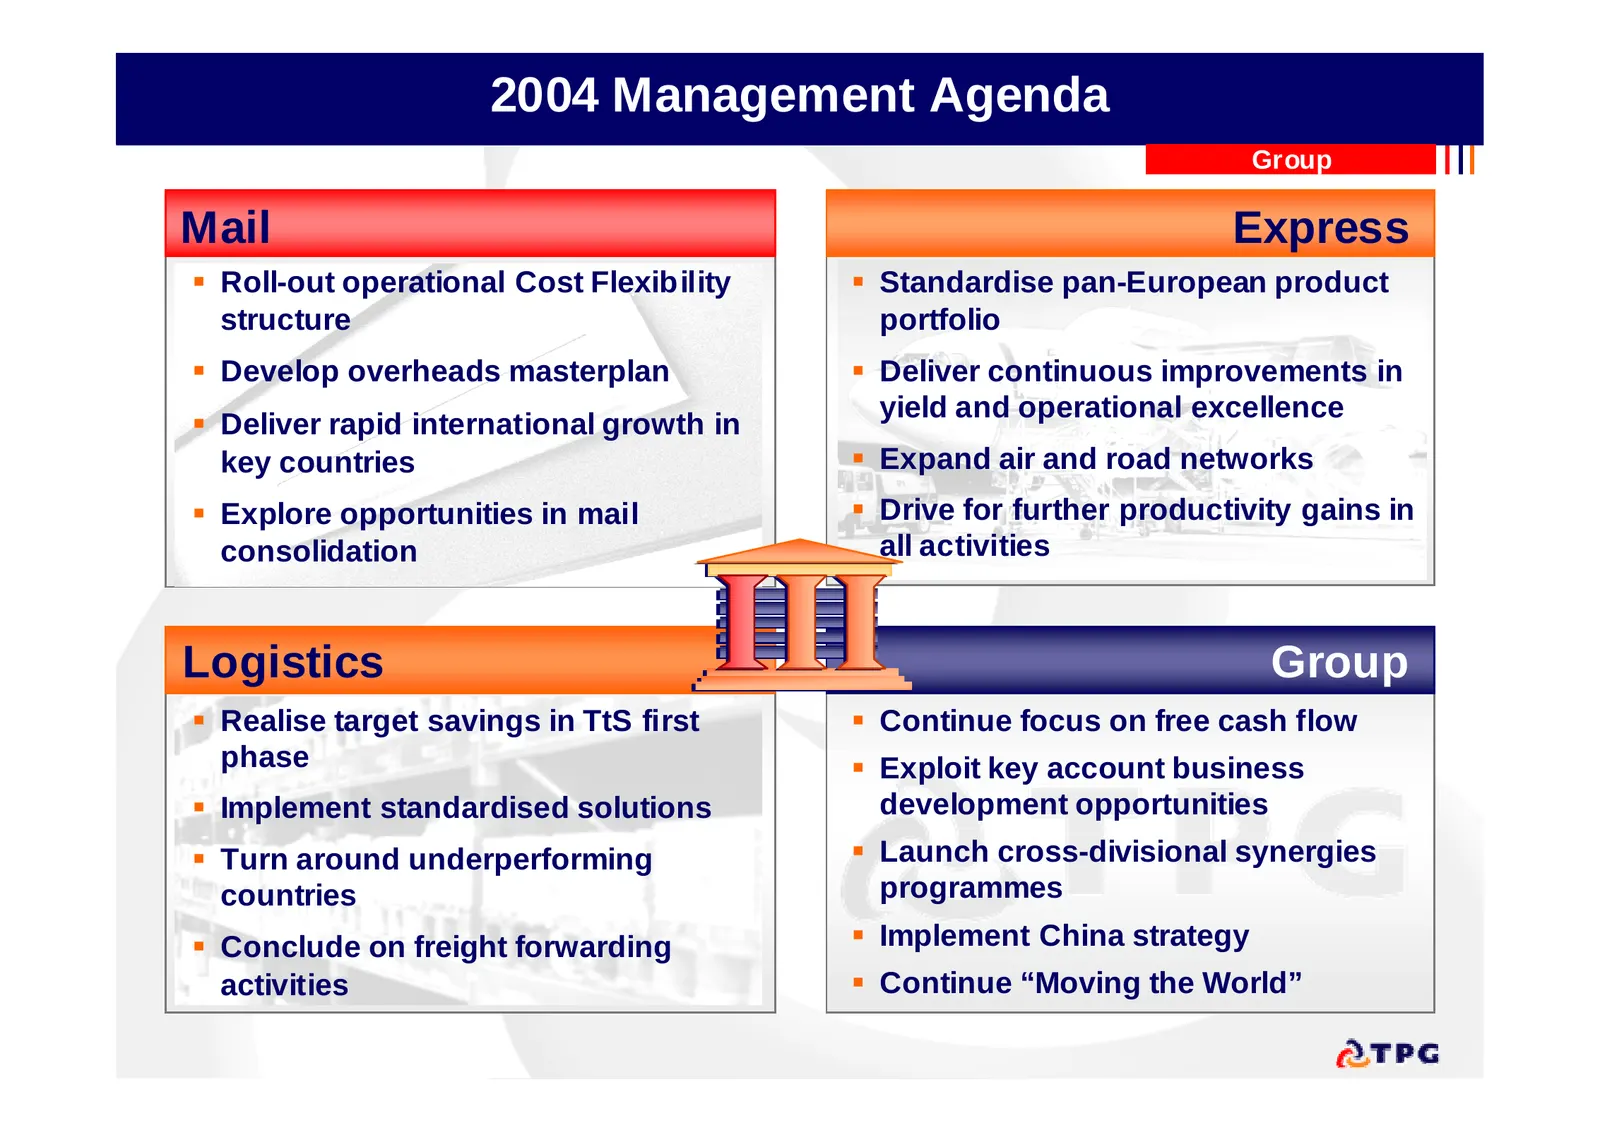
Slide 37: 2004 Management Agenda
2004 Management Agenda Group Mail Express Roll-out operational Cost Flexibility Standardise pan-European product structure portfolio Develop overheads masterplan Deliver continuous improvements in yield and operational excellence Deliver rapid international growth in key countries Expand
Slide 38
Source: Internet Archive copy of tpg.com
More decks from TPG Inc.
 Q2 2026 Earnings Presentation44 slides · Aug 4, 2026
 Q1 2026 Earnings Presentation44 slides · May 1, 2026
 Q4 2025 Earnings Presentation45 slides · Feb 5, 2026
 Merger or Acquisition (January 2026)14 slides · Jan 6, 2026
 Q2 2025 Earnings Presentation44 slides · Aug 6, 2025
 Q1 2025 Earnings Presentation44 slides · May 7, 2025