HomeTrust Bancshares, Inc. · NYSE:HTB
HomeTrust Bancshares — Community Bank Conference (July 2014)
19 slides from HomeTrust Bancshares's conference presentation, Jul 30, 2014
Slide 1: HomeTrust Bancshares, Inc. Community Bank Conference
HometTrust Bancshares /Inc. Community Bank Conference July 30, 2014 x HomeTrust Bancshares, Inc. Lt just bettor here
Slide 2: Forward Looking Statements
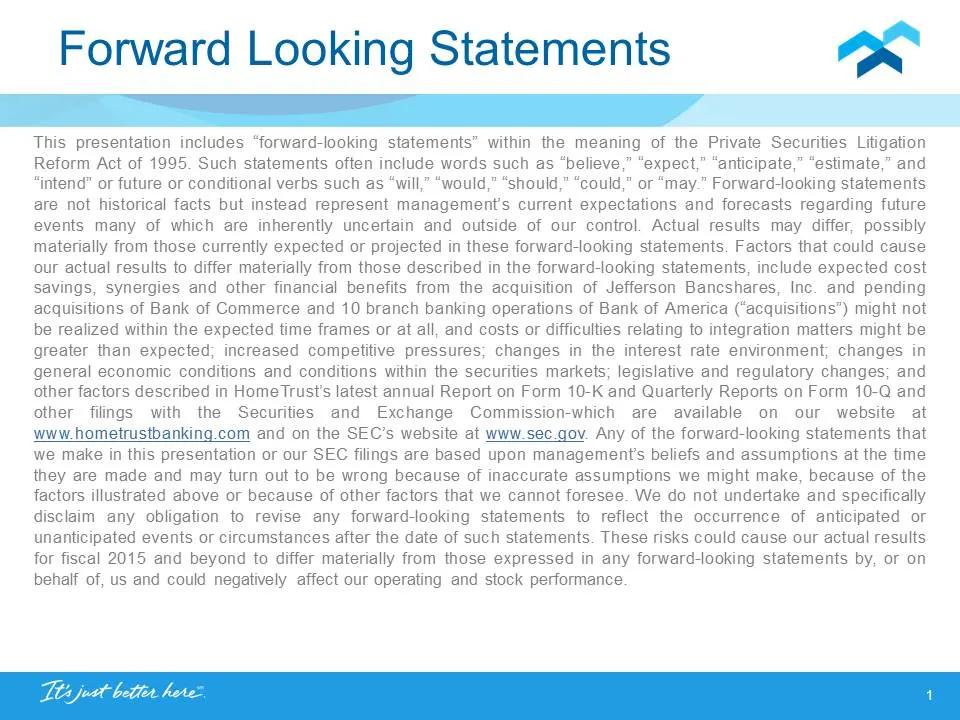
Forward Looking Statements x EEE DS, This presentation includes “forward-looking statements” within the meaning of the Private Securities Litigation Reform Act of 1995. Such statements often include words such as “believe,” “expect,” “anticipate,” “estimate,” and “intend” or future or conditional ve
Slide 3: HomeTrust Bancshares, Inc. Overview
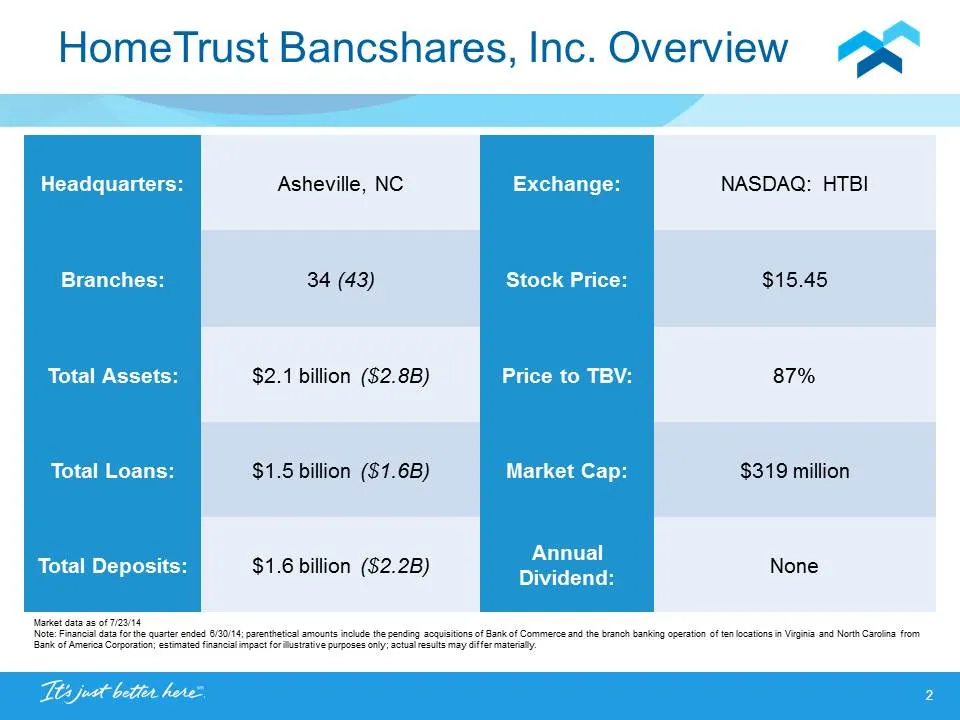
HometTrust Bancshares, Inc. Overview ~*~ Headquarters: Asheville, NC NASDAQ: HTBI Branches: 34 (43) Stock Price: | $15.45, Total Assets: $2.1 billion ($2.8B) Price to TBV: 87% | Total Loans: $1.5 billion ($1.6B) ‘Market Cap: | $319 million | Ttal Denosits:. alr Annual Total Deposits: $1.6 billion ($
Slide 4: Introduction to HomeTrust
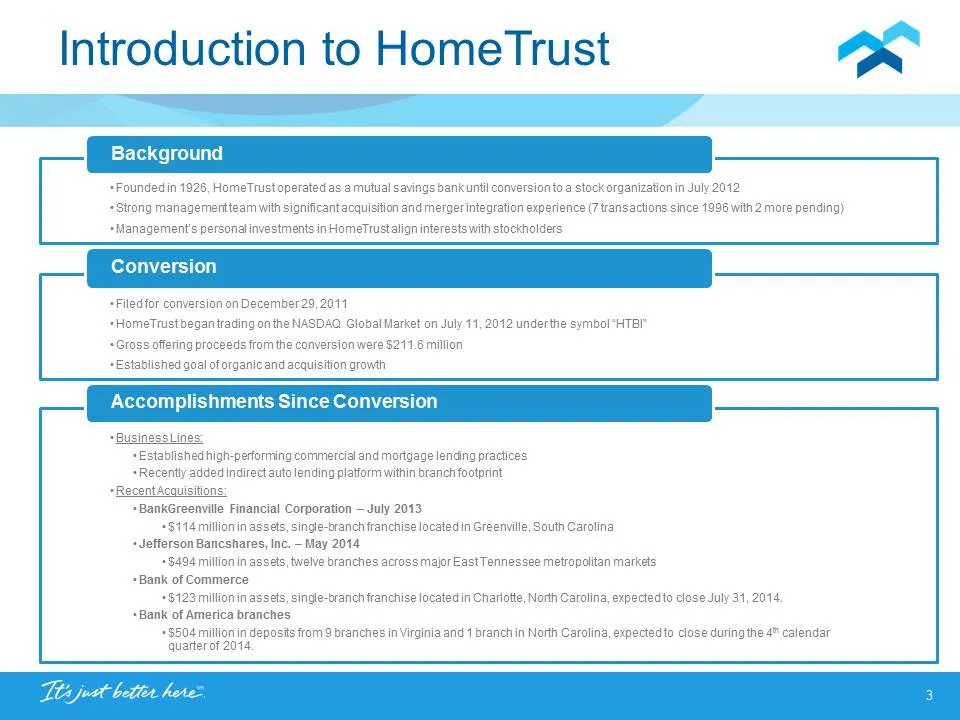
Introduction to HomeTrust mes Background + Foundedin 1926, HomeTrust operated as a mutual savings bankuntil conversion to a stock organization in July 2012 +Strong managementteam with significant acquisition and mergerintegration experience (7 transactions since 1996 with 2 more pending) + Managemen
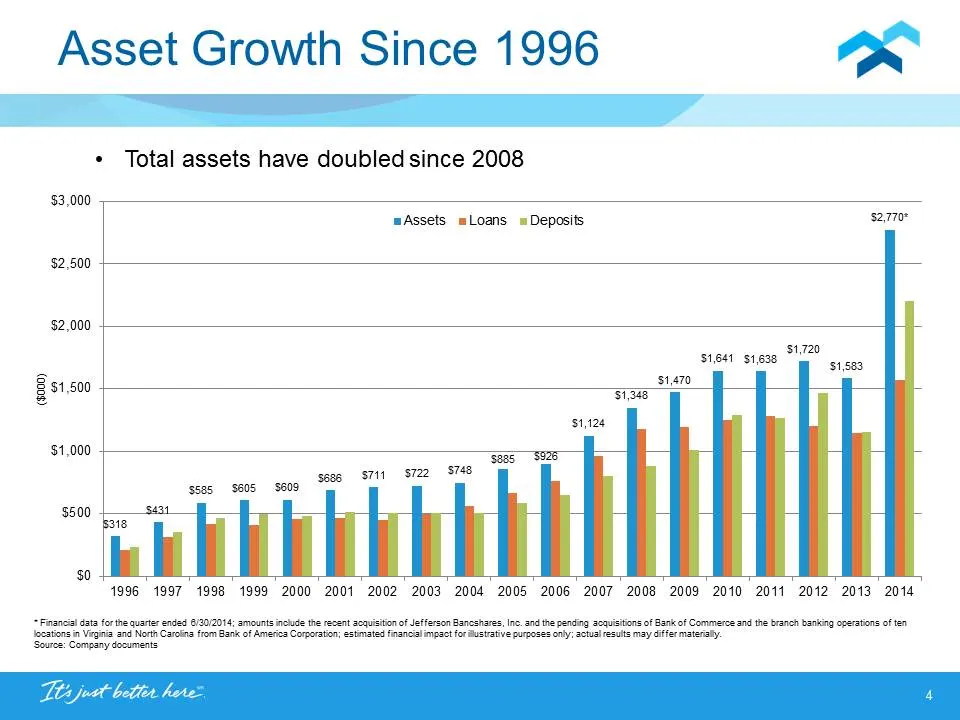
Slide 5: Asset Growth Since 1996
Asset Growth Since 1996 a + Total assets have doubled since 2008 Assets mLoans m= Deposits $2.70" $2,500 $2,000 $1,500 (#000) $1,000 $500 30 1996 1997 1998 1999 2000 2001 2002 2003 2004 2005 2006 2007 2008 2009 2010 2011 2012 2013 2014 Financial data forthe quarter end 6/90/2014; amounts incude the
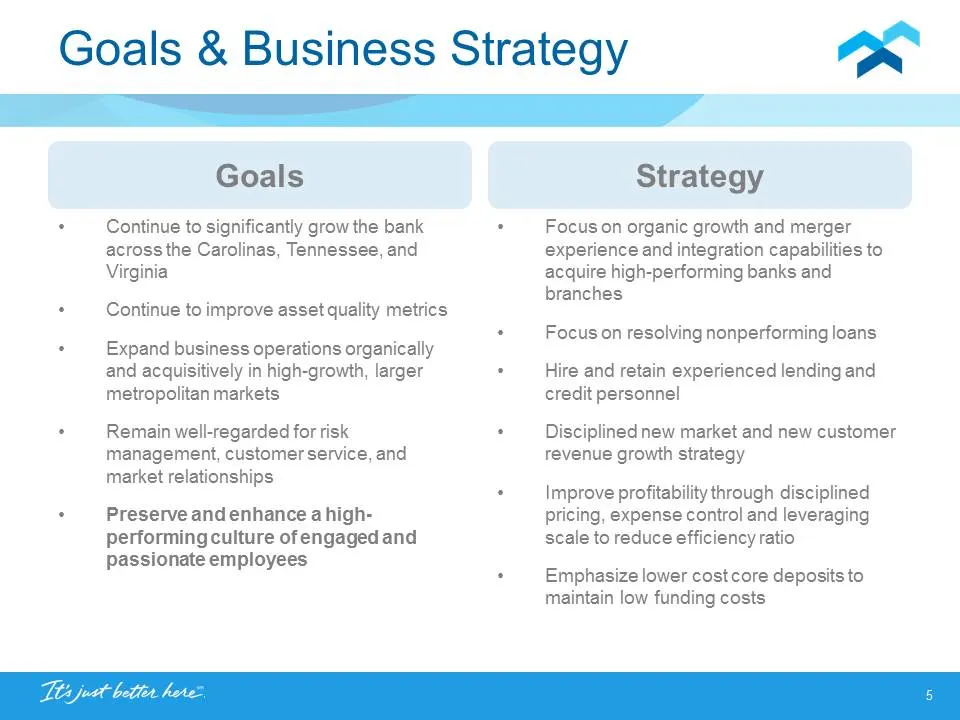
Slide 6: Goals & Business Strategy
Goals & Business Strategy x a Goals Strategy . Continue to significantly grow the bank Focus on organic growth and merger across the Carolinas, Tennessee, and experience and integration capabilities to Virginia acquire high-performing banks and branches . Continue to improve asset quality metrics .
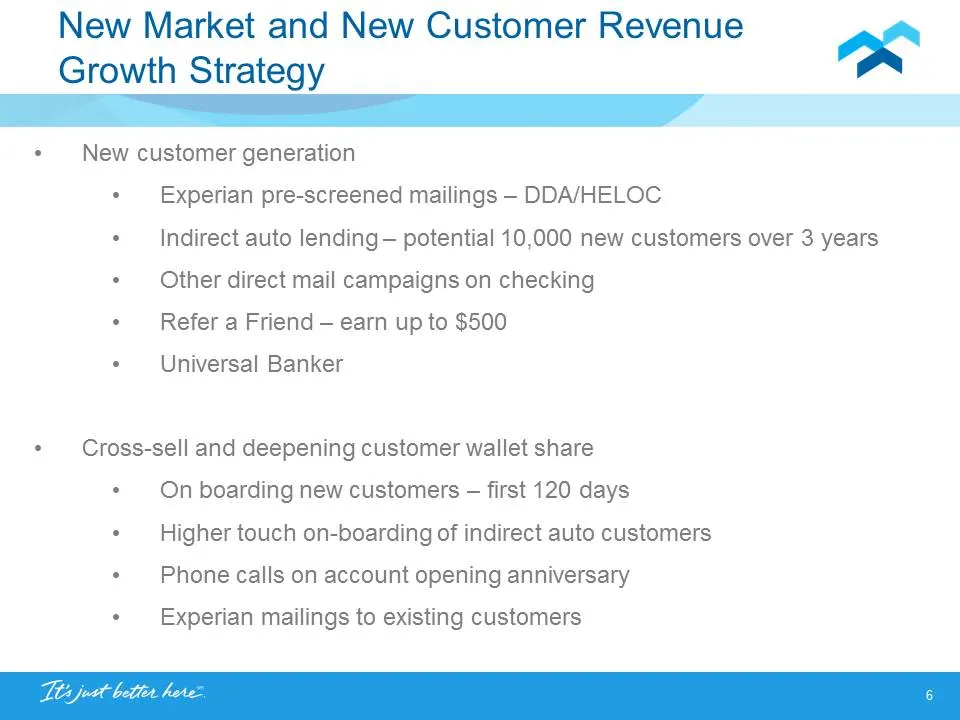
Slide 7: New Market and New Customer Revenue Growth Strategy
New Market and New Customer Revenue x Growth Strategy a EE * New customer generation + Experian pre-screened mailings - DDA/HELOC + Indirect auto lending — potential 10,000 new customers over 3 years + Other direct mail campaigns on checking ¢ Refer a Friend — earn up to $500 + Universal Banker * Cr
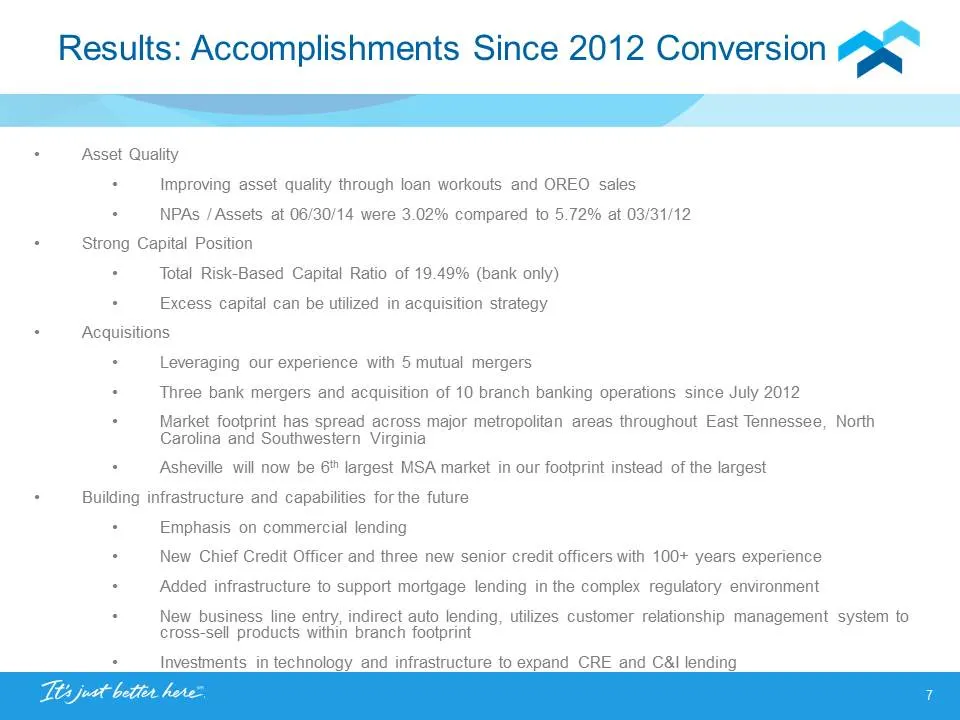
Slide 8: Results: Accomplishments Since 2012 Conversion
Results: Accomplishments Since 2012 Conversion x S iit, _____=____"_"""""¢ + Asset Quality + Improving asset quality through loan workouts and OREO sales + NPAs /Assets at 06/30/14 were 3.02% compared to 5.72% at 03/31/12 + Strong Capital Position + Total Risk-Based Capital Ratio of 19.49% (bank onl
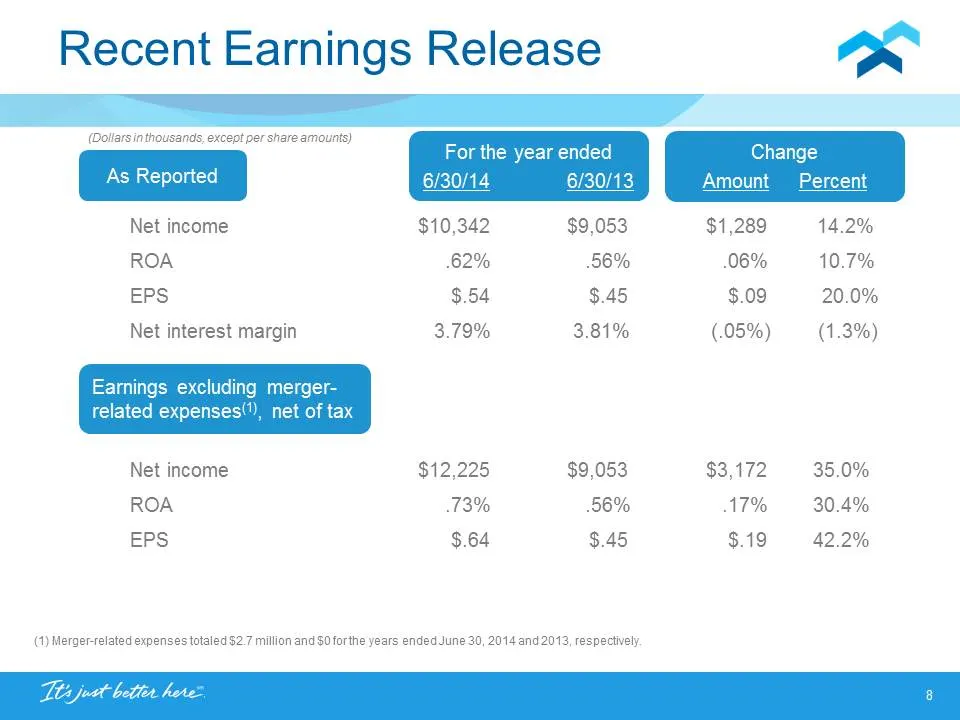
Slide 9: Recent Earnings Release
Recent Earnings Release (Dollars in thousands, except per share amounts) As Reported the year ended 0/14 30/13, Net income $10,342 $9,053 $1,289 14.2% ROA 62% 56% 06% 10.7% EPS $.54 $.45 $.09 20.0% Net interest margin 3.79% 3.81% (.05%) (1.3%) Earnings excluding merger- related expenses"), net of ta
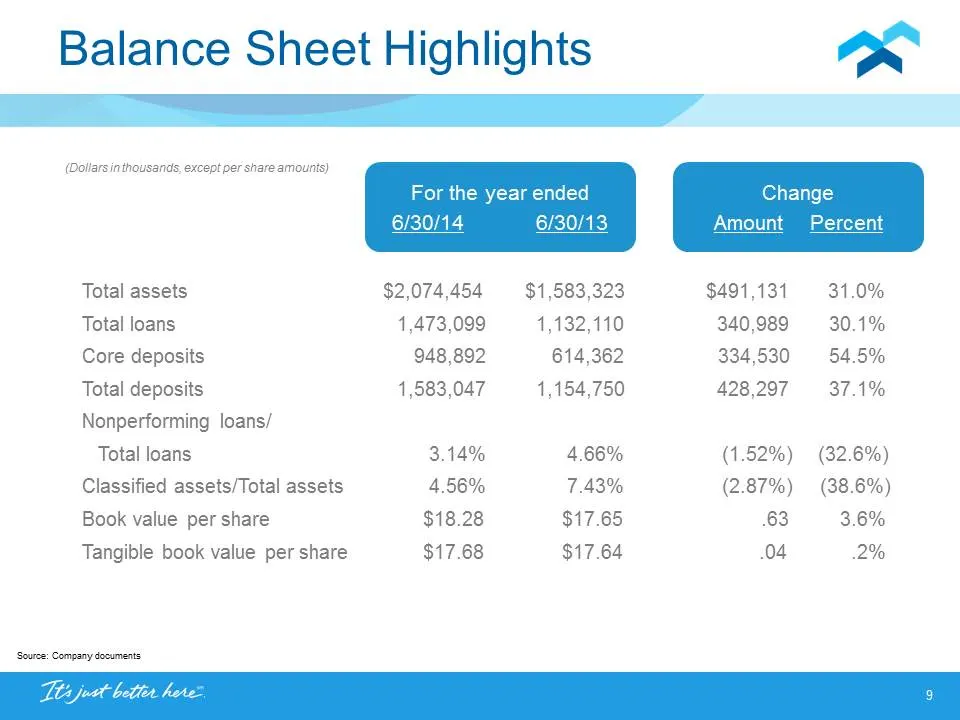
Slide 10: Balance Sheet Highlights
Balance Sheet Highlights x pe wT (Dollars in thousands, except per share amounts) For the year ended Change 6/30/14 6/30/13 Amount Percent Total assets $2,074,454 $1,583,323 $491,131 31.0% Total loans 1,473,099 1,132,110 340,989 30.1% Core deposits 948,892 614,362 334,530 54.5% Total deposits 1,583,
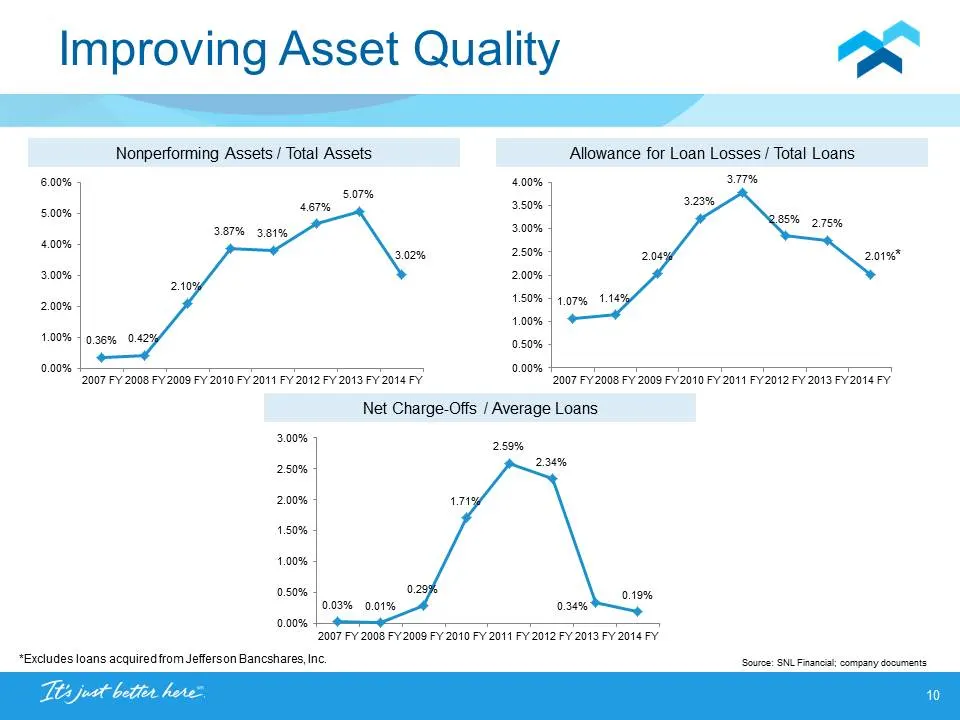
Slide 11: Improving Asset Quality
Improving Asset Quality EEE Nonperforming Assets / Total Assets Allowance for Loan Losses / Total Loans 6.00% 4.00% 5.07% 5.00% 467% 3.50% 3.00% 4.00% a 3.00% 2.00% 2.00% — 1.00% 1.00% | 0.36% 0. 0.50% 0.00% | 0.00% + 2007 FY 2008 FY 2009 FY 2010 FY 2041 FY 2012 FY 2013 FY 2014 FY 2007 FY’ 2008 FY’
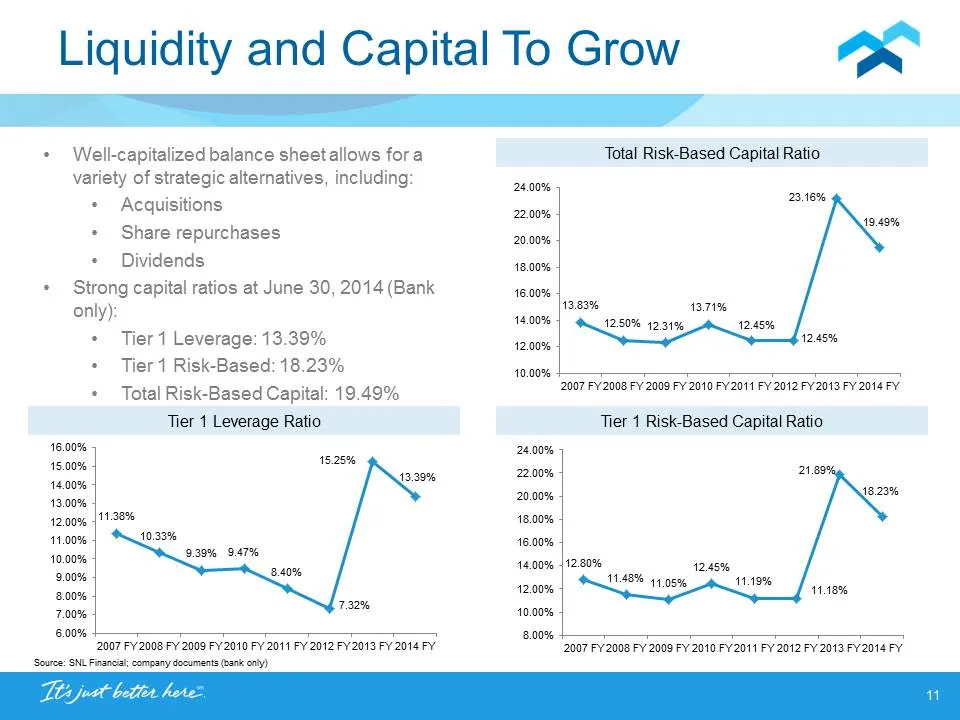
Slide 12: Liquidity and Capital To Grow
Liquidity and Capital To Grow x Well-capitalized balance sheet allows fora variety of strategic alternatives, including: + Acquisitions + Share repurchases + Dividends Strong capital ratios at June 30, 2014 (Bank only): + Tier 1 Leverage: 13.39% + Tier 1 Risk-Based: 18.23% + Total Risk-Based Capital
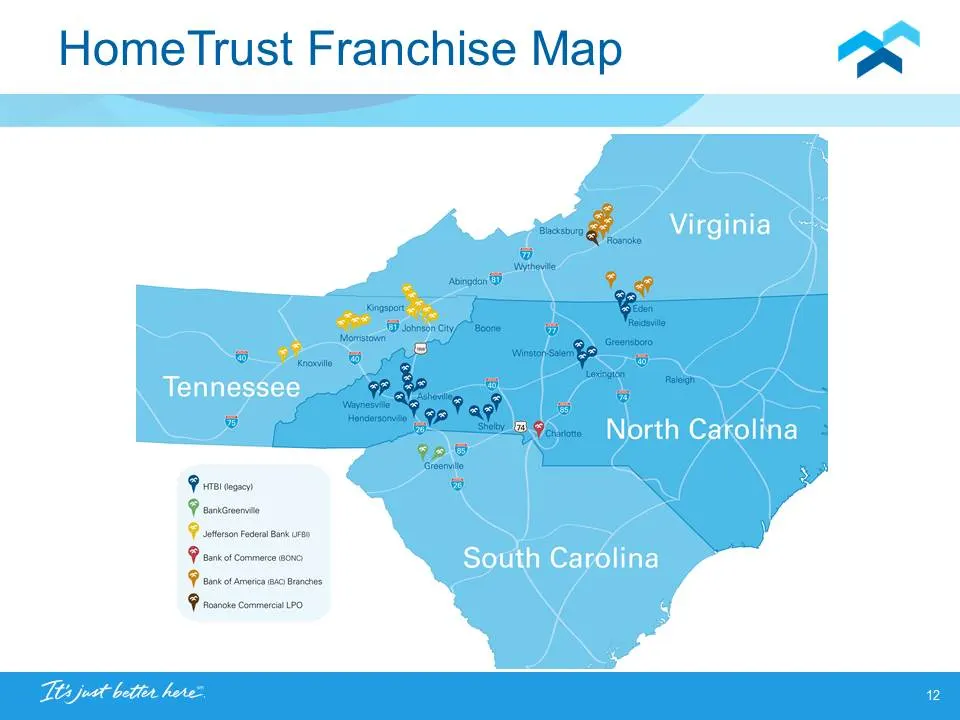
Slide 13: HomeTrust Franchise Map
HometTrust Franchise Map F euncor rmes nc Bncres essen
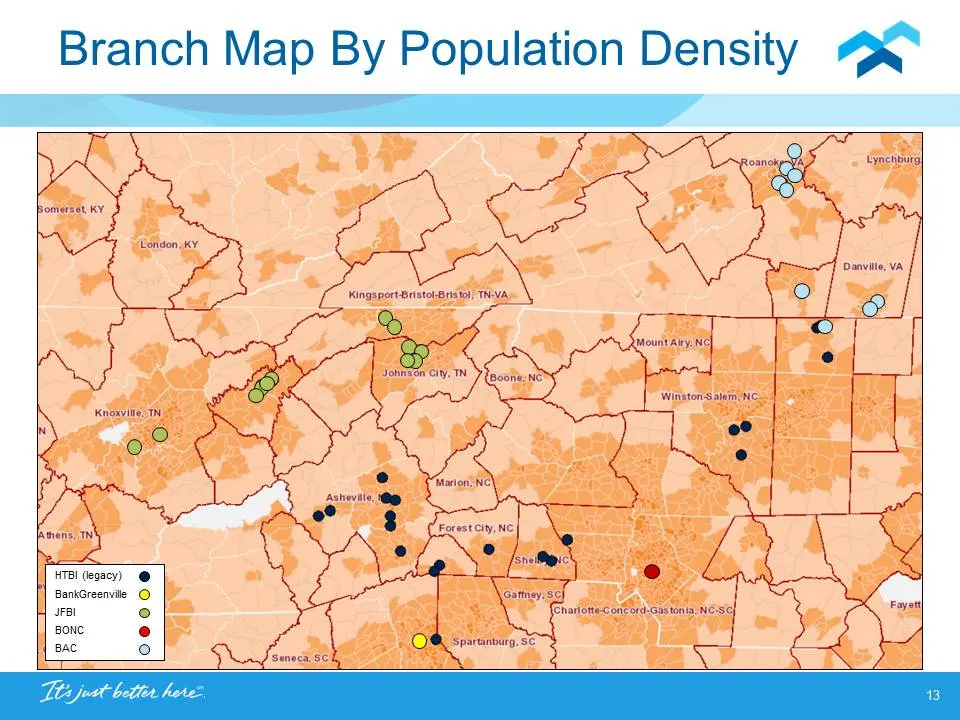
Slide 14: Branch Map By Population Density
Branch Map By Population Density x x HTBI (egacy) @ BankGreenvile © JFBI ce) Bone e BAC °
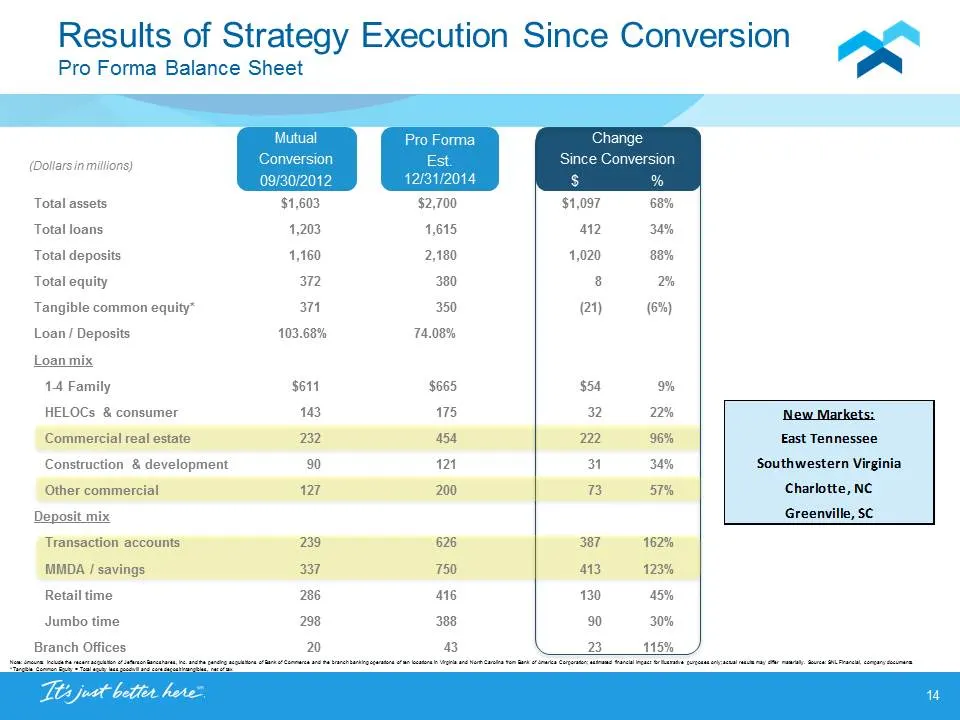
Slide 15: Results of Strategy Execution Since Conversion
Results of Strategy Execution Since Conversion Pro Forma Balance Sheet Pro F ‘orma (Doltarsin milions) Total assets Total loans Total deposits Total equity 372 380 8 2% Tangible common equity* 34 350 (21) (6%) Loan / Deposits 103.68% 74.08% Loan mi: 1.4 Family sent $665 $54 o% HELOCs & consumer ‘New
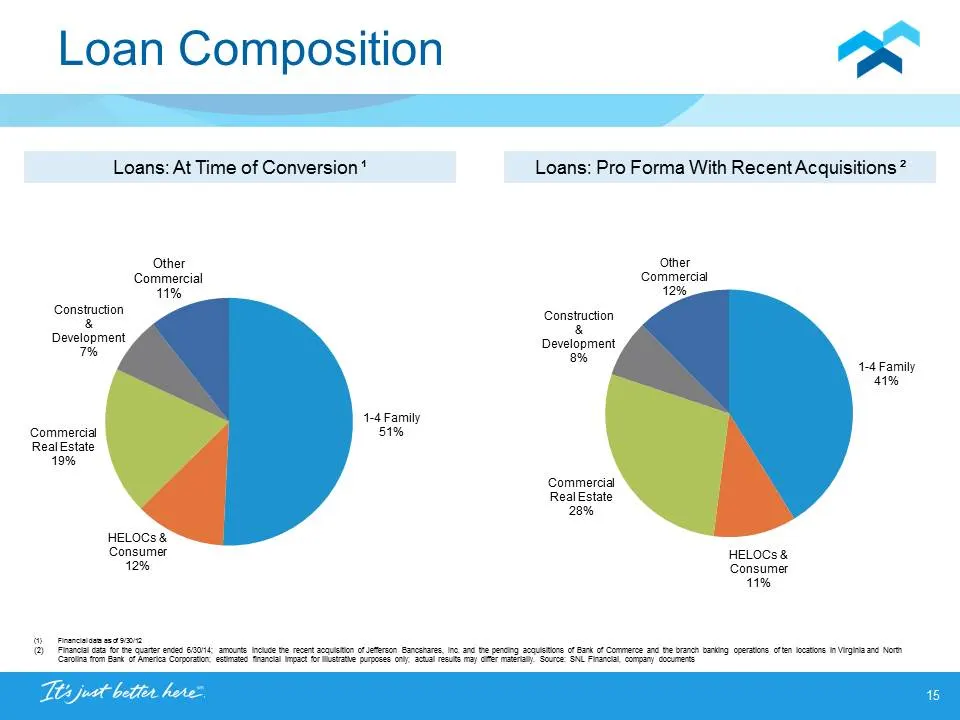
Slide 16: Loan Composition
Loan Composition Loans: At Time of Conversion * Other Commercial 11% Construction & Development 7% 4-4 Family ‘Commercial 51% RealEstate 19% HELOCs & ‘Consumer Loans: Pro Forma With Recent Acquisitions? Construction & Development ae 1-4 Family 41% ‘Commercial RealEstate 28% HELOCs & ‘Consumer 11%
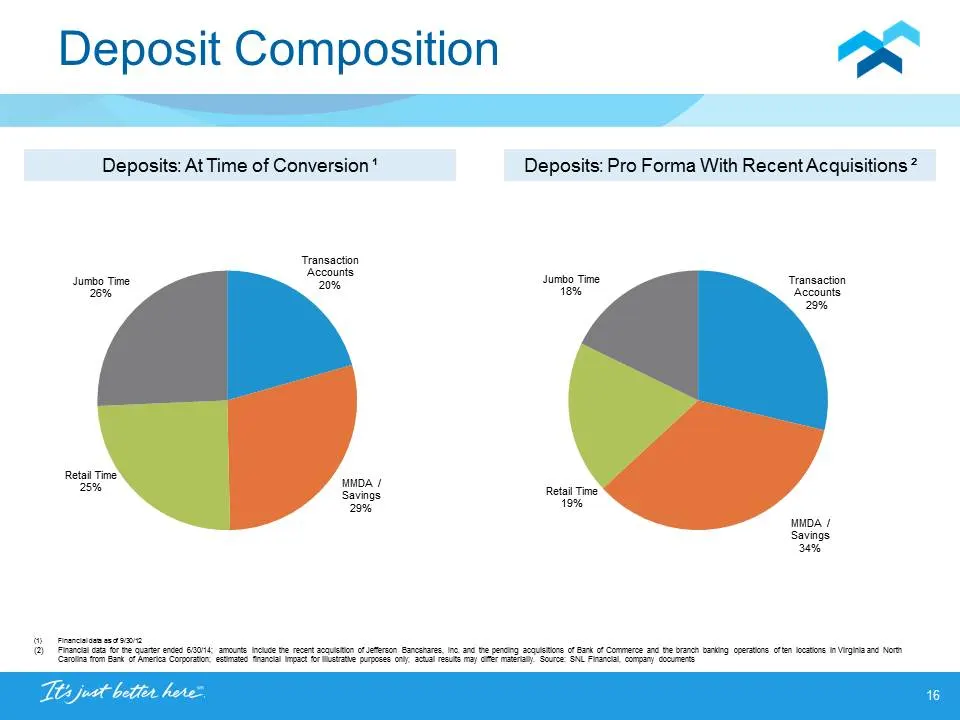
Slide 17: Deposit Composition
Deposit Composition x St Deposits: At Time of Conversion* Deposits: Pro Forma With Recent Acquisitions” ‘Transaction
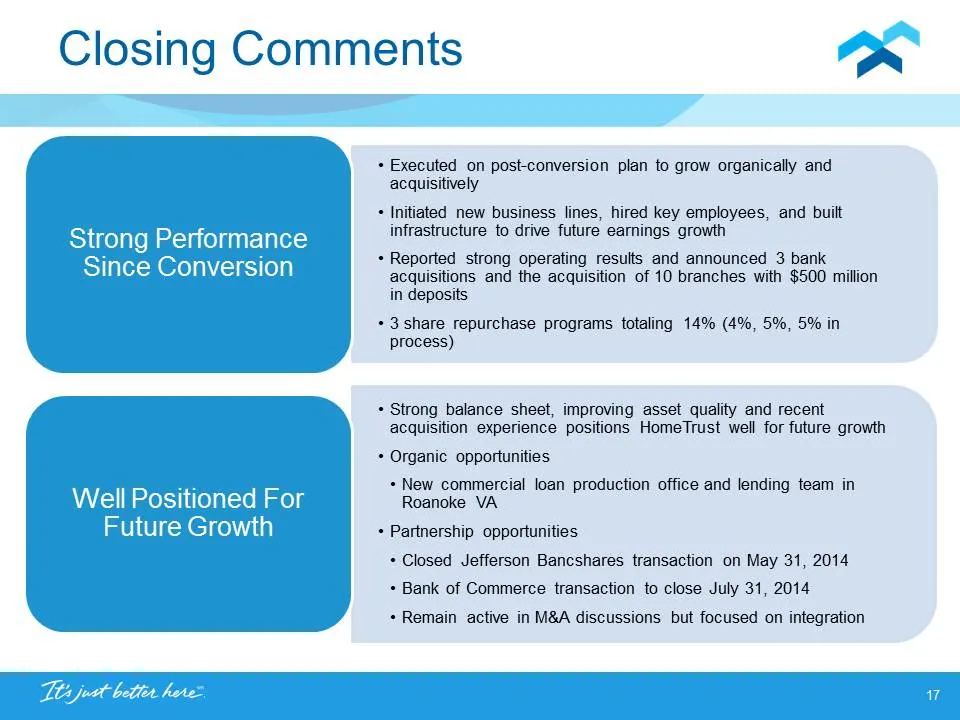
Slide 18: Closing Comments
~ J lo Ss ~~) ng Comments -4 + Executed on post-conversion plan to grow organically and acquisitively + Initiated new business lines, hired key employees, and built infrastructure to drive future earnings growth + Reported strong operating results and announced 3 bank acquisitions and the acquisitio
Slide 19: Investor Contacts
Investor Contacts x EEE Dana Stonestreet Chairman, President & CEO Tony VunCannon Senior VP, CFO & Treasurer 10 Woodfin Street Asheville, NC 28801 (828) 259-3939 www.hometrustbanking.com
Source: SEC EDGAR · 8-K filed Jul 30, 2014
More decks from HomeTrust Bancshares, Inc.
 Q3 2026 Earnings Presentation41 slides · October 2026
 Q2 2026 Earnings Presentation32 slides · July 2026
 Q1 2026 Earnings Presentation32 slides · Apr 23, 2026
 Q4 2025 Earnings Presentation32 slides · Jan 22, 2026
 Q3 2025 Earnings Presentation32 slides · Oct 22, 2025
 Q2 2025 Earnings Presentation34 slides · Jul 28, 2025