El Paso Pipeline Partners L.P.
El Paso Pipeline Partners L.P — Merger or Acquisition (August 2014)
33 slides from El Paso Pipeline Partners L.P's merger presentation, Aug 20, 2014
Slide 1: Run By Shareholders, For Shareholders
Run By Shareholders, For Shareholders Steve Kean President & Chief Operating Officer August 20-21, 2014
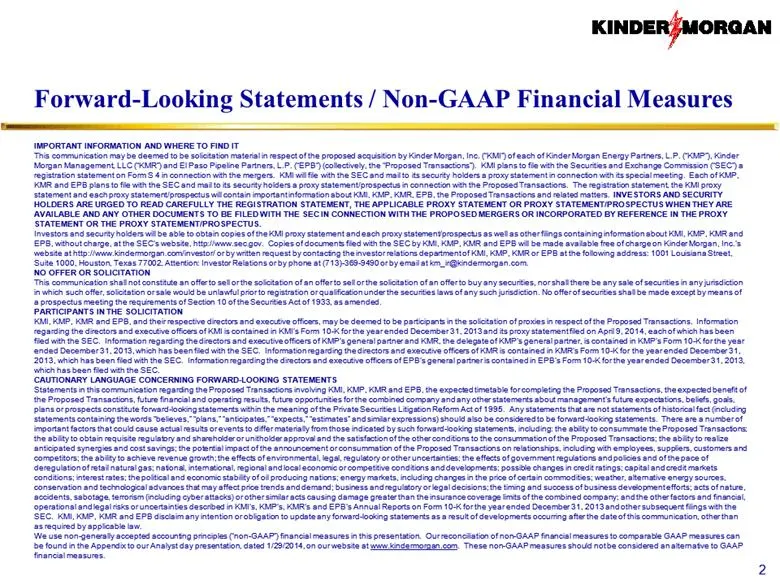
Slide 2: Forward-Looking Statements / Non-GAAP Financial Measures
Forward-Looking Statements / Non-GAAP Financial Measures IMPORTANT INFORMATION AND WHERE TO FIND IT This communication may be deemed to be solicitation material in respect of the proposed acquisition by Kinder Morgan, Inc. (“KMI”) of each of Kinder Morgan Energy Partners, L.P. (“KMP”), Kinder Morgan
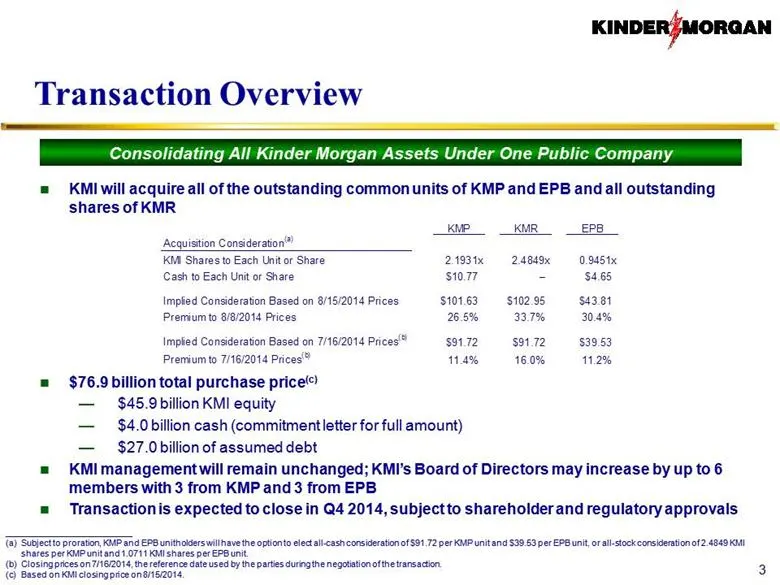
Slide 3: Transaction Overview
Transaction Overview KMI will acquire all of the outstanding common units of KMP and EPB and all outstanding shares of KMR $76.9 billion total purchase price(c) $45.9 billion KMI equity $4.0 billion cash (commitment letter for full amount) $27.0 billion of assumed debt KMI management will remain unc
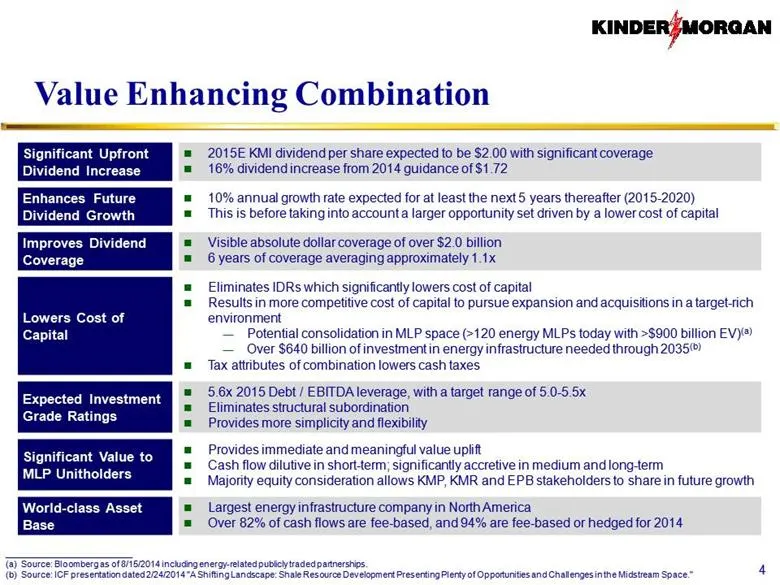
Slide 4: Value Enhancing Combination
Value Enhancing Combination Significant Upfront Dividend Increase 2015E KMI dividend per share expected to be $2.00 with significant coverage 16% dividend increase from 2014 guidance of $1.72 Enhances Future Dividend Growth 10% annual growth rate expected for at least the next 5 years thereafter (20
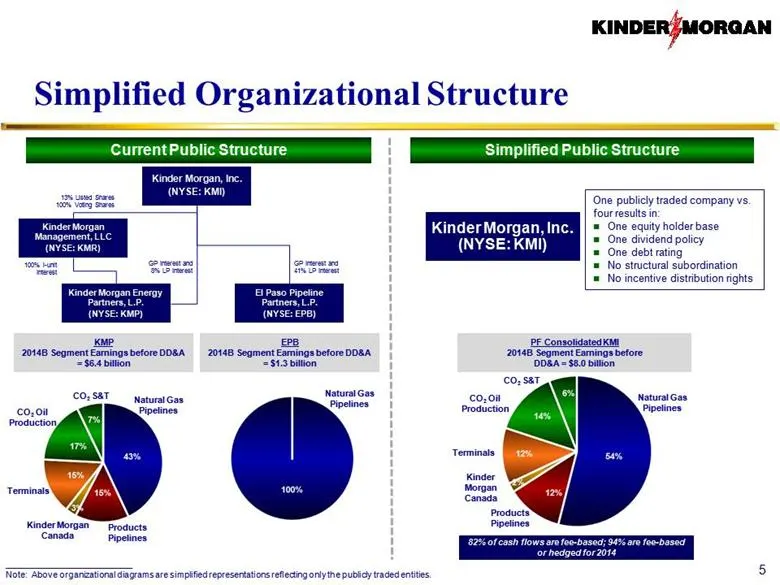
Slide 5: Simplified Organizational Structure
Simplified Organizational Structure Current Public Structure Simplified Public Structure 5 __________________________ Note: Above organizational diagrams are simplified representations reflecting only the publicly traded entities. CO2 Oil Production CO2 S&T Natural Gas Pipelines Products Pipelines K
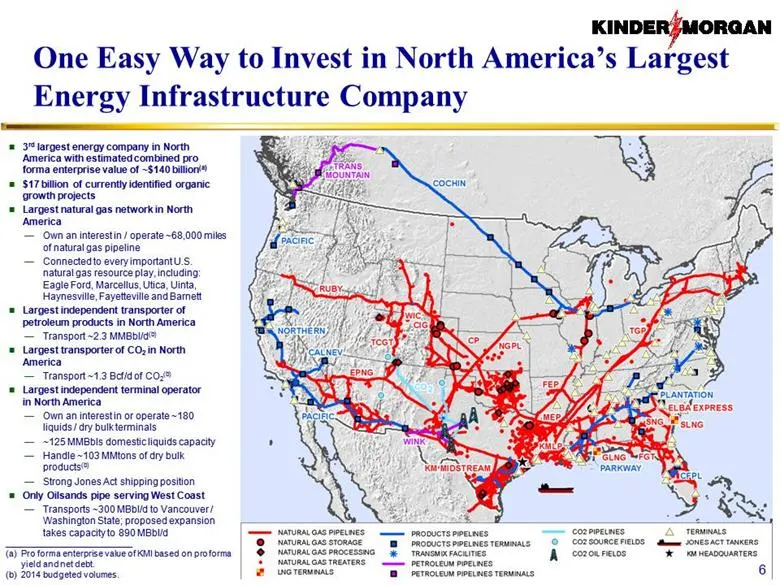
Slide 6: One Easy Way to Invest in North America's Largest Energy Infrastructure Company
One Easy Way to Invest in North America’s Largest Energy Infrastructure Company 3rd largest energy company in North America with estimated combined pro forma enterprise value of ~$140 billion(a) $17 billion of currently identified organic growth projects Largest natural gas network in North America
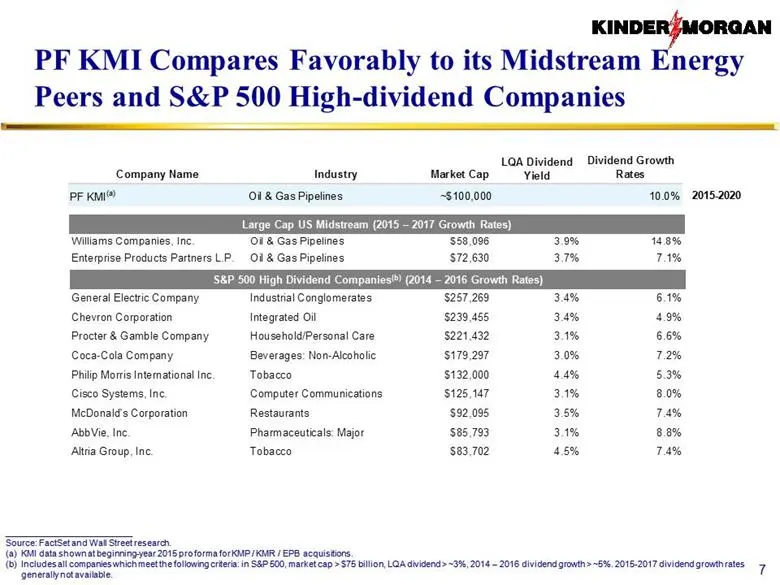
Slide 7: PF KMI Compares Favorably to its Midstream Energy Peers and S&P 500 High-dividend Companies
PF KMI Compares Favorably to its Midstream Energy Peers and S&P 500 High-dividend Companies 7 __________________________ Source: FactSet and Wall Street research. KMI data shown at beginning-year 2015 pro forma for KMP / KMR / EPB acquisitions. Includes all companies which meet the following criteri
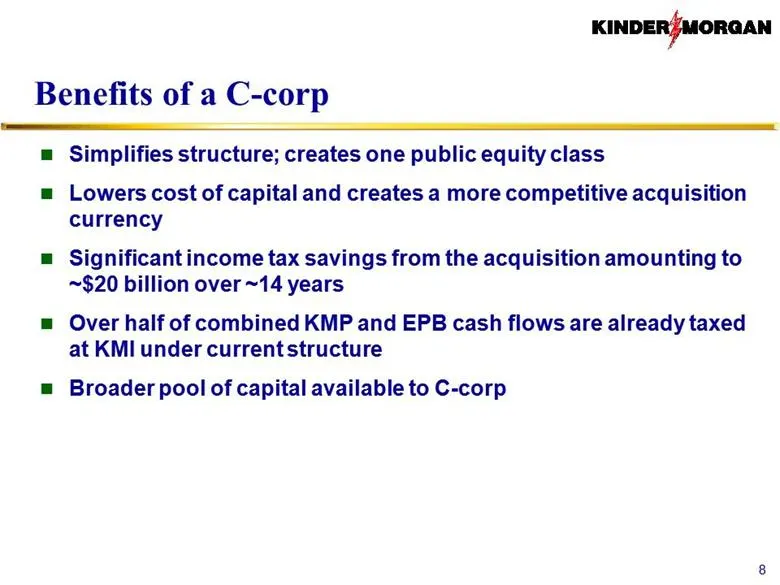
Slide 8: Benefits of a C-corp
Benefits of a C-corp Simplifies structure; creates one public equity class Lowers cost of capital and creates a more competitive acquisition currency Significant income tax savings from the acquisition amounting to ~$20 billion over ~14 years Over half of combined KMP and EPB cash flows are already
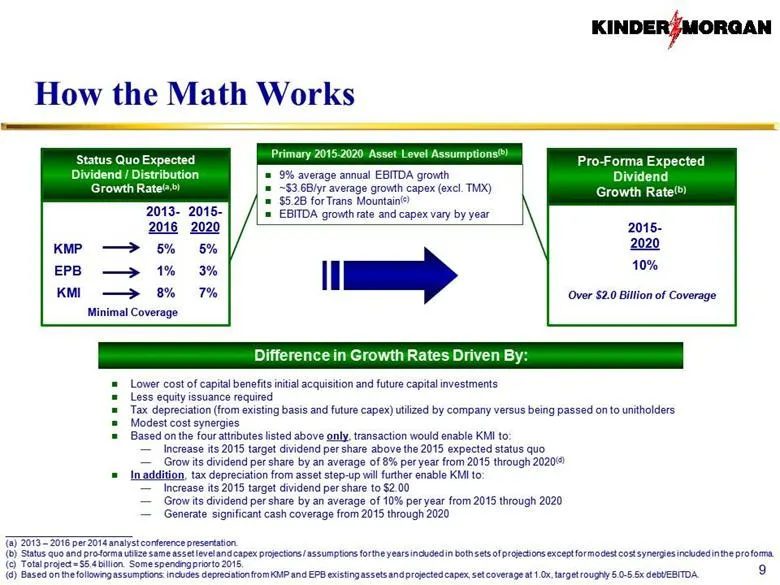
Slide 9: How the Math Works
How the Math Works Lower cost of capital benefits initial acquisition and future capital investments Less equity issuance required Tax depreciation (from existing basis and future capex) utilized by company versus being passed on to unitholders Modest cost synergies Based on the four attributes list
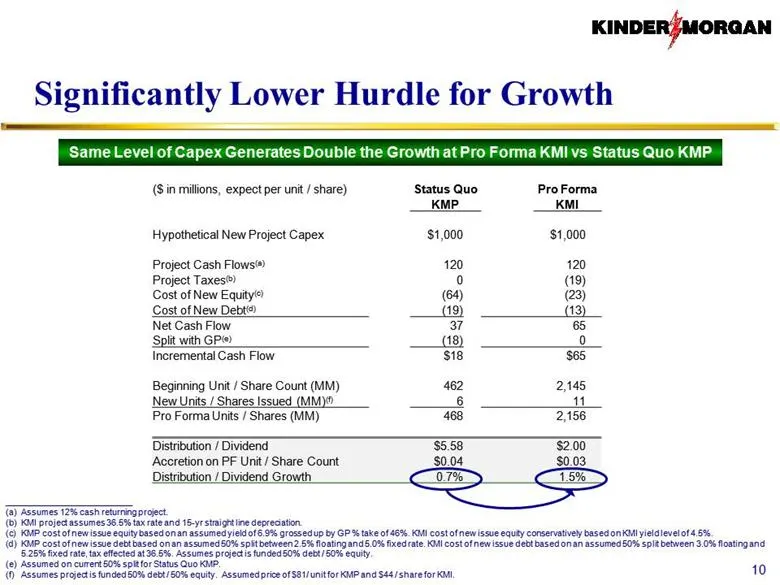
Slide 10: Significantly Lower Hurdle for Growth
Significantly Lower Hurdle for Growth 10 Same Level of Capex Generates Double the Growth at Pro Forma KMI vs Status Quo KMP ($ in millions, expect per unit / share) Status Quo Pro Forma KMP KMI Hypothetical New Project Capex $1,000 $1,000 Project Cash Flows(a) 120 120 Project Taxes(b) 0 (19) Cost of
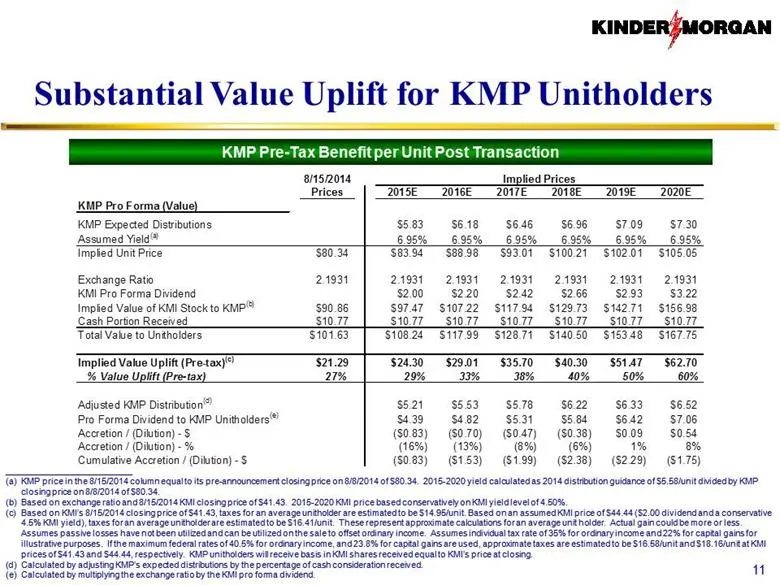
Slide 11: Substantial Value Uplift for KMP Unitholders
Substantial Value Uplift for KMP Unitholders 11 KMP Pre-Tax Benefit per Unit Post Transaction __________________________ KMP price in the 8/15/2014 column equal to its pre-announcement closing price on 8/8/2014 of $80.34. 2015-2020 yield calculated as 2014 distribution guidance of $5.58/unit divided
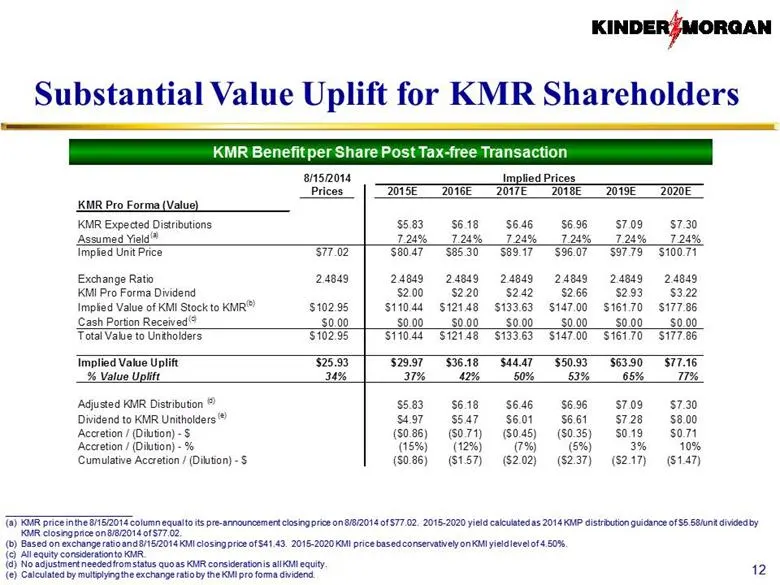
Slide 12: Substantial Value Uplift for KMR Shareholders
Substantial Value Uplift for KMR Shareholders 12 KMR Benefit per Share Post Tax-free Transaction __________________________ KMR price in the 8/15/2014 column equal to its pre-announcement closing price on 8/8/2014 of $77.02. 2015-2020 yield calculated as 2014 KMP distribution guidance of $5.58/unit
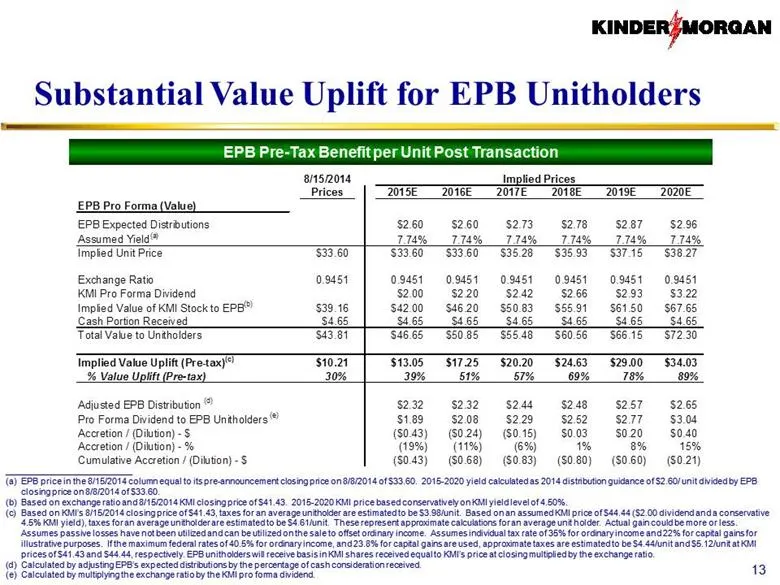
Slide 13: Substantial Value Uplift for EPB Unitholders
Substantial Value Uplift for EPB Unitholders 13 EPB Pre-Tax Benefit per Unit Post Transaction __________________________ EPB price in the 8/15/2014 column equal to its pre-announcement closing price on 8/8/2014 of $33.60. 2015-2020 yield calculated as 2014 distribution guidance of $2.60/ unit divide
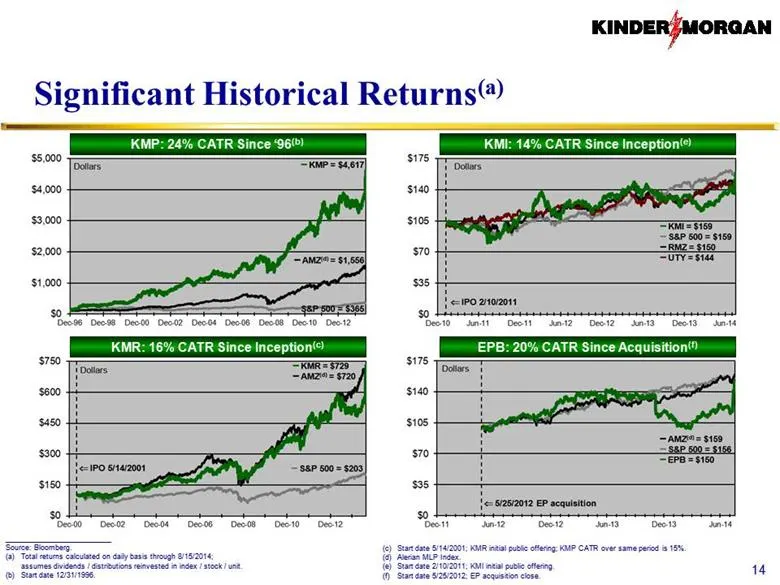
Slide 14: Significant Historical Returns
Significant Historical Returns(a) KMI: 14% CATR Since Inception(e) KMP: 24% CATR Since ‘96(b) KMR: 16% CATR Since Inception(c) __________________________ Source: Bloomberg. Total returns calculated on daily basis through 8/15/2014; assumes dividends / distributions reinvested in index / stock / unit
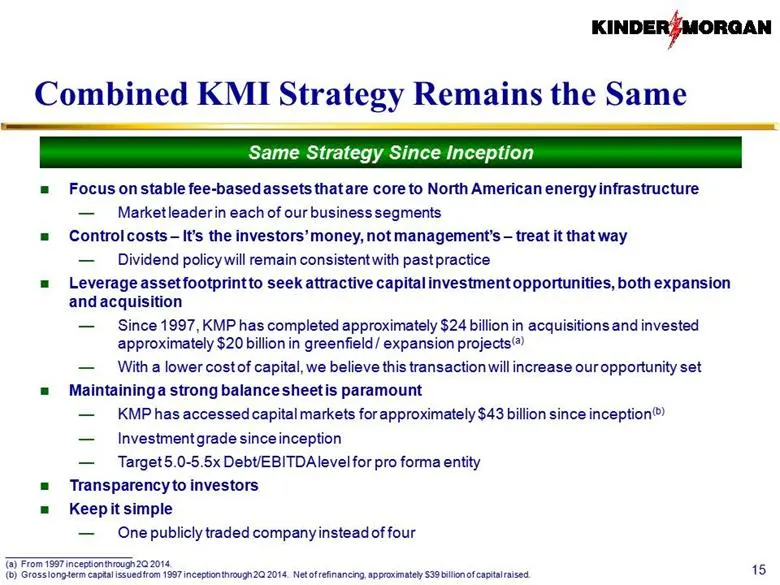
Slide 15: Combined KMI Strategy Remains the Same
Combined KMI Strategy Remains the Same Focus on stable fee-based assets that are core to North American energy infrastructure Market leader in each of our business segments Control costs – It’s the investors’ money, not management’s – treat it that way Dividend policy will remain consistent with pas
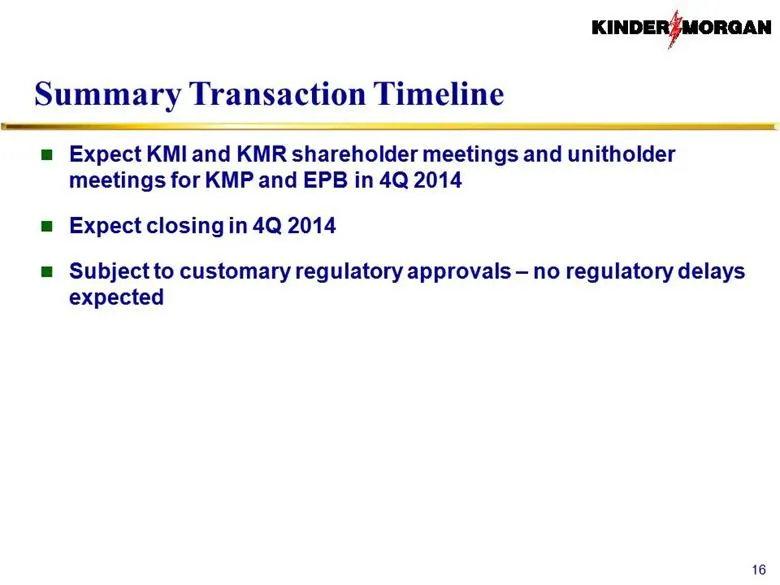
Slide 16: Summary Transaction Timeline
Summary Transaction Timeline Expect KMI and KMR shareholder meetings and unitholder meetings for KMP and EPB in 4Q 2014 Expect closing in 4Q 2014 Subject to customary regulatory approvals – no regulatory delays expected 16
Slide 17: Appendix
Appendix KINDER/MORQAN
Slide 18: Cross-guarantees Overview
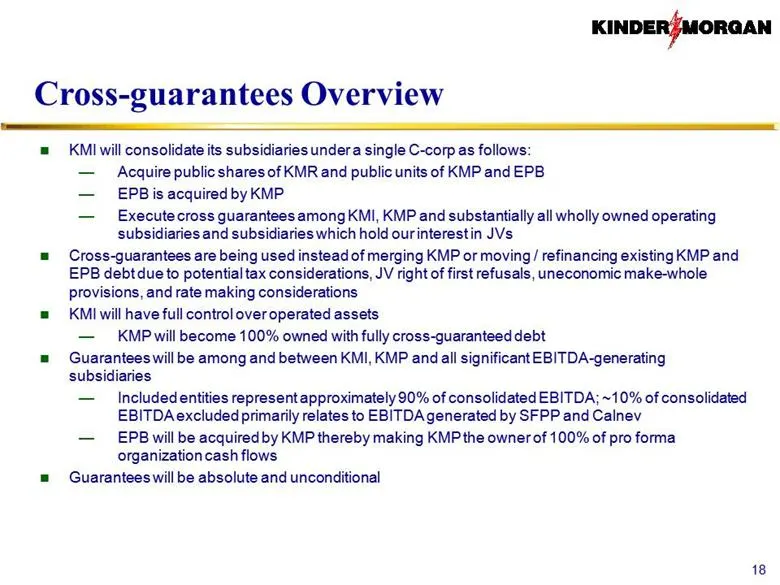
Cross-guarantees Overview KMI will consolidate its subsidiaries under a single C-corp as follows: Acquire public shares of KMR and public units of KMP and EPB EPB is acquired by KMP Execute cross guarantees among KMI, KMP and substantially all wholly owned operating subsidiaries and subsidiaries whi
Slide 19: Years of Consistent Growth at KMP
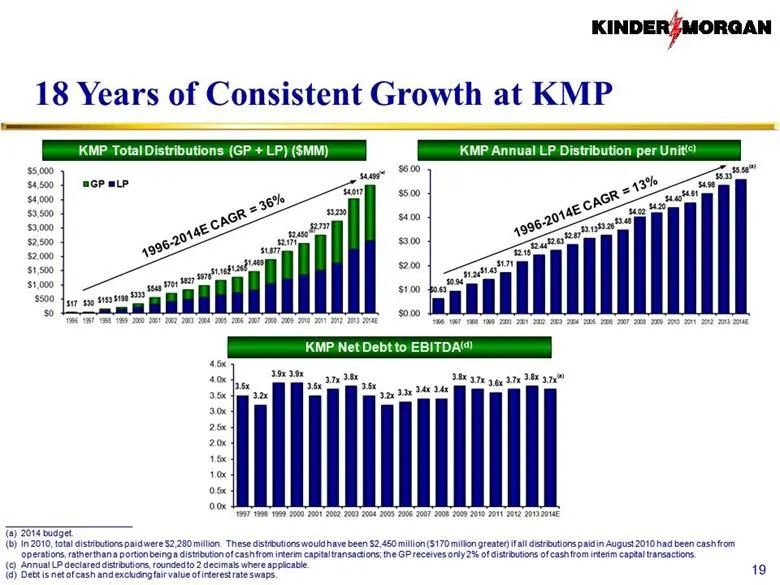
18 Years of Consistent Growth at KMP 1996-2014E CAGR = 36% KMP Total Distributions (GP + LP) ($MM) KMP Annual LP Distribution per Unit(c) KMP Net Debt to EBITDA(d) __________________________ 2014 budget. In 2010, total distributions paid were $2,280 million. These distributions would have been $2,45
Slide 20: Financial Rigor: Promises Made, Promises Kept
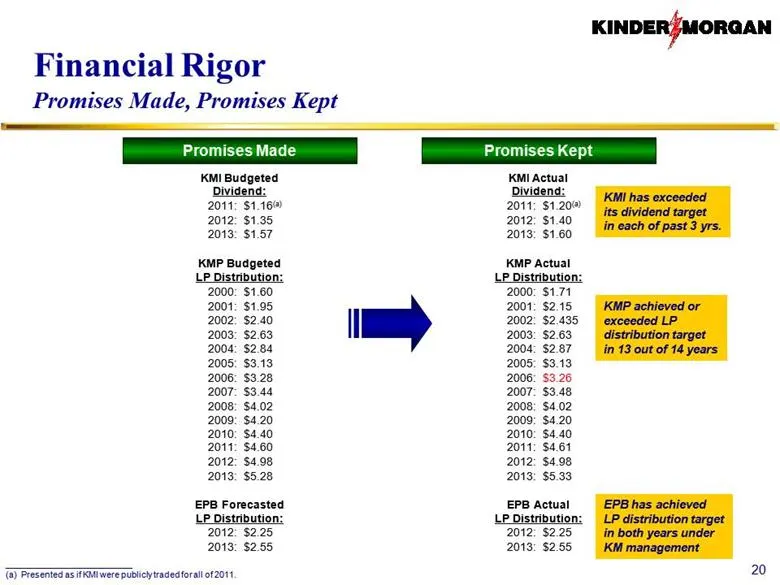
Financial Rigor Promises Made, Promises Kept KMI Budgeted Dividend: 2011: $1.16(a) 2012: $1.35 2013: $1.57 KMP Budgeted LP Distribution: 2000: $1.60 2001: $1.95 2002: $2.40 2003: $2.63 2004: $2.84 2005: $3.13 2006: $3.28 2007: $3.44 2008: $4.02 2009: $4.20 2010: $4.40 2011: $4.60 2012: $4.98 2013: $
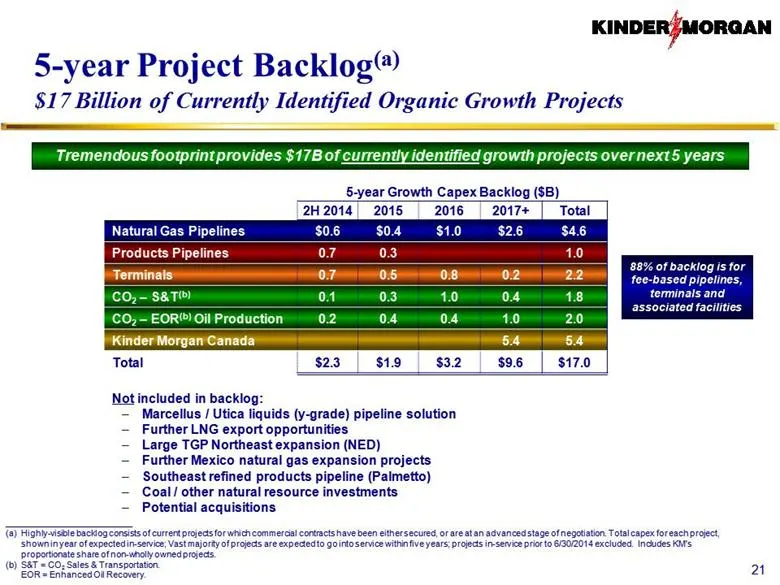
Slide 21: 5-year Growth Capex Backlog
5-year Growth Capex Backlog ($B) 2H 2014 2015 2016 2017+ Total Natural Gas Pipelines $0.6 $0.4 $1.0 $2.6 $4.6 Products Pipelines 0.7 0.3 1.0 Terminals 0.7 0.5 0.8 0.2 2.2 CO2 – S&T(b) 0.1 0.3 1.0 0.4 1.8 CO2 – EOR(b) Oil Production 0.2 0.4 0.4 1.0 2.0 Kinder Morgan Canada 5.4 5.4 Total $2.3 $1.9 $3.
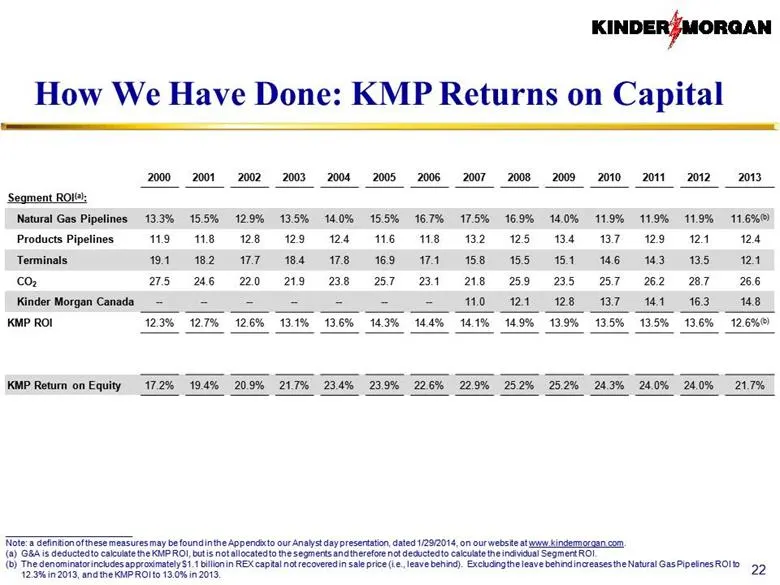
Slide 22: How We Have Done: KMP Returns on Capital
How We Have Done: KMP Returns on Capital 2000 2001 2002 2003 2004 2005 2006 2007 2008 2009 2010 2011 2012 2013 Segment ROI(a): Natural Gas Pipelines 13.3% 15.5% 12.9% 13.5% 14.0% 15.5% 16.7% 17.5% 16.9% 14.0% 11.9% 11.9% 11.9% 11.6%(b) Products Pipelines 11.9 11.8 12.8 12.9 12.4 11.6 11.8 13.2 12.5
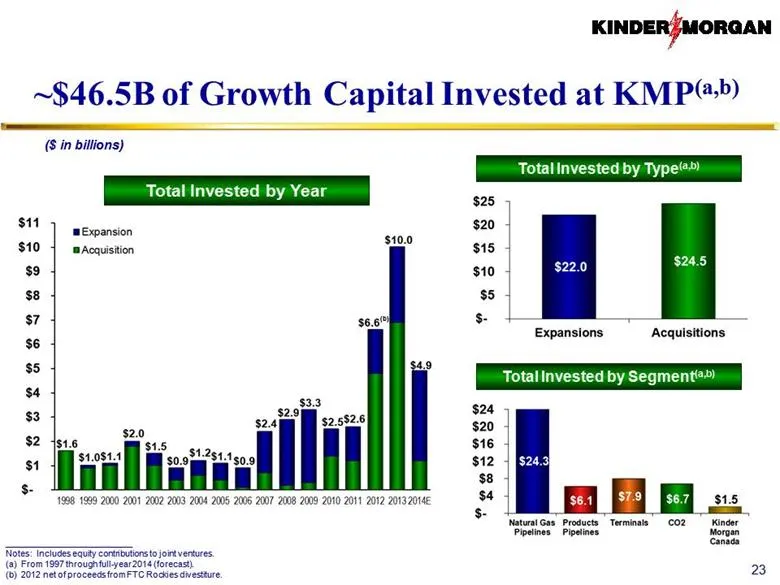
Slide 23: ~$46.5B of Growth Capital Invested at KMP
($ in billions) __________________________ Notes: Includes equity contributions to joint ventures. From 1997 through full-year 2014 (forecast). 2012 net of proceeds from FTC Rockies divestiture. Total Invested by Type(a,b) Total Invested by Segment(a,b) Total Invested by Year ~$46.5B of Growth Capit
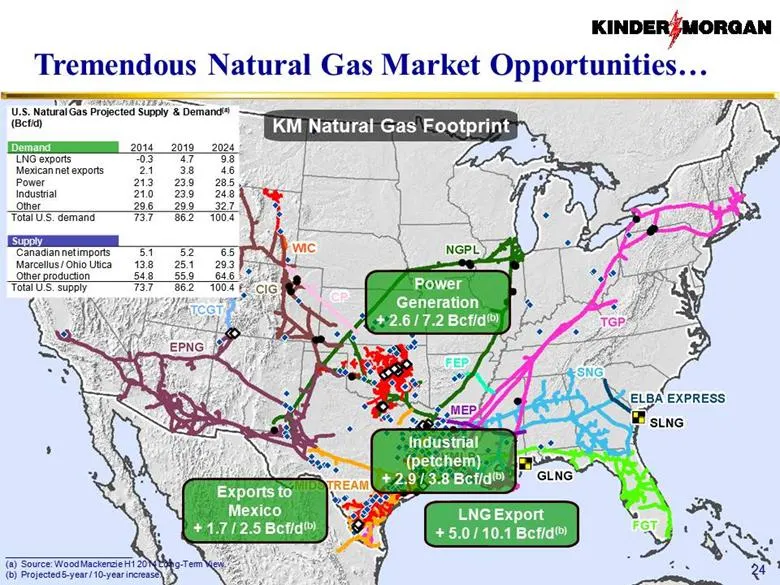
Slide 24: Tremendous Natural Gas Market Opportunities
Tremendous Natural Gas Market Opportunities 24 Power Generation + 2.6 / 7.2 Bcf/d(b) Industrial (petchem) + 2.9 / 3.8 Bcf/d(b) LNG Export + 5.0 / 10.1 Bcf/d(b) Exports to Mexico + 1.7 / 2.5 Bcf/d(b) KM Natural Gas Footprint __________________________ Source: Wood Mackenzie H1 2014 Long-Term View. Pr
Slide 25: Generating Real-time, Long-term Benefits
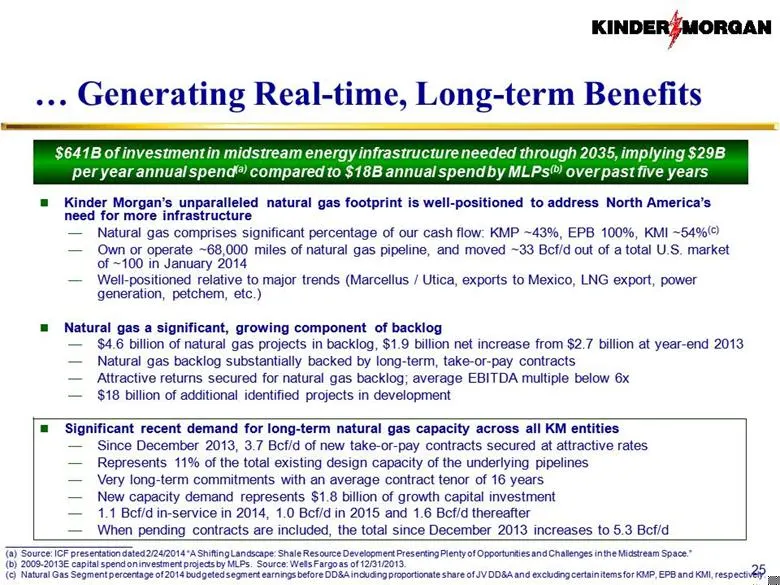
Generating Real-time, Long-term Benefits Kinder Morgan’s unparalleled natural gas footprint is well-positioned to address North America’s need for more infrastructure Natural gas comprises significant percentage of our cash flow: KMP ~43%, EPB 100%, KMI ~54%(c) Own or operate ~68,000 miles of natura
Slide 26: Natural Gas Pipelines Segment Outlook
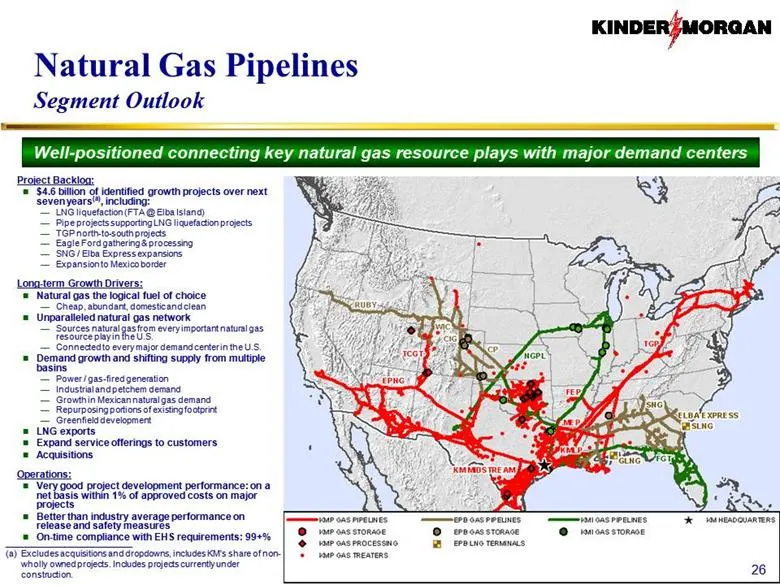
Natural Gas Pipelines Segment Outlook 26 Well-positioned connecting key natural gas resource plays with major demand centers __________________________ Excludes acquisitions and dropdowns, includes KM's share of non-wholly owned projects. Includes projects currently under construction. Project Backl
Slide 27: Products Pipelines Segment Outlook
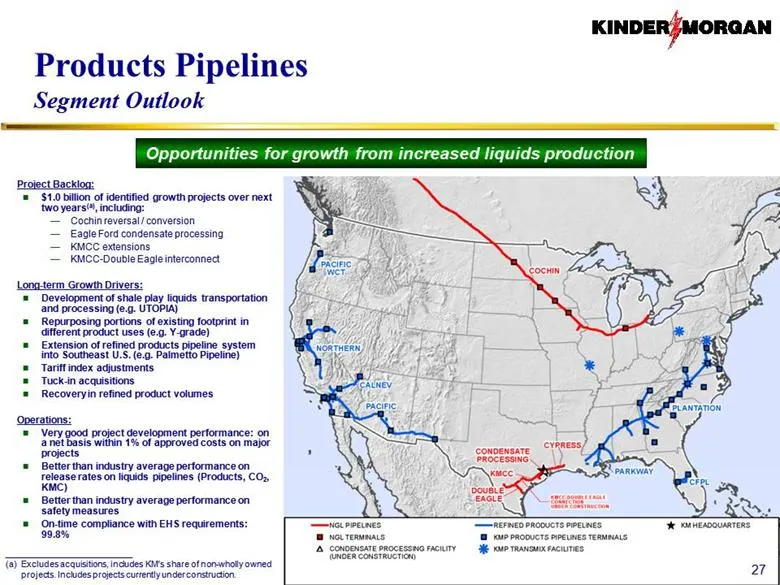
Products Pipelines Segment Outlook Project Backlog: $1.0 billion of identified growth projects over next two years(a), including: Cochin reversal / conversion Eagle Ford condensate processing KMCC extensions KMCC-Double Eagle interconnect Long-term Growth Drivers: Development of shale play liquids t
Slide 28: Terminals Segment Outlook
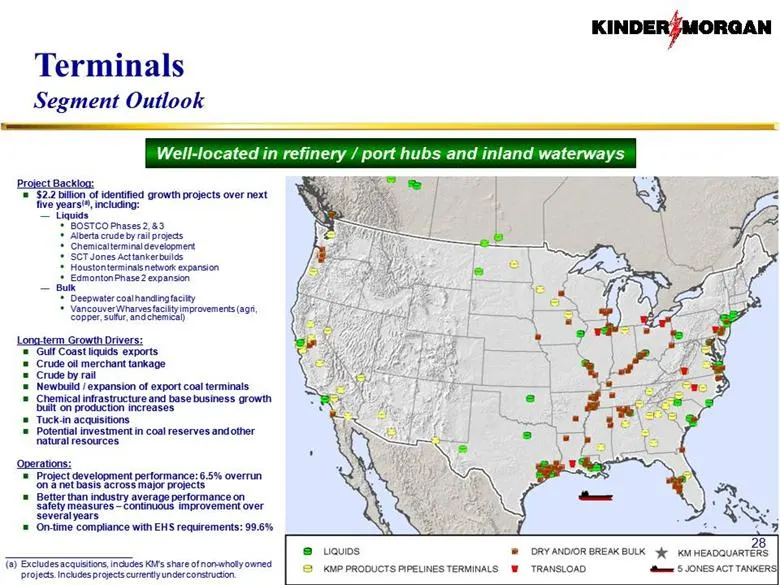
Terminals Segment Outlook Well-located in refinery / port hubs and inland waterways 28 __________________________ Excludes acquisitions, includes KM's share of non-wholly owned projects. Includes projects currently under construction. Project Backlog: $2.2 billion of identified growth projects over
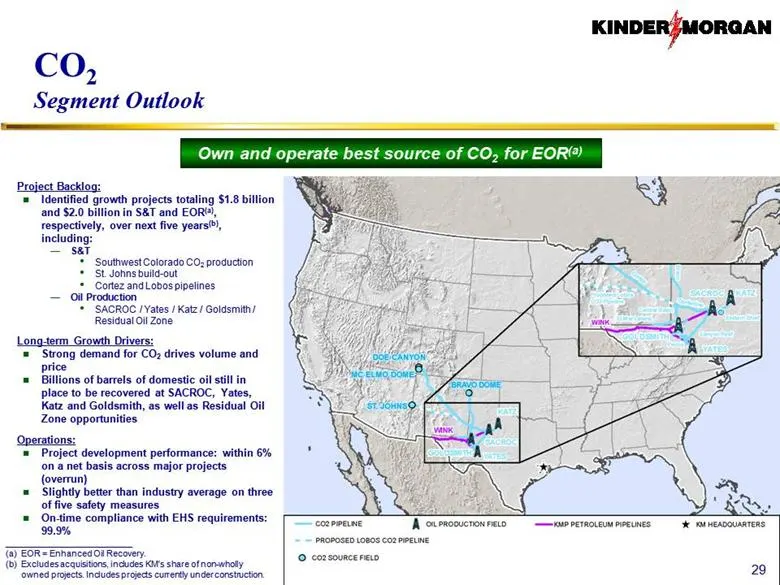
Slide 29: CO2 Segment Outlook
CO2 Segment Outlook Own and operate best source of CO2 for EOR(a) 29 __________________________ EOR = Enhanced Oil Recovery. Excludes acquisitions, includes KM's share of non-wholly owned projects. Includes projects currently under construction. Project Backlog: Identified growth projects totaling $
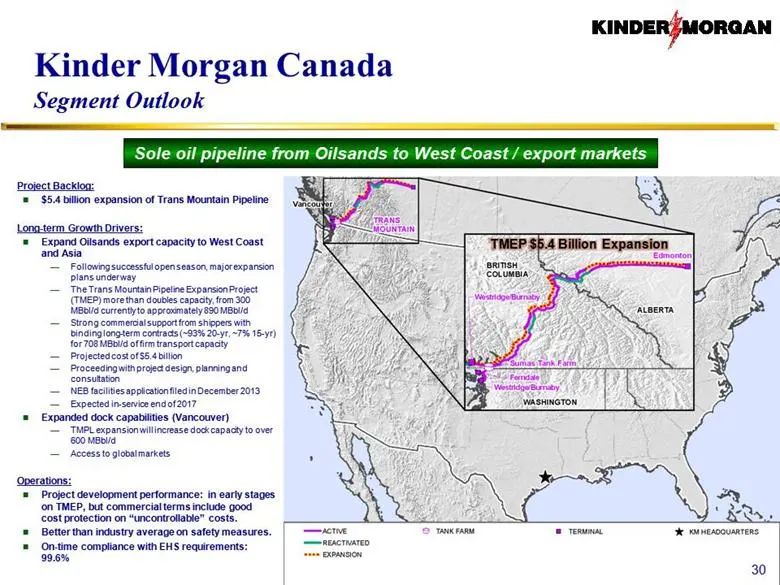
Slide 30: Kinder Morgan Canada Segment Outlook
Kinder Morgan Canada Segment Outlook Sole oil pipeline from Oilsands to West Coast / export markets 30 Project Backlog: $5.4 billion expansion of Trans Mountain Pipeline Long-term Growth Drivers: Expand Oilsands export capacity to West Coast and Asia Following successful open season, major expansion
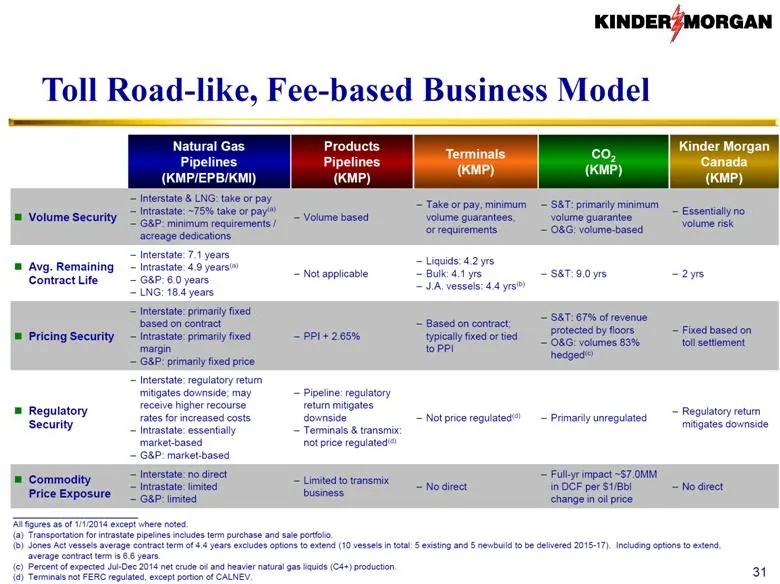
Slide 31: Toll Road-like, Fee-based Business Model
Toll Road-like, Fee-based Business Model Natural Gas Pipelines (KMP/EPB/KMI) Products Pipelines (KMP) Terminals (KMP) CO2 (KMP) Kinder Morgan Canada (KMP) Volume Security Interstate & LNG: take or pay Intrastate: ~75% take or pay(a) G&P: minimum requirements / acreage dedications Volume based Take o
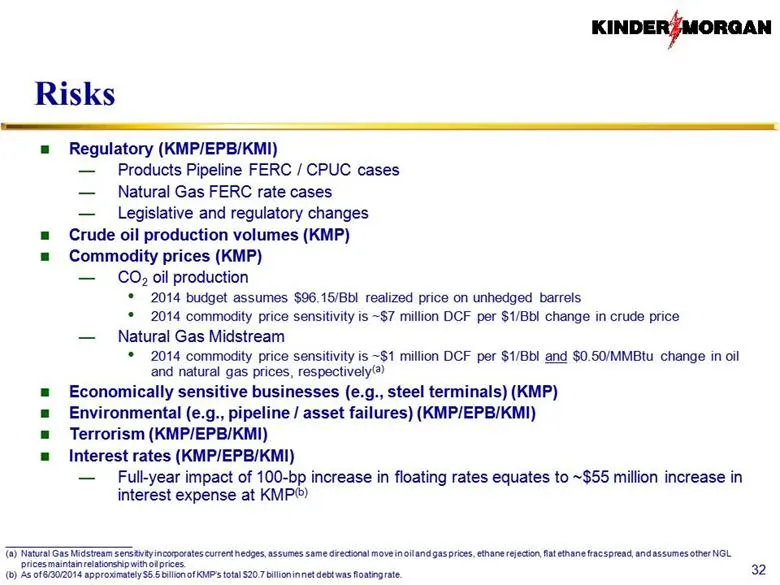
Slide 32: Risks
Risks 32 __________________________ Natural Gas Midstream sensitivity incorporates current hedges, assumes same directional move in oil and gas prices, ethane rejection, flat ethane frac spread, and assumes other NGL prices maintain relationship with oil prices. As of 6/30/2014 approximately $5.5 bi
Slide 33: Kinder Morgan
KINDER/MORGAN
Source: SEC EDGAR · 425 filed Aug 20, 2014
More decks from El Paso Pipeline Partners L.P.
 Merger or Acquisition (November 2014)40 slides · Nov 19, 2014
 Merger or Acquisition (October 2014)40 slides · Oct 27, 2014
 Merger or Acquisition (October 2014)40 slides · Oct 27, 2014
 Merger or Acquisition (September 2014)39 slides · Sep 25, 2014
 Merger or Acquisition (September 2014)34 slides · Sep 3, 2014
 Merger or Acquisition (August 2014)33 slides · Aug 12, 2014