SECO S.p.A. · MIL:IOT
SECO — Q1 2025 Earnings Presentation
18 slides from SECO's earnings presentation, May 8, 2025
Slide 1: 1Q 2025 Results Presentation & Business Update
1Q 2025 Results Presentation & Business Update May 8 th , 2025
Slide 2: Disclaimer
Disclaimer This document has been prepared by SECO S.p.A. (“SECO” or the “Company”), for information purposes only, exclusively with the aim of assisting you to understand and assess the activities of SECO. The information contained in this presentation does not purport to be comprehensive and may n
Slide 3: Presenting today
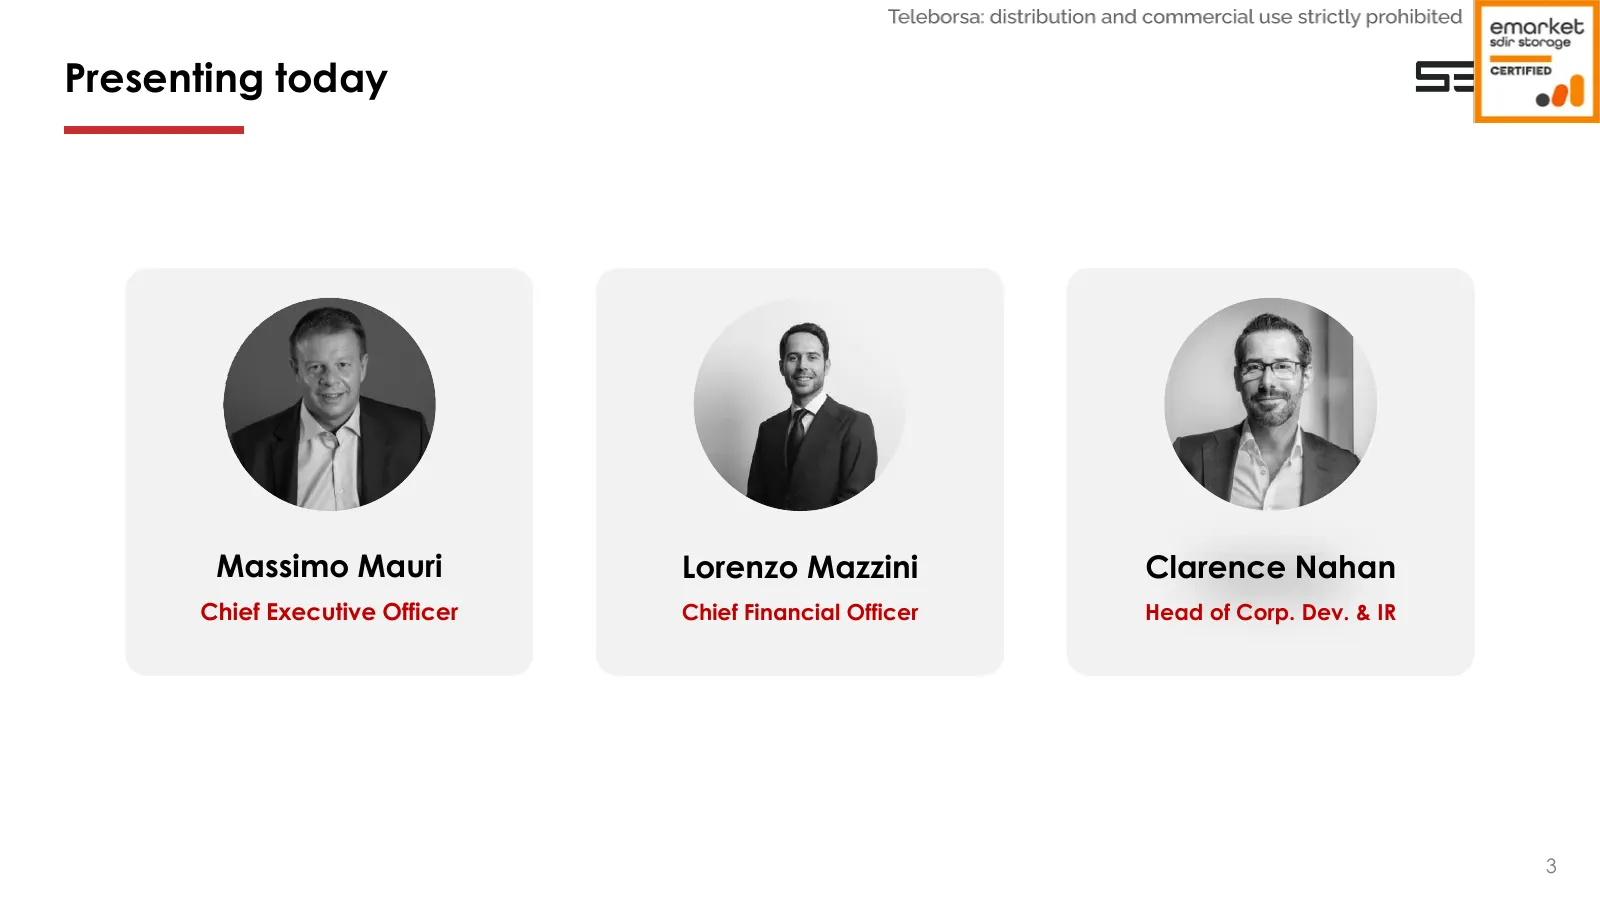
Presenting today Massimo Mauri Lorenzo Mazzini Clarence Nahan Chief Executive Officer Chief Financial Officer Head of Corp. Dev. & IR 3
Slide 4: Key takeaways from the past 3 months
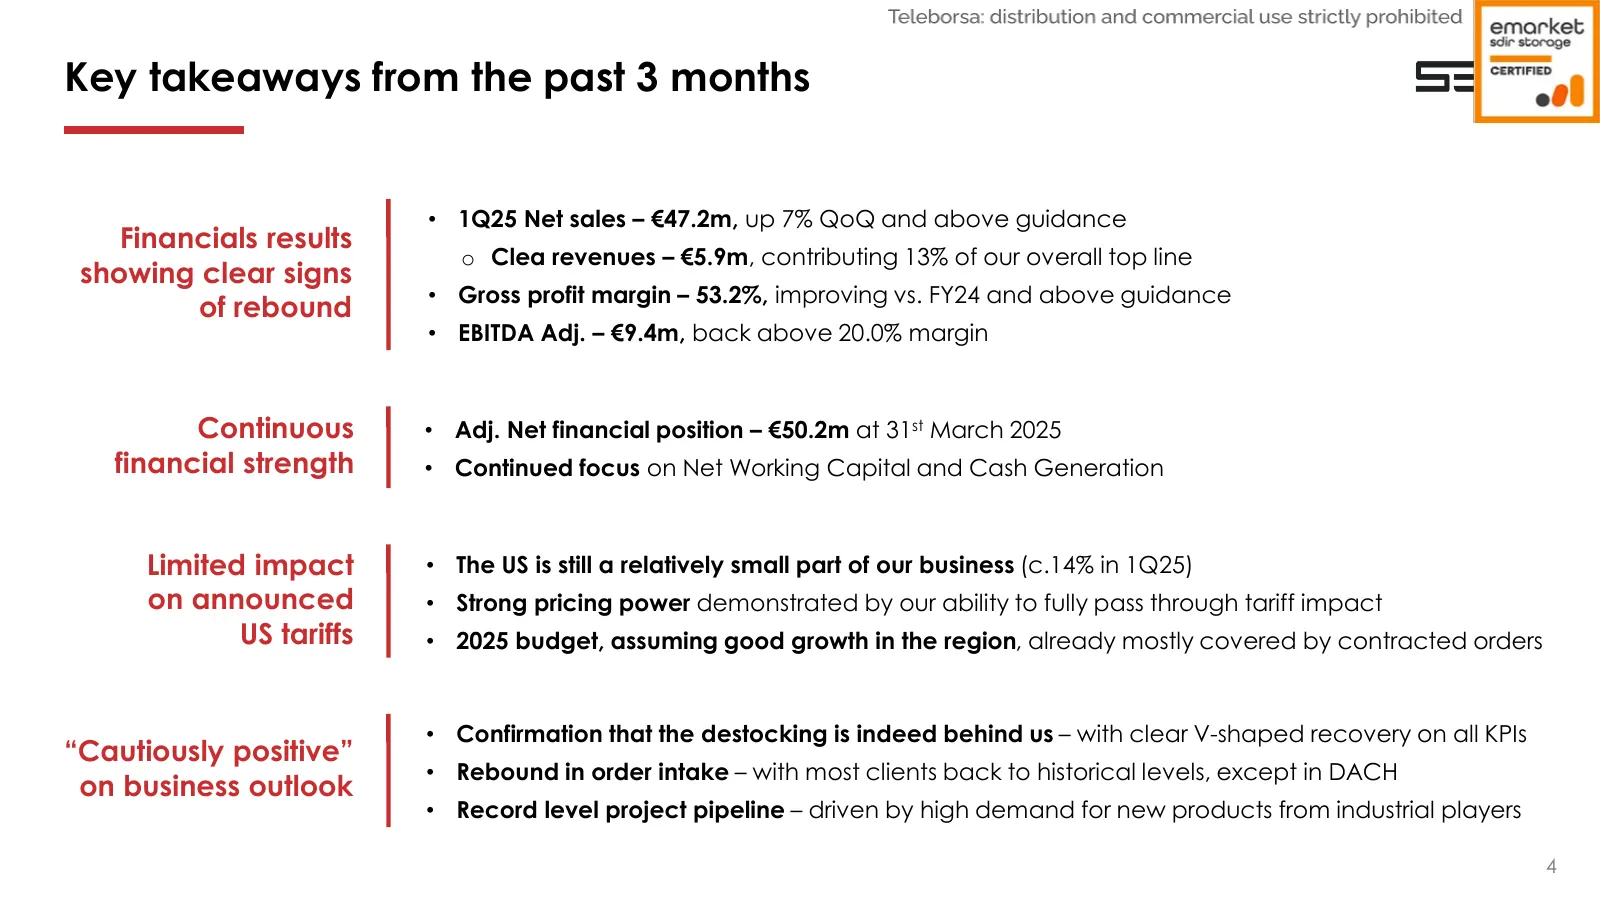
Key takeaways from the past 3 months • 1Q25 Net sales – €47.2m, up 7% QoQ and above guidance Financials results o Clea revenues – €5.9m, contributing 13% of our overall top line showing clear signs • Gross profit margin – 53.2%, improving vs. FY24 and above guidance of rebound • EBITDA Adj. – €9.4m,
Slide 5: Detailed 1Q 2025 Results
Detailed 1Q 2025 Results S=C/4
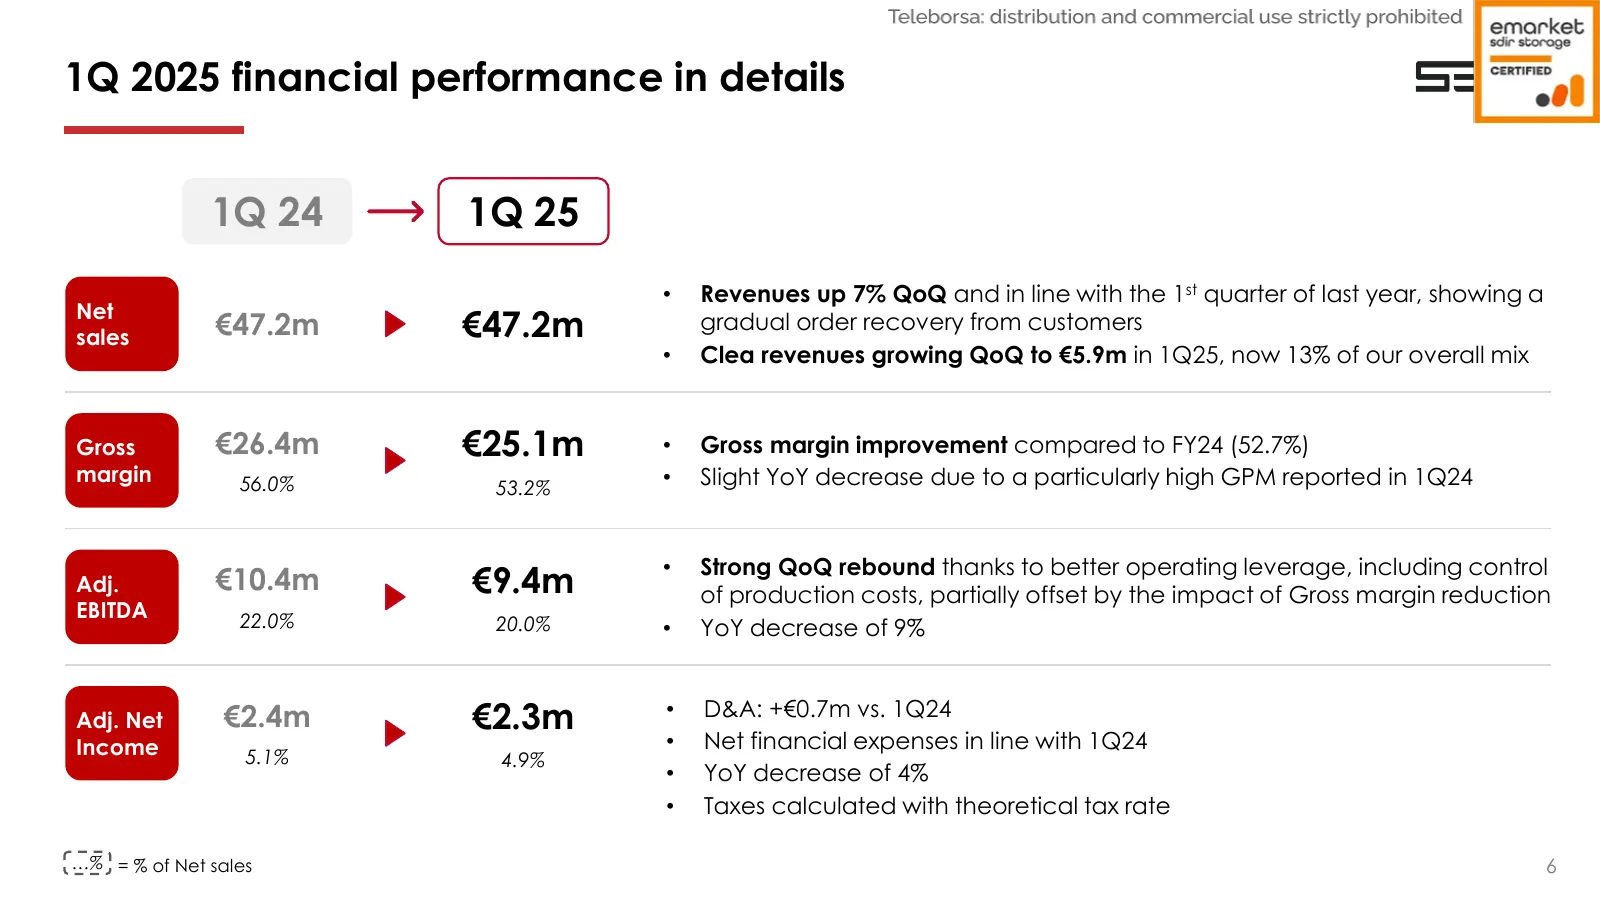
Slide 6: 1Q 2025 financial performance in details
1Q 2025 financial performance in details 1Q 24 1Q 25 • Revenues up 7% QoQ and in line with the 1st quarter of last year, showing a Net sales €47.2m €47.2m gradual order recovery from customers • Clea revenues growing QoQ to €5.9m in 1Q25, now 13% of our overall mix Gross €26.4m €25.1m • Gross margin
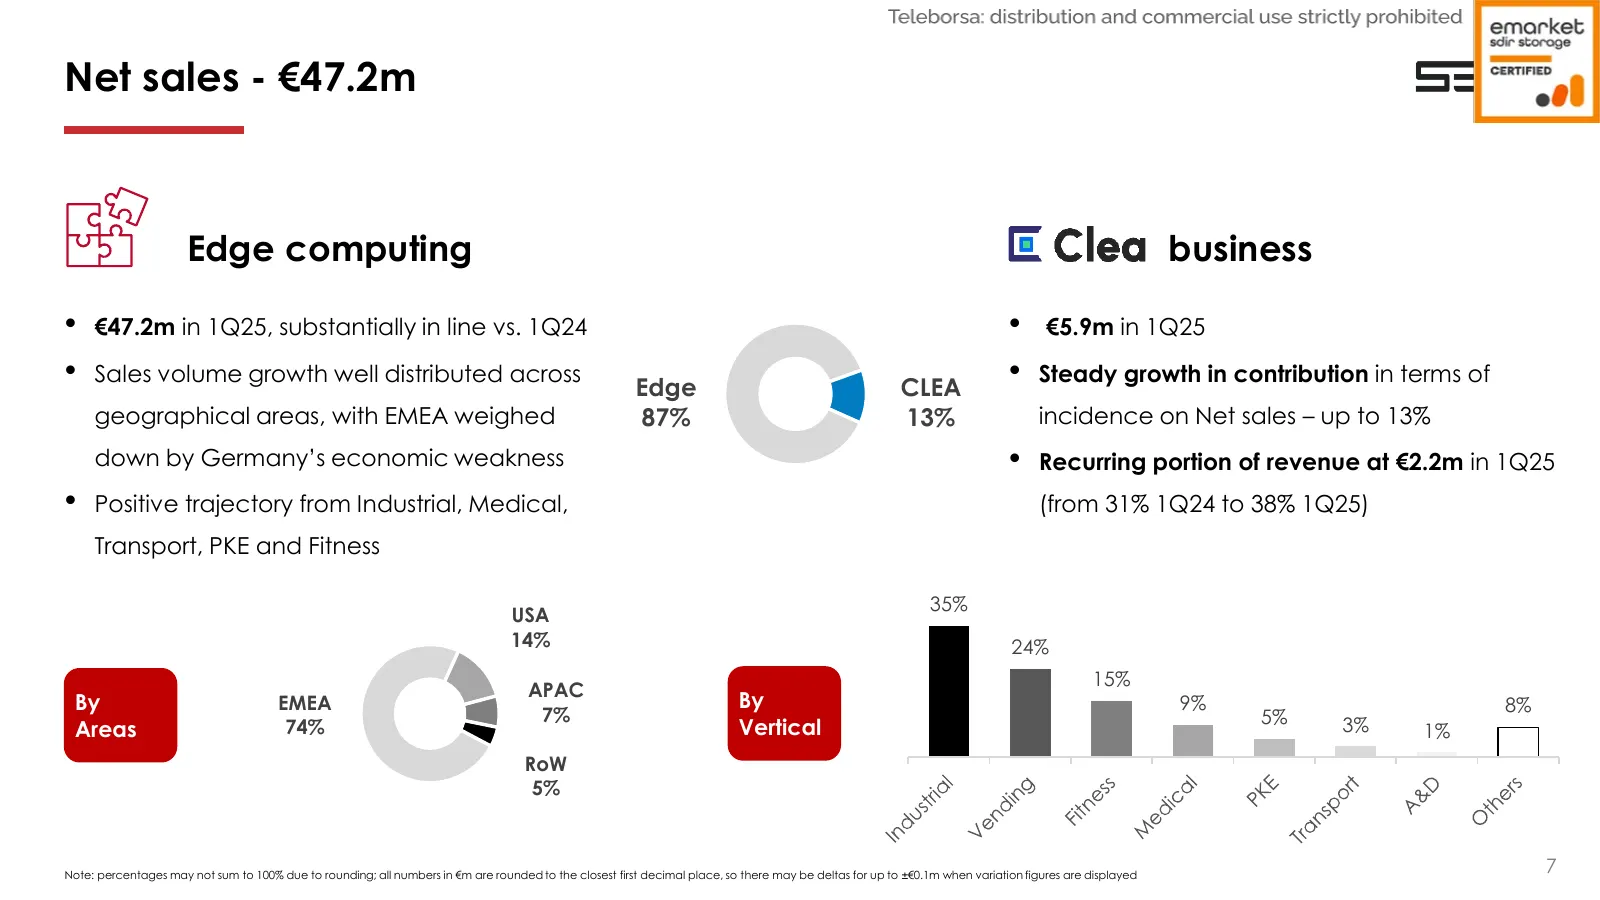
Slide 7: Net sales - €47.2m
Net sales - €47.2m Edge computing business • €47.2m in 1Q25, substantially in line vs. 1Q24 • €5.9m in 1Q25 • Sales volume growth well distributed across Edge CLEA • Steady growth in contribution in terms of geographical areas, with EMEA weighed 87% 13% incidence on Net sales – up to 13% down by Ger
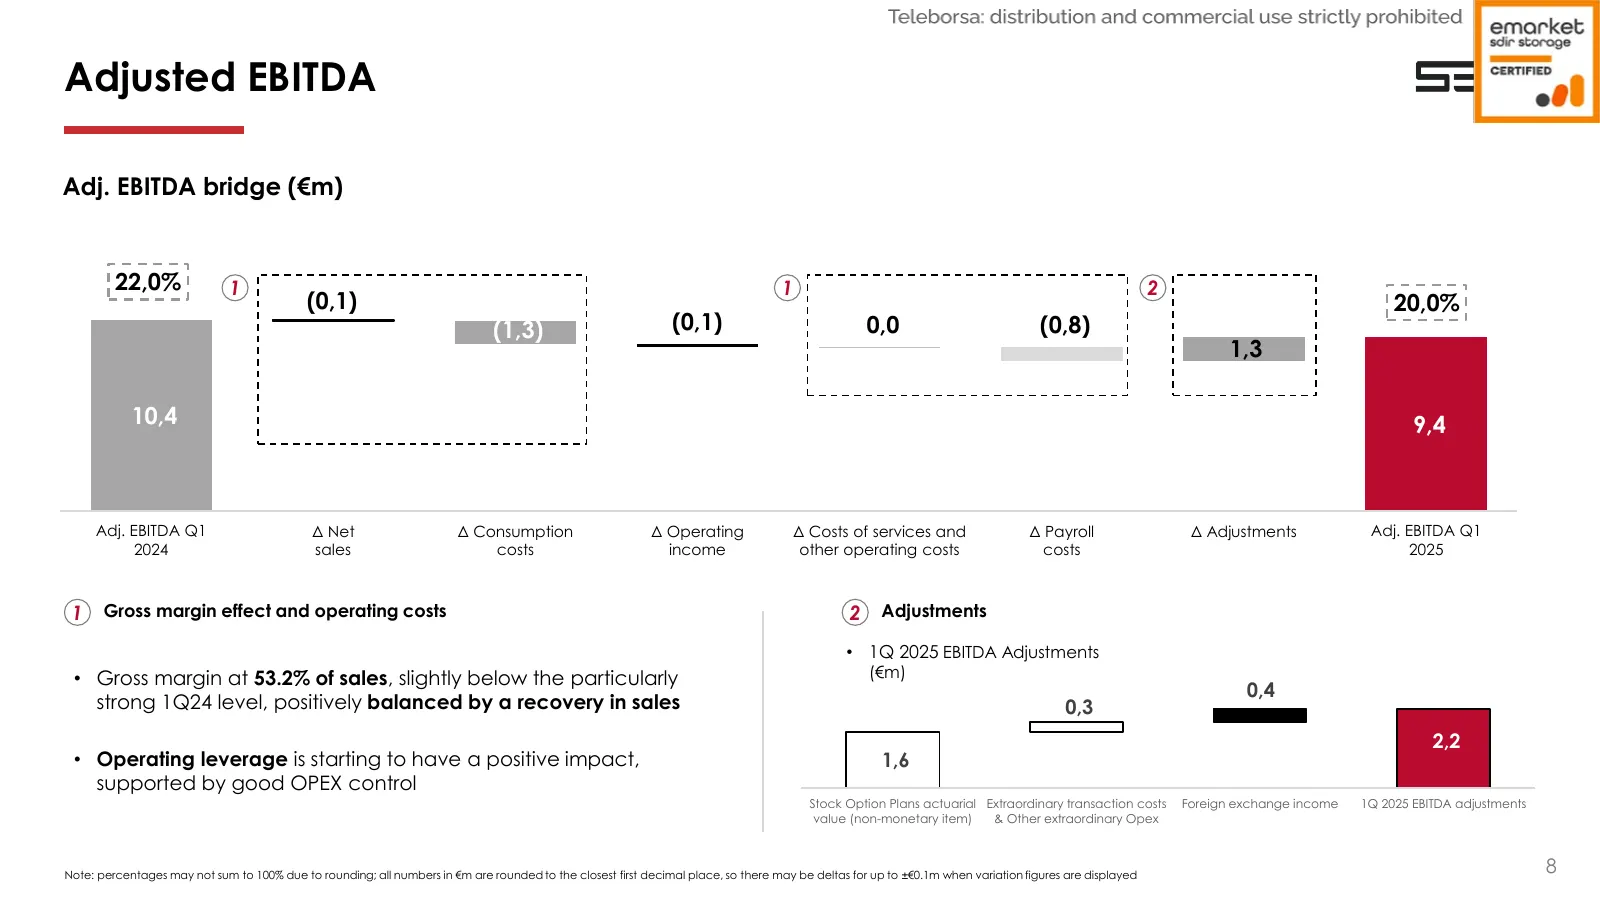
Slide 8: Adjusted EBITDA
Adjusted EBITDA Adj. EBITDA bridge (€m) 22,0% 1 1 2 (0,1) 20,0% (1,3) (0,1) 0,0 (0,8) 1,3 10,4 9,4 Adj. EBITDA Q1 Δ Net Δ Consumption Δ Operating Δ Costs of services and Δ Payroll Δ Adjustments Adj. EBITDA Q1 2024 sales costs income other operating costs costs 2025 1 Gross margin effect and operatin
Slide 9: Adjusted Net financial position
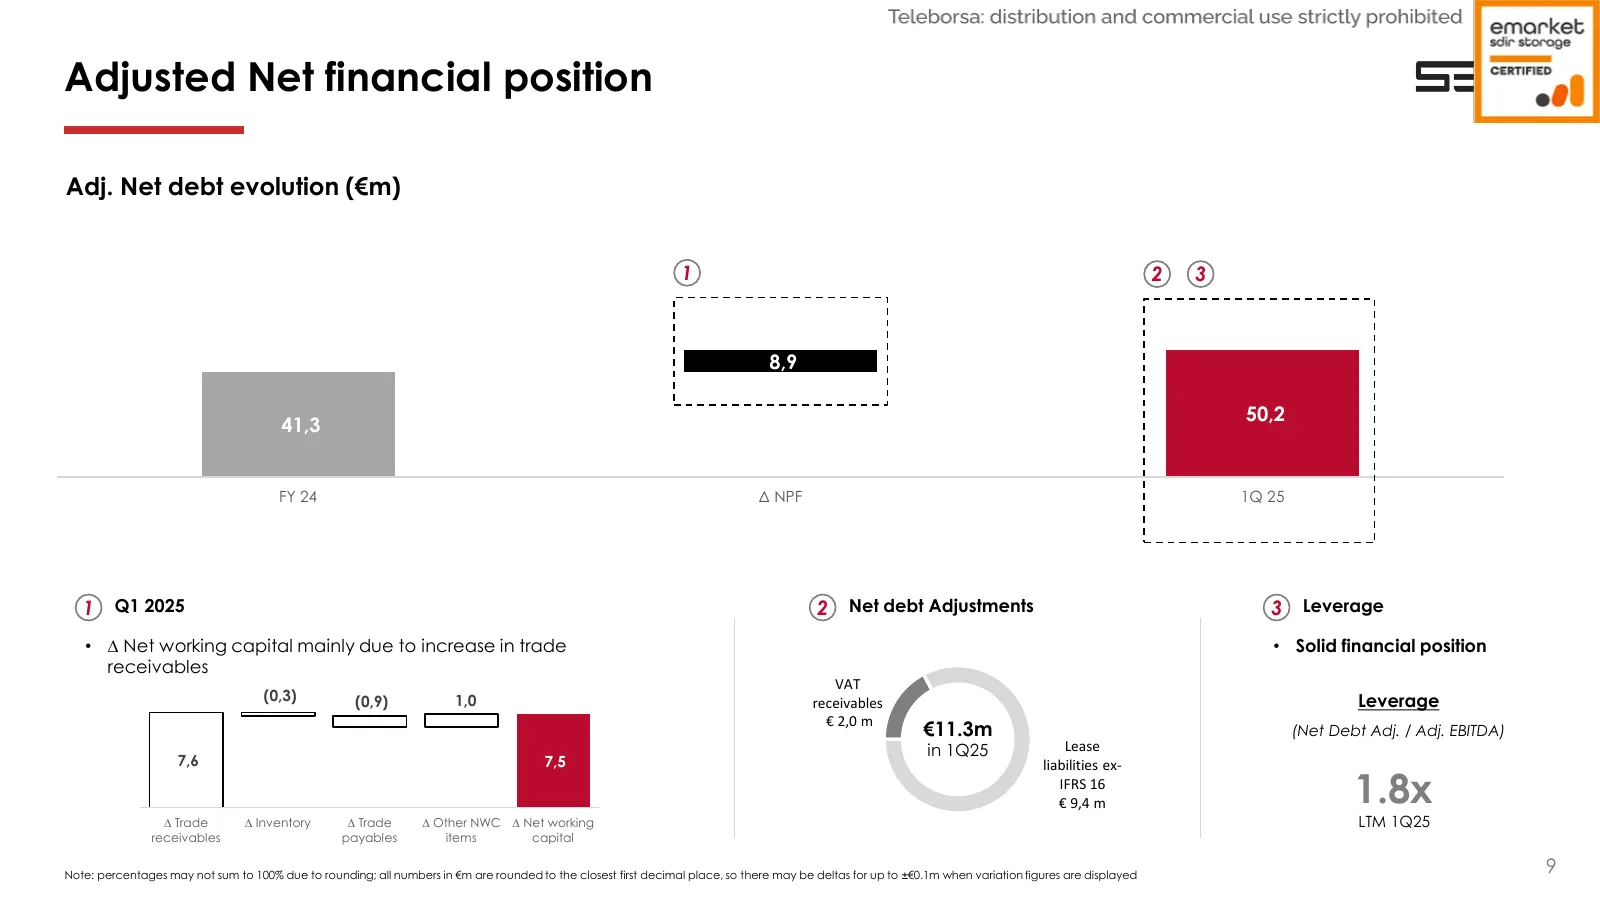
Adjusted Net financial position Adj. Net debt evolution (€m) 1 2 3 8,9 50,2 41,3 FY 24 Δ NPF 1Q 25 1 Q1 2025 2 Net debt Adjustments 3 Leverage • ∆ Net working capital mainly due to increase in trade • Solid financial position receivables VAT (0,3) (0,9) 1,0 receivables Leverage € 2,0 m €11.3m (Net D
Slide 10: Business update
Business update

Slide 11: AI at the Edge is set to transform the Industrial sector
AI at the Edge is set to transform the Industrial sector SECO will enable a faster AI adoption thanks to its end-to-end solution Augmented Enable user experience data monetization Faster, more intuitive, • Real-time decision-making and immersive human- • New functionalities machine interaction Edge
Slide 12: Clear monetization strategy
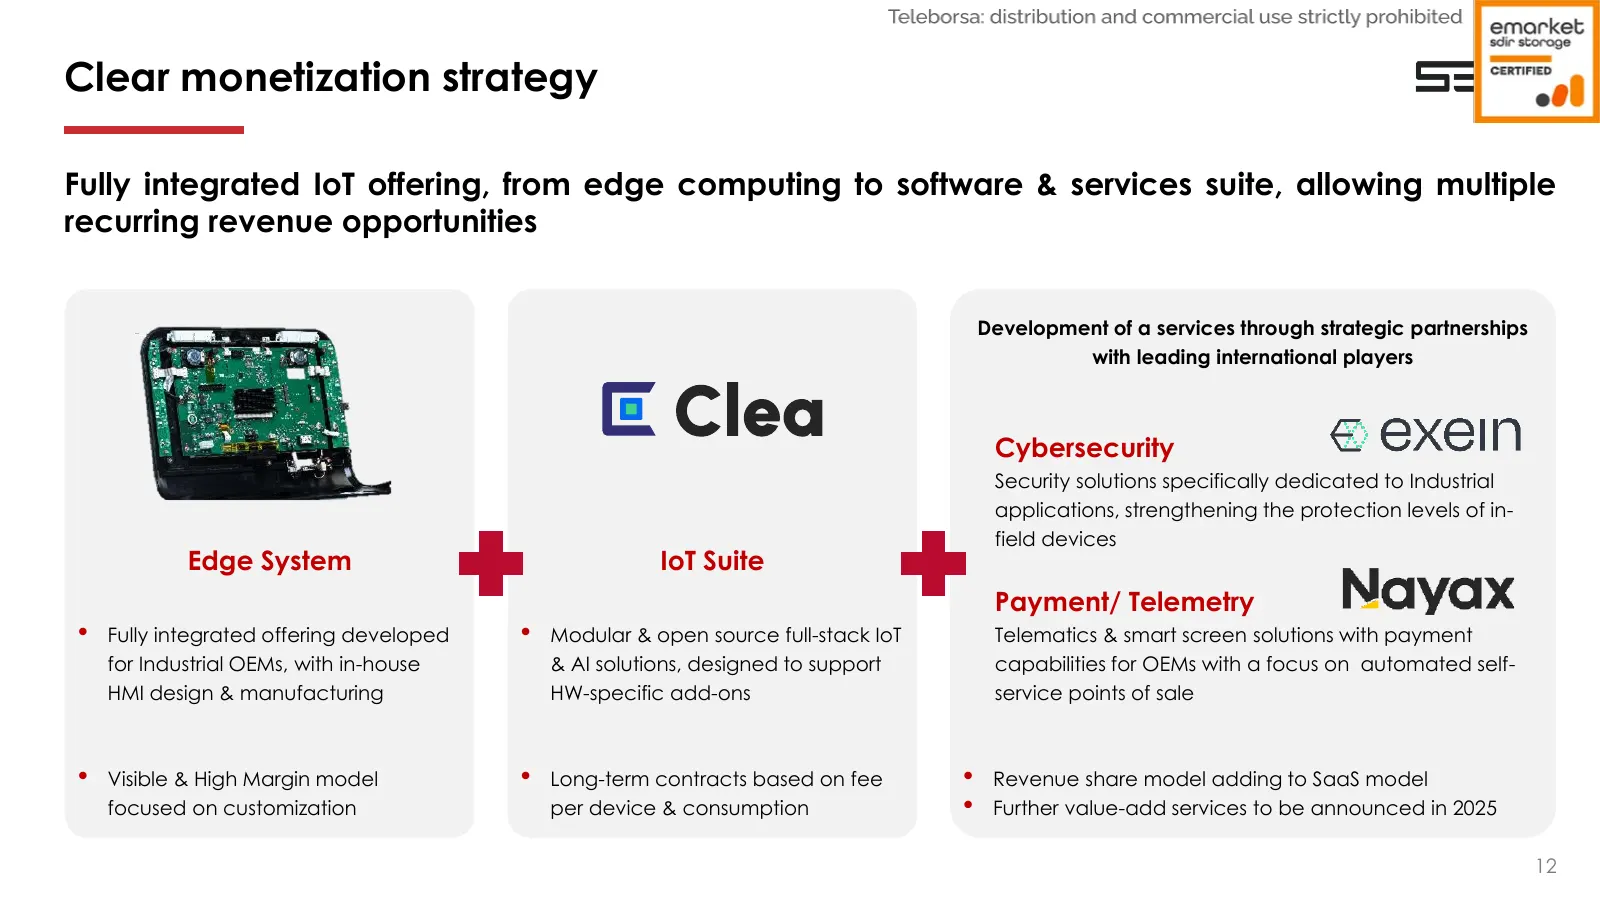
Clear monetization strategy Fully integrated IoT offering, from edge computing to software & services suite, allowing multiple recurring revenue opportunities Development of a services through strategic partnerships with leading international players Cybersecurity Security solutions specifically ded
Slide 13: Update on contribution since its launch in 2021
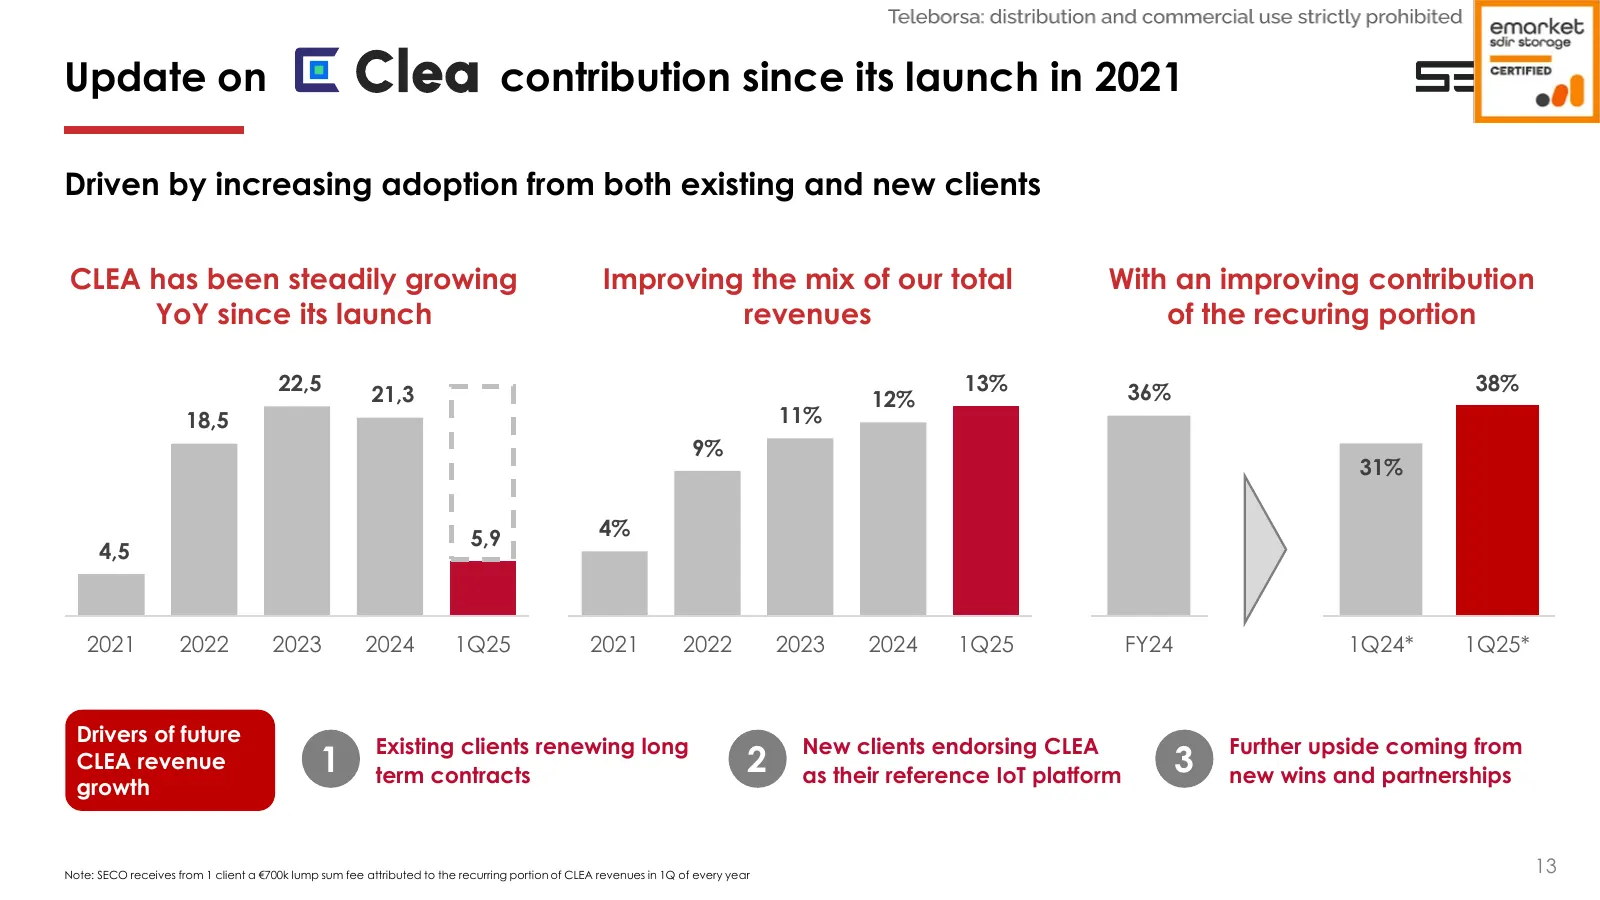
Update on contribution since its launch in 2021 Driven by increasing adoption from both existing and new clients CLEA has been steadily growing Improving the mix of our total With an improving contribution YoY since its launch revenues of the recuring portion 22,5 13% 36% 38% 21,3 12% 18,5 11% 9% 31
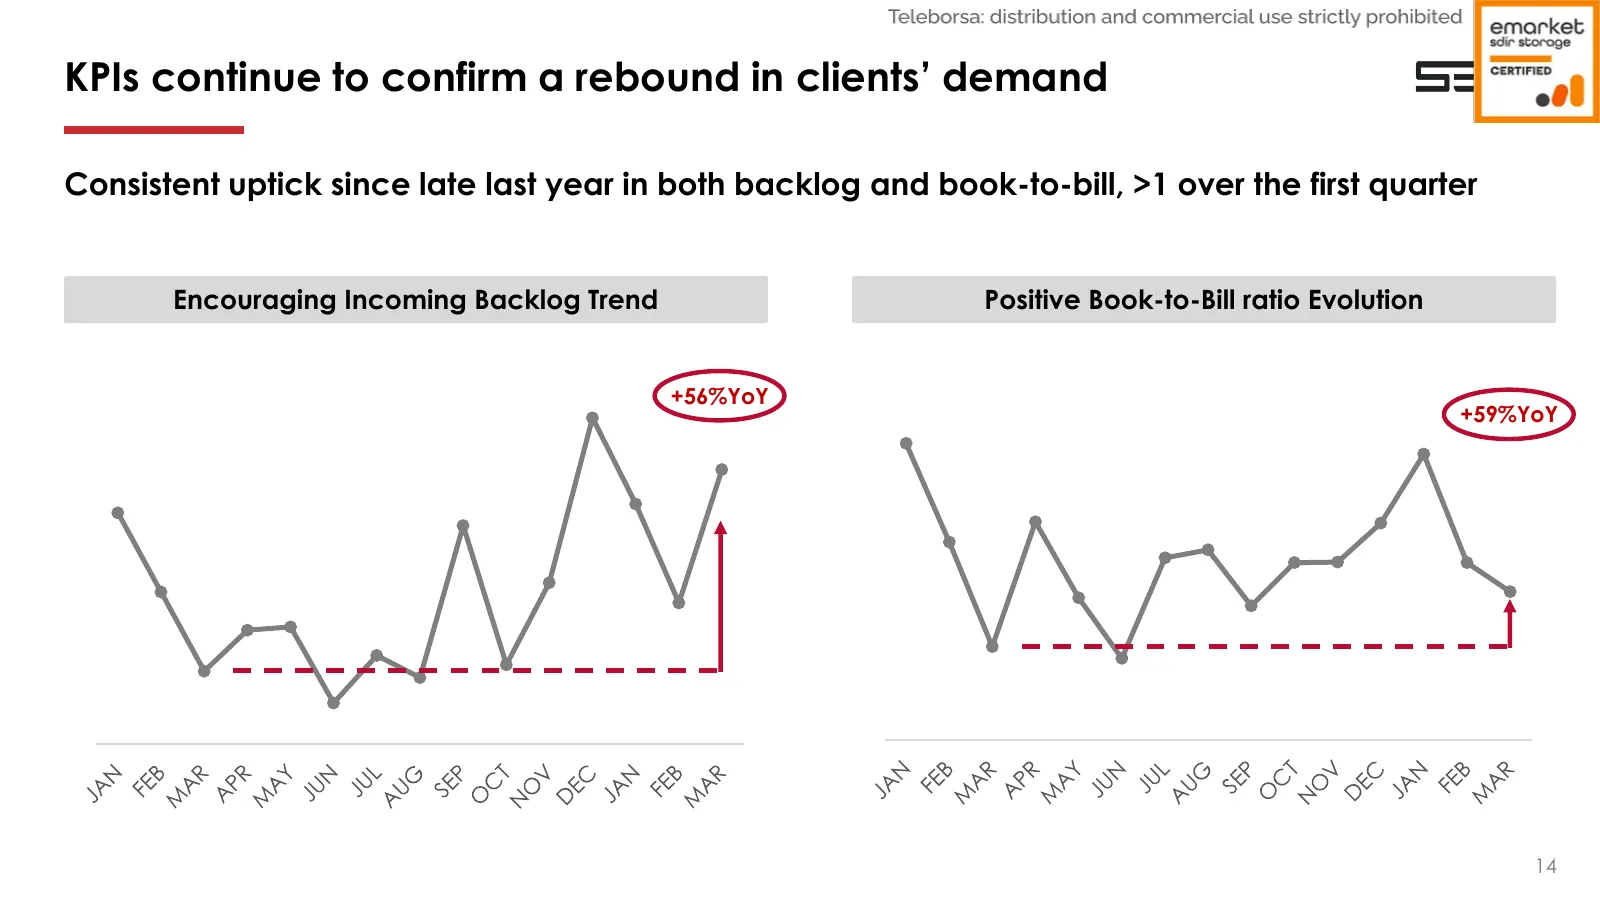
Slide 14: KPIs continue to confirm a rebound in clients’ demand
KPIs continue to confirm a rebound in clients’ demand Consistent uptick since late last year in both backlog and book-to-bill, >1 over the first quarter Encouraging Incoming Backlog Trend Positive Book-to-Bill ratio Evolution +56%YoY +59%YoY 14
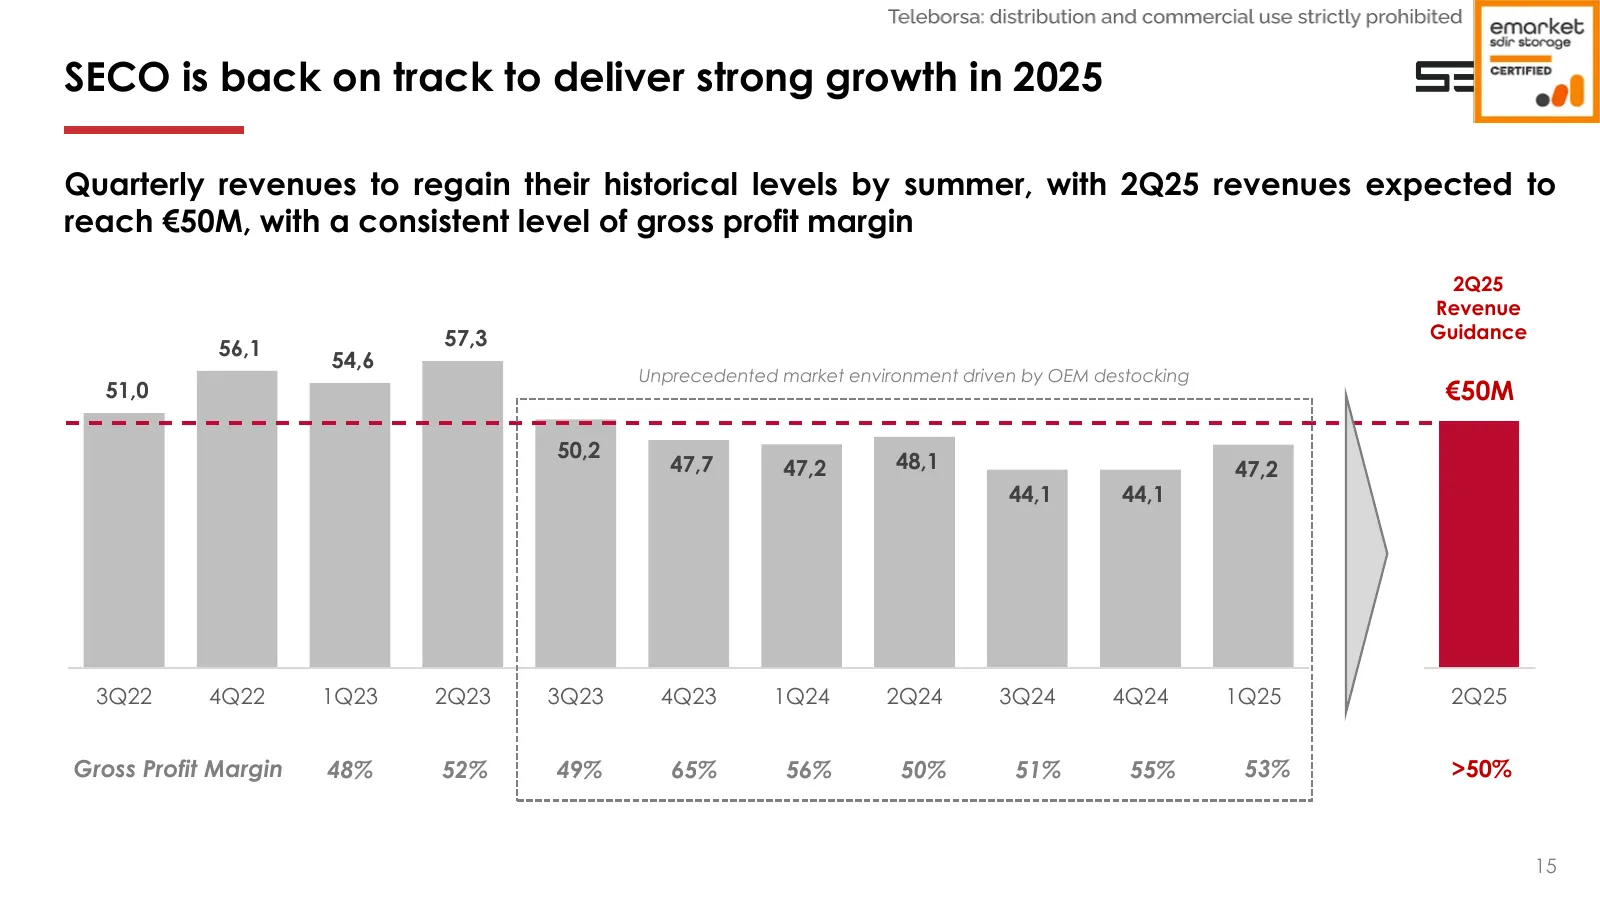
Slide 15: SECO is back on track to deliver strong growth in 2025
SECO is back on track to deliver strong growth in 2025 Quarterly revenues to regain their historical levels by summer, with 2Q25 revenues expected to reach €50M, with a consistent level of gross profit margin 2Q25 Revenue 57,3 Guidance 56,1 54,6 Unprecedented market environment driven by OEM destock
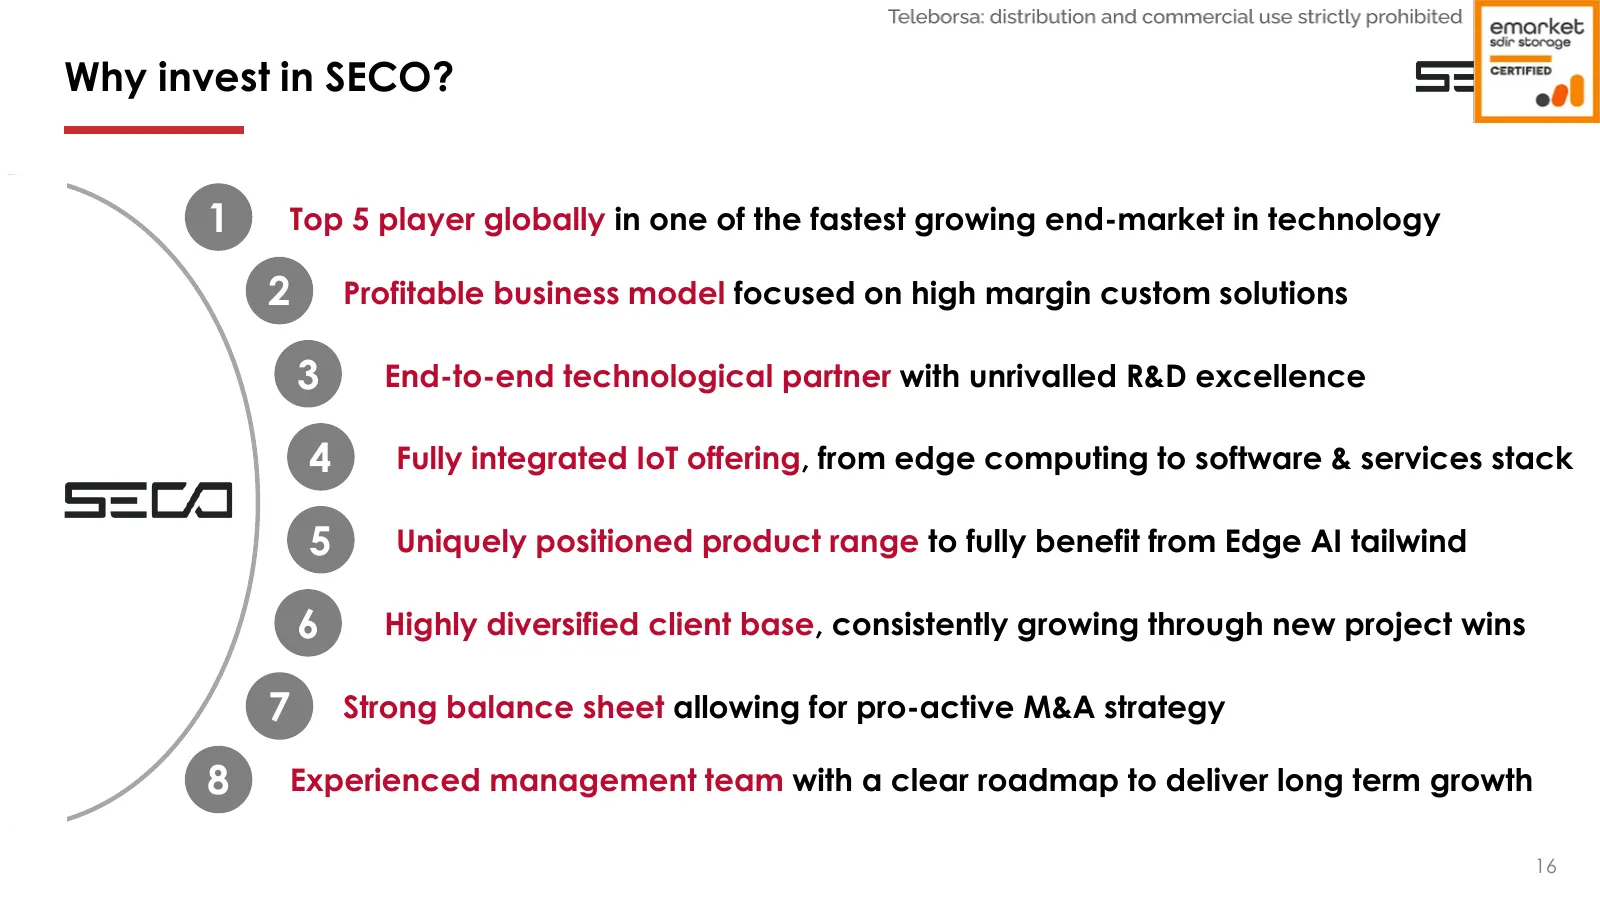
Slide 16: Why invest in SECO?
Why invest in SECO? 1 Top 5 player globally in one of the fastest growing end-market in technology 2 Profitable business model focused on high margin custom solutions 3 End-to-end technological partner with unrivalled R&D excellence 4 Fully integrated IoT offering, from edge computing to software &
Slide 17: Q&A
Q&A S=C/4
Slide 18: Thank you
Thank you WWwW.SeECO.cCOmM
Source: EarningsCall slides
More decks from SECO S.p.A.
 9M 2026 Earnings Presentation28 slides · Nov 9, 2026
 H1 2026 Earnings Presentation26 slides · Sep 8, 2026
 Q1 2026 Earnings Presentation22 slides · May 11, 2026
 Euronext STAR Conference 202631 slides · Mar 25, 2026
 H1 2025 Earnings Presentation24 slides · Sep 8, 2025
 FY2024 Earnings Presentation30 slides · Mar 17, 2025