WellCare Health Plans — Q1 2014 Earnings Presentation
15 slides from WellCare Health Plans's earnings presentation, May 6, 2014
Slide 1: First Quarter 2014 Financial Results and Outlook Update
WAwellCare First Quarter 2014 Financial Results and Outlook Update WellCare Health Plans, Inc. May 6, 2014
Slide 2: Cautionary Statement
Cautionary Statement This presentation contains “forward-looking” statements that are made pursuant to the safe harbor provisions of the Private Securities Litigation Reform Act of 1995. Statements that are predictive in nature, that depend upon or refer to future events or conditions, or that inclu
Slide 3: Basis of Presentation
Basis of Presentation In addition to results determined under GAAP, WellCare provides certain non-GAAP measurements that management believes are useful in assessing the Company's performance. Following is a description of the calculation of important GAAP and non-GAAP measures used in this presentat
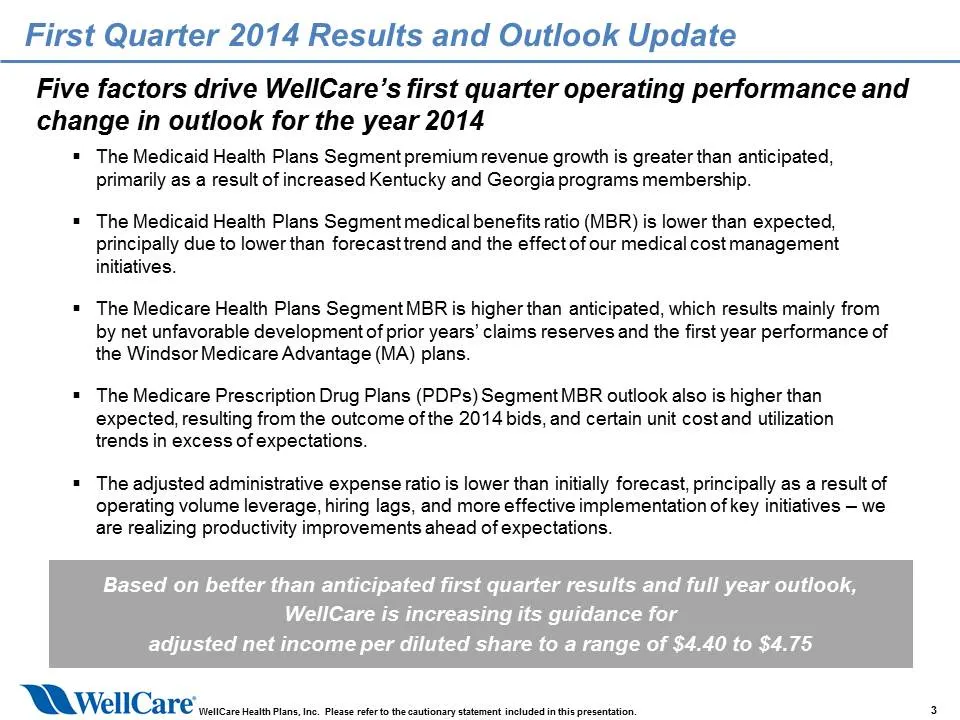
Slide 4: First Quarter 2014 Results and Outlook Update
First Quarter 2014 Results and Outlook Update Five factors drive WellCare’s first quarter operating performance and change in outlook for the year 2014 = The Medicaid Health Plans Segment premium revenue growth is greater than anticipated, primarily as a result of increased Kentucky and Georgia prog
Slide 5: Windsor Transaction Gain and Integration Expenses
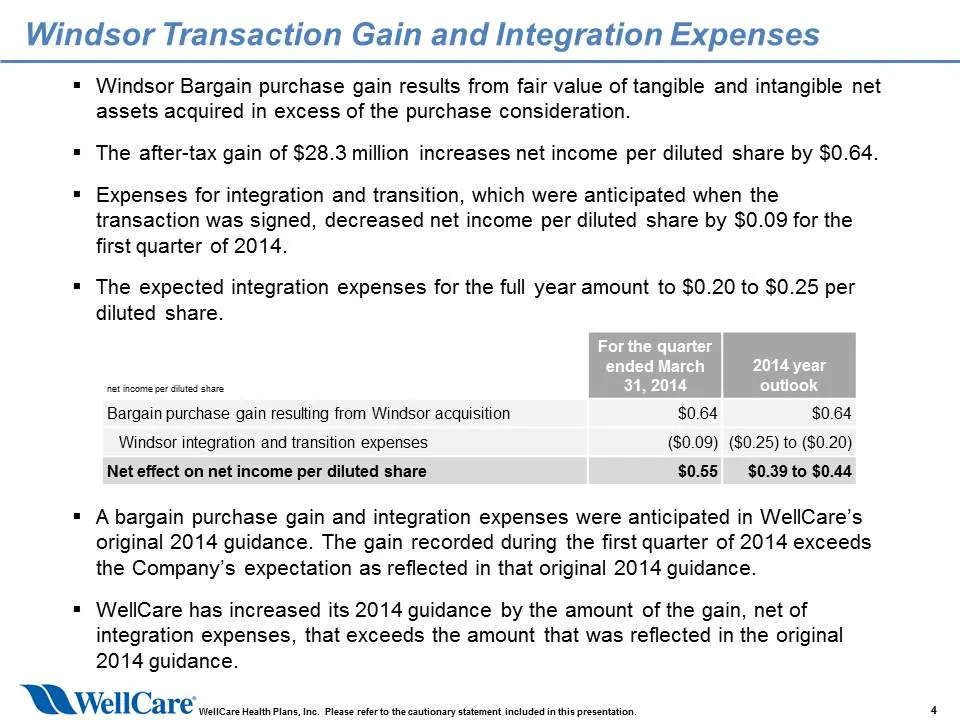
Windsor Transaction Gain and Integration Expenses = Windsor Bargain purchase gain results from fair value of tangible and intangible net assets acquired in excess of the purchase consideration. = The after-tax gain of $28.3 million increases net income per diluted share by $0.64. = Expenses for inte
Slide 6: Prior Years' Reserve Development
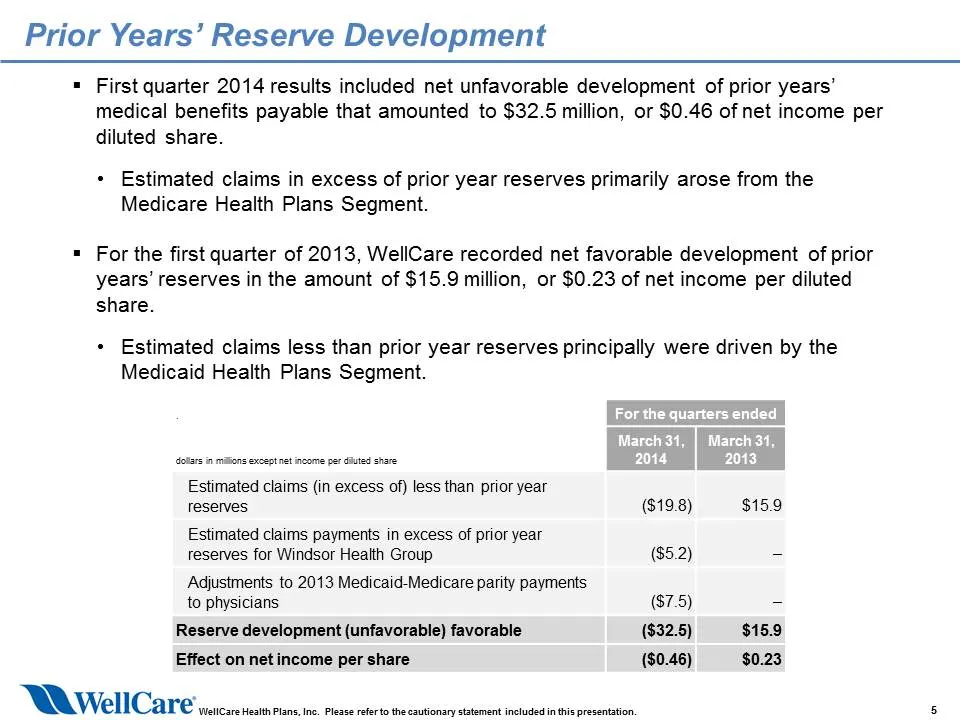
Prior Years’ Reserve Development = First quarter 2014 results included net unfavorable development of prior years’ medical benefits payable that amounted to $32.5 million, or $0.46 of net income per diluted share. + Estimated claims in excess of prior year reserves primarily arose from the Medicare
Slide 7: ACA Industry Fee: First Quarter 2014
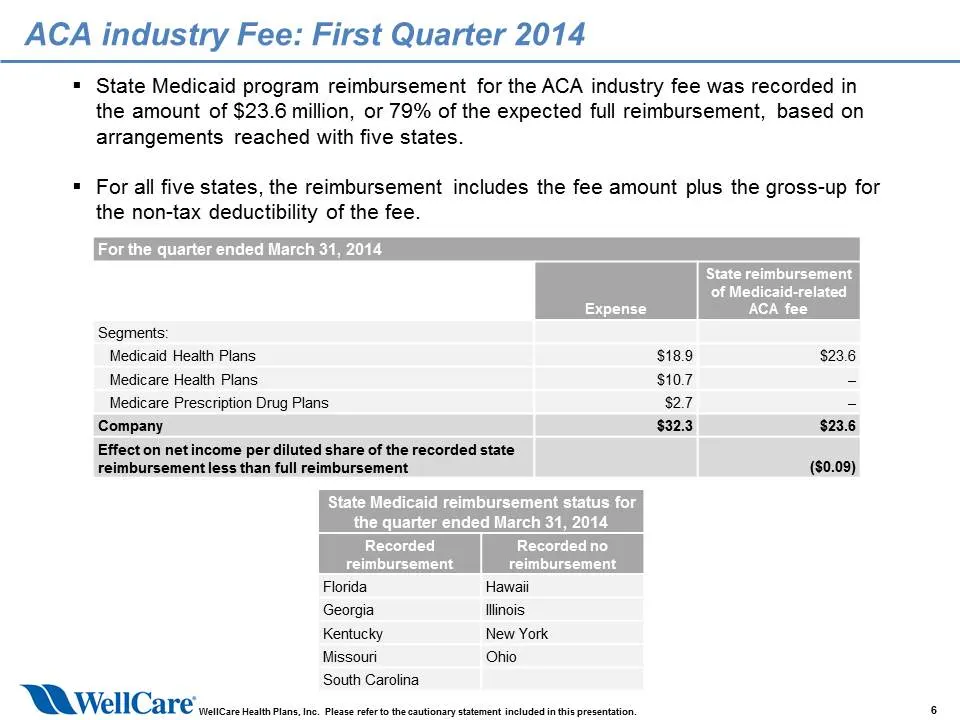
ACA industry Fee: First Quarter 2014 = State Medicaid program reimbursement for the ACA industry fee was recorded in the amount of $23.6 million, or 79% of the expected full reimbursement, based on arrangements reached with five states. = For all five states, the reimbursement includes the fee amoun
Slide 8: ACA Industry Fee: 2014 Outlook
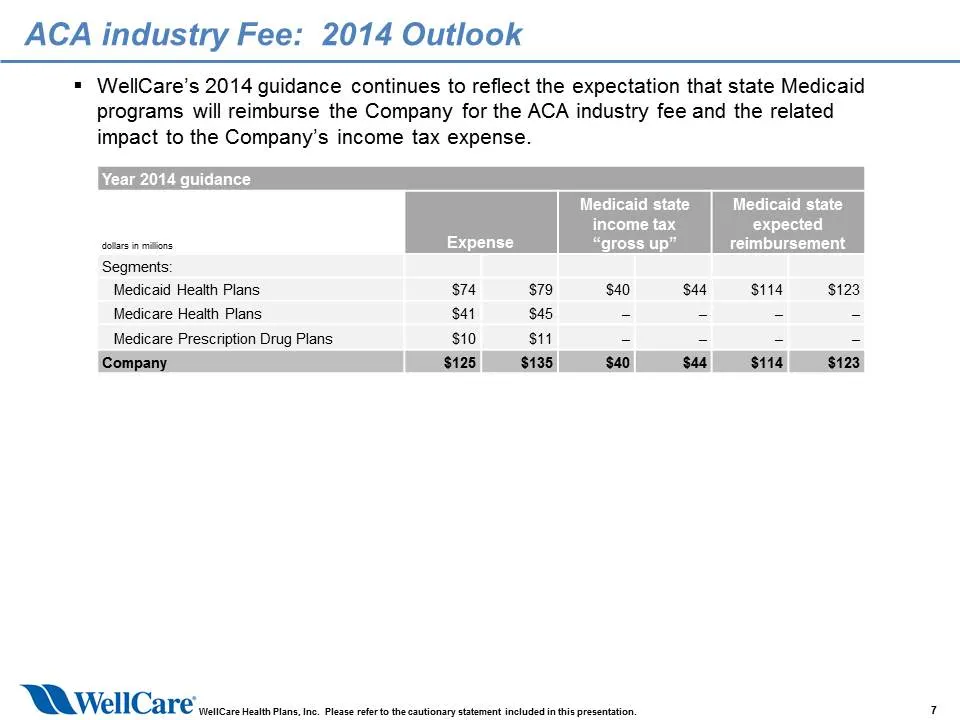
ACA industry Fee: 2014 Outlook = WellCare’s 2014 guidance continues to reflect the expectation that state Medicaid programs will reimburse the Company for the ACA industry fee and the related impact to the Company’s income tax expense. Year 2014 guidance come tax expected deta n mins “gross up” reim
Slide 9: Hepatitis C Treatments
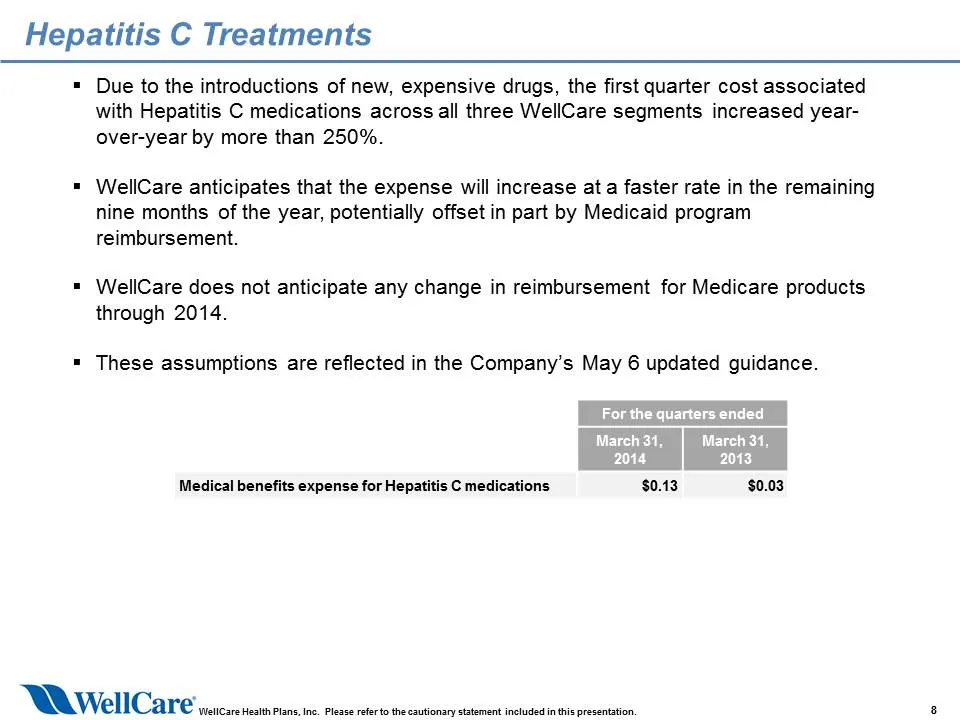
Hepatitis C Treatments = Due to the introductions of new, expensive drugs, the first quarter cost associated with Hepatitis C medications across all three WellCare segments increased year- over-year by more than 250%. = WellCare anticipates that the expense will increase at a faster rate in the rema
Slide 10: Investments
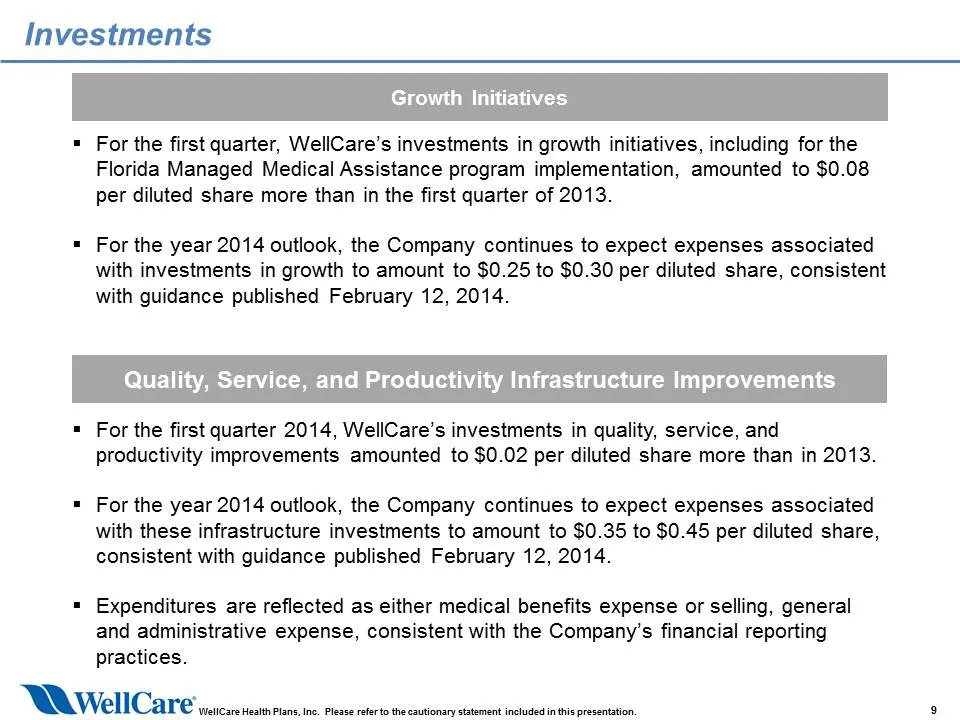
Investments Growth Initiatives = For the first quarter, WellCare’s investments in growth jatives, including for the Florida Managed Medical Assistance program implementation, amounted to $0.08 per diluted share more than in the first quarter of 2013. = For the year 2014 outlook, the Company continue
Slide 11: Gross Margin Performance: Company
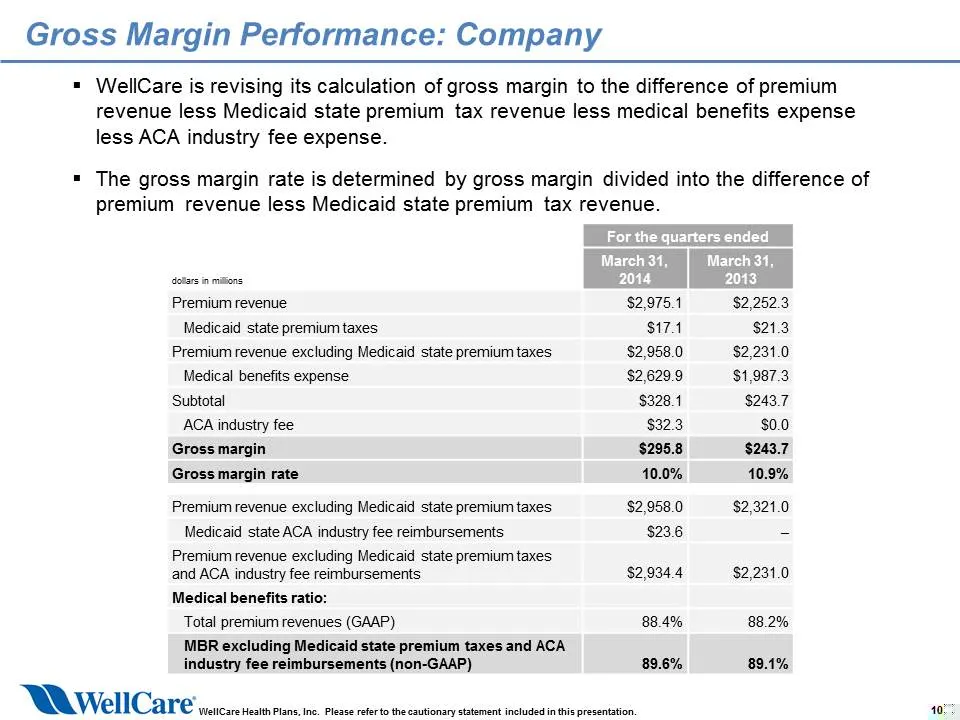
Gross Margin Performance: Company = WellCare is revising its calculation of gross margin to the difference of premium revenue less Medicaid state premium tax revenue less medical benefits expense less ACA industry fee expense. = The gross margin rate is determined by gross margin divided into the di
Slide 12: Gross Margin: Medicaid Health Plans Segment
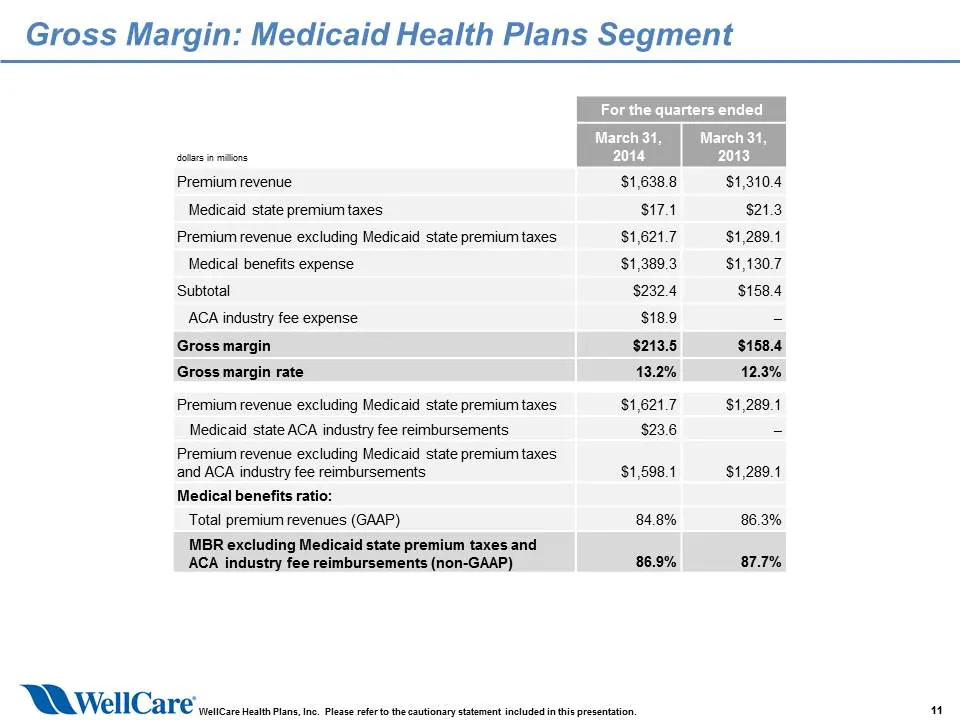
Gross Margin: Medicaid Health Plans Segment March 31, dots in mains 2014 Premium revenue $1,638.8 $1,310.4 Medicaid state premium taxes Si74 $213 Premium revenue excluding Medicaid state premium taxes $1,621.7 $1,289.1 Medical benefits expense $1,389.3 $1,130.7 Subtotal $232.4 $158.4 ACA industry fe
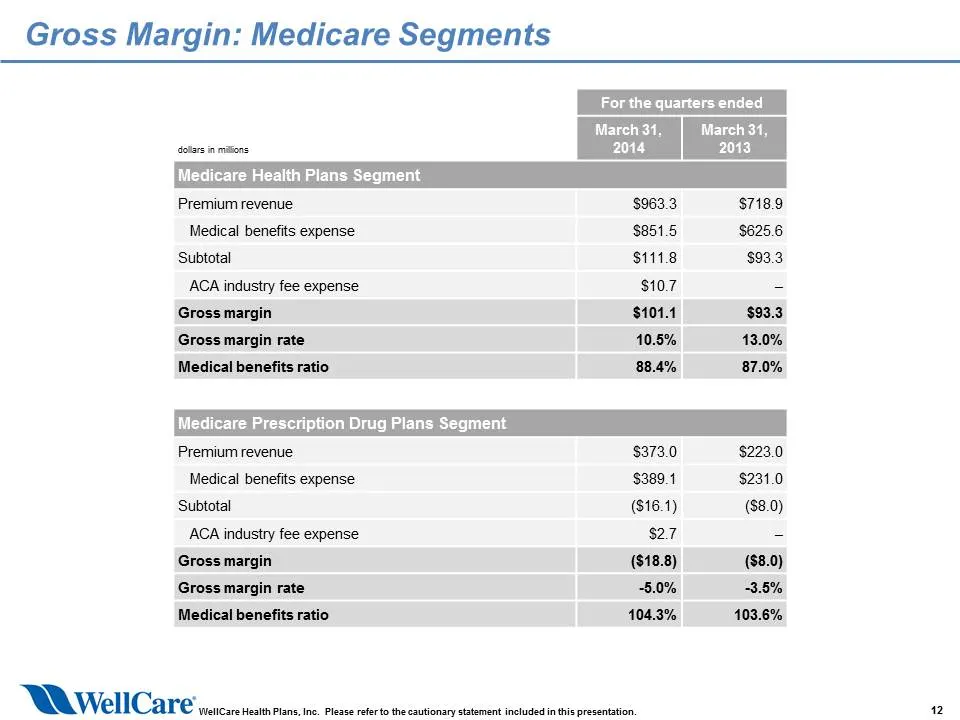
Slide 13: Gross Margin: Medicare Segments
Gross Margin: Medicare Segments For the quarters ended tars in mons Medicare Health Plans Segment Premium revenue $963.3 $718.9 Medical benefits expense $851.5 $625.6 ‘Subtotal $1118 $93.3 ACA industry fee expense $10.7 - Gross margin $101.4 $93.3 Gross margin rate 10.5% 13.0% Medical benefits ratio
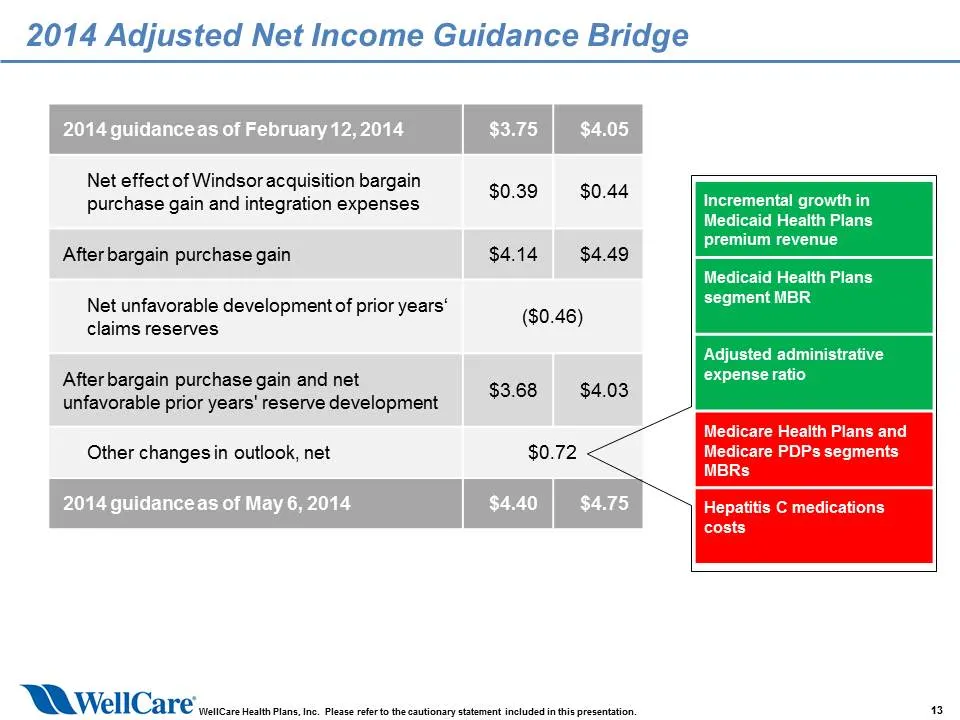
Slide 14: 2014 Adjusted Net Income Guidance Bridge
2014 Adjusted Net Income Guidance Bridge Net effect of Windsor acquisition bargain purchase gain and integration expenses After bargain purchase gain Net unfavorable development of prior years‘ claims reserves After bargain purchase gain and net unfavorable prior years' reserve development Other cha
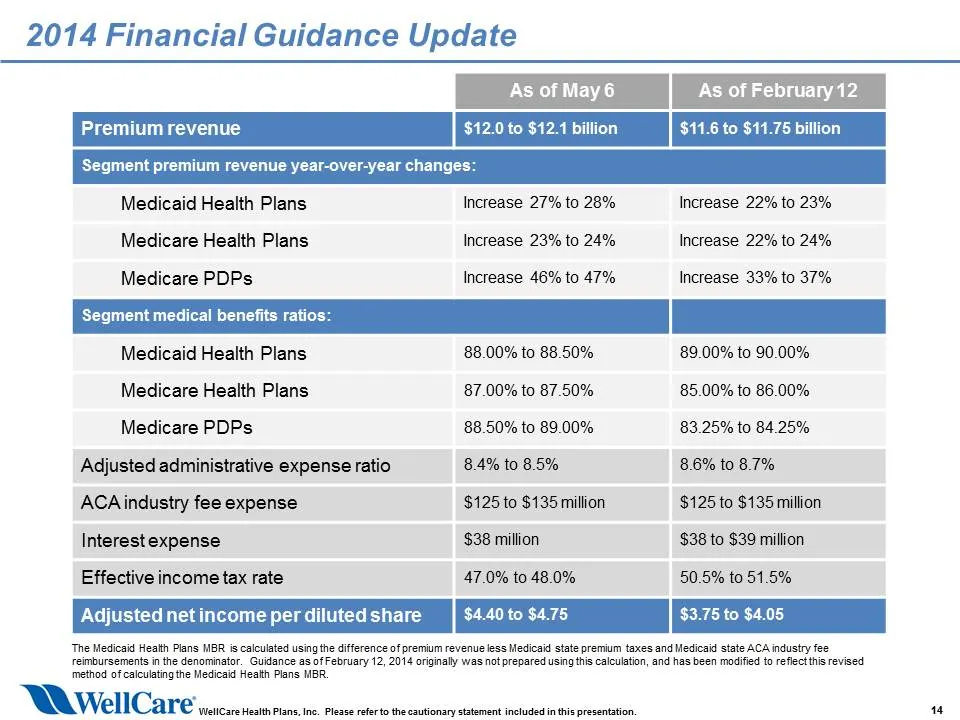
Slide 15: 2014 Financial Guidance Update
2014 Financial Guidance Update As of May6 As of February 12 $12.0 to $12.1 billion $11.6 to $11.75 billion Segment premium revenue year-over-year changes: Medicaid Health Plans Increase 27% to 28% Increase 22% to 23% Medicare Health Plans Increase 23% to 24% Increase 22% to 24% Medicare PDPs Increas
Source: SEC EDGAR · 8-K filed May 6, 2014
More decks from WellCare Health Plans Inc
 Wellcare — Investor Presentation (2026)13 slides · Oct 29, 2026
 WellCare of Kentucky — Provider Summit 202618 slides · Apr 3, 2026
 Wellcare — Investor Presentation (September 2025)13 slides · September 2025
 Wellcare — Investor Presentation (2025)78 slides · Jun 12, 2025
 Wellcare — Investor Presentation (2025)13 slides · Feb 8, 2025
 Wellcare — Investor Presentation (2025)13 slides · 2025