Teva Pharmaceutical Industries Limited · TASE:TEVA
Teva Pharmaceutical Industries — Q3 2026 Earnings Presentation
70 slides from Teva Pharmaceutical Industries's earnings presentation, Nov 3, 2026

Slide 1: Teva Pharmaceutical Industries Ltd. Q3 2026
November 3, 2026 Teva Pharmaceutical Industries Ltd.
Slide 2: Forward-looking statements
This presentation contains forward-looking statements within the meaning of the Private Securities Litigation Reform Act of 1995, which are based on management’s current beliefs and expectations and are subject to substantial risks and uncertainties, both known and unknown, that could cause our futu
Slide 3: Business update
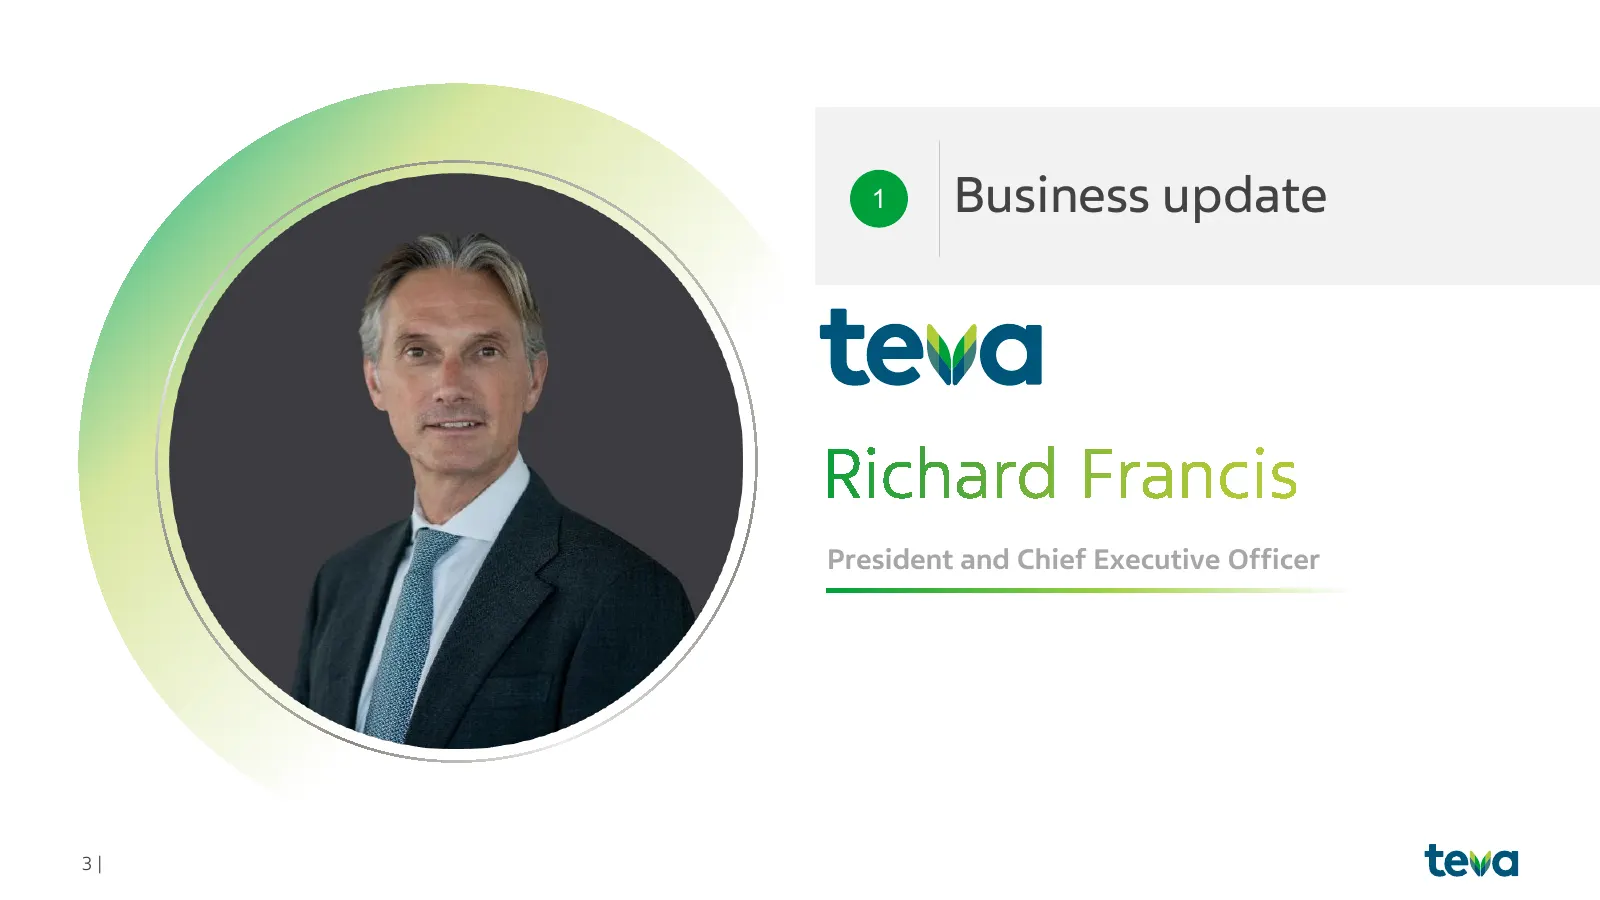
1 Business update President and Chief Executive Officer 3|
Slide 4: Agenda
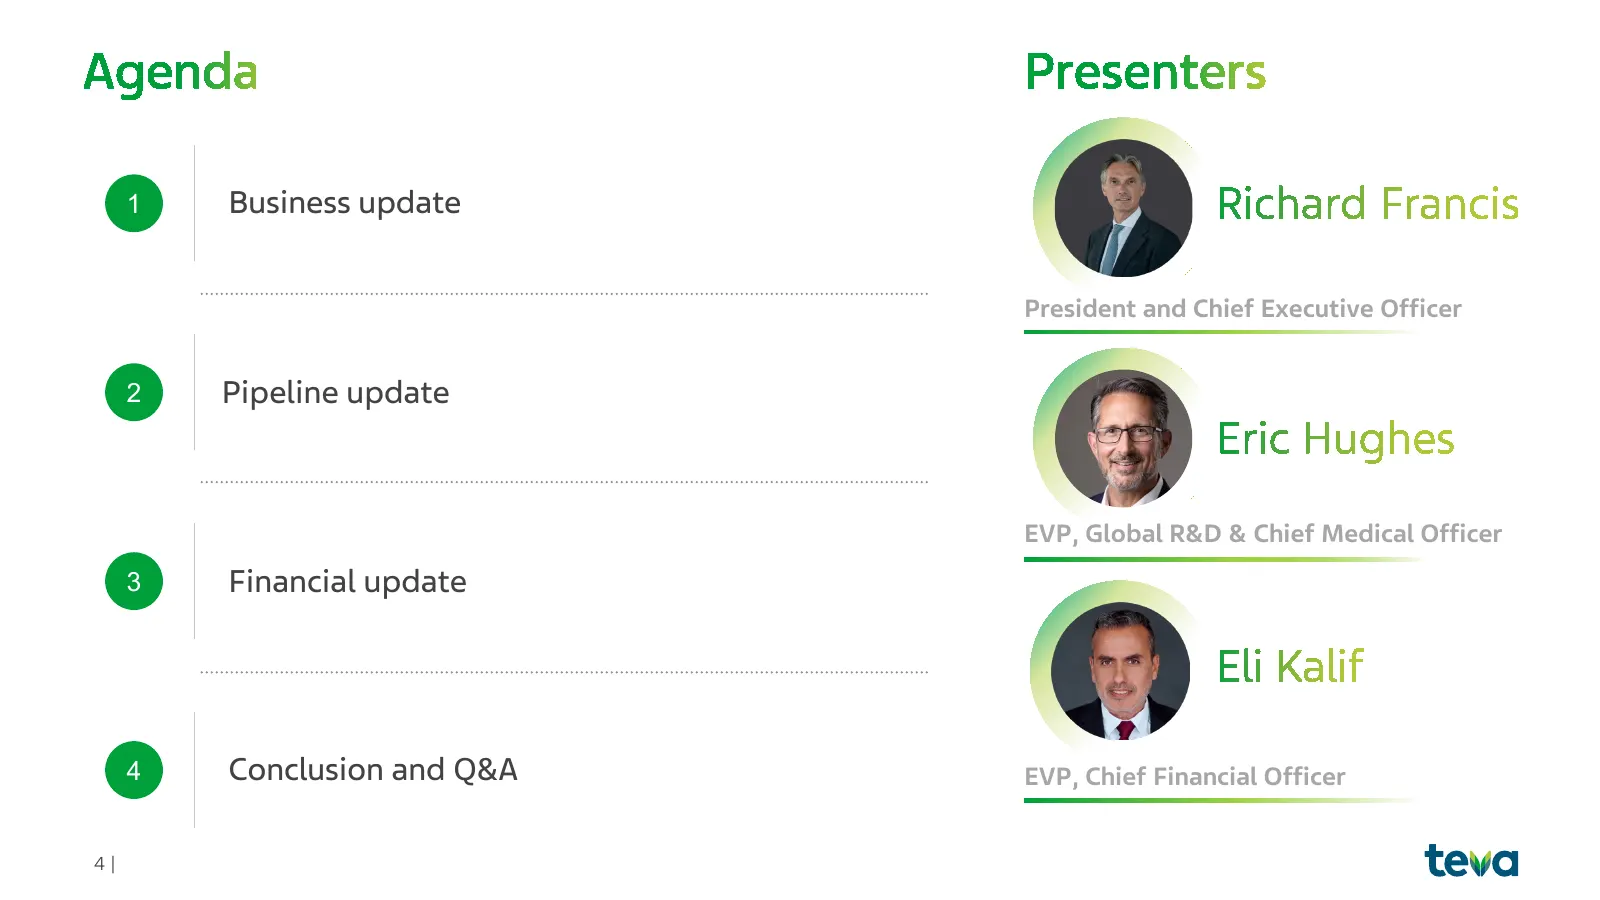
1 Business update President and Chief Executive Officer 2 Pipeline update EVP, Global R&D & Chief Medical Officer 3 Financial update 4 Conclusion and Q&A EVP, Chief Financial Officer 4|
Slide 5: Pivot to Growth strategy pillars
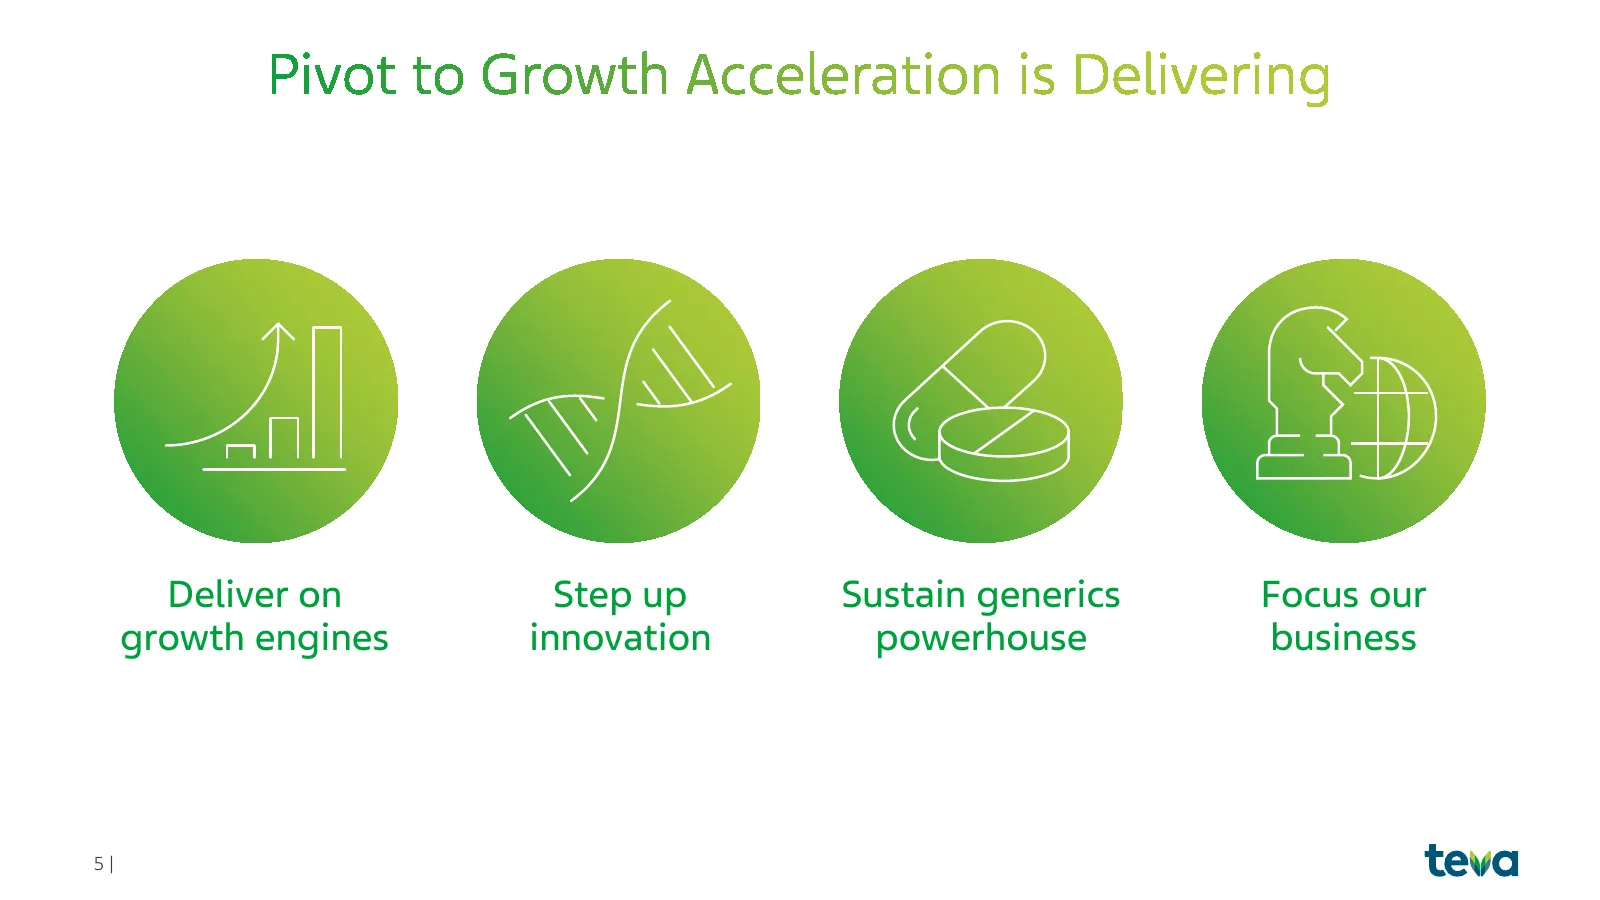
Deliver on Step up Sustain generics Focus our growth engines innovation powerhouse business 5|
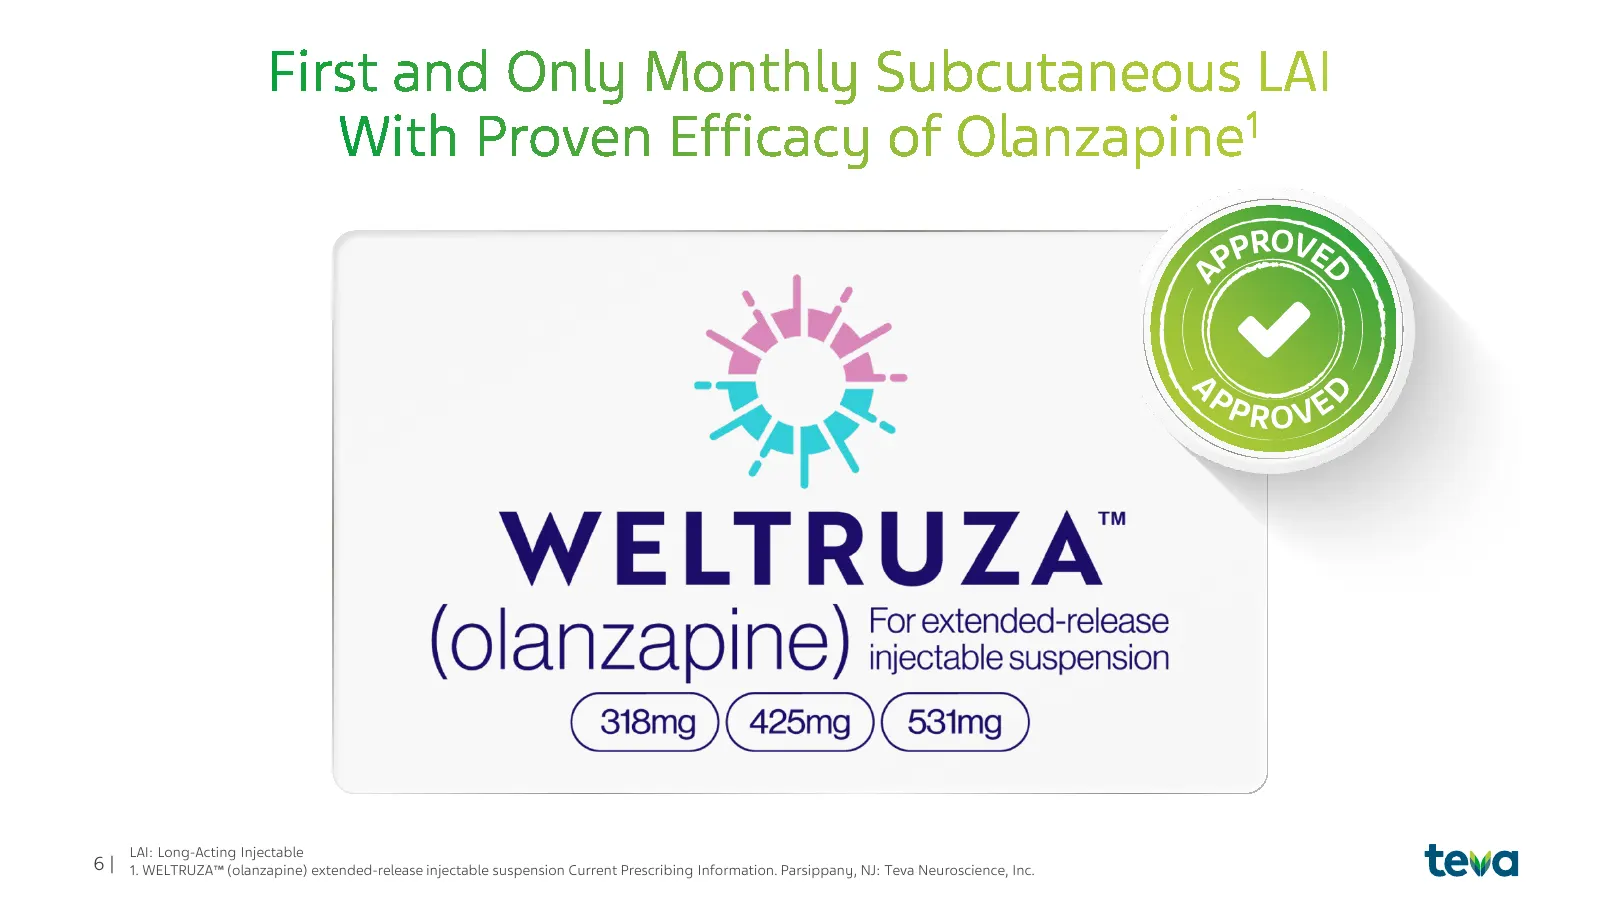
Slide 6: WELTRUZA long-acting injectable
LAI: Long-Acting Injectable 6| 1. WELTRUZA (olanzapine) extended-release injectable suspension Current Prescribing Information. Parsippany, NJ: Teva Neuroscience, Inc.
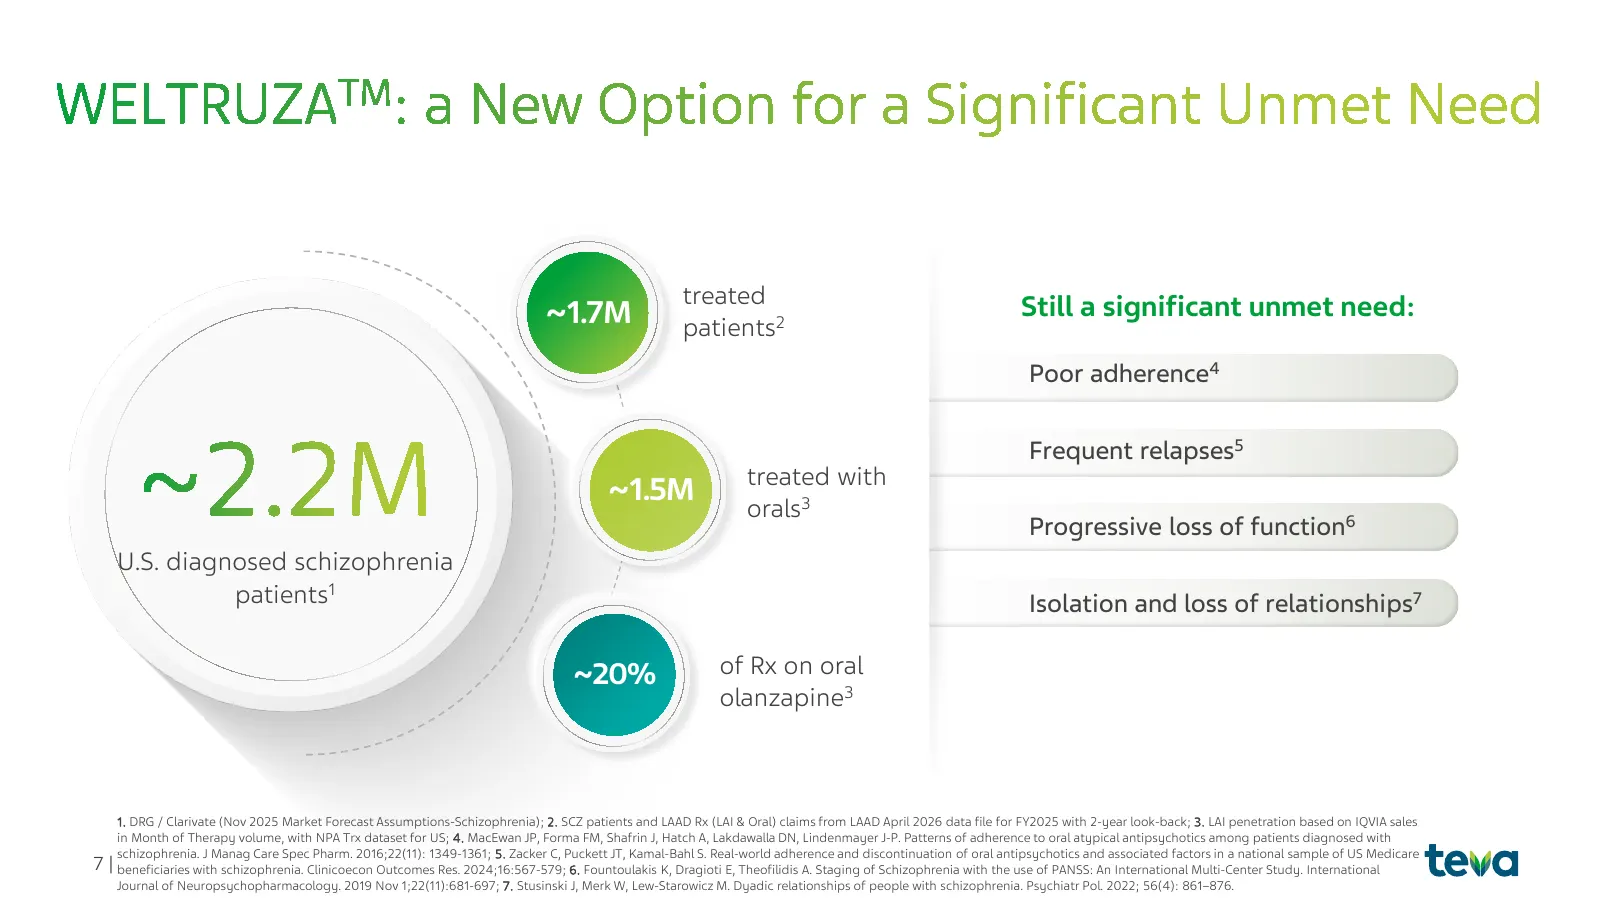
Slide 7: Unmet need in schizophrenia
treated Still a significant unmet need: ~1.7M patients2 Poor adherence4 Frequent relapses5 treated with ~1.5M orals3 Progressive loss of function6 U.S. diagnosed schizophrenia patients1 Isolation and loss of relationships7 ~20% of Rx on oral olanzapine3 1. DRG / Clarivate (Nov 2025 Market Forecast A
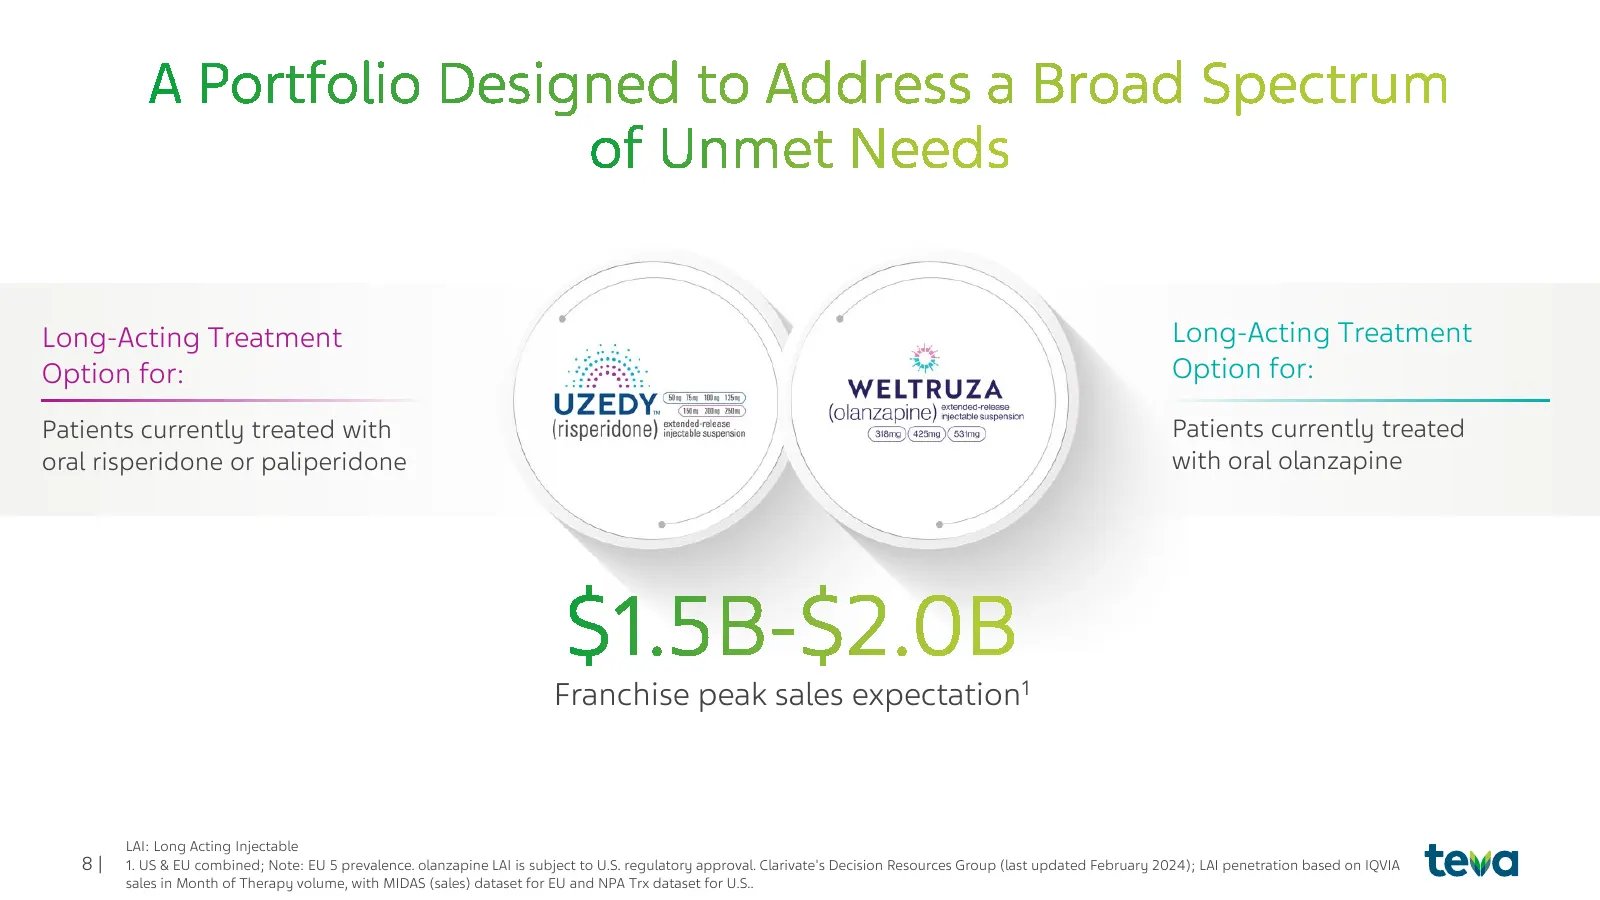
Slide 8: LAI franchise peak sales expectation
Long-Acting Treatment Long-Acting Treatment Option for: Option for: Patients currently treated with Patients currently treated oral risperidone or paliperidone with oral olanzapine Franchise peak sales expectation1 LAI: Long Acting Injectable 8| 1. US & EU combined; Note: EU 5 prevalence. olanzapine
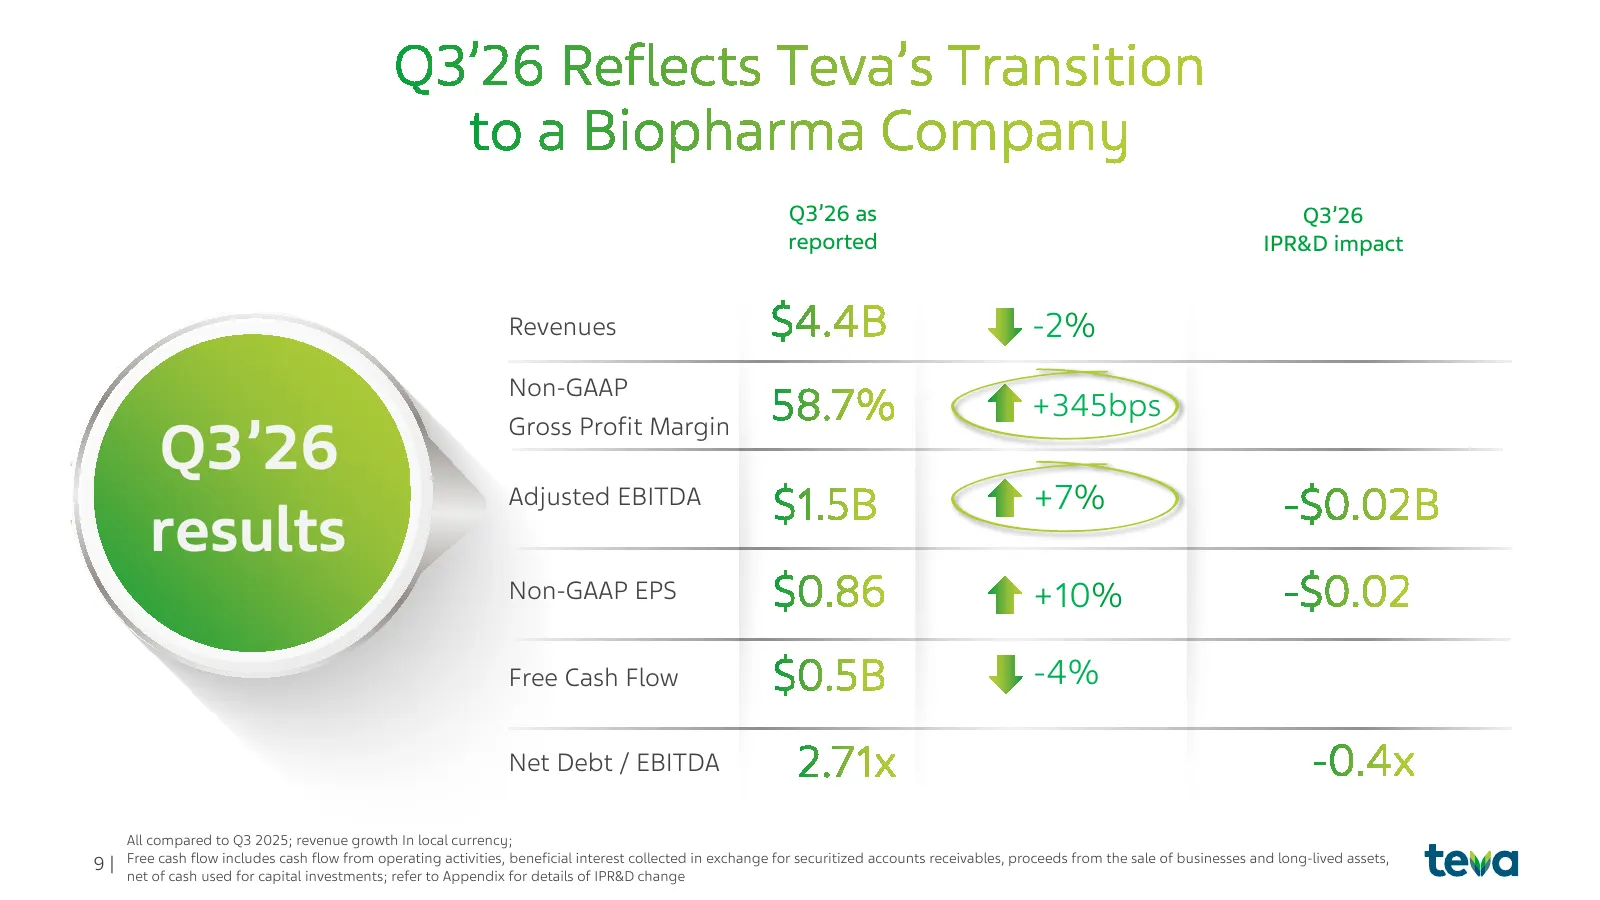
Slide 9: Q3'26 results
Q3’26 as Q3’26 reported IPR&D impact Revenues -2% Non-GAAP +345bps Q3’26 Gross Profit Margin Adjusted EBITDA +7% results Non-GAAP EPS +10% Free Cash Flow -4% Net Debt / EBITDA All compared to Q3 2025; revenue growth In local currency; 9| Free cash flow includes cash flow from operating activities, b
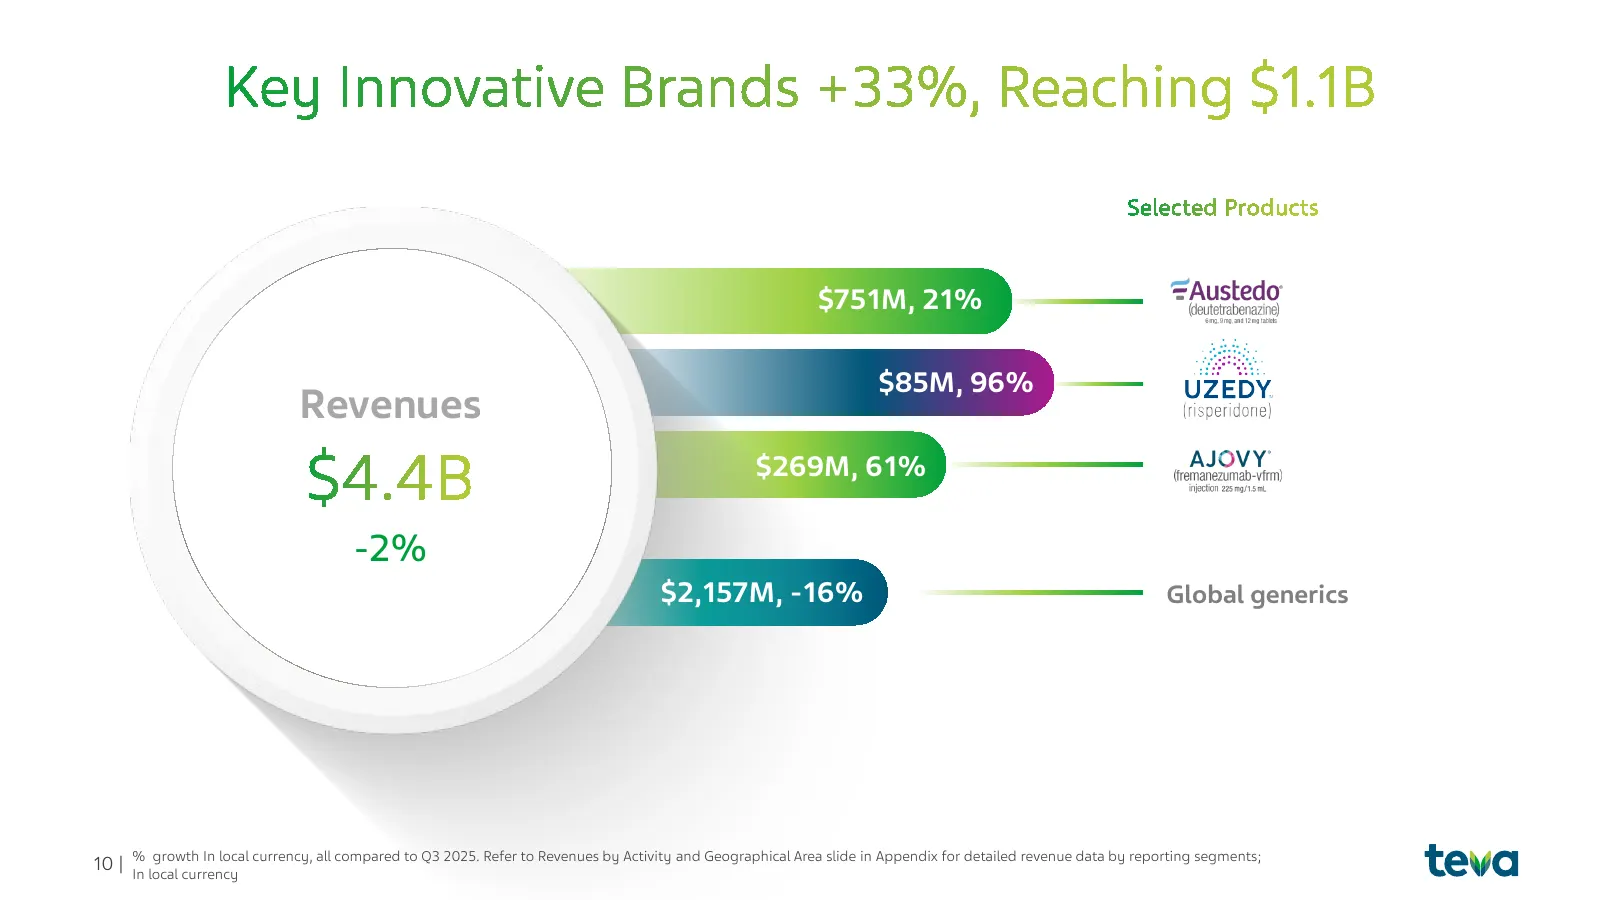
Slide 10: Revenues
$751M, 21% $85M, 96% Revenues $269M, 61% -2% $2,157M, -16% Global generics 10 | % growth In local currency, all compared to Q3 2025. Refer to Revenues by Activity and Geographical Area slide in Appendix for detailed revenue data by reporting segments; In local currency
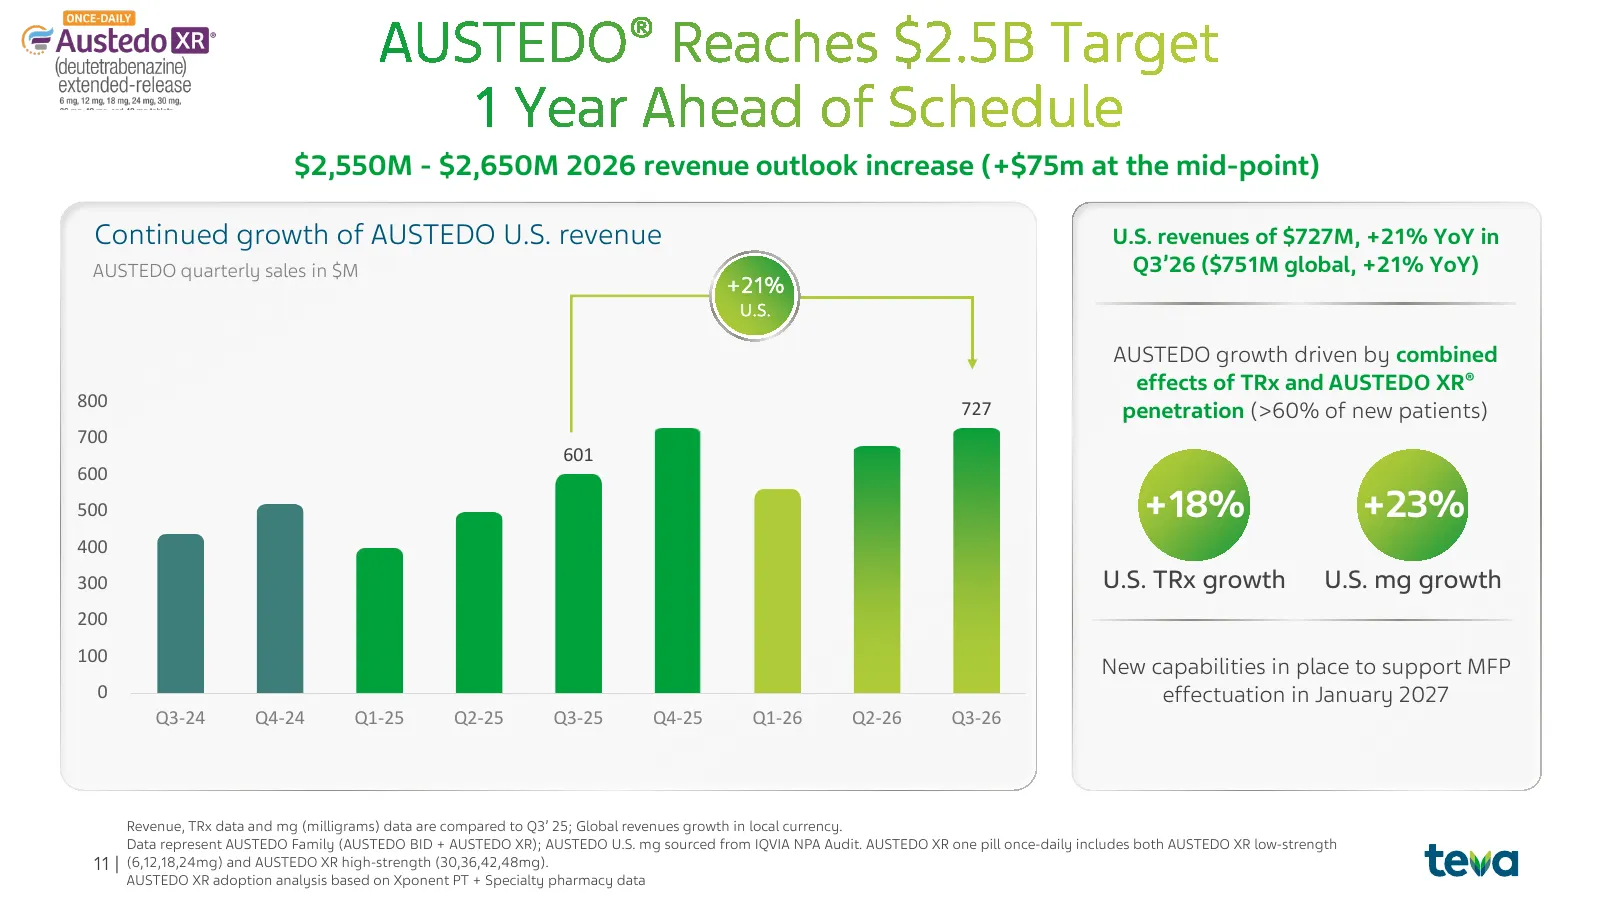
Slide 11: AUSTEDO growth
$2,550M - $2,650M 2026 revenue outlook increase (+$75m at the mid-point) Continued growth of AUSTEDO U.S. revenue U.S. revenues of $727M, +21% YoY in AUSTEDO quarterly sales in $M Q3’26 ($751M global, +21% YoY) +21% U.S. AUSTEDO growth driven by combined effects of TRx and AUSTEDO XR® 800 727 penetr
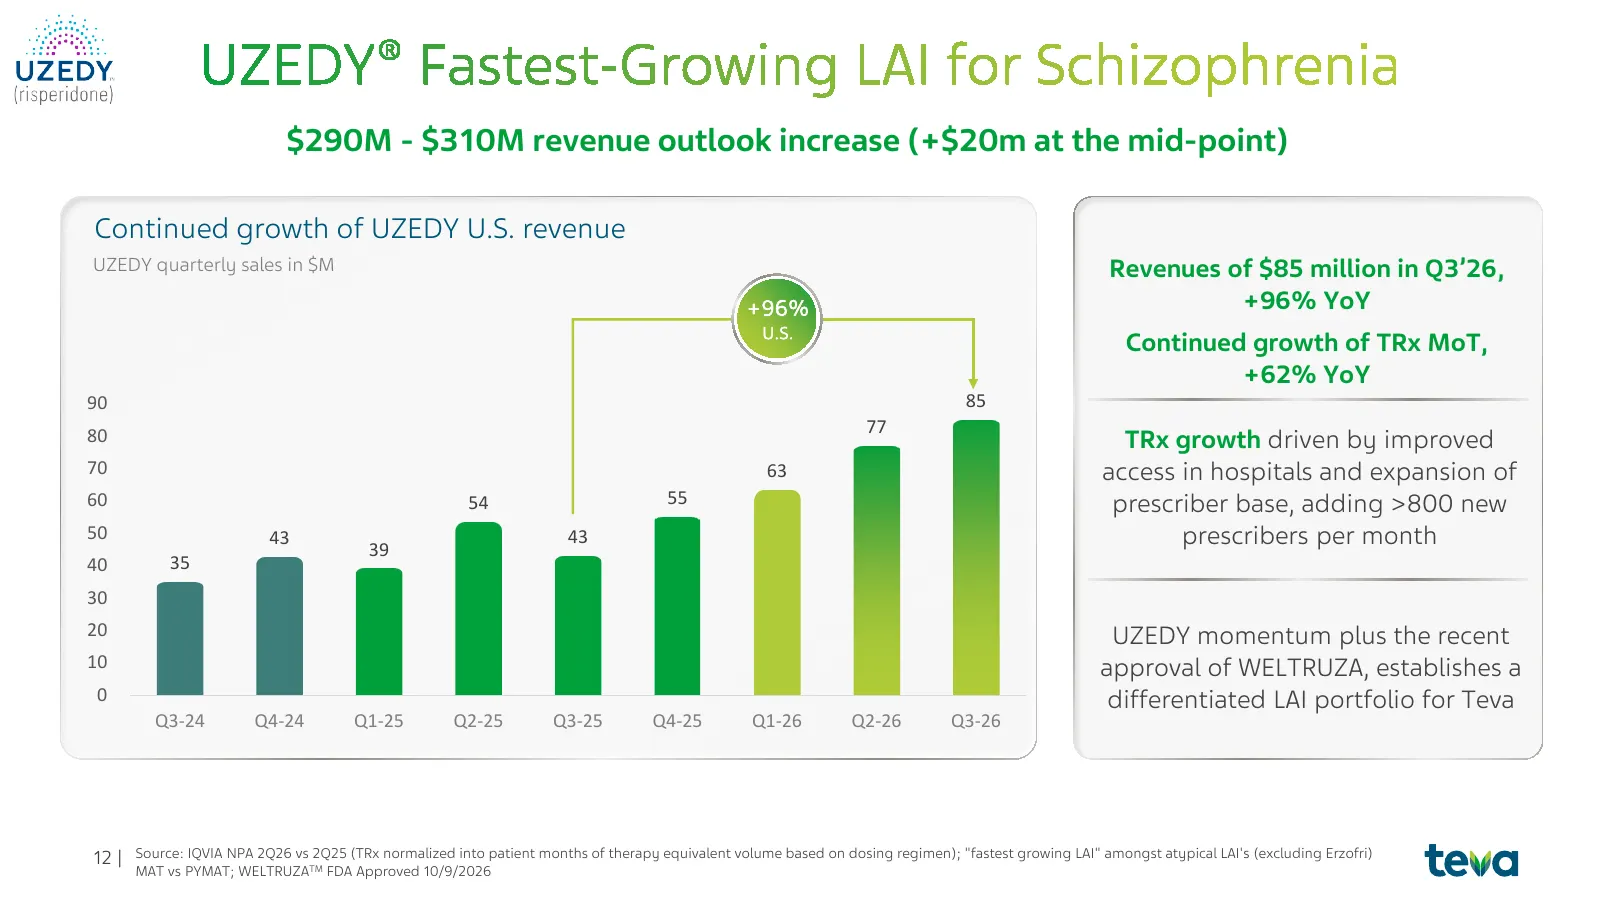
Slide 12: UZEDY growth
$290M - $310M revenue outlook increase (+$20m at the mid-point) Continued growth of UZEDY U.S. revenue UZEDY quarterly sales in $M Revenues of $85 million in Q3’26, +96% +96% YoY U.S. Continued growth of TRx MoT, +62% YoY 90 85 80 77 TRx growth driven by improved 70 63 access in hospitals and expans
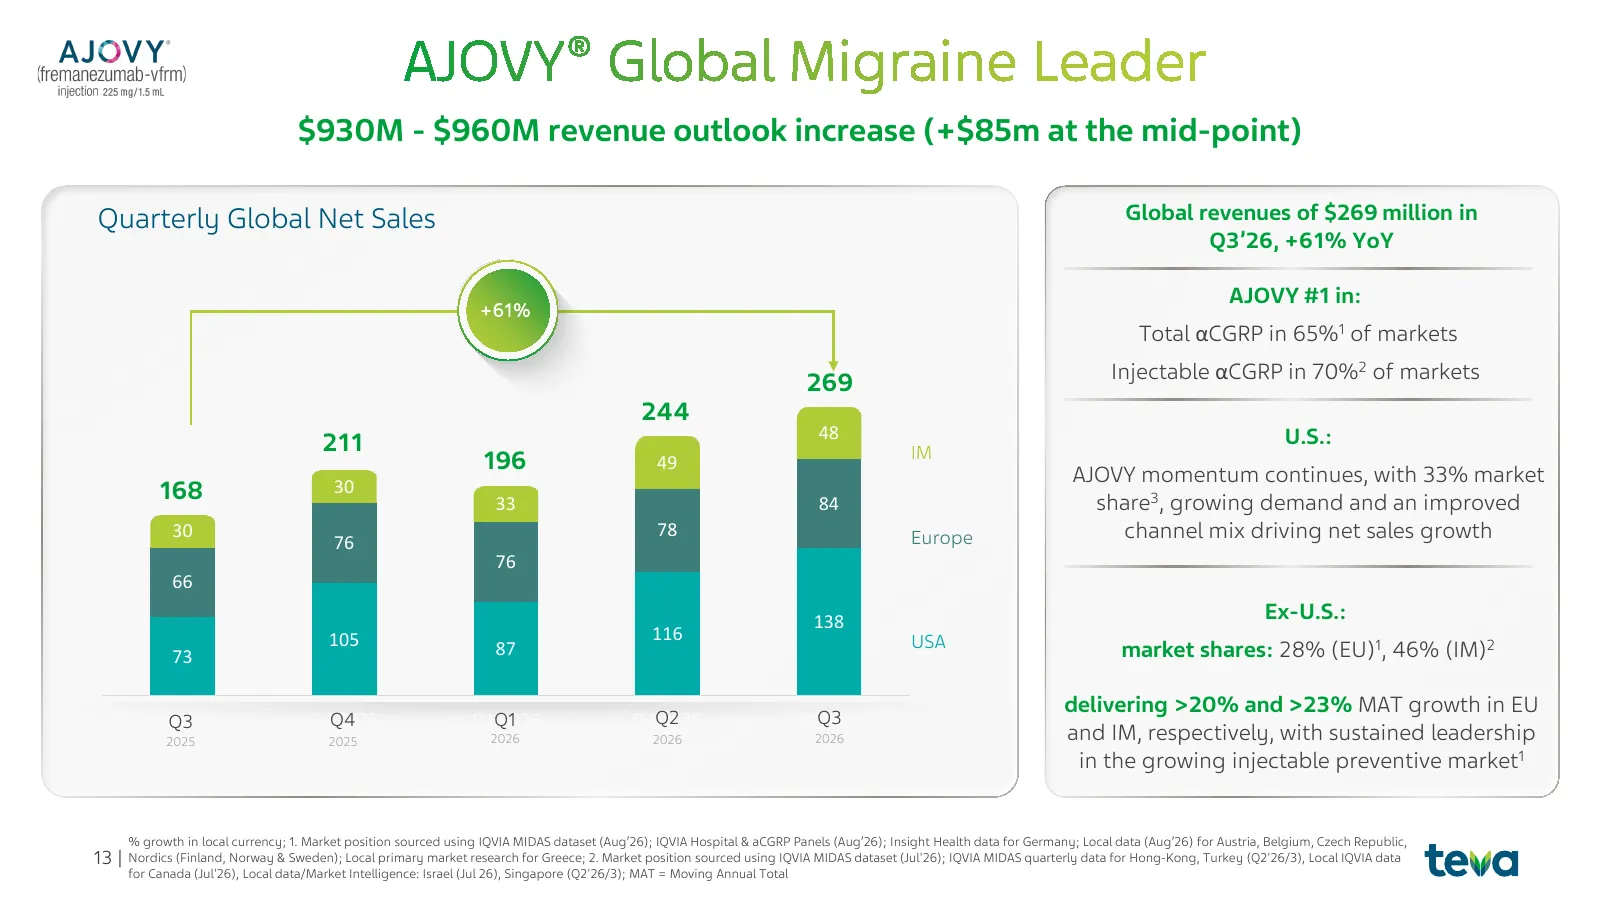
Slide 13: AJOVY momentum
$930M - $960M revenue outlook increase (+$85m at the mid-point) Quarterly Global Net Sales Global revenues of $269 million in Q3’26, +61% YoY AJOVY #1 in: +61% Total αCGRP in 65%1 of markets 269 Injectable αCGRP in 70%2 of markets 244 48 U.S.: 211 IM 196 49 30 AJOVY momentum continues, with 33% mark
Slide 14: Tourette syndrome unmet need and ecopipam
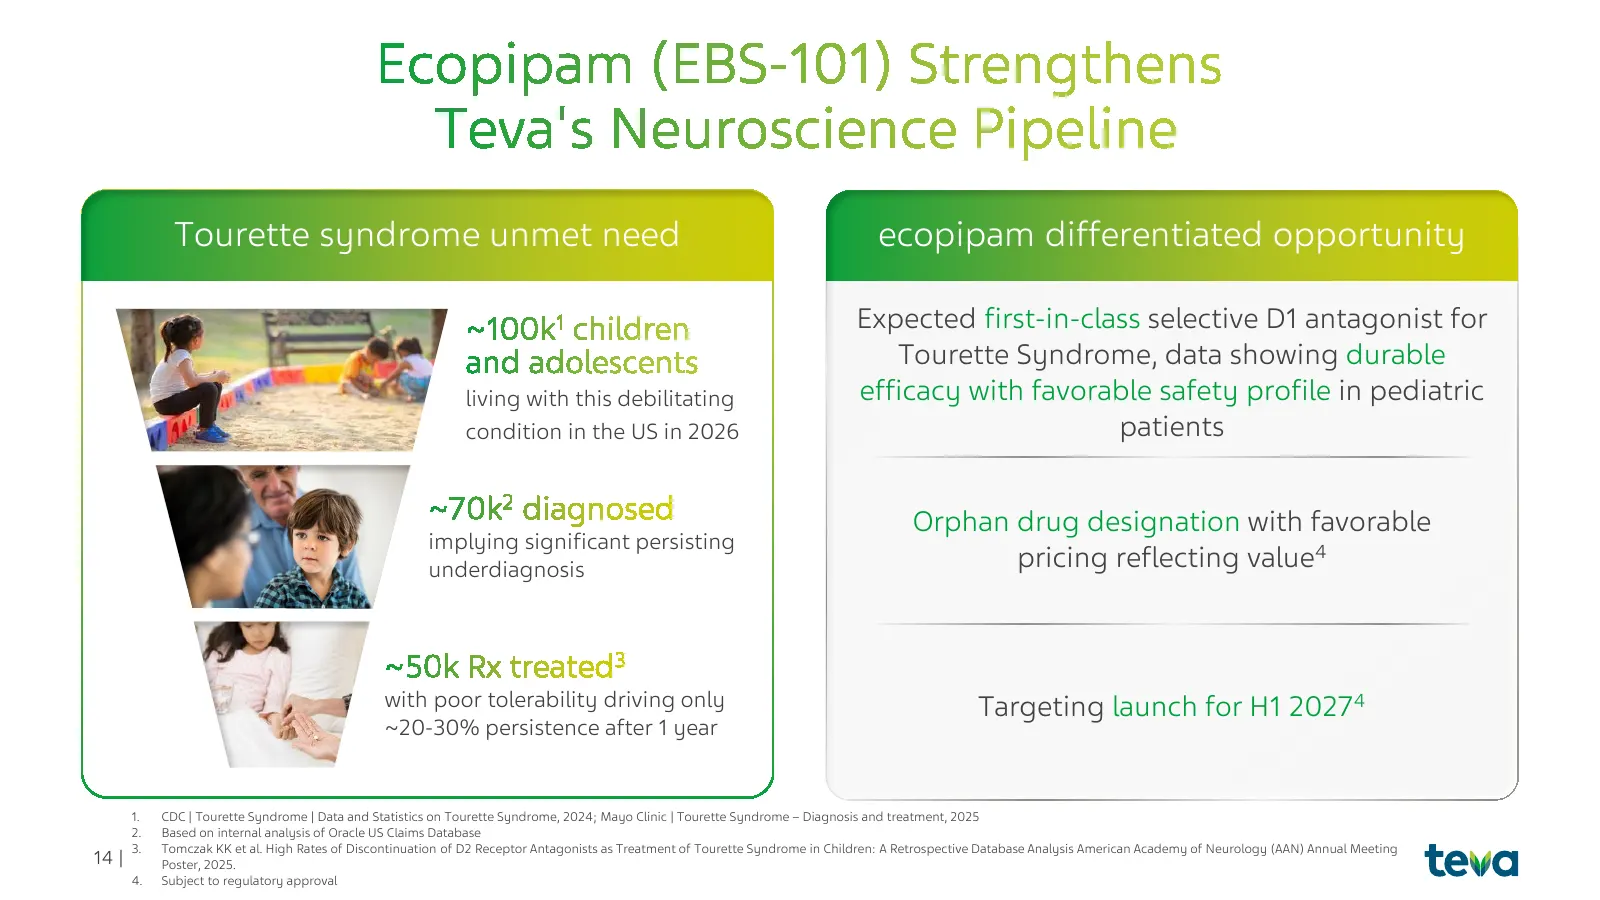
Tourette syndrome unmet need ecopipam differentiated opportunity Expected first-in-class selective D1 antagonist for Tourette Syndrome, data showing durable living with this debilitating efficacy with favorable safety profile in pediatric condition in the US in 2026 patients Orphan drug designation
Slide 15: BXCL-501 strategic fit for Teva
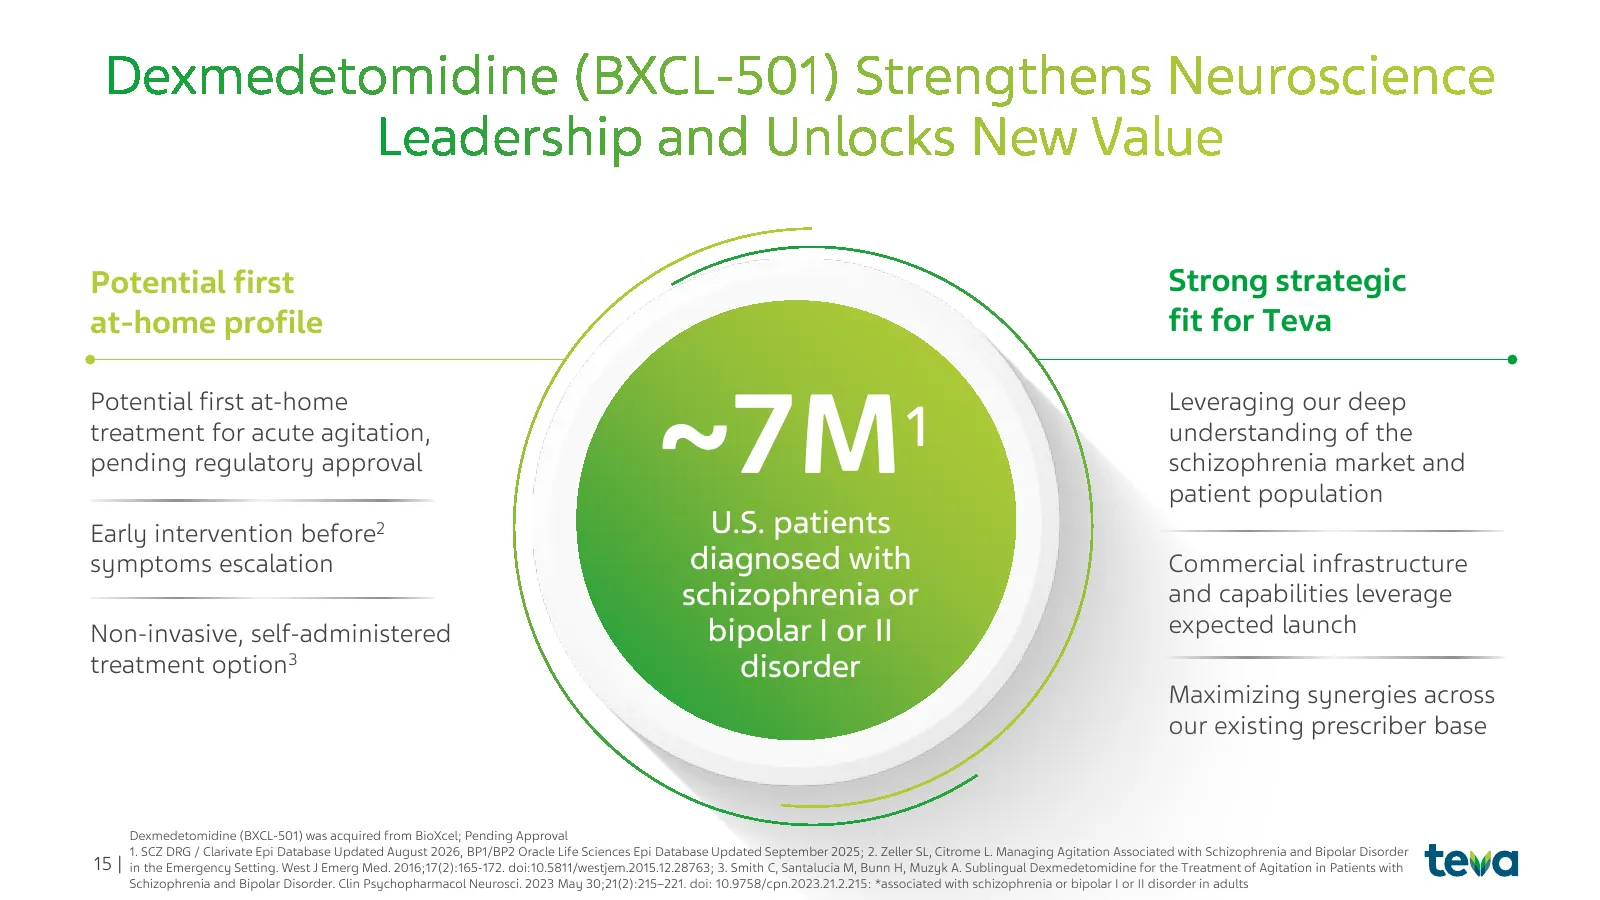
Potential first Strong strategic at-home profile fit for Teva ~7M Potential first at-home Leveraging our deep treatment for acute agitation, pending regulatory approval 1 understanding of the schizophrenia market and patient population Early intervention before2 U.S. patients symptoms escalation dia
Slide 16: Potential to launch a product per year
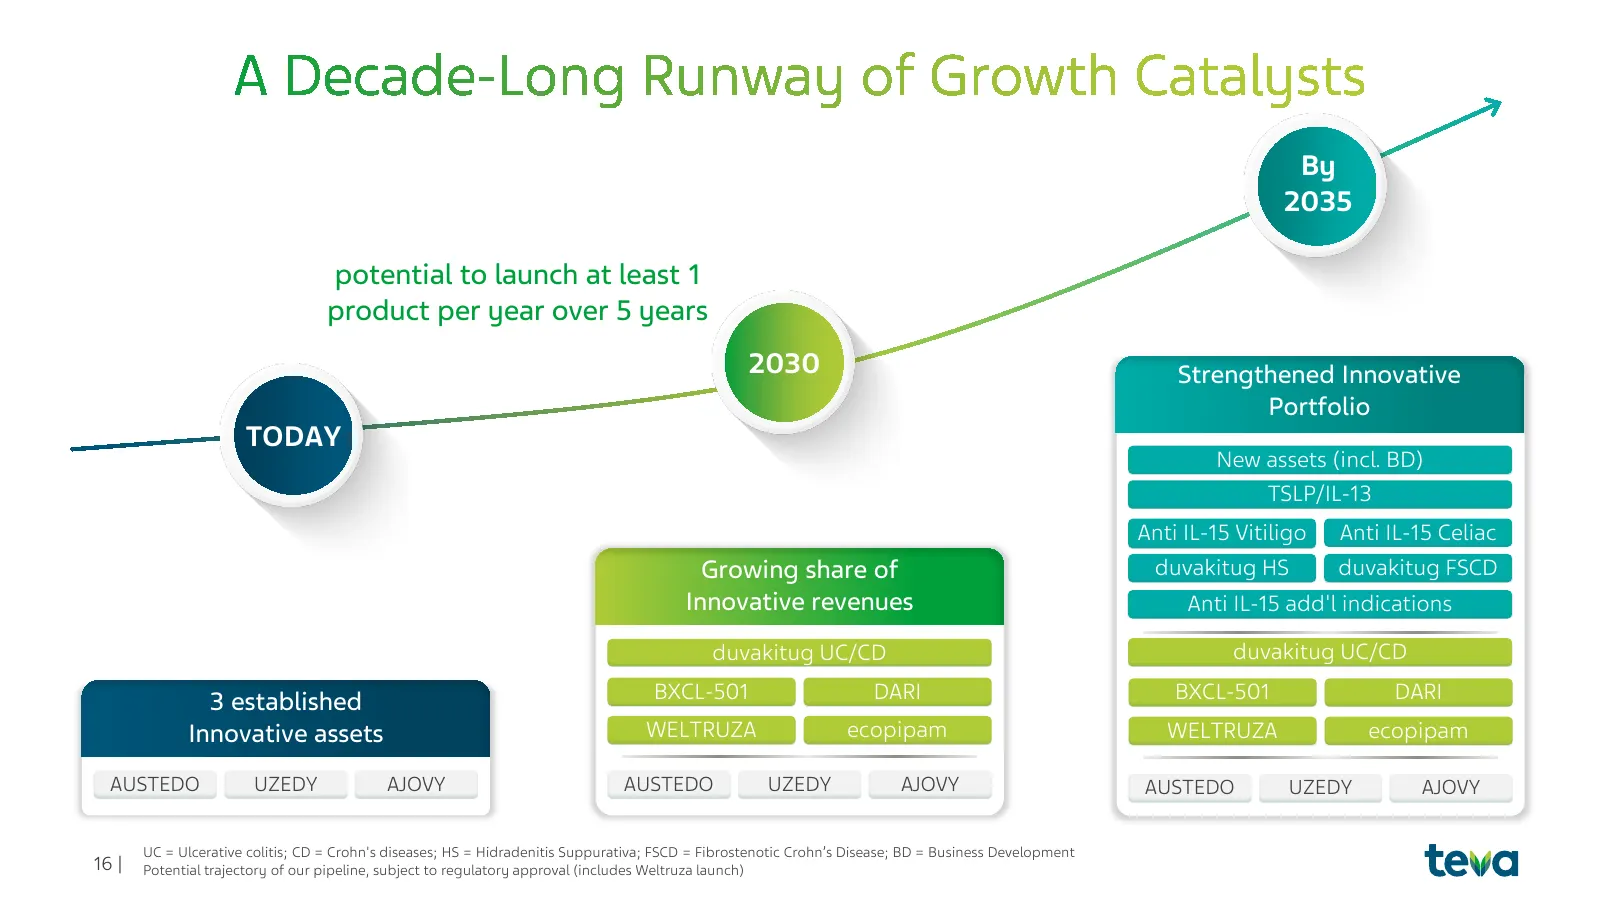
By 2035 potential to launch at least 1 product per year over 5 years 2030 Strengthened Innovative Portfolio TODAY New assets (incl. BD) TSLP/IL-13 Anti IL-15 Vitiligo Anti IL-15 Celiac Growing share of duvakitug HS duvakitug FSCD Innovative revenues Anti IL-15 add'l indications duvakitug UC/CD duvak
Slide 17: Late-stage pipeline assets
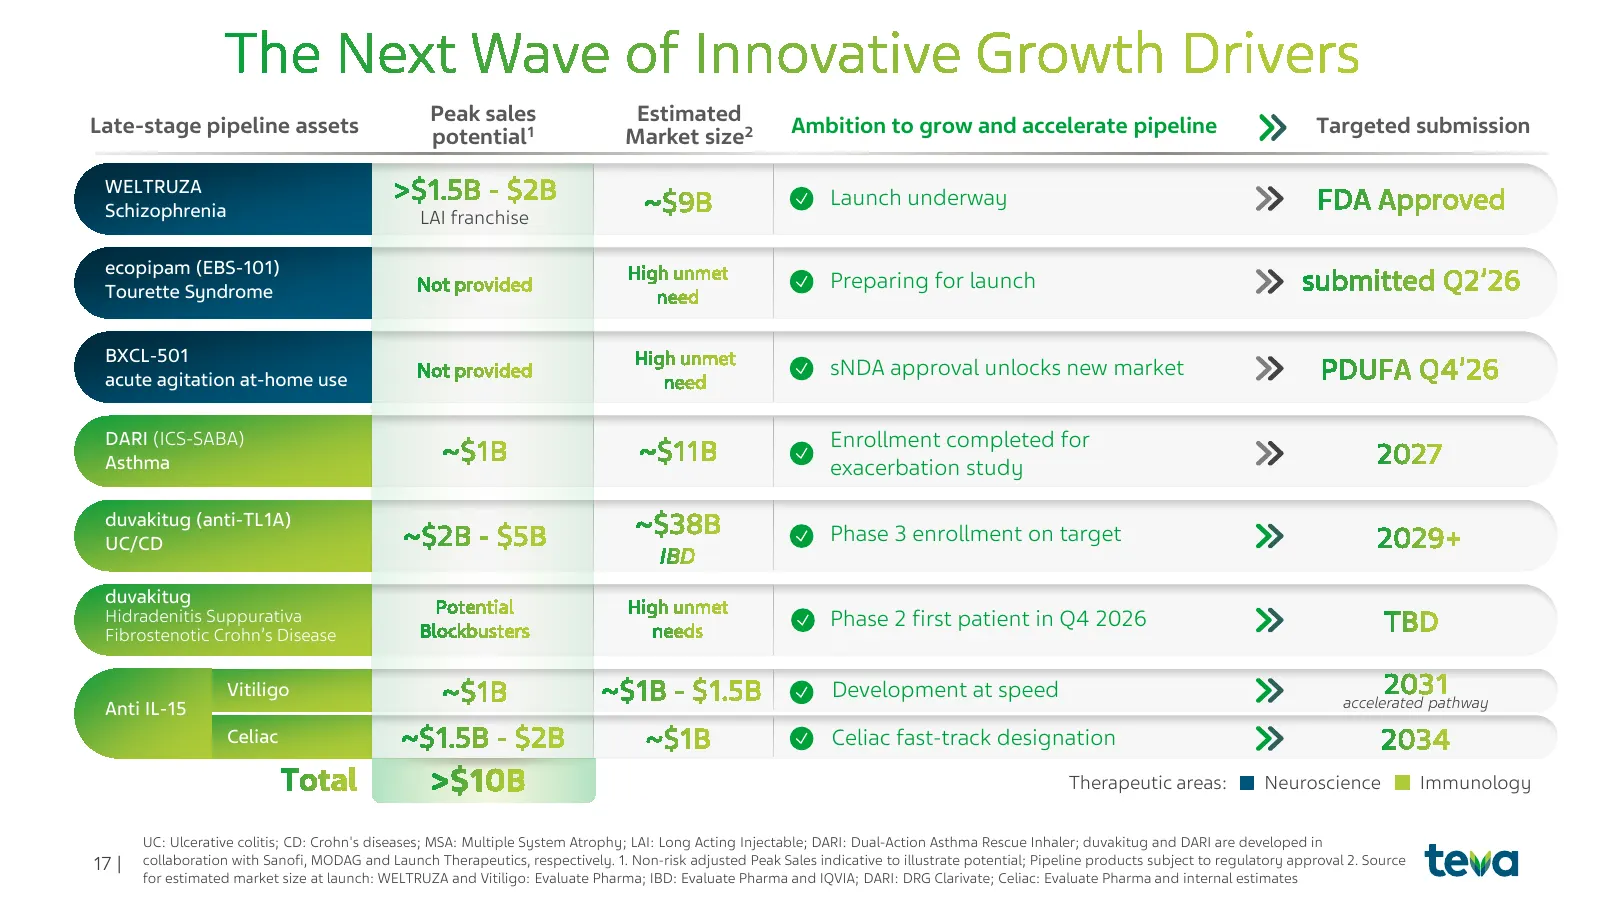
Late-stage pipeline assets Peak sales Estimated Ambition to grow and accelerate pipeline Targeted submission potential1 Market size2 WELTRUZA Launch underway Schizophrenia LAI franchise ecopipam (EBS-101) Tourette Syndrome Preparing for launch BXCL-501 sNDA approval unlocks new market acute agitatio
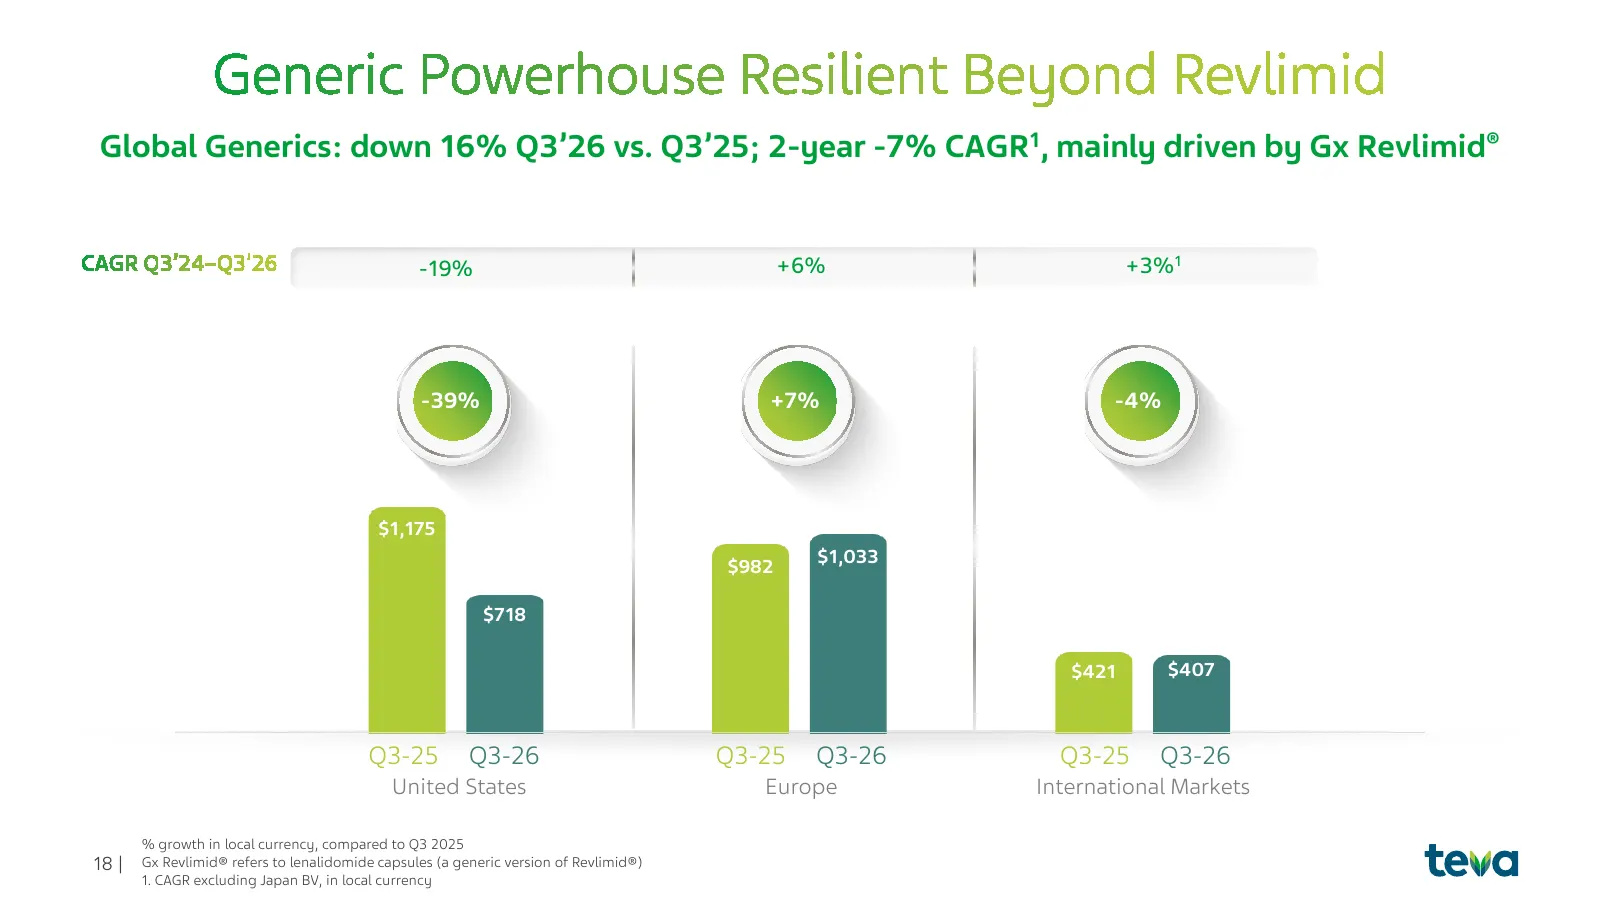
Slide 18: Global Generics performance
Global Generics: down 16% Q3’26 vs. Q3’25; 2-year -7% CAGR1, mainly driven by Gx Revlimid® -19% +6% +3%1 +15% -39% +7% +15% -4% $1,175 $982 $1,033 $718 $421 $407 Q3-25 Q3-26 Q3-25 Q3-26 Q3-25 Q3-26 United States Europe International Markets % growth in local currency, compared to Q3 2025 18 | Gx Rev
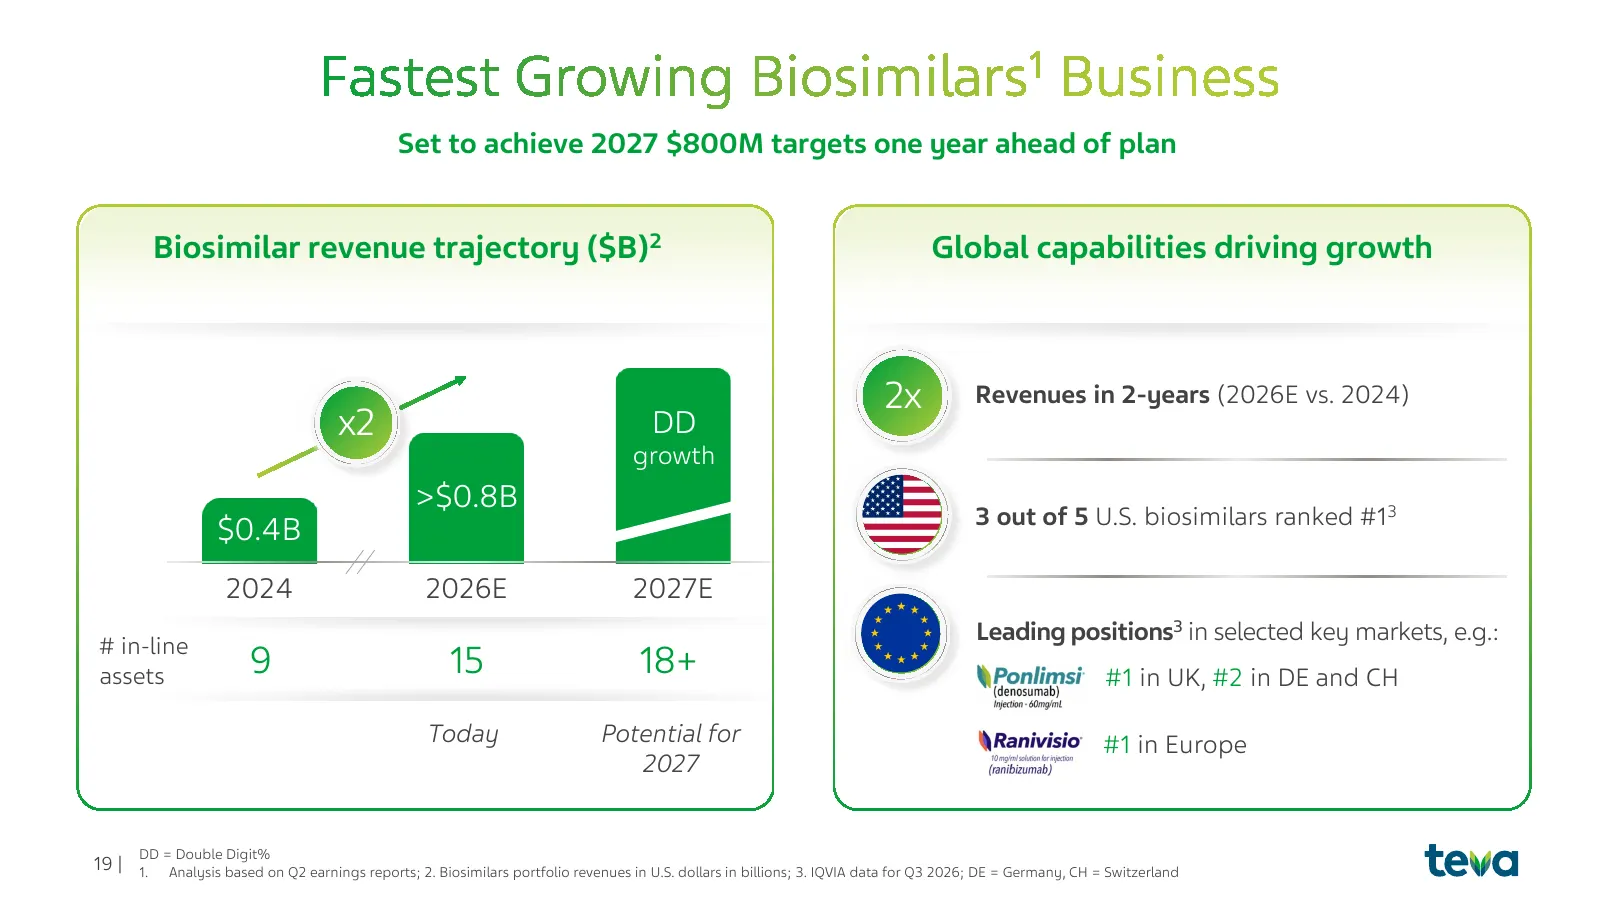
Slide 19: Biosimilar revenue trajectory
Set to achieve 2027 $800M targets one year ahead of plan Biosimilar revenue trajectory ($B)2 Global capabilities driving growth 2x Revenues in 2-years (2026E vs. 2024) x2 DD growth >$0.8B 3 out of 5 U.S. biosimilars ranked #13 $0.4B 2024 2026E 2027E Leading positions3 in selected key markets, e.g.:
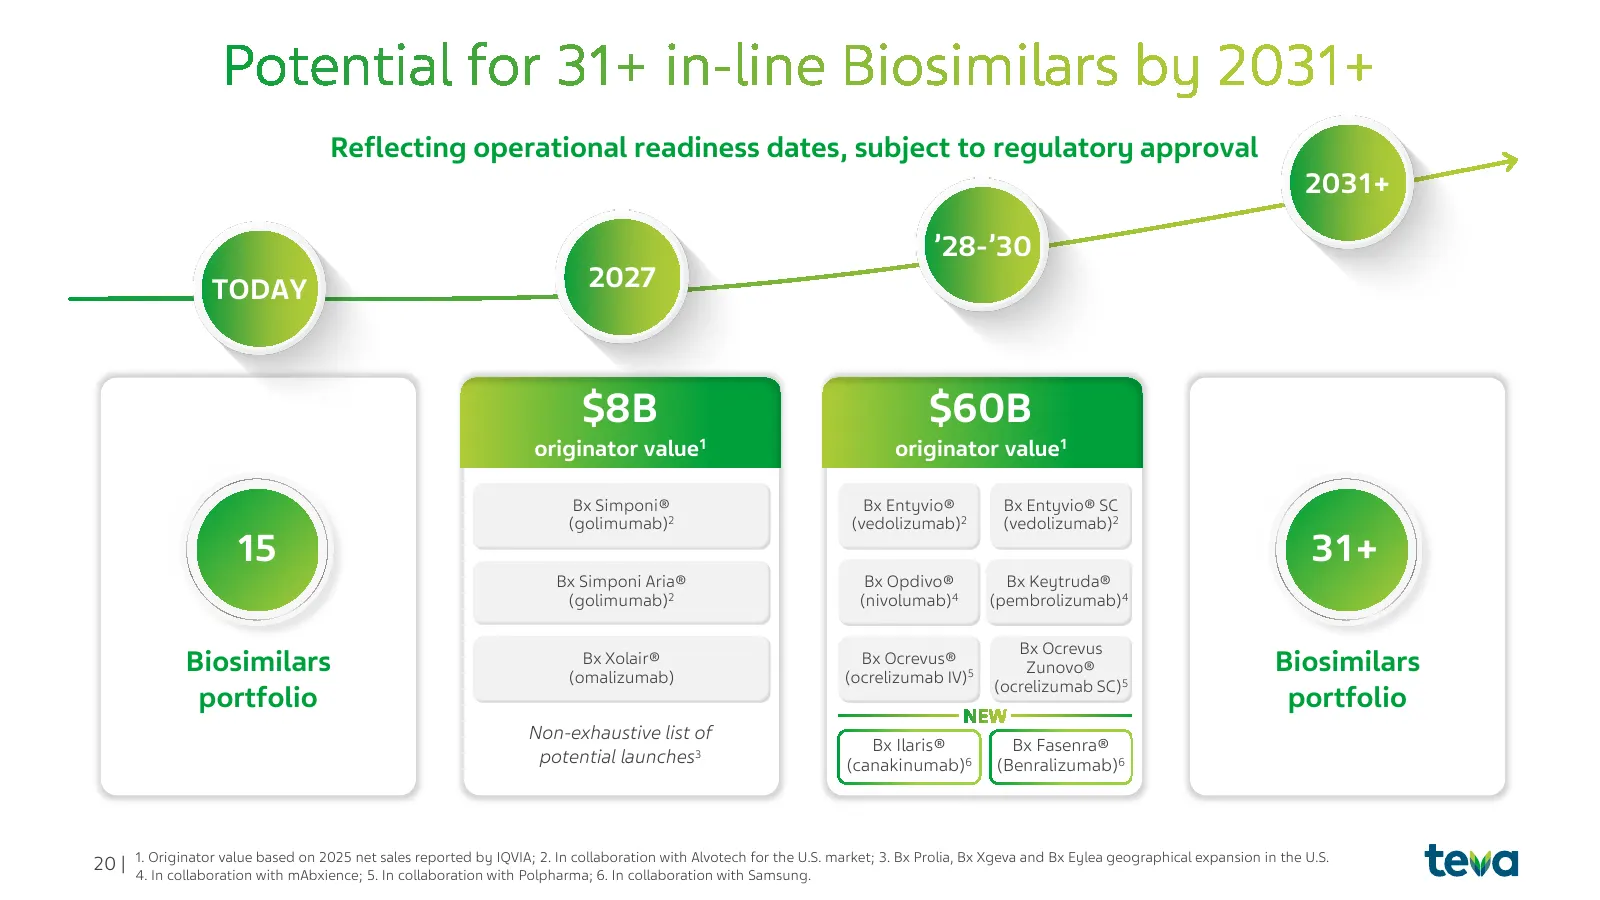
Slide 20: Biosimilar potential launches
Reflecting operational readiness dates, subject to regulatory approval 2031+ ’28-’30 TODAY 2027 $8B $60B originator value1 originator value1 Bx Simponi® Bx Entyvio® Bx Entyvio® SC (golimumab)2 (vedolizumab)2 (vedolizumab)2 15 31+ Bx Simponi Aria® Bx Opdivo® Bx Keytruda® (golimumab)2 (nivolumab)4 (pe
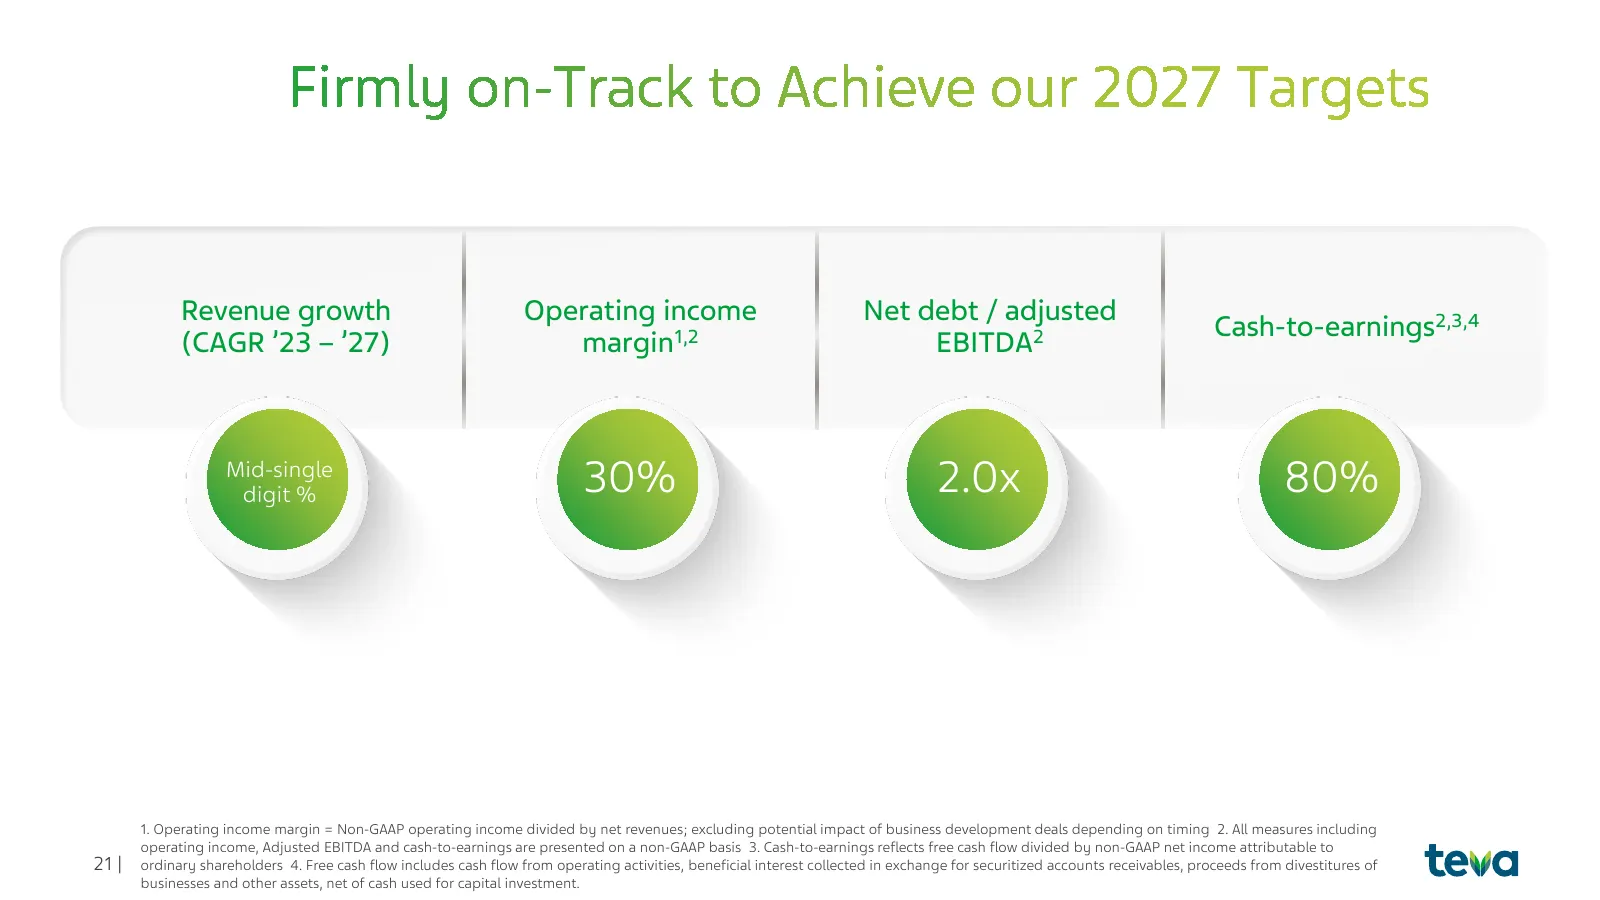
Slide 21: Long-term financial targets
Revenue growth Operating income Net debt / adjusted Cash-to-earnings2,3,4 (CAGR ’23 – ’27) margin1,2 EBITDA2 Mid-single digit % 30% 2.0x 80% 1. Operating income margin = Non-GAAP operating income divided by net revenues; excluding potential impact of business development deals depending on timing 2.
Slide 22: Pipeline Update
2 Pipeline Update Executive Vice President, Global R&D & Chief Medical Officer 22 |
Slide 23: Late-stage pipeline assets
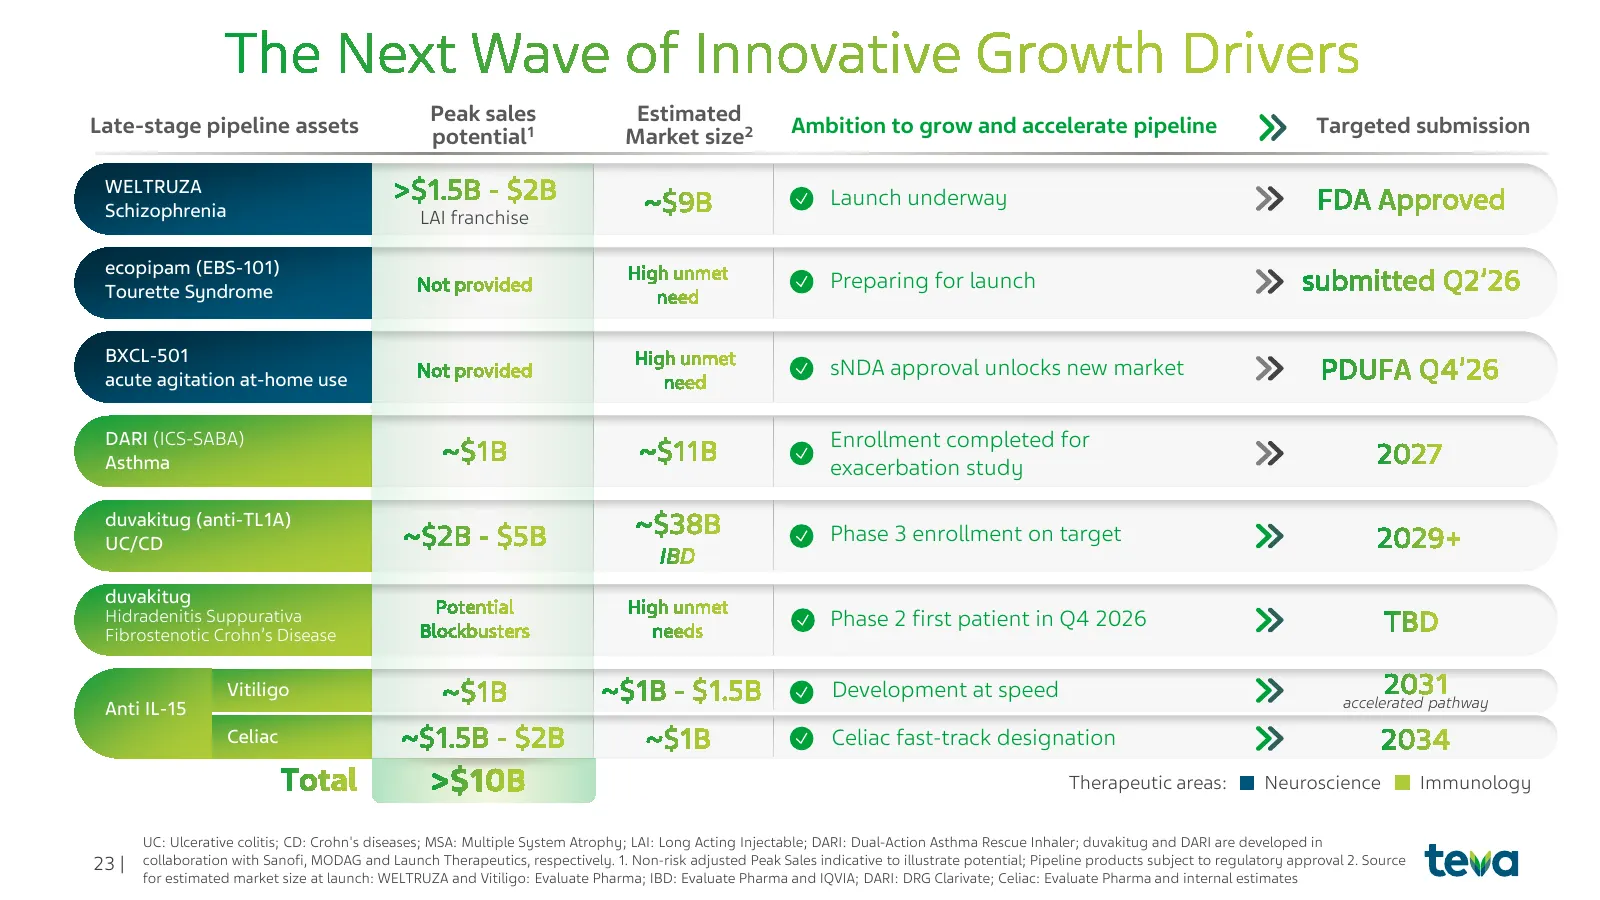
Late-stage pipeline assets Peak sales Estimated Ambition to grow and accelerate pipeline Targeted submission potential1 Market size2 WELTRUZA Launch underway Schizophrenia LAI franchise ecopipam (EBS-101) Tourette Syndrome Preparing for launch BXCL-501 sNDA approval unlocks new market acute agitatio
Slide 24: WELTRUZA monthly subcutaneous LAI
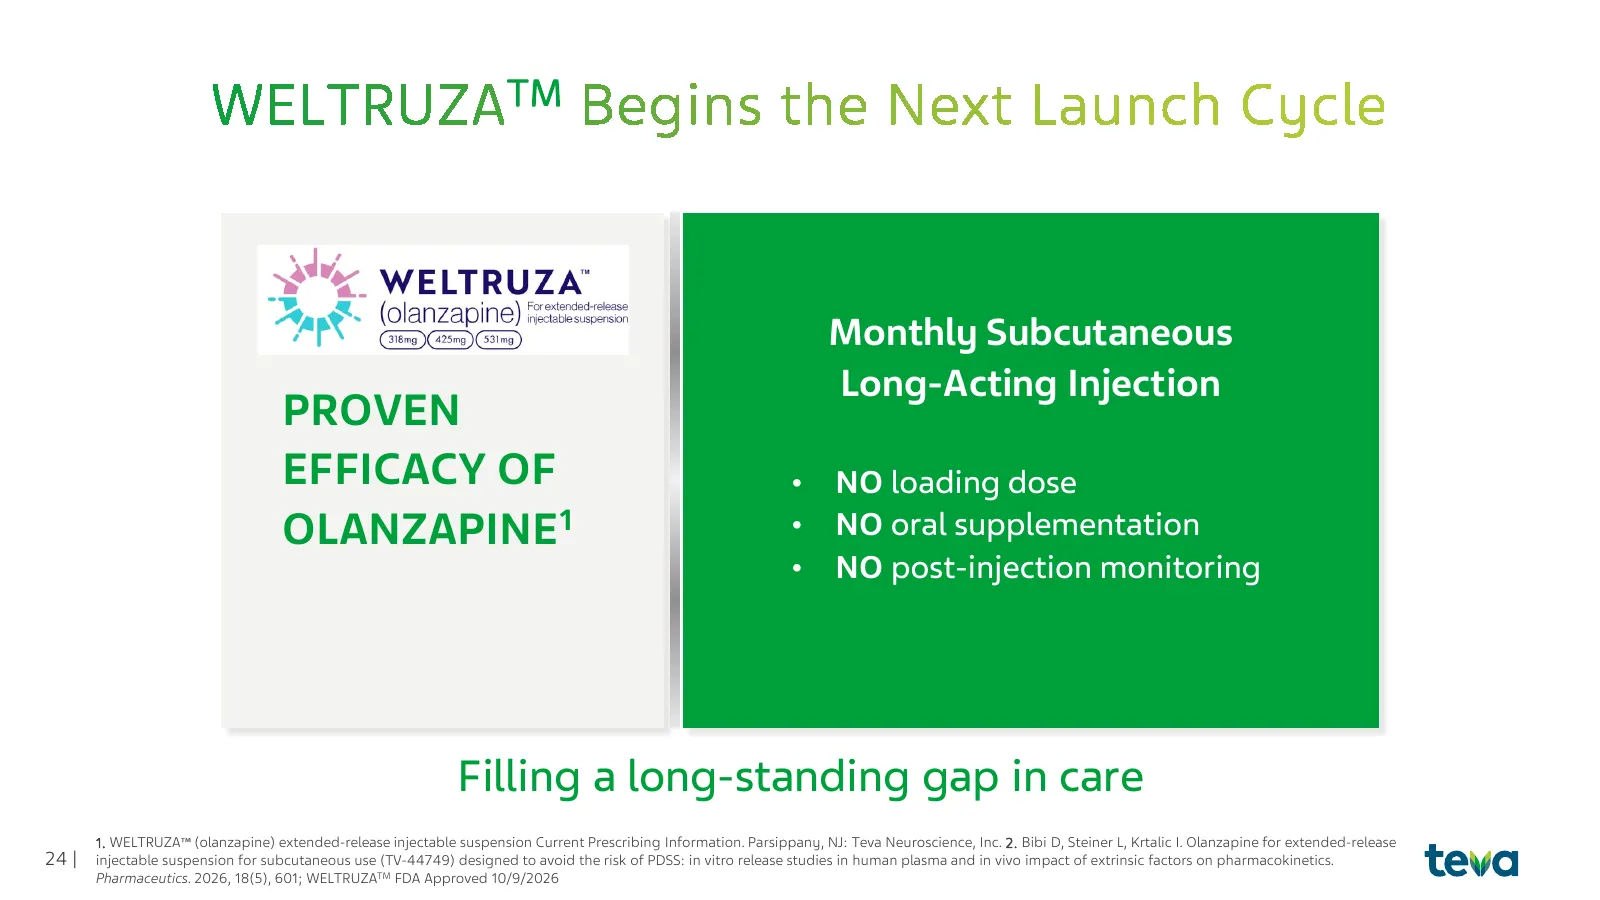
TM Monthly Subcutaneous Long-Acting Injection PROVEN EFFICACY OF • NO loading dose OLANZAPINE1 • NO oral supplementation • NO post-injection monitoring • Filling a long-standing gap in care 1. WELTRUZA (olanzapine) extended-release injectable suspension Current Prescribing Information. Parsippany, N
Slide 25: Recent pipeline milestones
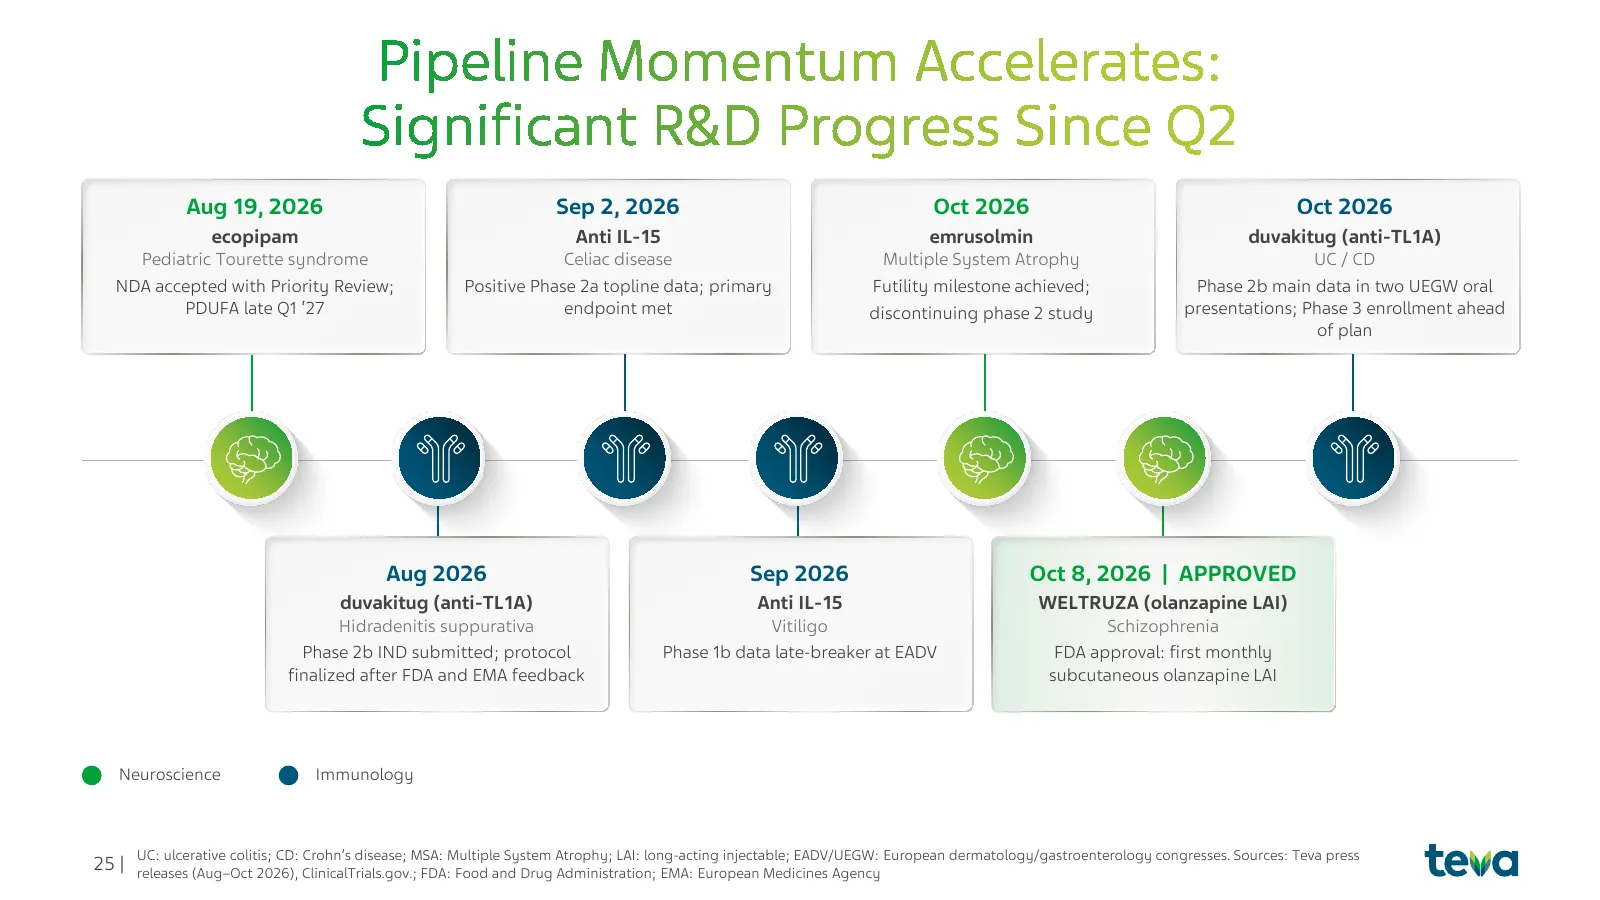
Aug 19, 2026 Sep 2, 2026 Oct 2026 Oct 2026 ecopipam Anti IL-15 emrusolmin duvakitug (anti-TL1A) Pediatric Tourette syndrome Celiac disease Multiple System Atrophy UC / CD NDA accepted with Priority Review; Positive Phase 2a topline data; primary Futility milestone achieved; Phase 2b main data in two
Slide 26: 2026 anticipated milestones
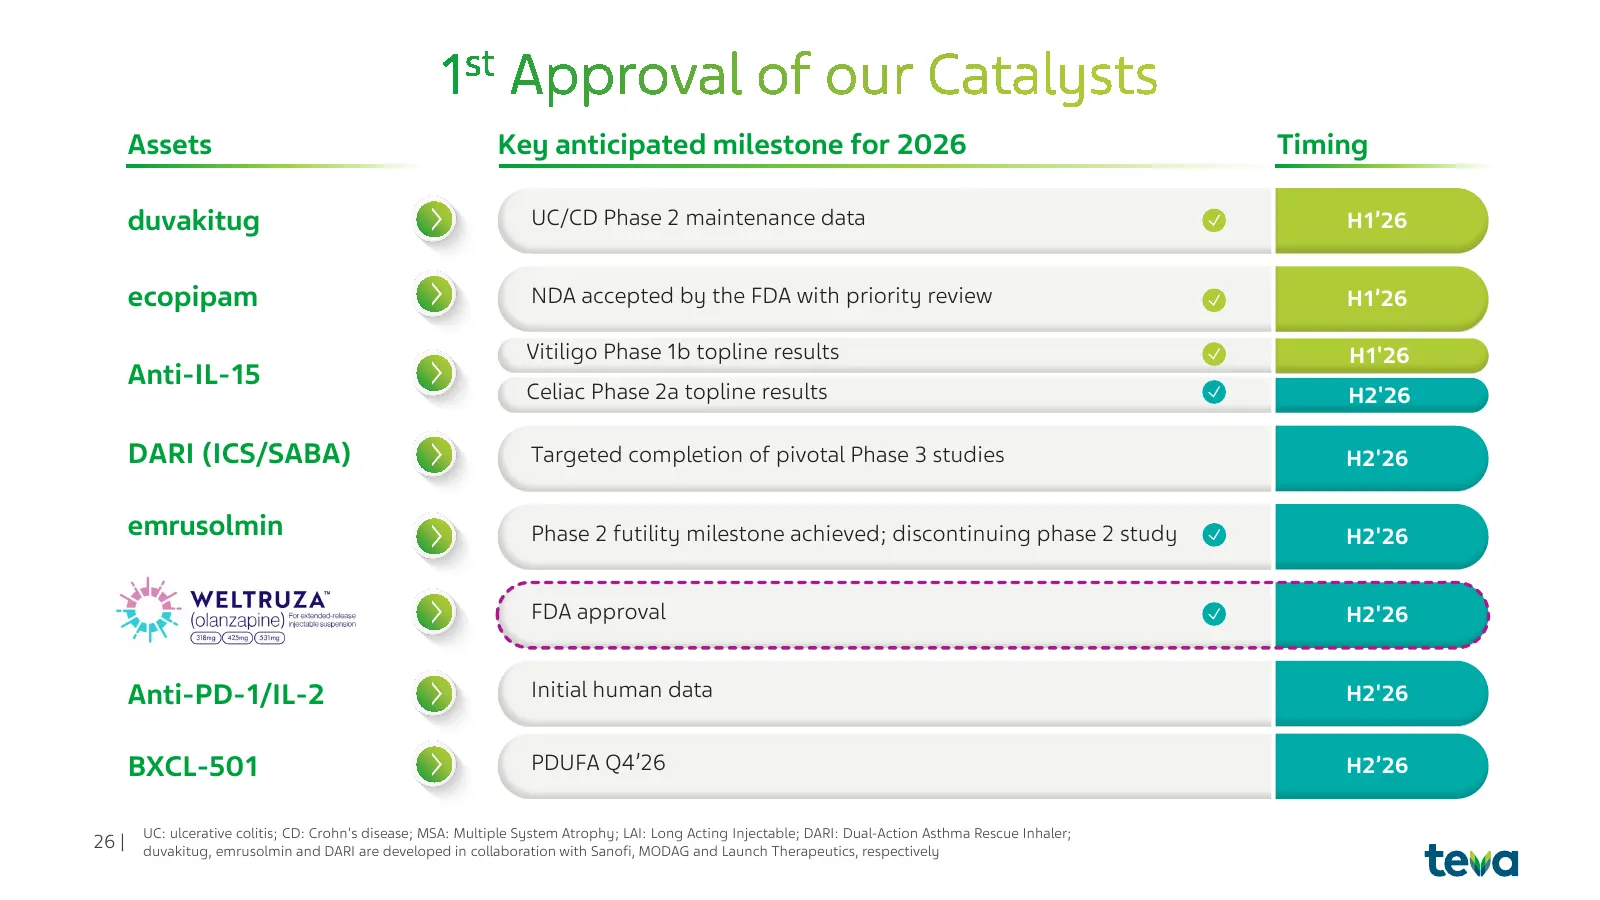
Assets Key anticipated milestone for 2026 Timing duvakitug UC/CD Phase 2 maintenance data H1’26 ecopipam NDA accepted by the FDA with priority review H1’26 Vitiligo Phase 1b topline results H1'26 Anti-IL-15 Celiac Phase 2a topline results H2'26 DARI (ICS/SABA) Targeted completion of pivotal Phase 3

Slide 27: Teva R&D Day
Teva R&D Day •High-Velocity Biopharma Wednesday, November 11 Details on Teva’s IR website or via TevaIR@Tevapharm.com
Slide 28: Financial update
3 Financial update Executive Vice President, Chief Financial Officer 28 |
Slide 29: Sustain innovative growth momentum
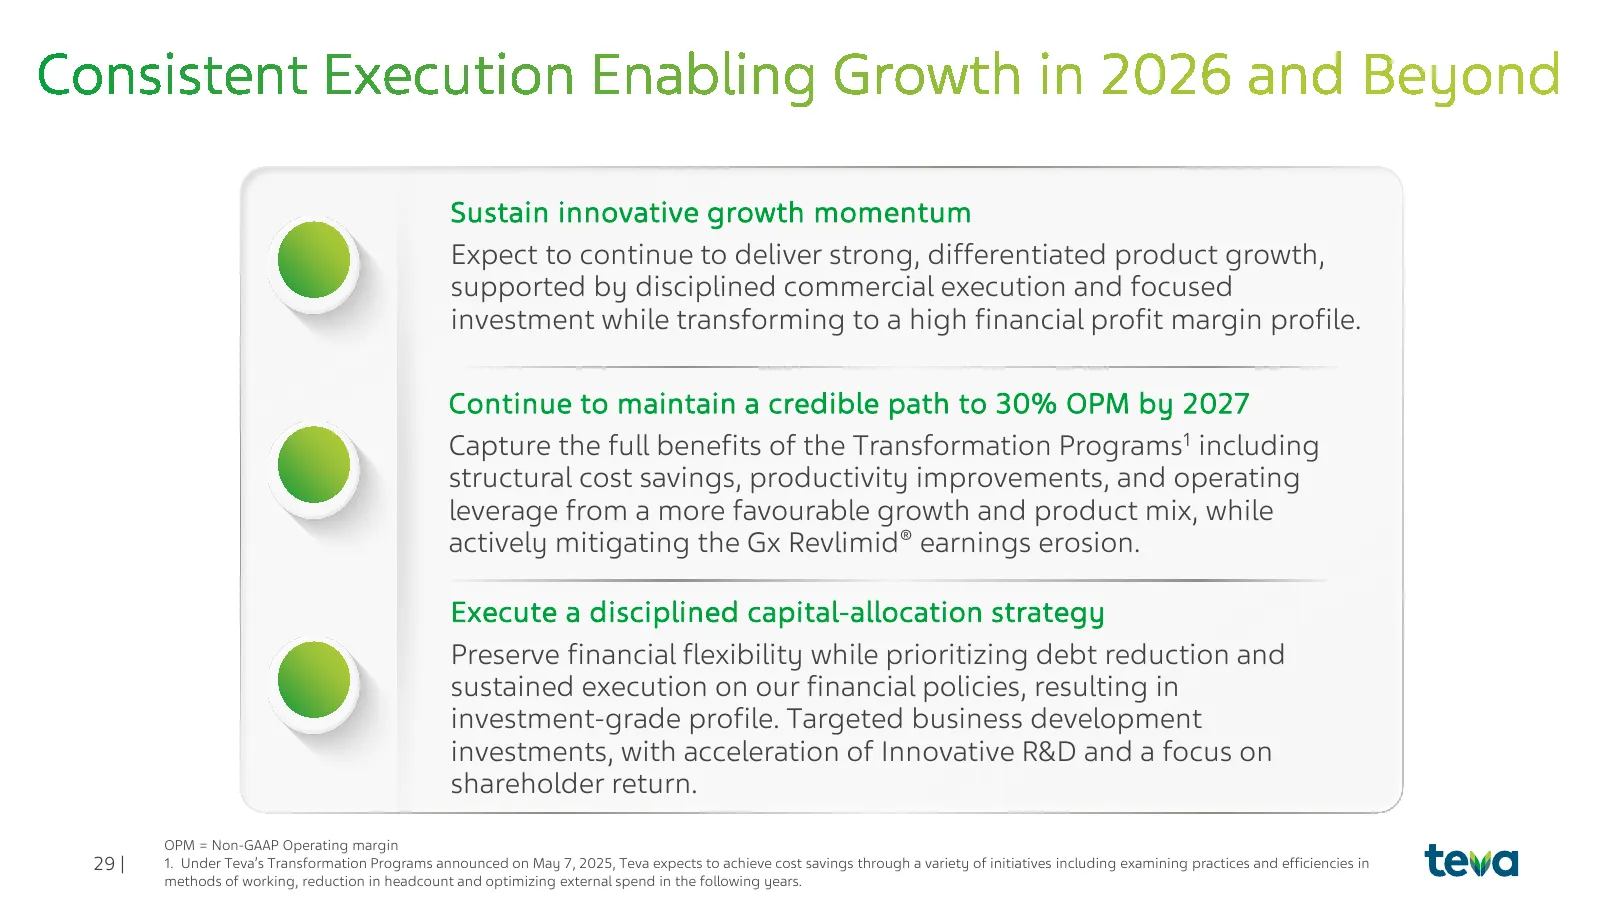
Sustain innovative growth momentum Expect to continue to deliver strong, differentiated product growth, supported by disciplined commercial execution and focused investment while transforming to a high financial profit margin profile. Continue to maintain a credible path to 30% OPM by 2027 Capture t
Slide 30: Q3 2026 financial results
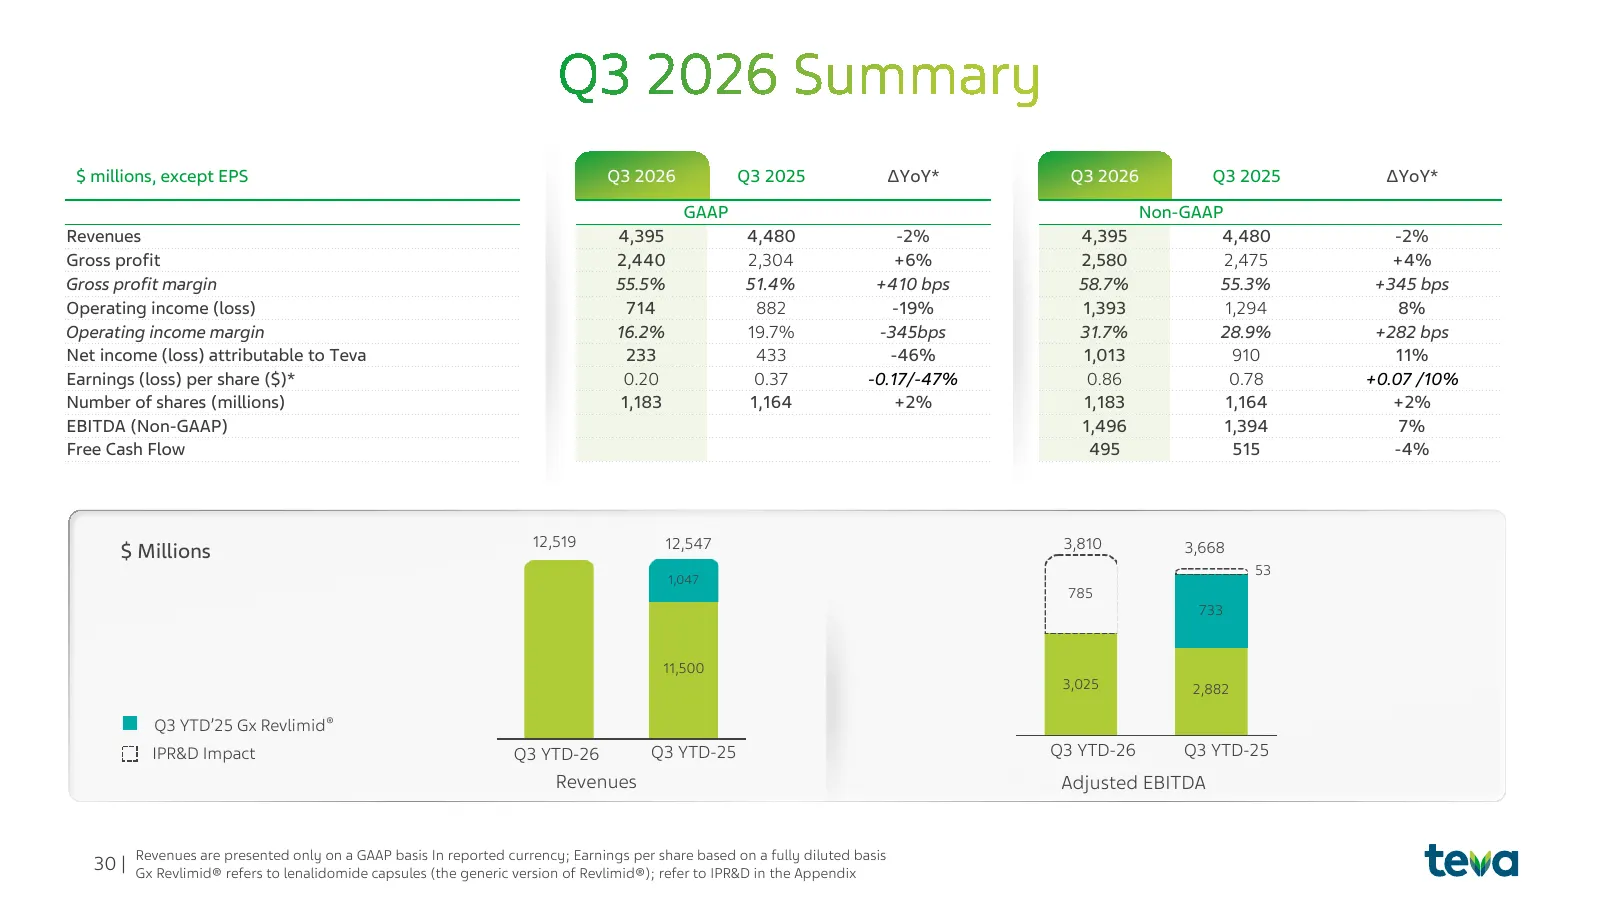
$ millions, except EPS Q3 2026 Q3 2025 ΔYoY* Q3 2026 Q3 2025 ΔYoY* GAAP Non-GAAP Revenues 4,395 4,480 -2% 4,395 4,480 -2% Gross profit 2,440 2,304 +6% 2,580 2,475 +4% Gross profit margin 55.5% 51.4% +410 bps 58.7% 55.3% +345 bps Operating income (loss) 714 882 -19% 1,393 1,294 8% Operating income ma
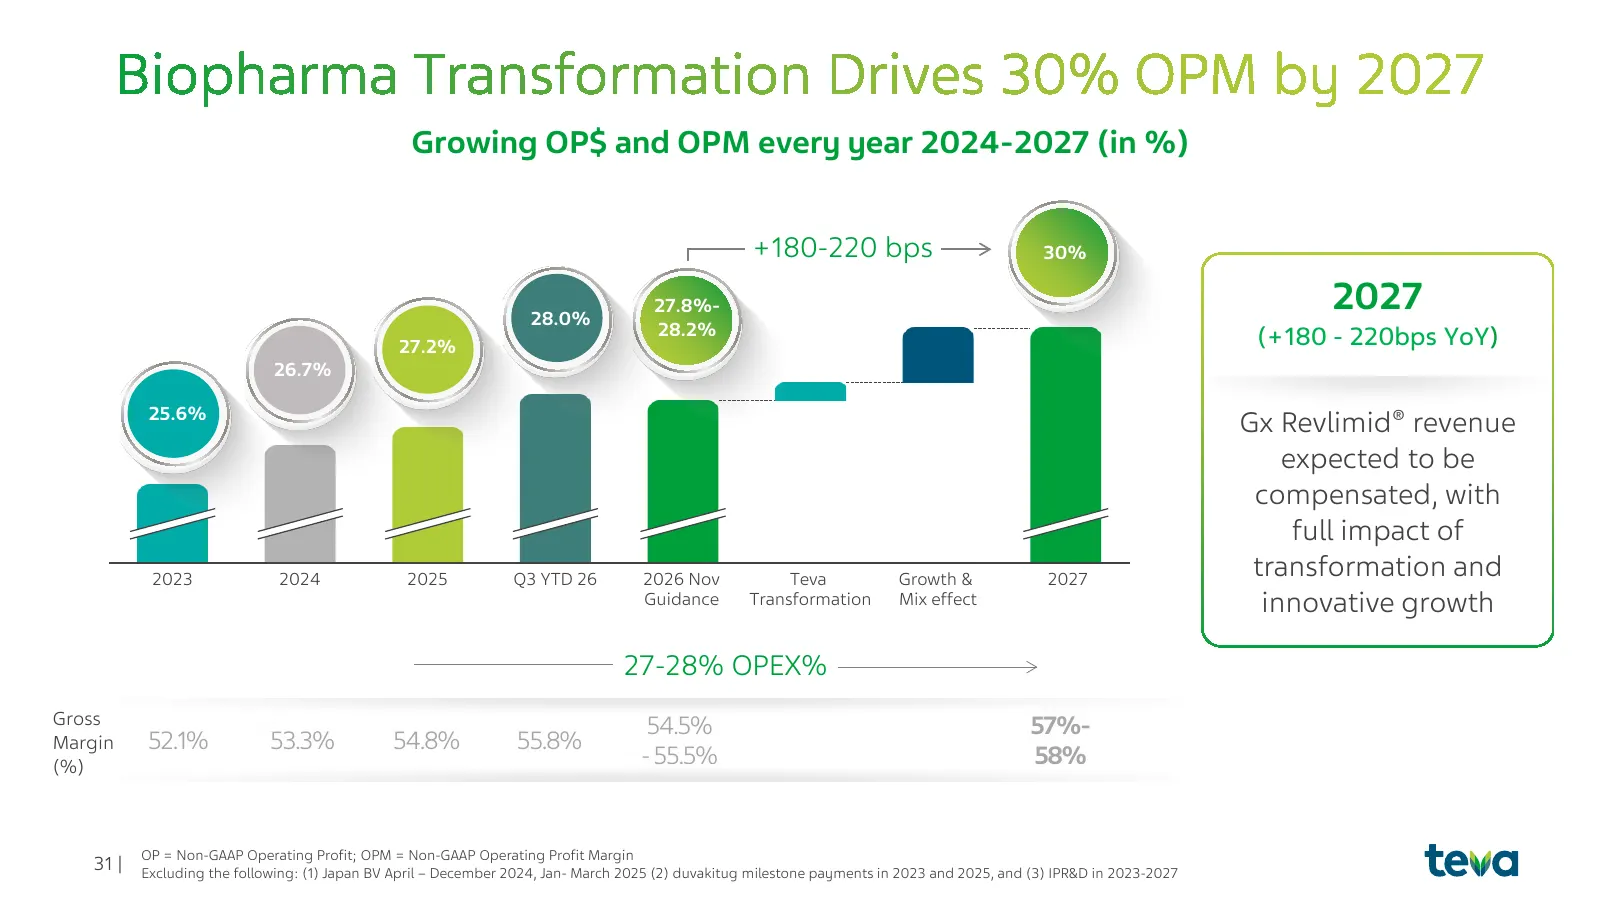
Slide 31: Growing operating profit and margin 2024-2027
Growing OP$ and OPM every year 2024-2027 (in %) +180-220 bps 30% 28.0% 27.8%- 2027 28.2% (+180 - 220bps YoY) 27.2% 26.7% 25.6% Gx Revlimid® revenue expected to be compensated, with full impact of 2023 2024 2025 Q3 YTD 26 2026 Nov Teva Growth & 2027 transformation and Guidance Transformation Mix effe
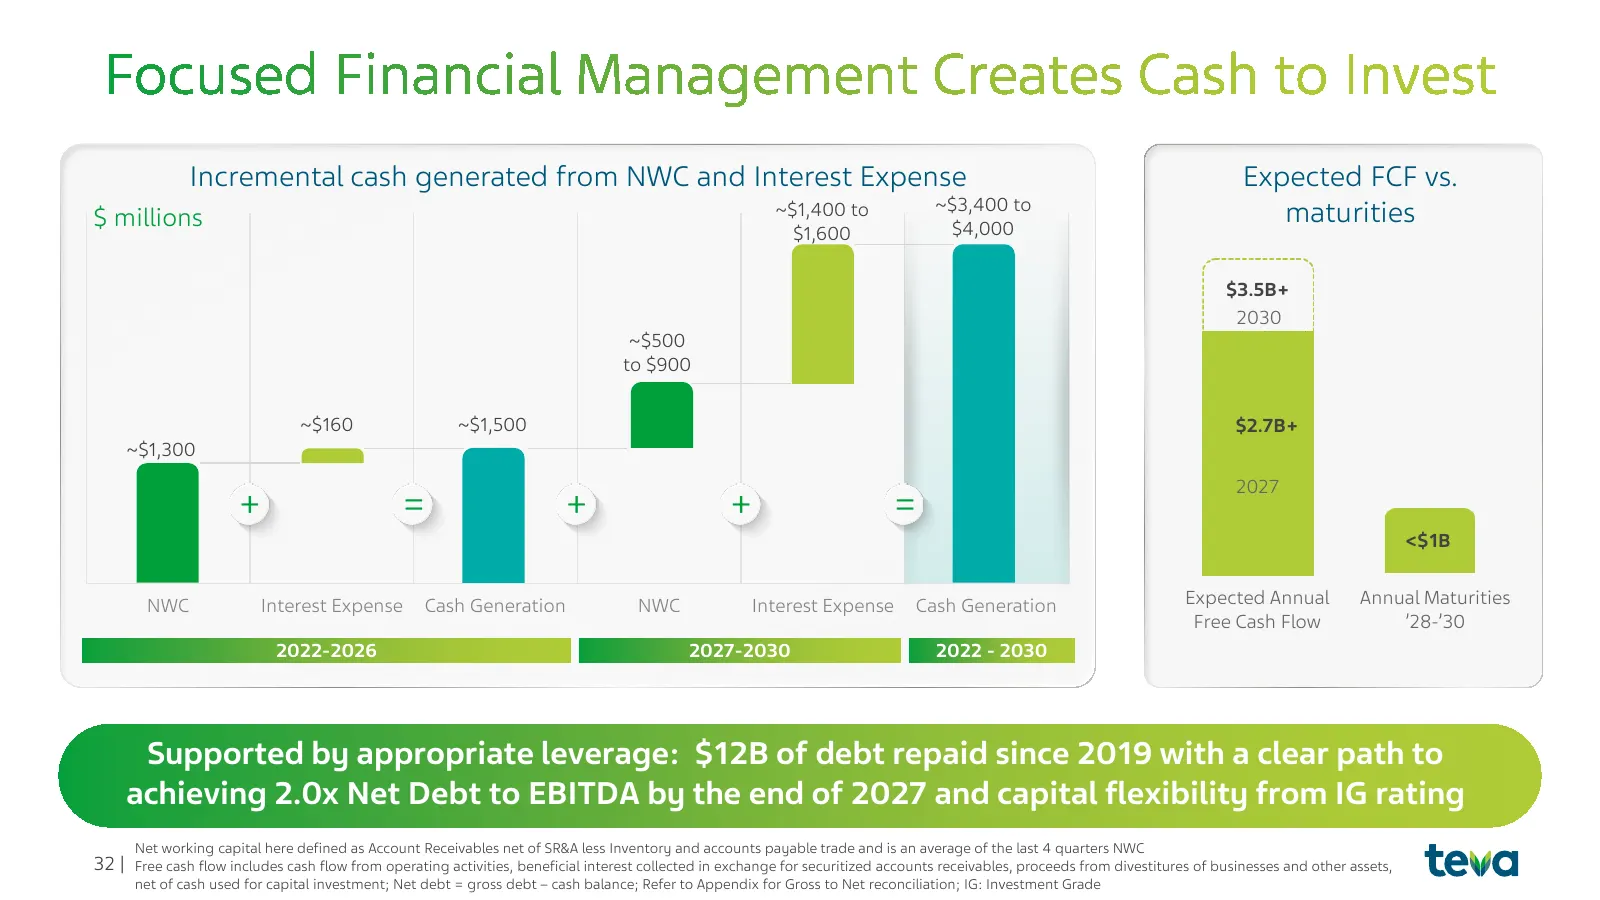
Slide 32: Leverage and free cash flow path
Incremental cash generated from NWC and Interest Expense Expected FCF vs. ~$3,400 to $ millions ~$1,400 to $4,000 maturities $1,600 $3.5B+ 2030 ~$500 to $900 ~$160 ~$1,500 $2.7B+ ~$1,300 2027 + = + + = <$1B NWC Interest Expense Cash Generation NWC Interest Expense Cash Generation Expected Annual Ann
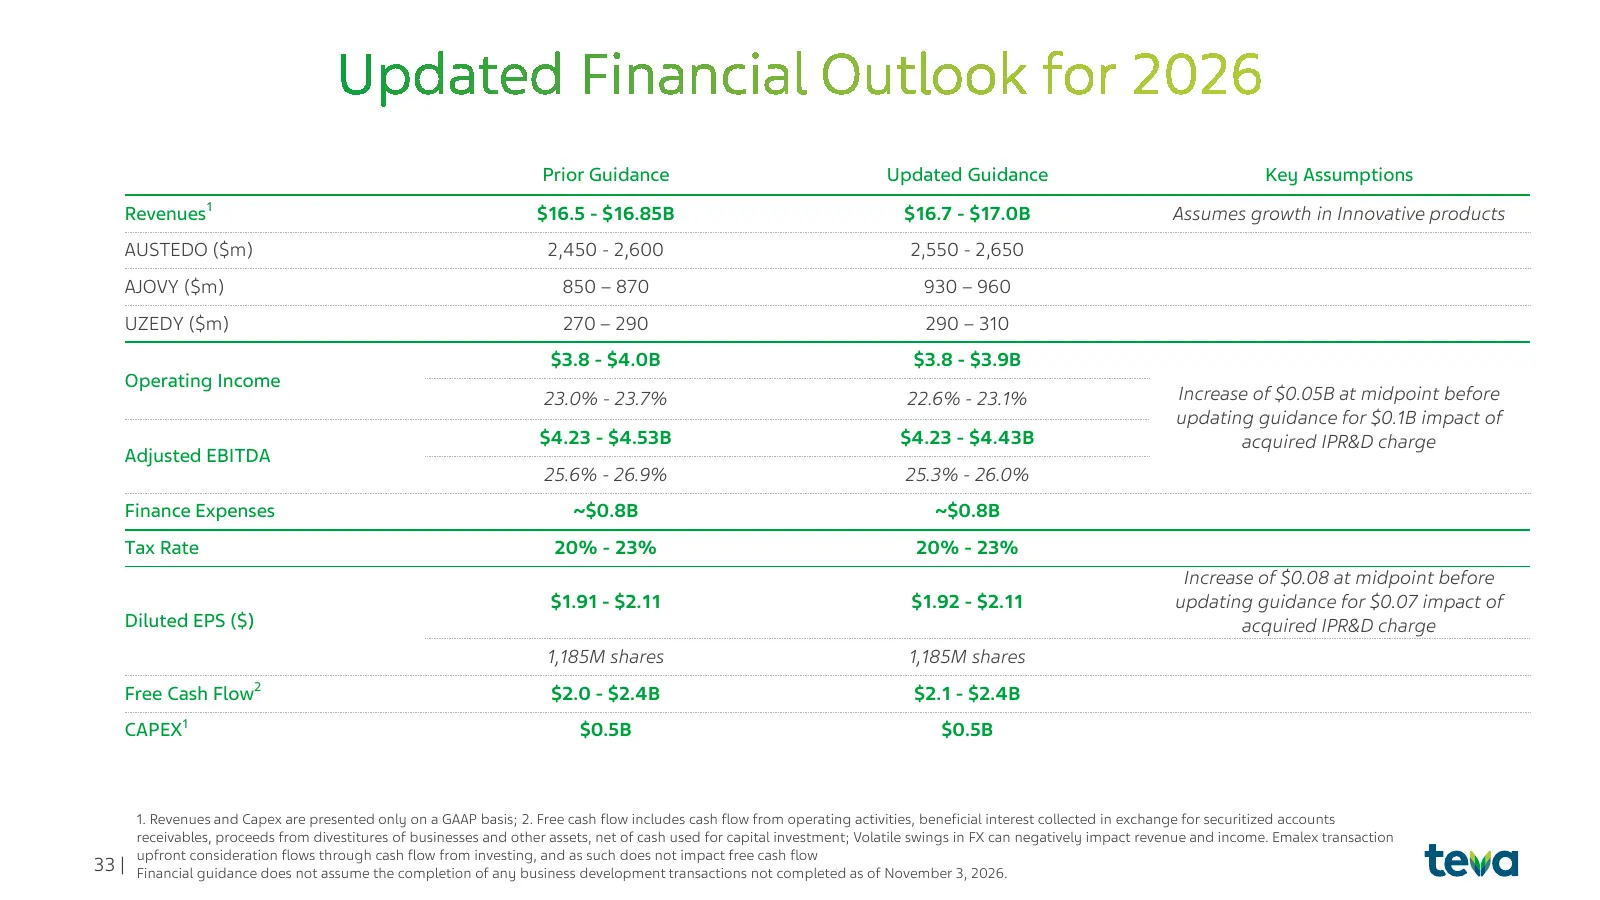
Slide 33: 2026 guidance
Prior Guidance Updated Guidance Key Assumptions Revenues1 $16.5 - $16.85B $16.7 - $17.0B Assumes growth in Innovative products AUSTEDO ($m) 2,450 - 2,600 2,550 - 2,650 AJOVY ($m) 850 – 870 930 – 960 UZEDY ($m) 270 – 290 290 – 310 $3.8 - $4.0B $3.8 - $3.9B Operating Income 23.0% - 23.7% 22.6% - 23.1%
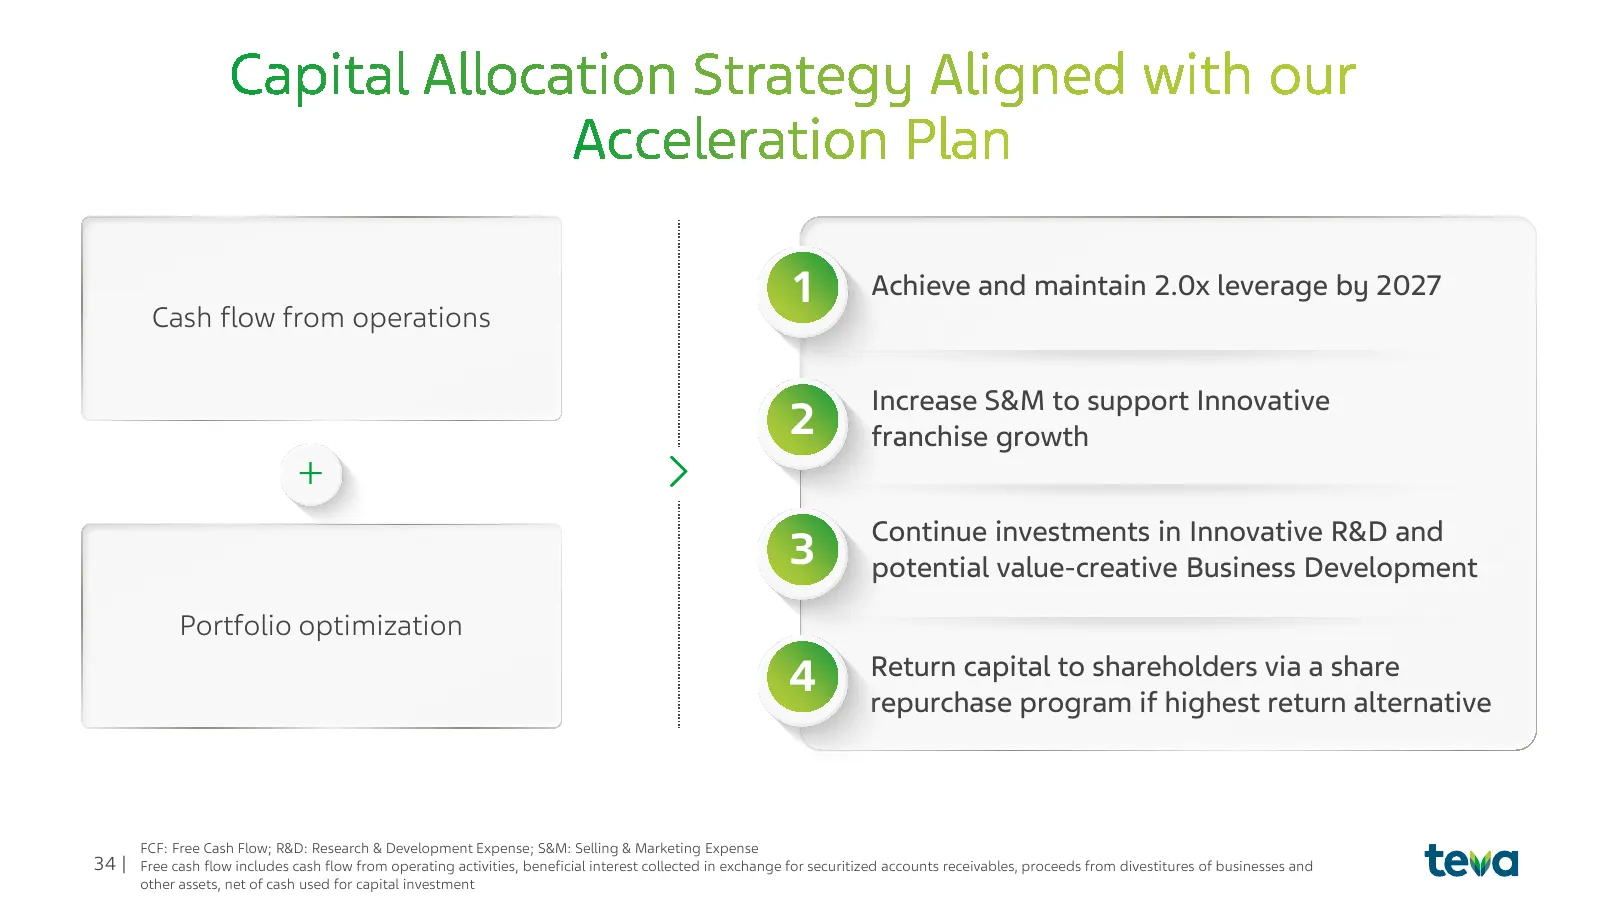
Slide 34: Capital allocation priorities
1 Achieve and maintain 2.0x leverage by 2027 Cash flow from operations Increase S&M to support Innovative 2 franchise growth Continue investments in Innovative R&D and 3 potential value-creative Business Development Portfolio optimization 4 Return capital to shareholders via a share repurchase progr
Slide 35: 35| teva
35| teva
Slide 36: Conclusion & Q&A
4 Conclusion & Q&A President and Chief Executive Officer 36 |
Slide 37: Growth phases and peak sales potential
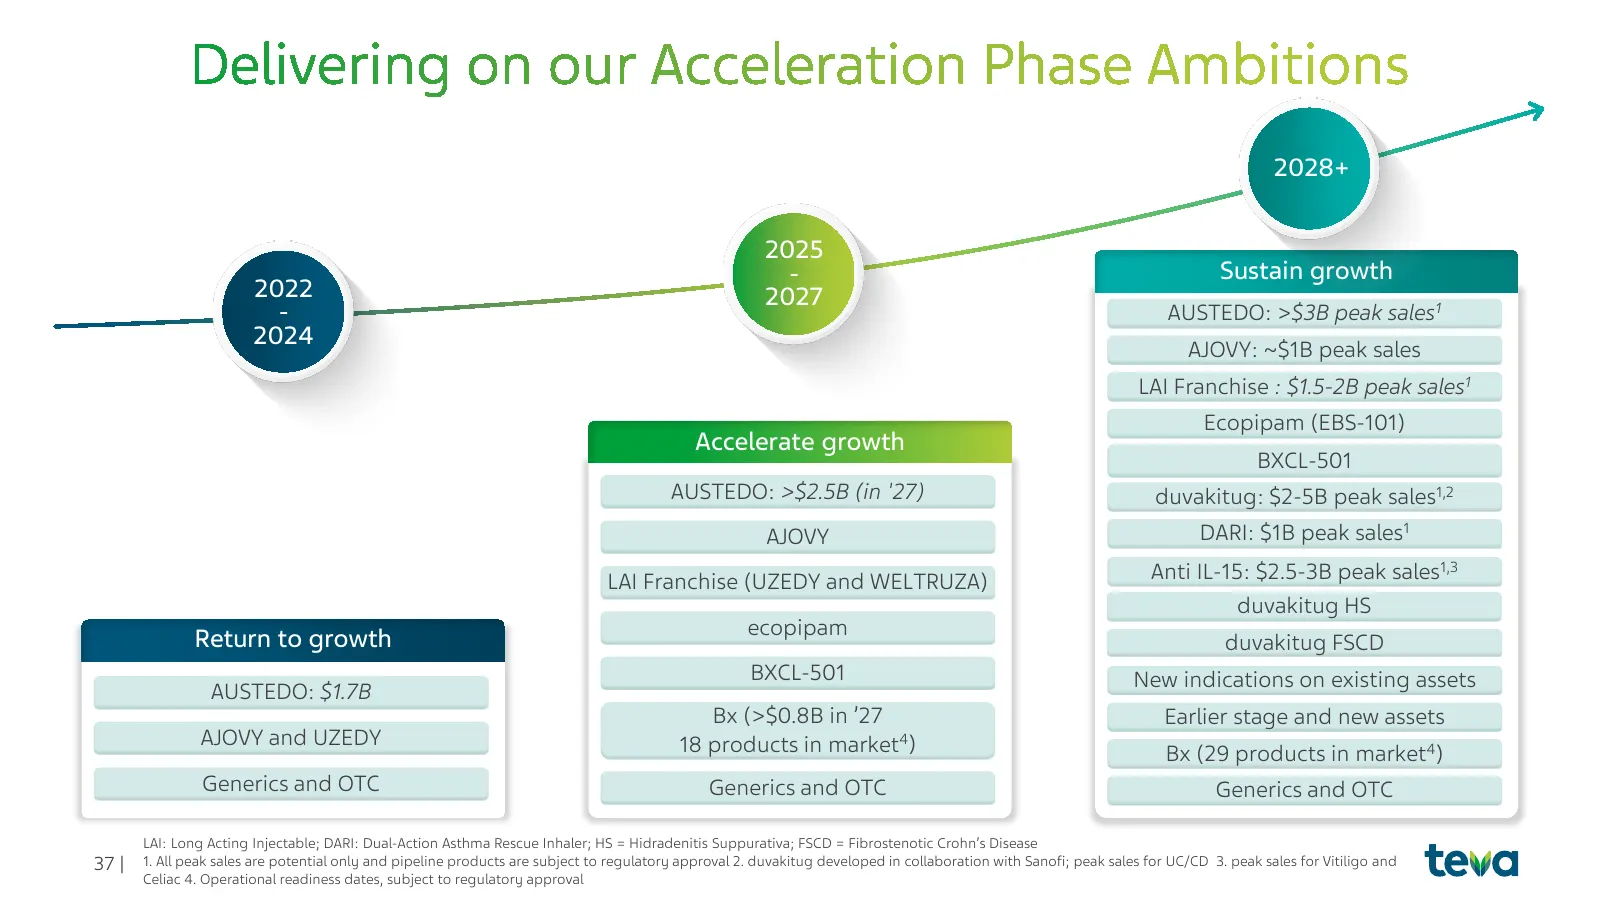
2028+ 2025 - Sustain growth 2022 2027 - AUSTEDO: >$3B peak sales1 2024 AJOVY: ~$1B peak sales LAI Franchise : $1.5-2B peak sales1 Ecopipam (EBS-101) Accelerate growth BXCL-501 AUSTEDO: >$2.5B (in '27) duvakitug: $2-5B peak sales1,2 AJOVY DARI: $1B peak sales1 LAI Franchise (UZEDY and WELTRUZA) Anti
Slide 38: Conclusion: Q3'26 summary
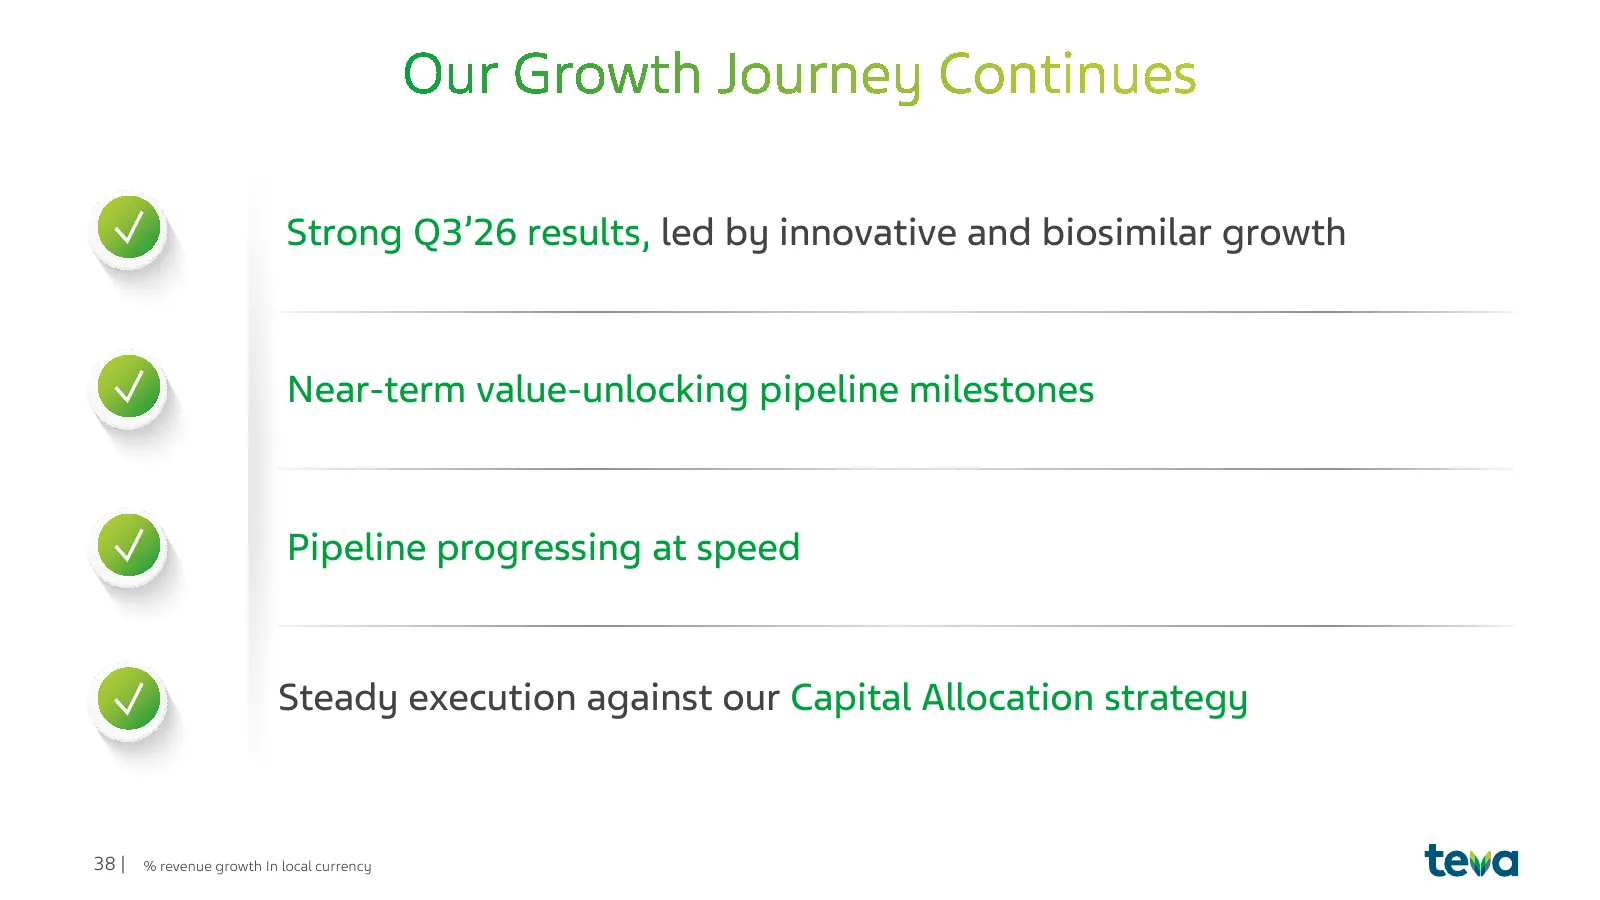
Strong Q3’26 results, led by innovative and biosimilar growth Near-term value-unlocking pipeline milestones Pipeline progressing at speed Steady execution against our Capital Allocation strategy 38 | % revenue growth In local currency

Slide 39: Q&A
Q8A

Slide 40: Innovative and Biosimilar Pipeline
teva Innovative and Biosimilar Pipeline
Slide 41: Innovative pipeline by phase
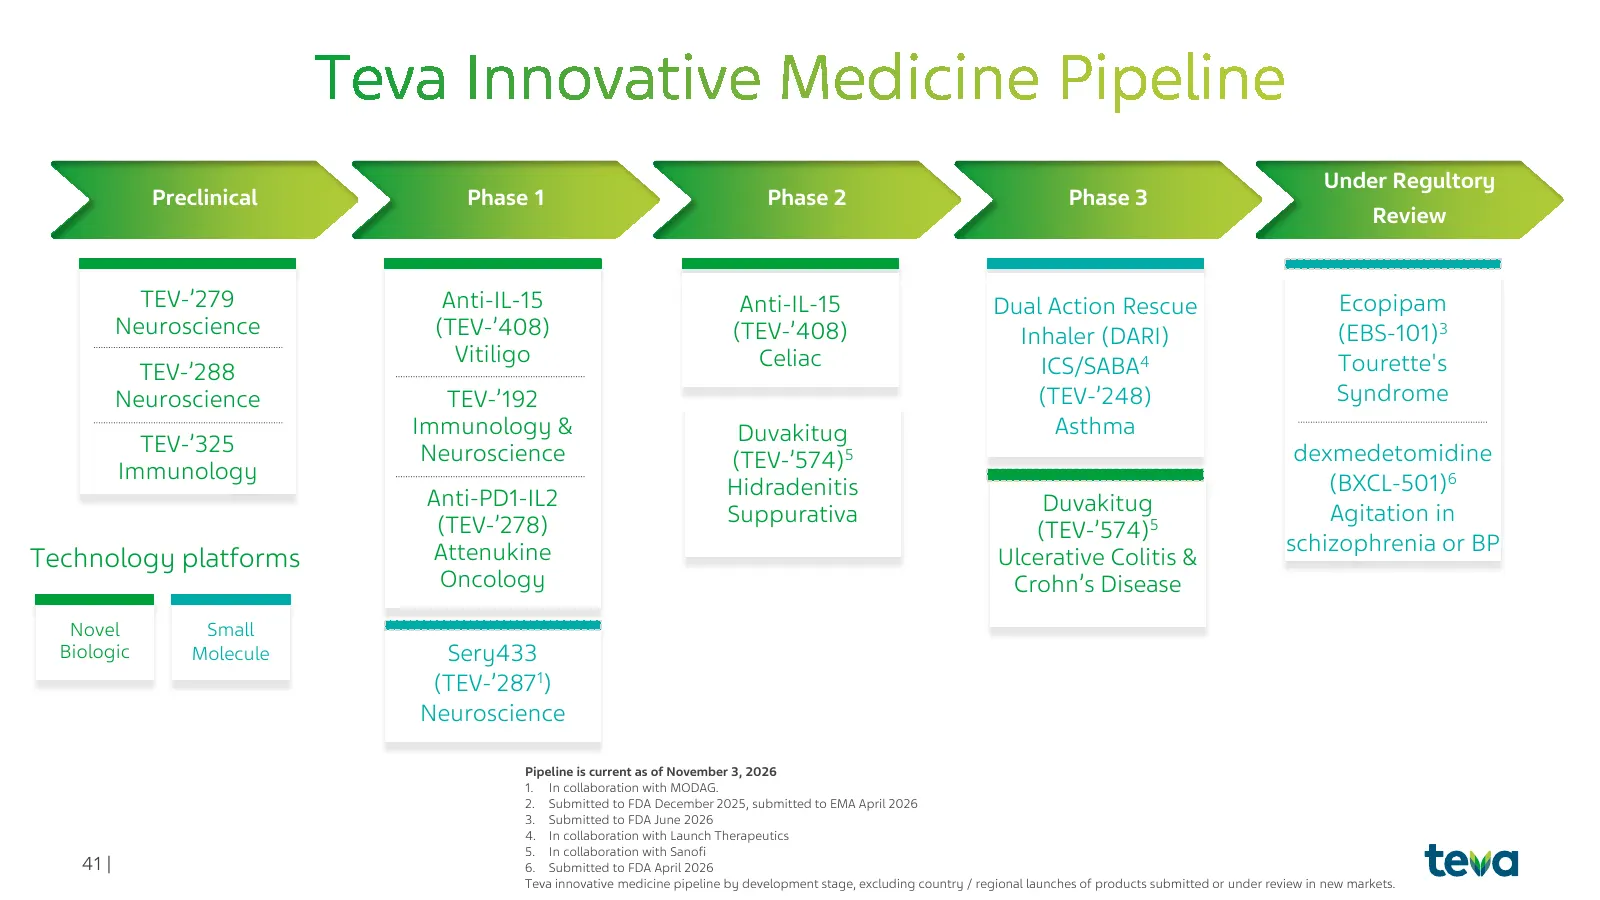
Under Regultory Preclinical Phase 1 Phase 2 Phase 3 Review TEV-’279 Anti-IL-15 Anti-IL-15 Dual Action Rescue Ecopipam Neuroscience (TEV-’408) (TEV-’408) Inhaler (DARI) (EBS-101)3 Vitiligo Celiac Tourette's TEV-’288 ICS/SABA4 Neuroscience TEV-’192 (TEV-’248) Syndrome Immunology & Duvakitug Asthma TEV
Slide 42: Biosimilar pipeline
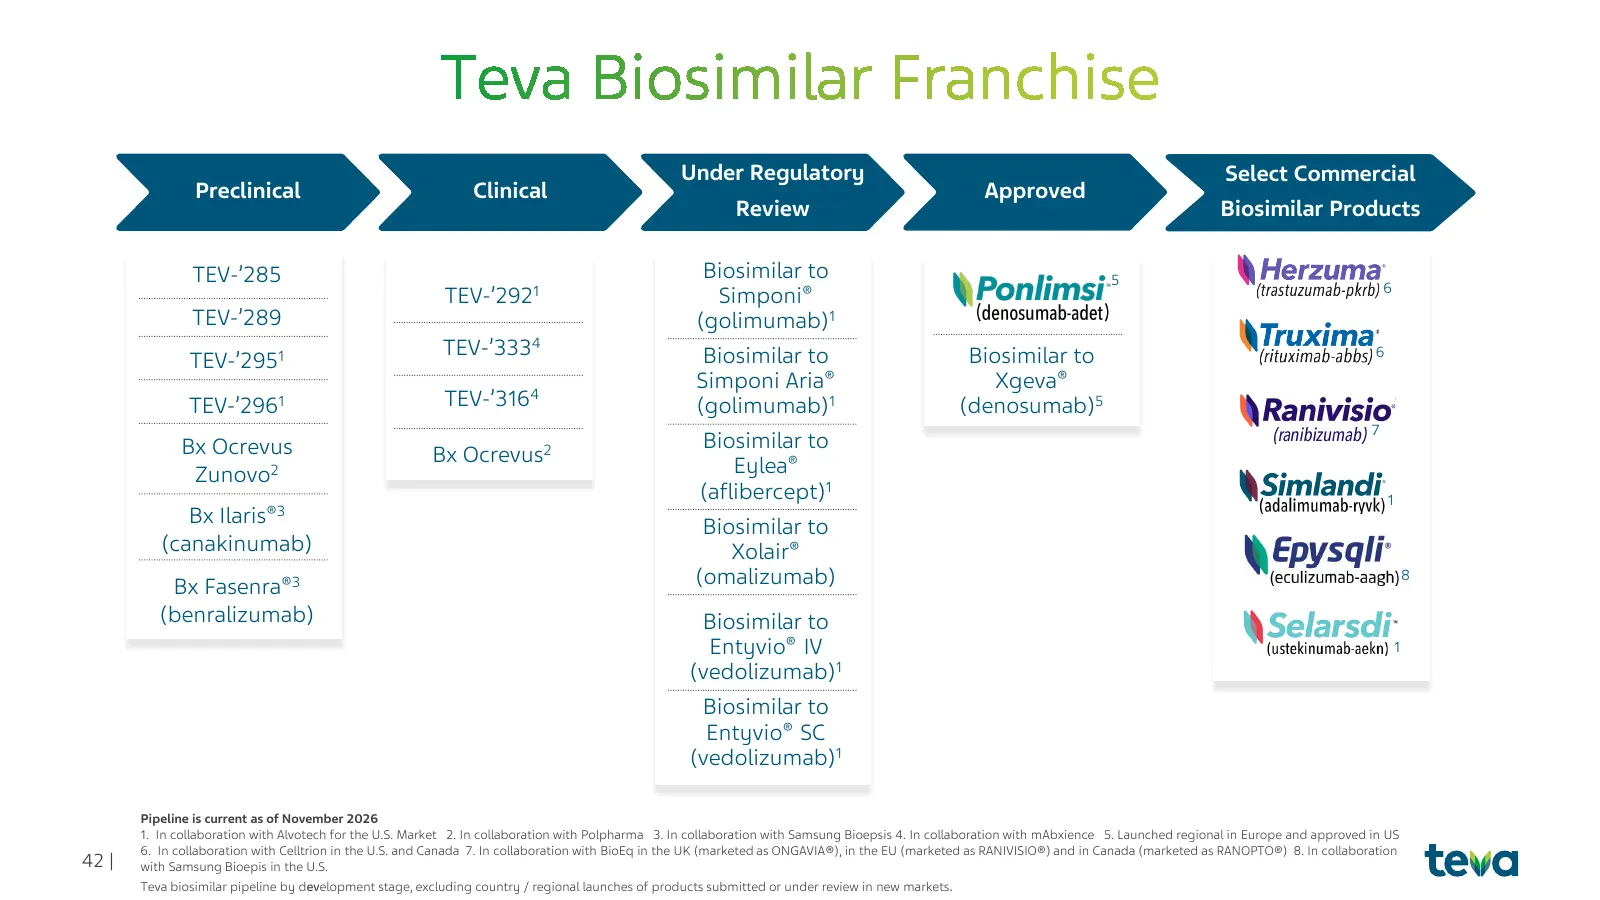
Under Regulatory Select Commercial Preclinical Clinical Approved Review Biosimilar Products TEV-’285 Biosimilar to 5 6 TEV-’2921 Simponi® TEV-’289 (golimumab)1 TEV-’3334 Biosimilar to Biosimilar to 6 TEV-’2951 Simponi Aria® Xgeva® TEV-’2961 TEV-’3164 (golimumab)1 (denosumab)5 7 Bx Ocrevus Biosimilar

Slide 43: Additional Information
teva Additional Information
Slide 44: P&L Impact
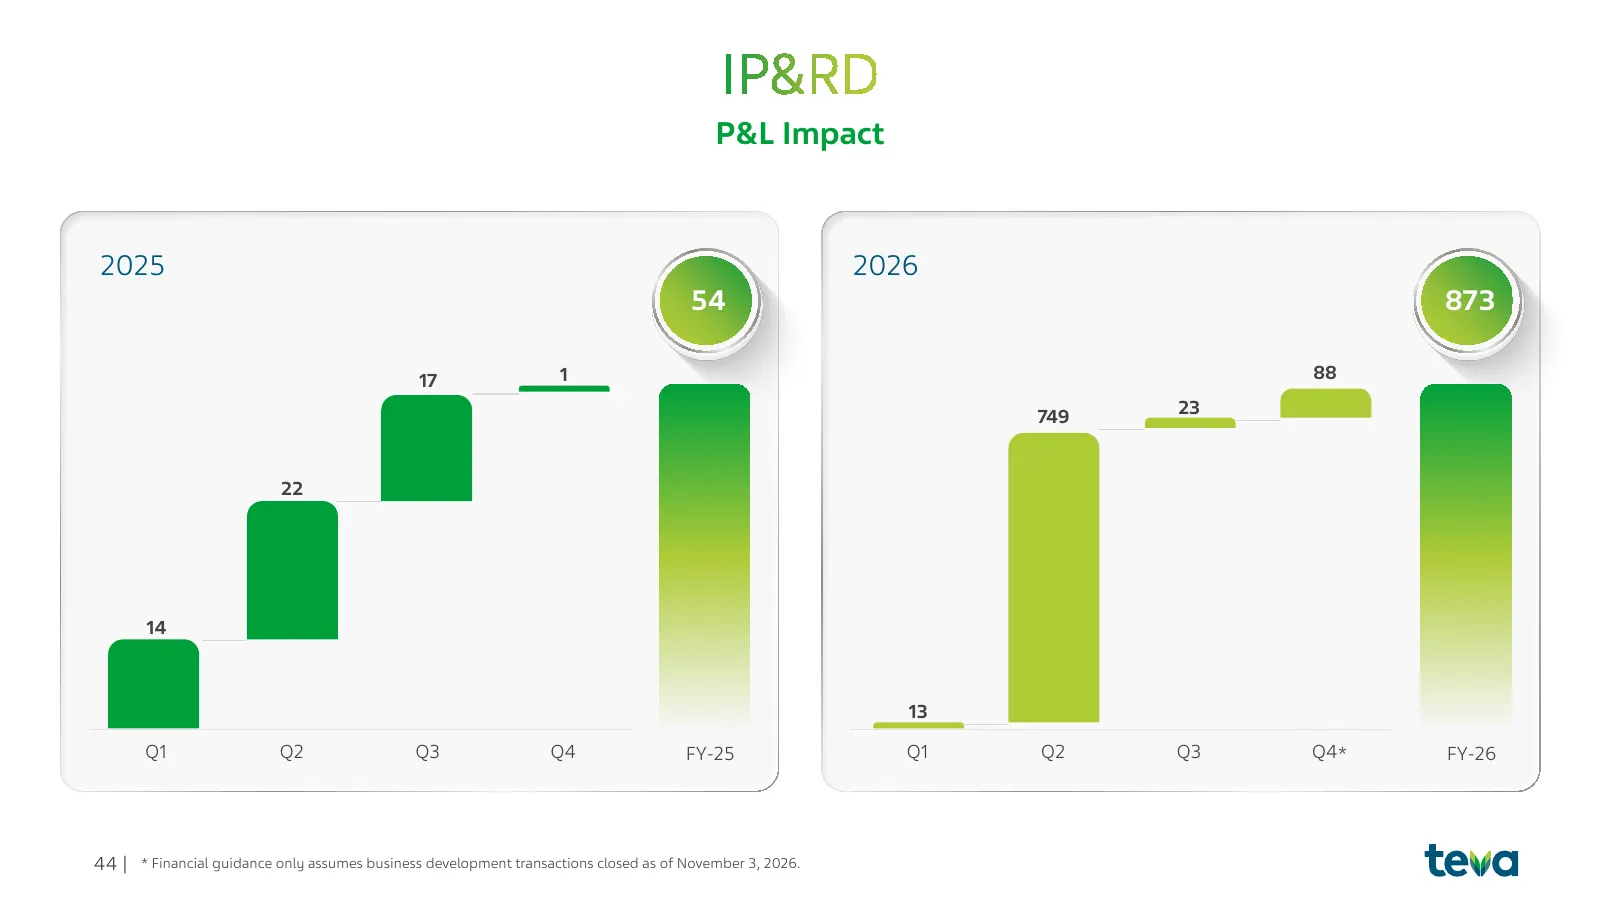
P&L Impact 2025 2026 54 873 17 1 88 749 23 22 14 13 Q1 Q2 Q3 Q4 FY-25 Q1 Q2 Q3 Q4* FY-26 44 | * Financial guidance only assumes business development transactions closed as of November 3, 2026.
Slide 45: Q3 YTD 2026 GAAP and non-GAAP results
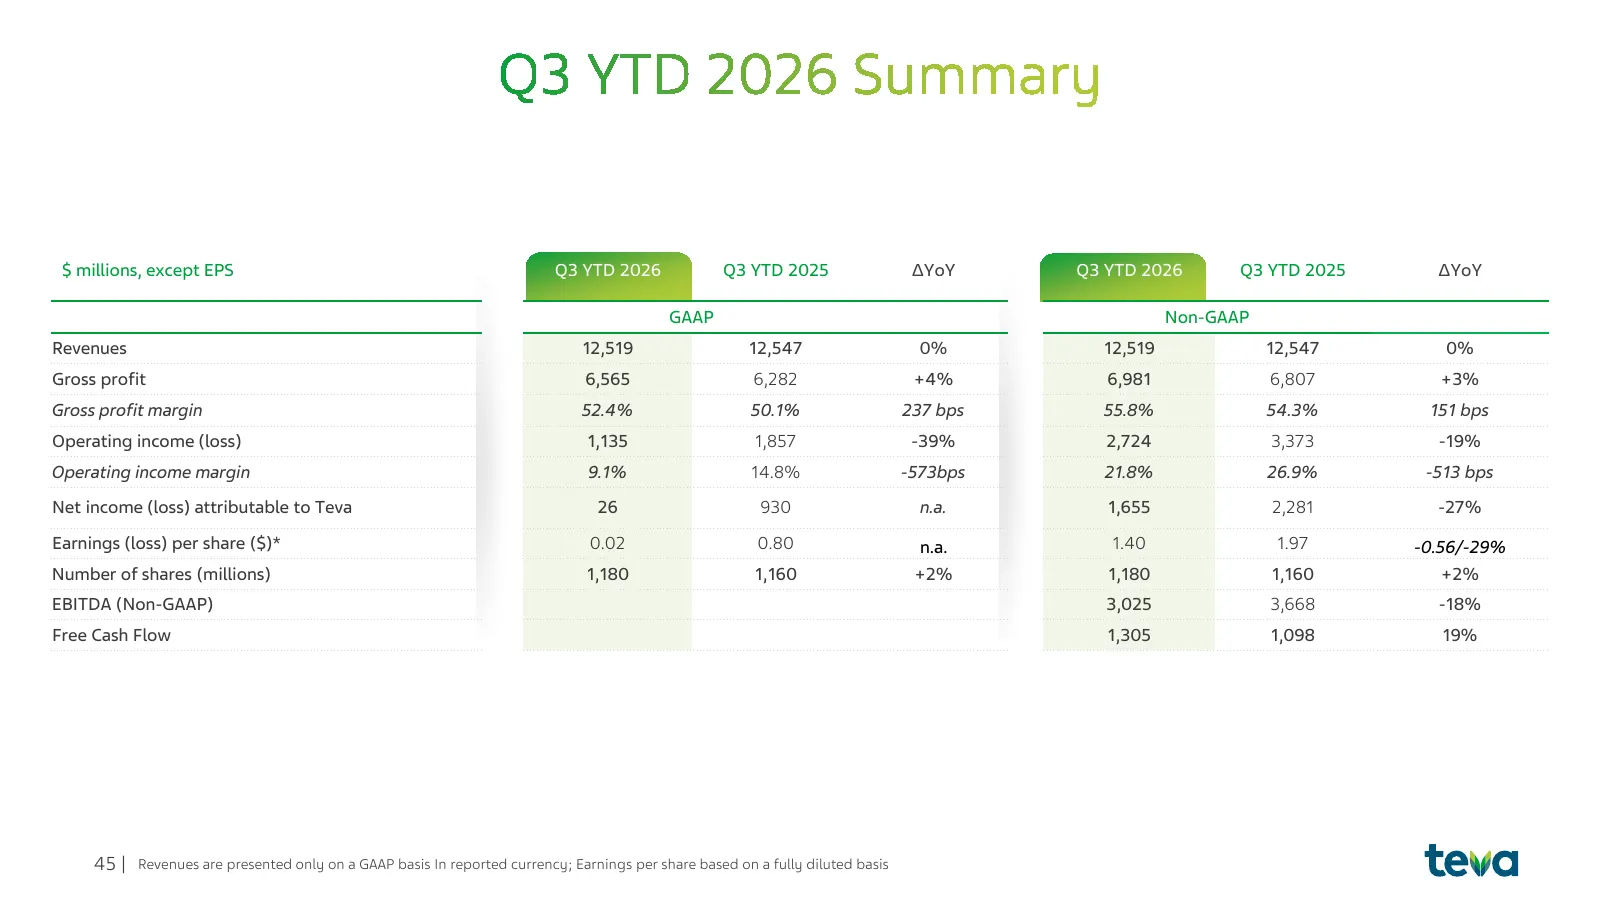
$ millions, except EPS Q3 YTD 2026 Q3 YTD 2025 ΔYoY Q3 YTD 2026 Q3 YTD 2025 ΔYoY GAAP Non-GAAP Revenues 12,519 12,547 0% 12,519 12,547 0% Gross profit 6,565 6,282 +4% 6,981 6,807 +3% Gross profit margin 52.4% 50.1% 237 bps 55.8% 54.3% 151 bps Operating income (loss) 1,135 1,857 -39% 2,724 3,373 -19%
Slide 46: Q3 2026 income statement
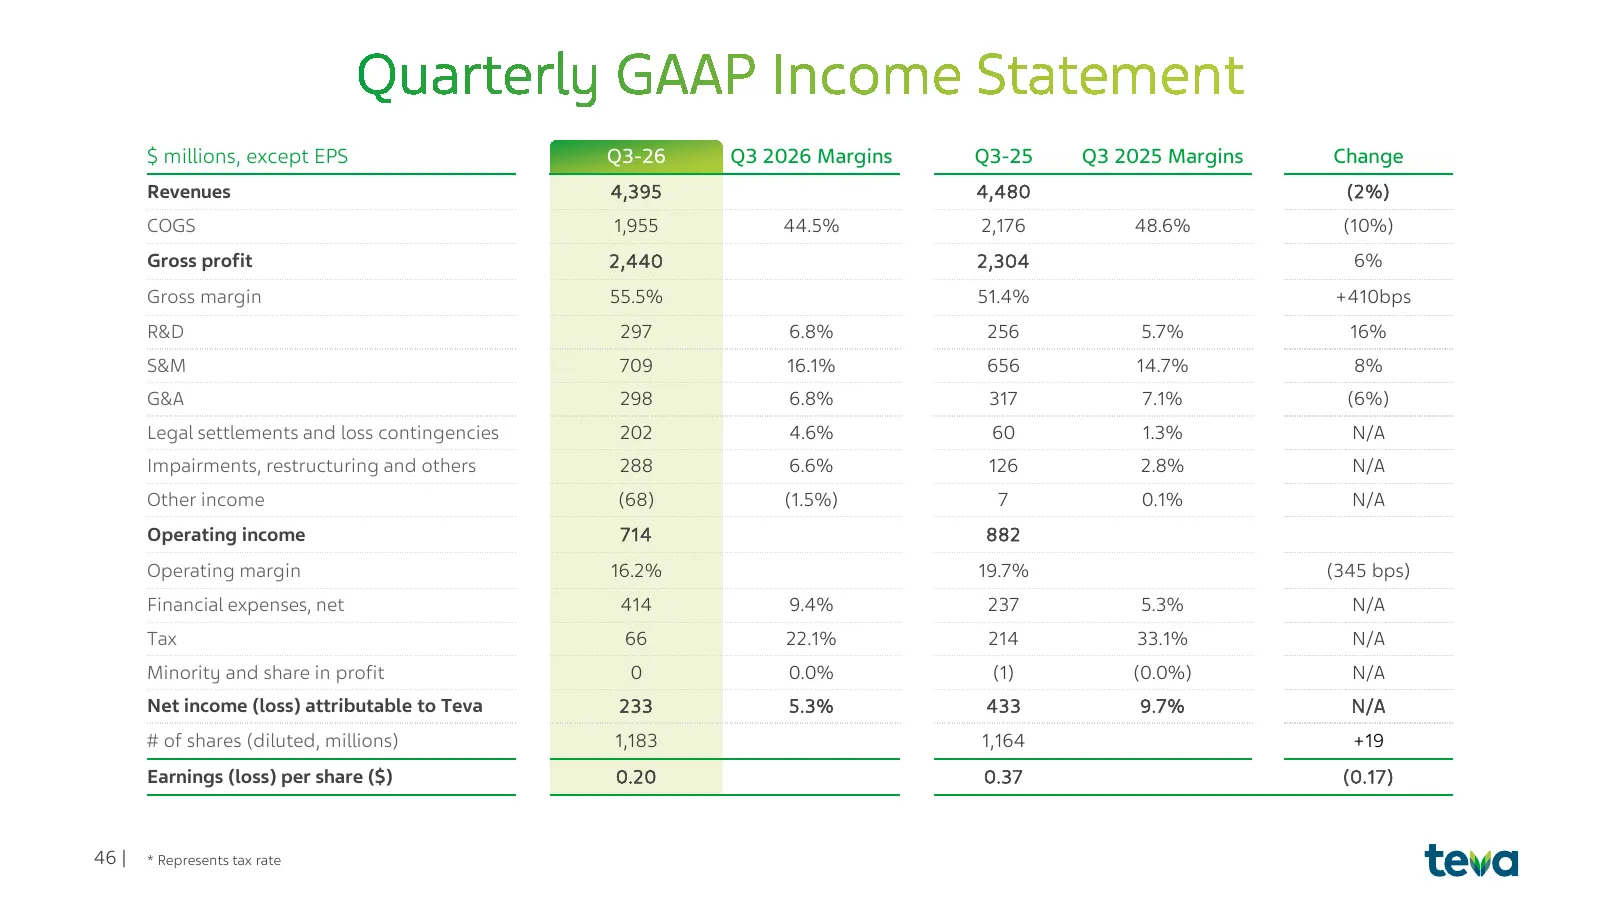
$ millions, except EPS Q3-26 Q3 2026 Margins Q3-25 Q3 2025 Margins Change Revenues 4,395 4,480 (2%) COGS 1,955 44.5% 2,176 48.6% (10%) Gross profit 2,440 2,304 6% Gross margin 55.5% 51.4% +410bps R&D 297 6.8% 256 5.7% 16% S&M 709 16.1% 656 14.7% 8% G&A 298 6.8% 317 7.1% (6%) Legal settlements and lo
Slide 47: YTD 2026 income statement
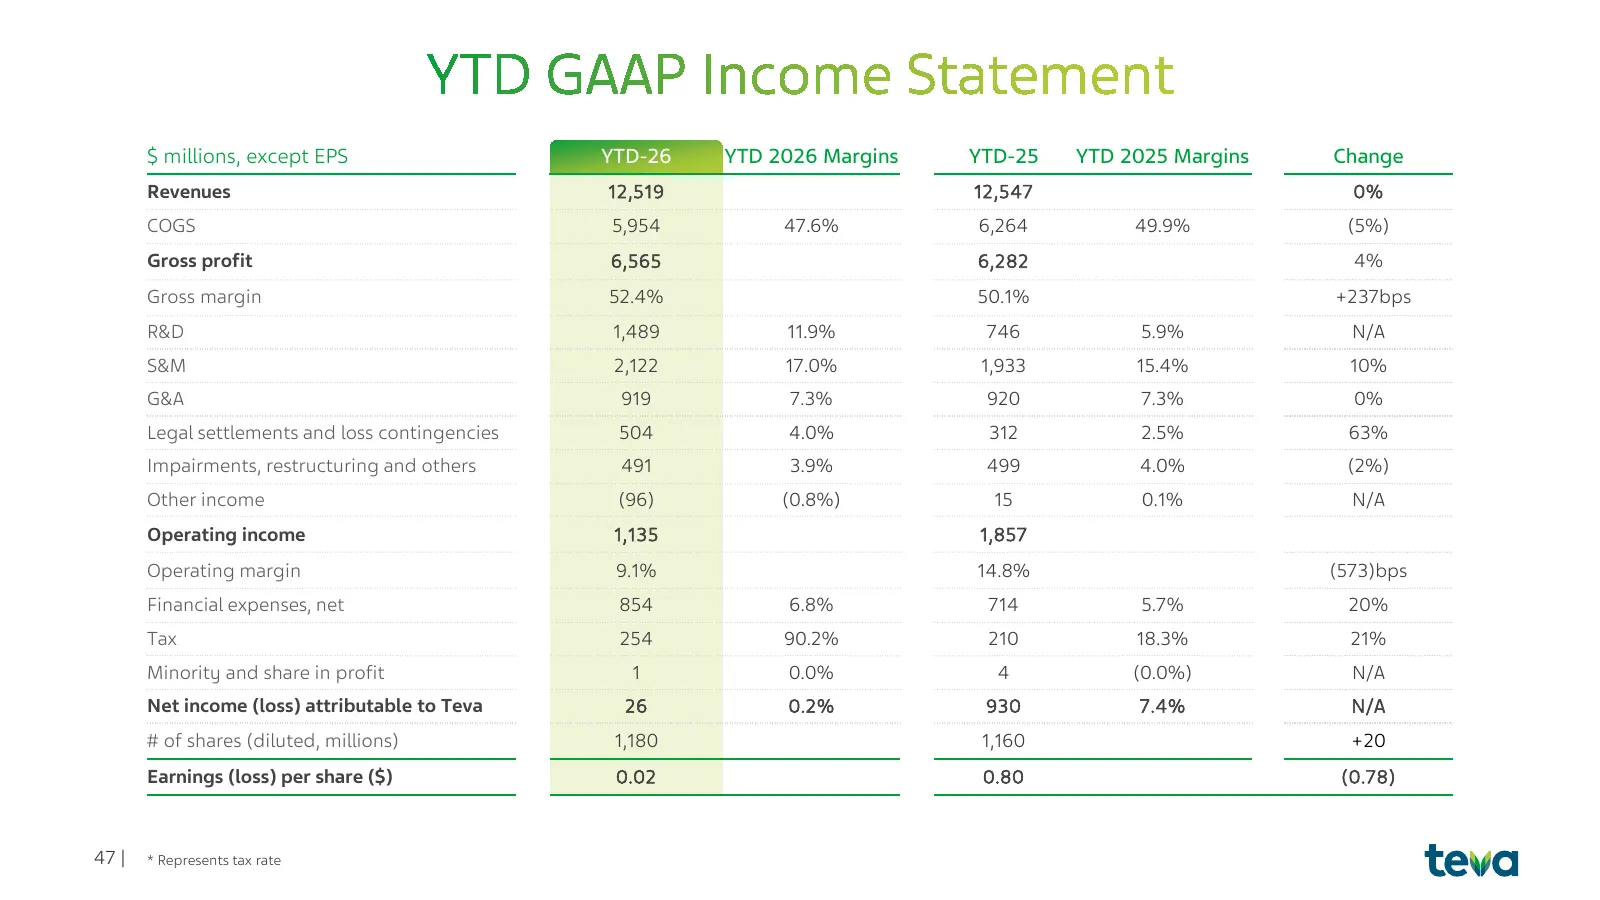
$ millions, except EPS YTD-26 YTD 2026 Margins YTD-25 YTD 2025 Margins Change Revenues 12,519 12,547 0% COGS 5,954 47.6% 6,264 49.9% (5%) Gross profit 6,565 6,282 4% Gross margin 52.4% 50.1% +237bps R&D 1,489 11.9% 746 5.9% N/A S&M 2,122 17.0% 1,933 15.4% 10% G&A 919 7.3% 920 7.3% 0% Legal settlemen
Slide 48: FX impact on results
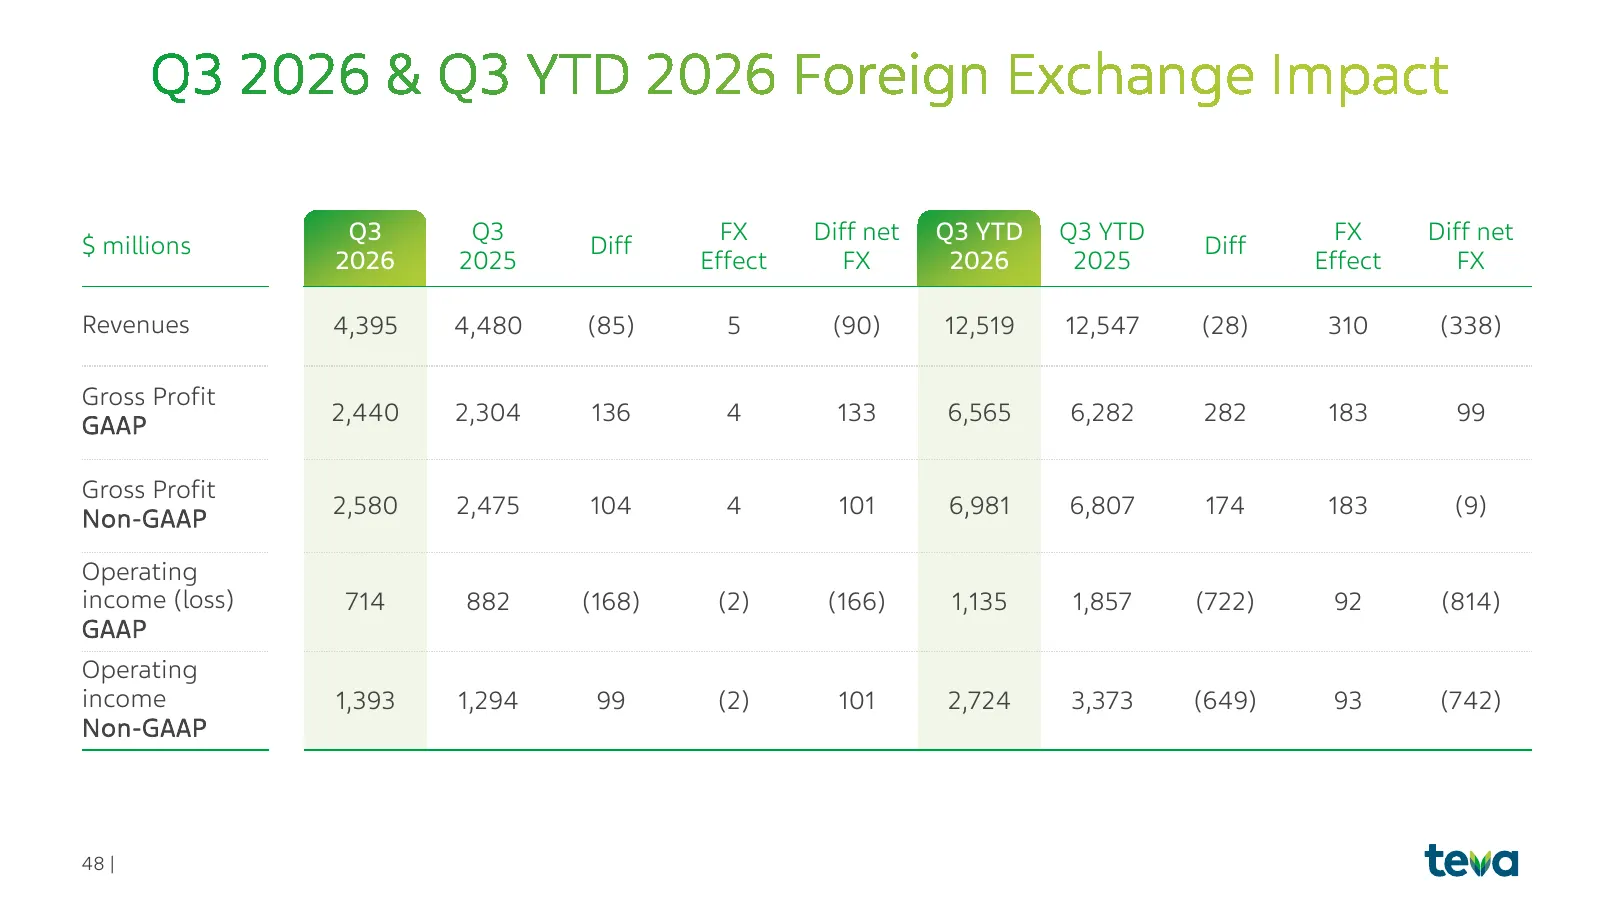
Q3 Q3 FX Diff net Q3 YTD Q3 YTD FX Diff net $ millions Diff Diff 2026 2025 Effect FX 2026 2025 Effect FX Revenues 4,395 4,480 (85) 5 (90) 12,519 12,547 (28) 310 (338) Gross Profit GAAP 2,440 2,304 136 4 133 6,565 6,282 282 183 99 Gross Profit Non-GAAP 2,580 2,475 104 4 101 6,981 6,807 174 183 (9) Op
Slide 49: Quarterly revenues and margins
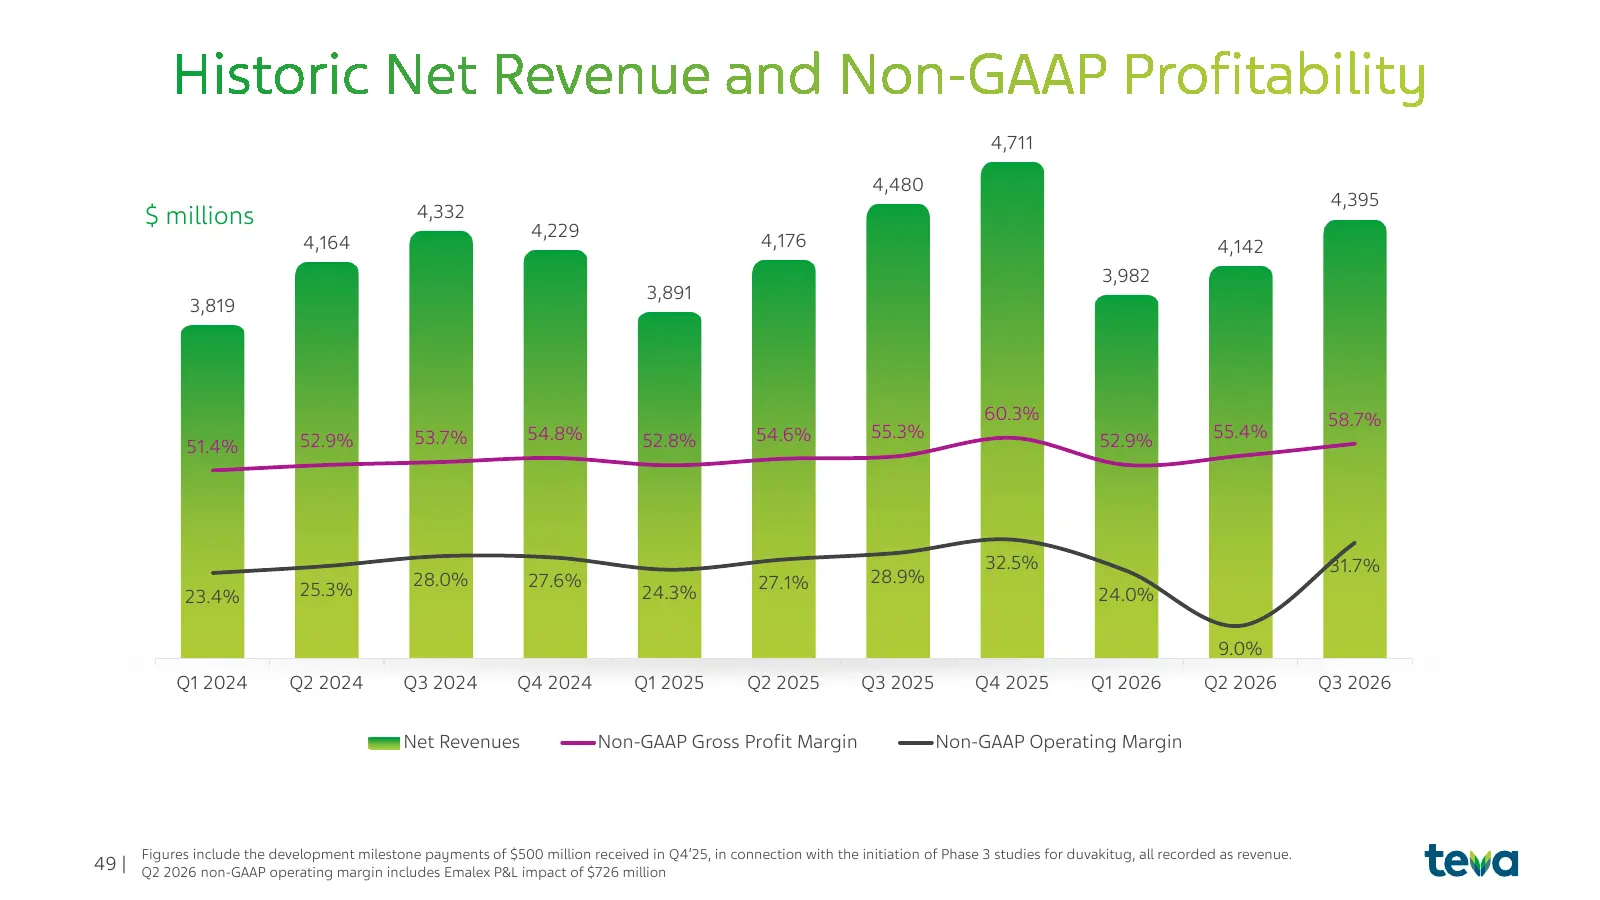
4,711 4,480 4,395 $ millions 4,332 4,229 4,164 4,176 4,142 3,982 3,891 3,819 60.3% 58.7% 52.9% 53.7% 54.8% 52.8% 54.6% 55.3% 52.9% 55.4% 51.4% 32.5% 31.7% 28.0% 27.6% 27.1% 28.9% 23.4% 25.3% 24.3% 24.0% 9.0% Q1 2024 Q2 2024 Q3 2024 Q4 2024 Q1 2025 Q2 2025 Q3 2025 Q4 2025 Q1 2026 Q2 2026 Q3 2026 Net
Slide 50: Revenues by segment and product
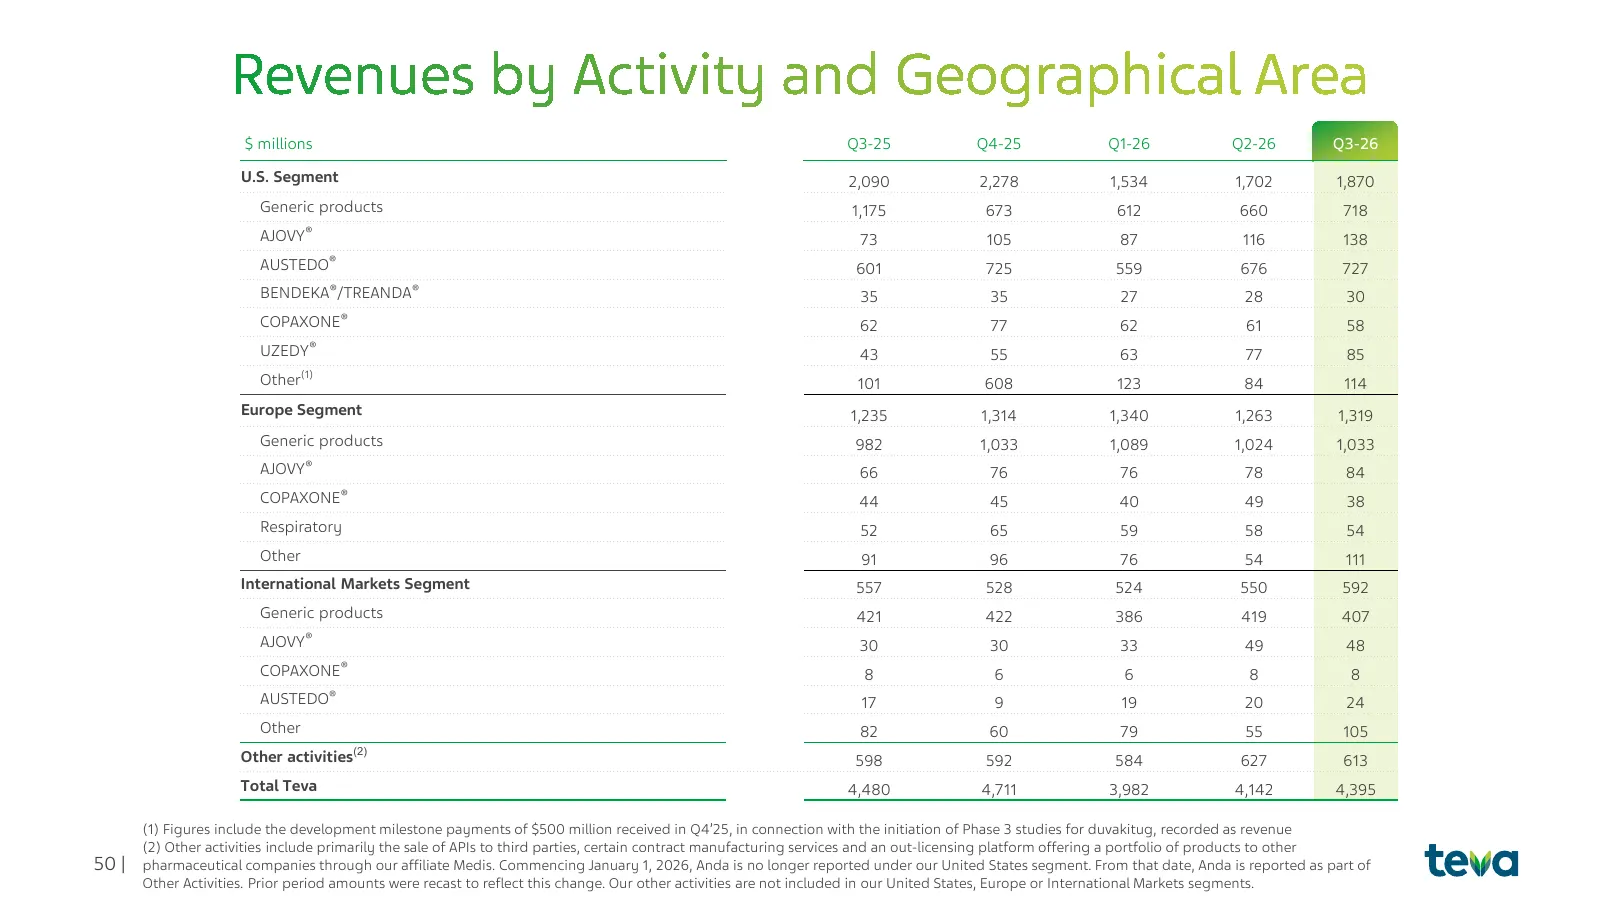
$ millions Q3-25 Q4-25 Q1-26 Q2-26 Q3-26 U.S. Segment 2,090 2,278 1,534 1,702 1,870 Generic products 1,175 673 612 660 718 ® AJOVY 73 105 87 116 138 ® AUSTEDO 601 725 559 676 727 BENDEKA®/TREANDA® 35 35 27 28 30 ® COPAXONE 62 77 62 61 58 ® UZEDY 43 55 63 77 85 Other(1) 101 608 123 84 114 Europe Segm
Slide 51: Non-GAAP net income, operating income and EPS
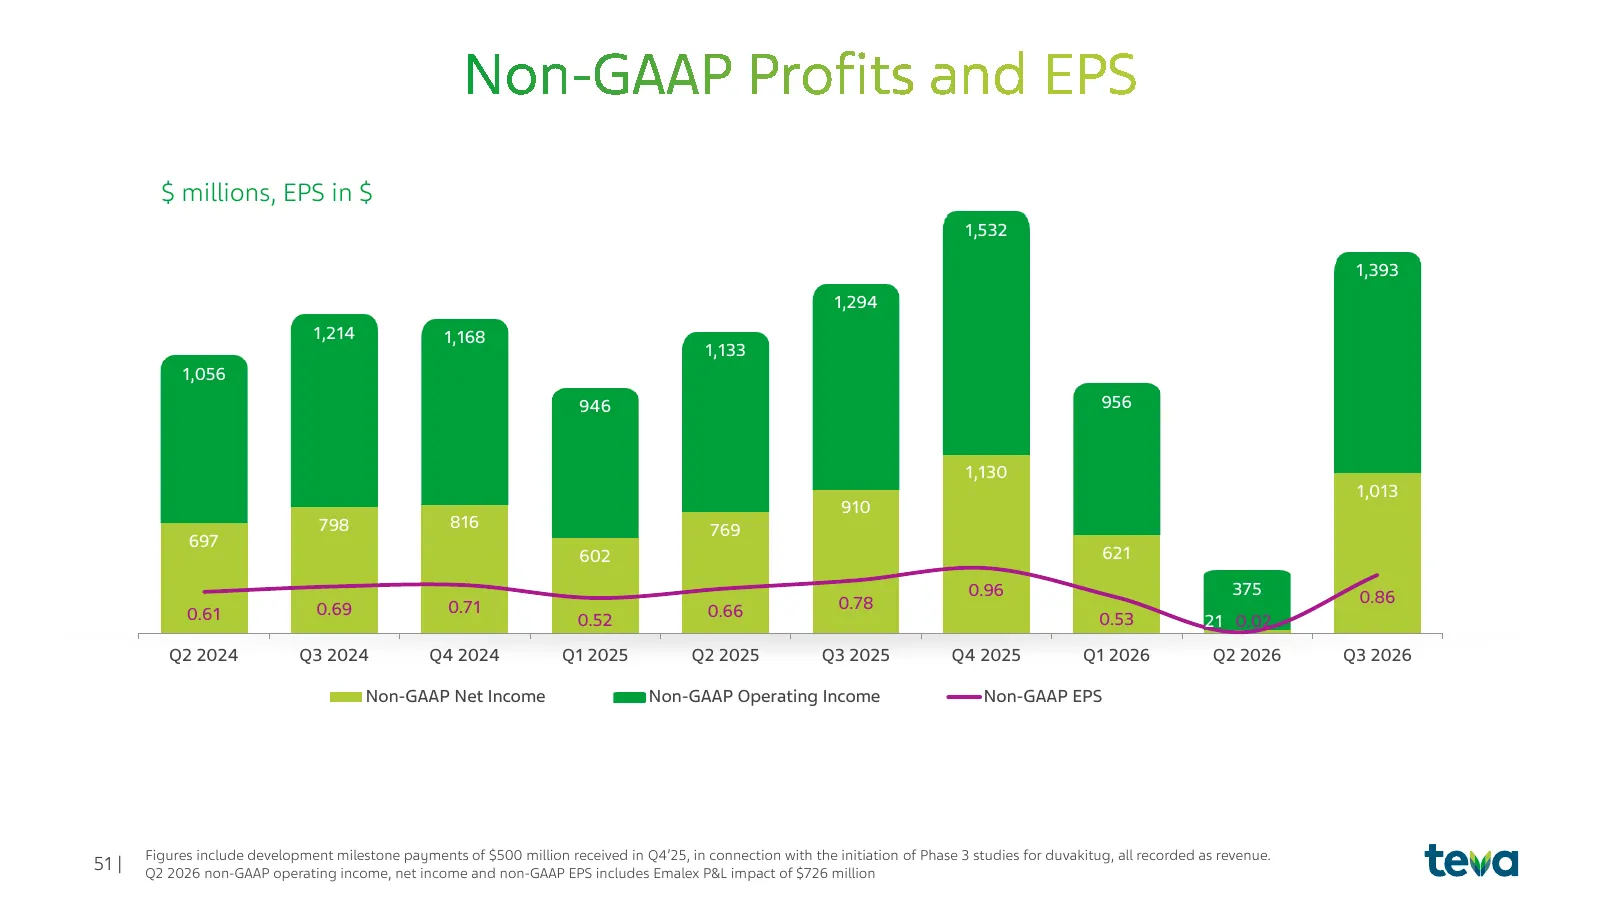
$ millions, EPS in $ 1,532 1,393 1,294 1,214 1,168 1,133 1,056 946 956 1,130 1,013 910 798 816 769 697 602 621 0.96 375 0.86 0.69 0.71 0.66 0.78 0.61 0.52 0.53 21 0.02 Q2 2024 Q3 2024 Q4 2024 Q1 2025 Q2 2025 Q3 2025 Q4 2025 Q1 2026 Q2 2026 Q3 2026 Non-GAAP Net Income Non-GAAP Operating Income Non-GA
Slide 52: Q3 operating income bridge by segment
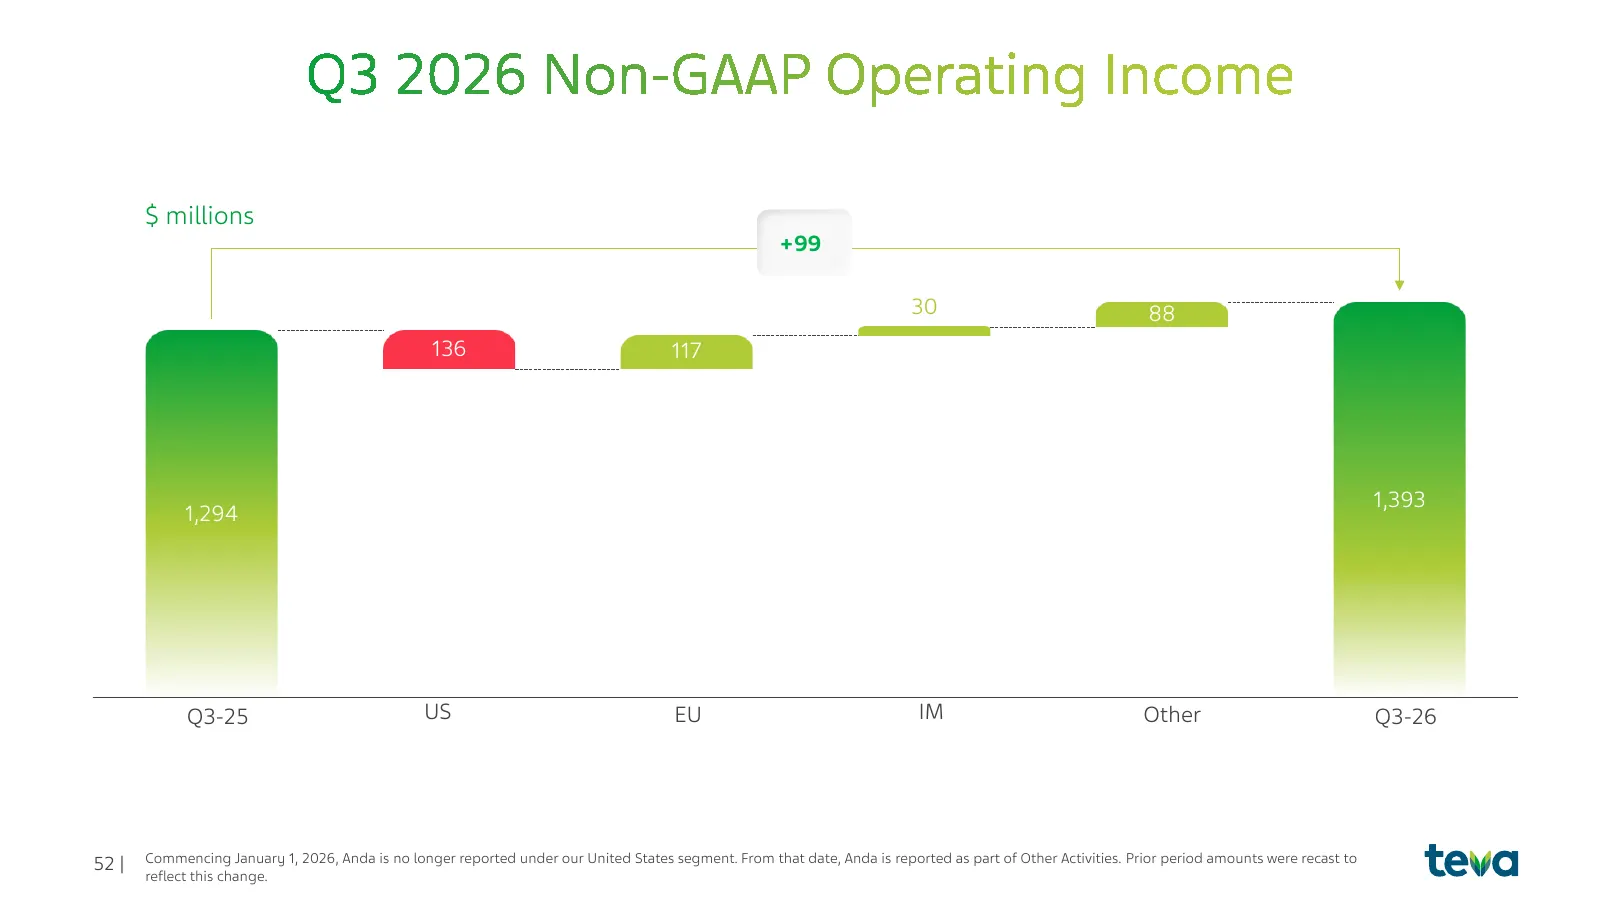
$ millions +99 30 88 136 117 1,393 1,294 Q3-25 Q3 25 US US EU IM IM Other Other Q3-26 Q3 26 52 | Commencing January 1, 2026, Anda is no longer reported under our United States segment. From that date, Anda is reported as part of Other Activities. Prior period amounts were recast to reflect this chan
Slide 53: Q3 YTD operating income bridge by segment
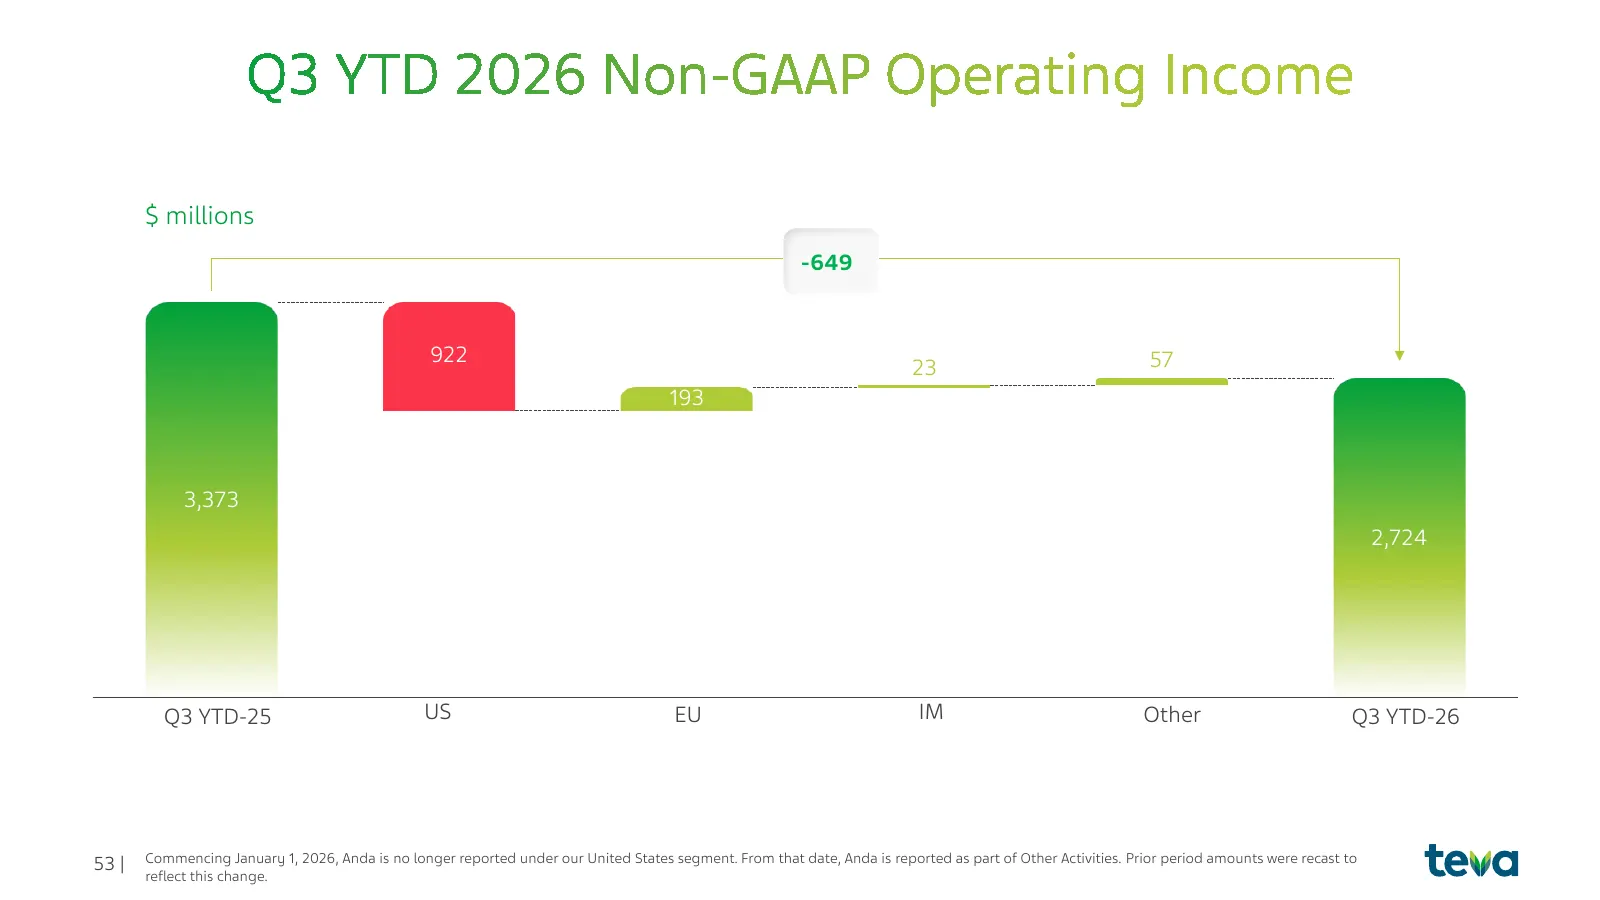
$ millions -649 922 57 23 193 3,373 2,724 Q3 YTD-25 Q3YTD 25 US EU IM Other Q3YTD Q3 YTD-26 26 53 | Commencing January 1, 2026, Anda is no longer reported under our United States segment. From that date, Anda is reported as part of Other Activities. Prior period amounts were recast to reflect this c
Slide 54: Operating income by segment
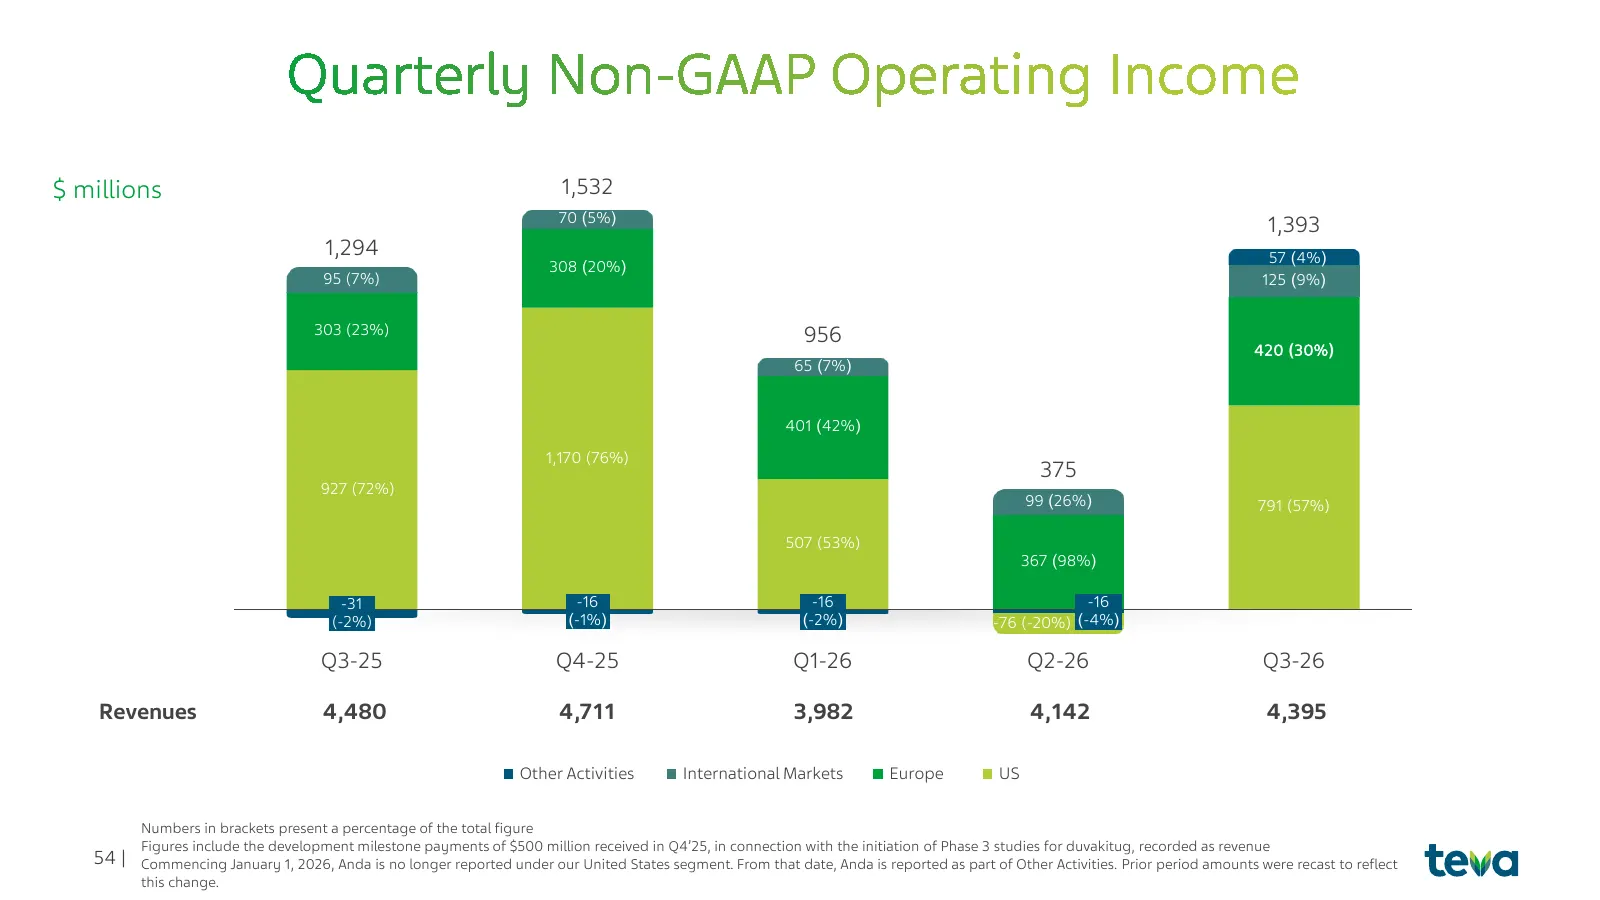
$ millions 1,532 70 (5%) 1,393 1,294 57 (4%) 308 (20%) 95 (7%) 125 (9%) 303 (23%) 956 420 (30%) 65 (7%) 401 (42%) 1,170 (76%) 375 927 (72%) 99 (26%) 791 (57%) 507 (53%) 367 (98%) -31 -16 -16 -16 (-2%) (-1%) (-2%) -76 (-20%) (-4%) Q3-25 Q4-25 Q1-26 Q2-26 Q3-26 Revenues 4,480 4,711 3,982 4,142 4,395 O
Slide 55: COGS and OPEX
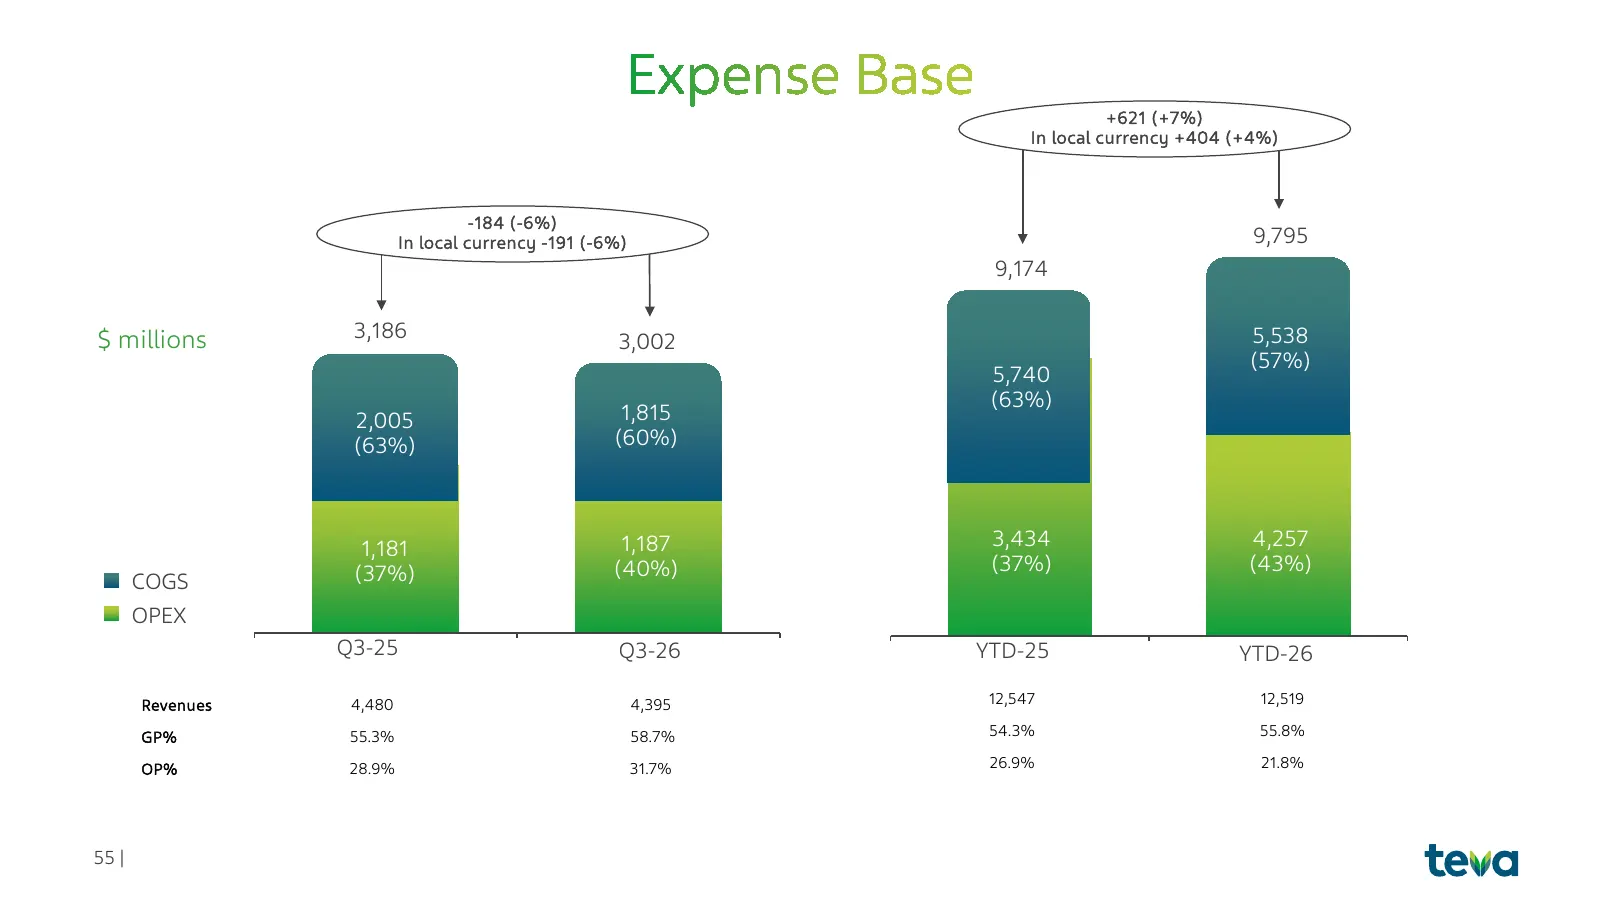
+621 (+7%) In local currency +404 (+4%) -184 (-6%) In local currency -191 (-6%) 9,795 9,174 $ millions 3,186 3,002 5,538 (57%) 5,740 (63%) 2,005 1,815 (63%) (60%) 1,181 1,187 3,434 4,257 (37%) (40%) (37%) (43%) COGS OPEX Q3-25 Q3-26 YTD-25 YTD-26 Revenues 4,480 4,395 12,547 12,519 GP% 55.3% 58.7% 54
Slide 56: Adjusted EBITDA
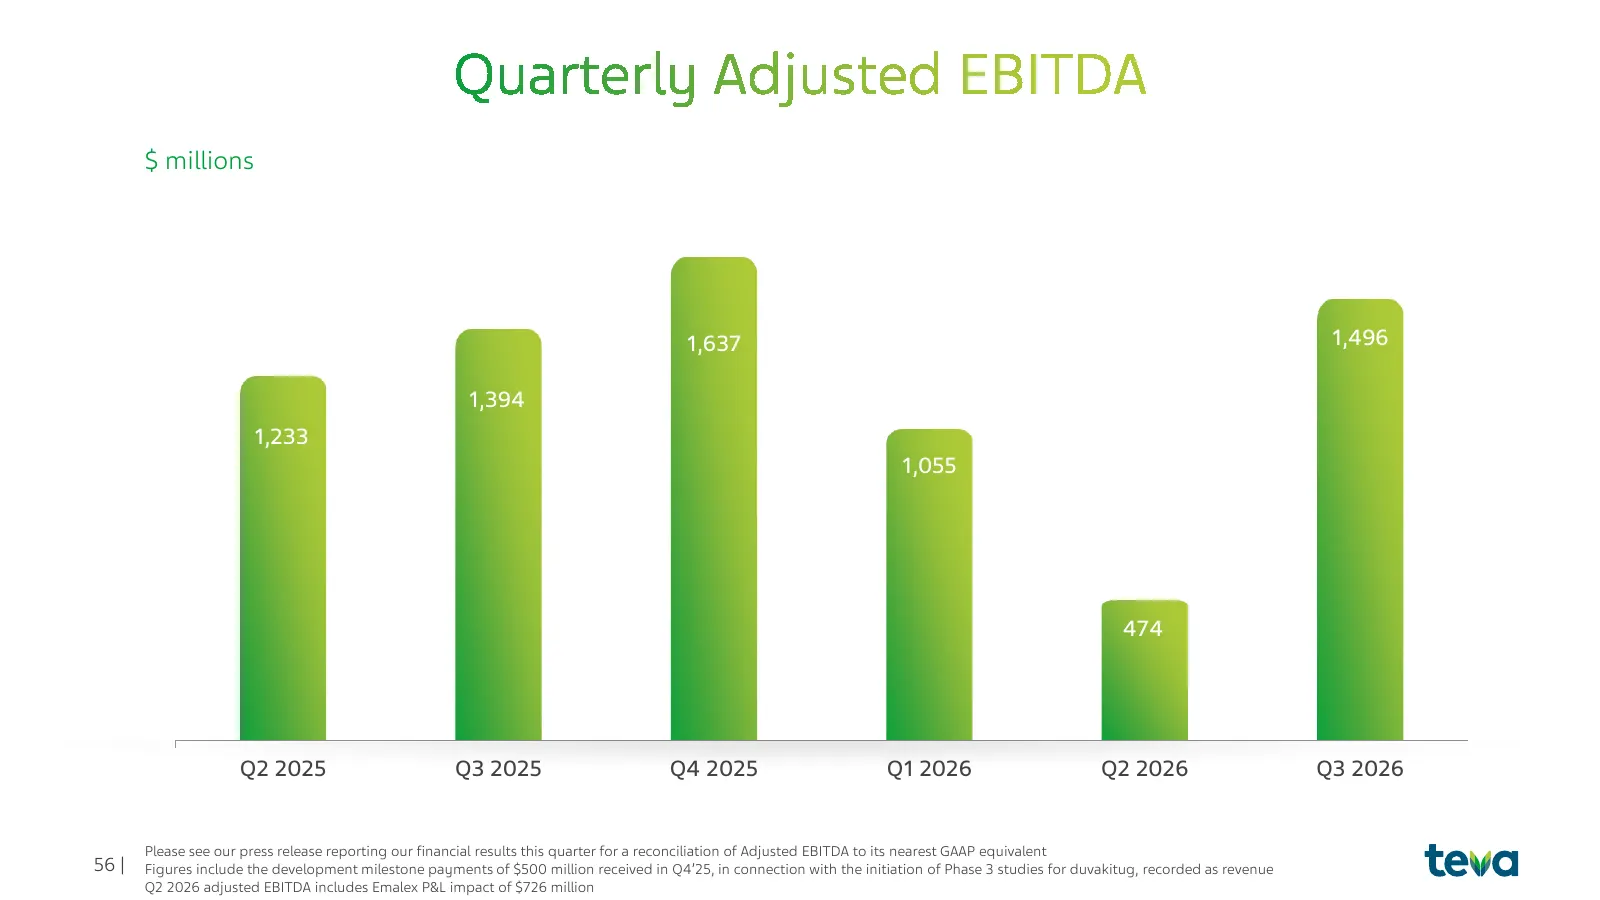
$ millions 1,637 1,496 1,394 1,233 1,055 474 Q2 2025 Q3 2025 Q4 2025 Q1 2026 Q2 2026 Q3 2026 Please see our press release reporting our financial results this quarter for a reconciliation of Adjusted EBITDA to its nearest GAAP equivalent 56 | Figures include the development milestone payments of $50
Slide 57: Free cash flow
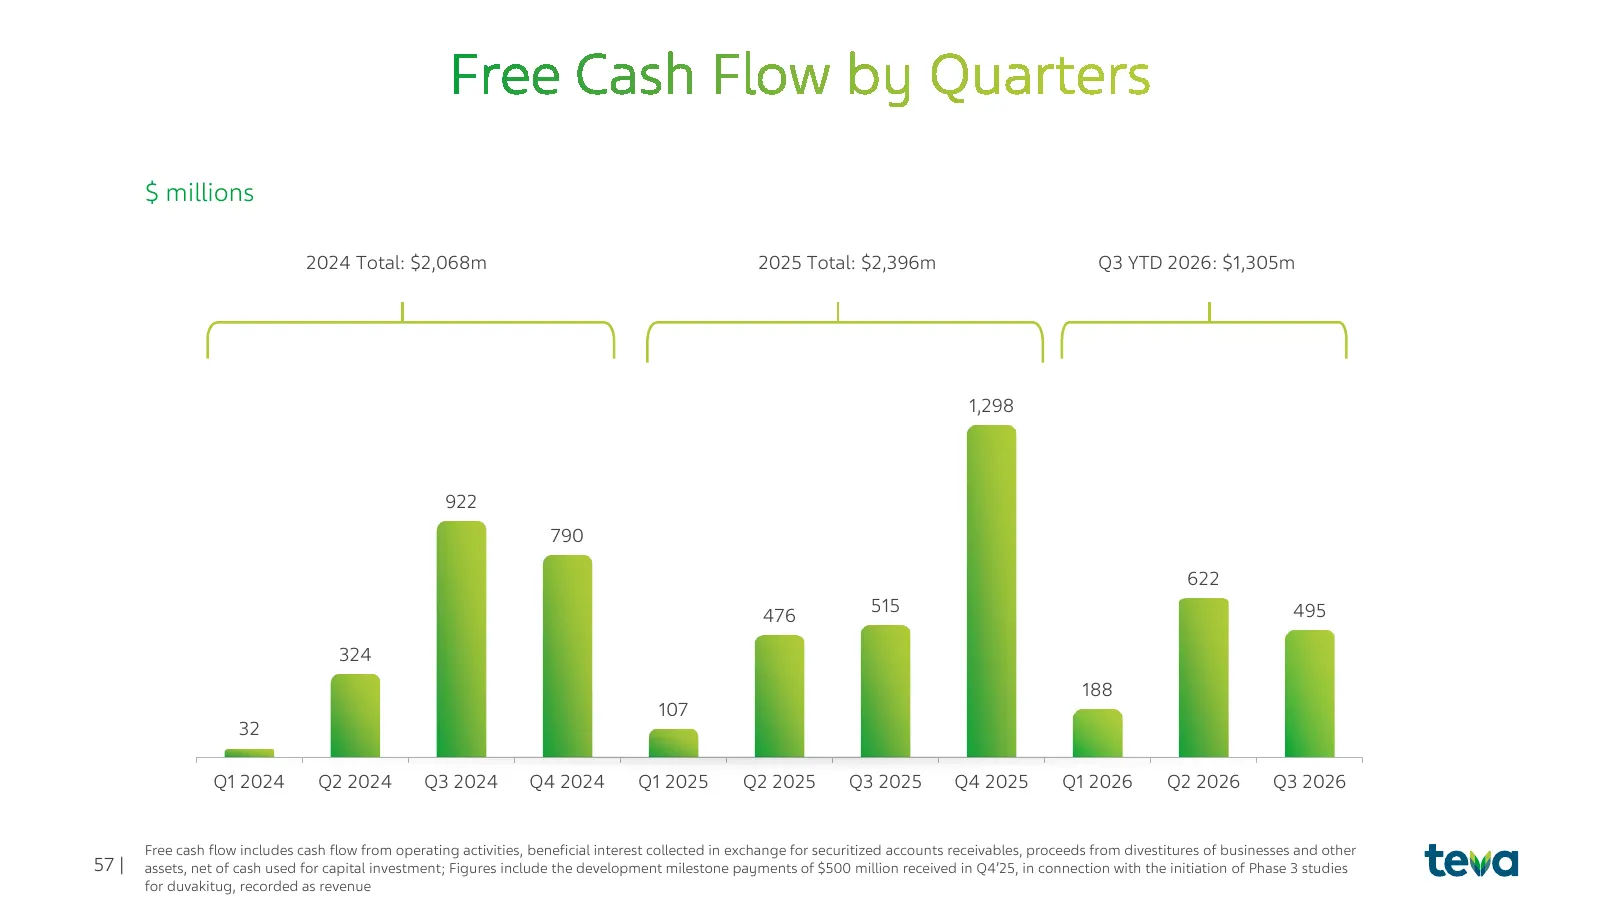
$ millions 2024 Total: $2,068m 2025 Total: $2,396m Q3 YTD 2026: $1,305m 1,298 922 790 622 476 515 495 324 188 107 32 Q1 2024 Q2 2024 Q3 2024 Q4 2024 Q1 2025 Q2 2025 Q3 2025 Q4 2025 Q1 2026 Q2 2026 Q3 2026 Free cash flow includes cash flow from operating activities, beneficial interest collected in e
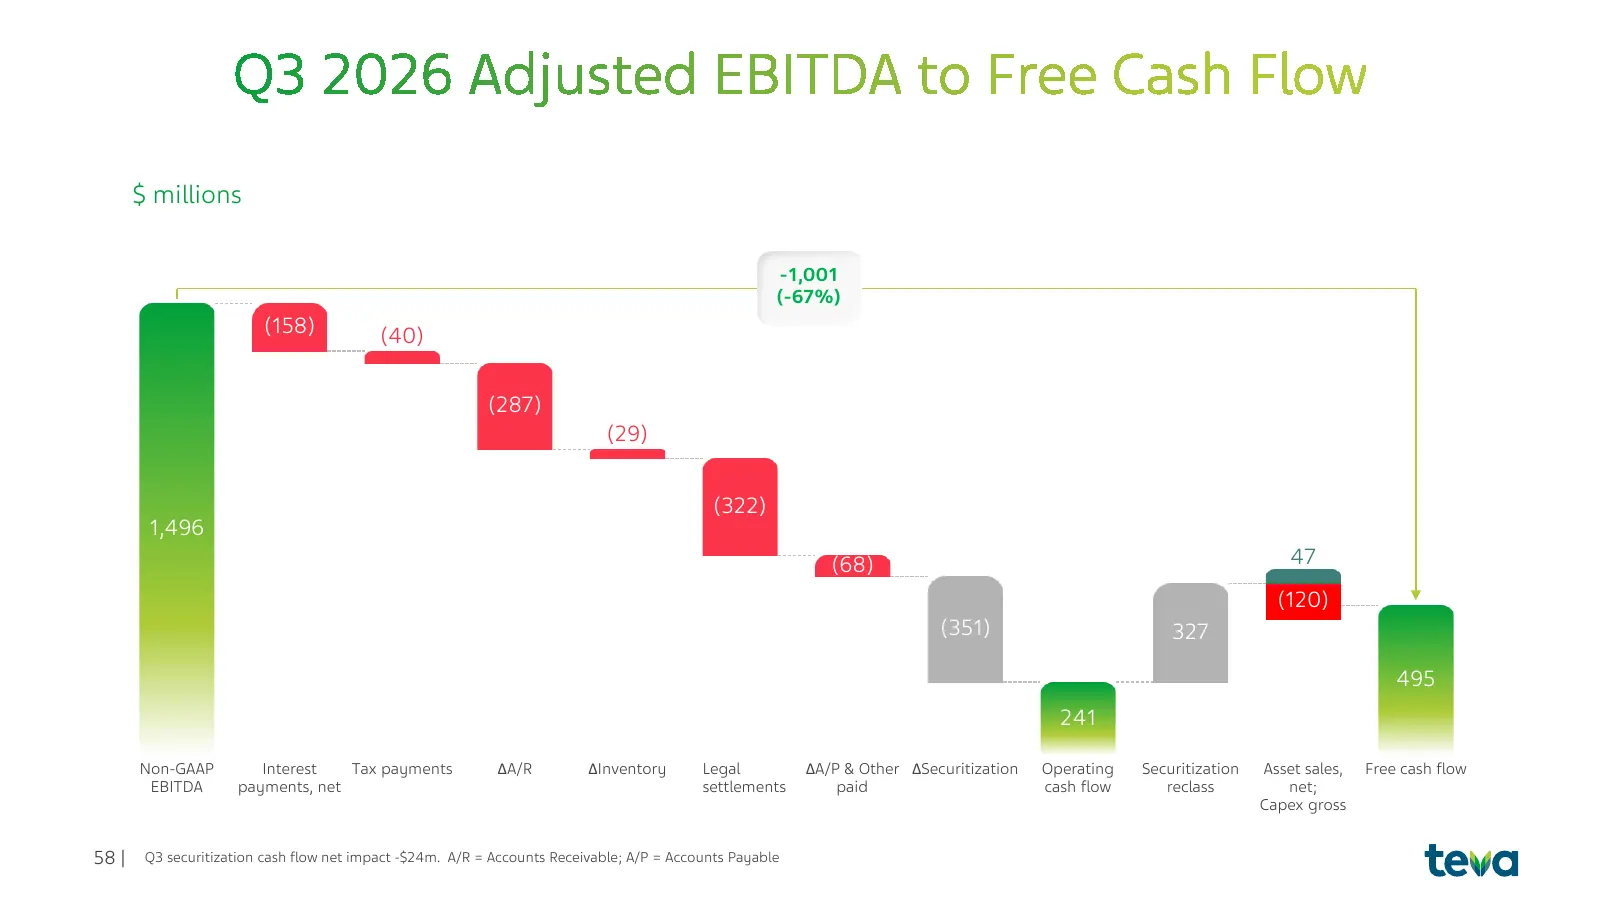
Slide 58: EBITDA to free cash flow bridge
$ millions -1,001 (-67%) (158) (40) (287) (29) (322) 1,496 (68) 47 (120) (351) 327 495 241 Non-GAAP Interest Tax payments ΔA/R ΔInventory Legal ΔA/P & Other ΔSecuritization Operating Securitization Asset sales, Free cash flow EBITDA payments, net settlements paid cash flow reclass net; Capex gross 5
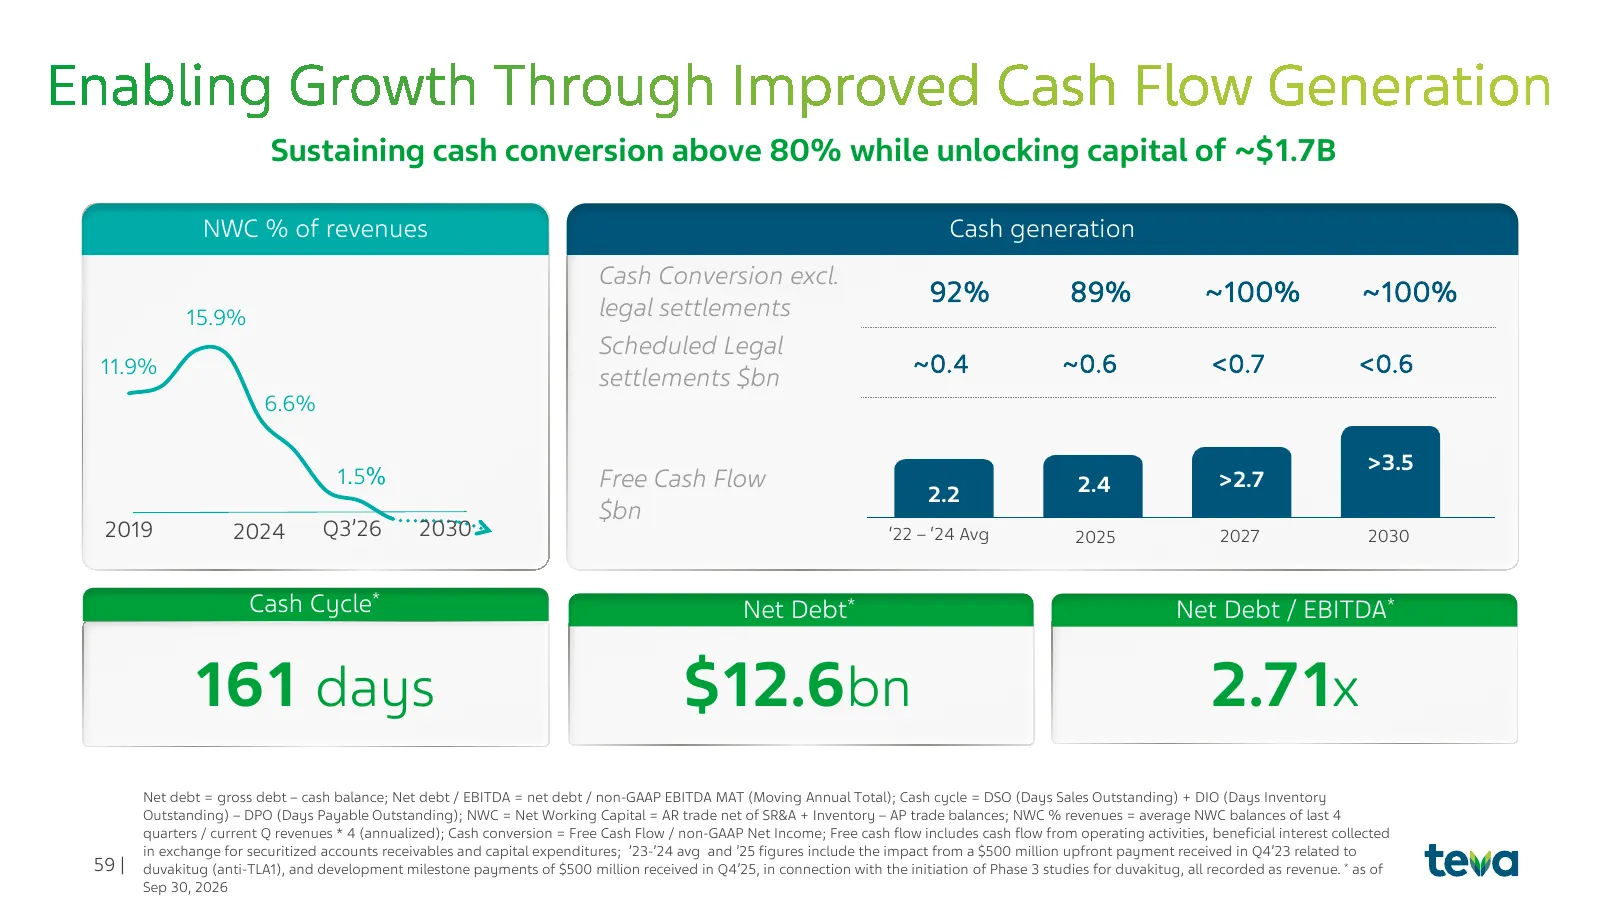
Slide 59: Cash conversion and net debt
Sustaining cash conversion above 80% while unlocking capital of ~$1.7B NWC % of revenues Cash generation Cash Conversion excl. 92% 89% ~100% ~100% 15.9% legal settlements Scheduled Legal 11.9% ~0.4 ~0.6 <0.7 <0.6 settlements $bn 6.6% >3.5 1.5% Free Cash Flow 2.4 >2.7 2.2 $bn 2019 2024 Q3’26 2030 ‘22
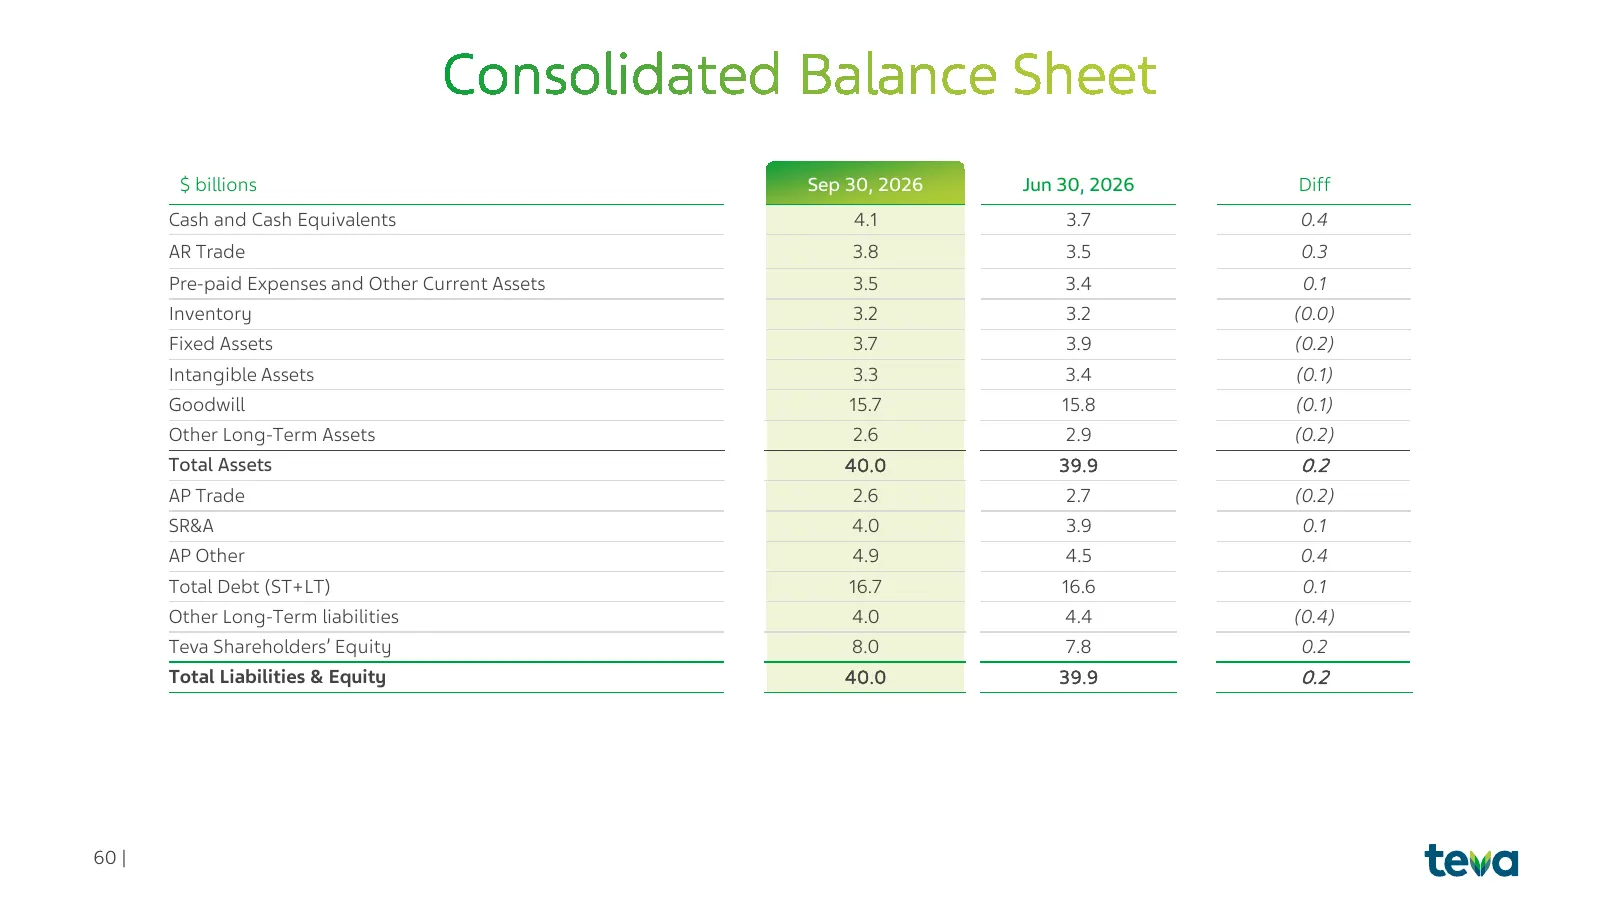
Slide 60: Balance sheet
$ billions Sep 30, 2026 Jun 30, 2026 Diff Cash and Cash Equivalents 4.1 3.7 0.4 AR Trade 3.8 3.5 0.3 Pre-paid Expenses and Other Current Assets 3.5 3.4 0.1 Inventory 3.2 3.2 (0.0) Fixed Assets 3.7 3.9 (0.2) Intangible Assets 3.3 3.4 (0.1) Goodwill 15.7 15.8 (0.1) Other Long-Term Assets 2.6 2.9 (0.2)
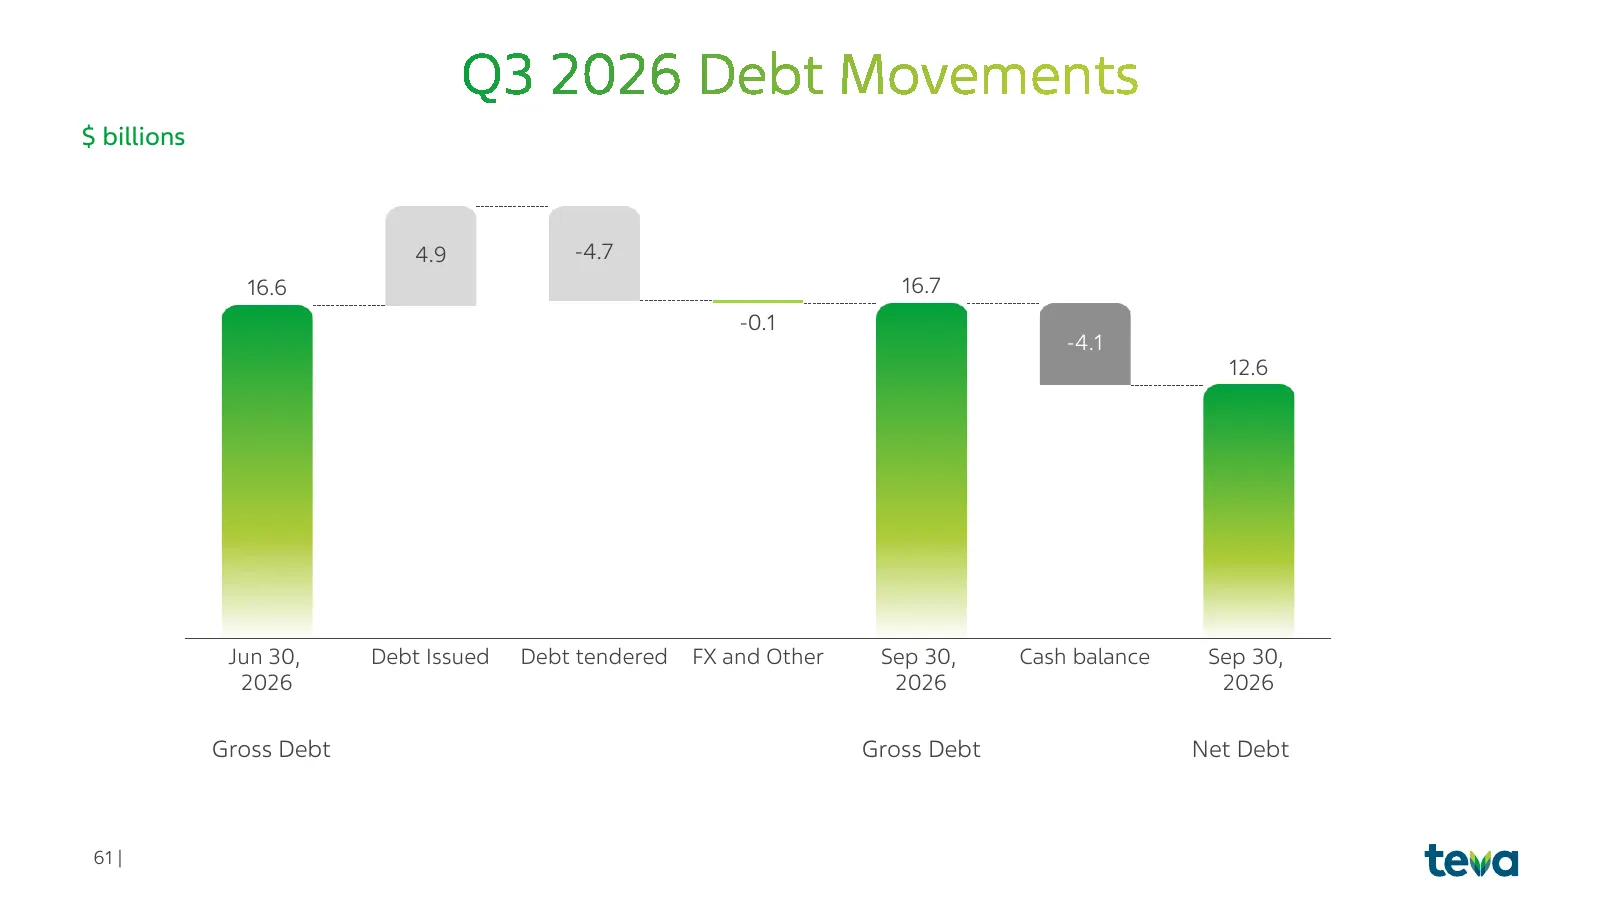
Slide 61: Gross and net debt movement
$ billions 4.9 -4.7 16.6 16.7 -0.1 -4.1 12.6 Jun 30, Debt Issued Debt tendered FX and Other Sep 30, Cash balance Sep 30, 2026 2026 2026 Gross Debt Gross Debt Net Debt 61 |
Slide 62: Net debt and leverage
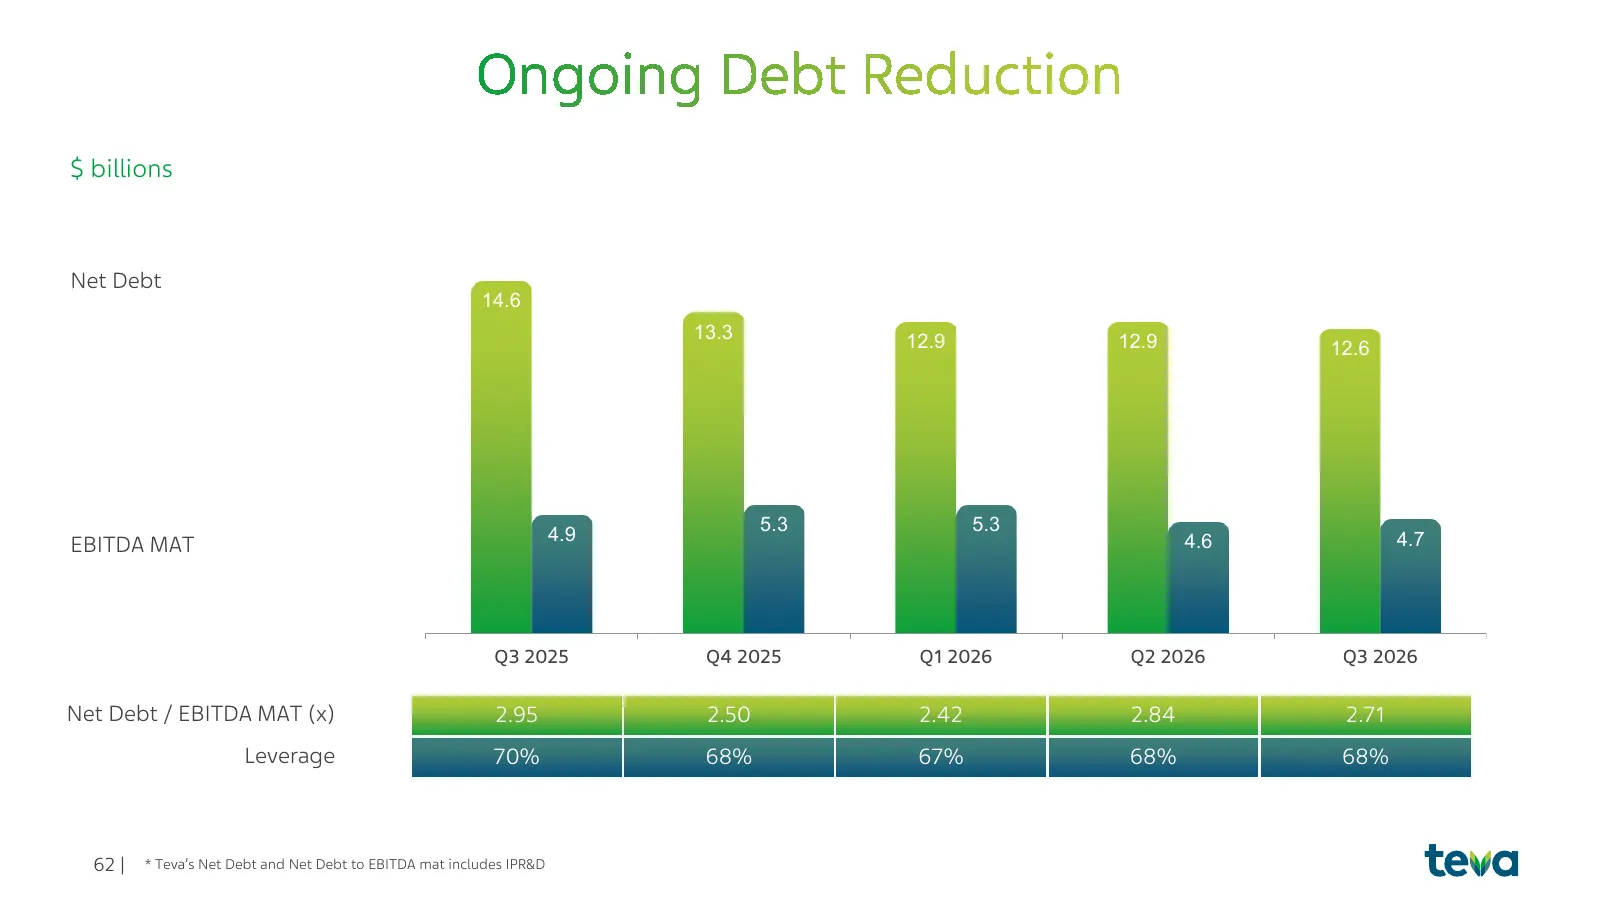
$ billions Net Debt 14.6 13.3 12.9 12.9 12.6 4.9 5.3 5.3 EBITDA MAT 4.6 4.7 Q3 2025 Q4 2025 Q1 2026 Q2 2026 Q3 2026 Net Debt / EBITDA MAT (x) 2.95 2.50 2.42 2.84 2.71 Leverage 70% 68% 67% 68% 68% 62 | * Teva’s Net Debt and Net Debt to EBITDA mat includes IPR&D
Slide 63: Net debt trend
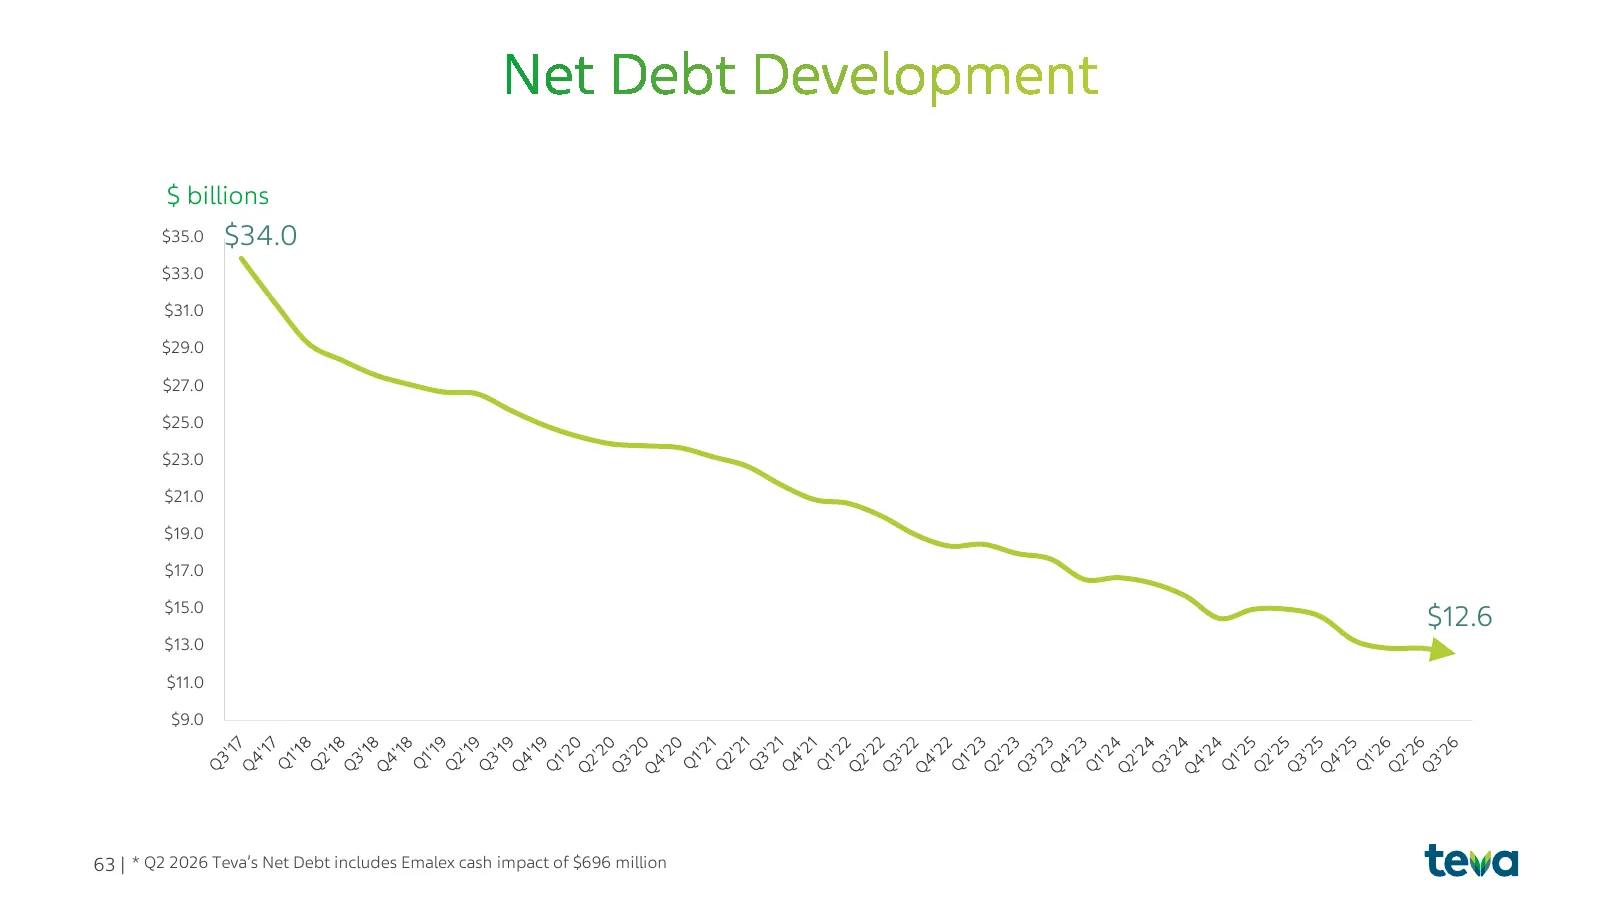
$ billions $35.0 $34.0 $33.0 $31.0 $29.0 $27.0 $25.0 $23.0 $21.0 $19.0 $17.0 $15.0 $12.6 $13.0 $11.0 $9.0 63 | * Q2 2026 Teva’s Net Debt includes Emalex cash impact of $696 million
Slide 64: Credit rating upgrades
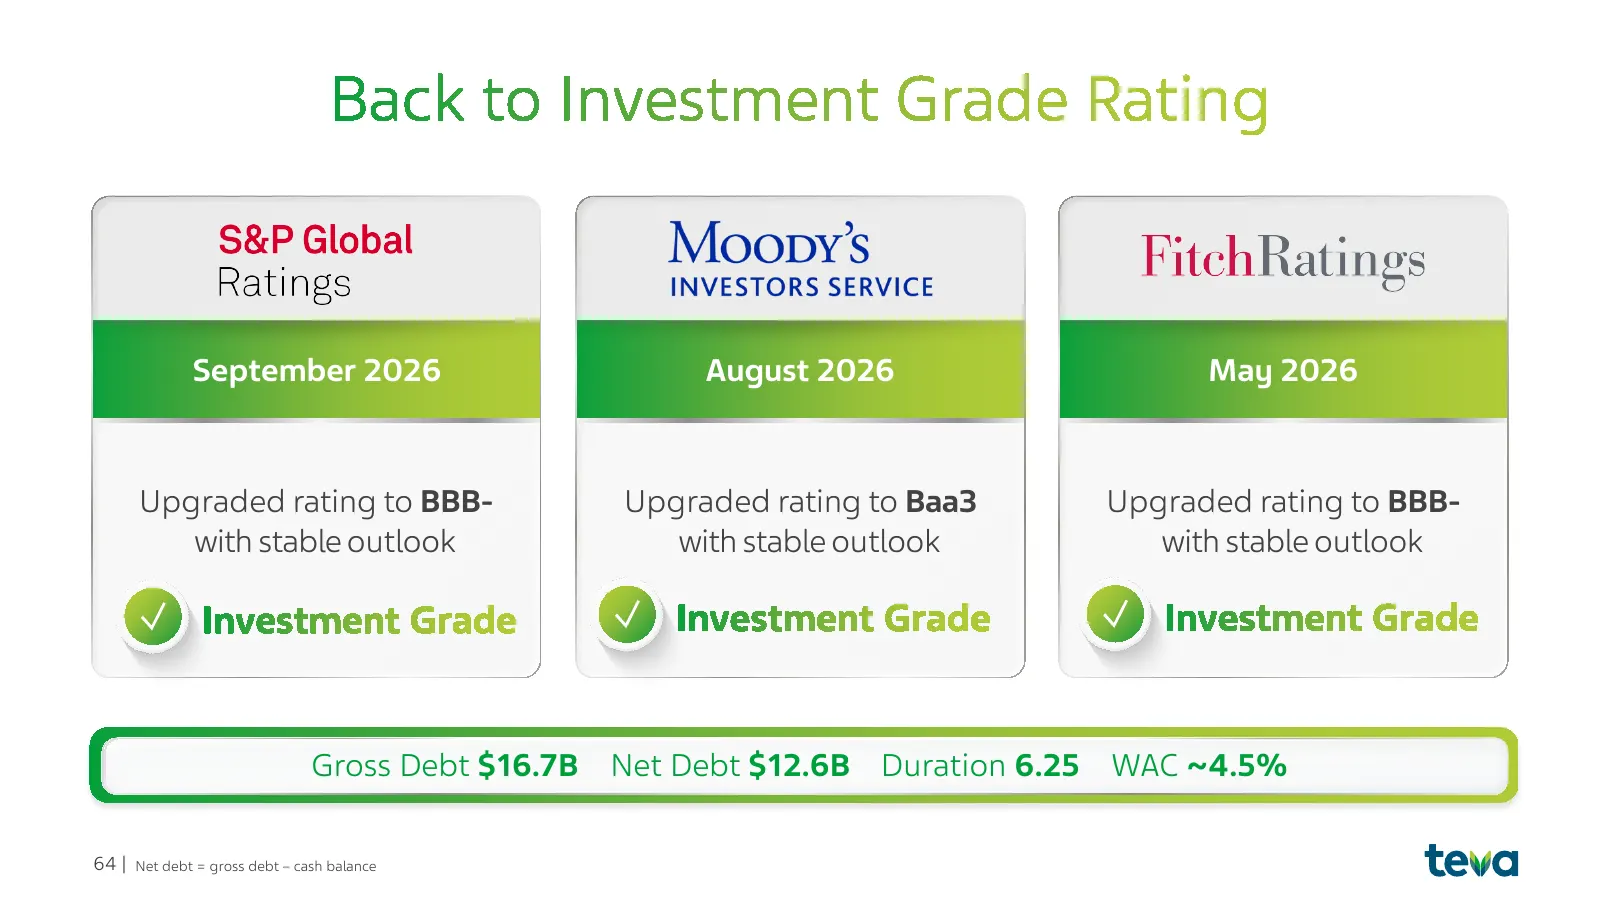
September 2026 August 2026 May 2026 Upgraded rating to BBB- Upgraded rating to Baa3 Upgraded rating to BBB- with stable outlook with stable outlook with stable outlook Gross Debt $16.7B Net Debt $12.6B Duration 6.25 WAC ~4.5% 64 | Net debt = gross debt – cash balance
Slide 65: Debt maturity profile before and after refinancing
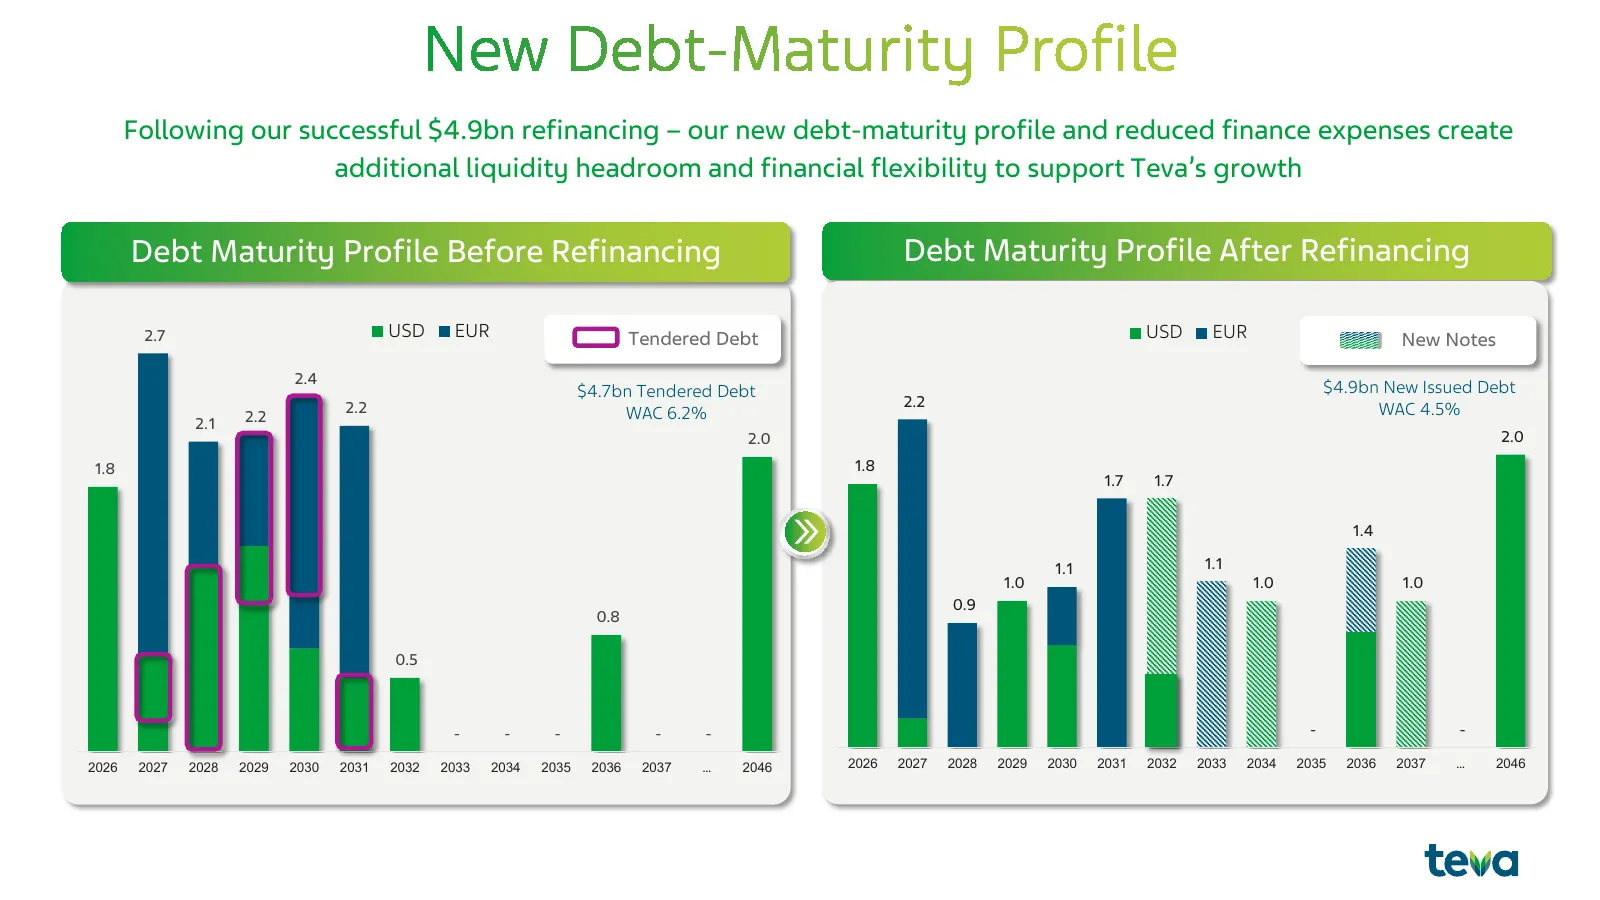
Following our successful $4.9bn refinancing – our new debt-maturity profile and reduced finance expenses create additional liquidity headroom and financial flexibility to support Teva’s growth Debt Maturity Profile Before Refinancing Debt Maturity Profile After Refinancing 2.7 USD EUR Tendered Debt
Slide 66: Q3 2026 non-GAAP adjustments
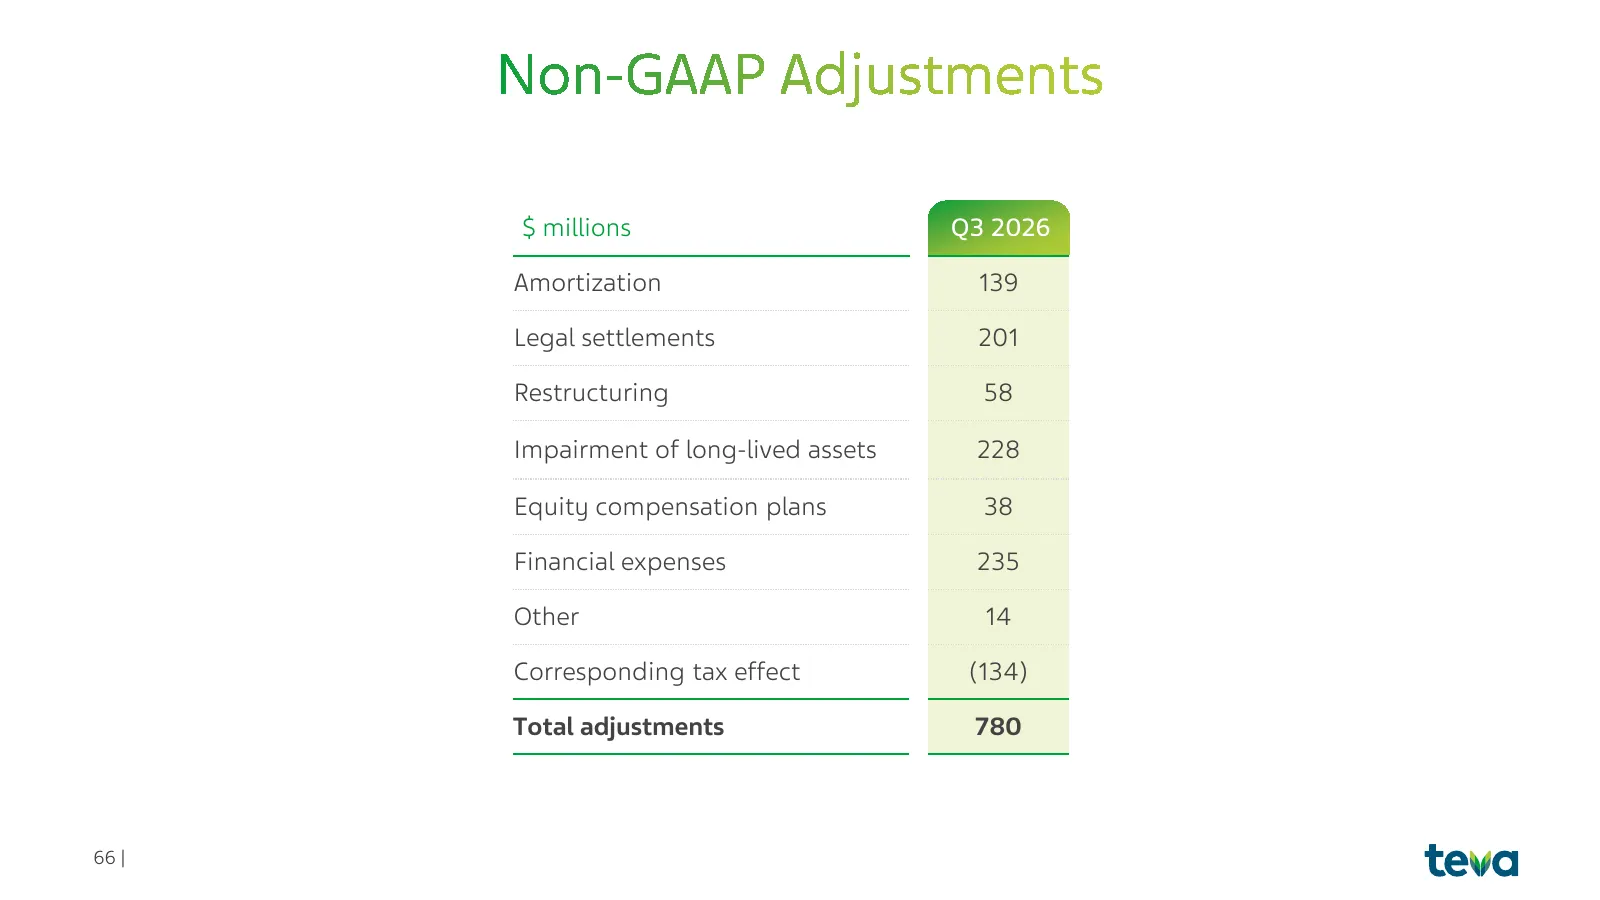
$ millions Q3 2026 Amortization 139 Legal settlements 201 Restructuring 58 Impairment of long-lived assets 228 Equity compensation plans 38 Financial expenses 235 Other 14 Corresponding tax effect (134) Total adjustments 780 66 |
Slide 67: New P&L segment presentation
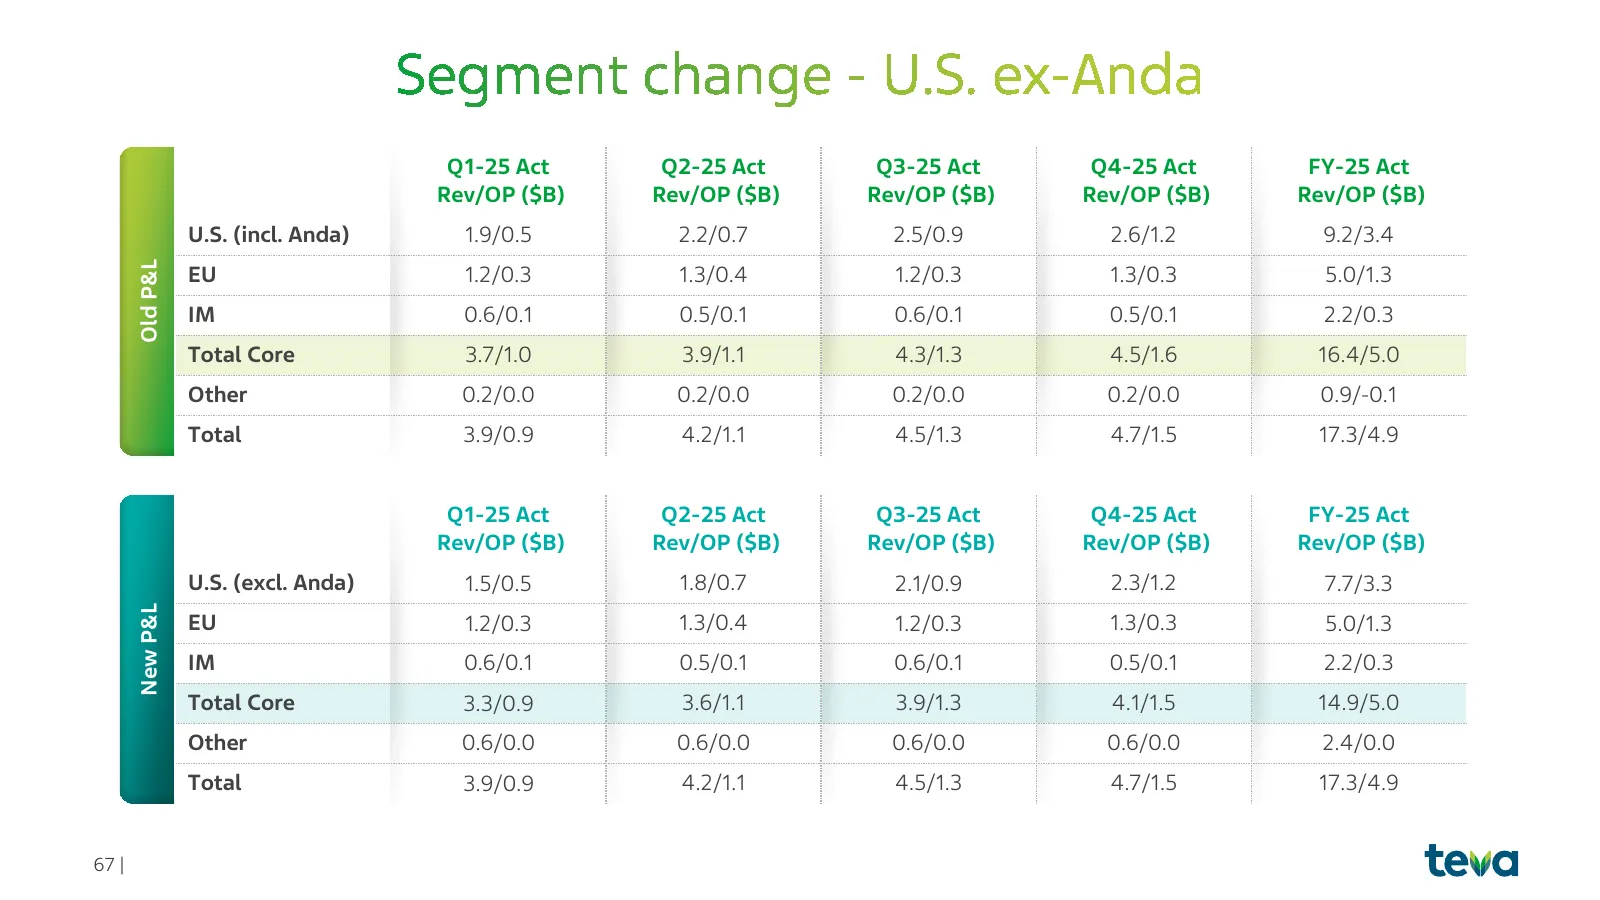
Q1-25 Act Q2-25 Act Q3-25 Act Q4-25 Act FY-25 Act Rev/OP ($B) Rev/OP ($B) Rev/OP ($B) Rev/OP ($B) Rev/OP ($B) U.S. (incl. Anda) 1.9/0.5 2.2/0.7 2.5/0.9 2.6/1.2 9.2/3.4 Old P&L EU 1.2/0.3 1.3/0.4 1.2/0.3 1.3/0.3 5.0/1.3 IM 0.6/0.1 0.5/0.1 0.6/0.1 0.5/0.1 2.2/0.3 Total Core 3.7/1.0 3.9/1.1 4.3/1.3 4.5
Slide 68: IQVIA TRx trends
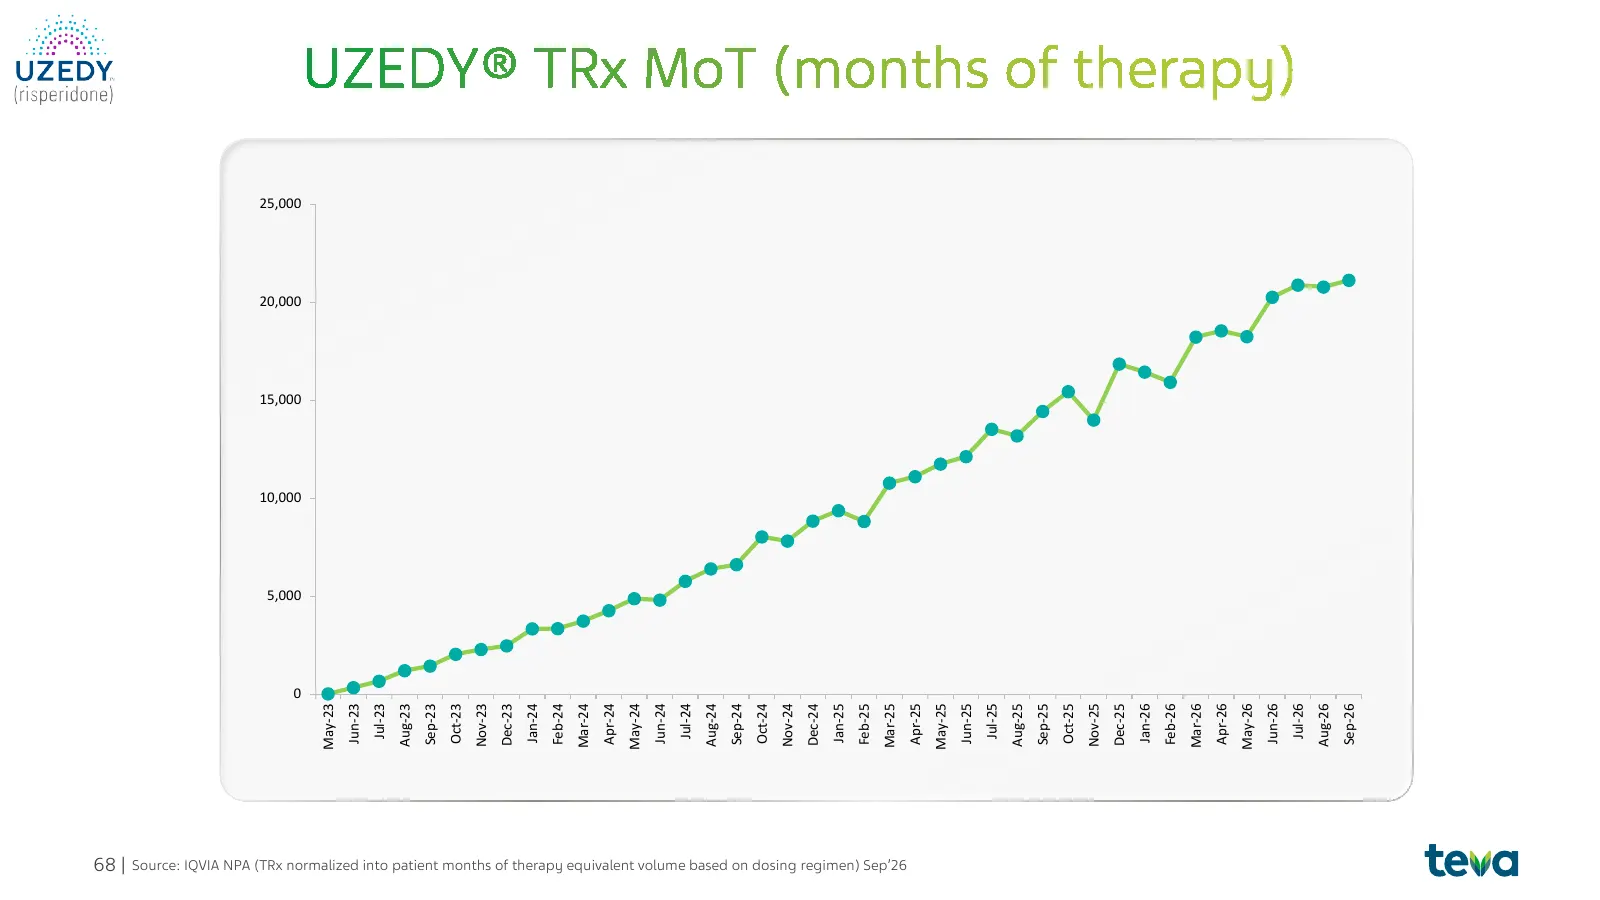
0 5,000 10,000 15,000 20,000 25,000 May-23 Jun-23 Jul-23 Aug-23 Sep-23 Oct-23 Nov-23 Dec-23 Jan-24 Feb-24 Mar-24 Apr-24 May-24 Jun-24 Jul-24 Aug-24 Sep-24 Oct-24 Nov-24 Dec-24 Jan-25 Feb-25 Mar-25 68 | Source: IQVIA NPA (TRx normalized into patient months of therapy equivalent volume based on dosing
Slide 69: Return to growth track record and 2027 targets
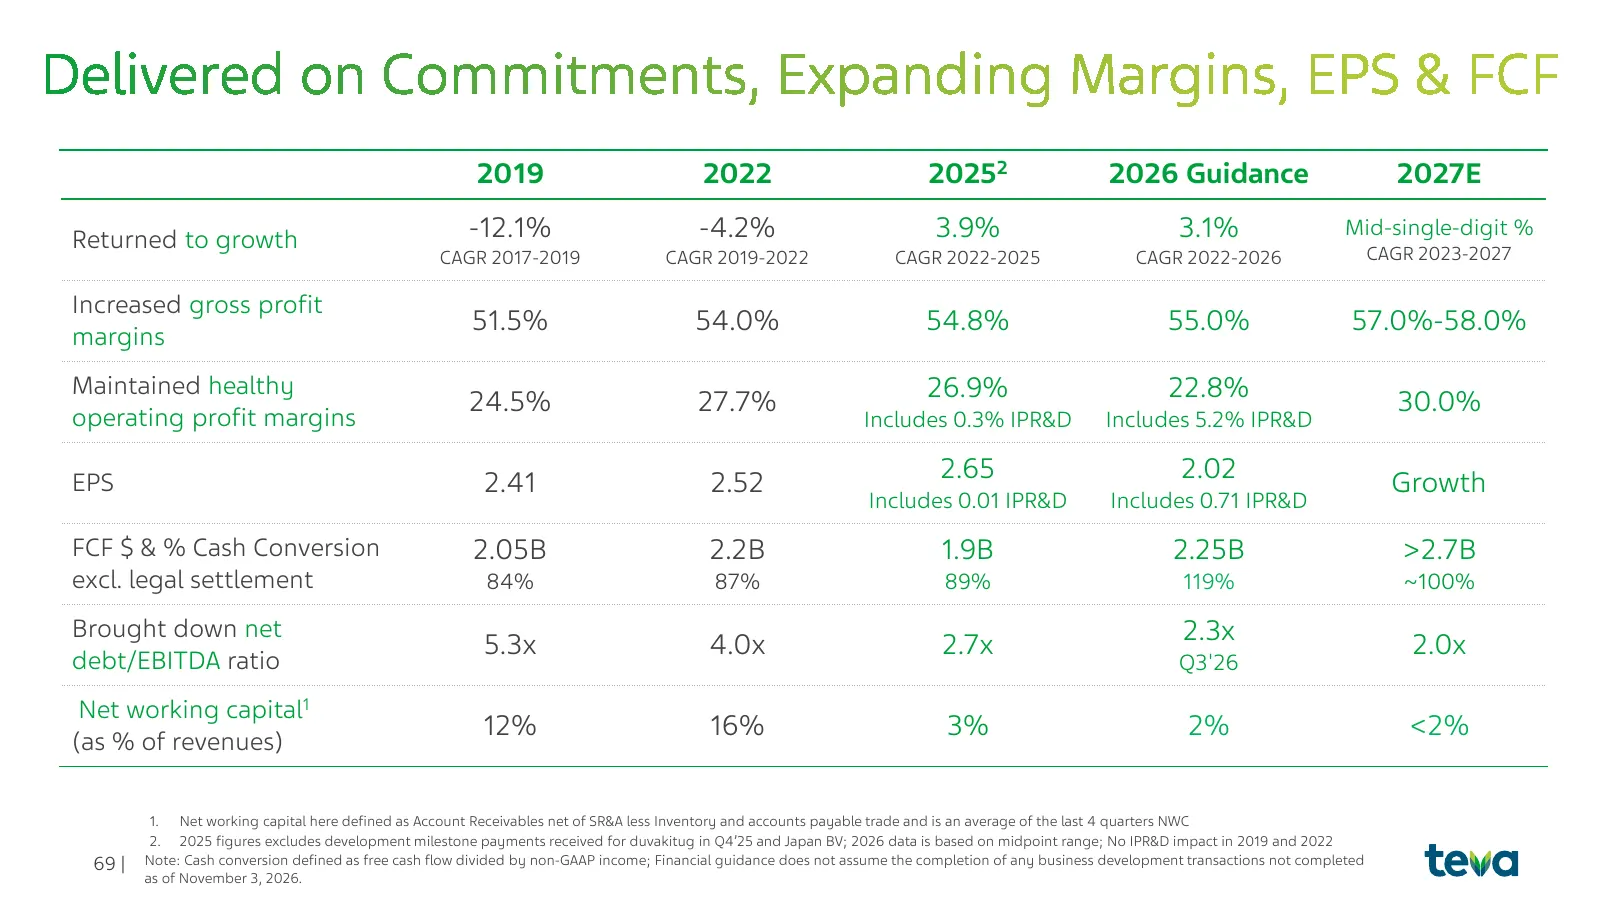
2019 2022 20252 2026 Guidance 2027E Returned to growth -12.1% -4.2% 3.9% 3.1% Mid-single-digit % CAGR 2017-2019 CAGR 2019-2022 CAGR 2022-2025 CAGR 2022-2026 CAGR 2023-2027 Increased gross profit margins 51.5% 54.0% 54.8% 55.0% 57.0%-58.0% Maintained healthy 24.5% 27.7% 26.9% 22.8% 30.0% operating pr
Slide 70: We are all in for better health
v We are all in for better health
Source: 6ix earnings call
More decks from Teva Pharmaceutical Industries Limited
 Corporate Update (October 2026)15 slides · Oct 9, 2026
 IL-15 Celiac Disease Phase 2a Topline Results - Conference Call (September 2026)23 slides · Sep 2, 2026
 Q2 2026 Earnings Presentation74 slides · Jul 29, 2026
 Technical Presentation (July 2026)19 slides · Jul 7, 2026
 Technical Presentation (July 2026)18 slides · Jul 7, 2026
 Q1 2026 Earnings Presentation73 slides · Apr 29, 2026