American Residential Properties Inc
American Residential Properties — BAML 2014 Global Real Estate Conference
31 slides from American Residential Properties's conference presentation, Sep 9, 2014
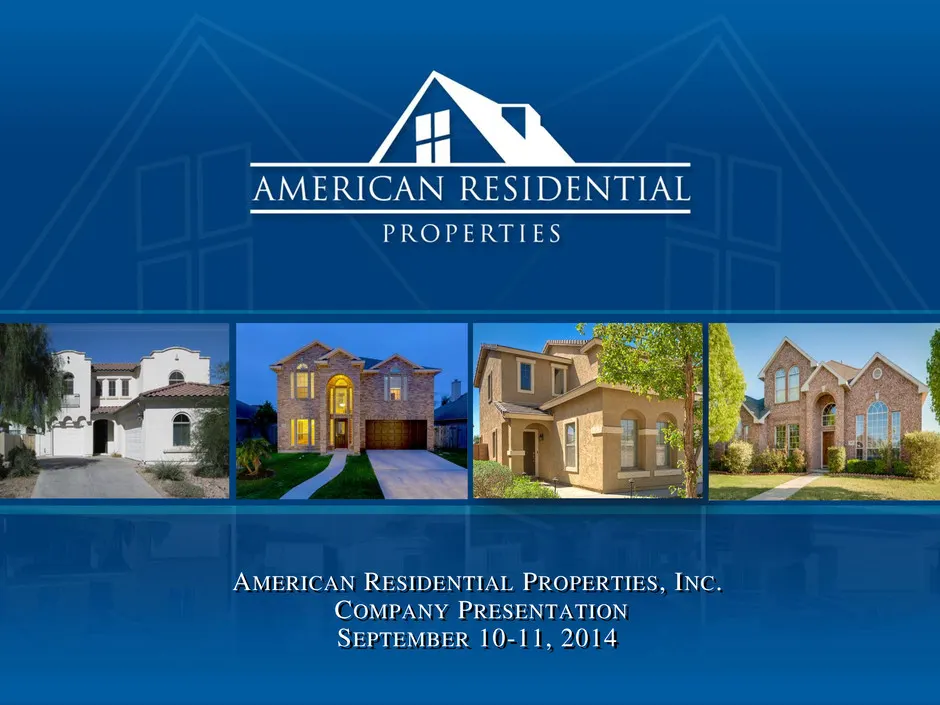
Slide 1: American Residential Properties, Inc. Company Presentation
AMERICAN RESIDENTIAL PROPERTIES, INC. COMPANY PRESENTATION SEPTEMBER 10-11, 2014
Slide 2: Disclaimer and Cautionary Note Regarding Forward-Looking Statements
EPS\Management Presentation\American Residential Properties - 602505097 DISCLAIMER AND CAUTIONARY NOTE REGARDING FORWARD-LOOKING STATEMENTS The information in this presentation has been prepared solely for informational purposes and does not constitute an offer to sell or the solicitation of an offe
Slide 3: Executive Summary
EPS\Management Presentation\American Residential Properties - 602505097 EXECUTIVE SUMMARY 3
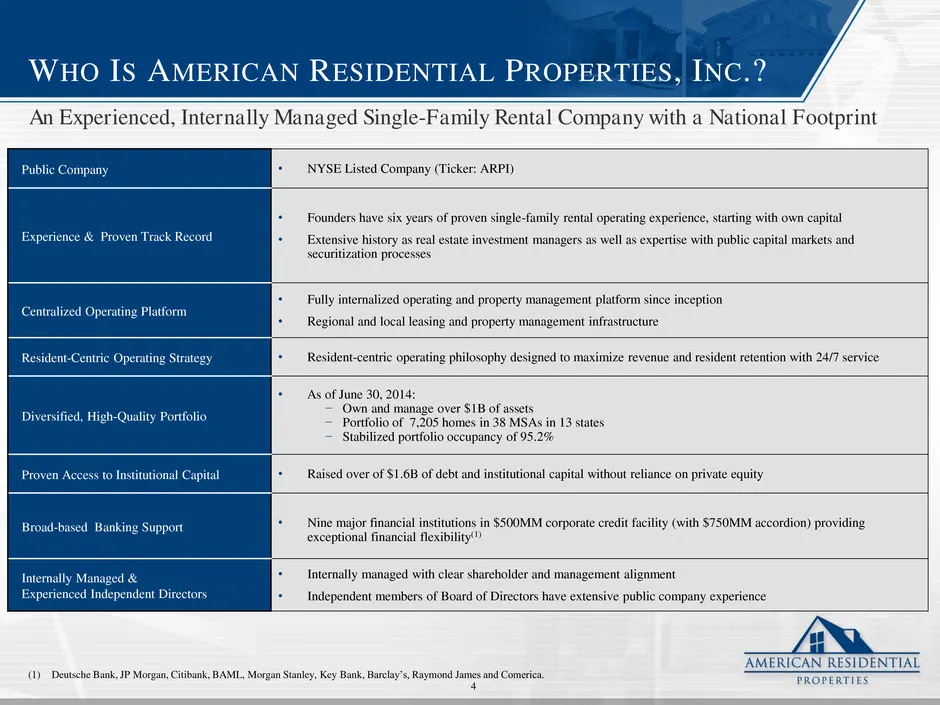
Slide 4: Who Is American Residential Properties, Inc.?
EPS\Management Presentation\American Residential Properties - 602505097 WHO IS AMERICAN RESIDENTIAL PROPERTIES, INC.? An Experienced, Internally Managed Single-Family Rental Company with a National Footprint (1) Deutsche Bank, JP Morgan, Citibank, BAML, Morgan Stanley, Key Bank, Barclay’s, Raymond J
Slide 5: What Is Our Strategy?
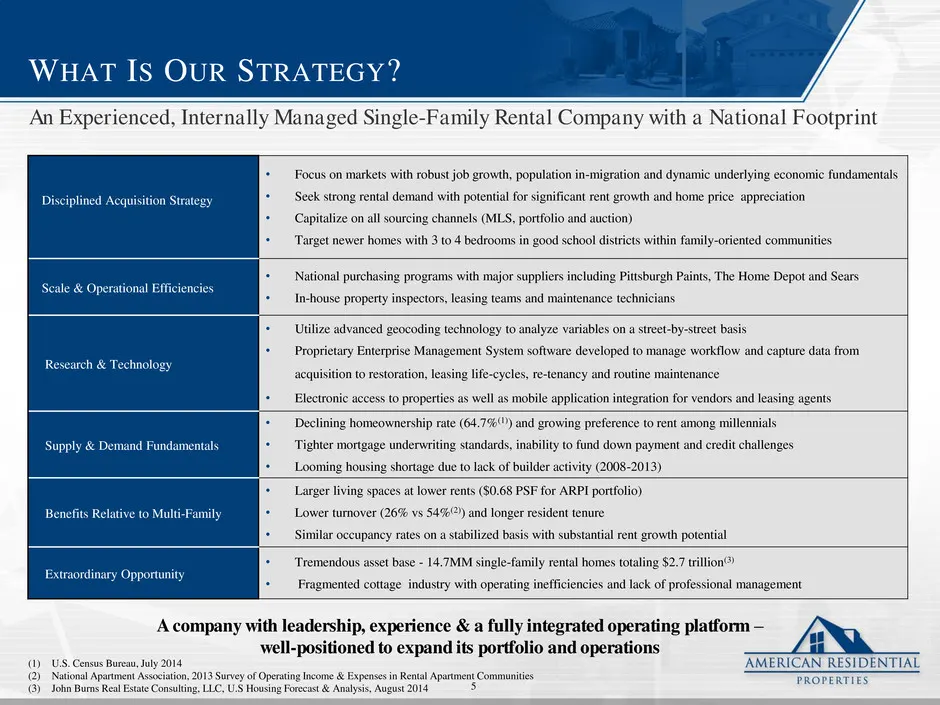
EPS\Management Presentation\American Residential Properties - 602505097 WHAT IS OUR STRATEGY? An Experienced, Internally Managed Single-Family Rental Company with a National Footprint A company with leadership, experience & a fully integrated operating platform – well-positioned to expand its portfo
Slide 6: An Experienced Operating Company
EPS\Management Presentation\American Residential Properties - 602505097 AN EXPERIENCED OPERATING COMPANY 6
Slide 7: How Did We Build the Company?
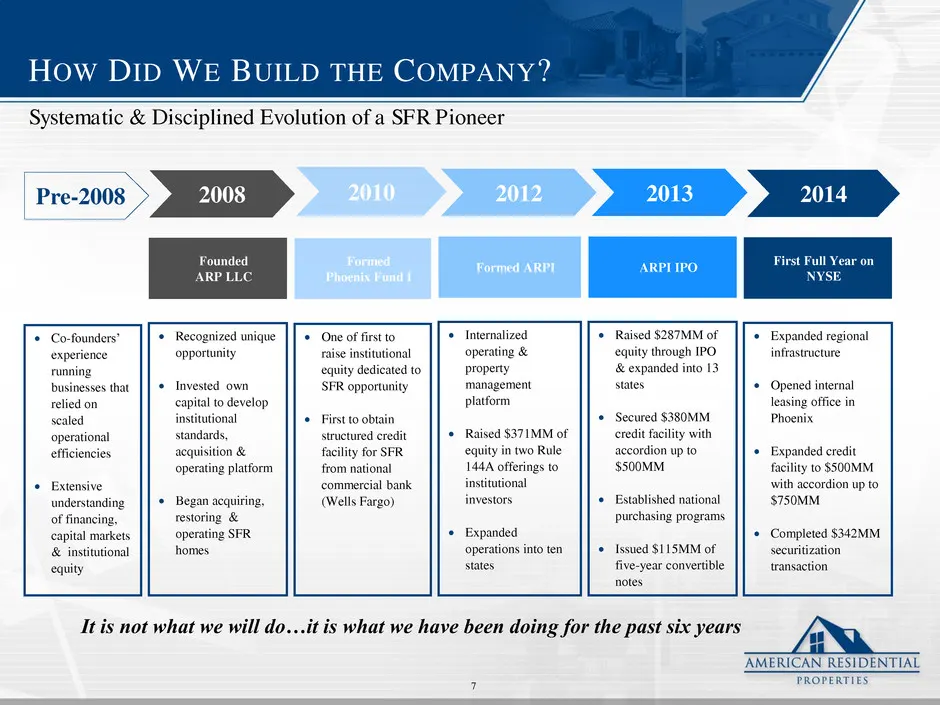
EPS\Management Presentation\American Residential Properties - 602505097 HOW DID WE BUILD THE COMPANY? One of first to raise institutional equity dedicated to SFR opportunity First to obtain structured credit facility for SFR from national commercial bank (Wells Fargo) Internalized operating &
Slide 8: Who Runs & Oversees the Company?
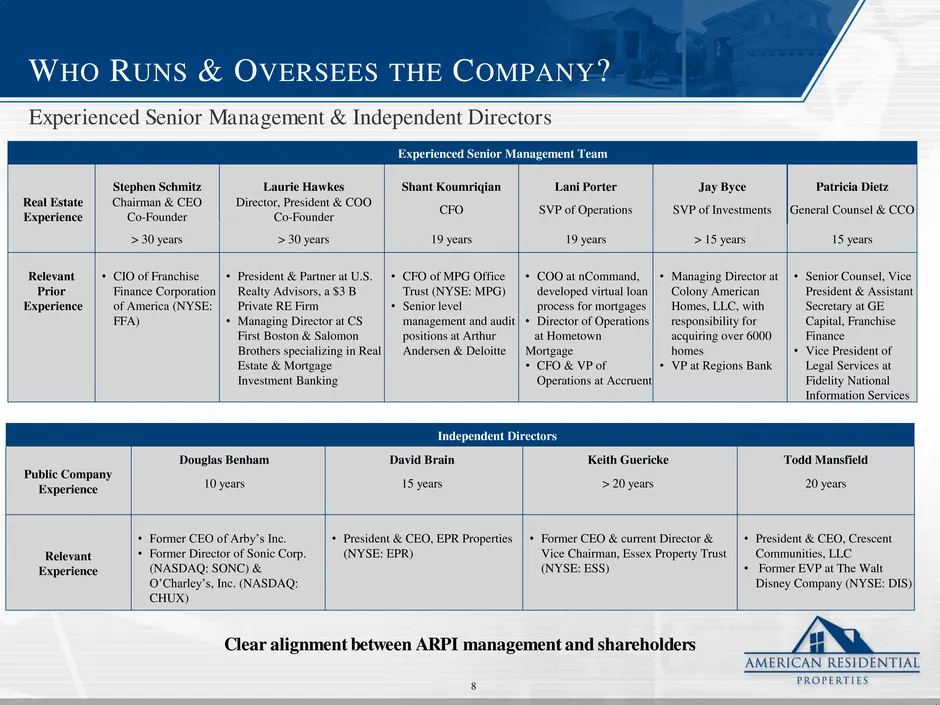
EPS\Management Presentation\American Residential Properties - 602505097 WHO RUNS & OVERSEES THE COMPANY? Experienced Senior Management & Independent Directors Experienced Senior Management Team Real Estate Experience Stephen Schmitz Laurie Hawkes Shant Koumriqian Lani Porter Jay Byce Patricia Dietz
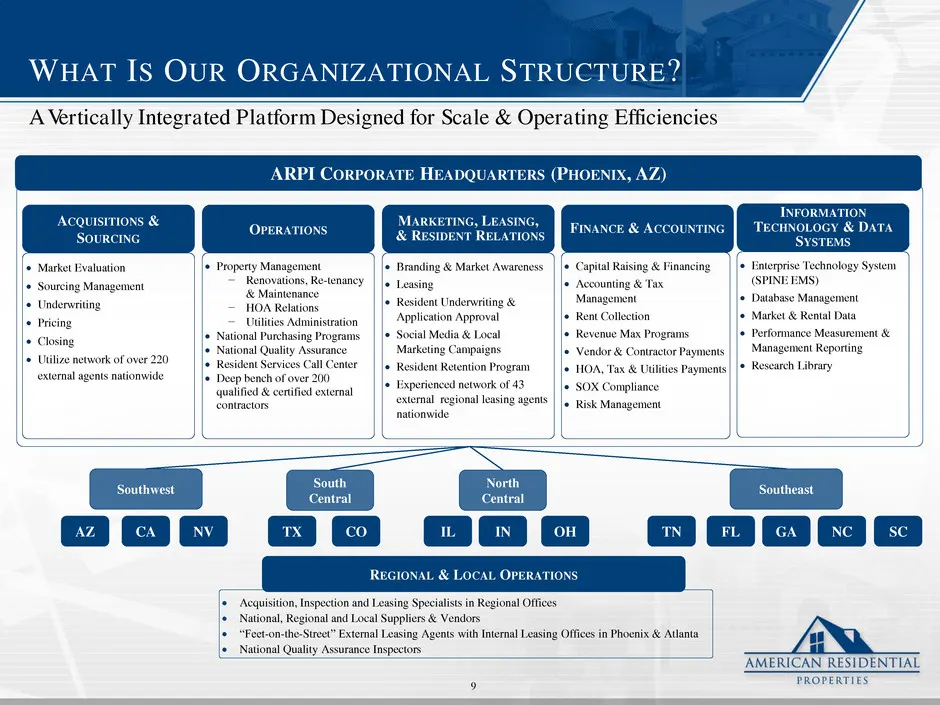
Slide 9: What Is Our Organizational Structure?
EPS\Management Presentation\American Residential Properties - 602505097 WHAT IS OUR ORGANIZATIONAL STRUCTURE? Market Evaluation Sourcing Management Underwriting Pricing Closing Utilize network of over 220 external agents nationwide ACQUISITIONS & SOURCING Property Management − Renovati
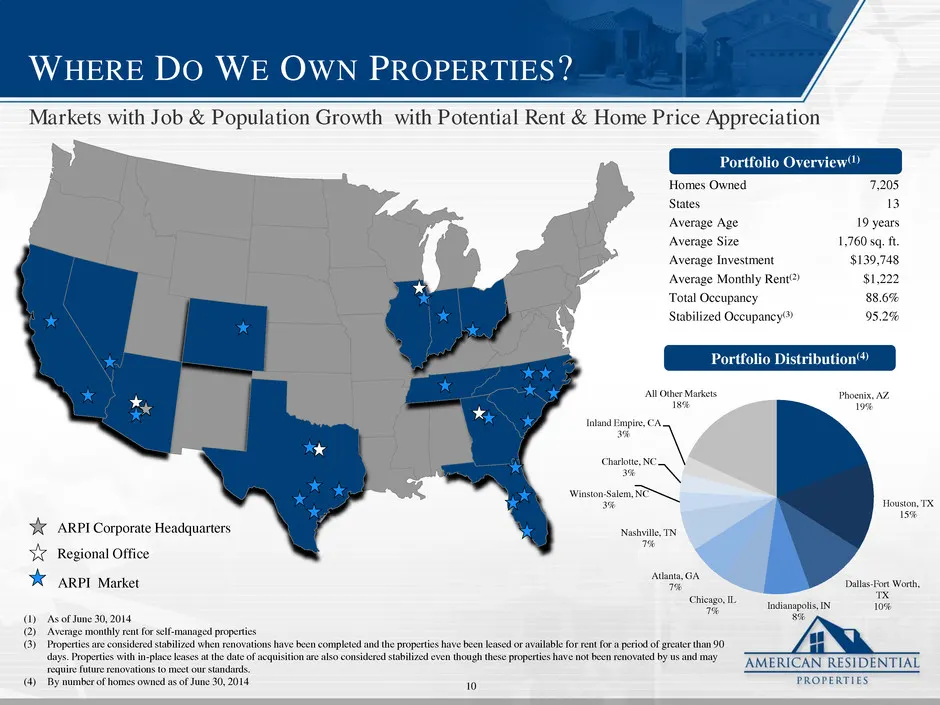
Slide 10: Where Do We Own Properties?
EPS\Management Presentation\American Residential Properties - 602505097 WHERE DO WE OWN PROPERTIES? Homes Owned 7,205 States 13 Average Age 19 years Average Size 1,760 sq. ft. Average Investment $139,748 Average Monthly Rent(2) $1,222 Total Occupancy 88.6% Stabilized Occupancy(3) 95.2% Markets with
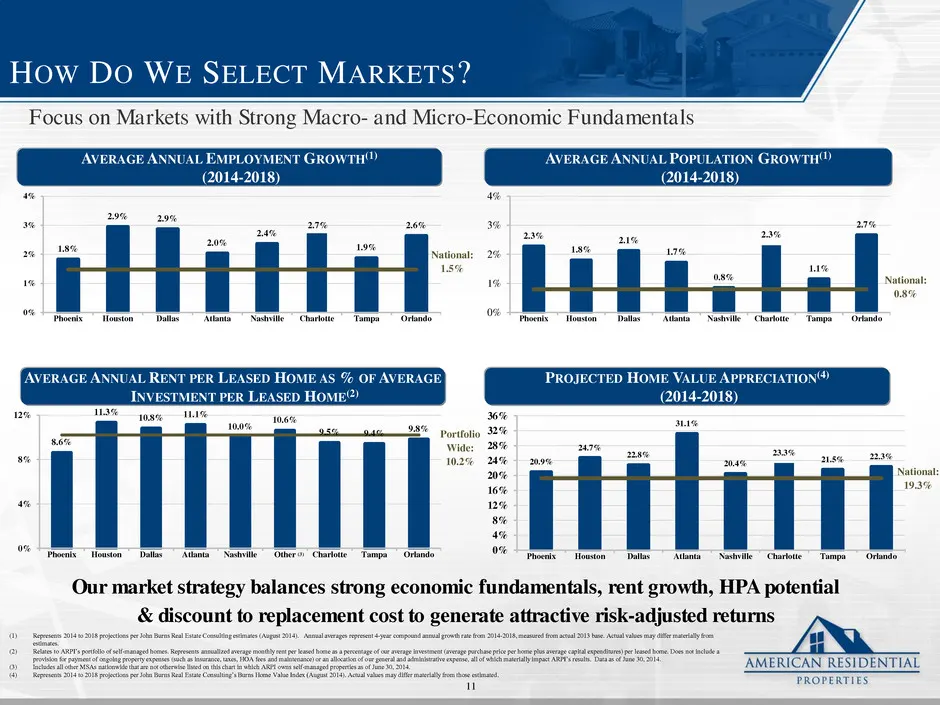
Slide 11: How Do We Select Markets?
EPS\Management Presentation\American Residential Properties - 602505097 HOW DO WE SELECT MARKETS? Our market strategy balances strong economic fundamentals, rent growth, HPA potential & discount to replacement cost to generate attractive risk-adjusted returns AVERAGE ANNUAL EMPLOYMENT GROWTH(1) (201
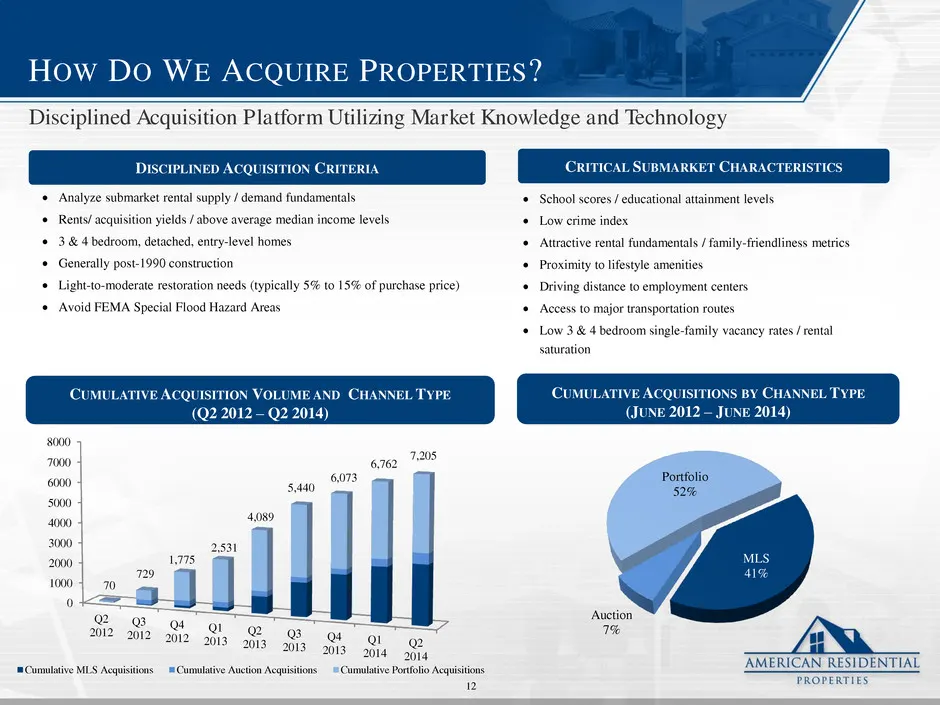
Slide 12: How Do We Acquire Properties?
EPS\Management Presentation\American Residential Properties - 602505097 HOW DO WE ACQUIRE PROPERTIES? Disciplined Acquisition Platform Utilizing Market Knowledge and Technology School scores / educational attainment levels Low crime index Attractive rental fundamentals / family-friendliness me
Slide 13: How Do We Restore & Maintain Properties?
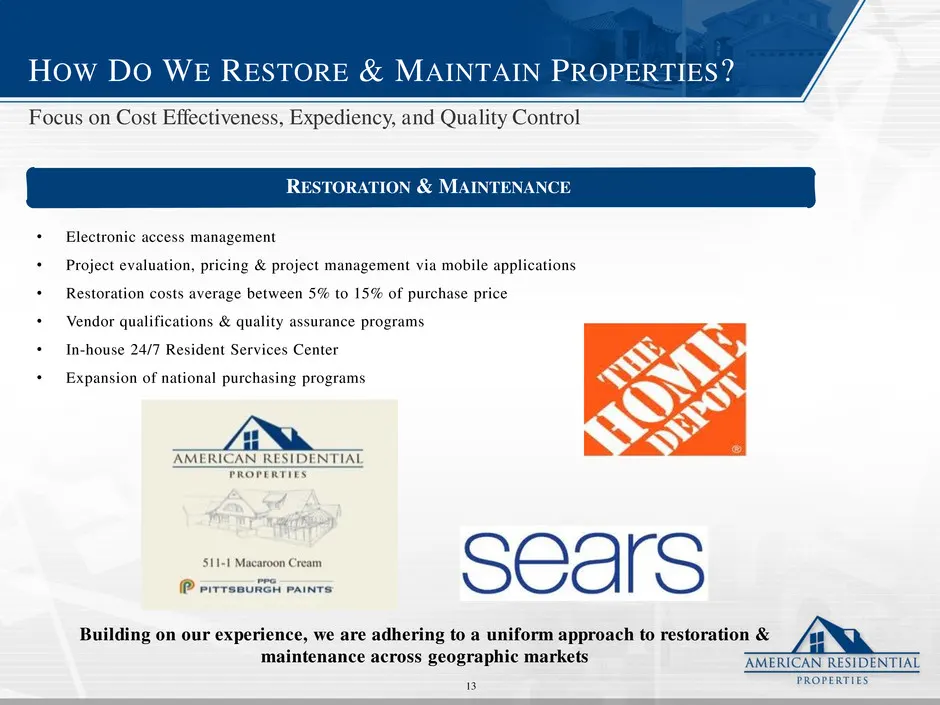
EPS\Management Presentation\American Residential Properties - 602505097 HOW DO WE RESTORE & MAINTAIN PROPERTIES? • Electronic access management • Project evaluation, pricing & project management via mobile applications • Restoration costs average between 5% to 15% of purchase price • Vendor qualific
Slide 14: What Is Our Marketing & Branding Strategy?
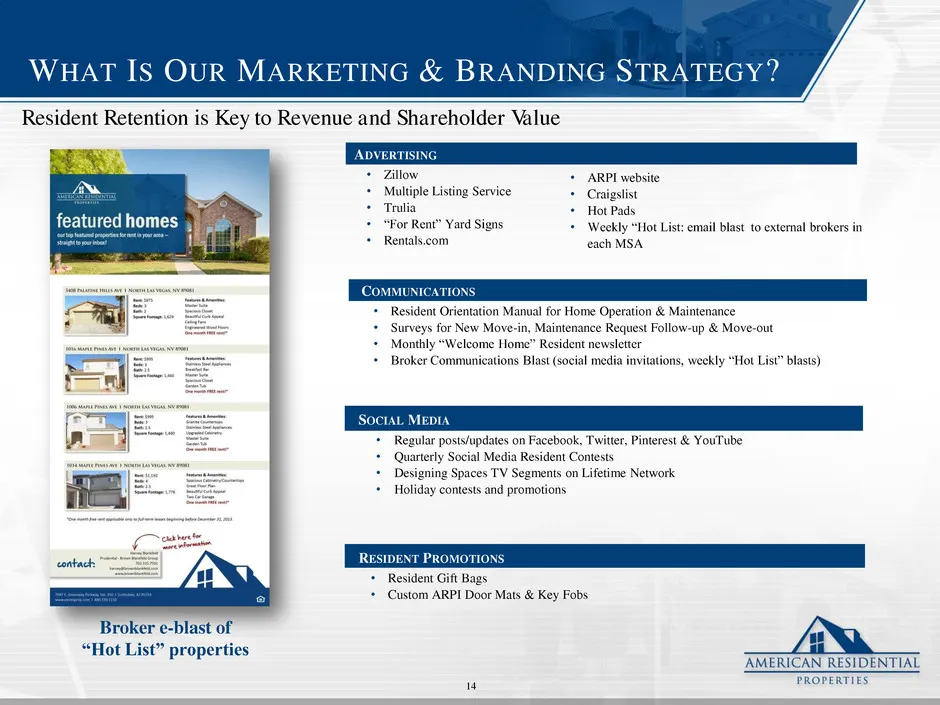
EPS\Management Presentation\American Residential Properties - 602505097 COMMUNICATIONS • Resident Orientation Manual for Home Operation & Maintenance • Surveys for New Move-in, Maintenance Request Follow-up & Move-out • Monthly “Welcome Home” Resident newsletter • Broker Communications Blast (social
Slide 15: Sample Profile of ARPI Residents
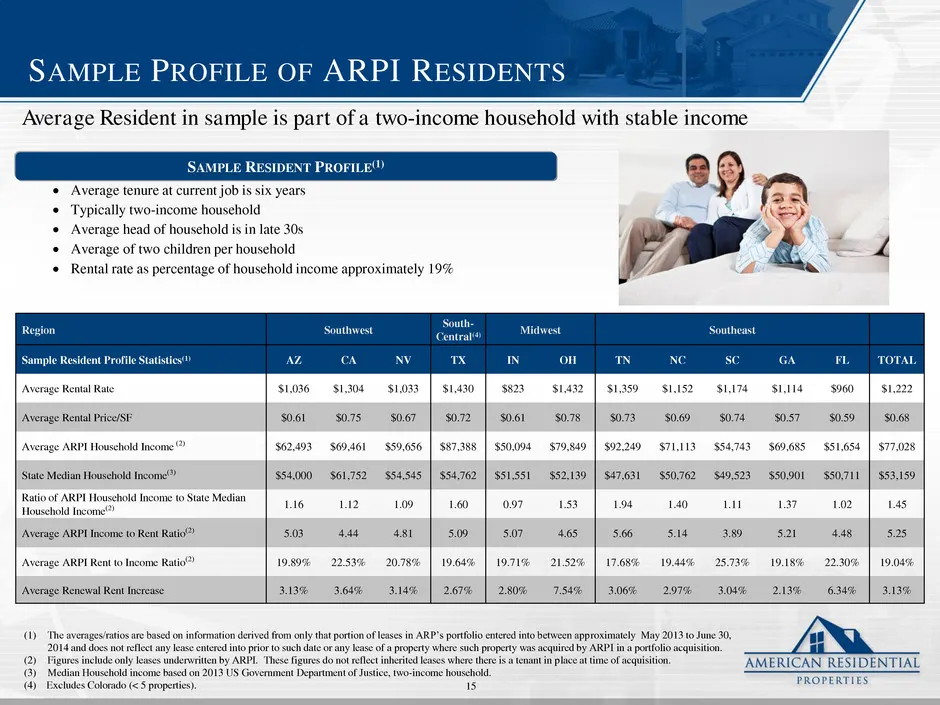
EPS\Management Presentation\American Residential Properties - 602505097 Average tenure at current job is six years Typically two-income household Average head of household is in late 30s Average of two children per household Rental rate as percentage of household income approximately 19% S
Slide 16: What Is Our Capital Structure?
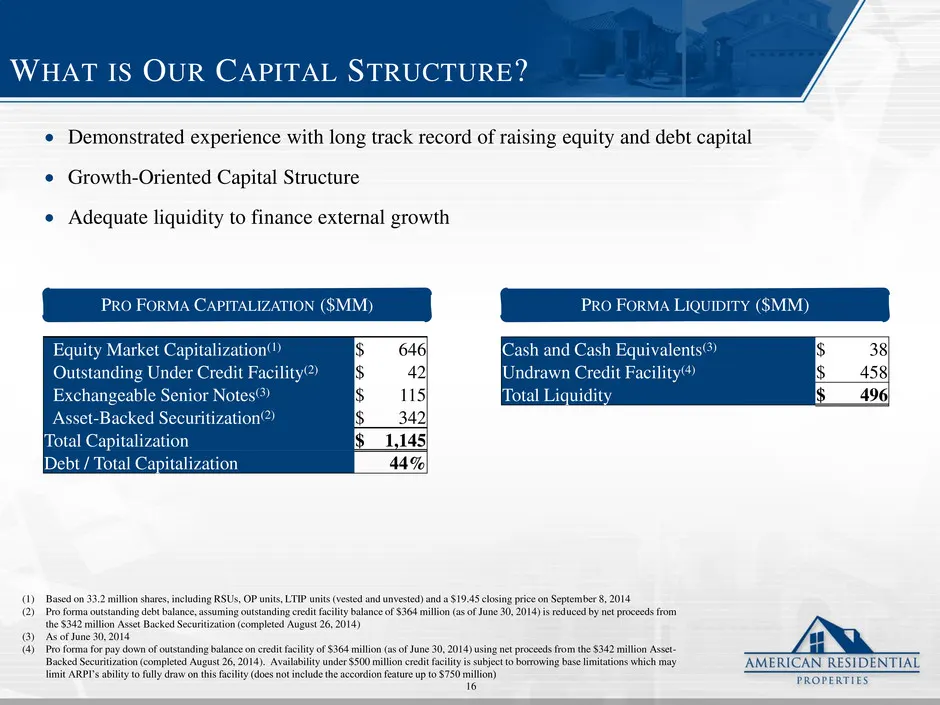
EPS\Management Presentation\American Residential Properties - 602505097 WHAT IS OUR CAPITAL STRUCTURE? Demonstrated experience with long track record of raising equity and debt capital Growth-Oriented Capital Structure Adequate liquidity to finance external growth (1) Based on 33.2 million sha
Slide 17: The Opportunity & Future Growth
EPS\Management Presentation\American Residential Properties - 602505097 THE OPPORTUNITY & FUTURE GROWTH 17
Slide 18: What Are the Opportunities for Future Growth?
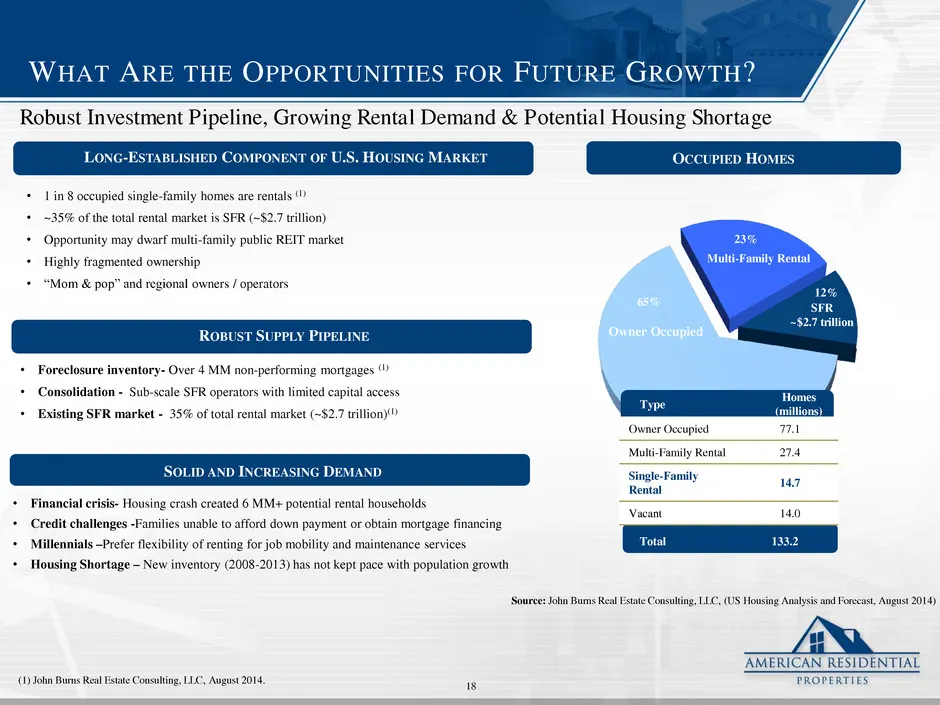
EPS\Management Presentation\American Residential Properties - 602505097 WHAT ARE THE OPPORTUNITIES FOR FUTURE GROWTH? Robust Investment Pipeline, Growing Rental Demand & Potential Housing Shortage • Foreclosure inventory- Over 4 MM non-performing mortgages (1) • Consolidation - Sub-scale SFR operato
Slide 19: What Are the Current Levels of Home Prices and Rental Vacancies?
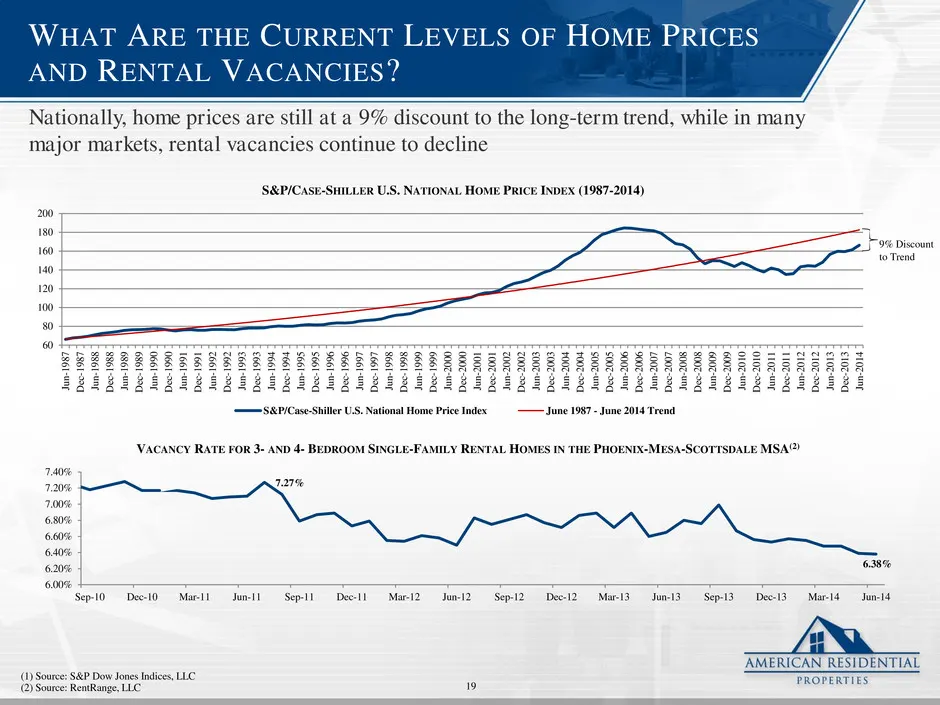
EPS\Management Presentation\American Residential Properties - 602505097 WHAT ARE THE CURRENT LEVELS OF HOME PRICES AND RENTAL VACANCIES? (1) Source: S&P Dow Jones Indices, LLC (2) Source: RentRange, LLC Nationally, home prices are still at a 9% discount to the long-term trend, while in many major ma
Slide 20: Sample Properties Pictured
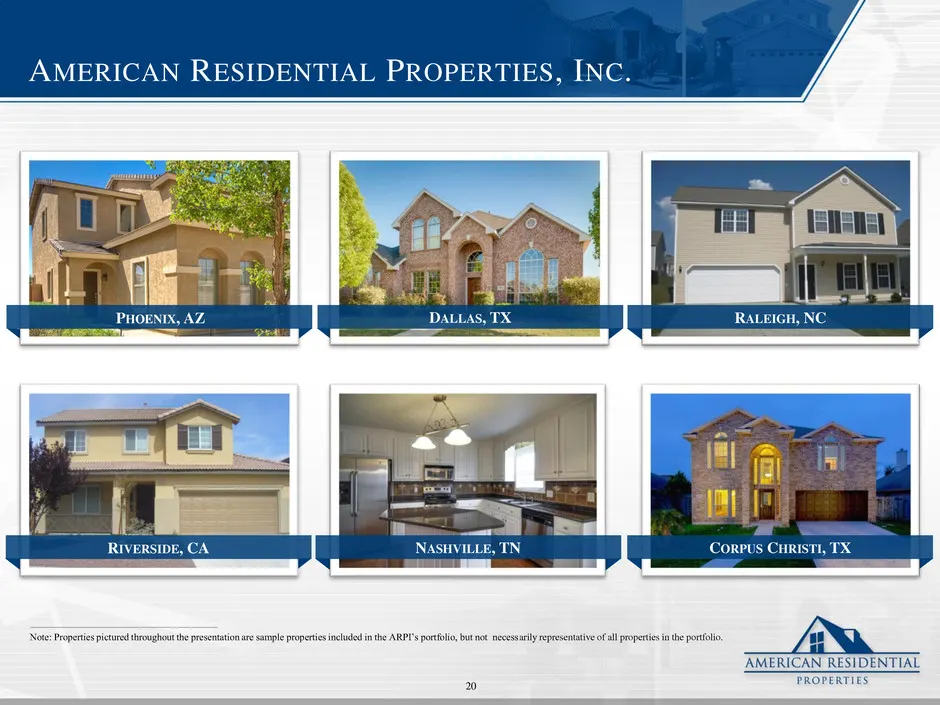
EPS\Management Presentation\American Residential Properties - 602505097 AMERICAN RESIDENTIAL PROPERTIES, INC. ________________________________________________ Note: Properties pictured throughout the presentation are sample properties included in the ARPI’s portfolio, but not necessarily representat
Slide 21: What Differentiates Us?
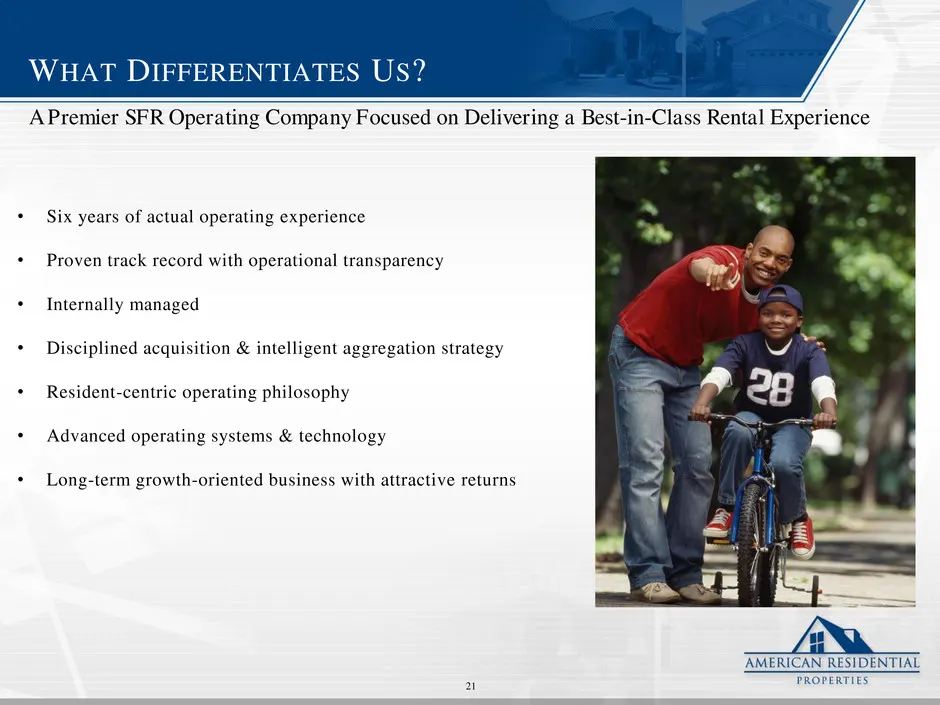
EPS\Management Presentation\American Residential Properties - 602505097 WHAT DIFFERENTIATES US? • Six years of actual operating experience • Proven track record with operational transparency • Internally managed • Disciplined acquisition & intelligent aggregation strategy • Resident-centric operatin
Slide 22: Appendix
EPS\Management Presentation\American Residential Properties - 602505097 APPENDIX 22
Slide 23: How Did We Perform in Second Quarter 2014?
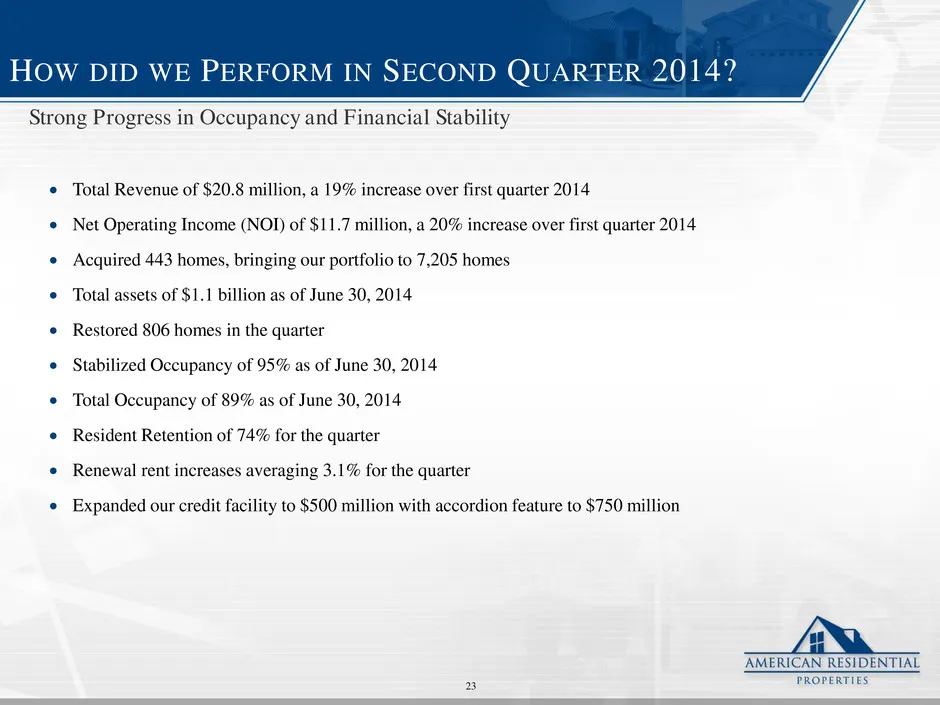
EPS\Management Presentation\American Residential Properties - 602505097 HOW DID WE PERFORM IN SECOND QUARTER 2014? Total Revenue of $20.8 million, a 19% increase over first quarter 2014 Net Operating Income (NOI) of $11.7 million, a 20% increase over first quarter 2014 Acquired 443 homes, brin
Slide 24: Quarterly Operating Overview: Financial Results
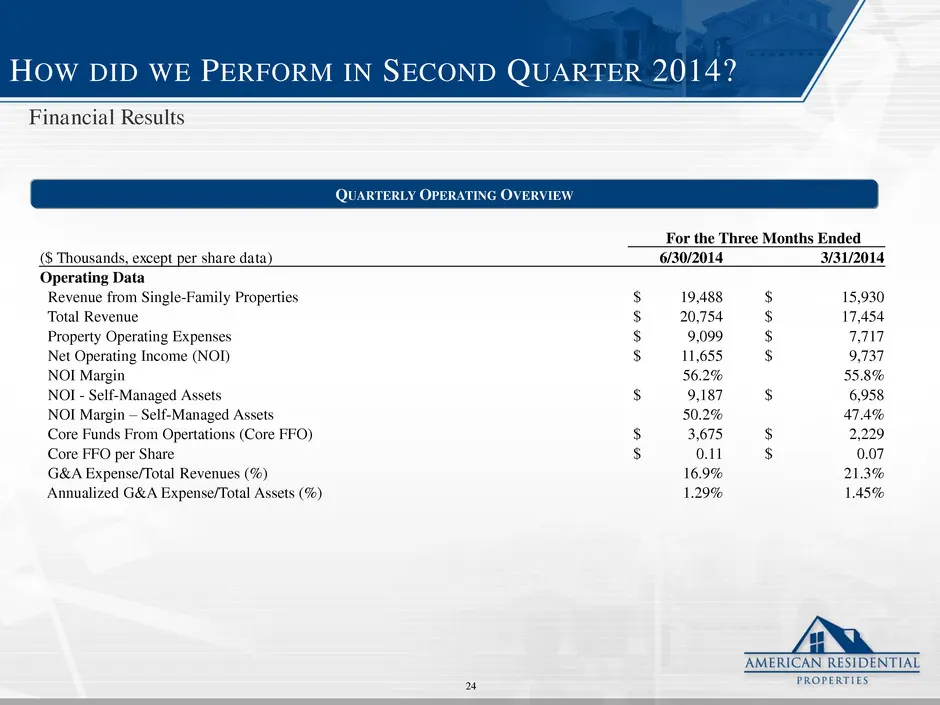
EPS\Management Presentation\American Residential Properties - 602505097 HOW DID WE PERFORM IN SECOND QUARTER 2014? 24 For the Three Months Ended ($ Thousands, except per share data) 6/30/2014 3/31/2014 Operating Data Revenue from Single-Family Properties $ 19,488 $ 15,930 Total Revenue $ 20,754 $ 17
Slide 25: Strategically Acquired Portfolio
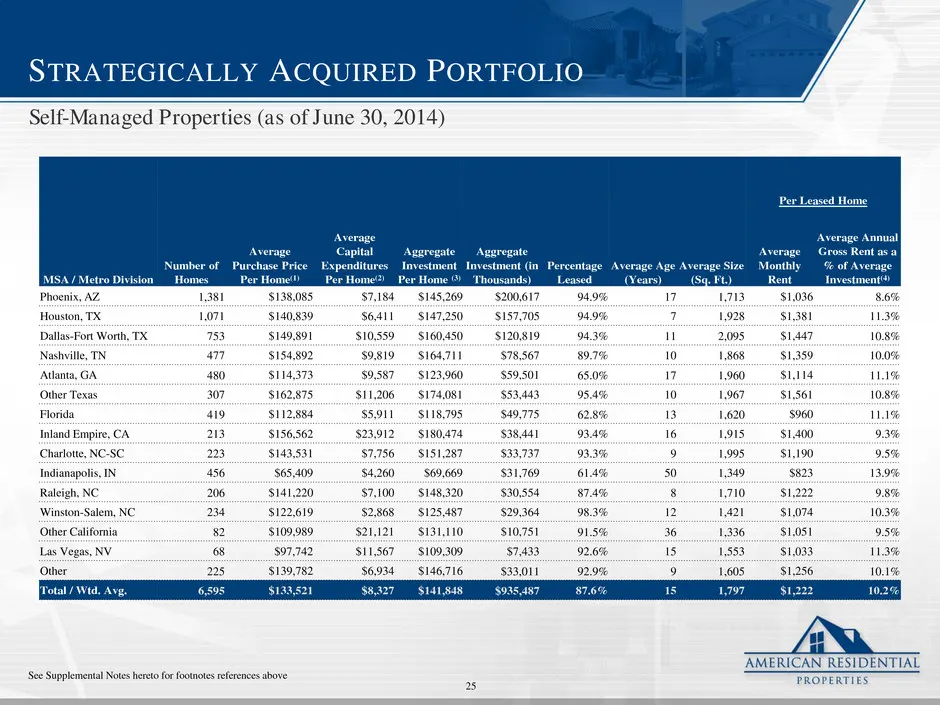
EPS\Management Presentation\American Residential Properties - 602505097 STRATEGICALLY ACQUIRED PORTFOLIO See Supplemental Notes hereto for footnotes references above 25 Per Leased Home MSA / Metro Division Number of Homes Average Purchase Price Per Home(1) Average Capital Expenditures Per Home(2) Ag
Slide 26: Strategically Acquired Portfolio
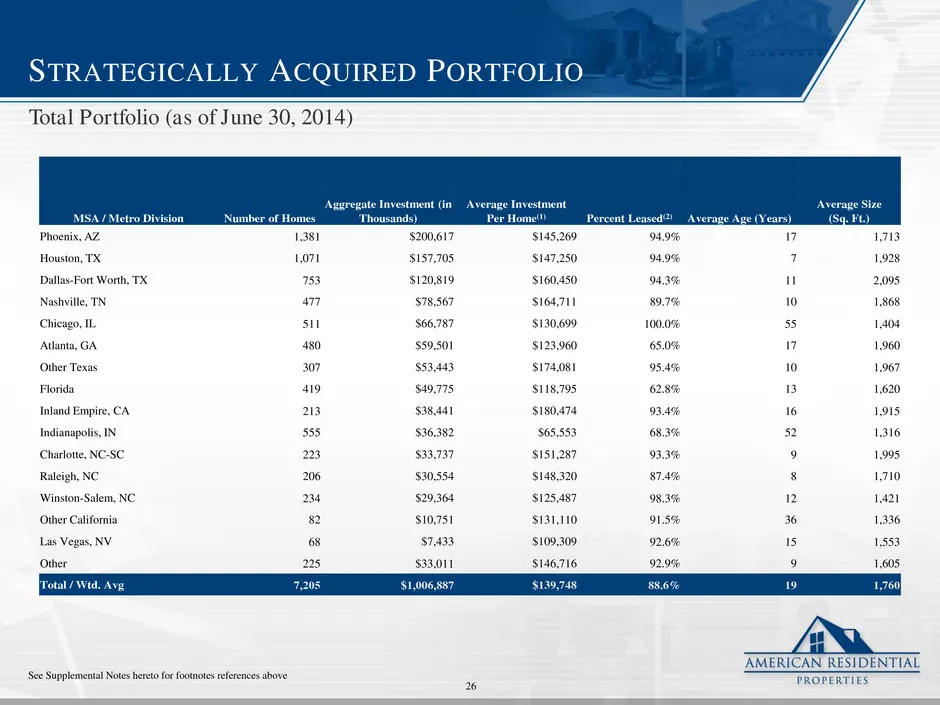
EPS\Management Presentation\American Residential Properties - 602505097 STRATEGICALLY ACQUIRED PORTFOLIO See Supplemental Notes hereto for footnotes references above 26 MSA / Metro Division Number of Homes Aggregate Investment (in Thousands) Average Investment Per Home(1) Percent Leased(2) Average A
Slide 27: Portfolio Profile by Geographic Distribution
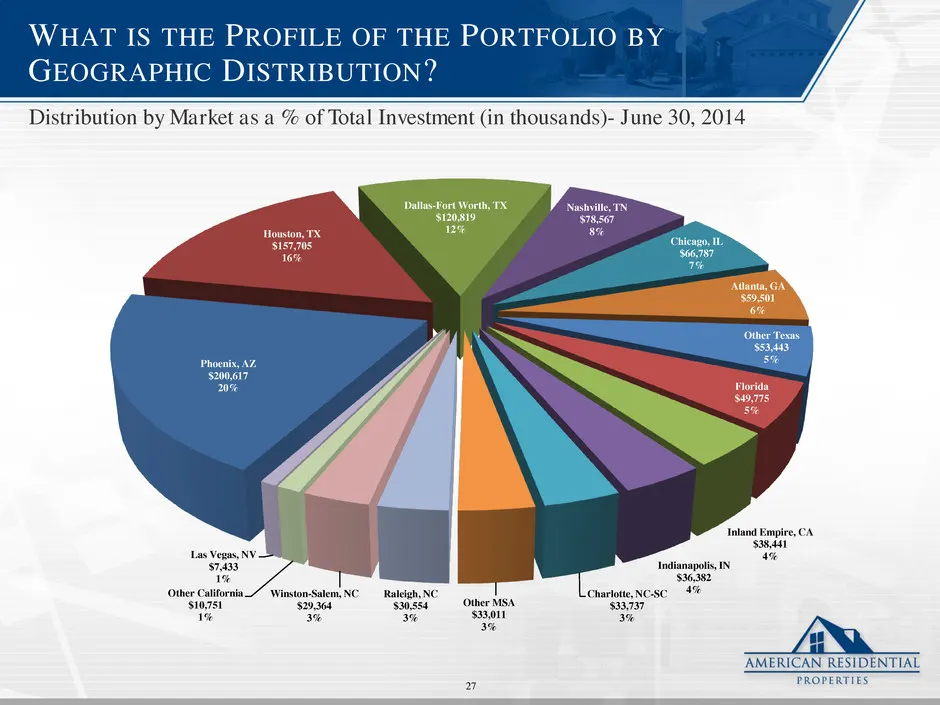
EPS\Management Presentation\American Residential Properties - 602505097 WHAT IS THE PROFILE OF THE PORTFOLIO BY GEOGRAPHIC DISTRIBUTION? 27 Phoenix, AZ $200,617 20% Houston, TX $157,705 16% Dallas-Fort Worth, TX $120,819 12% Nashville, TN $78,567 8% Chicago, IL $66,787 7% Atlanta, GA $59,501 6% Othe
Slide 28: How Much Have Home Prices Appreciated?
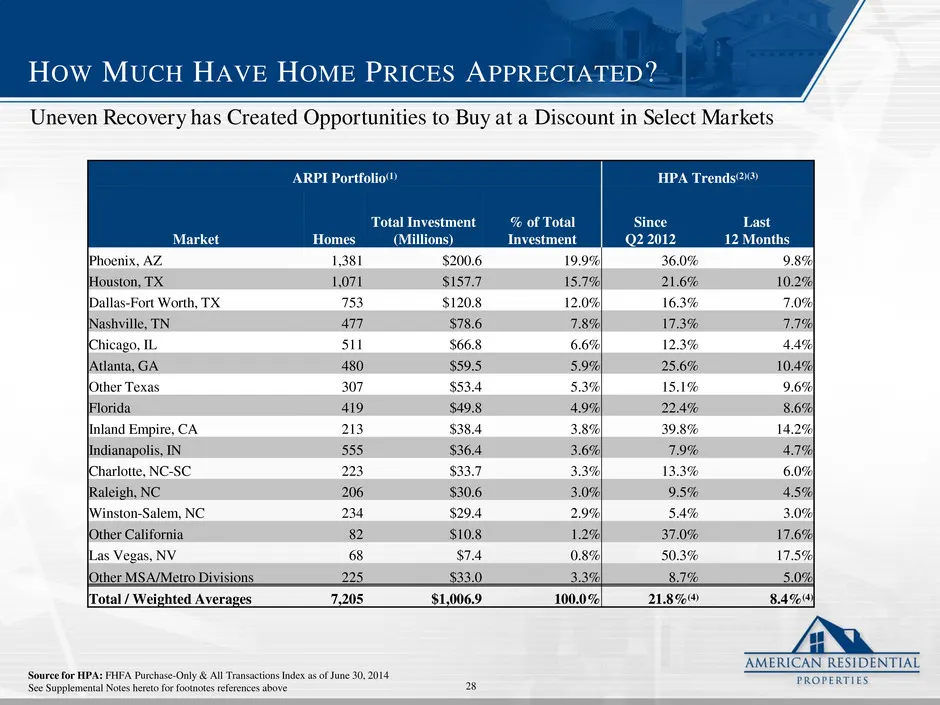
EPS\Management Presentation\American Residential Properties - 602505097 HOW MUCH HAVE HOME PRICES APPRECIATED? Uneven Recovery has Created Opportunities to Buy at a Discount in Select Markets 28 ARPI Portfolio(1) HPA Trends(2)(3) Market Homes Total Investment (Millions) % of Total Investment Since Q
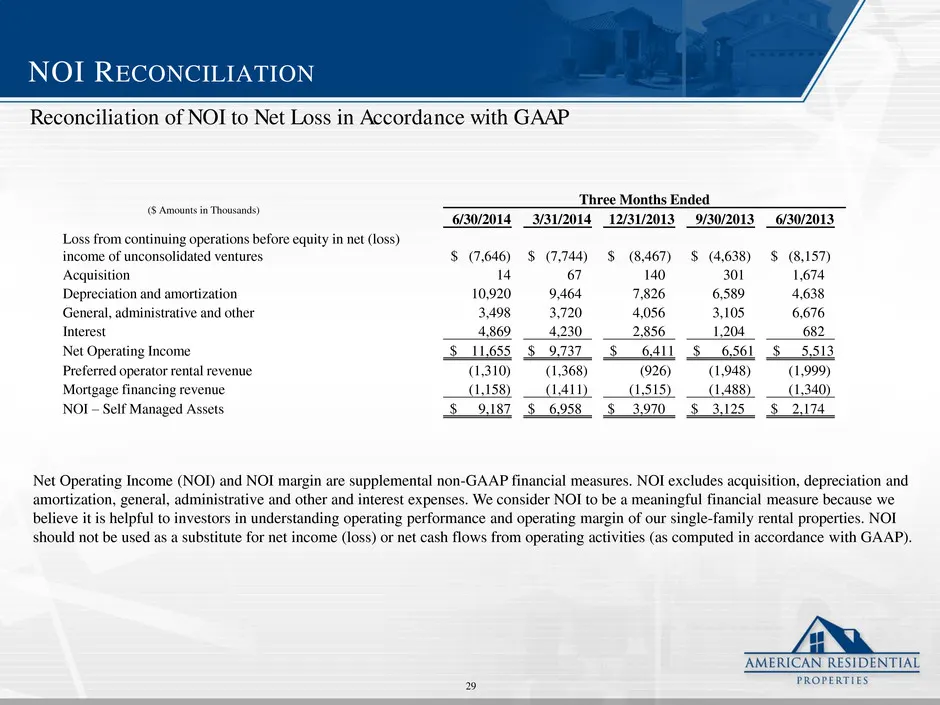
Slide 29: NOI Reconciliation
EPS\Management Presentation\American Residential Properties - 602505097 NOI RECONCILIATION 29 Three Months Ended 6/30/2014 3/31/2014 12/31/2013 9/30/2013 6/30/2013 Loss from continuing operations before equity in net (loss) income of unconsolidated ventures $ (7,646) $ (7,744) $ (8,467) $ (4,638) $
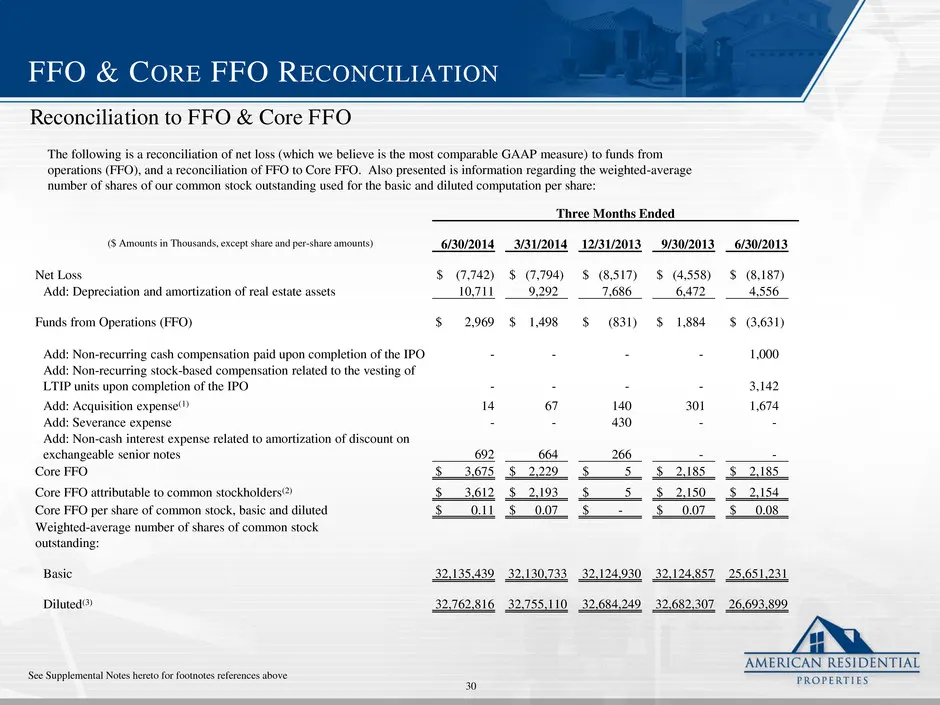
Slide 30: FFO & Core FFO Reconciliation
EPS\Management Presentation\American Residential Properties - 602505097 FFO & CORE FFO RECONCILIATION 30 Three Months Ended 6/30/2014 3/31/2014 12/31/2013 9/30/2013 6/30/2013 Net Loss $ (7,742) $ (7,794) $ (8,517) $ (4,558) $ (8,187) Add: Depreciation and amortization of real estate assets 10,711 9,
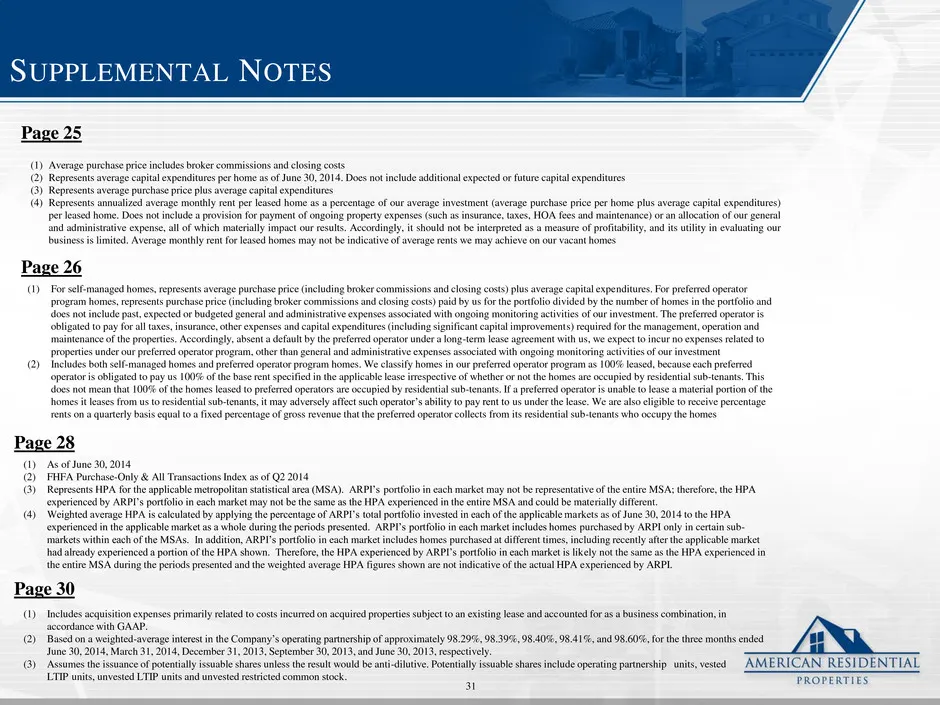
Slide 31: Supplemental Notes
EPS\Management Presentation\American Residential Properties - 602505097 SUPPLEMENTAL NOTES (1) Average purchase price includes broker commissions and closing costs (2) Represents average capital expenditures per home as of June 30, 2014. Does not include additional expected or future capital expendi
Source: SEC EDGAR · 8-K filed Sep 9, 2014
More decks from American Residential Properties Inc
 Merger or Acquisition (December 2015)15 slides · Dec 4, 2015
 Investor Presentation (November 2015)37 slides · Nov 17, 2015
 Investor Presentation (September 2015)36 slides · Sep 10, 2015
 NAREIT Investor Forum June 201537 slides · Jun 8, 2015
 Investor Presentation (May 2015)35 slides · May 13, 2015
 NAREIT Conference November 201434 slides · Nov 5, 2014