Allegiance Bancshares — Q1 2019 Earnings Presentation
14 slides from Allegiance Bancshares's earnings presentation, Apr 26, 2019

Slide 1: First Quarter 2019 Earnings Presentation
First Quarter 2019 Earnings Presentation
Slide 2: Safe Harbor Statement
Safe Harbor Statement “Safe Harbor” Statement under the Private Securities Litigation Reform Act of 1995: This presentation may contain forward-looking statements within the meaning of the securities laws that are based on various facts and derived utilizing important assumptions, present expectatio
Slide 3: Company Overview
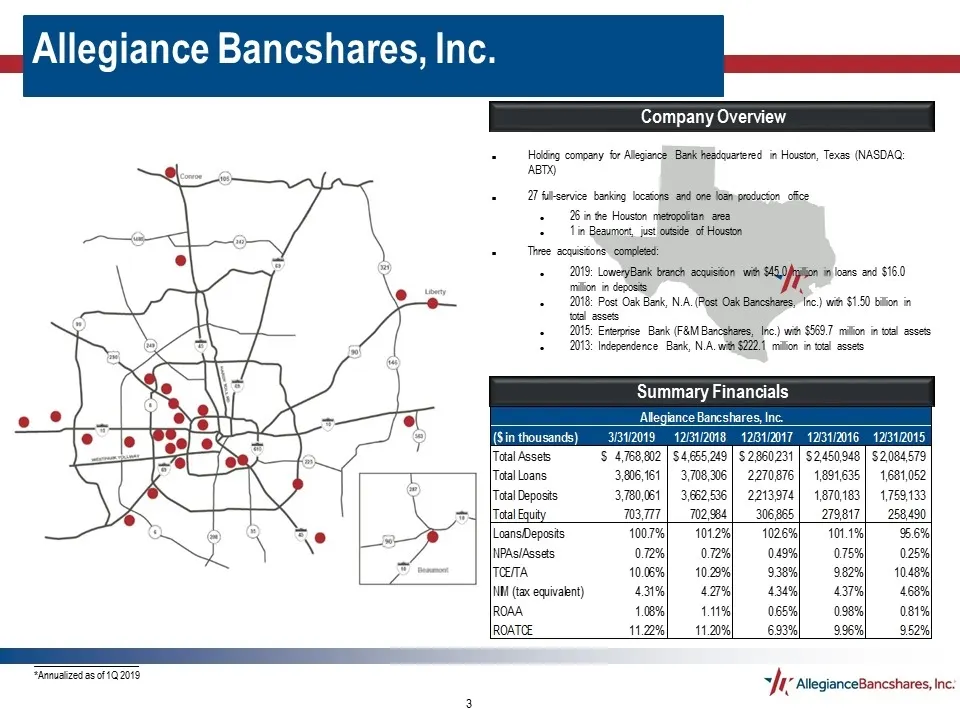
Holding company for Allegiance Bank headquartered in Houston, Texas (NASDAQ: ABTX) 27 full-service banking locations and one loan production office 26 in the Houston metropolitan area 1 in Beaumont, just outside of Houston Three acquisitions completed: 2019: LoweryBank branch acquisition with $45.0
Slide 4: Our Super-community Banking Strategy
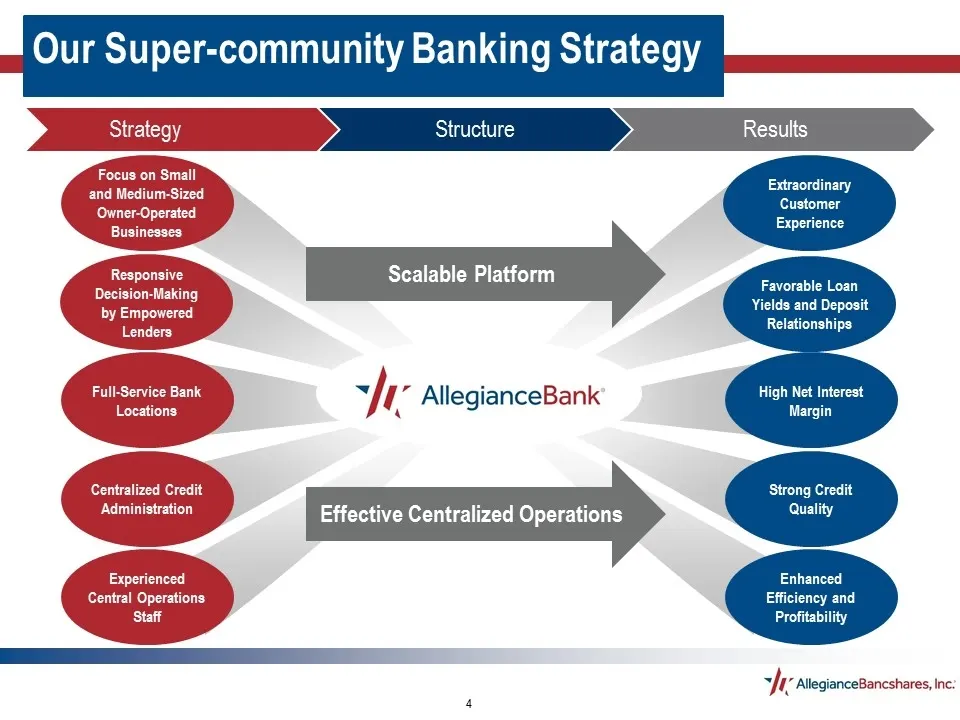
Our Super-community Banking Strategy High Net Interest Margin Strong Credit Quality Centralized Credit Administration Focus on Small and Medium-Sized Owner-Operated Businesses Full-Service Bank Locations Favorable Loan Yields and Deposit Relationships Effective Centralized Operations Scalable Platfo
Slide 5: Houston MSA Deposit Market Share
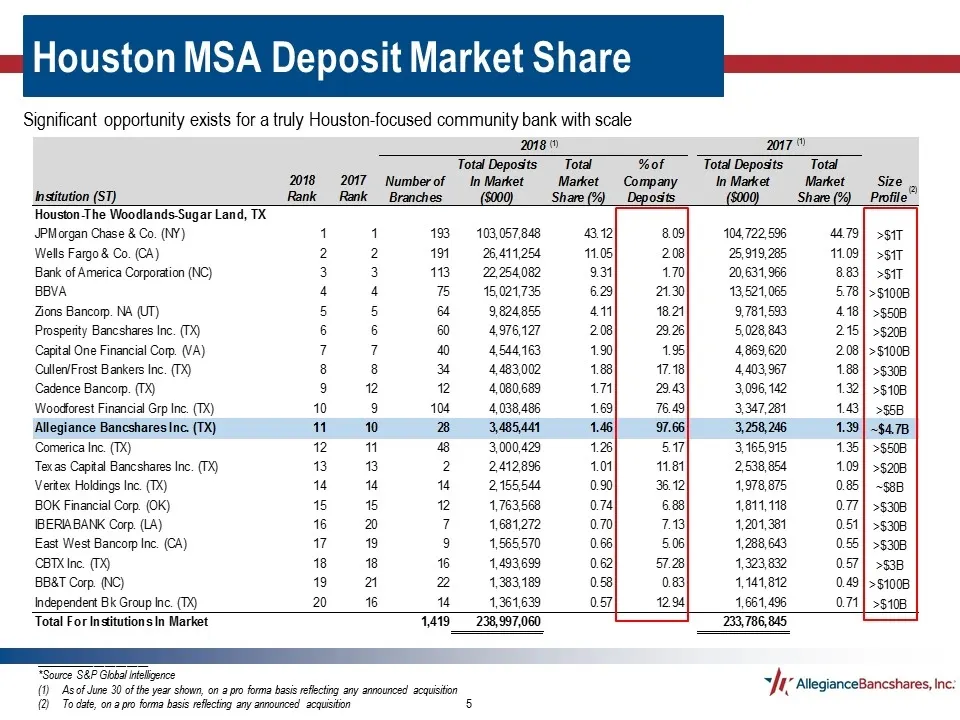
Houston MSA Deposit Market Share Significant opportunity exists for a truly Houston-focused community bank with scale _____________________ *Source S&P Global Intelligence As of June 30 of the year shown, on a pro forma basis reflecting any announced acquisition To date, on a pro forma basis reflect
Slide 6: Highlights – First Quarter 2019
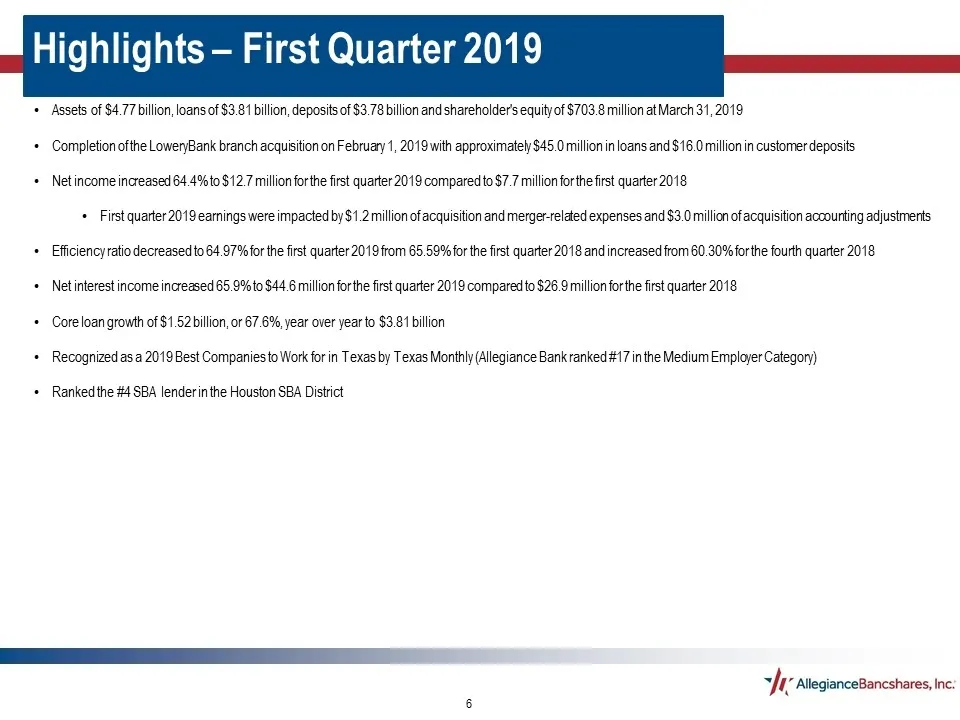
Highlights – First Quarter 2019 Assets of $4.77 billion, loans of $3.81 billion, deposits of $3.78 billion and shareholder's equity of $703.8 million at March 31, 2019 Completion of the LoweryBank branch acquisition on February 1, 2019 with approximately $45.0 million in loans and $16.0 million in c
Slide 7: Historical Growth
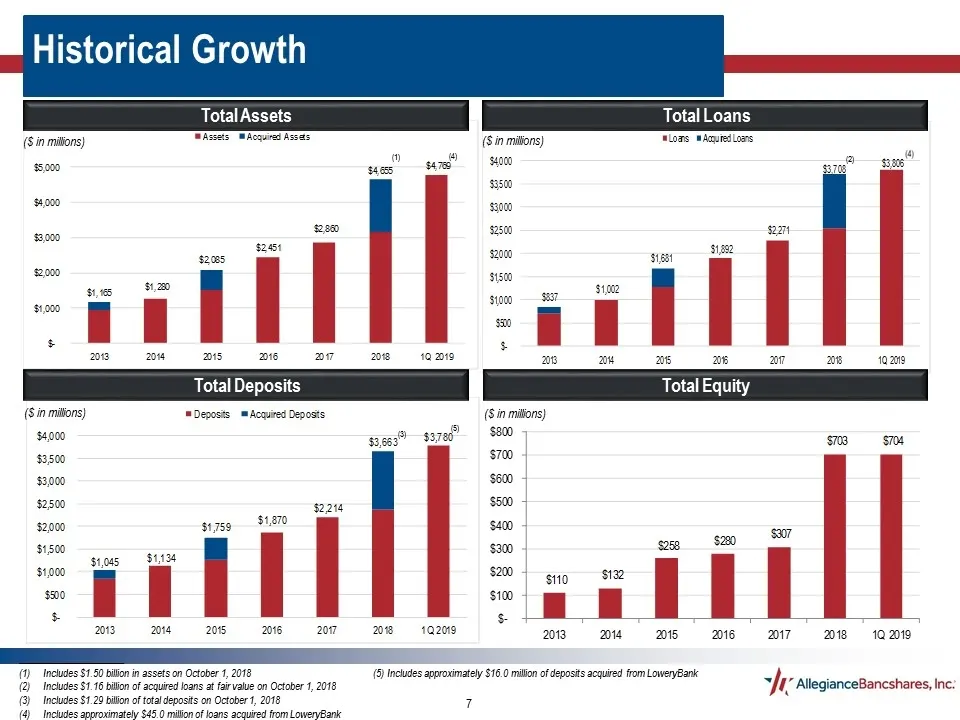
Total Loans Total Equity ($ in millions) _____________________ Includes $1.50 billion in assets on October 1, 2018 Includes $1.16 billion of acquired loans at fair value on October 1, 2018 Includes $1.29 billion of total deposits on October 1, 2018 Includes approximately $45.0 million of loans acqui
Slide 8: Net Income Growth
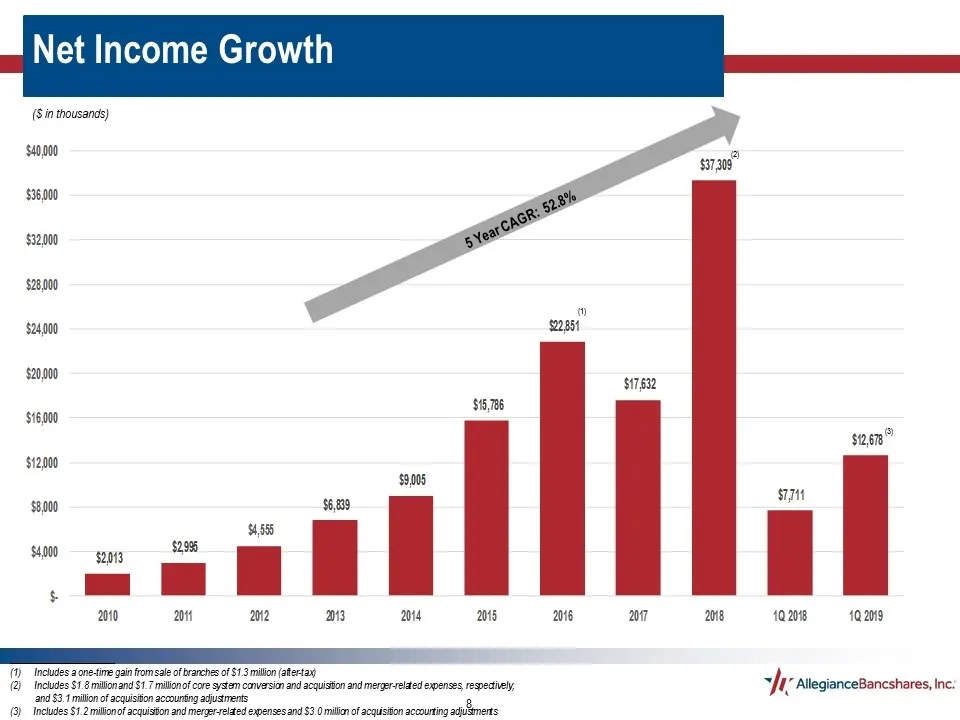
Net Income Growth * ($ in thousands) _____________________ Includes a one-time gain from sale of branches of $1.3 million (after-tax) Includes $1.8 million and $1.7 million of core system conversion and acquisition and merger-related expenses, respectively, and $3.1 million of acquisition accounting
Slide 9: Diluted EPS Growth
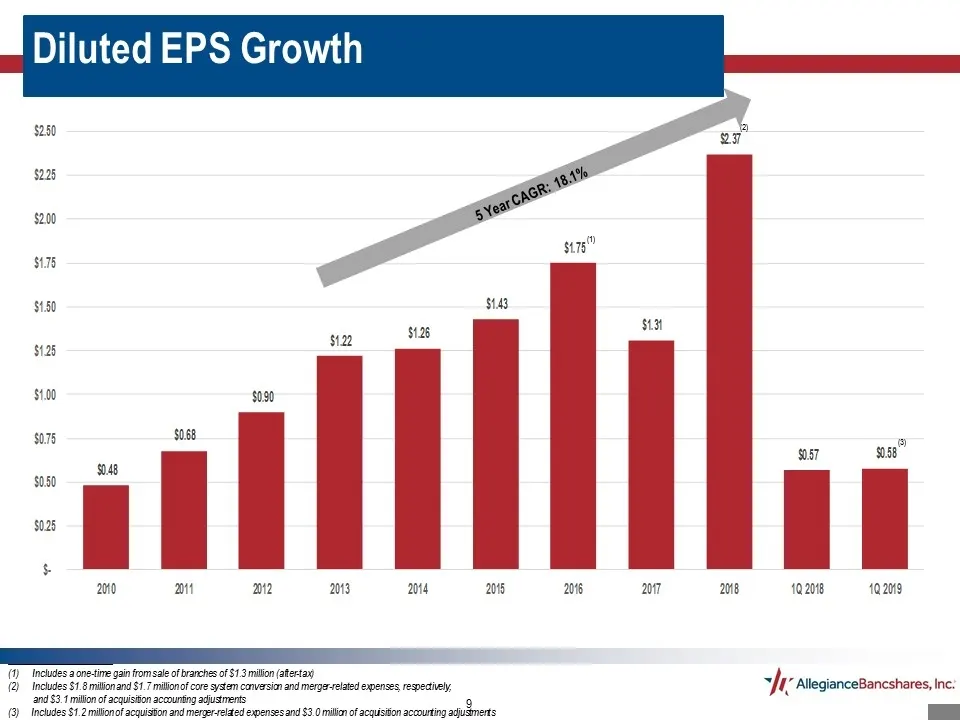
Diluted EPS Growth * _____________________ Includes a one-time gain from sale of branches of $1.3 million (after-tax) Includes $1.8 million and $1.7 million of core system conversion and merger-related expenses, respectively, and $3.1 million of acquisition accounting adjustments (3) Includes $1.2 m
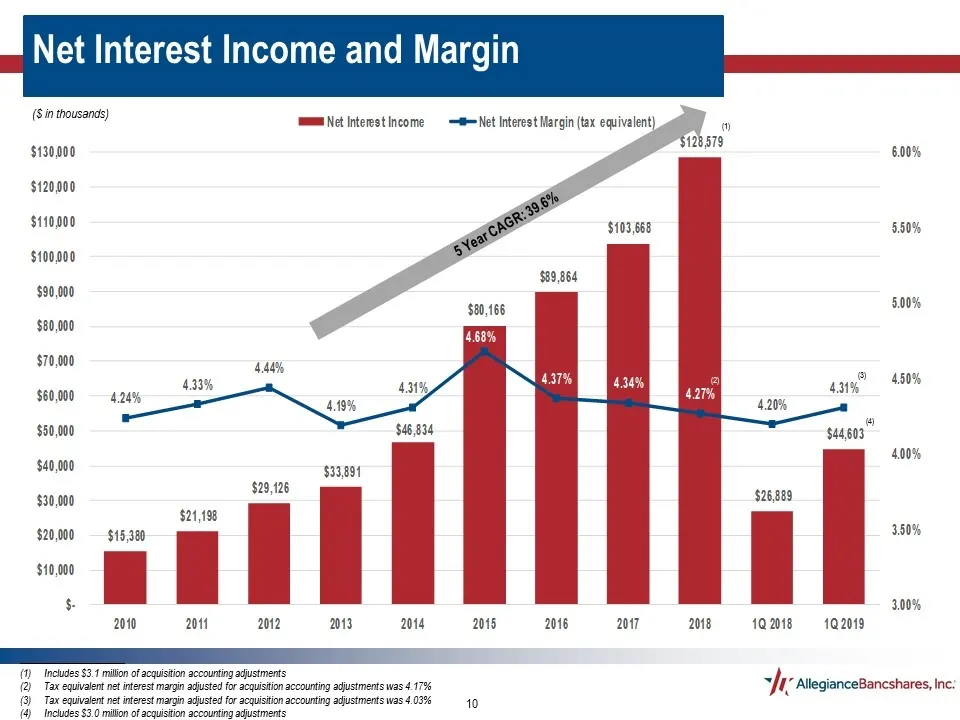
Slide 10: Net Interest Income and Margin
Net Interest Income and Margin ($ in thousands) _____________________ Includes $3.1 million of acquisition accounting adjustments Tax equivalent net interest margin adjusted for acquisition accounting adjustments was 4.17% Tax equivalent net interest margin adjusted for acquisition accounting adjust
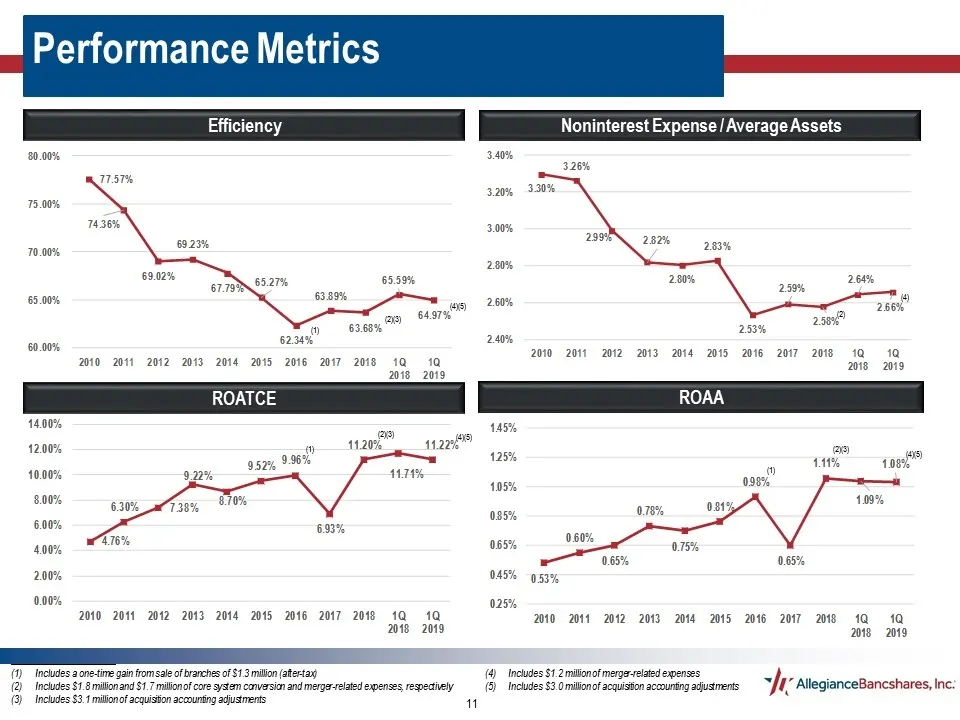
Slide 11: Performance Metrics
Performance Metrics ROAA Efficiency _____________________ Includes a one-time gain from sale of branches of $1.3 million (after-tax) Includes $1.8 million and $1.7 million of core system conversion and merger-related expenses, respectively Includes $3.1 million of acquisition accounting adjustments
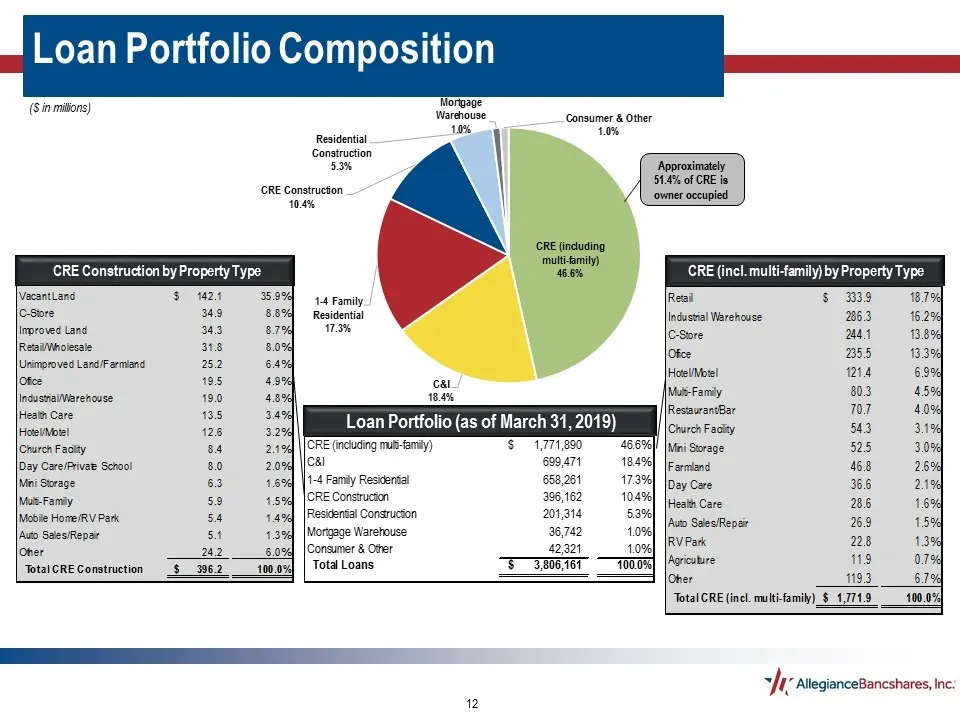
Slide 12: Loan Portfolio Composition
Loan Portfolio Composition Loan Portfolio (as of March 31, 2019) ($ in millions) CRE Construction by Property Type CRE (incl. multi-family) by Property Type Approximately 51.4% of CRE is owner occupied
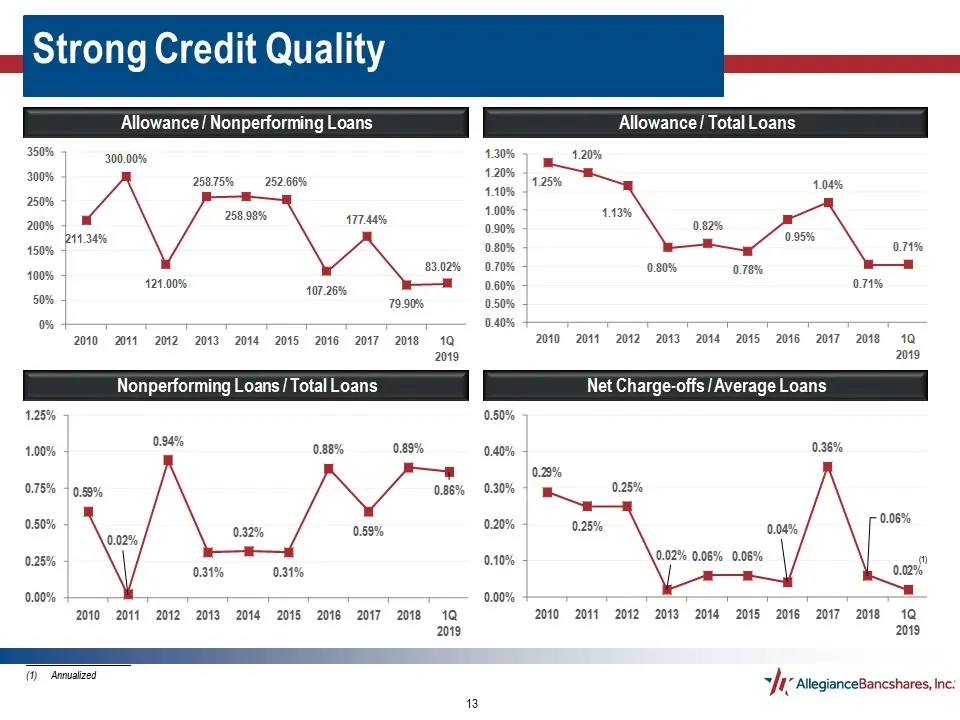
Slide 13: Strong Credit Quality
Strong Credit Quality Net Charge-offs / Average Loans Nonperforming Loans / Total Loans Allowance / Nonperforming Loans Allowance / Total Loans _____________________ (1) Annualized (1)
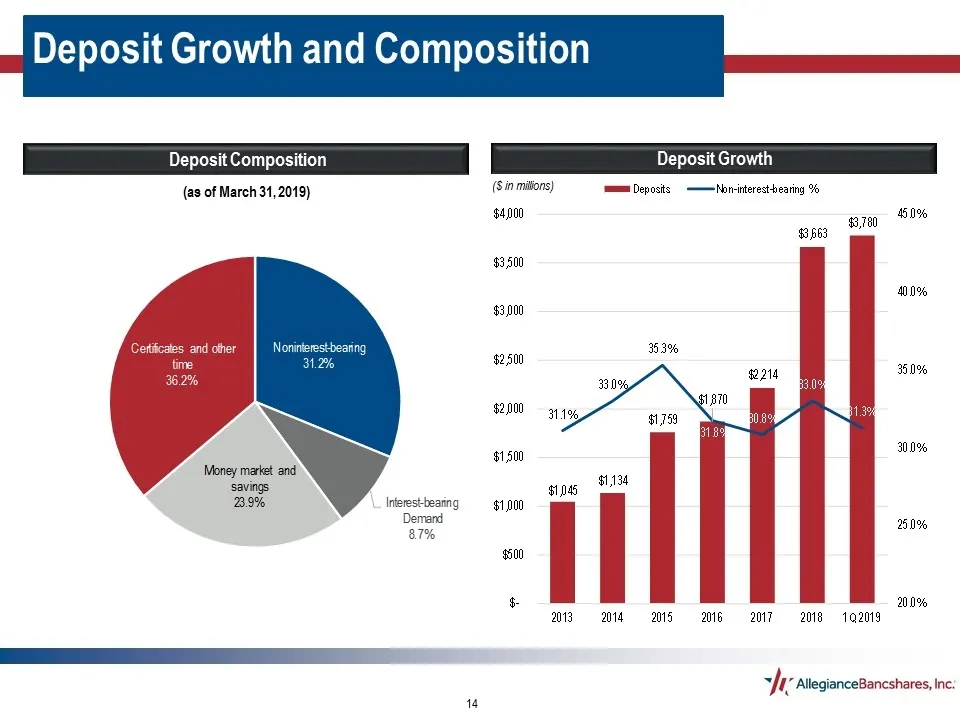
Slide 14: Deposit Growth and Composition
Deposit Growth and Composition Deposit Composition ($ in millions) Deposit Growth (as of March 31, 2019)
Source: SEC EDGAR · 8-K filed Apr 26, 2019
More decks from Allegiance Bancshares Inc
 Q2 2022 Earnings Presentation16 slides · Jul 29, 2022
 Q1 2022 Earnings Presentation19 slides · Apr 28, 2022
 FY2021 Earnings Presentation18 slides · Jan 28, 2022
 Q4 2021 Earnings Presentation19 slides · Jan 28, 2022
 Merger or Acquisition (November 2021)28 slides · Nov 8, 2021
 Q3 2021 Earnings Presentation17 slides · Oct 28, 2021