Archipelago Learning — Investor Presentation (May 2010)
30 slides from Archipelago Learning's investor presentation, May 18, 2010

Slide 1: May 2010 Investor/Analyst Presentation
May 2010 Investor/Analyst Presentation Exhibit 99.1
Slide 2: Safe Harbor Summary
1 Safe Harbor Summary These slides and accompanying oral presentation contain forward-looking statements. These statements relate to future events or to future financial performance and involve known and unknown risks, uncertainties, and other factors that may cause our actual results, levels of act
Slide 3: Overview
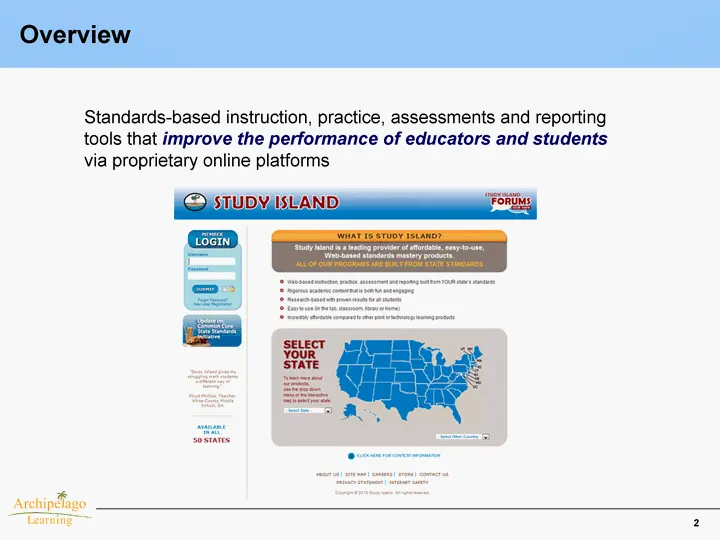
2 Overview Standards-based instruction, practice, assessments and reporting tools that improve the performance of educators and students via proprietary online platforms
Slide 4: Strong Brand/Loyal Customers
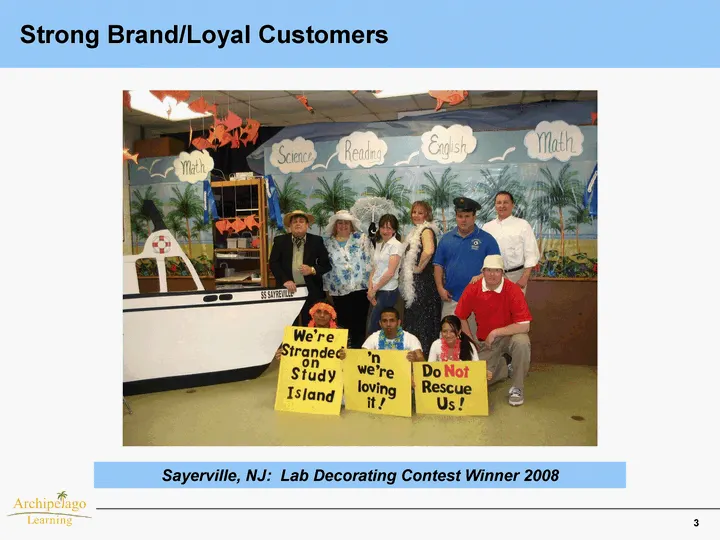
3 Sayerville, NJ: Lab Decorating Contest Winner 2008 Strong Brand/Loyal Customers
Slide 5: Highlights
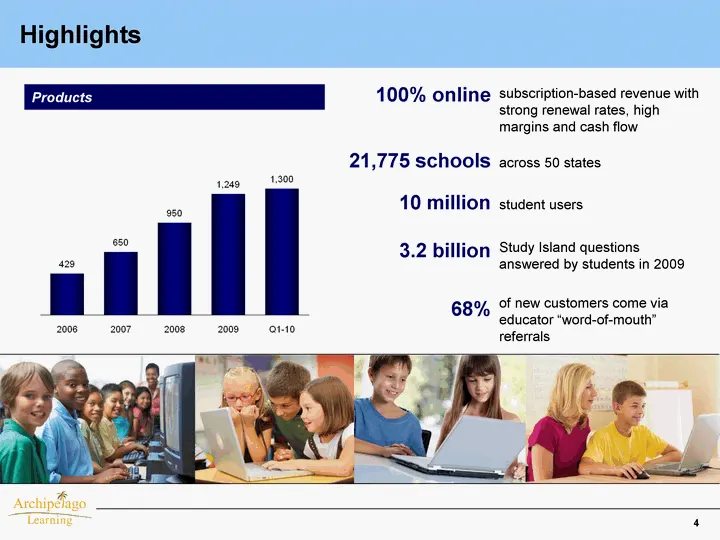
4 Highlights subscription-based revenue with strong renewal rates, high margins and cash flow 100% online across 50 states 21,775 schools student users 10 million Study Island questions answered by students in 2009 3.2 billion of new customers come via educator "word-of-mouth" referrals 68% Products
Slide 6: Compelling Growth Story
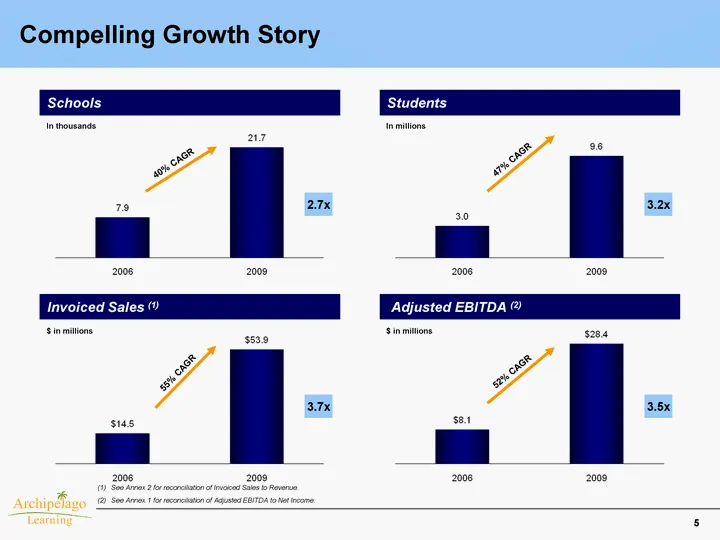
5 Compelling Growth Story $ in thousands Schools Students Invoiced Sales (1) Adjusted EBITDA (2) 40% CAGR 47% CAGR 2.7x 55% CAGR 52% CAGR In thousands 3.7x $ in millions 3.5x $ in millions In millions 3.2x See Annex 2 for reconciliation of Invoiced Sales to Revenue. See Annex 1 for reconciliation of
Slide 7: Focused on a Large and Growing Market
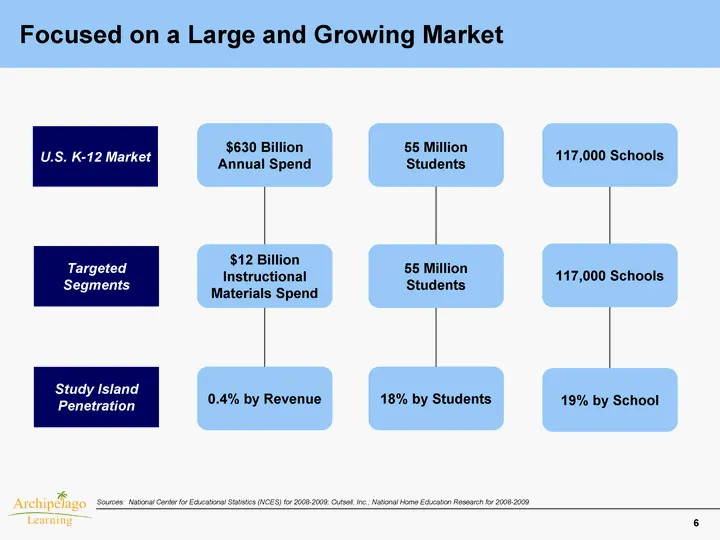
6 Focused on a Large and Growing Market U.S. K-12 Market Sources: National Center for Educational Statistics (NCES) for 2008-2009; Outsell, Inc.; National Home Education Research for 2008-2009. Targeted Segments Study Island Penetration $630 Billion Annual Spend 55 Million Students 117,000 Schools $
Slide 8: Favorable Industry Trends
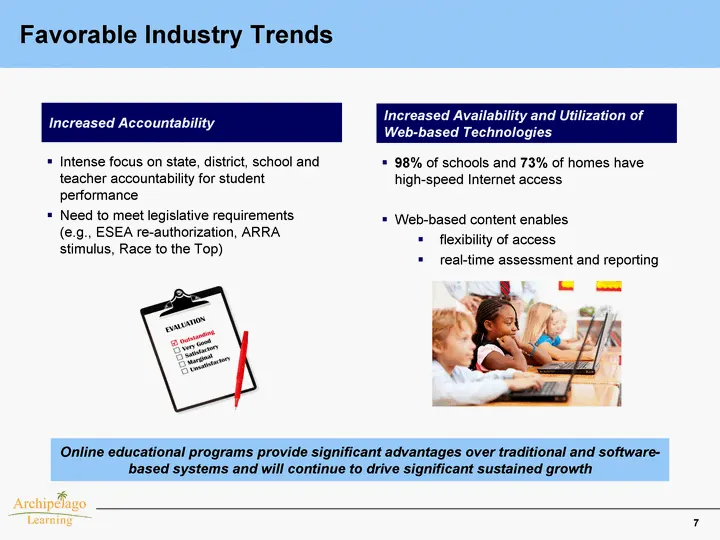
7 Favorable Industry Trends Increased Accountability Increased Availability and Utilization of Web-based Technologies Intense focus on state, district, school and teacher accountability for student performance Need to meet legislative requirements (e.g., ESEA re-authorization, ARRA stimulus, Race to
Slide 9: Study Island Addresses Challenges Facing Educators
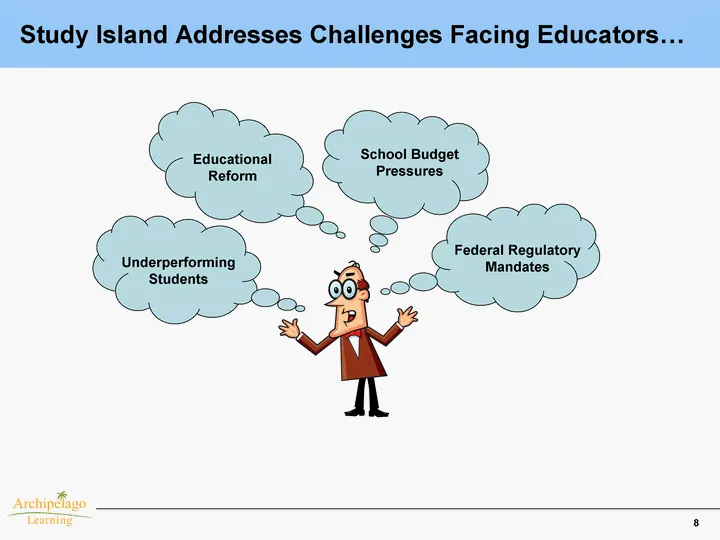
8 Study Island Addresses Challenges Facing Educators... School Budget Pressures Federal Regulatory Mandates Underperforming Students Educational Reform
Slide 10: With a Disruptive Online Learning Model
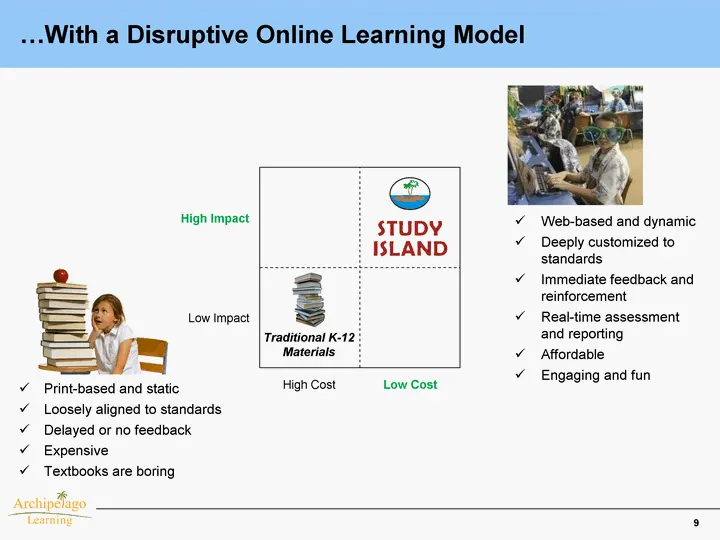
9 ....With a Disruptive Online Learning Model Web-based and dynamic Deeply customized to standards Affordable Real-time assessment and reporting Engaging and fun High Cost Low Cost Low Impact High Impact Traditional K-12 Materials u Print-based and static u Loosely aligned to standards u Delayed or
Slide 11: Attractive Value Proposition
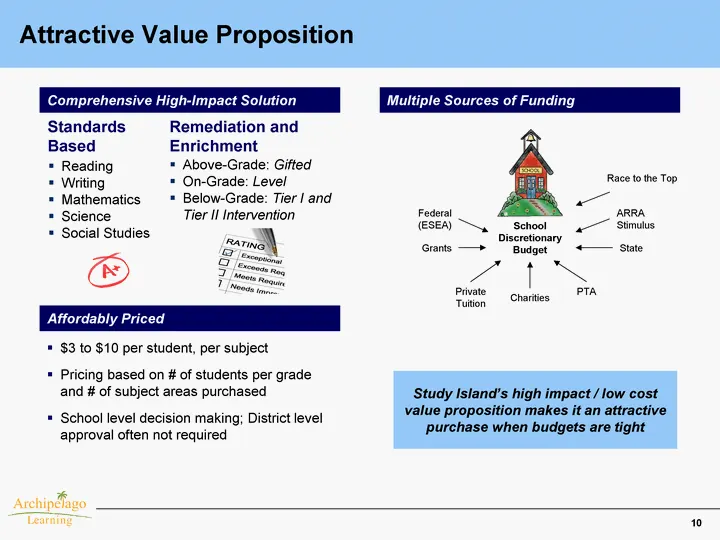
10 Attractive Value Proposition $3 to $10 per student, per subject Pricing based on # of students per grade and # of subject areas purchased School level decision making; District level approval often not required Reading Writing Mathematics Science Social Studies Comprehensive High-Impact Solution
Slide 12: Highly Differentiated Solution
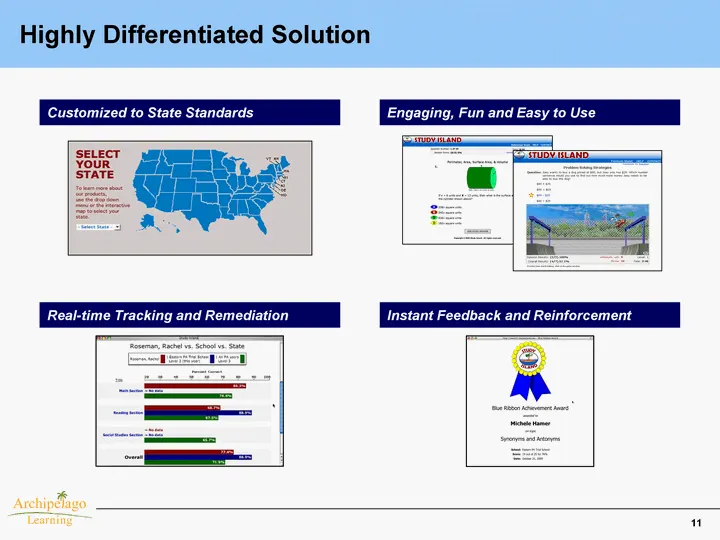
11 Highly Differentiated Solution Customized to State Standards Engaging, Fun and Easy to Use Real-time Tracking and Remediation Instant Feedback and Reinforcement
Slide 13: Compelling Scalable Business Model
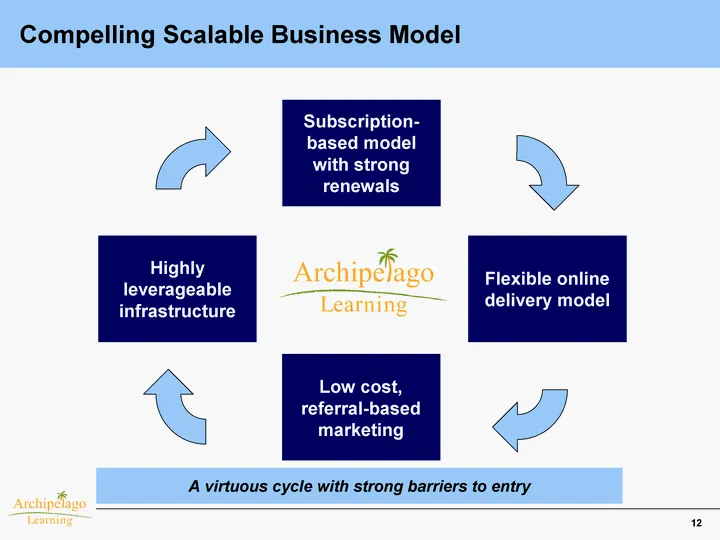
12 Compelling Scalable Business Model Flexible online delivery model Low cost, referral-based marketing Highly leverageable infrastructure Subscription- based model with strong renewals A virtuous cycle with strong barriers to entry
Slide 14: Multiple Opportunities for Growth
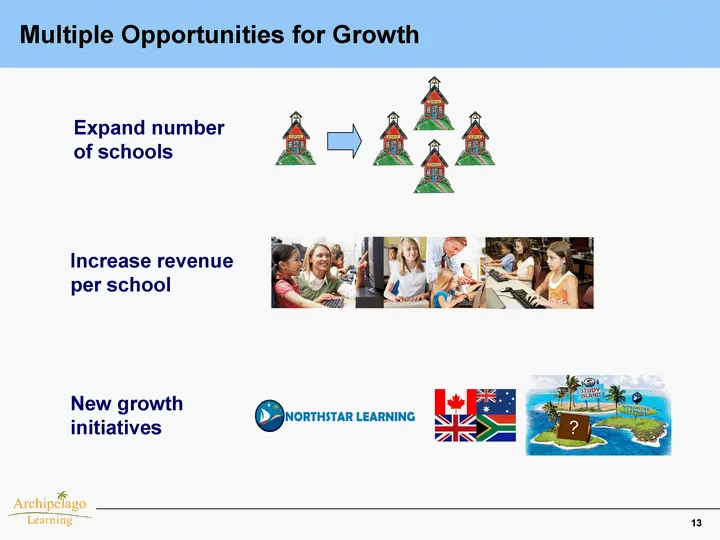
13 Multiple Opportunities for Growth ? Expand number of schools Increase revenue per school New growth initiatives
Slide 15: Expand Number of Schools
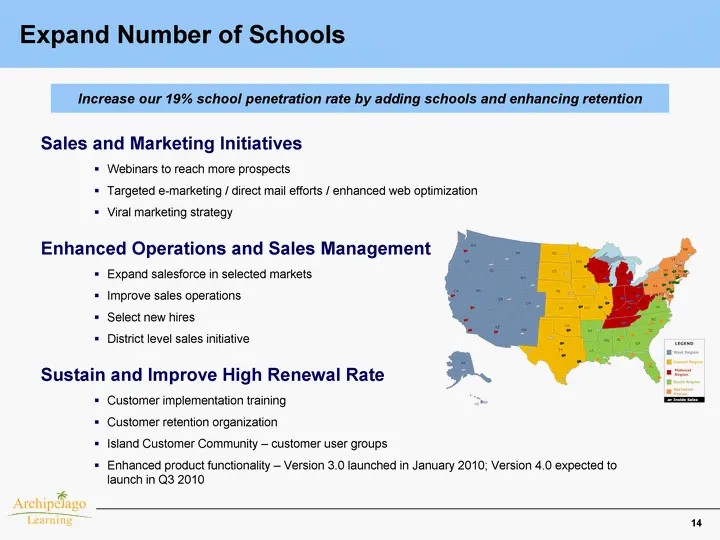
14 Expand Number of Schools Increase our 19% school penetration rate by adding schools and enhancing retention Webinars to reach more prospects Targeted e-marketing / direct mail efforts / enhanced web optimization Viral marketing strategy Sales and Marketing Initiatives Expand salesforce in selecte
Slide 16: Increase Revenue Per School
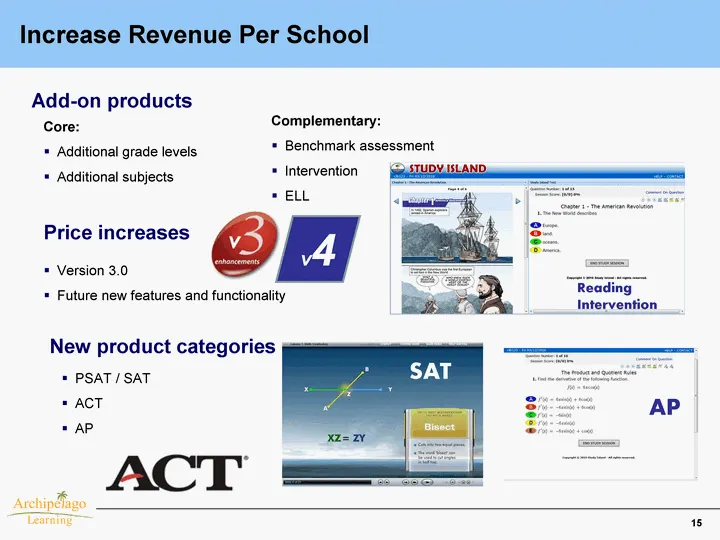
15 Increase Revenue Per School Core: Additional grade levels Additional subjects Add-on products Version 3.0 Future new features and functionality Price increases PSAT / SAT ACT AP New product categories Complementary: Benchmark assessment Intervention ELL SAT AP Reading Intervention v4
Slide 17: New Growth Initiatives
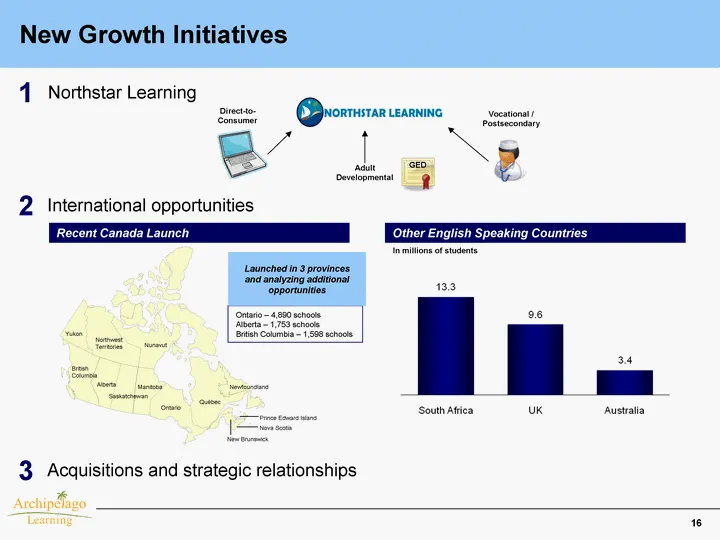
16 International opportunities New Growth Initiatives Northstar Learning GED Vocational / Postsecondary Adult Developmental Direct-to- Consumer 1 2 Recent Canada Launch Other English Speaking Countries In millions of students Acquisitions and strategic relationships 3 Newfoundland Prince Edward Isla
Slide 18: Strong Leadership Team
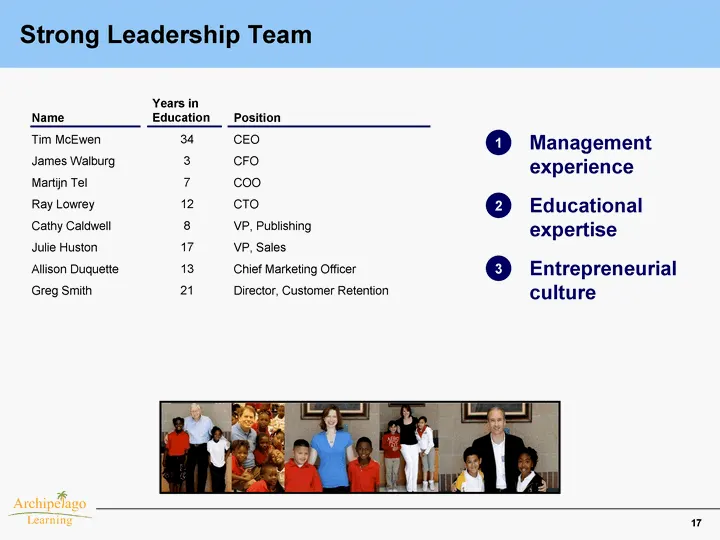
17 Strong Leadership Team Name Tim McEwen James Walburg Martijn Tel Ray Lowrey Cathy Caldwell Julie Huston Allison Duquette Greg Smith Years in Education 34 3 7 12 8 17 13 21 Position CEO CFO COO CTO VP, Publishing VP, Sales Chief Marketing Officer Director, Customer Retention Management experience

Slide 19: Financial Overview
Archipelago Learning Financial Overview Archipglago —Tearning—
Slide 20: Financial Highlights
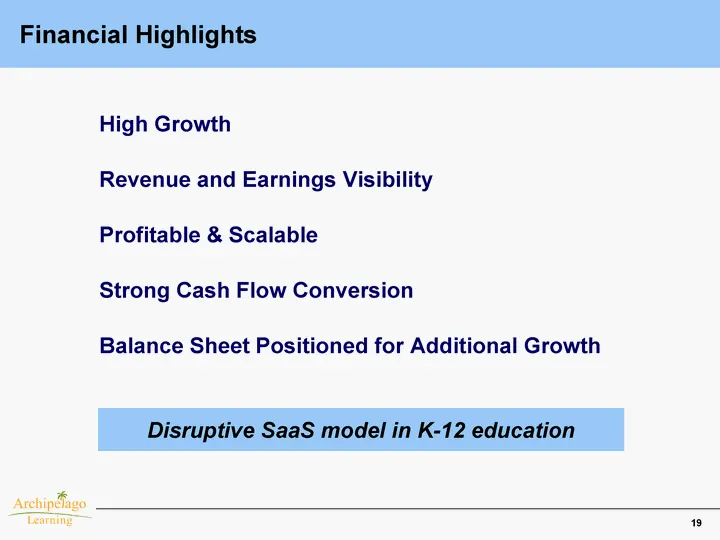
19 Financial Highlights Revenue and Earnings Visibility Profitable & Scalable Balance Sheet Positioned for Additional Growth High Growth Disruptive SaaS model in K-12 education Strong Cash Flow Conversion
Slide 21: Track Record of Growth in Revenue and Profitability
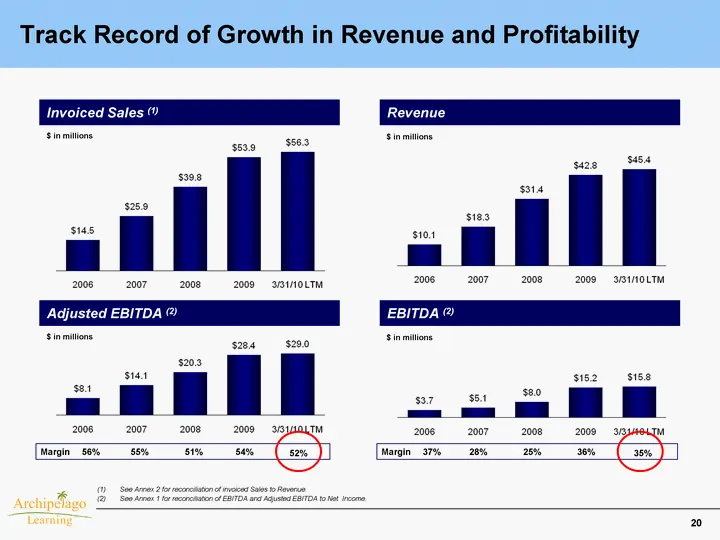
20 Track Record of Growth in Revenue and Profitability See Annex 2 for reconciliation of invoiced Sales to Revenue. See Annex 1 for reconciliation of EBITDA and Adjusted EBITDA to Net Income. Invoiced Sales (1) Revenue Adjusted EBITDA (2) EBITDA (2) $ in millions $ in millions 56% Margin 55% 51% 54%
Slide 22: Market Opportunities
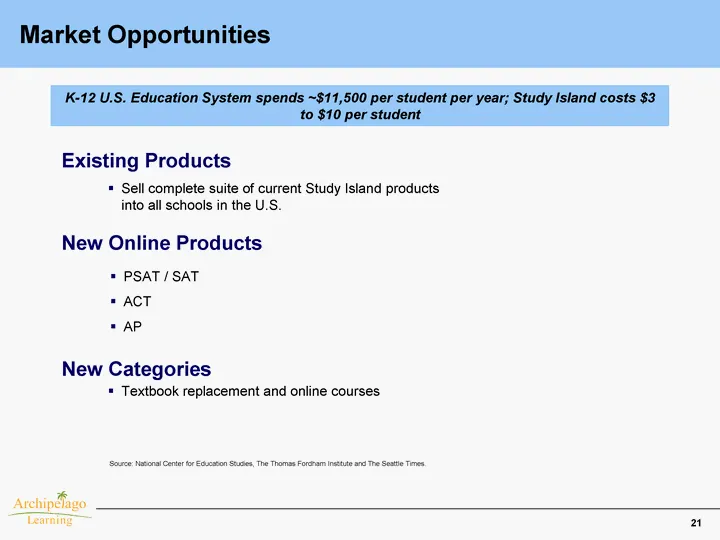
21 Market Opportunities Sell complete suite of current Study Island products into all schools in the U.S. Existing Products PSAT / SAT ACT AP New Online Products Textbook replacement and online courses New Categories K-12 U.S. Education System spends ~$11,500 per student per year; Study Island costs
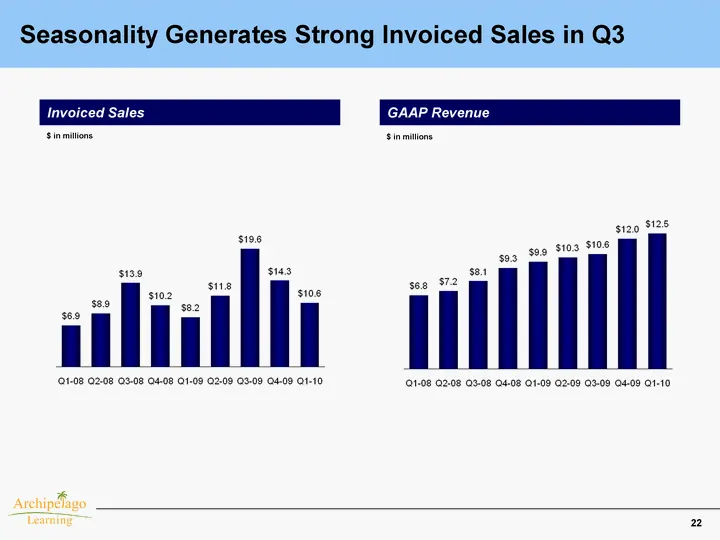
Slide 23: Seasonality Generates Strong Invoiced Sales in Q3
22 Seasonality Generates Strong Invoiced Sales in Q3 Invoiced Sales GAAP Revenue $ in millions $ in millions
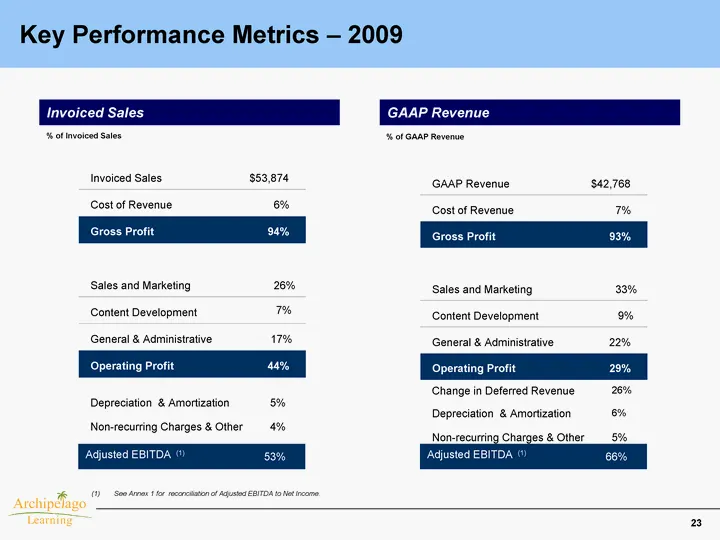
Slide 24: Key Performance Metrics - 2009
23 Key Performance Metrics - 2009 Invoiced Sales GAAP Revenue % of Invoiced Sales % of GAAP Revenue Invoiced Sales $53,874 Cost of Revenue 6% Gross Profit 94% Sales and Marketing 26% Content Development 7% General & Administrative 17% Operating Profit 44% GAAP Revenue $42,768 Cost of Revenue 7% Gros
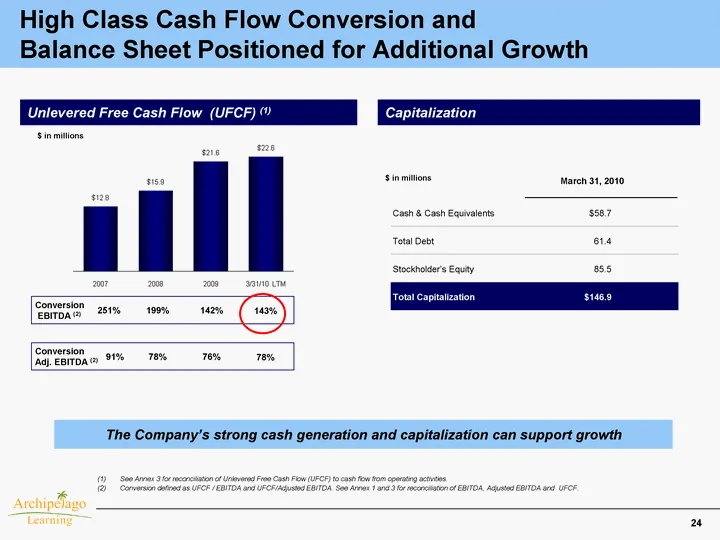
Slide 25: Cash Flow Conversion and Balance Sheet Positioned for Additional Growth
24 High Class Cash Flow Conversion and Balance Sheet Positioned for Additional Growth Capitalization Unlevered Free Cash Flow (UFCF) (1) $ in millions $ in millions 251% Conversion EBITDA (2) 199% 142% (1) See Annex 3 for reconciliation of Unlevered Free Cash Flow (UFCF) to cash flow from operating
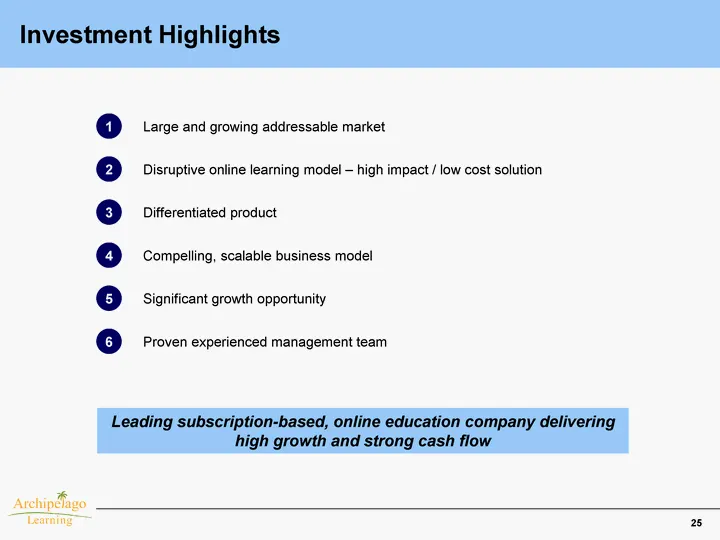
Slide 26: Investment Highlights
25 Investment Highlights Large and growing addressable market Differentiated product Disruptive online learning model - high impact / low cost solution Compelling, scalable business model Significant growth opportunity Proven experienced management team 1 2 3 4 5 6 Leading subscription-based, online

Slide 27: Archipelago Learning
Archipelago Learning
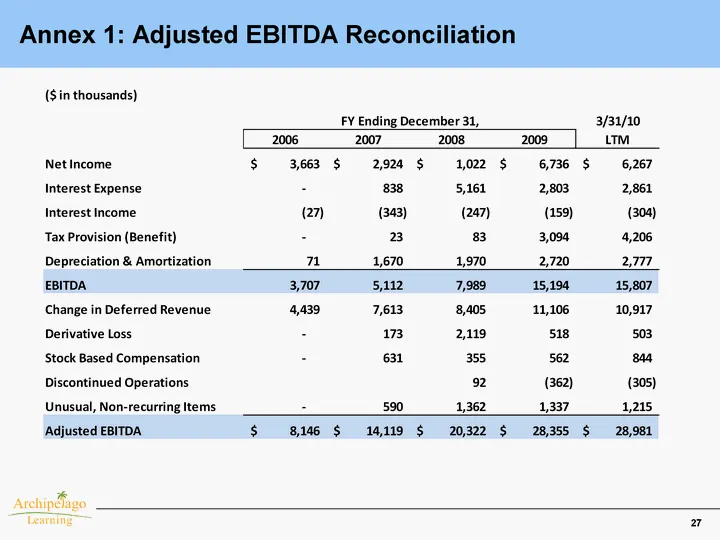
Slide 28: Annex 1: Adjusted EBITDA Reconciliation
27 Annex 1: Adjusted EBITDA Reconciliation
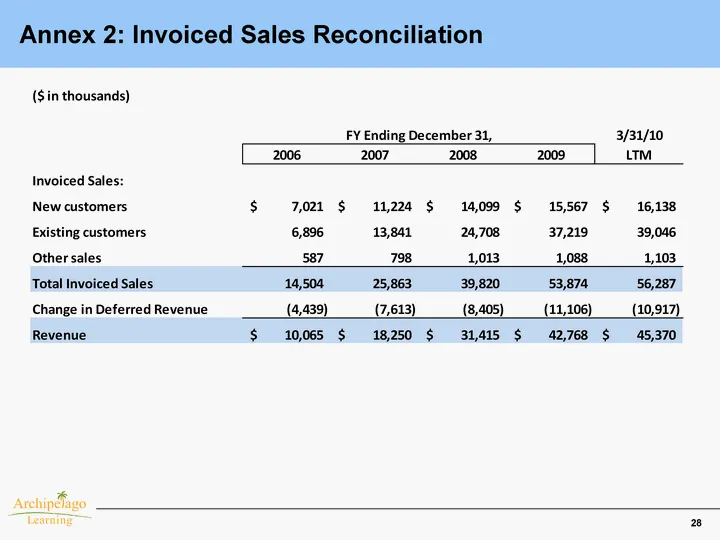
Slide 29: Annex 2: Invoiced Sales Reconciliation
28 Annex 2: Invoiced Sales Reconciliation
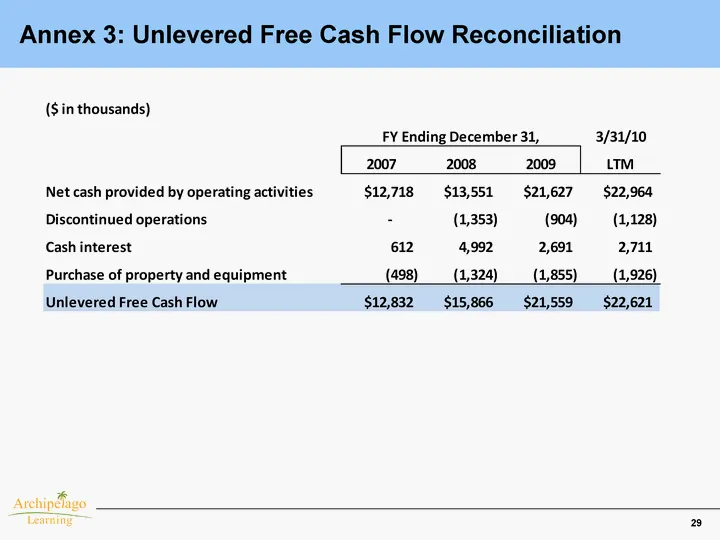
Slide 30: Annex 3: Unlevered Free Cash Flow Reconciliation
29 Annex 3: Unlevered Free Cash Flow Reconciliation
Source: SEC EDGAR · 8-K filed May 18, 2010