CareMax — Deerfield Healthcare Technology Acquisitions — SPAC Merger (April 2021)
48 slides from CareMax's SPAC merger presentation, Apr 6, 2021
Slide 1: Tech-Enabled Senior Care Platform
TECH - ENABLED SENIOR CARE PLATFORM April 2021 1
Slide 2: Investor Presentation disclaimer
2 Investor Presentation This investor presentation (“Investor Presentation”) is for informational purposes only and does not constitute solicitation of a proxy, consent or authorization with respect to any securities, or an offer to sell, a solicitation of an offer to buy, or a r ecommendation to pu
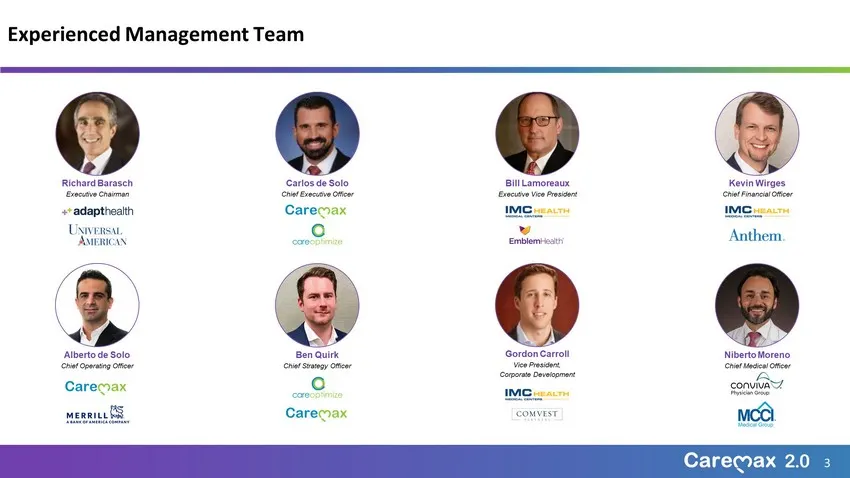
Slide 3: Experienced Management Team
Experienced Management Team Bill Lamoreaux Executive Vice President Carlos de Solo Chief Executive Officer Kevin Wirges Chief Financial Officer Alberto de Solo Chief Operating Officer Ben Quirk Chief Strategy Officer Gordon Carroll Vice President, Corporate Development Richard Barasch Executive Chai
Slide 4: Introduction and Proposed Transaction
4 Introduction and Proposed Transaction 1
Slide 5: Executive Summary
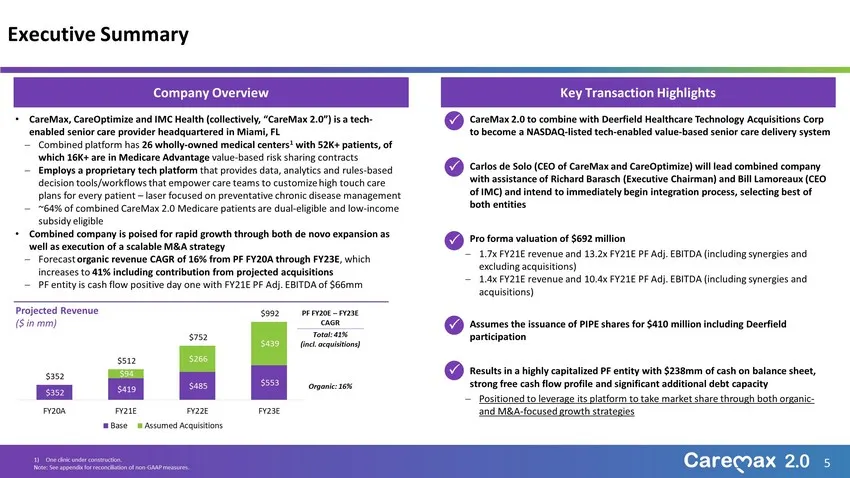
Executive Summary 5 Company Overview Key Transaction Highlights • CareMax, CareOptimize and IMC Health (collectively, “CareMax 2.0”) is a tech - enabled senior care provider headquartered in Miami, FL Combined platform has 26 wholly - owned medical centers 1 with 52K+ patients, of which 16K+ are in
Slide 6: Transaction Overview
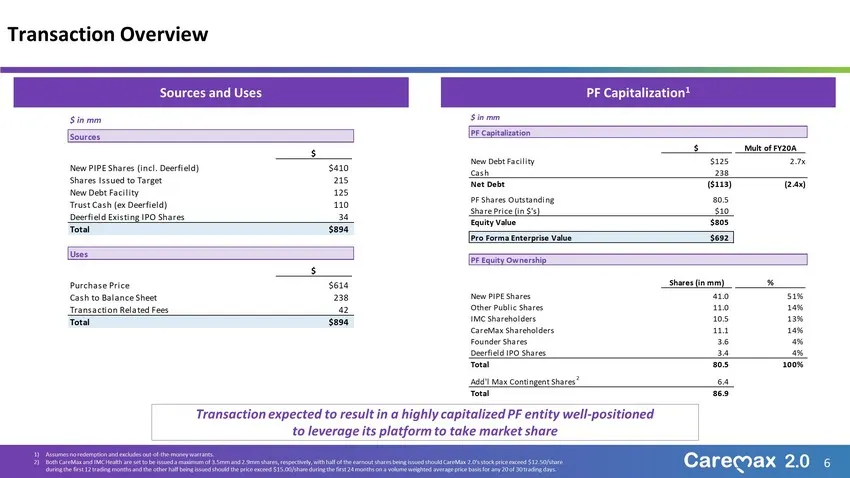
6 Transaction Overview Sources and Uses PF Capitalization 1 Transaction expected to result in a highly capitalized PF entity well - positioned to leverage its platform to take market share 1) Assumes no redemption and excludes out - of - the - money warrants. 2) Both CareMax and IMC Health are set t
Slide 7: Transaction Overview (cont'd)
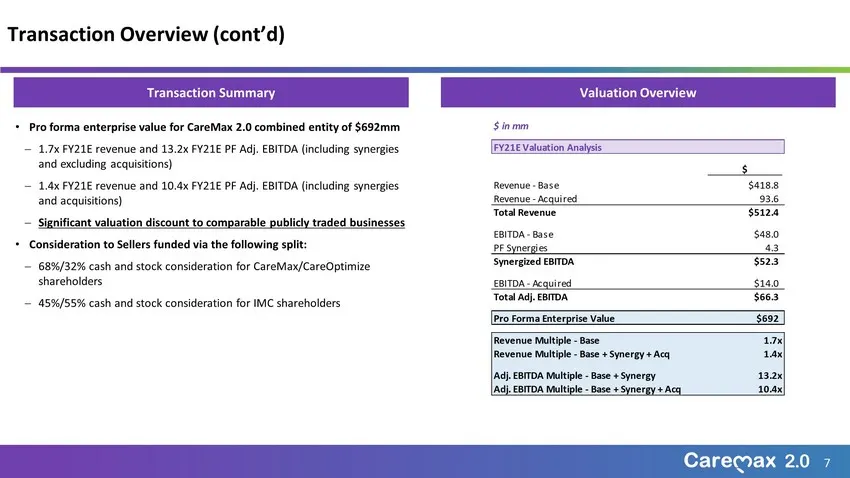
7 Transaction Overview (cont’d) Transaction Summary Valuation Overview • Pro forma enterprise value for CareMax 2.0 combined entity of $692mm 1.7x FY21E revenue and 13.2x FY21E PF Adj. EBITDA (including synergies and excluding acquisitions) 1.4x FY21E revenue and 10.4x FY21E PF Adj. EBITDA (includin
Slide 8: An Aging Population Drives a Large and Growing Medicare Market
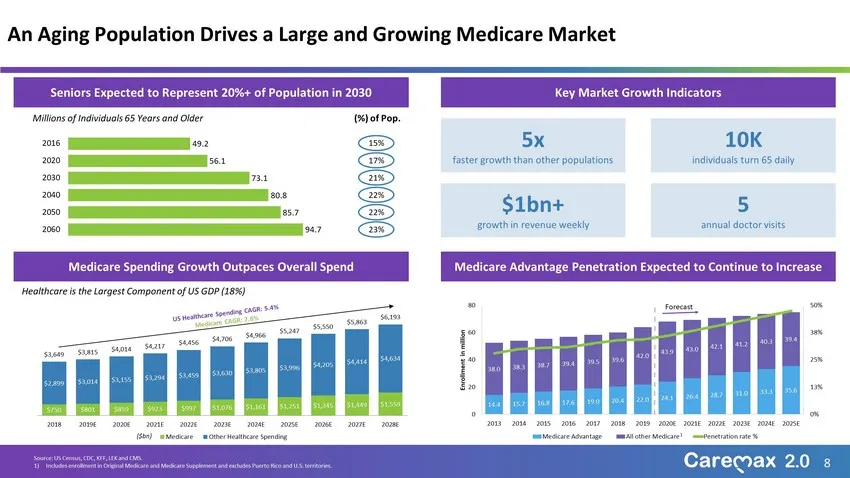
$750 $801 $859 $923 $997 $1,076 $1,161 $1,251 $1,345 $1,449 $1,559 $2,899 $3,014 $3,155 $3,294 $3,459 $3,630 $3,805 $3,996 $4,205 $4,414 $4,634 $3,649 $3,815 $4,014 $4,217 $4,456 $4,706 $4,966 $5,247 $5,550 $5,863 $6,193 2018 2019E 2020E 2021E 2022E 2023E 2024E 2025E 2026E 2027E 2028E Medicare Other
Slide 9: Value-Based Primary Care Recognized as the Best Way to Lower Healthcare Spend
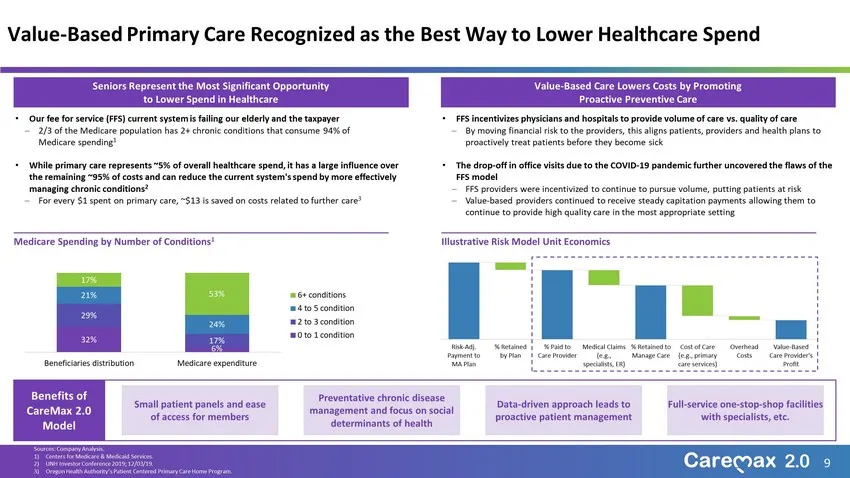
Value - Based Primary Care Recognized as the Best Way to Lower Healthcare Spend 9 32% 6% 29% 17% 21% 24% 17% 53% Beneficiaries distribution Medicare expenditure 6+ conditions 4 to 5 condition 2 to 3 condition 0 to 1 condition Medicare Spending by Number of Conditions 1 Illustrative Risk Model Unit E
Slide 10: Deerfield + Richard Barasch partnership and key investment highlights
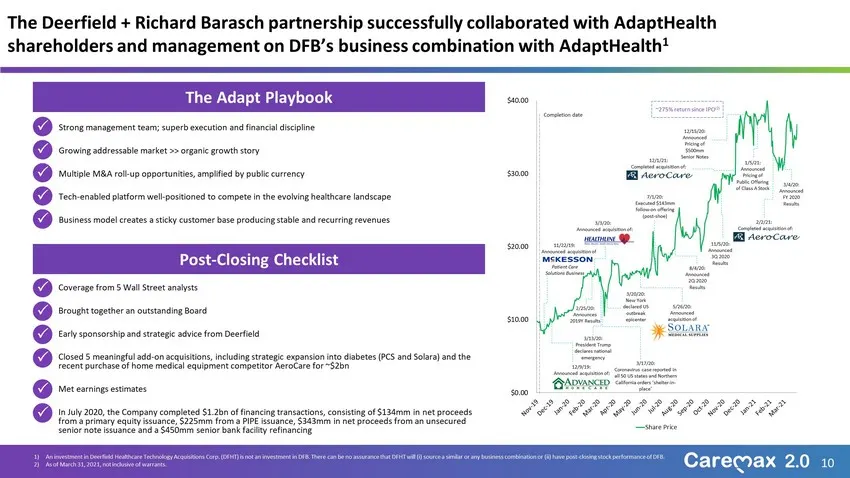
$0.00 $10.00 $20.00 $30.00 $40.00 Share Price The Deerfield + Richard Barasch partnership successfully collaborated with AdaptHealth shareholders and management on DFB’s business combination with AdaptHealth 1 Completion date Strong management team ; superb execution and financial discipline Growing
Slide 11: Combination creates a foundational platform for a high-performing care delivery model
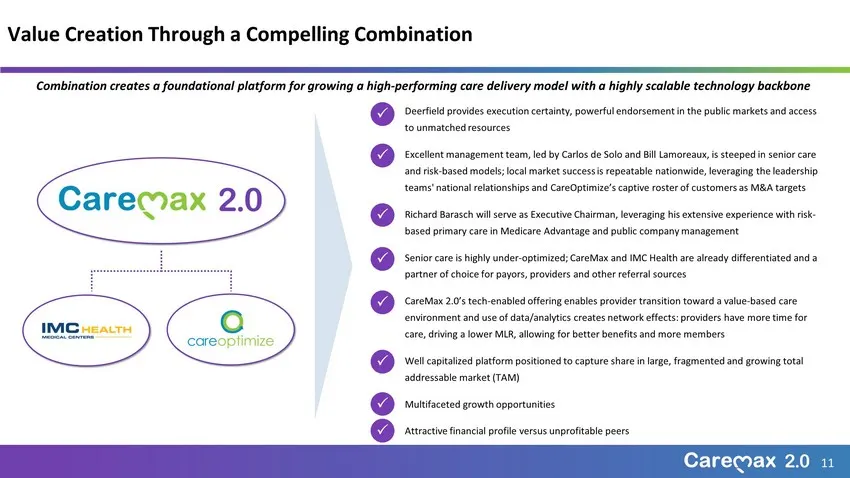
Combination creates a f oundational platform for growing a high - performing care delivery model with a highly scalable technology backbone Deerfield provides execution certainty, powerful endorsement in the public markets and access to unmatched resources Excellent management team, led by Carlos d
Slide 12: Company Overview
Company Overview Caremax 2.0
Slide 13: By the Numbers: CareMax 2.0
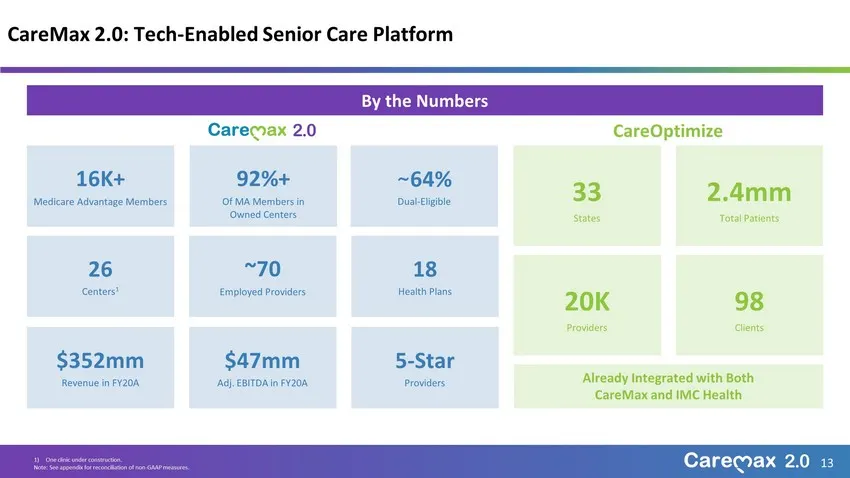
By the Numbers 13 CareMax 2.0: Tech - Enabled Senior Care Platform CareOptimize ~ 64% Dual - Eligible 16 K+ Medicare Advantage Members 92%+ Of MA Members in Owned Centers 33 States 2 .4mm Total Patients 20K Providers 98 Clients 26 Centers 1 ~70 Employed Providers Already Integrated with Both CareMax
Slide 14: 75%+ of PF Revenue Driven by Full-Risk Medicare Members
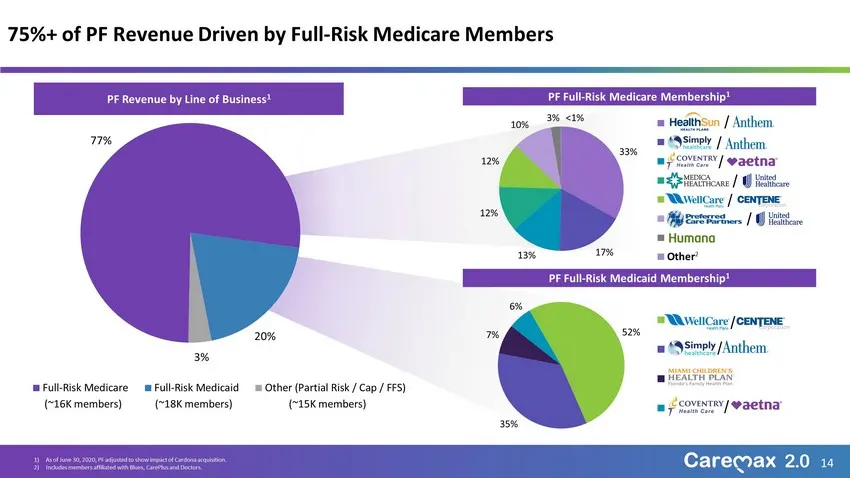
33% 17% 13% 12% 12% 10% 3% <1% HealthSun Simply Coventry Medica WellCare Preferred Humana Other 52% 35% 7% 6% WellCare Simply MCFL Coventry 14 75%+ of PF Revenue Driven by Full - Risk Medicare Members PF Revenue by Line of Business 1 1) As of June 30, 2020, PF adjusted to show impact of Cardona acqu
Slide 15: Strong Regional Presence and National Reach
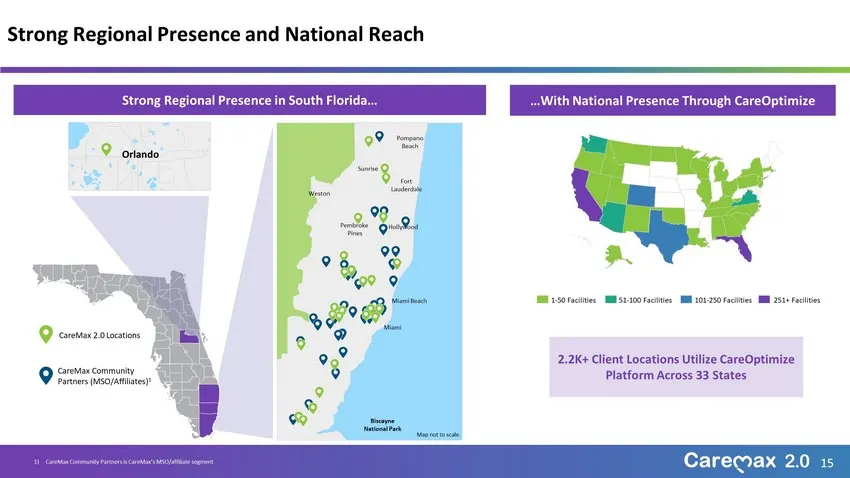
15 Strong Regional Presence in South Florida… …With National Presence Through CareOptimize Strong Regional Presence and National Reach 15 CareMax 2.0 Locations CareMax Community Partners (MSO/Affiliates) 1 Orlando Pompano Beach Fort Lauderdale Sunrise Weston Pembroke Pines Miami Beach Miami Biscayne
Slide 16: Vertically Integrated Model Provides a One-Stop-Shop Solution
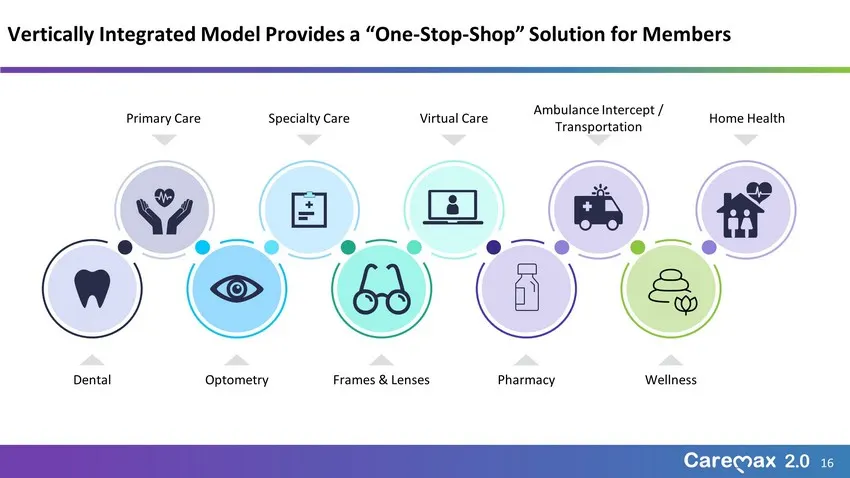
Wellness Dental Optometry Frames & L enses Pharmacy Primary C are Specialty C are Virtual C are Ambulance Intercept / Transportation Home Health 16 Vertically Integrated Model Provides a “One - Stop - Shop” Solution for Members
Slide 17: CareMax 2.0 Serves the Communities Most in Need
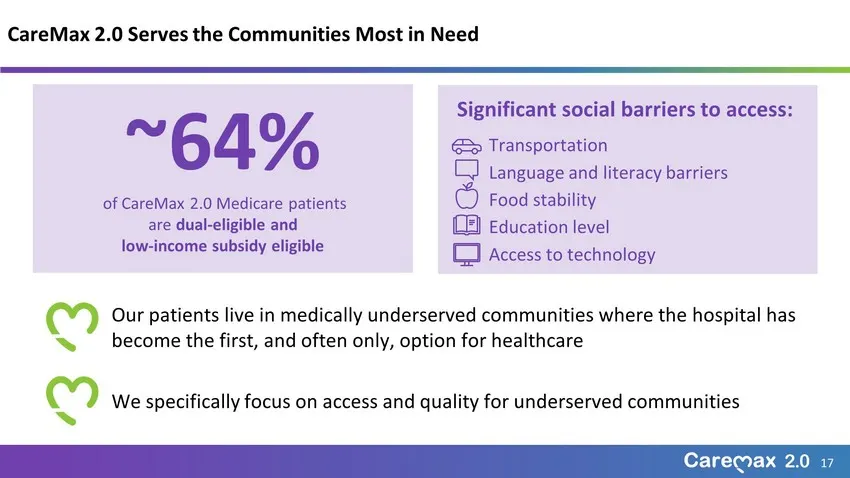
Significant social barriers to access: Transportation Language and literacy barriers Food stability Education level Access to technology 17 CareMax 2.0 Serves the Communities Most in Need Our patients l ive in medically underserved communities where the hospital has become the first , and often only
Slide 18: CareMax 2.0 Strategy Roadmap
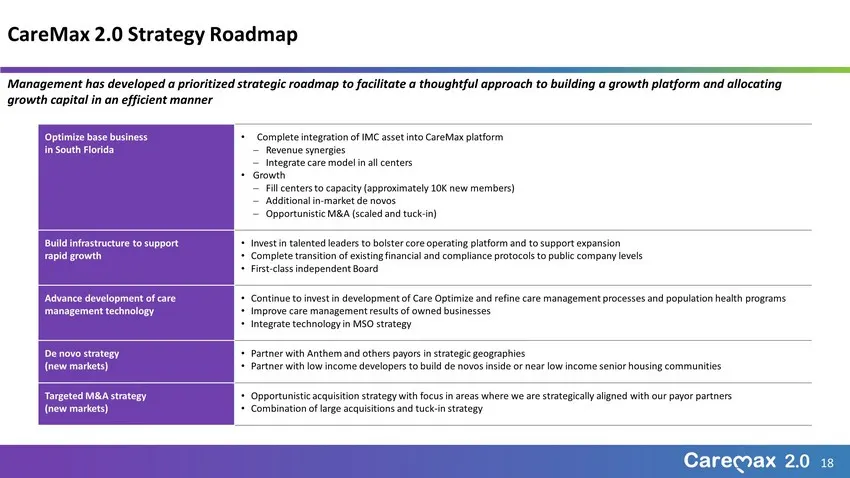
18 CareMax 2.0 Strategy Roadmap Management has developed a prioritized strategic roadmap to facilitate a thoughtful approach to building a growth platform an d a llocating growth capital in an efficient manner Optimize base business in South Florida • Complete integration of IMC asset into CareMax p
Slide 19: Approach to Care: Whole Person Health
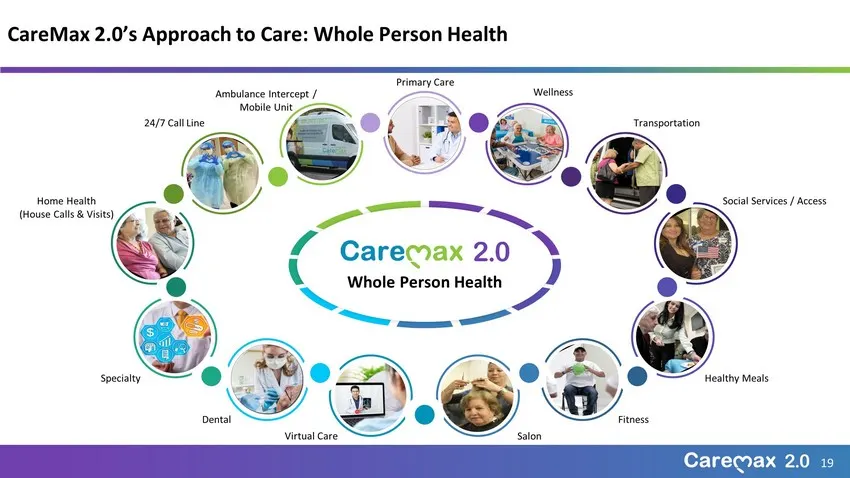
19 CareMax 2.0’s Approach to Care: Whole Person Health Wellness Transportation Social Services / Access Healthy Meals Primary Care Dental Virtual Care Fitness Salon Specialty Ambulance Intercept / Mobile Unit 24/7 Call Line Home Health (House Calls & Visits) Whole Person Health
Slide 20: Physicians are the Center Piece of a High Touch Care Team Model
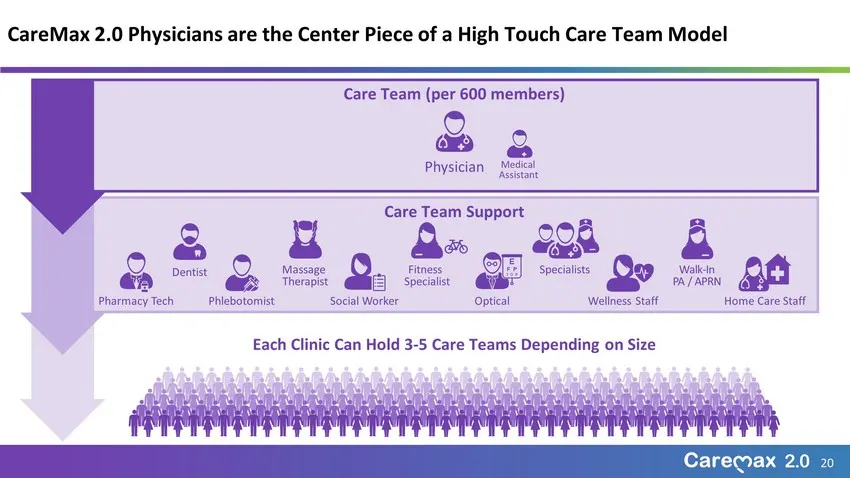
20 CareMax 2.0 Physicians are the Center Piece of a High Touch Care Team Model Each Clinic Can Hold 3 - 5 Care Teams Depending on Size Medical Assistant Walk - In PA / APRN Physician Care Team (per 600 members) Care Team Support Social Worker Home Care Staff Phlebotomist Dentist Fitness Specialist M
Slide 21: Uses Technology and Processes to Tailor the Level of Care
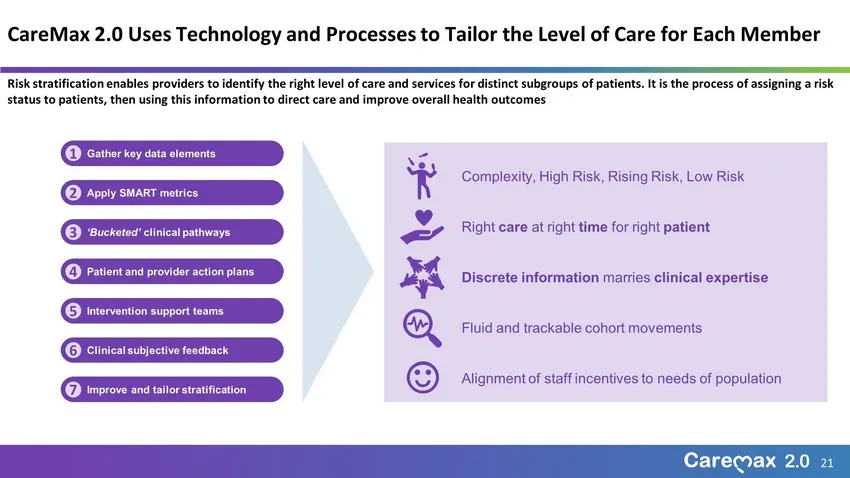
21 CareMax 2.0 Uses Technology and Processes to Tailor the Level of Care for Eac h Member 21 Gather key data elements 1 Apply SMART metrics 2 ‘Bucketed’ c linical pathways 3 Patient and provider action plans 4 Intervention support teams 5 Clinical subjective feedback 6 Improve and tailor stratificat
Slide 22: CareOptimize: Proprietary End-to-End Technology Platform
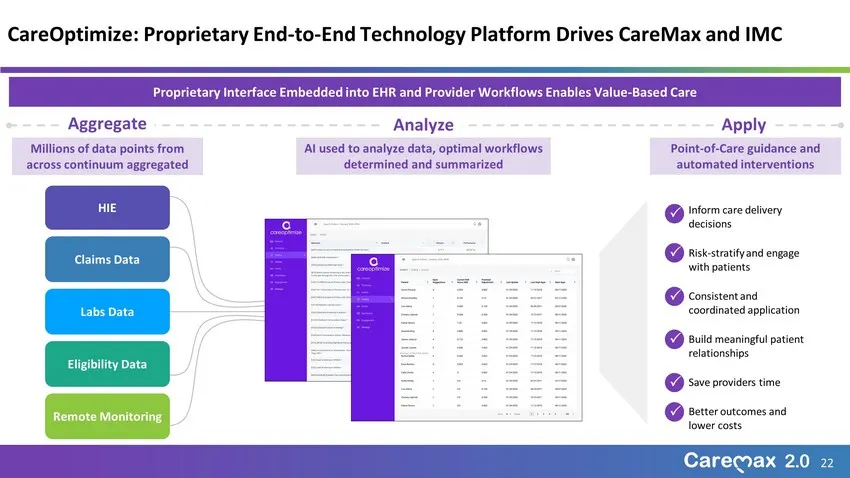
22 CareOptimize: Proprietary End - to - End Technology Platform Drives CareMax and IMC Proprietary Interface Embedded into EHR and Provider Workflows Enables Value - Based Care HIE Claims Data Labs Data Eligibility Data Remote Monitoring • Inform care delivery decisions • Risk - stratify and engage
Slide 23: Shift in Care Paradigm: Technology to Bend the Cost Curve
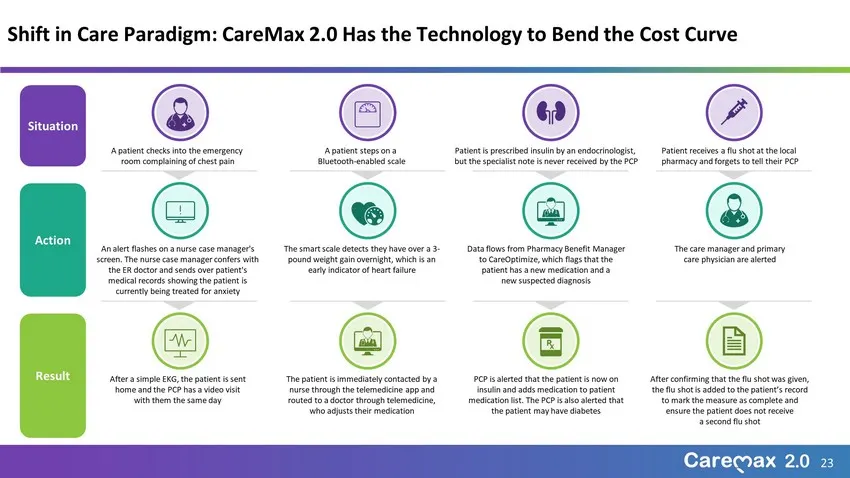
23 Shift in Care Paradigm: CareMax 2.0 Has the Technology to Bend the Cost Curve Situation A patient checks into the emergency room complaining of chest pain A patient steps on a Bluetooth - enabled scale Patient is prescribed insulin by an endocrinologist, but the specialist note is never received
Slide 24: CareBox: Pilot for Remote Monitoring
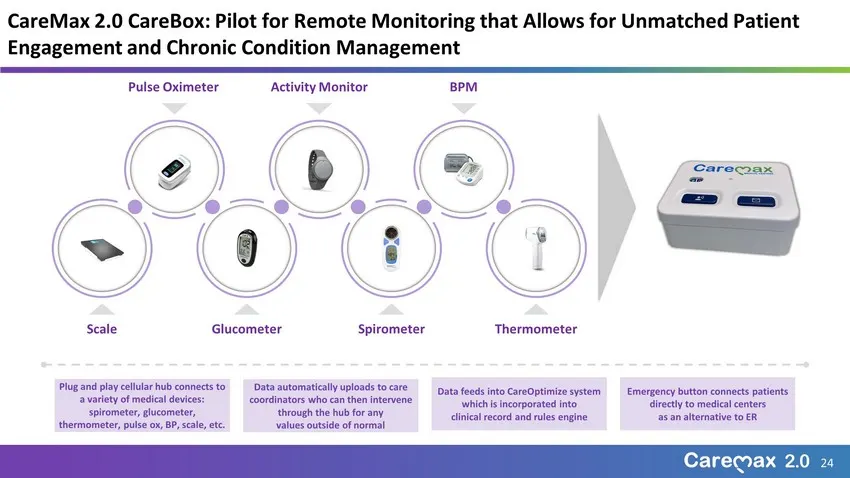
24 CareMax 2.0 CareBox : Pilot for Remote Monitoring that Allows for Unmatched Patient Engagement and Chronic Condition Management Scale Glucometer Spirometer Thermometer Pulse Oximeter Activity Monitor BPM Plug and play cellular hub connects to a variety of medical devices: spirometer, glucometer,
Slide 25: Mobile Clinic
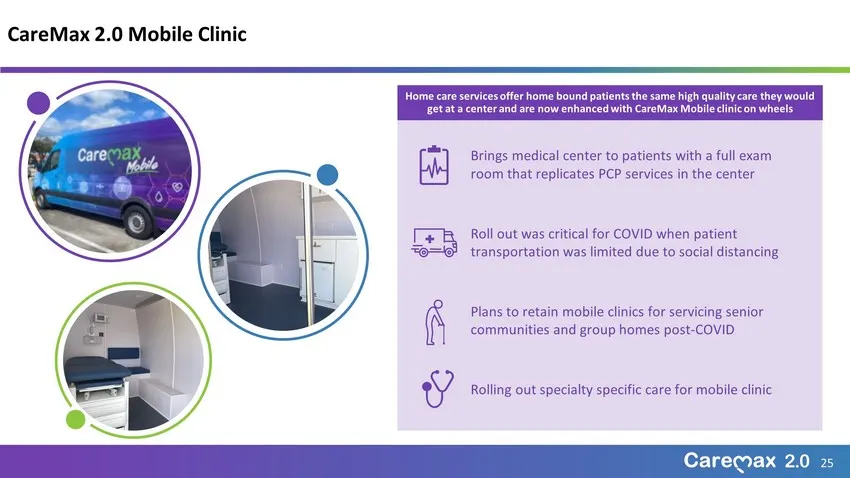
CareMax 2.0 Mobile Clinic Home care services offer home bound patients the same high quality care they would get at a center and are now enhanced with CareMax Mobile clinic on wheels Brings medical center to patients with a full exam room that replicates PCP services in the center Roll out was criti
Slide 26: COVID-Response Within Hours of Pandemic
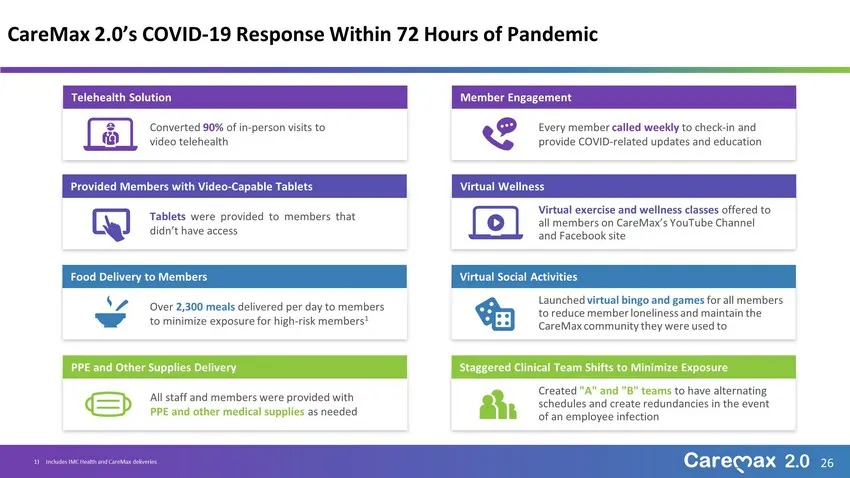
26 CareMax 2.0’s COVID - 19 Response Within 72 Hours of Pandemic 1) Includes IMC Health and CareMax deliveries Converted 90% of in - person visits to video telehealth Every member called weekly to check - in and provide COVID - related updates and education Tablets were provided to members that didn
Slide 27: Innovation Has Developed Programs that Impact Outcomes
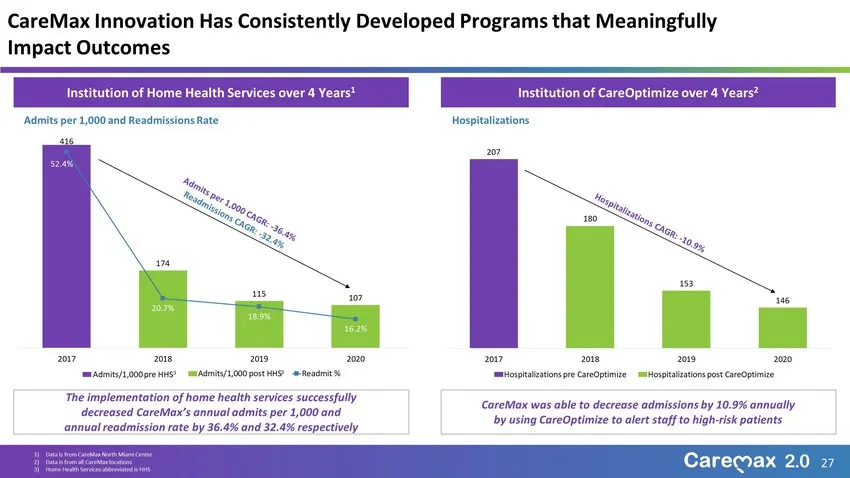
CareMax Innovation Has Consistently Developed Programs that Meaningfully Impact Outcomes Institution of Home Health Services over 4 Years 1 Institution of CareOptimize over 4 Years 2 The implementation of home health services successfully decreased CareMax’s annual admits per 1,000 and annual readmi
Slide 28: Model Works Despite Highest Acuity Patient Base
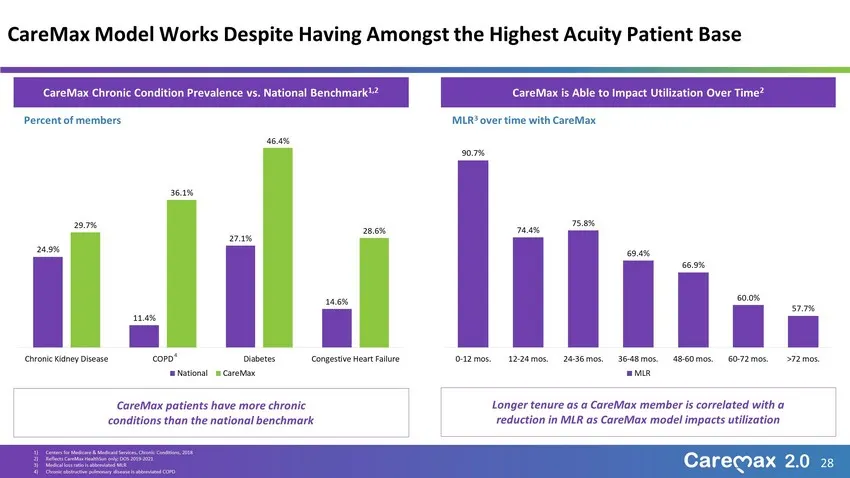
28 CareMax Model Works Despite Having Amongst the Highest Acuity Patient Base CareMax Chronic Condition Prevalence vs. National Benchmark 1,2 CareMax is Able to Impact Utilization Over Time 2 CareMax patients have more chronic conditions than the national benchmark Longer tenure as a CareMax member
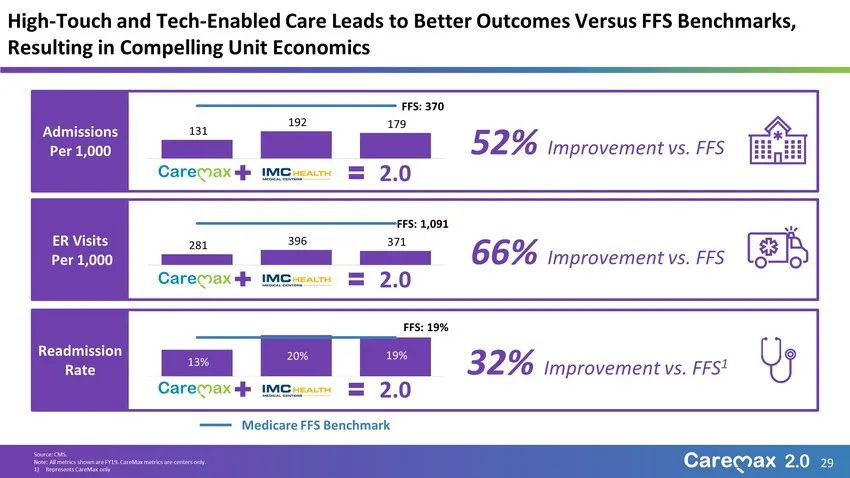
Slide 29: High-Touch and Tech-Enabled Care Leads to Better Outcomes Versus FFS
52% Improvement vs. FFS 131 192 179 FFS: 370 CareMax IMC 2.0 29 High - Touch and Tech - Enabled Care Leads to Better Outcomes Versus FFS Benchmarks, Resulting in Compelling Unit Economics Source: CMS. Note: All metrics shown are FY19. CareMax metrics are centers only. 1) Represents CareMax only 66%

Slide 30: Growth Strategy
Growth Strategy Caremax 2.0
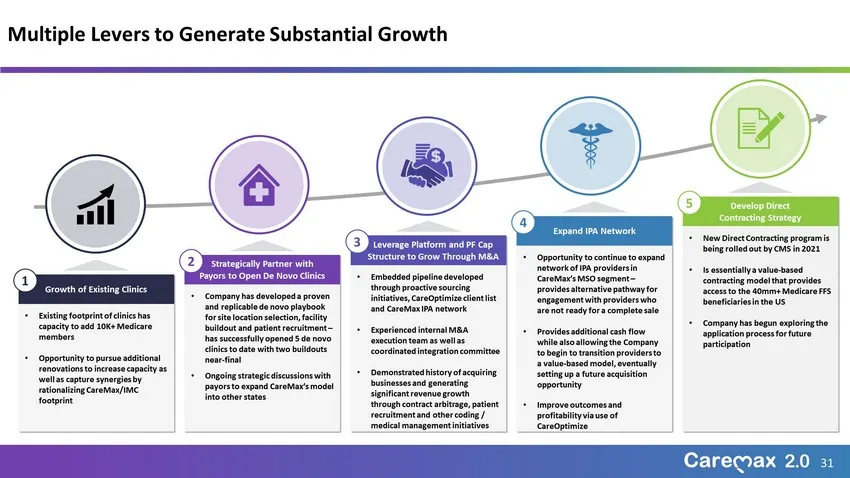
Slide 31: Multiple Levers to Generate Substantial Growth
31 Multiple Levers to Generate Substantial Growth Growth of Existing Clinics • Existing footprint of clinics has capacity to add 10K+ Medicare members • Opportunity to pursue additional renovations to increase capacity as well as capture synergies by rationalizing CareMax /IMC footprint Strategicall
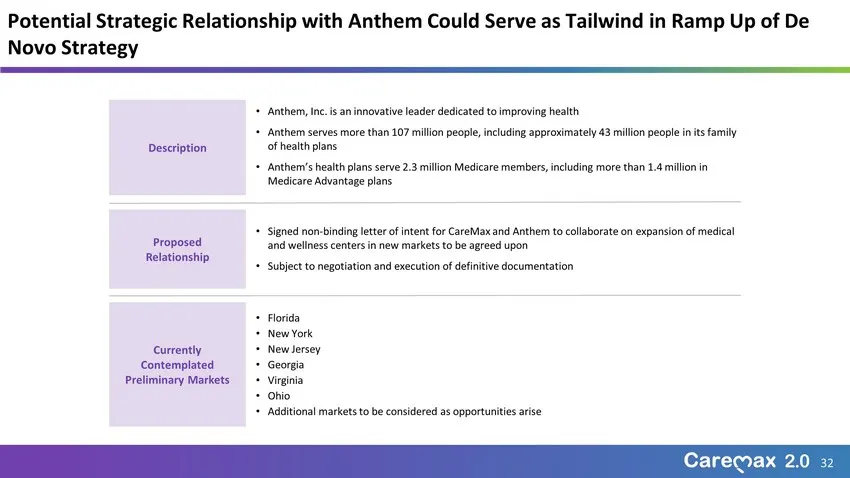
Slide 32: Potential Strategic Relationship with Anthem
32 Potential Strategic Relationship with Anthem Could Serve as Tailwind in Ramp Up of De Novo Strategy Description Proposed Relationship Currently Contemplated Preliminary Markets • Anthem, Inc. is an innovative leader dedicated to improving health • Anthem serves more than 107 million people, inclu
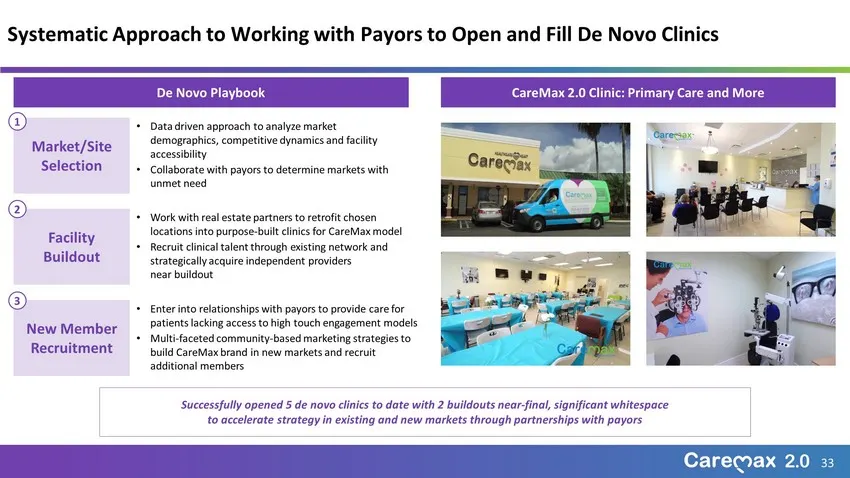
Slide 33: Systematic Approach to Working with Payors to Open De Novo Clinics
Systematic Approach to Working with Payors to Open and Fill De Novo Clinics De Novo Playbook CareMax 2.0 Clinic: Primary Care and More Market/Site Selection Facility Buildout New Member Recruitment • Data driven approach to analyze market demographics, competitive dynamics and facility accessibility
Slide 34: Rigorous New Market Evaluation Processes
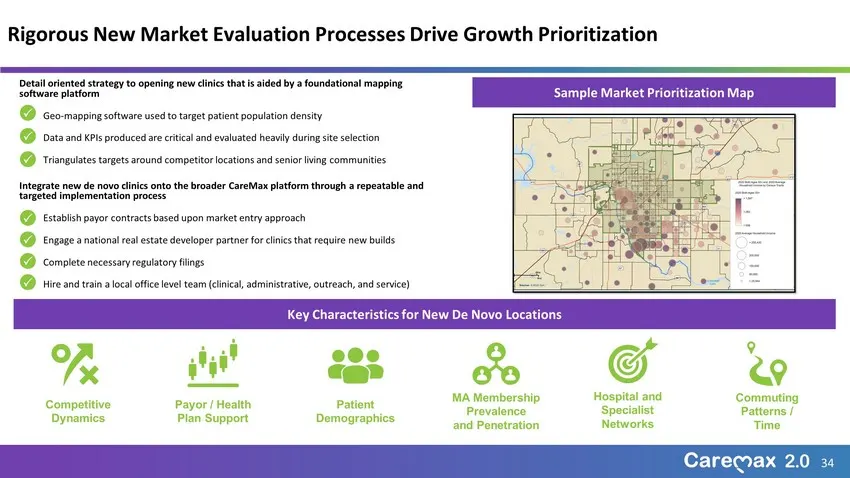
Rigorous New Market Evaluation Processes Drive Growth Prioritization 34 Key Characteristics for New De Novo Locations Competitive Dynamics Payor / Health Plan Support Patient Demographics MA Membership Prevalence and Penetration Commuting Patterns / Time Hospital and Specialist Networks Sample Marke
Slide 35: Multi-Dimensional M&A Strategy
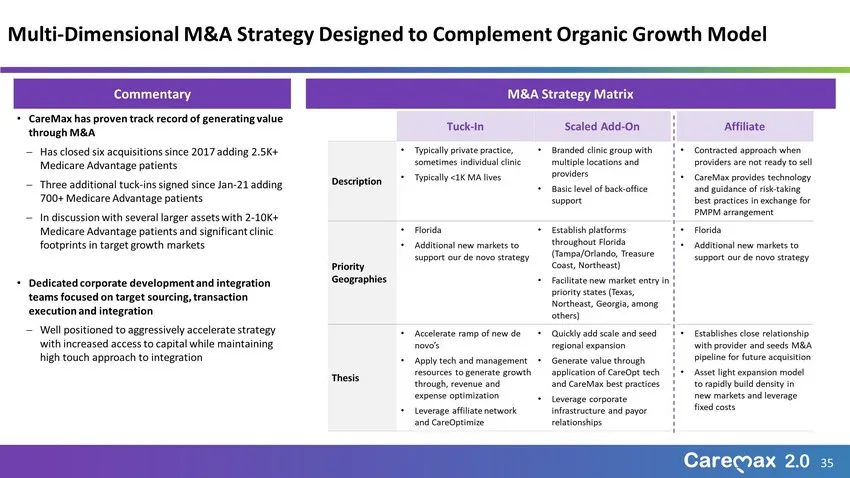
35 Multi - Dimensional M&A Strategy Designed to Complement Organic Growth Model Tuck - In Scaled Add - On Affiliate Description • Typically private practice, sometimes individual clinic • Typically <1K MA lives • Branded clinic group with multiple locations and providers • Basic level of back - offi
Slide 36: Established Playbook to Integrate Acquisitions: Pines Care Medical Center
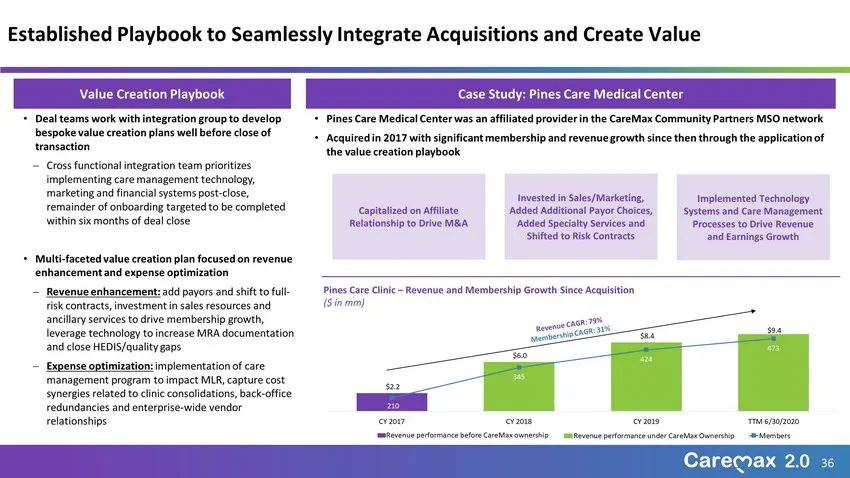
$2.2 $6.0 $8.4 $9.4 210 345 424 473 150 200 250 300 350 400 450 500 $- $1.0 $2.0 $3.0 $4.0 $5.0 $6.0 $7.0 $8.0 $9.0 $10.0 CY 2017 CY 2018 CY 2019 TTM 6/30/2020 Revenue performance under CareMax Ownership Members Case Study: Pines Care Medical Center 36 Established Playbook to Seamlessly Integrate Ac
Slide 37: Robust Target Pipeline Across Geographies
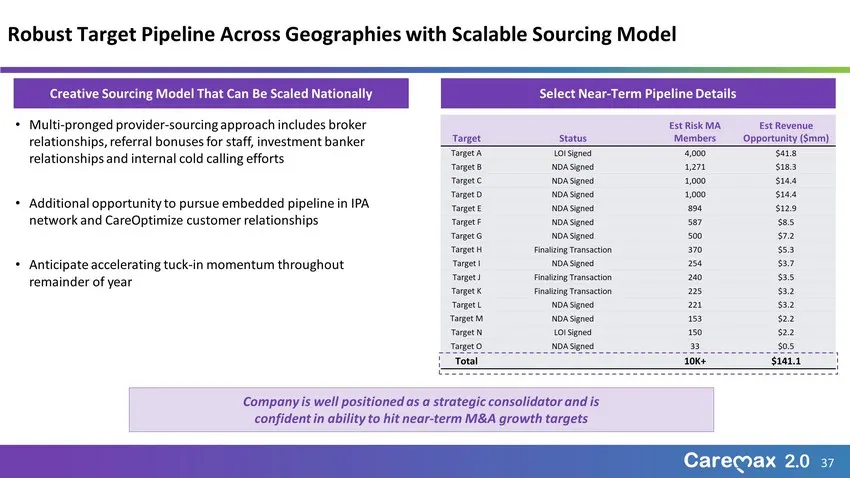
37 Robust Target Pipeline Across Geographies with Scalable Sourcing Model Creative Sourcing Model That Can Be Scaled Nationally Select Near - Term Pipeline Details • Multi - pronged provider - sourcing approach includes broker relationships, referral bonuses for staff, investment banker relationship
Slide 38: CareMax 2.0 Model: Value for All Stakeholders
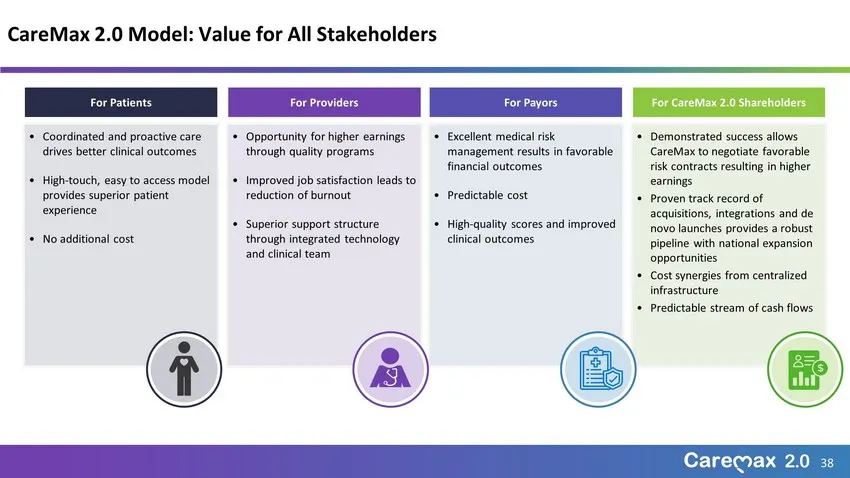
38 CareMax 2.0 Model: Value for All Stakeholders • Opportunity for higher earnings through quality programs • Improved job satisfaction leads to reduction of burnout • Superior support structure through integrated technology and clinical team • Excellent medical risk management results in favorable
Slide 39: Financial Update
Financial Update Caremax 2.0
Slide 40: Overview of Key Projection Assumptions
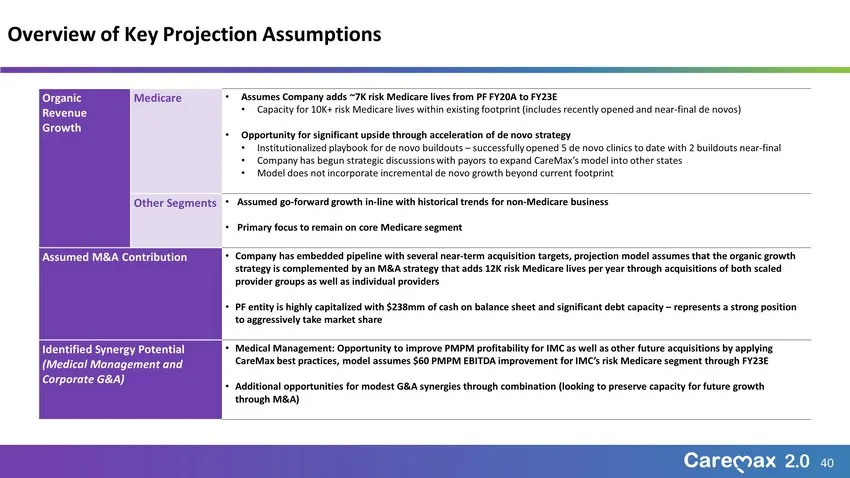
40 Overview of Key Projection Assumptions Organic Revenue Growth Medicare • Assumes Company adds ~7K risk Medicare lives from PF FY20A to FY23E • Capacity for 10K+ risk Medicare lives within existing footprint (includes recently opened and near - final de novos ) • Opportunity for significant upside
Slide 41: Summary Projections Overview
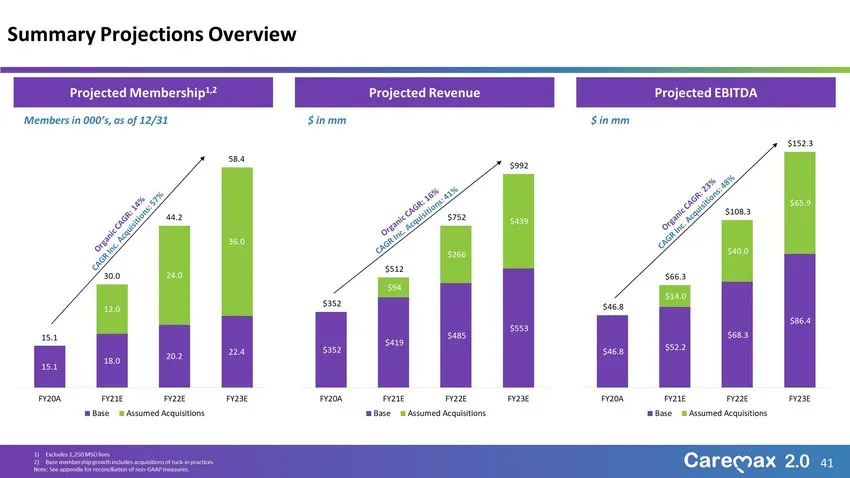
15.1 18.0 20.2 22.4 12.0 24.0 36.0 15.1 30.0 44.2 58.4 FY20A FY21E FY22E FY23E Base Assumed Acquisitions $46.8 $52.2 $68.3 $86.4 $14.0 $40.0 $65.9 $46.8 $66.3 $108.3 $152.3 FY20A FY21E FY22E FY23E Base Assumed Acquisitions 41 Summary Projections Overview 1) Excludes 1,250 MSO lives 2) Base membershi
Slide 42: Financial Summary
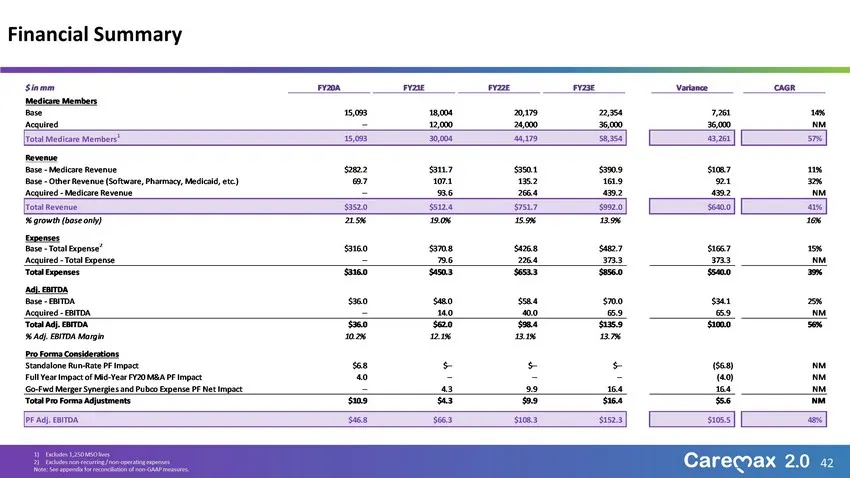
42 Financial Summary 1) Excludes 1,250 MSO lives 2) Excludes non - recurring / non - operating expenses Note: See appendix for reconciliation of non - GAAP measures. $ in mm FY20A FY21E FY22E FY23E Variance CAGR Medicare Members Base 15,093 18,004 20,179 22,354 7,261 14% Acquired – 12,000 24,000 36,
Slide 43: CareMax 2.0 is Well Positioned Versus Peers
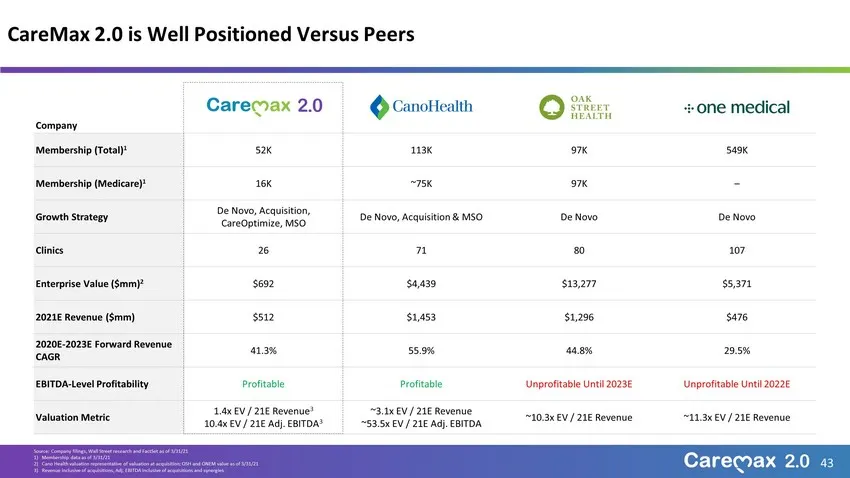
Company Membership ( T otal) 1 52K 113K 97K 549K Membership (Medicare) 1 16 K ~75K 97K – Growth Strategy De Novo, Acquisition, CareOptimize, MSO De Novo, Acquisition & MSO De Novo De Novo Clinics 26 71 80 107 Enterprise Value ($mm) 2 $ 692 $4,439 $13,277 $5,371 2021E Revenue ($mm) $5 12 $1,453 $1 ,2
Slide 44: Appendix
Appendix Caremax 2.0
Slide 45: Overview of Mature Clinic-Level Projection Assumptions
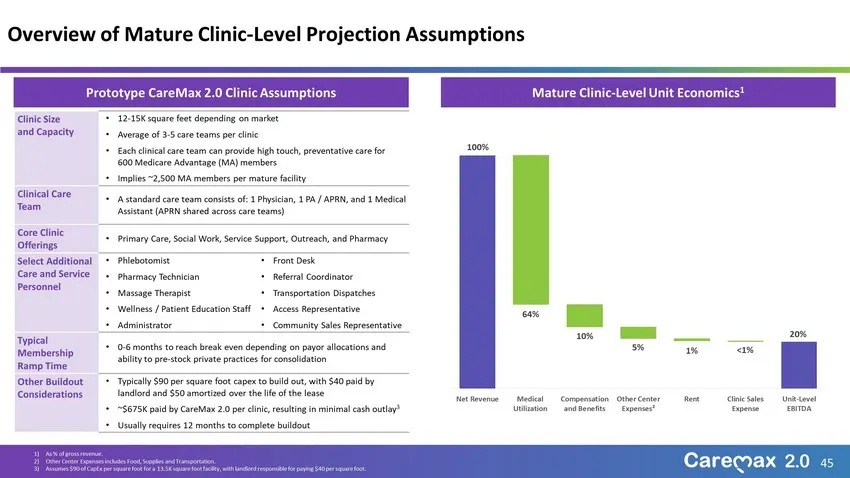
100% 20% 64% 10% 5% 1% <1% Net Revenue Medical Utilization Compensation and Benefits Other Center Expenses² Rent Clinic Sales Expense Unit-Level EBITDA 45 Overview of Mature Clinic - Level Projection Assumptions Clinic Size and Capacity • 12 - 15K square feet depending on market • Average of 3 - 5 c
Slide 46: PF Revenue and PF Net Income Reconciliation
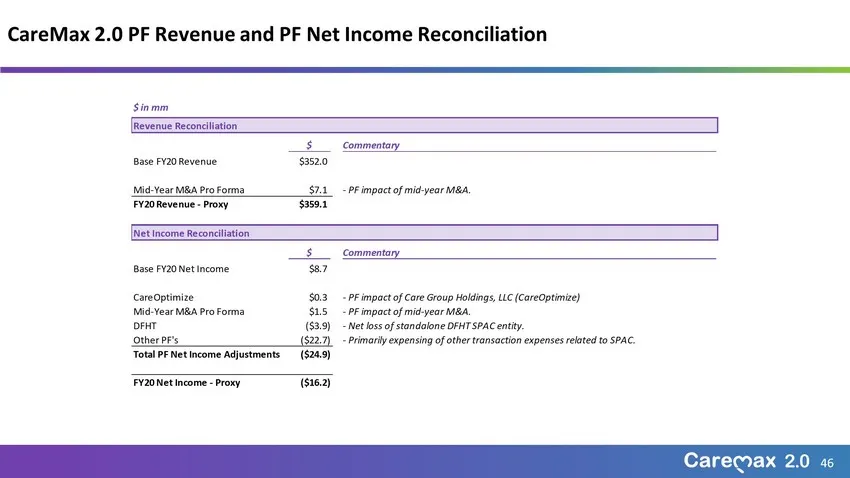
46 CareMax 2.0 PF Revenue and PF Net Income Reconciliation 46 $ in mm Revenue Reconciliation $ Commentary Base FY20 Revenue $352.0 Mid-Year M&A Pro Forma $7.1 - PF impact of mid-year M&A. FY20 Revenue - Proxy $359.1 Net Income Reconciliation $ Commentary Base FY20 Net Income $8.7 CareOptimize $0.3 -
Slide 47: PF Adjusted EBITDA Reconciliation
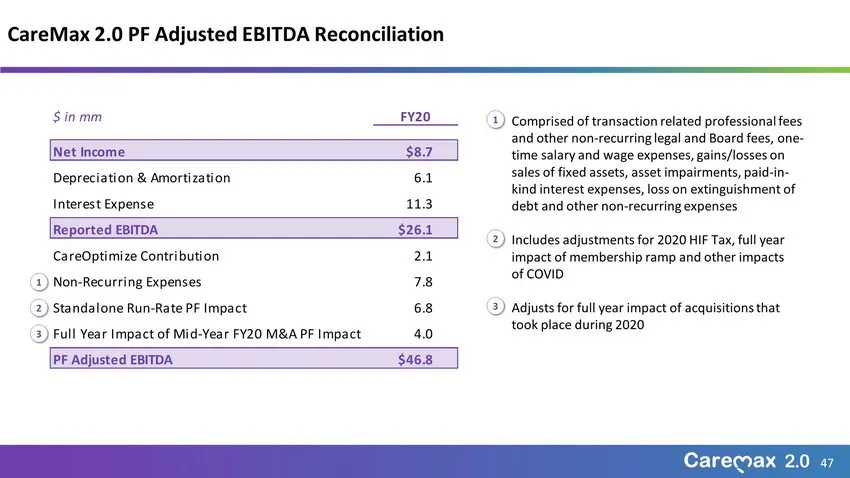
47 CareMax 2.0 PF Adjusted EBITDA Reconciliation 47 1 Comprised of transaction related professional fees and other non - recurring legal and Board fees, one - time salary and wage expenses, gains/losses on sales of fixed assets, asset impairments, paid - in - kind interest expenses, loss on extingui
Slide 48: Non-GAAP Financial Measures
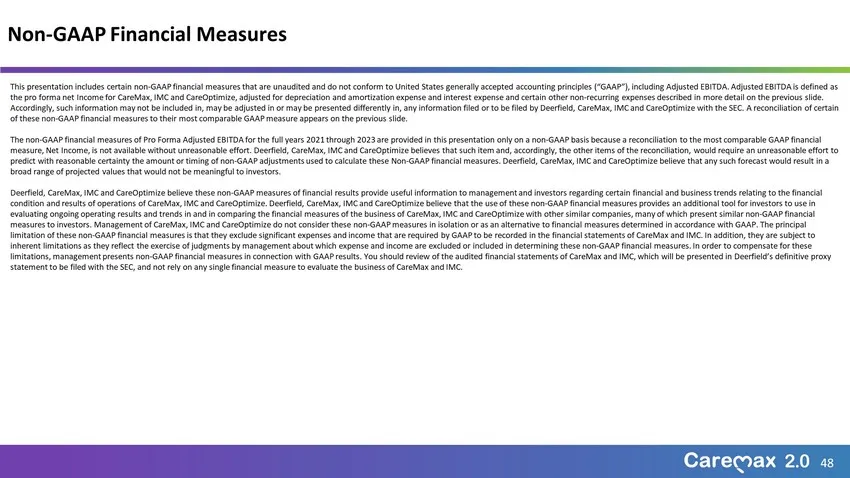
48 Non - GAAP Financial Measures 48 This presentation includes certain non - GAAP financial measures that are unaudited and do not conform to United States generally accepted accounting principles (“GAAP”), including Adjusted EBITDA. Adjusted EBITDA is defined as the pro forma net Income for CareMax
Source: SEC EDGAR · DEFA14A filed Apr 6, 2021
More decks from CareMax Inc
 Presentation (January 2025)8 slides · Jan 3, 2025
 Q3 2023 Earnings Presentation15 slides · Nov 9, 2023
 Q2 2023 Earnings Presentation16 slides · Aug 9, 2023
 Q1 2023 Earnings Presentation14 slides · May 10, 2023
 Investor Day (March 2023)95 slides · Mar 13, 2023
 FY2022 Earnings Presentation14 slides · Mar 9, 2023